

November 6, 2018
Brenda A. Howe Secretary of the Commission
Frankfort City Light & Power 1000 Washington Ave Frankfort IN 46041
Phone: 765-659-3362 Fax: 765-675-9048
Indiana Utility Regulatory Commission 101 West Washington St., Suite 1500 E Indianapolis, IN 46204
RE: Frankfort City Light & Power 30 Day Filing Pursuant to 170 IAC 1-6-1 et seq.
Dear Ms. Howe:
Pursuant to 170 IAC 1-6-5, please find enclosed the following 30 Day Filing by City of Frankfort Light & Power: Determination of the rate adjustments for the Purchase Power Cost Adjustment Tracking Factor (Appendix A) for the three months of January, February and March 2019. The tariff sheets and work papers are attached. The purpose of this filing is to implement an average change in rates for electric service charged by our supplier, Indiana Municipal Power Agency. This filing is necessary because of a change in the Utility's wholesale rates from the Indiana Municipal Power Agency. This filing is allowed under 170 IAC 1-6-3 for the following reasons: This request is allowable pursuant to 170 IAC 1-6-3 of Rule 6 because it entails Cause No. 36835-S3 dated December 13, 1989: A filing for which the Commission has already approved or accepted the procedure for the change.
The person at the Frankfort City Light & Power to be contacted regarding this filing is: Michael Myers 765-659-3362 1000 Washington Ave Frankfort IN 46041 [email protected]
Affected customers have been notified as required under 170 IAC 1-6-6. Notice will be published in The Times on November 9, 2018. In addition, the Legal Notice has been posted on the utility website legal notices page (www.fmu-in.com) and has been posted in the lobby of the Frankfort Municipal Utilities Billing Office. A copy of the notice is attached.

I verify that notice has been provided as stated in this letter and that this letter and the attached documents are true and accurate to the best of my knowledge, information, and belief.
Michael Myers
Frankfort City Light and Power 1000 Washington Ave Frankfort IN 46041 (765) 659-3362
November 6, 2018
LEGAL NOTICE:
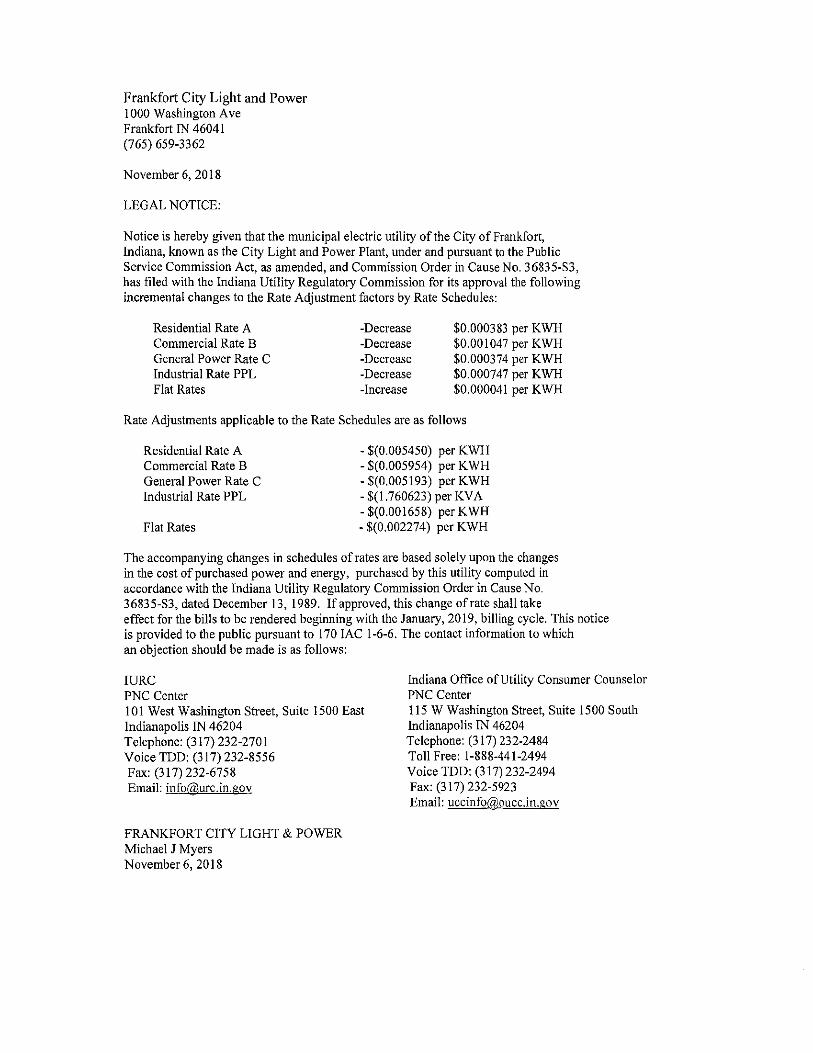
Notice is hereby given that the municipal electric utility of the City of Frankfort, Indiana, known as the City Light and Power Plant, under and pursuant to the Public Service Commission Act, as amended, and Commission Order in Cause No. 36835-S3, has filed with the Indiana Utility Regulatory Commission for its approval the following incremental changes to the Rate Adjustment factors by Rate Schedules:
Residential Rate A -Decrease $0.000383 per KWH Commercial Rate B -Decrease $0.001047 per KWH General Power Rate C -Decrease $0.000374 per KWH Industrial Rate PPL -Decrease $0.000747 per KWH Flat Rates -Increase $0.000041 per KWH
Rate Adjustments applicable to the Rate Schedules are as follows
Residential Rate A Commercial Rate B General Power Rate C Industrial Rate PPL
Flat Rates
- $(0.005450) per KWH - $(0.005954) per KWH - $(0.005193) per KWH - $(1.760623) per KVA - $(0.001658) per KWH - $(0.002274) per KWH
The accompanying changes in schedules of rates are based solely upon the changes in the cost of purchased power and energy, purchased by this utility computed in accordance with the Indiana Utility Regulatory Commission Order in Cause No. 36835-S3, dated December 13, 1989. If approved, this change ofrate shall take effect for the bills to be rendered beginning with the January, 2019, billing cycle. This notice is provided to the public pursuant to 170 !AC 1-6-6. The contact information to which an objection should be made is as follows:
IURC PNC Center 101 West Washington Street, Suite 1500 East Indianapolis IN 46204 Telephone: (317) 232-2701 Voice TDD: (317) 232-8556 Fax: (317) 232-6758 Email: [email protected]
FRANKFORT CITY LIGHT & POWER Michael J Myers November6, 2018
Indiana Office of Utility Consumer Counselor PNC Center 115 W Washington Street, Suite 1500 South Indianapolis IN 46204 Telephone: (317) 232-2484 Toll Free: 1-888-441-2494 Voice TDD: (317) 232-2494 Fax: (317) 232-5923 Email: [email protected]

November\o, 2018
Indiana Utility Regulatory Corrnnission PNC Center 101 w. Washington Street, Suite 1500 E. Indianapolis, Indiana 46204-3407
TO THE INDIANA UTILITY REGULATORY COMMISSION:
1. The City of Frankfort, Indiana, 1000 Washington Avenue, Frankfort, Indiana, under and pursuant to the Public Service Commission Act, as amended, and Corrnnission Order in Cause No. 36836-S3, hereby files with the Indiana Utility Regulatory Commission for its approval, an average decrease in its schedules of rates for electricity sold in the amount of $0.000647 per kilowatt-hour (KWH).
2. The acccnnpanying changes in schedules of rates are based solely upon the changes in the cost of purchased power and energy purchased by this utility ccnnputed in accordance with the Indiana Utility Regulatory Commission Order in Cause No. 36835-S3, dated December 13, 1989.
3. All of the matters and facts stated herein and in the attached exhibits are true and correct. If approved, this change of rate shall take effect for the bills to be rendered beginning with the January, 2019, billing cycle.
4. As required by IURC ruling 170 IAC 1-6-6, notice of this change in rates has appeared as a legal notice in the Frankfort Times and is posted in the lobby of the Frankfort Municipal Utilities Billing Office. It is posted on the Frankfort.Utilities web site which can be found by going to www.fmu-in.com, under Electric Legal Notices.
STATE OF INDIANA SS:
COUNTY OF
Personally apt~?red before me, a Notary Public in and for said county and state, this tt1 day of November, 2018 hiu;natJ n~v.J , who, after been duly sworn according to law, stated that he ~she is an officer of the City of Frankfort, Indiana, that he or she has read the matters and facts stated above, and in all exhibits at ched hereto, and that the same are true; that he or she is duly author zed to this instrument for and on behalf of the applicant herein.
Public
My Commission Expires: QllaffCh l/J LOI q
Residence:

City Light and Power Plant Frankfort, Indiana
Appendix A
Rate Adjustments
The Rate Adjustments shall be on the basis of a Purchase Power Cost Adjustment Tracking Factor occasioned solely by changes in the cost of purchased power and energy, in accordance with the Order of the Indiana Utility Regulatory Commission, approved on December 13, 1989 in Cause No. 36835-83 as follows:
Rate Adjustments applicable to the below listed Rate Schedules are as follows:
Residential Rate A Commercial Rate B General Power Rate C -Industrial Rate PPL
Flat Rates
January, February and March, 2019
$(0.005450) per KWH $(0.005954) per KWH $(0.005193) per KWH $(1.760623) per KVA $(0.001658) per KWH $(0.002274) per KWH

LINE NO.
1 2 3 4
6 7 8
CITY OF FRANKFORT, INDIAllA
DETERMINATION OF THE RATE ADJUSTMENTS FOR RATE SCHEDULE PPL
ATTACHMENT A PAGE I OF 1
FOR THE THREE MONTHS OF JANHARY, FEBRUARY AND MARCH, 2019
RATE PPL
DEMAND RELATED RATE ADJUSTMENT FACTOR: --------------------------------------FROM PAGE J OF J, COLUMN C, LINE 4: ($62,406.83) FROM PAGE 2 OP J, COLUMN C, LINE 4: 28,356.7
LINE I DIVIDED BY LINE 2: I 12. 200779 J
MULTIPLIED BY: 80.000% ($1. 760623)
DEMAND RELATED RATE ADJUSTMENT FACTOR: (II. 760623)/KVA
RATE PPL
ENERGY RELATED RATE ADJUSTMENT FACTOR: --------------------------------------FROM PAGE J OF 3, COLUMN D, LINE 4: ($34,548.76) FROM PAGE 2 OF 3, COLUMN D, LINE 4: 20,837,127
LINE I DIVIDED BY LINE 2: ($0.001658)
ENERGY RELATED RATE ADJUSTMENT FACTOR: I $0. 001658 I /KWH

LINE NO.
2
6
Page 1 of 3 CITY OF FRANKFORT, !NO I ANA
-----------
DETERMINATION OF RATE ADJUSTMENT FOR THE THREE MONTHS OF
JANUARY, FEBRUARY ANO MARCH, 2019
DESCRIPTION
-----------------
INCREMENTAL CHANGE IN BASE RATE (a)
ESTIMATED SAVINGS FEOM DEDICATED CAPACITY PAYMENTS (b)
ESTIMATED PURCHASED POWER ENERGY COST ADJUSTMENT I c I
ESTIMATED TOTAL CHANGE IN PURCHASED POWER RATE
EST CHANGE IN PURCHASED POWER RATE ADJ FOR LOSSES & GR INCOME TAX (d)
PLUS TRACKING FACTOR EFFECTIVE PRIOR TO JANUARY 27, 1983 (e)
ESTIMATED TOTAL RATE ADJUSTMENT
ESTIMATED AVERAGE BILLING UNITS (f)
ESTIMATED INCREMENTAL CHANGE IN PURCHASED POWER COST (g)
(a) Exhibit I, Line 3 (b) Exhibit II, Line 9
OEM ANO RELATED
-----
(A)
0. 366
0.000
(2. 450 I
I 2. 084 I
I 2.155 I
0.000
------
( 2.155)
51,382
($110, 728.21)
(c) Exhibit lll, Column E, Lines 3 and 5
ENERGY RELATED
--------
(B)
0.001982
(0.003505)
------
(0.001523)
(0.001575)
o. 000000
------
(0.001575)
31,283,220
($49,271.07)
(d) Line 4 divided by (I - line loss factor)(0.986) '0.9670155863 (e) Tracking Factor effective prior to January 27, 1983. This
factor is zero if new rates have been filed and approved since January 27, 1983.
(f) Exhibit lll, Column E, Lines I and 2 (g) Line 1 times Line 8
LINE NO.
2
3
4
6

KW DEMAND LINE RATE ALLOCATOR
NO. SCHEDULE (%) (a)
------ ------(A)
I RATE-A 27.099 2 RATE-B 5. 242 3 RATE-C 12. 429 4 RATE-PPL 55.188 5 FLAT RATES 0.042 6 RATE IP 0. 000 7 0.000 8 0.000 9 0.000
-----
10 TOTAL 100.000
Page 2 of 1 CITY Of FRANKFORT, INDIANA
DETERMINATION Of RATE ADJUSTMENT FOR TilJl THREE MONTHS OF
JANUARY, FEBRUARY AND MARCH, 2019
INCREMENTAL CHANGE IN PURCHASED POWER COST KWH ENERGY ALLOCATED ALLOCATED ADJ FOR LINE LOSSES & GROSS RECEIPTS TAX ALLOCATOR EST! MA TED KW ESTIMATED KWH ------
(%) (a) PURCHASED (b) PURCHASED I c) DEMAND (d) ENERGY (e) TOTAL
--------- -------- ------ ------- ----------(B) (C) (D) IEI (F) (GI
19.485 11,924.0 6,095,535 1130,006.24) ($9,600.47) ($39,606.11) J.632 2,693.4 1,136,207 ($5,804.37) ($1,789.53) ($7,591.90) 9. 781 6,386.3 3,059,812 ($13, 762.41) ($4,819.20) ($18,581.61)
66.608 28,356.7 20,837' 127 ($61,108.68) ($12,818.47) ($93,927.15) 0.494 21. 6 154' 539 ($46.51) ($241.40) ($289.91) 0.000 0 .0 0 $0.00 $0. 00 $0.00 0.000 0.0 0 $0.00 $0.00 $0.00 0.000 o. 0 0 $0.00 $0.00 $0.00 0.000 0. 0 0 $0. 00 $0 .00 $0 .00
- ------ -------- ------ -----
100.000 51,382.0 31,283,220 ($110,728.21) ($49,271.07) ($159,999.28)
LINE NO.
1 2 3 4 5 6 7 8 9
10
-------
(a) From Cost of Service Study Cause No. 44856 (bl Page I of 3, Column A, Line 8 times Page 2 of 1, Column A (c) Page I. of 1, Column B, Line 8 times Page 2 of 3, Column B (d) Page I of 1, Column A, Line 9 times Page 2 of 1, Column A (e) Page I of 1, Column B, Line 9 times Page 2 of 1, Column B
CITY OF FRANKFORT, INDIANA
-------
DETERMINATION OF RATE ADJUSTMENT FOR THE THREE MONTHS OF
JANUARY, FEBRUARY AND MARCH, 2019
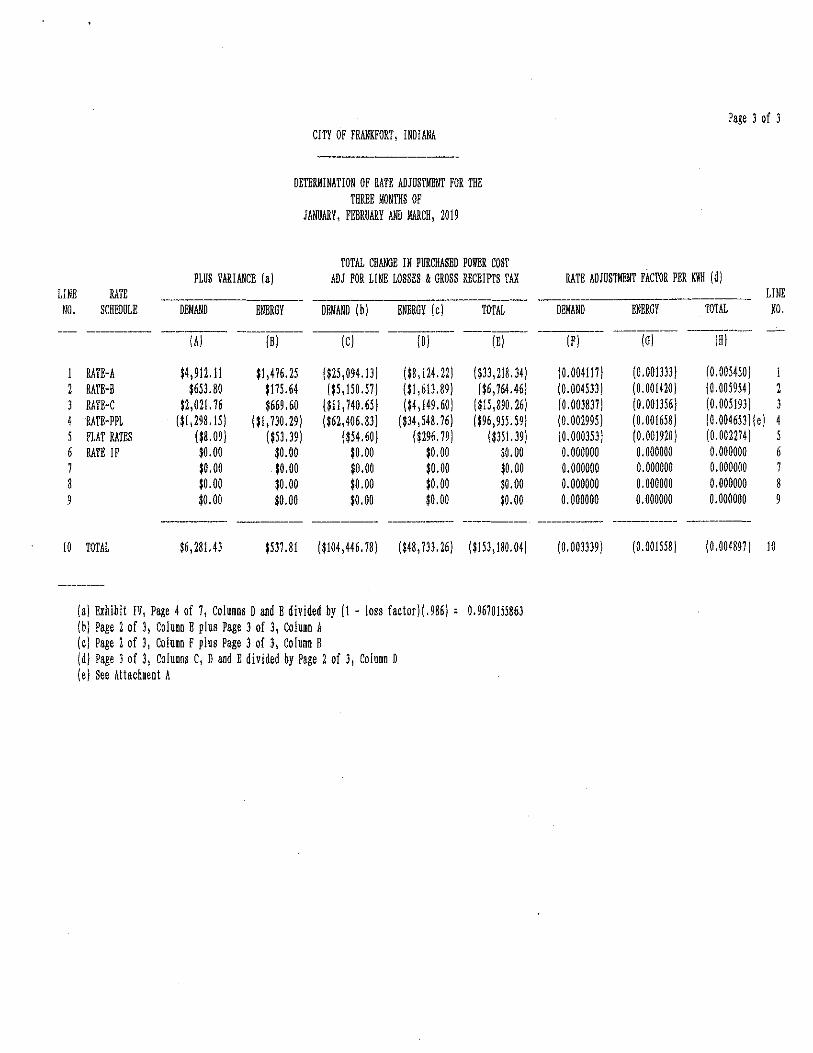
TOTAL CHANGE IN PURCHASED POWER COS! PLUS VARIANCE (a) ADJ FOR LINE LOSSES & GROSS RECEIPTS !AX
LINE RA!E NO. SCHEDULE DEMAND ENERGY DEMAND (b) ENERGY (c) !O!AL
--------- ------ --------- ------- ------ -------(A) (BJ (CJ (DJ IE)
1 RATE-A $4,912. 11 $1,476.25 ($25,094.13) ($8,124.22) ($33,218.34) 2 RATE-B $653.80 $175.64 ($5,150.57) ($1,613.89) ($6,764.46) 3 RATE-C $2,021.16 $669. 60 ($11,740.65) ($4,149.60) 1115,890.26) 4 RATE-PPL ($1,298.15) ($1,730.29) ($62,406.83) ($34,548. 76) ($96,95U9) 5 FLAT RATES ($8. 09) ($53.39) ($54.60) ($296. 79) ($351.39) 6 RATE IP $0.00 $0.00 10 .oo $0. 00 $0. 00 7 $0.00 $0.00 $0.00 $0 .00 $0. 00 8 $0.00 $0.00 $0.00 $0. 00 $0. 00 9 $0.00 $0.00 $0.00 $0.00 $0. 00
----- -------- --------- --------
10 TOTAL $6,281.43 $537.81 ($104,446. 78) ($48, JJJ.26) ($153,180.04)
----
(a) Exhibit IV, Page 4 of 7, Columns D and E divided by (1 - loss factorJl .986) ' 0.9670155863 lb) Page 2 of 3, Column E plus Page J of J, Column A (c) Page 2 of 3, Column F plus Page J of 3, Column B (d) Page 3 of J, Columns C, D and E divided by Page 2 of J, Column D ( e I See Attachment A
Page 3 of 3
RATE ADJUSTMENT FACTOR PER KWH (d) LINE --------------------
DEMAND ENERGY !O!AL NO.
-------- ---------- --------IF) (G) (HJ
(0.004117) (0.0013JJ) (0.005450) I (0.004533) (0.001420) (0.005954) 2 (0.003837) (0.001356) (0.005193) J (0.002995) (0.001658) I 0.004653 ll e I 4 (0.000353) (0.001920) (0.002274) 5 0. 000000 o. 000000 0.000000 6 0. 000000 0.000000 0.000000 1 0. 000000 o. 000000 0.000000 8 0. 000000 0.000000 o. 000000 9
--------- -------- ---------
(0.003339) (0.001558) (0.004897) 10

LINE NO.
J
Exhibit I
CITY OF FRANKFORT, INDIANA
DETERMINATION OF INCRENENTAL CHANGE IN BASE RATE
DEMAND ENERGY DESCRIPTION RELATED RELATED
------------- ------ --------
BASE RATE EFFECTIVE JAN. 1,2019 (a) 24.698 0.030772
BASE RATE EFFECTIVE JAN.l,2017 (bl 24.332 Id I 0.028790
---------- ----------
INCREMENTAL CHANGE IN BASE RATE (c) 0 .366 0.001982
(a) IMPA rate effective for the period covered by this filing. The Base Rate includes the applicable .Area Adjustment and Delivery Voltage Adjustment.
(b) Base purchased power rate including Area and Voltage Adjustments effective at the time of the member's last approved rate case was filed or January 27, 1983, whichever is more recent.
(c) Line l - Line 2 (d) Equivalent Coincident Peak
LINE NO.
2
3
LINE NO.
2
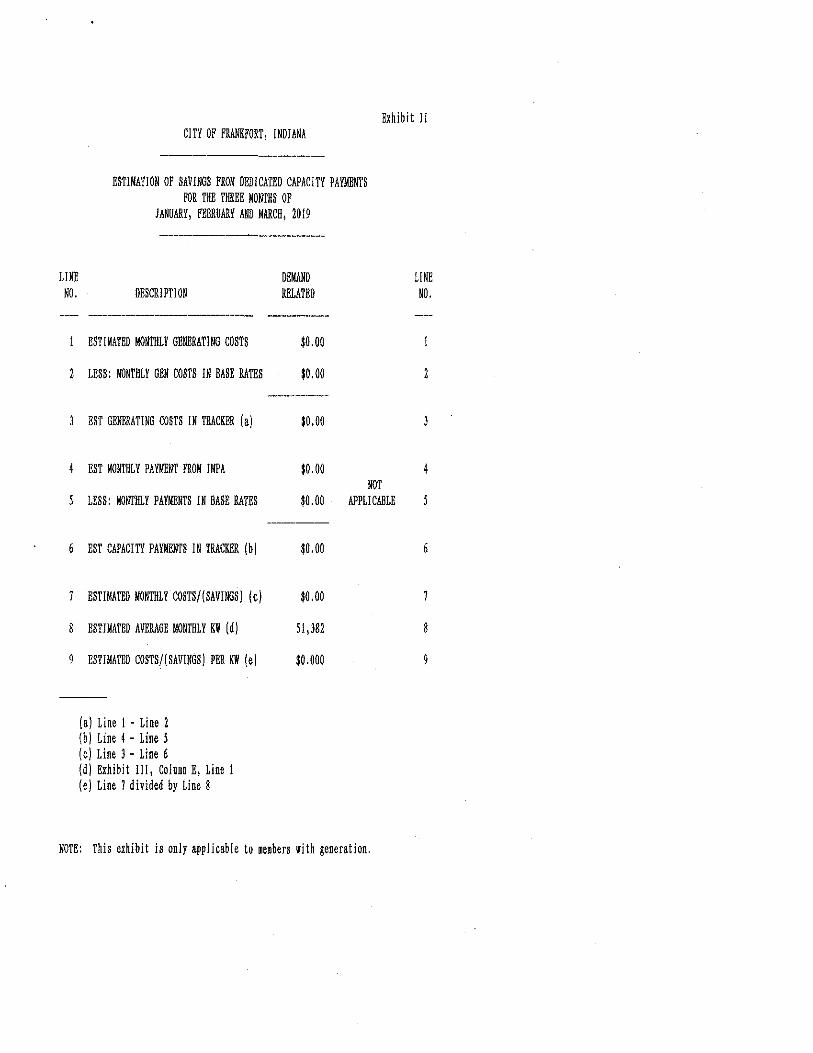
CITY OF FRANKFORT, INDIANA
ESTIMATION OF SAVINGS FROM DEDICATED CAPACITY PAYMENTS fOR THE THREE MONTHS OF
JANUARY, FEBRUARY AND MARCH, 2019
DEMAND DESCRIPTION RELATED
------------------ -----
ESTIMATED MONTHLY GENERATING COSTS $0.00
LESS: MONTHLY GEN COSTS IN BASE RATES $0.00
-----EST GENERATING COSTS IN TRACKER (a) $0.00
EST MONTHLY PAYMENT FROM IMPA $0.00
Exhibit II
LINE NO.
2
4 NOT
LESS: MONTHLY PAYMENTS IN BASE RATES $0.00 APPLICABLE
-----
6 EST CAPACITY PAYMENTS IN TRACKER (b) $0.00 6
ESTIMATED MONTHLY COSTS/(SAVINGS) (c) $0.00
ESTIMATED AVERAGE MONTHLY KW (d) 51,382 8
9 ESTIMATED COS!S/(SAVINGS) PER KW (e) $0 .000
---(a) Line I - Line 2 (b) Line 4 - Line 5 (c) Line J - Line 6 (d) Exhibit III, Column E, Line I (e) Line 1 divided by Line 8
NOTE: !his exhibit is only applicable to members with generation.

LINE NO.
1 2
J 4
5 6
DESCRIPTION
PURCHASED POWER FRON INPA
KW DEMAND KWH ENERGY
INCREMENTAL PURCHASED POWER COSTS
DEMAND RELATED ECA FACTOR PER KW CHARGE (a)
ENERGY RELATED ECA FACTOR PER KWH CHARGE (b)
la) Line 1 times Line J (b) Line 2 times Line 5
CITY OF FRANKFORT, INDIANA
ESTIMATION OF ENERGY C-OST ADJUSTMENT FOR THE FOR THE THREE MONTHS OF
JANUARY, FEBRUARY AND MARCH, 2019
JANUARY 2019
!Al
FEBRUARY 2019
(BJ
MARCH 2019
(Cl
Exhibit III
ESTIMATED 3 MONTH LINE
TOTAL AVERAGE NO.
ID I (El
52,042 52,820 49,285 154,147 51,382 33,281,392 J0,105,503 30,462, 765 93,849,660 31,283,220
12.4501 [2.4501 (2.450) (2.4501 [$127,502.901 ($129,409.00) ($120,748.251 [$377,660.15) [$125,886.721
(0.0035051 [0.0035051 (0.0035051 [0.0035051 ($116, 651.28 I I 1105 ,519. 79 I IU06, 17U9 I I $328, 943.061 I $109,647. 69 I
LINE NO.
2
l
6
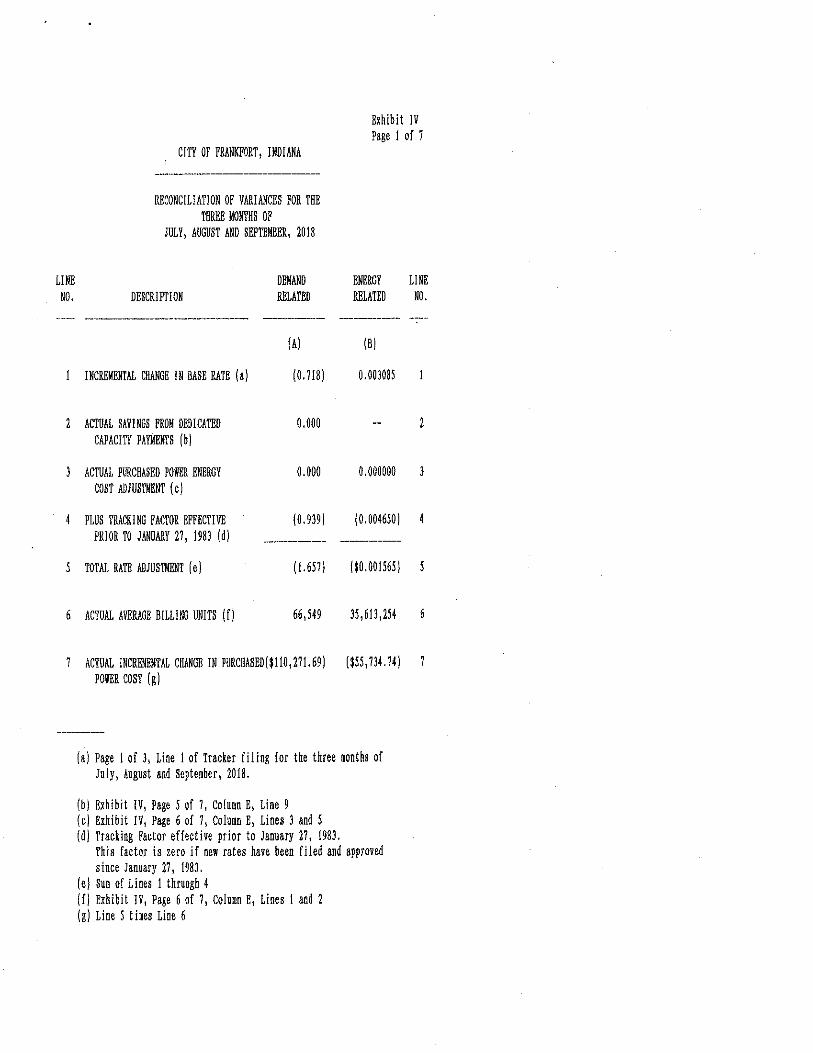
Exhibit JV Page 1 of 7
CITY OF FRANKFORT, INDIANA
----------------------
RECONCILIATION OF VARIANCES FOR THE THREE MONTHS OF
JULY, AUGUST AND SEPTEMBER, 2018
DEMAND ENERGY DESCRIPTION RELATED RELATED
----------------- ----- -------
(A) (Bl
INCREMENTAL CHANGE IN BASE RATE (a) ( 0. 718) 0.003085
ACTUAL SAVINGS FROM DEDICATED 0. 000 CAPACITY PAYMENTS (bl
AC!UAL PURCHASED POWER ENERGY 0.000 0 .000000 COS! ADJUSTMENT ( c)
PLUS TRACKING FACTOR EFFECTIVE ( 0. 939 I ( 0.004650 I PRIOR 10 JANUARY 21, 1983 (d) ----- -------
TOTAL RA!E ADJUSTMENT I e) (1.651) ($0.001565)
ACTUAL AVERAGE BILLING UNITS (fl 66,549 35,613,254
ACTUAL INCREMENTAL CHANGE IN PURCHASED($110, 211. 69 I ($55,134.141 POWER COST (g)
(a) Page I of 3, Line I of !racker filing for the three months of July, August and September, 2018.
(bl Exhibit IV, Page 5 of 7, Column E, Line 9 (cl Exhibit IV, Page 6 of 1, Column E, Lines 3 and 5 (d) Tracking Factor effective prior to January 21, 1983.
This factor is zero if oew rates have been filed and approved since January 21, 1983.
(e) Sum of Lines I thruogh 4 (fl Exhibit JV, Page 6 of 1, Column E, Lines 1 and 2 (g) Line 5 tines Line 6
LINE NO.
2
3
6

Exhibit IV Page 2 of 1
CITY OF FRANKFORT, INDIAllA
RECONCILIATION OF VARIANCES FOR THE THREE MONTHS OF
JULY, AUGUST AND SEPTEMBER, 2018
---------------
KW DEMAND KWH ENERGY ALLOCATED ALLOCATED LINE RATE ALLOCATOR ALLOCATOR ACTUAL KW ACTUAL KWH
NO. SCHEDULE (%) [a) [%) la) PURCHASED (b) PURCHASED (c) ---------- ------- ------- ----------- ------------
IA) (B) IC) IDI
I RATE-A 27.099 19. 485 18,034.1 6, 939, 243 2 RATE-B 5. 242 3.632 3,488.5 1,293,413 3 RATE-C 12. 429 9. 181 8,211.4 3, 483, JJ2 4 RATE-PPL 55.188 66.608 36,121.1 23,721,216 5 FLAT RATES 0.042 0.494 28.0 11l,929 6 0. 000 0. 000 0.0 0 1 0.000 0. 000 0.0 0 8 o. 000 0.000 0. 0 0 9 0.000 0. 000 0. 0 0
----- ------ ------
10 TOTAL 100. 000 100.000 66,549.0 35,613,254
------
la) From Cost of Service Study Cause No. 44856 (b) Exhibit IV, Page 6 of 1, Column E, Line 1 times Exhibit IV, Page 2 of 7, Column A lei Exhibit IV, Page 6 of 1, Column E, Line 2 times Exhibit IV, Page 2 of 1, Column B Id) Exhibit IV, Page 1of1, Column A, Line 1 times Exhibit IV, Pagel of 1, Column A lei Exhibit IV, Page I of 1, Column B, Line 1 times Exhibit IV, Pagel of 1, Column B
INCREMllNTAL CHANGE HI PURCHASED POWER COST LINE ---------------------------
DEMAND (d) ENERGY (e) TOTAL NO.
--------- ----------- --------IE) IFI (Gi
[$29,882. 53) ($10,859.911 1$40,142.44) 1 1$5,180.44) ($2,024.29) 1$1,804.13) 2
1$13, 105. 61) ($5,451.41) ($19,151.08) 3 ($60,856.14) ($37,123.80) 1191,980.54) 4
1146.31) 11215.33) ($321.64) 5 $0 .00 $0.00 $0. 00 6 $0. 00 $0 .00 $0. 00 1 $0 .00 $0. 00 $0 .00 8 $0. 00 $0.00 $0. 00 9
- ----- ----
($110,211.69) 1155,134.14) ($166,006.43) 10
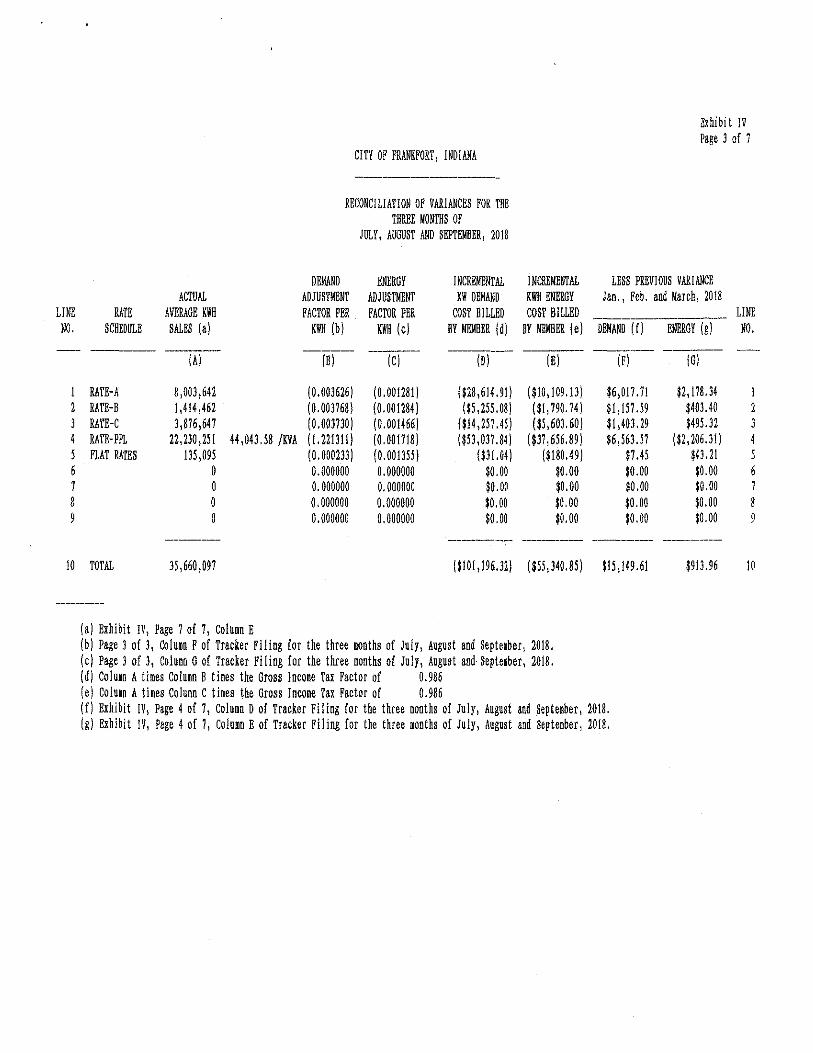
Exhibit IV Page3of7
cm OF rnANKFORT, INDIANA
------------
RECONCILIATION OF VARIANCES FOR THE THREE MONTHS OF
JULY, AUGUST AND SEPTEMBER, 2018
DEMAND ENERGY INCREMENTAL INCREMENTAL LESS PREVIOUS VARIANCE ACTUAL ADJUSTMENT ADJUSTMENT KW DEMAND KWH ENERGY Jan., Feb. and March, 2018
LINE RATE AVERAGE KWH FACTOR PER FACTOR PER COST BILLED COST BILLED LINE -----------NO. SCHEDULE SALES (a) KWH (b) KWH (c) BY MEMBER (d) BY MEMBER I e I DEMAND ( f) ENERGY (g) NO.
----- --- ----- ---- ------- ----- -----(A) (BJ (CJ (DJ IE) (F) (G)
1 RATE-A 8,003,642 (0.003626) (0.001281) ($28,614.91) ($10,109.13) $6,017. 71 $2,178.34 1 2 RATE-B 1,414,462 (0.003768) (0.001284) ($5,255.08) ($1,190.74) $1,157.59 $403.40 2 3 RATE-C 3,876,647 (0.003730) (0.001466) ($14,257.45) ($5,603.60) $1,403.29 $495.32 3 4 RATE-PPL 22,230,251 44,043.58 rm (1.221311) (0.001718) ($53,037.84) I !37, 656. 89 J $6,563.57 ($2,206.31) 4 5 FLAT RATES 135,095 (0.000233) (0.001355) ($31.04) ($180.49) $1.45 143' 21 5 6 0 0. 000000 0.000000 $0. 00 $0.00 $0. 00 $0. 00 6 7 0 0.000000 0. 000000 $0. 00 $0. 00 $0 .00 $0. 00 7 8 0 o. 000000 0.000000 $0. 00 $0.00 $0. 00 $0.00 8 9 0 0.000000 0.000000 $0. 00 $0. 00 10. 00 $0. 00 9
-------- ------- ------ ------- --------
10 TOTAL 35,660,097 ($101,196.32) ($55,340.85) 115,149.61 $913.96 10
---------
(a) Exhibit IV, Page 7 of 7, Column E (b) Page 3 of 3, Column F of Tracker Filing for the three months of July, August and September, 2018. (c) Page 3 of 3, Column G of Tracker Filing for the three mooths of July, August and September, 2018. (d) Column A times Column B times the Gross Income Tax Factor of 0.986 (e) Column A times Column C times the Gross Income Tax Factor of 0.986 (f) Exhibit IV, Page 4 of 7, Column D of Tracker Filing for the three months of July, August and September, 2018. (g) Exhibit IV, Page 4 of 1, Column E of Tracker Filing for the three months of July, August and September, 2018.
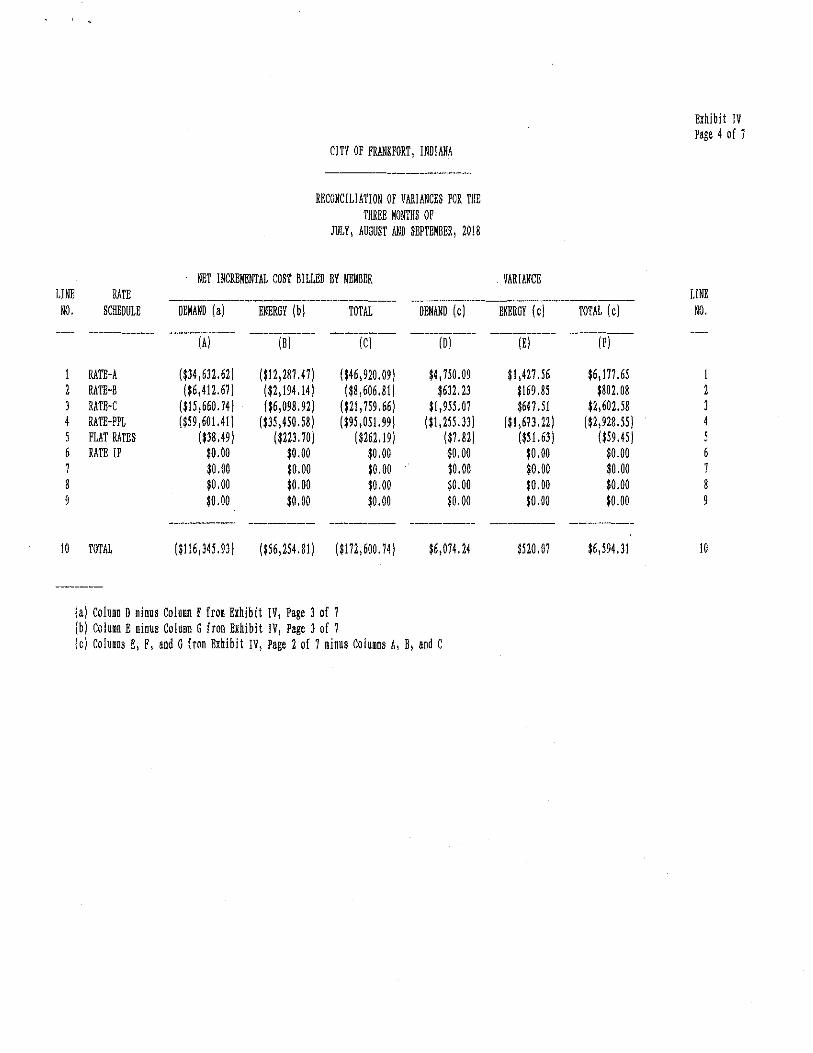
Exhibit IV Page 4 of 7
CITY OF FRANKFORT, INDIANA
RECONCILIATION OF VARIANCES FOR THE THREE MONTHS OF
JULY, AUGUST AND SEPTEMBER, 2018
NET INCREMENTAL COST BILLED BY MEMBER VARIANCE LINE RATE LINE ------
NO. SCHEDULE DEMAND (a) ENERGY (b) TOTAL DEMAND (c) ENERGY ( c) TOTAL (c) NO.
---------- ------- ----------- ----- ----------- ----- ---------(AJ (BJ (CJ (OJ (E) (F)
1 RATE-A ($34,632.62) ($12,287 .47) 1146,920.09) $4' 750.09 $1,421.56 $6, 177. 65 1 2 RATE-B ($6,412.67) ($2,194.14) ($8,606.81) $632. 21 $169.85 $802.08 2 3 RATE-C ($15,660.74) ($6,098.92) ($21, 759.66) $1,955.07 $64 7.51 $2,602.58 3 4 RATE-PPL ($59,601.41J ($15,450.58) ($95,051.99J ($1,255.31) ($1,673.22) ($2,928.55) 4 5 FLAT RATES ($38.49) ($223.70) 11262.19) ($7. 82) ($51.61J ($59.45) 5 6 RATE JP $0. 00 $0.00 $0.00 $0. 00 $0.00 $0.00 6 7 $0.00 $0.00 $0. 00 $0.00 $0.00 $0. 00 7 8 $0.00 $0.00 $0.00 $0. 00 $0.00 10.00 8 9 $0. 00 $0.00 $0. 00 $0. 00 $0.00 $0.00 9
------- ------ ------- --------- --------- ---------
10 TOTAL 11116,145.91) ($56,254.81) (1172,600.74) $6,074.24 !520. 07 $6,594.31 10
------
(a) Column D minus Column F from Exhibit JV, Page 3 of 7 (b) Column E minus Column G Iron Exhibit IV, Page l of 7 (c) Columns E, F, and G Iron Exhibit JV, Page 2 of 7 minus Columns A, B, and C

CITY OF FRANKFORT, INDIANA
DETERMINATION OF ACTUAL DEDICATED CAPACITY PAYMENTS FOR THE THREE MONTHS OF
LIME NO.
4 5
6
DESCRIPTION
------------------------
ACTUAL MEMBER GENERATING COSTS LESS: GENERATING COSTS IN BASE RATES
DIFFERENCE IN ACTUAL TO BASE RATE COSTS la)
ACTUAL MONTHLY PAYMENT FROM IMPA LESS: ESTIMATED PAYMENT IN BASE RATES
DIFFERENCE 1N ACTUAL TO BASE RATE PAYMENT lb)
ACTUAL CAPACITY PAYMENT SAVINGS TO BE COLLECTED THROUGH THE TRACKER I c)
ACTUAL MONTHLY KW BILLED Id)
ACTUAL CAPACITY PAYMENT SAVINGS PER KW I e)
---
la) Line 1 minus Line 2 lb) Line 4 minus Line 5 le) Line 3 minus Line 6 Id) Exhibit IV, Page 6 of 1, Line 1 le) Line 1 divided by Line 8
JULY, AUGUST AND SEPTEMBER, 2018
JULY 2018
------IA)
$0.00 $0 .00
-----------$0. 00
10. 00 $0. 00
----------$0. 00
------------$0.00
61, 031
0.000
AUGUST 2018
------IB)
$0.00 $0 .00
---------$0 .00
$0.00 $0. 00
----------$0.00
--------$0.00
66,026
0. 000
NOT APPLICABLE
NOTE: This exhibit is only applicable to members with generation.
SEPTEMBER 2018
-------IC)
$0.00 $0 .oo
------------$0.00
$0.00 $0 .00
----------$0 .00
$0.00
66, 583
0. 000
TOTAL
-----------(D)
$0.00 $0. 00
-----------$0.00
$0.00 $0. 00
----------$0 .00
--------$0.00
199,646
Exhibit IV Page 5 of 1
AVERAGE
----------IEi
$0. 00 $0.00
-----------$0.00
$0. 00 $0.00
--------$0.00
---------$0. 00
66,549
0.000
LINE NO.
6

LINE NO.
3 4
5 6
DESCRIPTION
PURCHASED POWER FROM IMPA
KW DEMAND (a) KWH ENERGY (a)
INCREMENTAL PURCHASED POWER COSTS
DEMAND RELATED ECA FACTOR PER KW (a) CHARGE (b)
ENERGY RELATED ECA FACTOR PER KWH (a) CHARGE ( c)
-----
CITY Of FRANKFORT, INDIANA
DETERMINATION OF ACTUAL ENERGY COST ADJUSTMENT FOR THE THREE MONTHS OF
JULY, AUGUST AND SEPTEMBER, 2018
JULY 2018
(A)
67 ,037 36,524,892
( o. 939) ($62,947. 74)
(0.004650) ($169,840. 75)
AUGUST 2018
(B)
66,026 36,950,659
(0. 939) ($61,998.41)
(0.004650) ($171,820.56)
SEPTEMBER 2018
(C)
66, 583 33,364,210
(0. 939) ($62,521.44)
(0.004650) ($155,113.58)
(a) From IMPA bills for the months of April, May and June, 2018, attached. (b) Line 1 times Line 3 (c) Line 2 times Line 5
TOTAL
(DI
199,646 106,839, 761
(1187,467.59)
($496,804.89)
Exhibit IV Page 6 of 7
ACTUAL 3 MONTH AVERAGE
(E)
66,549 35,613,254
(0. 939) ($62,489.20)
I 0.004650 l ($165,601.63)
LINE NO.
3 4
5 6

. .
Exhibit IV Page 1 of 7
CITY OF FRANKFORT, INDIANA
DETERMINATION OF ACTUAL AVERAGE KWH SALES FOR THE THREE MONTHS OF
JULY, AUGUST AND SEPTEMBER, 2018
LINE RATE JULY AUGUST SEPTEMBER LINE NO. SCHEDULE 2018 2018 2orn TOTAL AVERAGE NO.
---- ----- ---- ------ -------- ------(A) (B) (C) (D) IE)
1 RATE-A 8,265,065 1,663,218 8,082,642 24,010,925 8,00J,642 l 2 RATE-B 1,455,187 1,165,996 1,422,204 4,243,387 1,414,462 2 3 RATE-C 3,675,852 J,901,109 4,052,319 11,629,940 3,816,647 J 4 RATE-PPL 21,811,821 22, 768, 129 22,090,198 66,690, 154 22,230,251 4 5 FLAT RATES 116,811 136, 151 152,311 405, 285 lJl,095 5 6 RATE IP 0 0 0 0 0 6 1 0 0 0 0 0 7 8 0 0 0 0 0 8 9 0 0 0 0 0 9
----- ----- ---- -------
10 TOTAL 35,344,142 15,835,809 35, 199, 140 106, 980, 291 15,660,097 IO
DETERMINATION OF ACTUAL AVERAGE KVA SALES
RATE JULY AUGUST SEPTEMBER SCHEDULE 2018 2018 2018 TOTAL AVERAGE
11 RATE PPL 44,513.11 KVA 44,111.81 KVA 41,499.09 KVA 132,130.13 KVA 44,043.58 KVA II
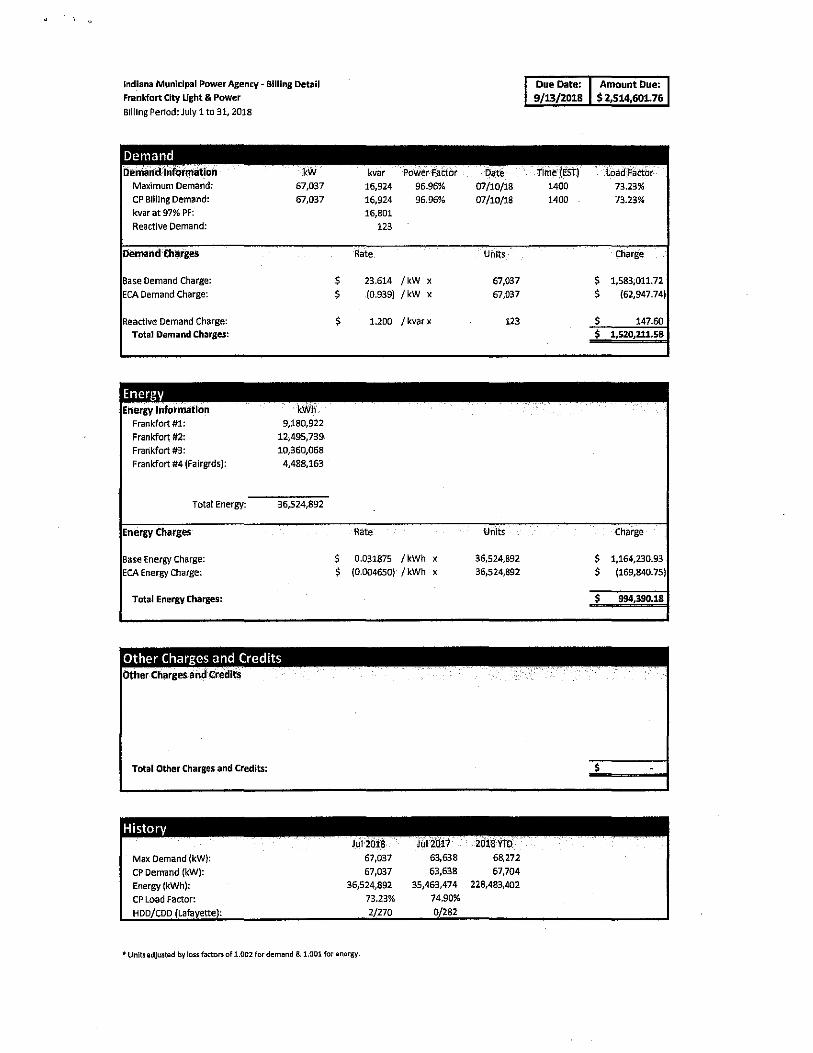
Indiana Municipal Power Agency· Billing Detail
Frankfort City Ught & Power
Billing Period: July 1 to 31, 2018
Demand Derriarid-:1nfotmatJ·on
Maximum Demand:
CP Bllllng Demand:
kvar at 97% PF: Reactive Demand:
Pemand-charges
aase Demand Charge:
ECA Demand Charge:
Reactive Demand Charge: Total Demand Charges:
Energy Energy Information
Frankfort#!:
Frankfort #2: Frankfort #3: Frankfort #4 (Fairgrds):
Total Energy:
Energy Charges
Base Energy Charge: ECA Energy Charge:
Total Energy Charges:
kW
67,037
67,037
kWh 9,180,922
12,49S,739
10,360,068
4,488,163
36,524,892
Other Charges and Credits other Charges:and Credits
Total Other Charges and Credits:
History
Max Demand (kW):
CP Demand (kW): Energy {kWh): CP Load Factor:
HDD/CDD (Lafayette):
$ $
$
kvar
16,924
16,924
16,801
123
Rate
PoWer'fador 96.96%
96.96%
23.614 I kW x (0.939) I kW x
1.200 I kvar x
Rate
$ 0.03187S I kWh x $ (0.0046SO) I kWh x
Jul 2018 JUl2017 67,037 63,638
67,037 63,638
36,524,892 35,463,474
73.23% 74.90%
2/270 0/282
•Units adjusted by loss factors of 1.002 for de mend & 1.001 for energy.
qate 07/10/18
07/10/18
Uilits
67,037
67,037
123
Units
36,S24,892
36,524,892
2018YTD.
68,272
67,704
228,483,402
Due Date: 9/13/2018
rime(Esi) 1400
1400
Amount Due: $ 2,514,601.76
$ $
$ $
Load:Fi1ctor 73.23%
73.23%
Charge
1,583,011.72
(62,947.74)
147.60 1,520,211.58
Charge
$ 1,164,230.93
$ (169,840. 75)
$ 994,390.18
$

Indiana Municipal Power Agency - Billing Detail
Frankfort City Light & Power
Biiiing Period: August 1 to 31, 2018
Demand Demand-Information
Maximum Demand:
CP Biiiing Demand: kvar at 97% PF:
Reactive Demand:
Demand· Charges
Base Demand Charge: ECA Demand Charge:
Total Demand Charges:
Energy Energy Information
Frankfort #1:
Frankfort #2:
Frankfort #3:
Frankfort #4 (Fairgrds):
Total Energy:
Energy Charges
Base Energy Charge:
ECA Energy Charge:
Total Energy Charges:
kW 67,632
66,026
kWh 9,682,846
12,303,203
11,374,533
3,590,077
36,950,659
Other Charges and Credits other Charges.and-Credits
Total Other Charges and Credits:
History
Max Demand (kW):
CP Demand (kW):
Energy {kWh):
CP Load Factor:
HOD/COD Lafayette):
$ $
kvar 16,217
15,526
16,548
Rate
Power Factor 97.24%
97.34%
23.614 /kW x
(0.939) I kW x
Rate
$ 0.031875 I kWh x $ (0.004650) I kWh x
Aug2017
67,632 61,027
66,026 59,692
36,950,659 33,317,540
75.22% 75.02%
1/282 9/139
'"Units adjusted by loss factors of l.002 for demand & l.001 for energy.
Date 08/06/18
08/28/18
Urilts
66,026
66,026
Units
36,950,659 36,950,659
wwrro·-68,272
67,704 265,434,061
Due Date: Amount Due:
10/15/2018 $ 2,503,121.25
Tlme(ESt)
1500
1600
L.Oad--Fa·ct6r
73.43%
75.22%
Charge
$ 1,559,137.96
$ (61,998.41)
$ 1,497,139.55
·charge
$ 1,177,802.26
$ (171,820.56)
$ 1,005,981.70
$

Indiana Municipal Power Agency - Biiiing Detall Frankfort City Ught & Power Billlng Period: September 1to30, 2018
Demand Demand-lntormatlon
Maximum Demand: CP Biiiing Demand: kvar at 97% PF:
Reactive Demand:
Base Demand Charge: ECA Demand Chcirge:
Total Demand Charges:
Energy Energy lnformatfon
Frankfort #1: Frankfort #2: Frankfort #3: Frankfort #4 (Falrgrds):
Total Energy:
Energy Charges
Base Energy Charge; ECA Energy Charge:
Total Energy Charges:
liW 66,768 66,583
kWh 8,702,553
11,544,849 9,784,212 3,332,596
33,364,210
Other Charges and Credits Other Charges-and Credits
Total other Charges and Credits:
History
Max Demand (kW): CP Demand (kW): Energy (kWh): CP Load Factor: HDD/CDD Lafayette :
$ $
kvar 13,843 14,359
16,687
Rate
Power Mictor 97.92%
97.75%
23.614 I kW x (0.939) I kW x
Rate
$ o.031875 I kWh x $ (0.004650) I kWh x
Sep 2018 5ep2011 66,768 63,697
66,583 63,697
33,364,210 30,899,365
69.60% 67.37%
55/189 69/136
•Units ad]U$ted by [0$s factors of 1.002 for demand & 1.001 for energy.
Date
09/20/18 09/05/18
Units
66,583 66,583
33,364,210 33,364,210
!-018YTQ 6a2n
'67,704 298,798,271
Due Date: Amount Due: 11/14/2018 $ 2,418,110.13
T1mo(f5T) 1600
1600
Load Fa.ctor 69.40%
69.60%
$ 1,572,290.96 $ (62,521.44)
$ 1,509,769.52
tharge
$ 1,063,484.19 $ (155,143.58)
$ 908,340.61
$


![Frankfort Roundabout. (Frankfort, KY) 1905-08-05 [p ].](https://static.documents.pub/doc/80x56/619296ecf8ec4c566b77c48d/frankfort-roundabout-frankfort-ky-1905-08-05-p-.jpg)

