

Zero TiltCritical Design Review
Frostburg State UniversityBrett Dugan, Adam Rexroad, Kaetie Combs, Michael Stevenson, Daniel Gares,
Mayowa Ogundipe, Tyler Lemmert, Jared Hughes, Sean Hughes, Andrew Huntley, Subhasis Ghosh, Derek Val-Addo,
11/27/2011
1

Mission Overview
2
Mission Statement: Zero Tilt’s goal is to provide, for the first time, a stable environment throughout the flight of a Sounding Rocket via two concurrent objectives:
◦Tilt correction system
◦Despun platform system
3
Mission Overview
We plan to:
◦ Counteract the platform spin◦ Orient the platform parallel to the earth’s surface at all times◦ Confirm the altitude reading using an accelerometer on our
platform
We expect to prove that it is possible to correct spin, tilt, and determine the altitude based upon a level reference.
This could benefit any scientific experiment that requires stabilization in order to collect data.
4
Mission Overview
The underlying theory and concepts:
◦negative feedback control systems ◦concepts of torque and centripetal force
◦Micro electromechanical systems (MEMS)
◦Real-Time Systems Theory (for multi-tasking)
5
Mission Overview: Theory and Concepts
Mission Objectives:
◦ Counter the spin of the rocket during flight.
◦ Keep a level surface to earth using our conceptual design.
◦ Prove successful by using the stored gyroscope output and the feedback from various motors.
Minimum success criteria
◦ Our main goals as the Zero Tilt team is to receive results indicating that we achieved zero tilt for the flight of a sounding rocket.
6
Mission Overview: Mission Requirements
7
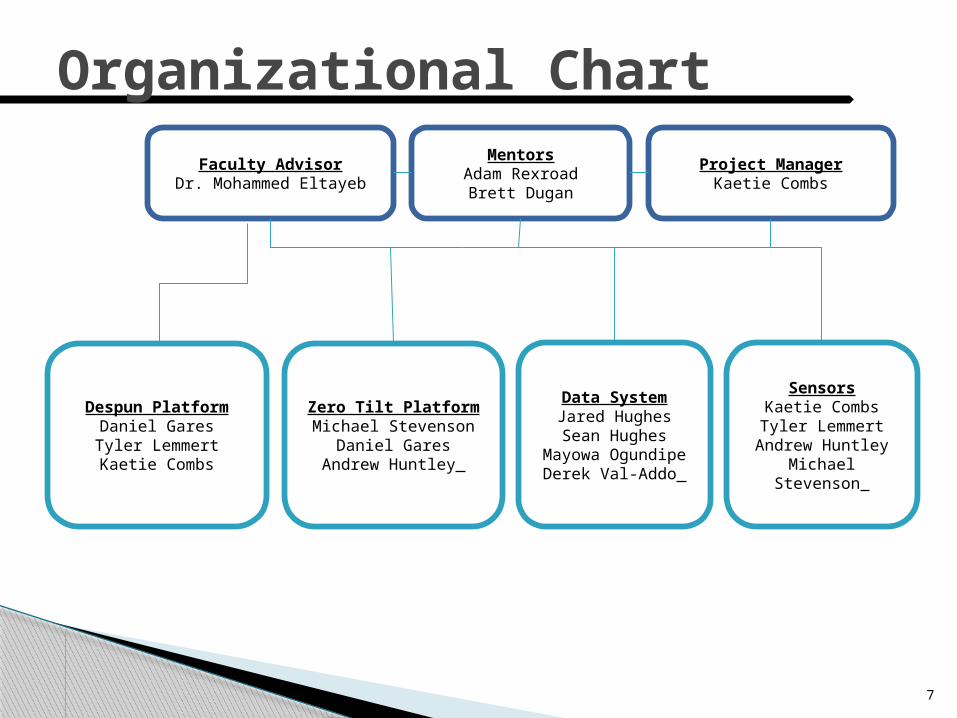
Organizational Chart
Project ManagerKaetie Combs
MentorsAdam RexroadBrett Dugan
Faculty AdvisorDr. Mohammed Eltayeb
Despun PlatformDaniel Gares
Tyler LemmertKaetie Combs
Zero Tilt PlatformMichael Stevenson
Daniel GaresAndrew Huntley
SensorsKaetie CombsTyler Lemmert
Andrew HuntleyMichael Stevenson
Data SystemJared HughesSean Hughes
Mayowa OgundipeDerek Val-Addo
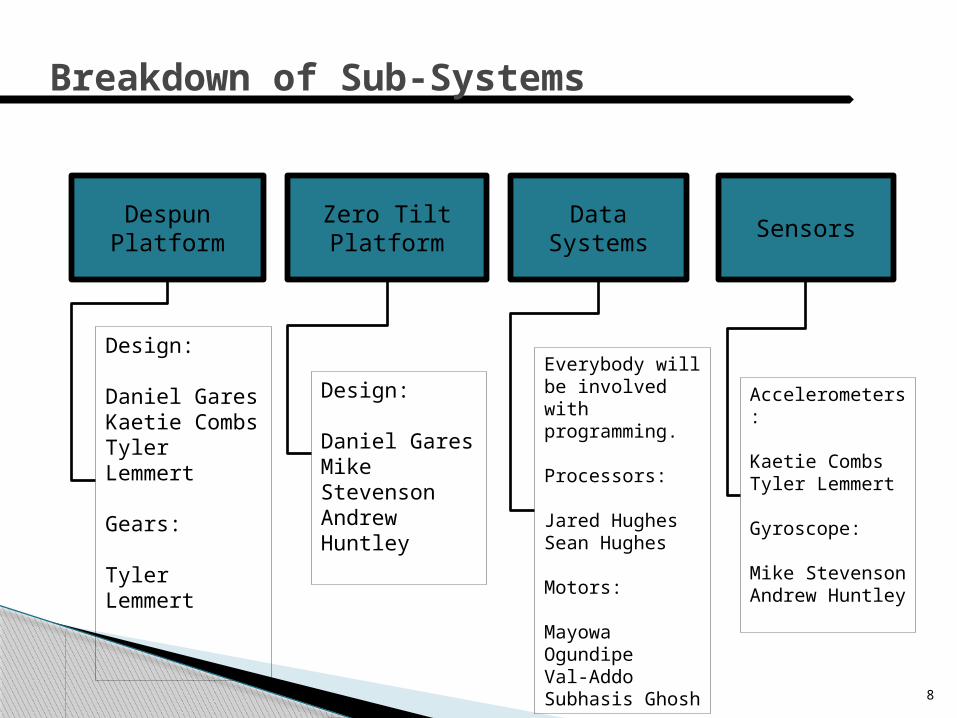
Breakdown of Sub-Systems
8
Despun Platform
Zero Tilt Platform
Data Systems
Sensors
Design:
Daniel GaresKaetie CombsTyler Lemmert
Gears:
Tyler Lemmert
Design:
Daniel GaresMike Stevenson Andrew Huntley
Everybody will be involved with programming.
Processors: Jared HughesSean Hughes
Motors:
Mayowa OgundipeVal-AddoSubhasis Ghosh
Accelerometers: Kaetie CombsTyler Lemmert
Gyroscope:
Mike StevensonAndrew Huntley
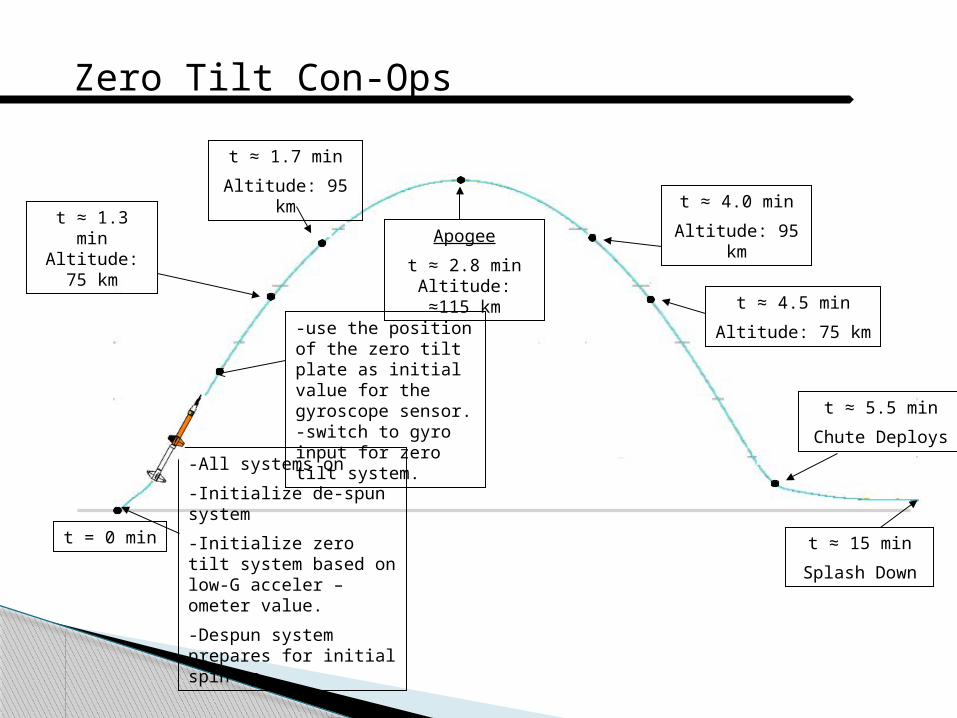
Zero Tilt Con-Ops
t ≈ 1.3 min Altitude: 75
km
t ≈ 15 min
Splash Down
t ≈ 1.7 min
Altitude: 95 km
-All systems on
-Initialize de-spun system
-Initialize zero tilt system based on low-G acceler –ometer value.
-Despun system prepares for initial spin up.
t = 0 min
t ≈ 4.0 min
Altitude: 95 kmApogee
t ≈ 2.8 min Altitude: ≈115 km
t ≈ 4.5 min
Altitude: 75 km
t ≈ 5.5 min
Chute Deploys
-use the position of the zero tilt plate as initial value for the gyroscope sensor.-switch to gyro input for zero tilt system.
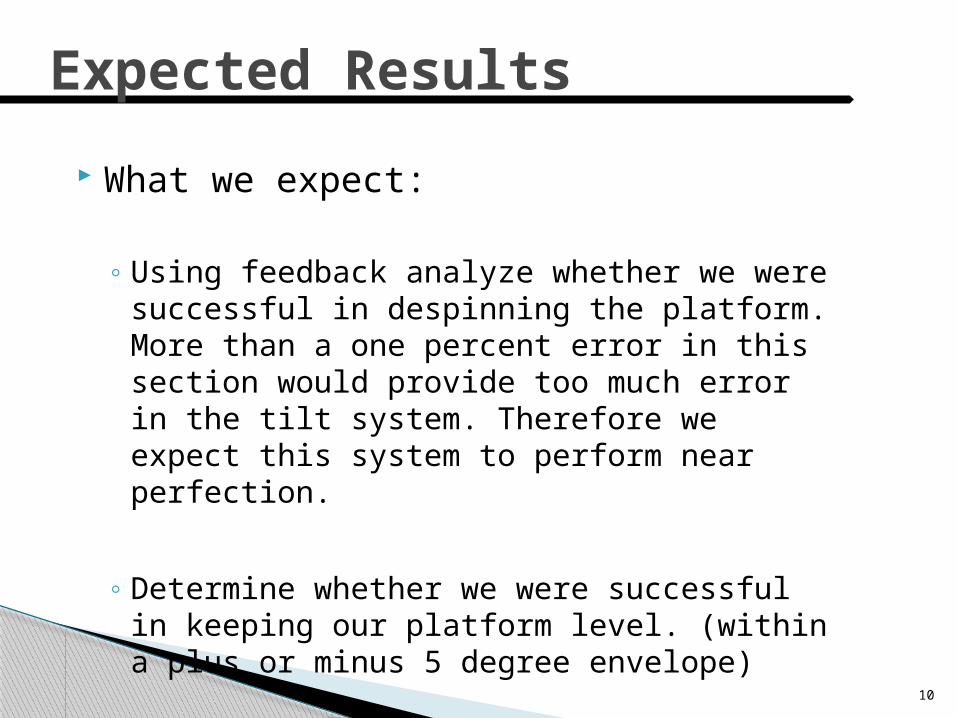
What we expect:
◦ Using feedback analyze whether we were successful in despinning the platform. More than a one percent error in this section would provide too much error in the tilt system. Therefore we expect this system to perform near perfection.
◦ Determine whether we were successful in keeping our platform level. (within a plus or minus 5 degree envelope)
10
Expected Results

Design Description
11
12
The scope of the project has changed slightly.
◦ We no longer require a viewport for camera due to size constraints.
◦ There was a minor change made to the design which will be discussed in the Mechanical Design elements section.
◦ Due to processor obligations we will not be verifying the altitude with the Low-G accelerometer.
◦ Our method for obtaining power has changed since the 9 volt batteries we were considering do not supply the continuous current necessary. Instead we will use a combination of AA batteries and 9 volts to supply various systems with the correct power.
De-Scopes
13
If we run out of time or money, or main goal would become to concentrate on the despun system.
If the tilt system does not have the time to complete the tilt correction, we may have to institute a different system. Such as running two processors and two gyros, one for each motor.
If the intuition that the priority of motors in the tilt system is wrong, then we need to consider major program changes.
Off RAMPS

14
Mechanical Design
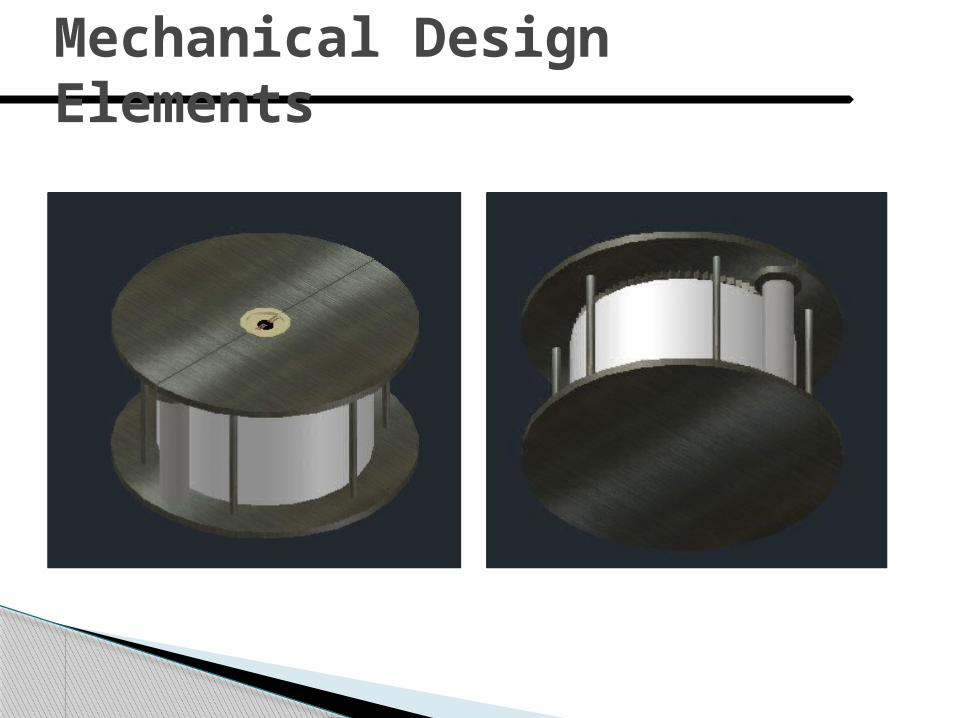
Mechanical Design Elements

Mechanical Design Elements – Gear Elements
16
Mechanical Design Elements – Main Gear
17
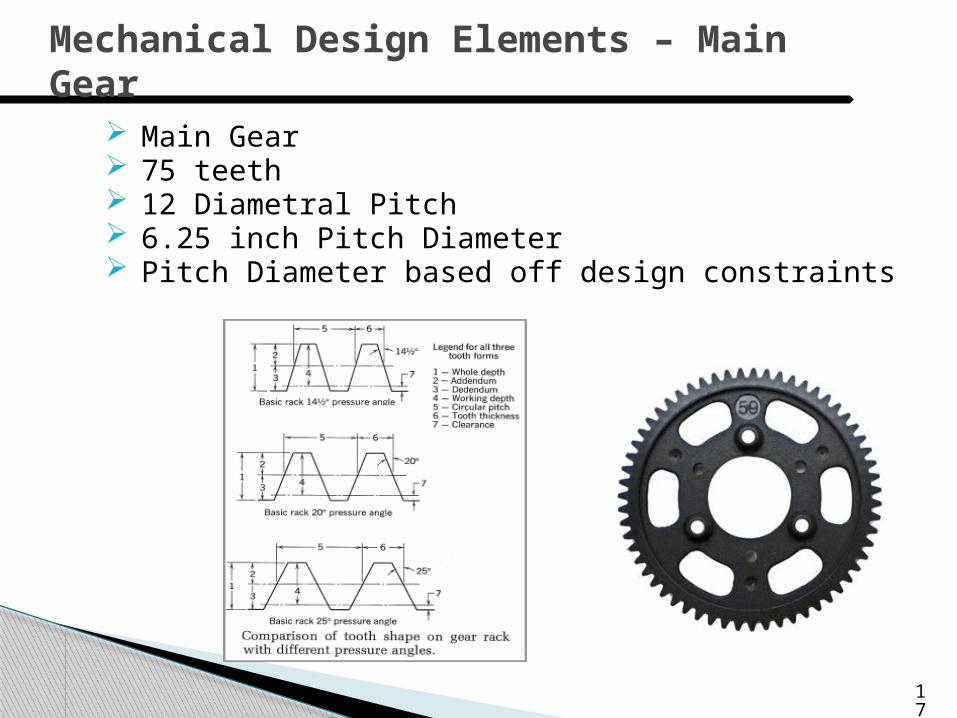
Main Gear 75 teeth 12 Diametral Pitch 6.25 inch Pitch Diameter Pitch Diameter based off design constraints
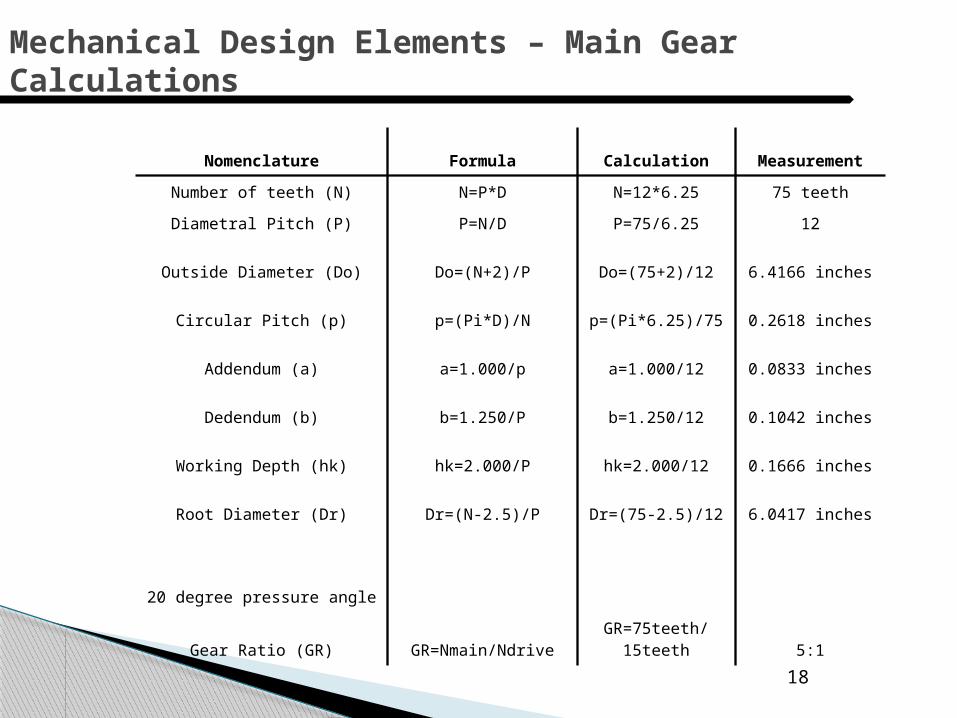
Mechanical Design Elements – Main Gear Calculations
18
Nomenclature Formula Calculation Measurement
Number of teeth (N) N=P*D N=12*6.25 75 teeth
Diametral Pitch (P) P=N/D P=75/6.25 12
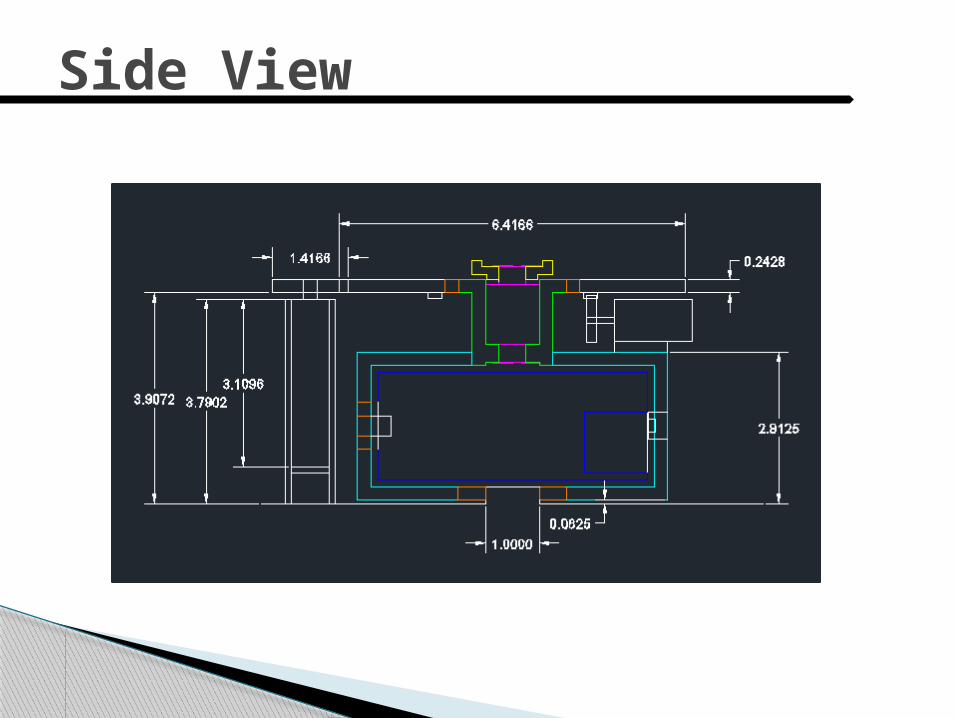
Outside Diameter (Do) Do=(N+2)/P Do=(75+2)/12 6.4166 inches
Circular Pitch (p) p=(Pi*D)/N p=(Pi*6.25)/75 0.2618 inches
Addendum (a) a=1.000/p a=1.000/12 0.0833 inches
Dedendum (b) b=1.250/P b=1.250/12 0.1042 inches
Working Depth (hk) hk=2.000/P hk=2.000/12 0.1666 inches
Root Diameter (Dr) Dr=(N-2.5)/P Dr=(75-2.5)/12 6.0417 inches
20 degree pressure angle
Gear Ratio (GR) GR=Nmain/NdriveGR=75teeth/
15teeth 5:1
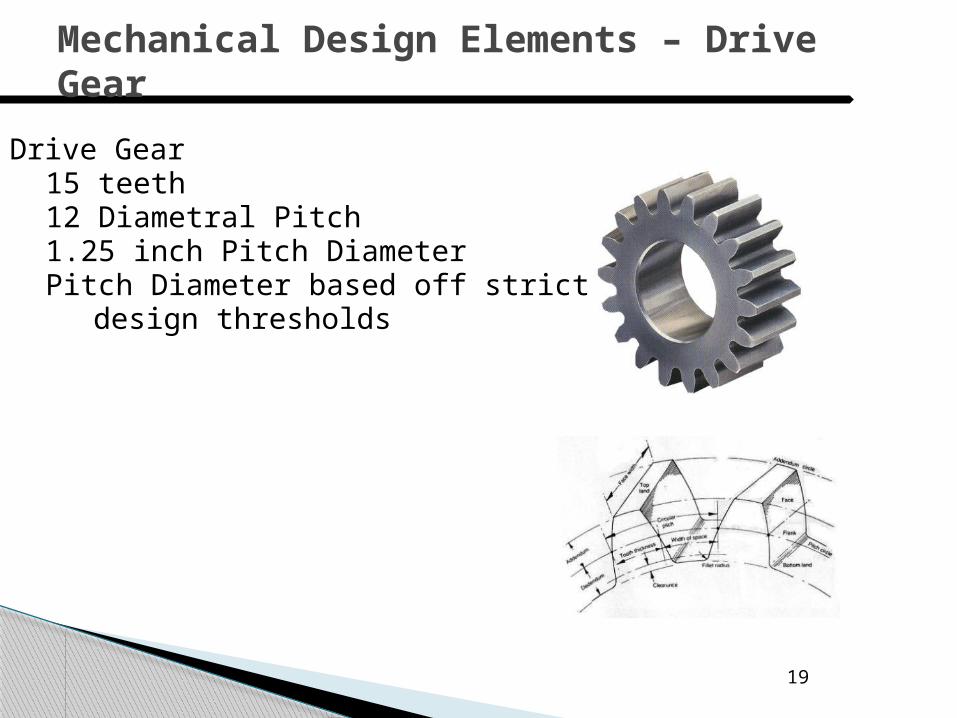
Mechanical Design Elements – Drive Gear
19
Drive Gear15 teeth12 Diametral Pitch1.25 inch Pitch DiameterPitch Diameter based off strict
design thresholds
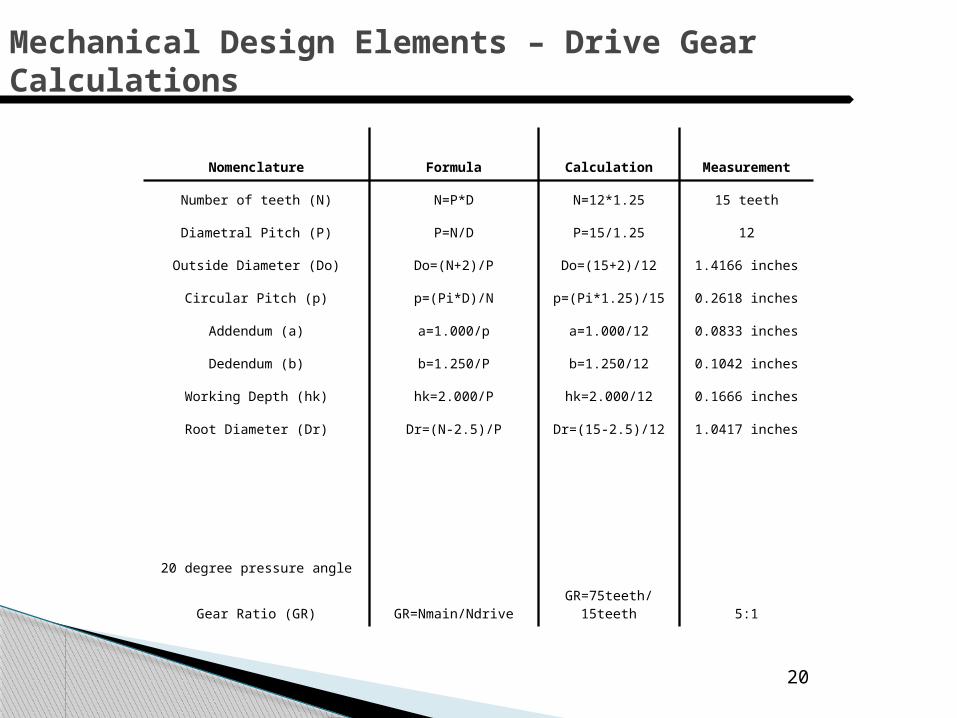
Mechanical Design Elements – Drive Gear Calculations
20
Nomenclature Formula Calculation Measurement
Number of teeth (N) N=P*D N=12*1.25 15 teeth
Diametral Pitch (P) P=N/D P=15/1.25 12
Outside Diameter (Do) Do=(N+2)/P Do=(15+2)/12 1.4166 inches
Circular Pitch (p) p=(Pi*D)/N p=(Pi*1.25)/15 0.2618 inches
Addendum (a) a=1.000/p a=1.000/12 0.0833 inches
Dedendum (b) b=1.250/P b=1.250/12 0.1042 inches
Working Depth (hk) hk=2.000/P hk=2.000/12 0.1666 inches
Root Diameter (Dr) Dr=(N-2.5)/P Dr=(15-2.5)/12 1.0417 inches
20 degree pressure angle
Gear Ratio (GR) GR=Nmain/Ndrive GR=75teeth/15teeth 5:1

After cutting the gears, we will utilize one of the electric motors in the campus machine shop to test the durability and precision of the
With the electric motors we can test the durability of the gears by meshing them at high speeds as well as applying a load to the gears. With such testing we can find weak points as well as any points where destructive friction is present.
By testing the gears at max conditions, we will be assured that the gears will survive the ascent and splash-down.
Mechanical Design Elements – Gear Testing
21
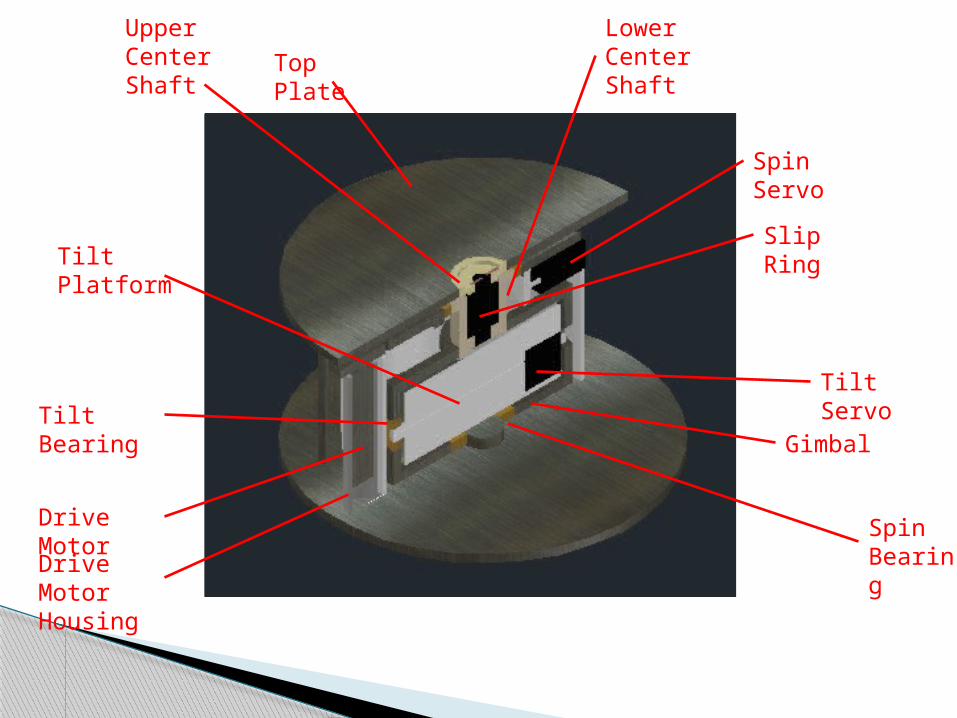
Upper Center Shaft
Tilt Servo
Lower Center Shaft
Slip Ring
Top Plate
Spin Bearing
Tilt Bearing
Tilt Platform
Drive Motor Housing
Drive Motor
Spin Servo
Gimbal
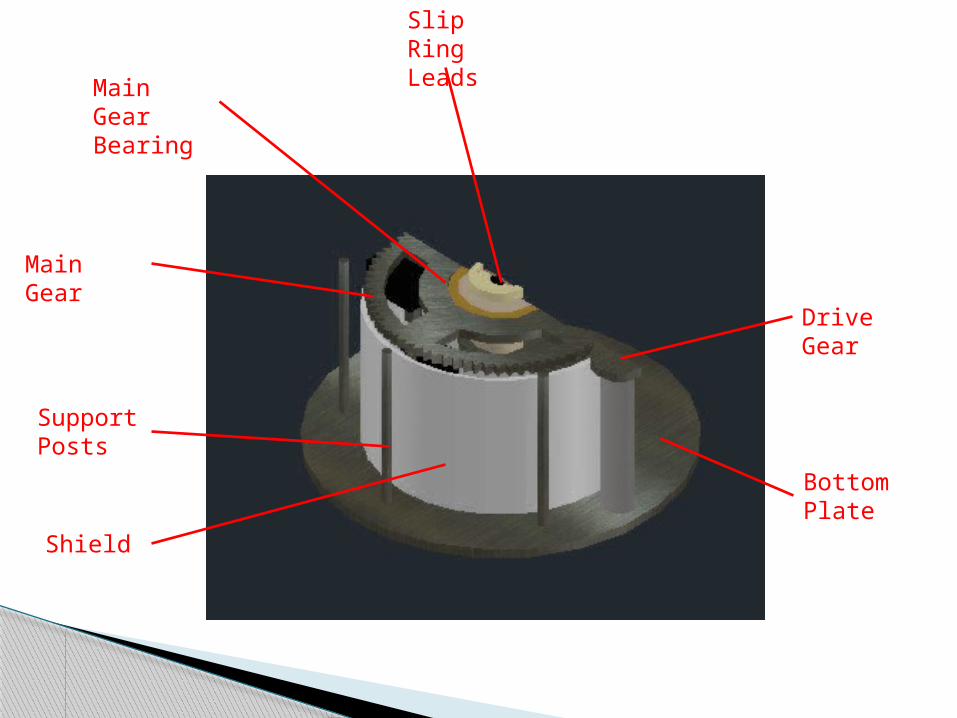
Main Gear Bearing
Slip Ring Leads
Bottom Plate
Main Gear
Drive Gear
Support Posts
Shield
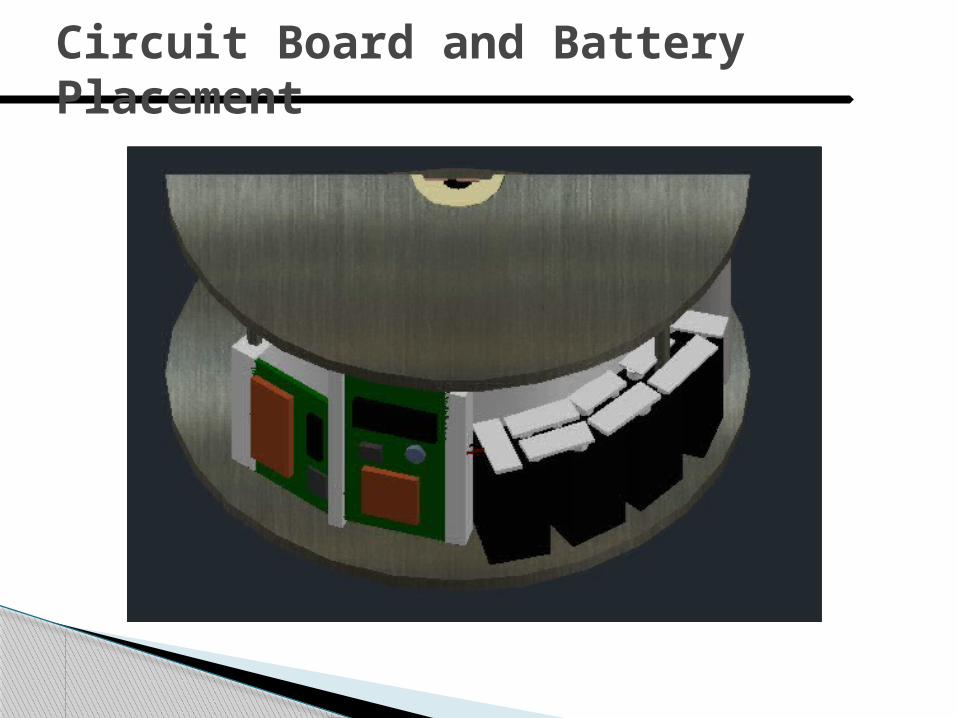
Circuit Board and Battery Placement
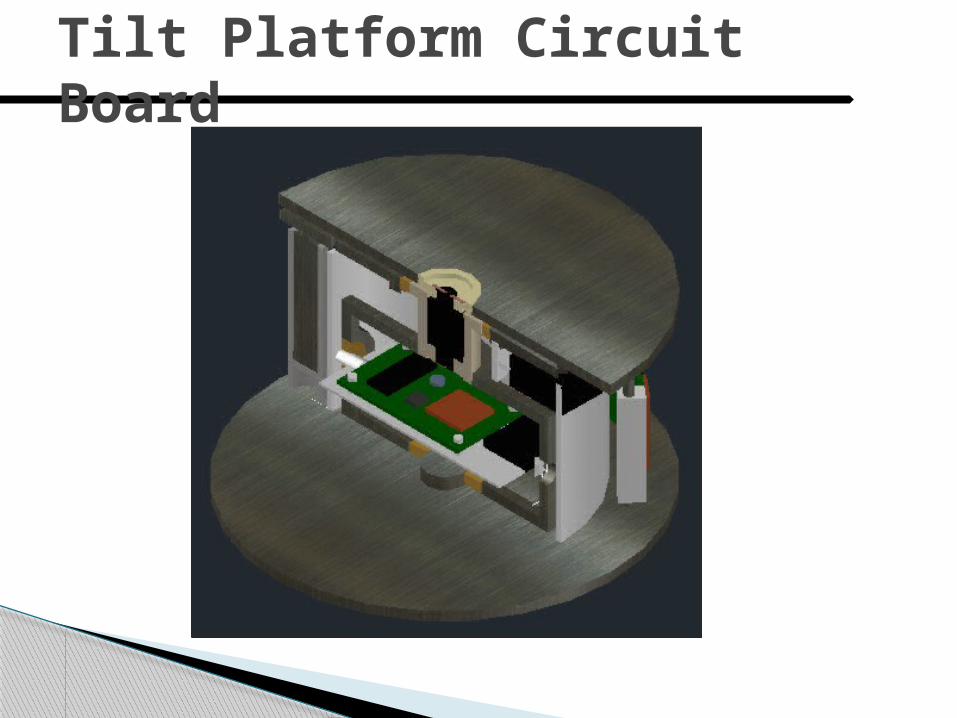
Tilt Platform Circuit Board
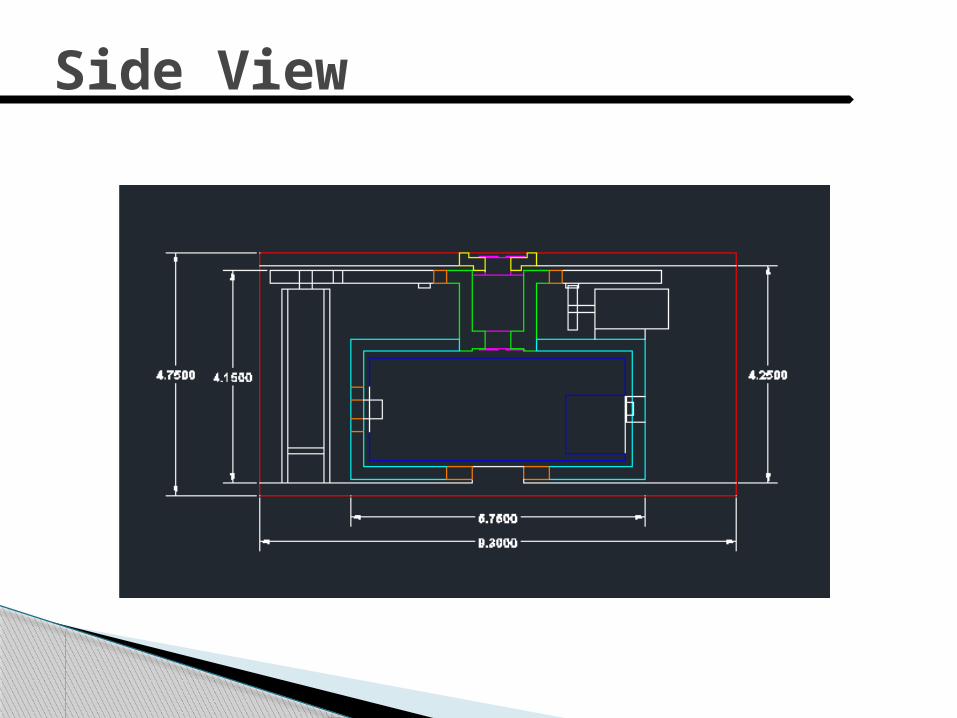
Side View
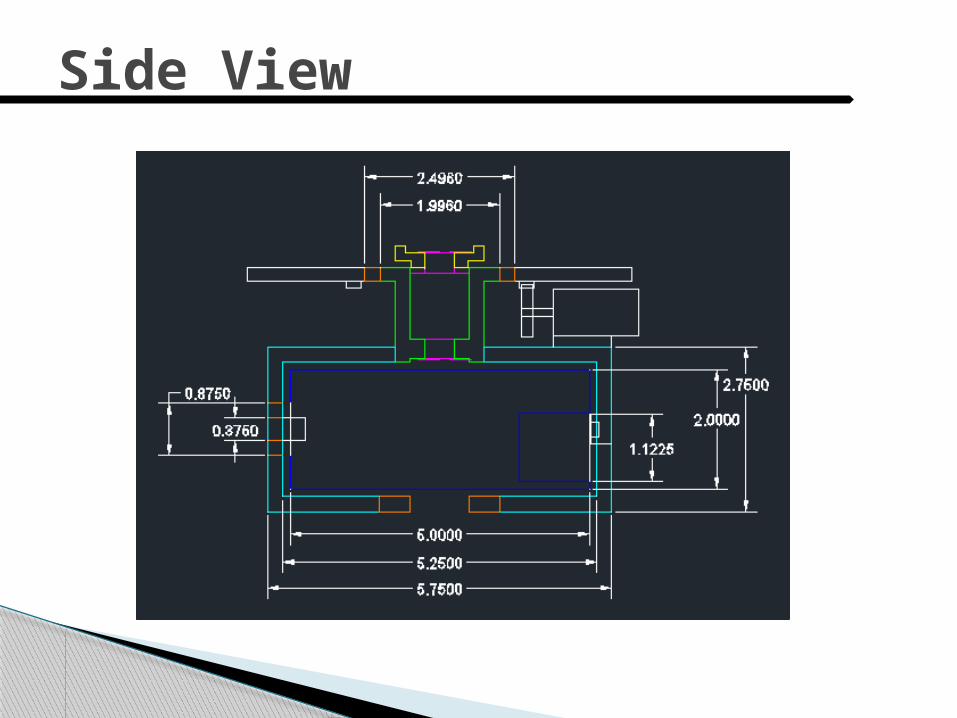
Side View
Side View
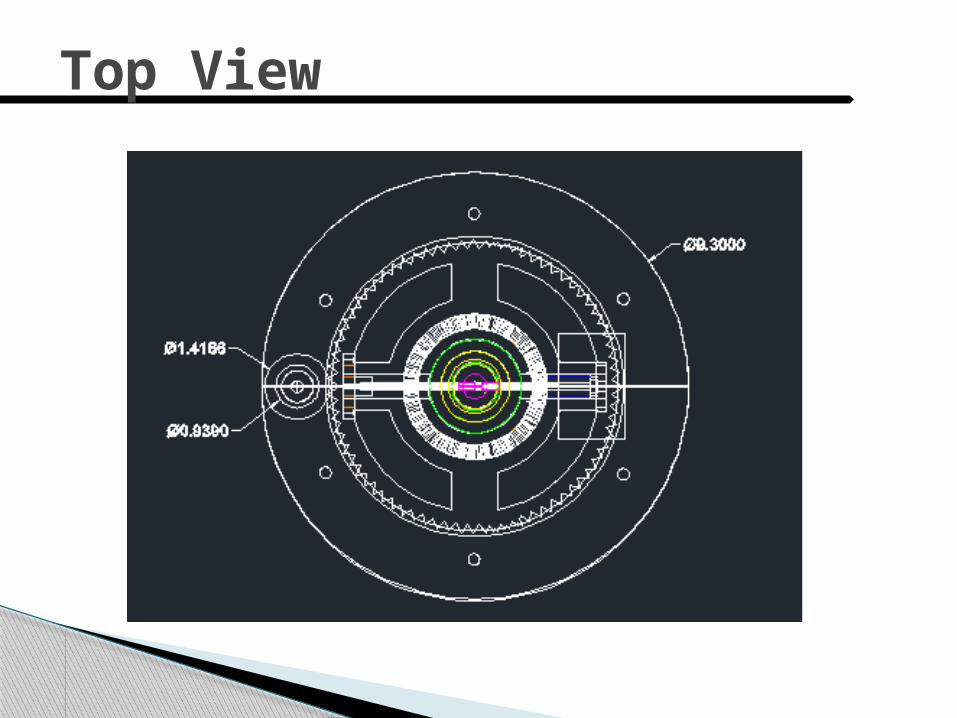
Top View
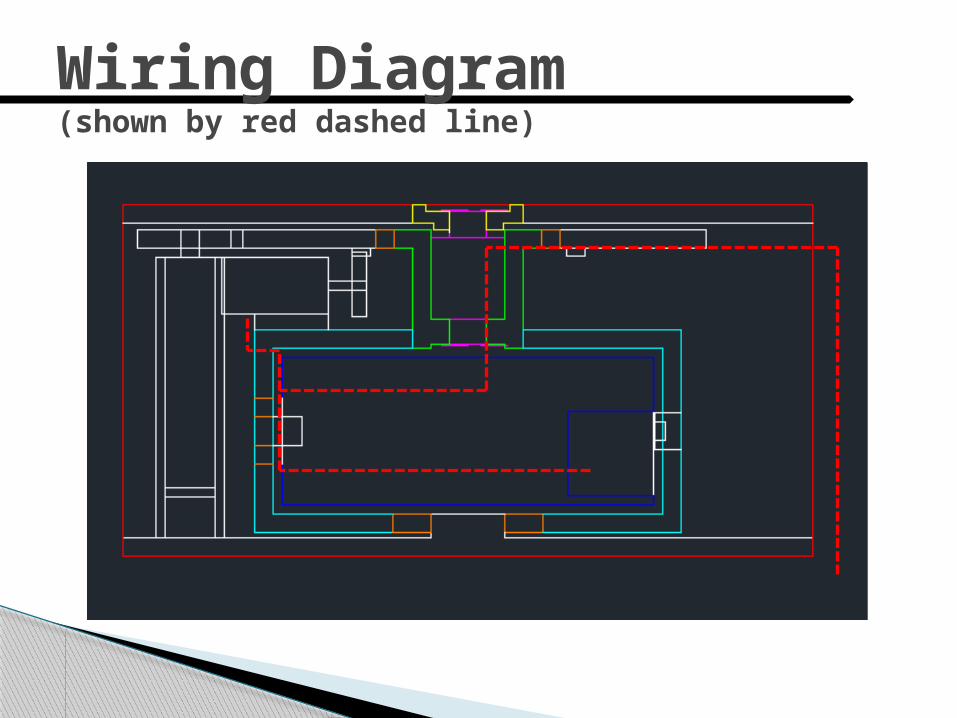
Wiring Diagram(shown by red dashed line)
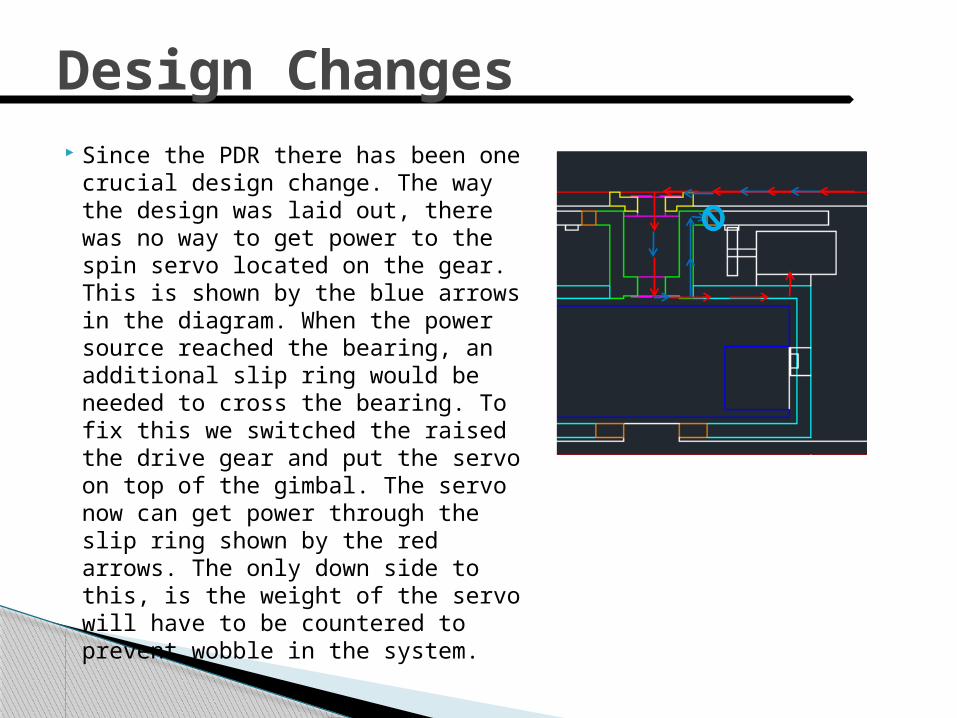
Design Changes Since the PDR there has been one
crucial design change. The way the design was laid out, there was no way to get power to the spin servo located on the gear. This is shown by the blue arrows in the diagram. When the power source reached the bearing, an additional slip ring would be needed to cross the bearing. To fix this we switched the raised the drive gear and put the servo on top of the gimbal. The servo now can get power through the slip ring shown by the red arrows. The only down side to this, is the weight of the servo will have to be countered to prevent wobble in the system.

32
The support poles that we are using to hold up the weight of the capsule above us has been changed to a different material.
The old material was 7075 Aluminum. The new material is Carbon Fiber.
The reason we have made this decision is to reduce the weight of the capsule.
Design Changes (continued)
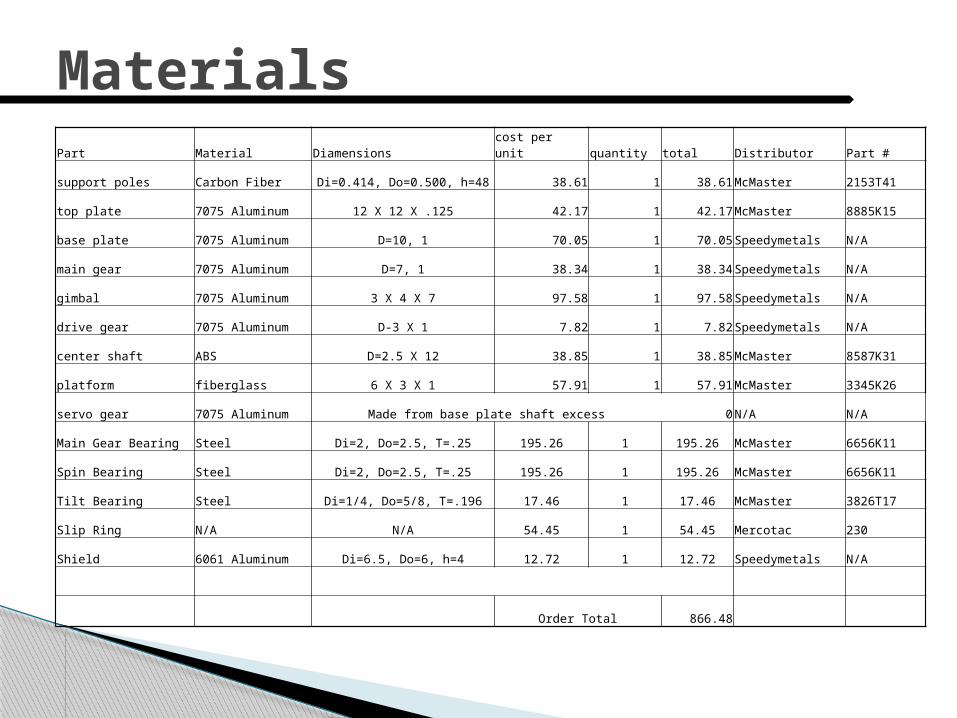
MaterialsPart Material Diamensions cost per unit quantity total Distributor Part #
support poles Carbon Fiber Di=0.414, Do=0.500, h=48 38.61 1 38.61 McMaster 2153T41
top plate 7075 Aluminum 12 X 12 X .125 42.17 1 42.17 McMaster 8885K15
base plate 7075 Aluminum D=10, 1 70.05 1 70.05 Speedymetals N/A
main gear 7075 Aluminum D=7, 1 38.34 1 38.34 Speedymetals N/A
gimbal 7075 Aluminum 3 X 4 X 7 97.58 1 97.58 Speedymetals N/A
drive gear 7075 Aluminum D-3 X 1 7.82 1 7.82 Speedymetals N/A
center shaft ABS D=2.5 X 12 38.85 1 38.85 McMaster 8587K31
platform fiberglass 6 X 3 X 1 57.91 1 57.91 McMaster 3345K26
servo gear 7075 Aluminum Made from base plate shaft excess 0 N/A N/A
Main Gear Bearing Steel Di=2, Do=2.5, T=.25 195.26 1 195.26 McMaster 6656K11
Spin Bearing Steel Di=2, Do=2.5, T=.25 195.26 1 195.26 McMaster 6656K11
Tilt Bearing Steel Di=1/4, Do=5/8, T=.196 17.46 1 17.46 McMaster 3826T17
Slip Ring N/A N/A 54.45 1 54.45 Mercotac 230
Shield 6061 Aluminum Di=6.5, Do=6, h=4 12.72 1 12.72 Speedymetals N/A
Order Total 866.48

34
Electrical Design

Please show finalized block diagrams, state how many PCBs/breadboards you will use and what each one will do, sensors they will have
Show the schematics for each PCB/bb◦ I know they will be large and difficult to see in detail but
I’m looking to see that they have been completed Any changes to this system since PDR?
◦ How does this affect your mission requirements?◦ What has been finalized that wasn’t at PDR?
Will you activate with command line or gswitch/LEDEX?◦ If command line, state how early you want to activate
and show the schematic you have derived to comply with the User’s Guide reqs
35
Electrical Design Elements

36
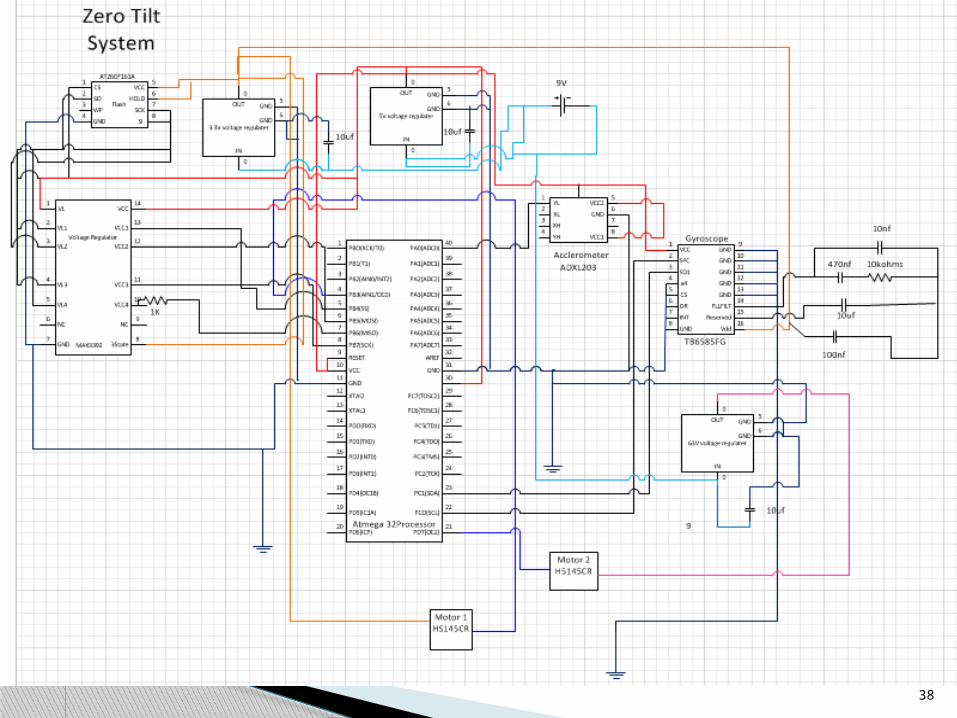
Schematics
Despun and Zero tilt on following slides
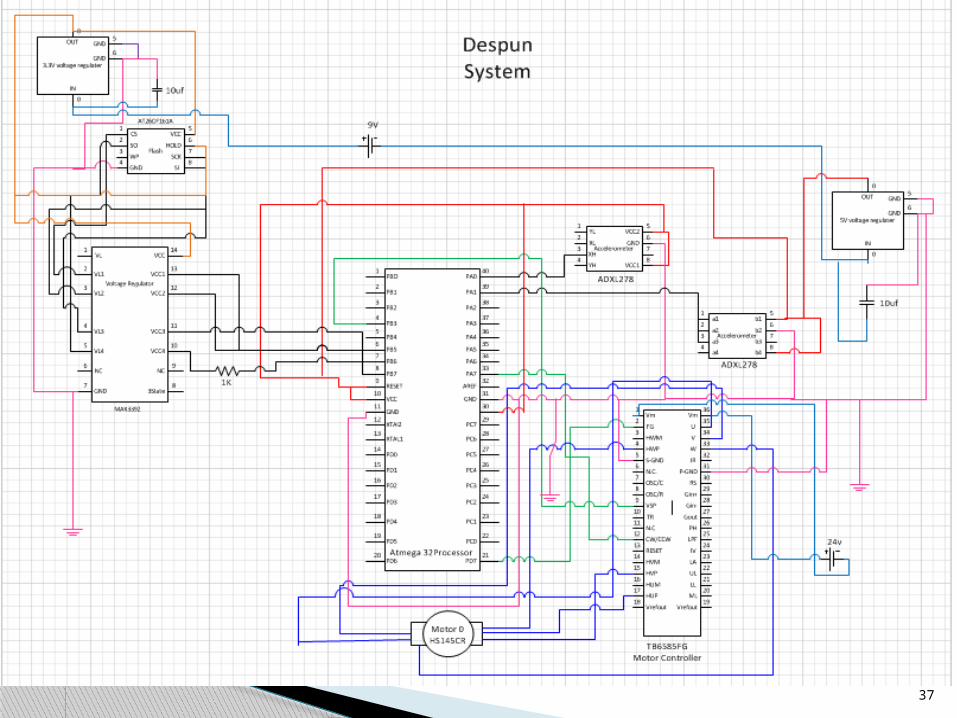
37
38

39
Software Design
40
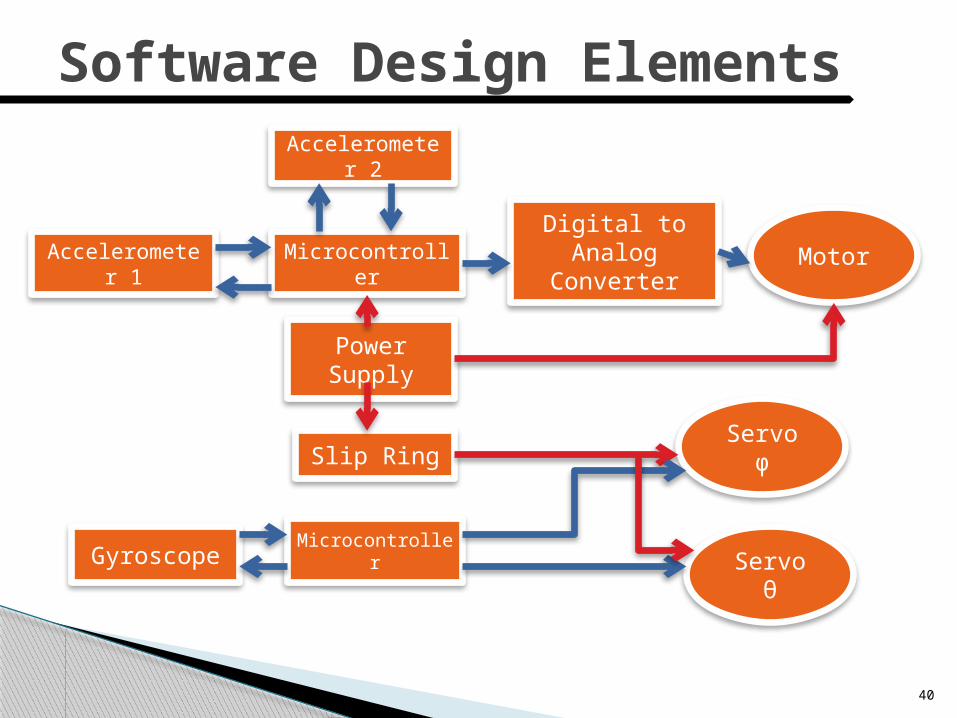
Software Design Elements
Accelerometer 1
Accelerometer 2
Microcontroller
Power Supply
Digital to Analog
Converter
Slip Ring
Gyroscope Microcontroller
Motor
Servo φ
Servo θ
41
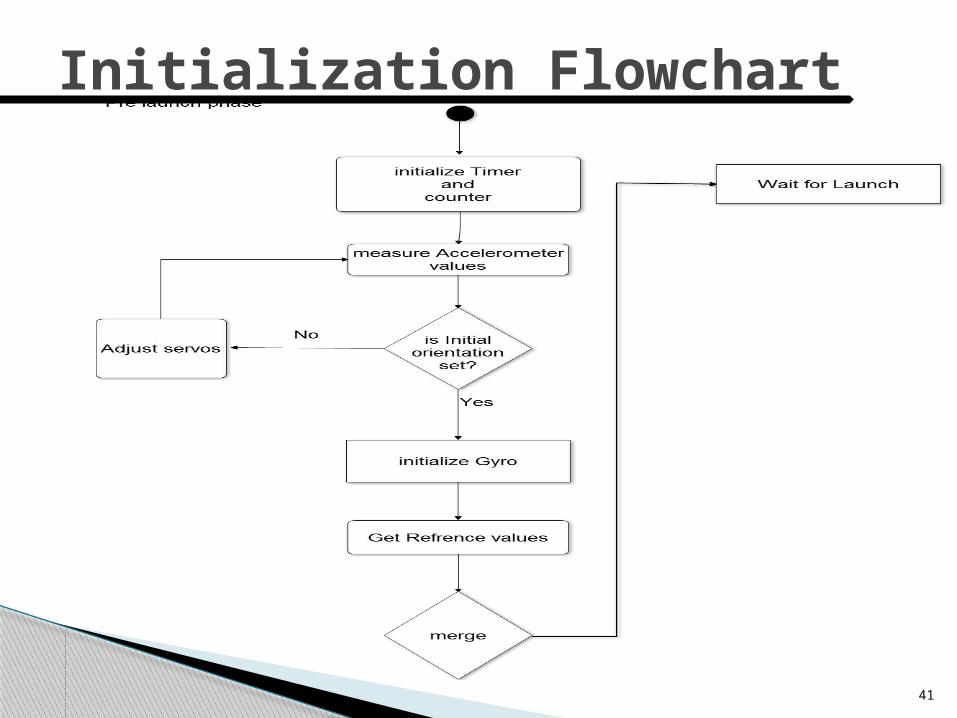
Initialization Flowchart
42
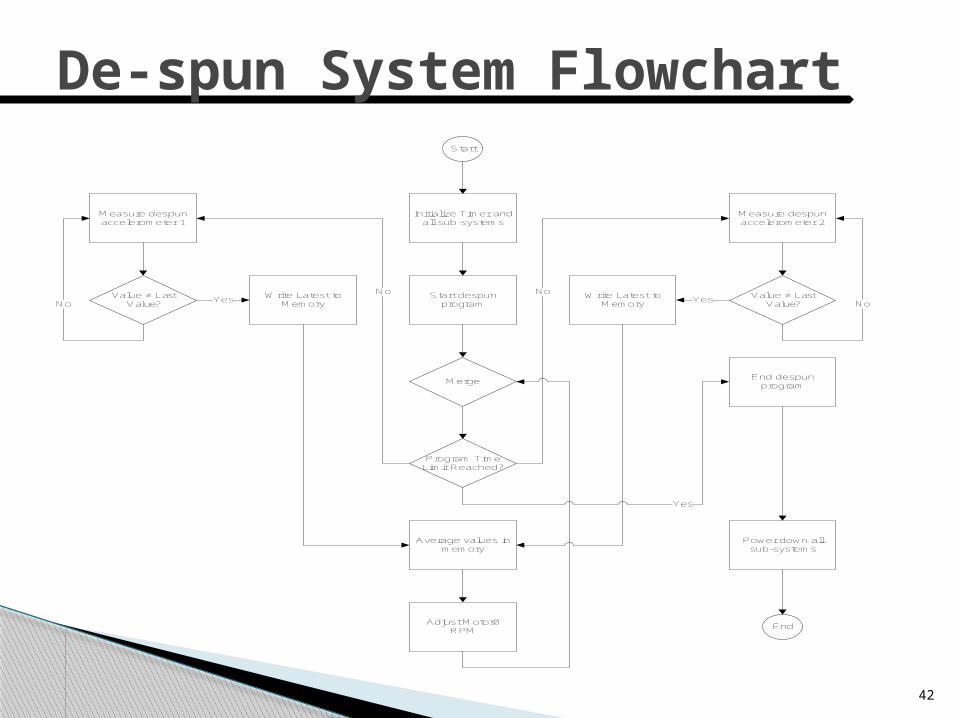
De-spun System FlowchartStart
Initialize Timer and all sub-systems
Start despun program
Merge
Measure despun accelerometer 1
Measure despun accelerometer 2
Value ≠ Last Value?
Value ≠ Last Value?
Write Latest to Memory
Write Latest to Memory
Yes Yes
Average values in memory
Adjust Motor0 RPM
No No
Program Time Limit Reached?
No No
End despun program
Yes
Power down all sub-systems
End
43
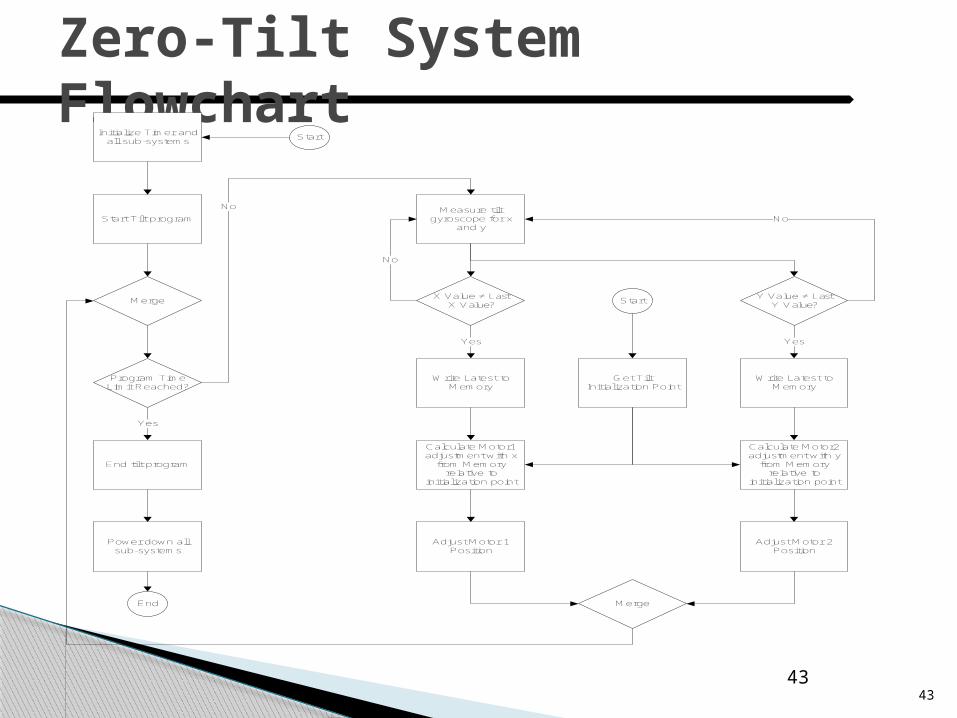
Zero-Tilt System Flowchart
43
StartInitialize Timer and
all sub-systems
Start Tilt program
Merge
Measure tilt gyroscope for x
and y
X Value ≠ Last X Value?
Y Value ≠ Last Y Value?
Write Latest to Memory
Write Latest to Memory
Yes Yes
No
No
Get Tilt Initialization Point
Start
Calculate Motor1 adjustment with x
from Memory relative to
initialization point
Calculate Motor2 adjustment with y
from Memory relative to
initialization point
Adjust Motor 1 Position
Adjust Motor 2 Position
Merge
Program Time Limit Reached?
End tilt program
Power down all sub-systems
End
Yes
No
44
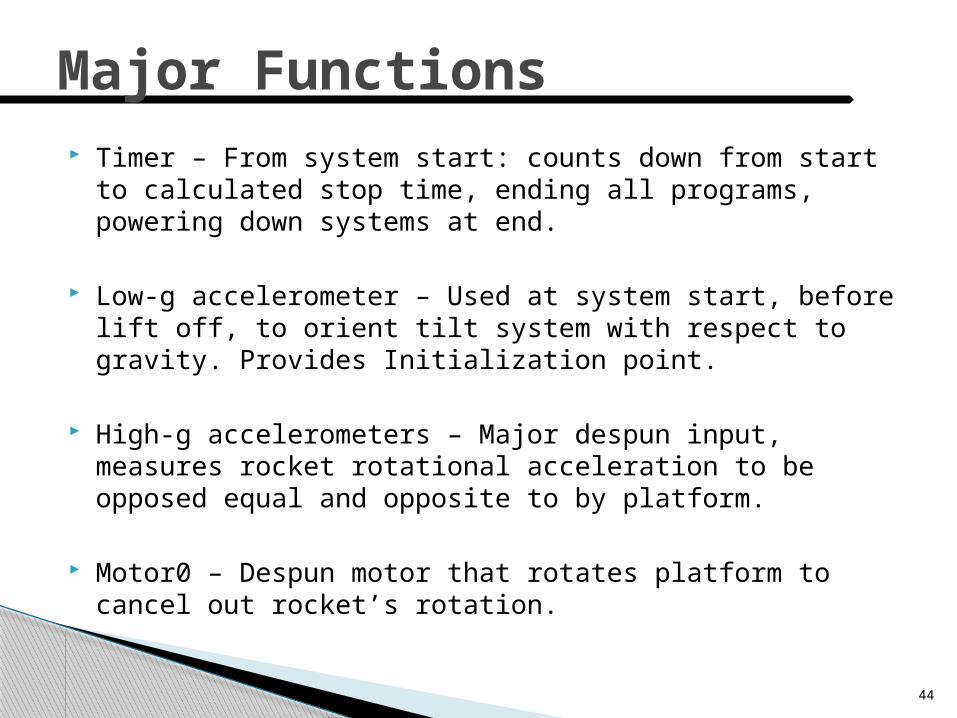
Major Functions Timer – From system start: counts down from start to
calculated stop time, ending all programs, powering down systems at end.
Low-g accelerometer – Used at system start, before lift off, to orient tilt system with respect to gravity. Provides Initialization point.
High-g accelerometers – Major despun input, measures rocket rotational acceleration to be opposed equal and opposite to by platform.
Motor0 – Despun motor that rotates platform to cancel out rocket’s rotation.
45
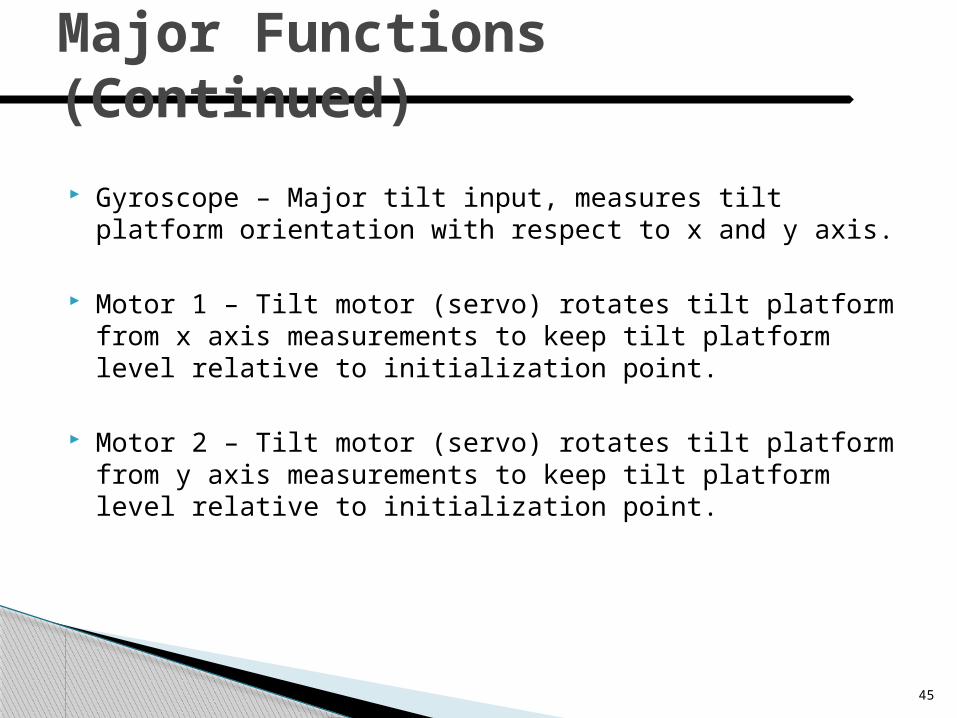
Gyroscope – Major tilt input, measures tilt platform orientation with respect to x and y axis.
Motor 1 – Tilt motor (servo) rotates tilt platform from x axis measurements to keep tilt platform level relative to initialization point.
Motor 2 – Tilt motor (servo) rotates tilt platform from y axis measurements to keep tilt platform level relative to initialization point.
Major Functions (Continued)

Prototyping/Analysis
46
47
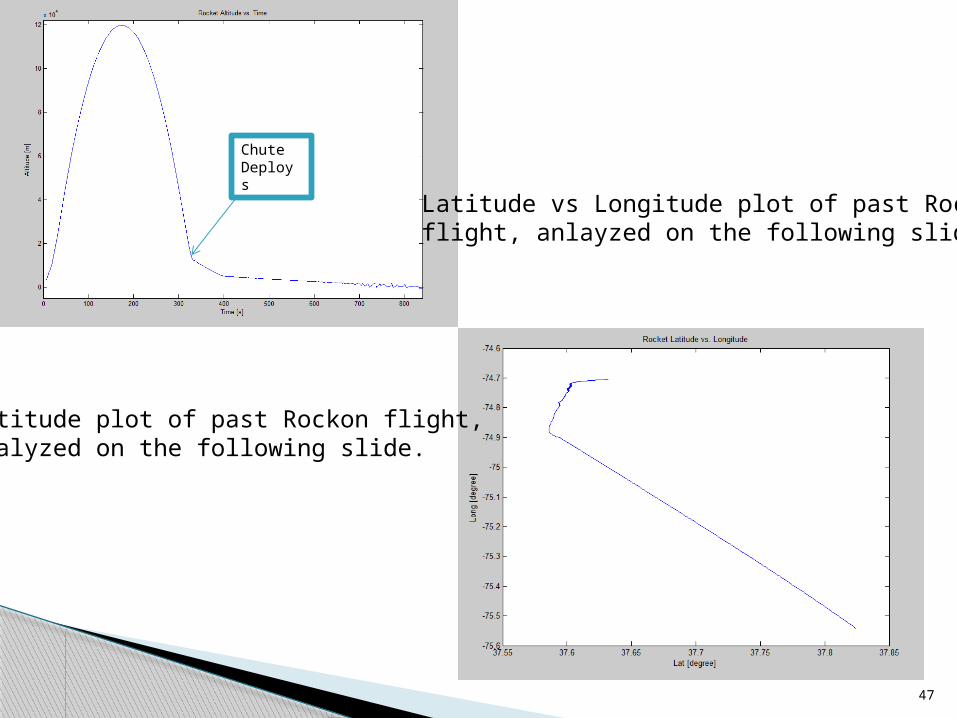
Altitude plot of past Rockon flight,analyzed on the following slide.
Latitude vs Longitude plot of past Rockon flight, anlayzed on the following slide.
Chute Deploys
48
What this data tells us about flight:
◦ Due to the Latitude vs Longitude plot we can conclude that the motor controlling the spin in the tilt system is of a low priority. This is because the maximum angle the rocket can change in the plane of concern is 45 degrees.
◦ The altitude plot demonstrates that the majority of the change in the tilt will occur at the apex. It must be able to rotate 180 degrees. This means that the tilt motor will have priority over the spin motor due to the greater degree in change over a shorter time period.
◦ As will be explained in the software section we believe our processer will be able to perform both the tilt and spin tasks without falling behind due to the small variations in spin coupled with the priority placed on tilt.
Analysis of Past Flight Data
49
The programming of our processor has made considerable strides with a demonstration of the PVM capabilities of the motor.
The Motor was controlled using the program provided on the following slides.
We now are assured we can control the servo motors (motors 1 and 2) and are working toward accomplishing similar goals with the despun motor (motor 0), and the sensors.
Analysis of Motor Demonstration
50
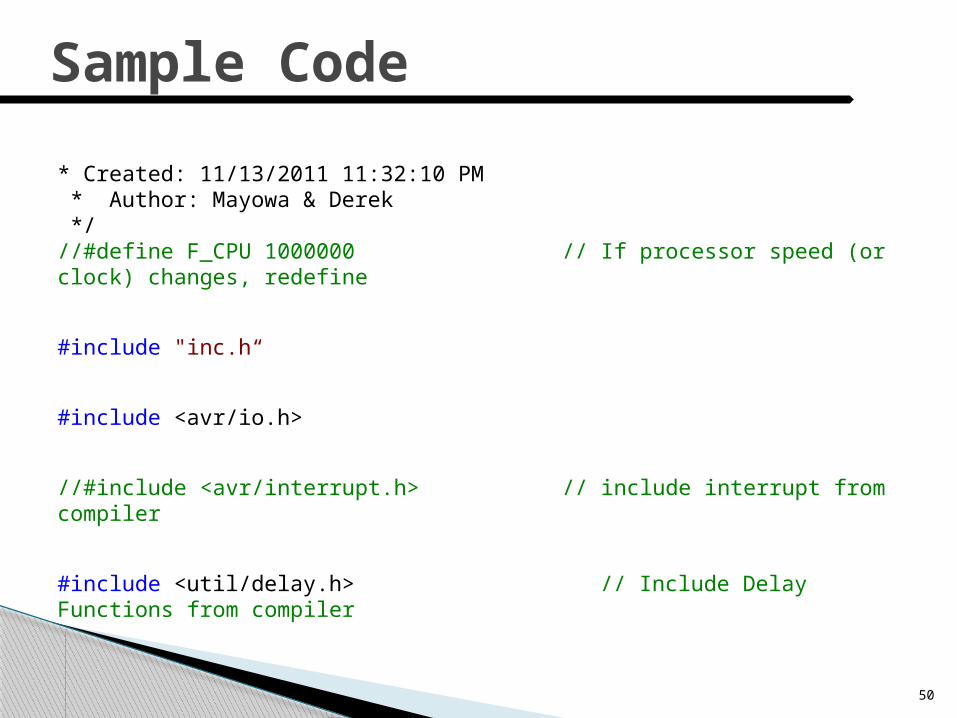
* Created: 11/13/2011 11:32:10 PM * Author: Mayowa & Derek */ //#define F_CPU 1000000 // If processor speed (or clock) changes, redefine
#include "inc.h“
#include <avr/io.h>
//#include <avr/interrupt.h> // include interrupt from compiler
#include <util/delay.h> // Include Delay Functions from compiler
Sample Code
51
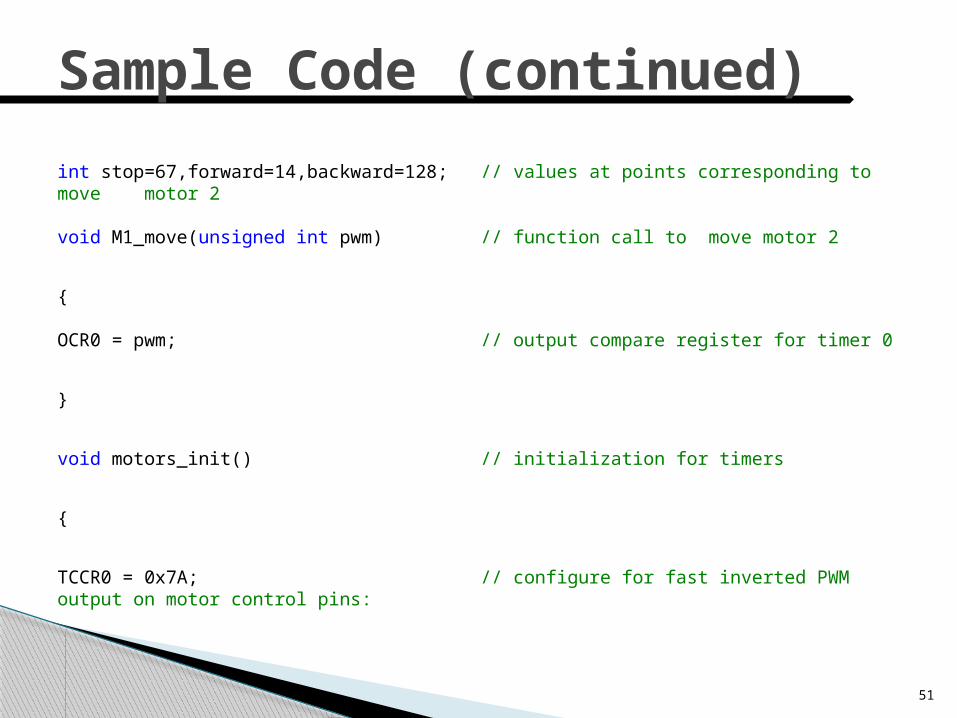
int stop=67,forward=14,backward=128; // values at points corresponding to move motor 2 void M1_move(unsigned int pwm) // function call to move motor 2
{ OCR0 = pwm; // output compare register for timer 0
}
void motors_init() // initialization for timers
{
TCCR0 = 0x7A; // configure for fast inverted PWM output on motor control pins:
Sample Code (continued)
52
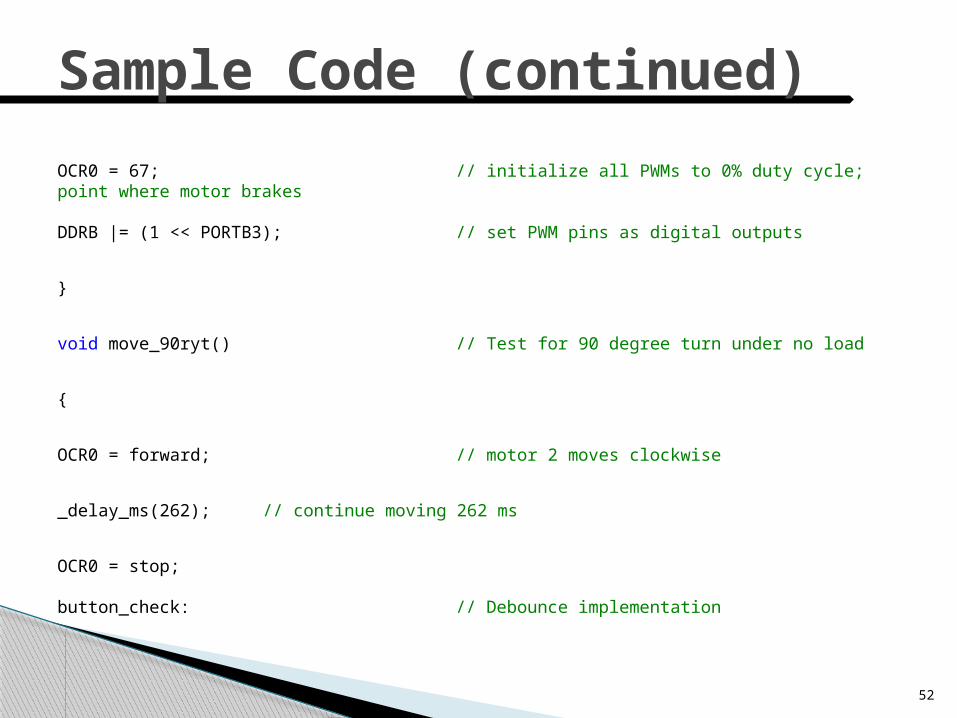
OCR0 = 67; // initialize all PWMs to 0% duty cycle; point where motor brakes DDRB |= (1 << PORTB3); // set PWM pins as digital outputs
}
void move_90ryt() // Test for 90 degree turn under no load
{
OCR0 = forward; // motor 2 moves clockwise
_delay_ms(262); // continue moving 262 ms
OCR0 = stop;
button_check: // Debounce implementation
Sample Code (continued)
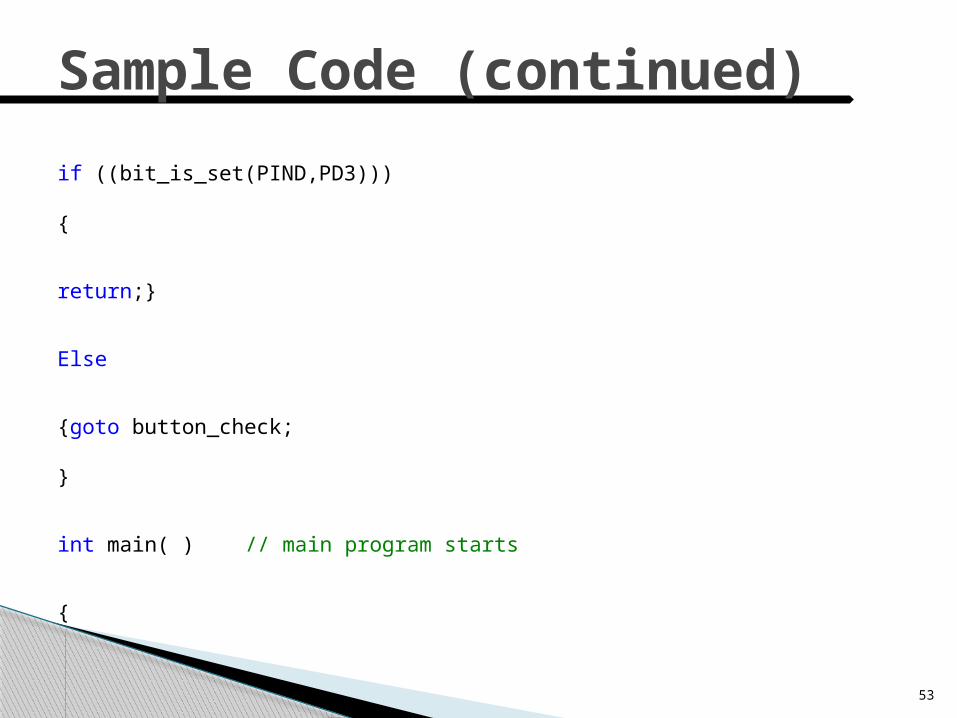
53
if ((bit_is_set(PIND,PD3)))
{
return;}
Else
{goto button_check;
}
int main( ) // main program starts
{
Sample Code (continued)
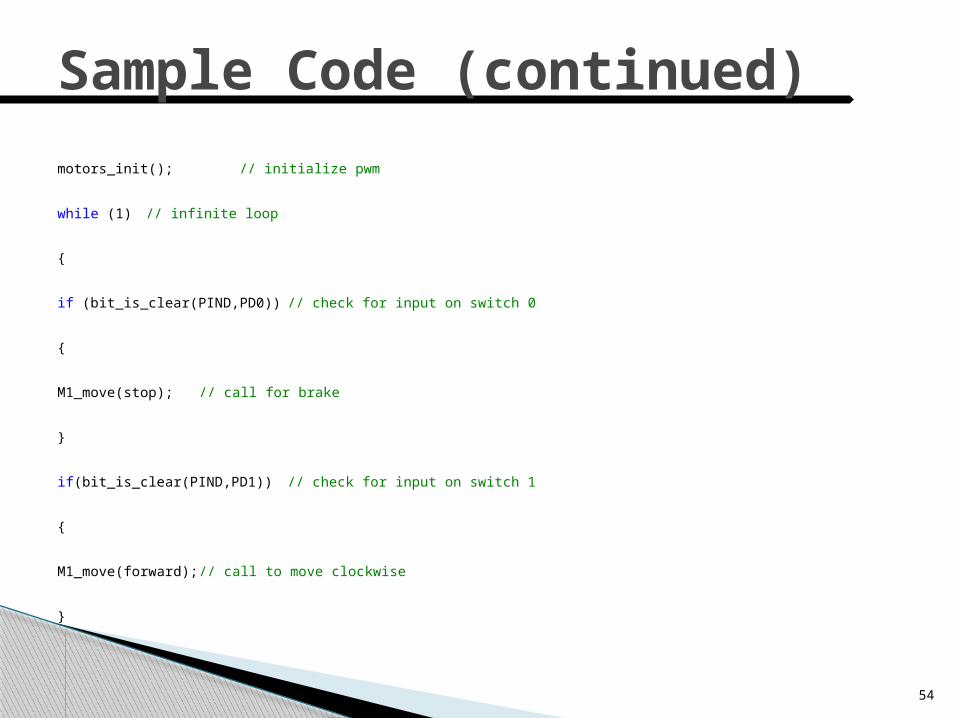
54
motors_init(); // initialize pwm
while (1) // infinite loop
{
if (bit_is_clear(PIND,PD0)) // check for input on switch 0
{
M1_move(stop); // call for brake
}
if(bit_is_clear(PIND,PD1)) // check for input on switch 1
{
M1_move(forward); // call to move clockwise
}
Sample Code (continued)
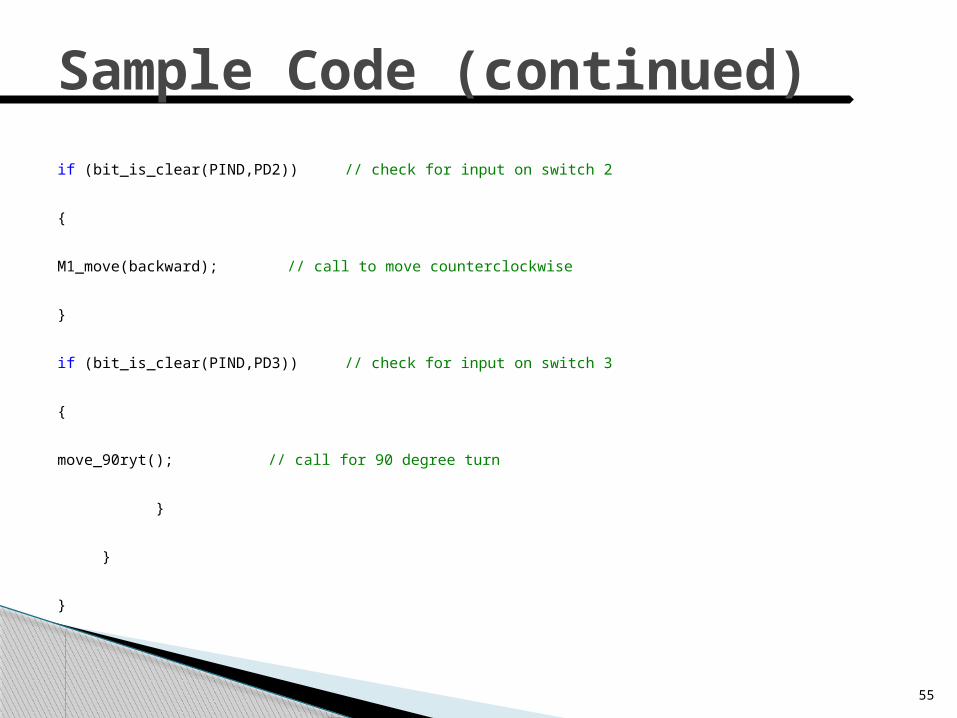
55
if (bit_is_clear(PIND,PD2)) // check for input on switch 2
{
M1_move(backward); // call to move counterclockwise
}
if (bit_is_clear(PIND,PD3)) // check for input on switch 3
{
move_90ryt(); // call for 90 degree turn
}
}
}
Sample Code (continued)
56
Constructions of the size of various mechanical components.
◦ Acryllic board made to model the zero-tilt platform.
Clearance considerations Length by width comparisons to components Motor placement
◦ Metal half-capsule made for a visual idea of size constraints
Used to decide upon things to be included and those to be thrown out. Instrumental in the decision to abandon camera option.
Motor/Processor prototype to test controllability.
◦ Necessary to prove to ourselves that we could manipulate the servo motors effectively.
Prototyping Results

57
Mass and Power Allowances
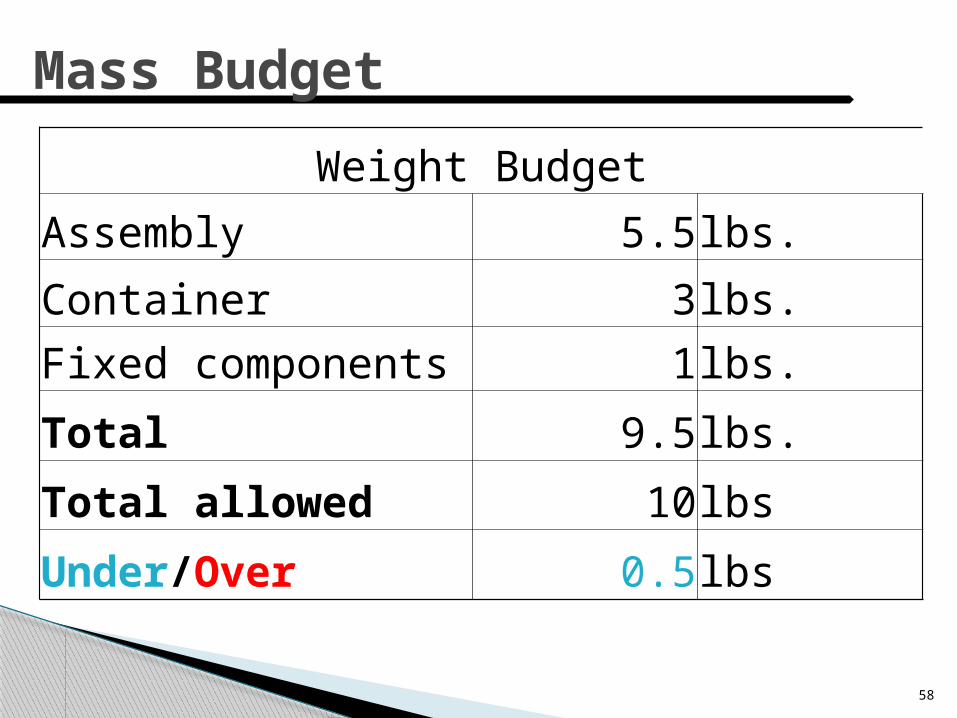
Mass Budget
58
Weight Budget
Assembly 5.5lbs.
Container 3lbs.Fixed components 1lbs.
Total 9.5lbs.
Total allowed 10lbs
Under/Over 0.5lbs
59
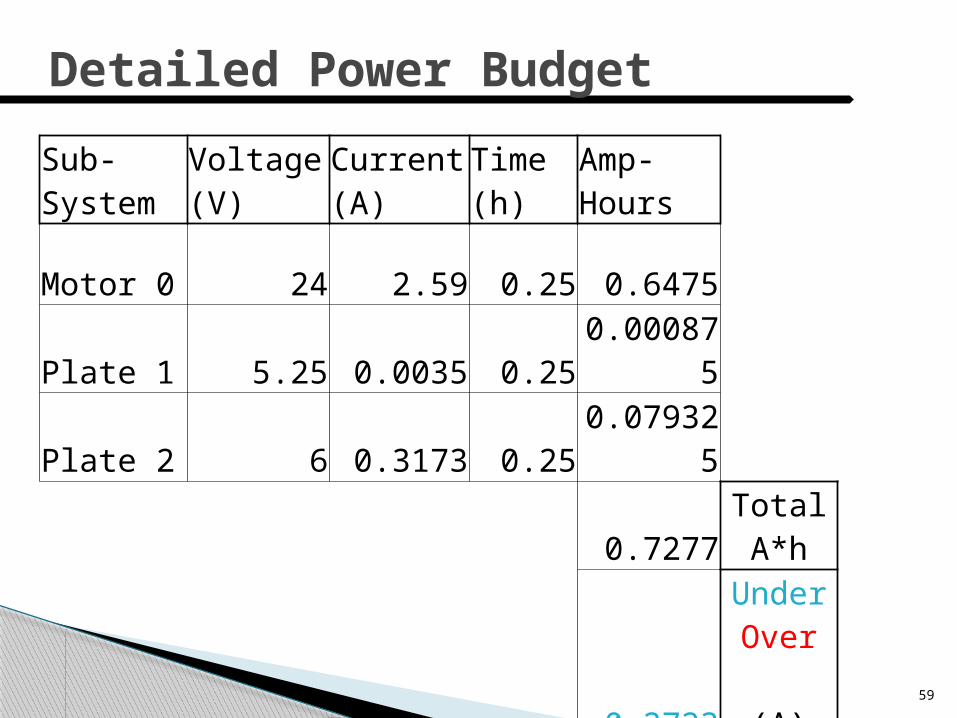
Detailed Power Budget
Sub-System
Voltage (V)
Current (A)
Time (h)
Amp-Hours
Motor 0 24 2.59 0.25 0.6475
Plate 1 5.25 0.0035 0.25 0.000875
Plate 2 6 0.3173 0.25 0.079325
0.7277Total A*h
0.2723
UnderOver (A)
60
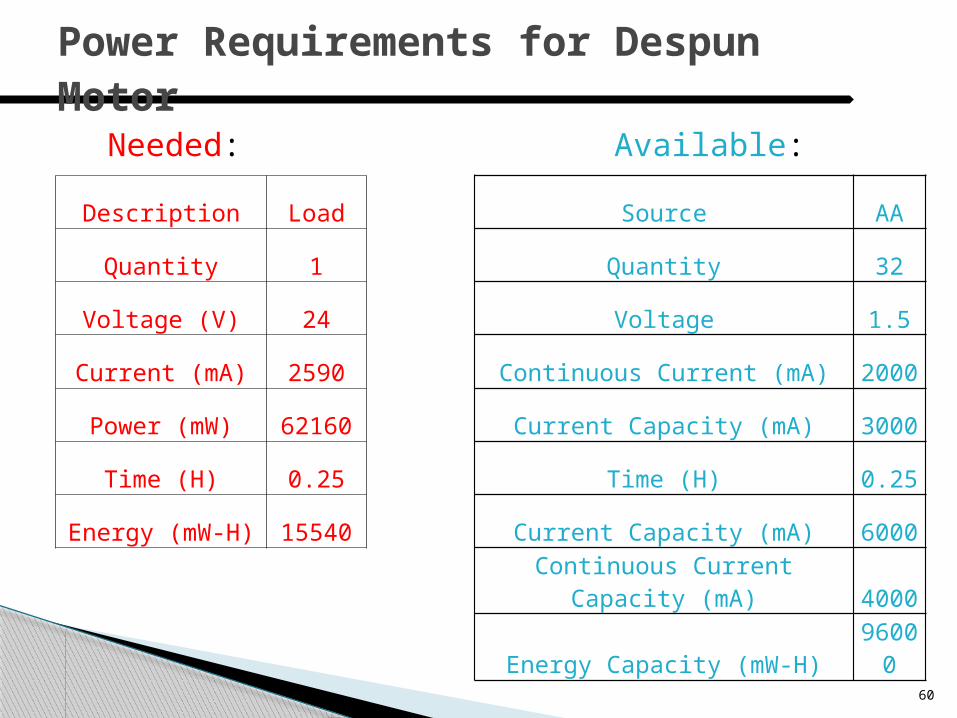
Power Requirements for Despun Motor
Description Load Source AA
Quantity 1 Quantity 32
Voltage (V) 24 Voltage 1.5
Current (mA) 2590 Continuous Current (mA) 2000
Power (mW) 62160 Current Capacity (mA) 3000
Time (H) 0.25 Time (H) 0.25
Energy (mW-H) 15540 Current Capacity (mA) 6000
Continuous Current Capacity (mA) 4000
Energy Capacity (mW-H) 96000
Needed: Available:
61
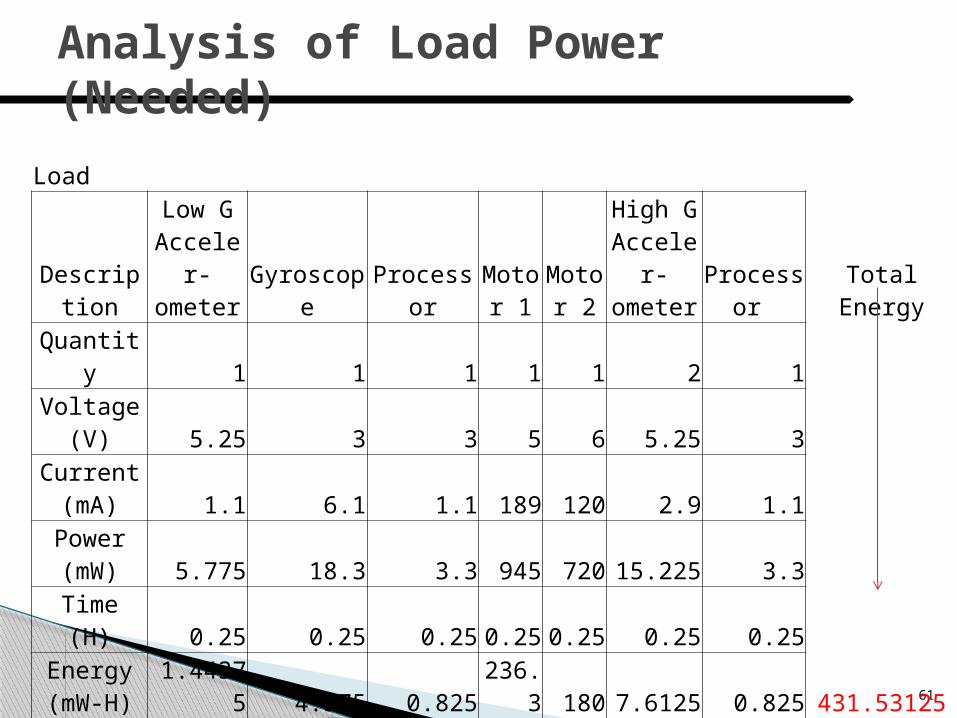
Analysis of Load Power (Needed)
Load
Description
Low G Acceler-ometer Gyroscope Processor
Motor 1
Motor 2
High G Acceler-ometer Processor Total Energy
Quantity 1 1 1 1 1 2 1
Voltage (V) 5.25 3 3 5 6 5.25 3Current
(mA) 1.1 6.1 1.1 189 120 2.9 1.1Power (mW) 5.775 18.3 3.3 945 720 15.225 3.3
Time (H) 0.25 0.25 0.25 0.25 0.25 0.25 0.25Energy (mW-H) 1.44375 4.575 0.825 236.3 180 7.6125 0.825 431.53125
62
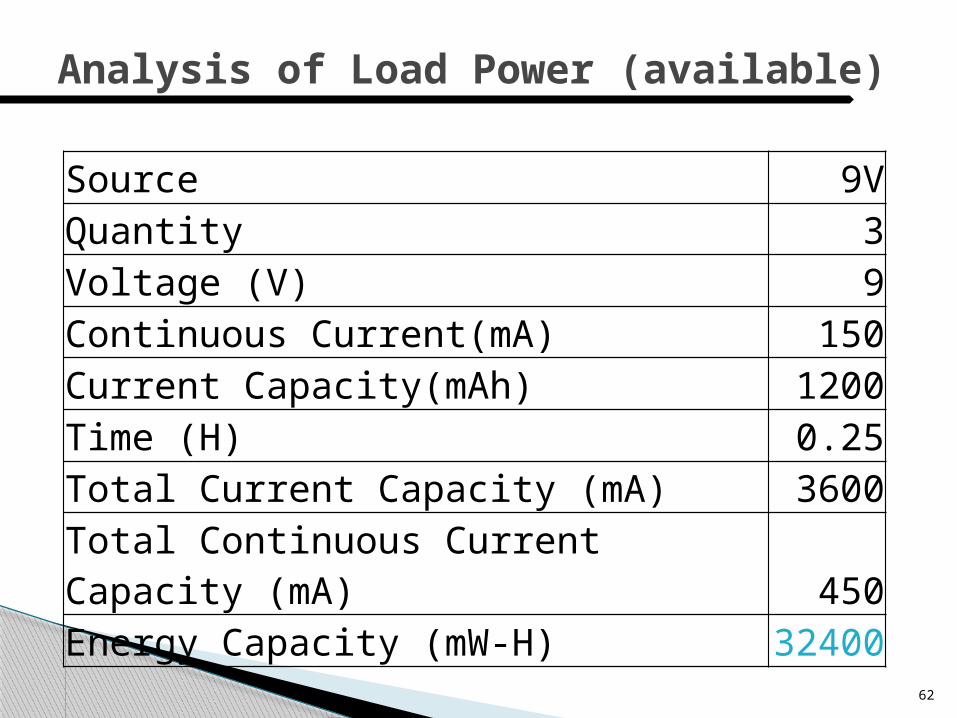
Analysis of Load Power (available)
Source 9VQuantity 3Voltage (V) 9Continuous Current(mA) 150Current Capacity(mAh) 1200Time (H) 0.25Total Current Capacity (mA) 3600Total Continuous Current Capacity (mA) 450Energy Capacity (mW-H) 32400

Manufacturing Plan
63
Machining
The following part will need to be machined: upper center shaft, lower center shaft, top plate, bottom plate, gimbal, tilt platform, drive motor housing, main gear, drive gear, support posts, and shield. These parts will be machined in house.
The bearings will be ordered from Mcmaster-Carr. The slip ring will be ordered from Mercotac.
65
Despun System
Tilt System
Integration of both
Construction of Systems (Orally conveyed)

Electrical Elements
Needs To be manufactured
◦ PCB
◦ Soldered our self
AVR, speed controller, resister, capacitors, voltage regulators, diodes, header, and transistors
◦ Place on the PCB by the company
Flash, accelerometers, gyro
Realistically we envision at least 3 revisions of our designed layout but hope to have our finalized piece up to specifications for the company by the time listed in the schedule section.
Software Elements (Despun) The first block of code is the code read and
process data from the two high-G accelerometers.
The second block of code controls the despun motor and therefore depends upon the first block of code.
Software Elements (Zero Tilt) The first block of code in this system assumes
that the despun system worked properly. The low-G accelerometer code is used to initialize the system. The gyroscope code is used to maintain orientation during flight.
The second block of code depends on the readings from the gyroscope and the accelerometer. The motor code translates sensor data into the amount the motor needs to turn to maintain zero tilt.

Testing Plan
69
System Level Testing - Sensors Sensor output evaluation
◦ Understanding the sensor output◦ Test of real-time transfer of the data◦ Self test of each sensor
prove accuracy Assure workability
◦ Survivability test
The system passes if we maintain a steady data transfer
System Level Testing - Despun Despun test
◦ Use the machine shop lathe to spin at variable speeds.
Measures rotational force Assures platform compensates for spin
This test will be successful if Motor 0 keeps up with the spin.

System Level Testing - Tilt
Tilt test
◦ Test the system using a variety of orientations, the motors will compensate our influence.
The system passes testing if Motors 1 and 2 correct tilt properly, maintaining a maximum error of plus or minus 5 degrees.
◦ This will be the final test assuming all other systems perform perfectly!
Mechanical Testing – Stress Test
Complete system maximum stress test
◦ Method to be decided◦ We were thinking about dropping the unit from a
height and rebound the fall with bungee cords◦ This test will simulate the initial shock from the
launch
The unit passes the stress test if all systems and subsystems survive
Mechanical Testing – Force Test
Vibration and rotation test
Utilizes a shaker table and lathe
◦ De-spun platform test◦ Spin of gimbal test
Also we must insure the following:
◦ Remain under mass constraints of 10lbs◦ Remain under volume constraints of a 9.3in Diameter and 4.75in height.◦ Keep center of gravity within the 1 x 1 x 1in envelope
We’ll know the system passed if there is minimal wobble and the system doesn’t break apart during rotation

Mechanical Design Elements – Gear Testing
75
After cutting the gears, we will utilize one of the electric motors in the campus machine shop to test the durability and precision of the gears.
With the electric motors we can test the durability of the gears by meshing them at high speeds as well as applying a load to the gears. With such testing we can find weak points as well as any points where destructive friction is present.
By testing the gears at max conditions, we will be assured that the gears will survive the ascent and splash-down.

76
Evaluation Boards
◦ Test Gyroscope output, real time sample rate, accuracy, and power.
◦ Test the motor response, speed, and power consumption.
◦ Processor performance including speed, storage of data, and power.
◦ Test all Accelerometer output, and confirm power consumption.
If we can adequately supply power to our components, communicate between all of our devices, and accomplish the goals of our subsystems then we would call this a success.
Electrical Testing

77
After the evaluations have been completed as of the systems need to be integrated to make sure that they can be successfully supplied with power.
Finally, the electrical components need to be finalized in preparation for fabrication (PCB construction), this is when severe revisions will be performed.
Electrical Testing (continued)
78
Software determines how well our devices can communicate as well as the optimum speed. Therefore it is instrumental in our electrical system.
In order to test the accelerometers on the base plate we will need to read data, process the data into motor ready commands, and relay it to our despun motor: motor 0.
In order to test the gyroscope we will need code to read from the gyroscope, process this data, and relay it to the necessary motors: motor 1 and 2.
Software Testing

79
In order to test that we are storing data correctly, sections of code will need to be dedicated to transferring readings to the flash memory.
In order to test that we can initialize the zero tilt system correctly we must have code to use the Low-G accelerometer for initialization, then switch to Gyroscope control.
Finally, in order to assure zero tilt, our code must be able to prioritize tasks, such as what was discussed in the analysis section.
Software Testing (continued)

Risks
80
Risk Walk-Down (Main Risks from PDR)
81
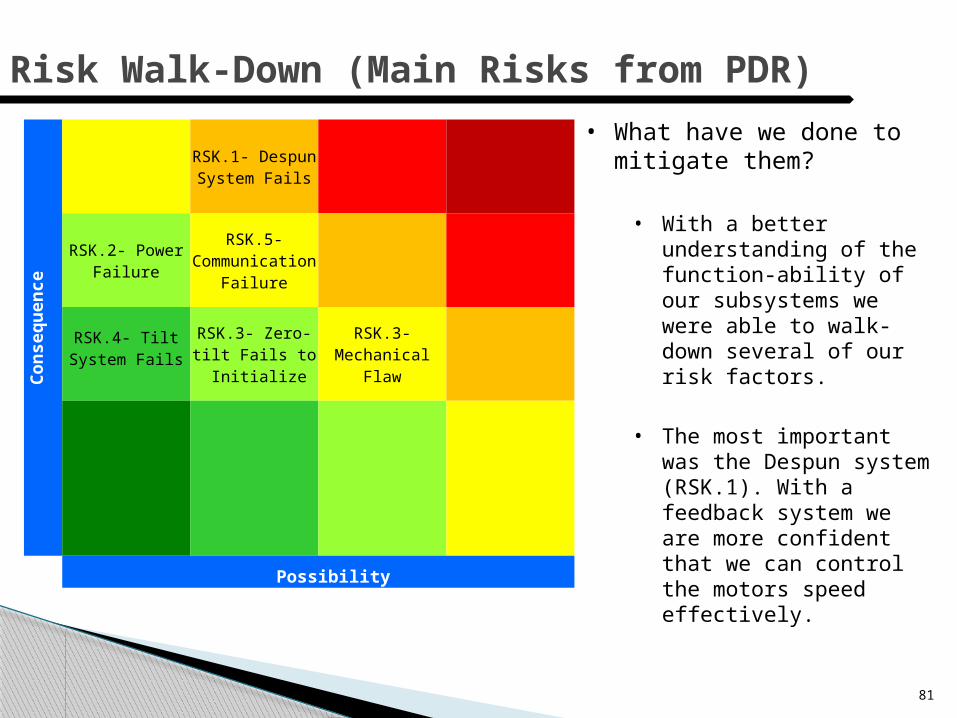
Consequence
RSK.1- Despun System Fails
RSK.2- Power Failure
RSK.5-Communication
Failure
RSK.4- Tilt System Fails
RSK.3- Zero-tilt Fails to
Initialize
RSK.3- Mechanical
Flaw
Possibility
• What have we done to mitigate them?
• With a better understanding of the function-ability of our subsystems we were able to walk-down several of our risk factors.
• The most important was the Despun system (RSK.1). With a feedback system we are more confident that we can control the motors speed effectively.
Risk Walk-Down (Main Risks Now)
82
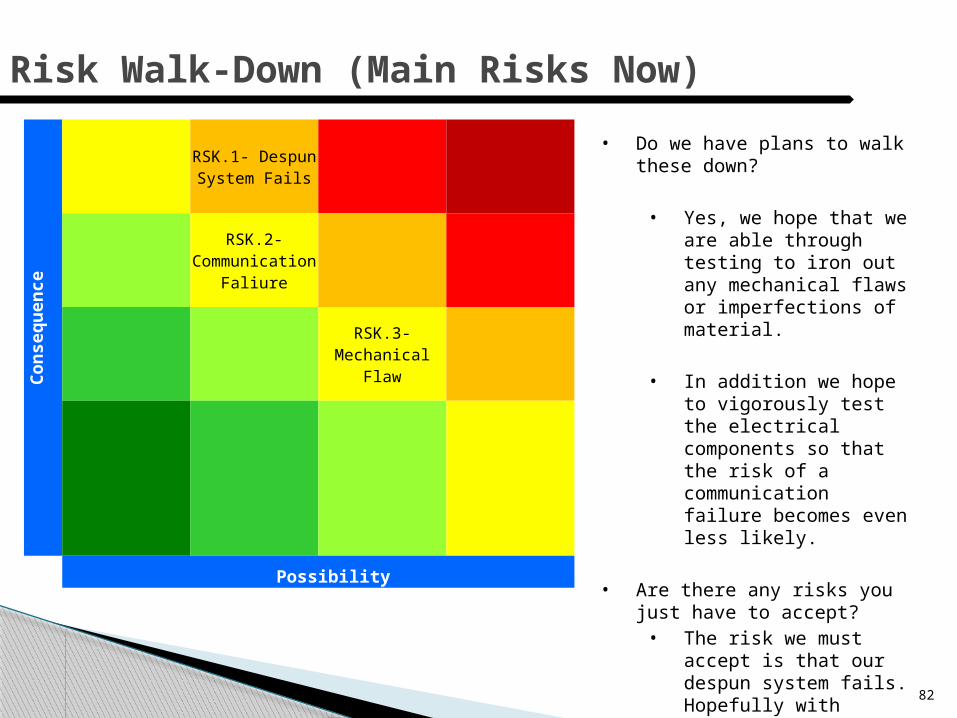
Consequence
RSK.1- Despun System Fails
RSK.2- Communication
Faliure
RSK.3- Mechanical
Flaw
Possibility
• Do we have plans to walk these down?
• Yes, we hope that we are able through testing to iron out any mechanical flaws or imperfections of material.
• In addition we hope to vigorously test the electrical components so that the risk of a communication failure becomes even less likely.
• Are there any risks you just have to accept?
• The risk we must accept is that our despun system fails. Hopefully with enough tests we can alleviate the possibility further.

User Guide Compliance
83
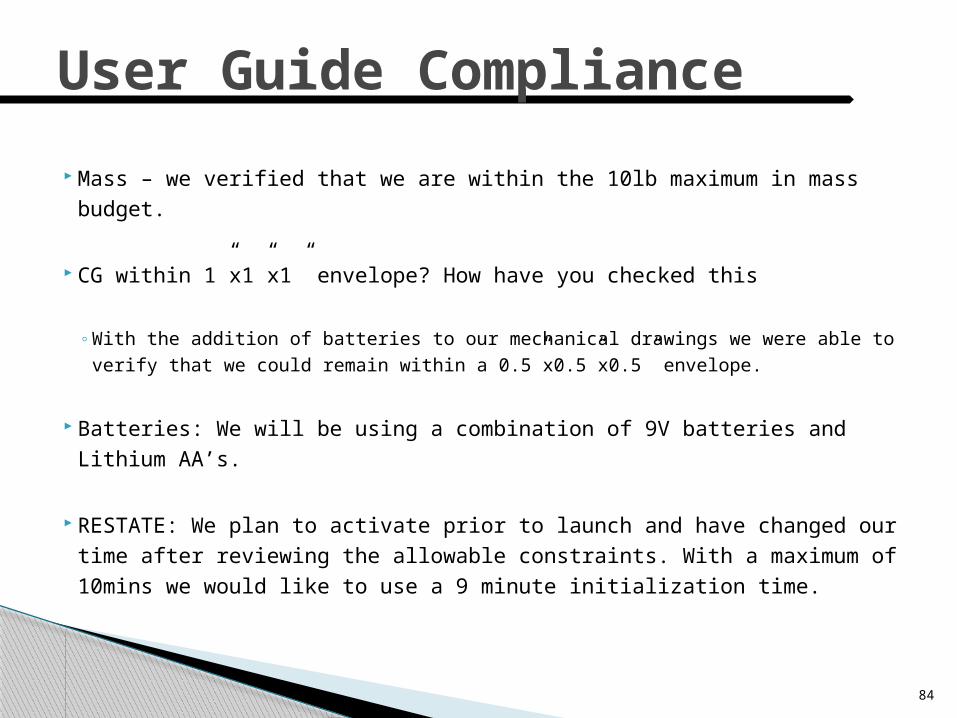
Mass – we verified that we are within the 10lb maximum in mass budget.
CG within 1”x1”x1” envelope? How have you checked this
◦ With the addition of batteries to our mechanical drawings we were able to verify that we could remain within a 0.5”x0.5”x0.5” envelope.
Batteries: We will be using a combination of 9V batteries and Lithium AA’s.
RESTATE: We plan to activate prior to launch and have changed our time after reviewing the allowable constraints. With a maximum of 10mins we would like to use a 9 minute initialization time.
84
User Guide Compliance

Sharing Logistics
85
We are sharing with Harding University
According to their PDR, their mission is to design, build, test and fly a spectrometer that will measure transmission spectra of gases in Earth’s atmosphere at lower altitudes and the Sun’s irradiance at higher altitudes.
Plan for collaboration:
◦ We intend to communicate with them via E-Mail. We have not communicated with Harding University as of yet because we only need to verify their mass in order for our stress testing. Thus, this communication is not of high priority at the moment. Also, looking at their PDR they said they sent us Design models but we have received nothing of the sort.
Structural interface – Our systems will be separated by a plate, however their capsule will screw into ours.
grandpmr.com

Project Management Plan
86

Schedule (From PDR)
87
Tentative Schedule
• Finalize Design
• Beginning of November: Start ordering parts
• Now until end of semester: Start testing electric components, test gyroscope output, test accelerometer outputs, test servo response, make sure we are able to supply necessary power, and complete despun subsystem.
• Next semester
• End of February: Zero Tilt platform completed• For the rest of the semester we will continue testing and
correcting problems to prepare for the launch in June.

Schedule- Schedule for the Rest of this Semester (Fall 2011)
December12/1 Critical Design Teleconference
12/1-12/12 Continue Testing Electrical Components, Accelerometer and Gyroscope Output, and Motor Response Acquire All Necessary Components for Project. Begin Machining of Mechanical Components so They are Prepared for the Spring Semester
12/12 Last Day of the Semester

Schedule (continued)- Schedule for Start of Next Semester (Spring 2012)
January1/25 First Day of the Semester
1/25-1/30 Prepare Progress Report 1 Fabricate and Begin Testing on De-spun System Begin Testing Tilt System Send Flash, Accelerometers and Gyroscopes to Company of Choice to be Placed on PCB Complete Sensor Output Evaluation
1/30-2/13 Test Individual Subsystems and Prepare Reports Finish Testing De-spun System Finish Testing Tilt System Conduct Stress, Force, and Gear Tests Ensure that Electrical Systems are Functioning Properly Verify that Code Performs as Expected Walk-Down Risk Factors
1/30 Progress Report 1 Due
February2/3 First Payment Due
2/13 Individual Subsystem Testing Reports Due 2/14 Individual Subsystem Testing Reports Teleconference
2/14-3/12 Prepare Progress Report 2

Schedule (continued)- Schedule for Middle of Next Semester (Spring 2012)
March3/12 Progress Report 2 Due
3/12-4/2 Work on Payload Subsystem Integration and Prepare Testing Reports
April4/2 Payload Subsystem Integration and Testing Report Due 4/3 Payload Subsystem Integration and Testing Report Teleconference 4/6 Final Payment Due
4/15 RockSat Payload Canisters Sent to Customers 4/15-4/16 Work on Placing Entire System in Canister for Testing 4/15-4/23 Simulate Mission and Prepare Test Report
4/23 First Full Mission Simulation Test Report Presentation Due 4/24 First Full Mission Simulation Test Report Presentation Teleconference
4/24-5/28 Continue Simulations and Testing and Prepare for Launch Readiness Review

Schedule (continued)- Schedule for End of Next Semester (Spring 2012)
May5/7 Weekly Teleconference 1
5/14 Weekly Teleconference 2 5/21 Weekly Teleconference 3 5/28 Launch Readiness Review Presentations 5/29 Launch Readiness Review Teleconference
June6/4 Weekly Teleconference 4
6/11 Weekly Teleconference 5 6/14 Visual Inspections at Refuge Inn
6/15-6/18 Integration/Vibration at Wallops 6/20 Presentation's to Next Year's Rock Sat 6/21 Launch Day
Budget
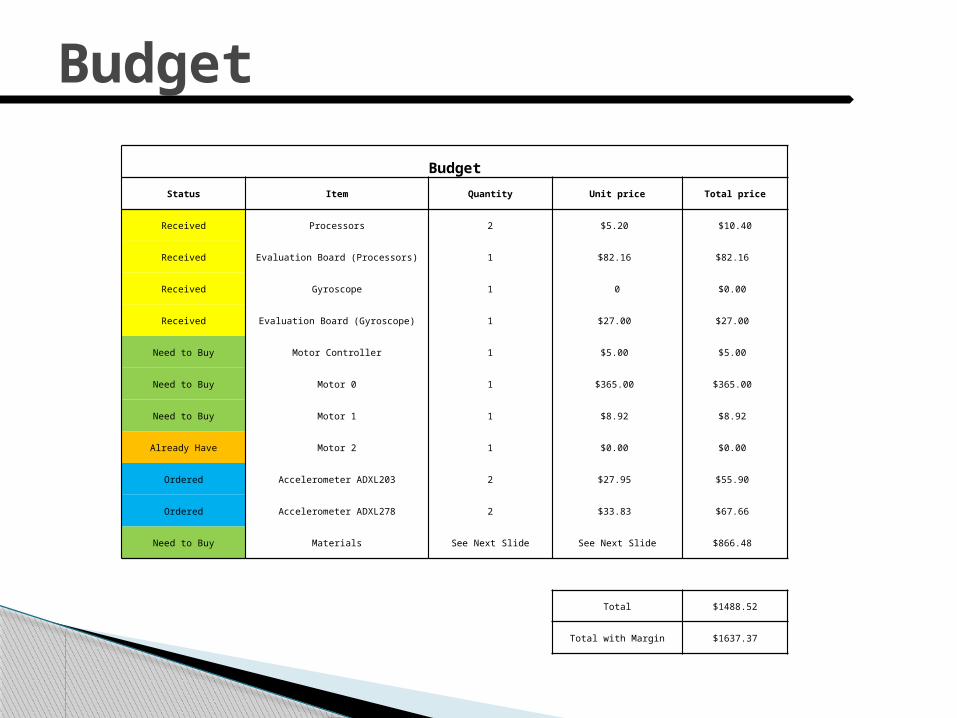
Budget
Status Item Quantity Unit price Total price
Received Processors 2 $5.20 $10.40
Received Evaluation Board (Processors) 1 $82.16 $82.16
Received Gyroscope 1 0 $0.00
Received Evaluation Board (Gyroscope) 1 $27.00 $27.00
Need to Buy Motor Controller 1 $5.00 $5.00
Need to Buy Motor 0 1 $365.00 $365.00
Need to Buy Motor 1 1 $8.92 $8.92
Already Have Motor 2 1 $0.00 $0.00
Ordered Accelerometer ADXL203 2 $27.95 $55.90
Ordered Accelerometer ADXL278 2 $33.83 $67.66
Need to Buy Materials See Next Slide See Next Slide $866.48
Total $1488.52 Total with Margin $1637.37
93
Issues we still have include:
◦ A viable test for the initial stress (takeoff).◦ Real-time functionality of the tilt system.◦ A steeper price for the raw materials then previously
anticipated.
The plan of action (before break):
◦ To acquire the remaining components.◦ Finish tests concerning the motors.◦ Begin testing of sensors using evaluation boards.◦ Evaluate price inflations.◦ Continue to walk-down our risk factors.
Conclusion


