

FULL PLANET, EMPTY PLATES
Carrelli Lydia,Cassio Paola, Yongchang He, Ottanà Giulia, Rytsola Valentina, Serrini Livia
The New Geopolitics of Food Scarcity
By Lester R. Brown

CORN CROP TIME
• Wheat and rice : world’s leading food grains
• Corn: - Dominates the use of grain in livestock and poultry feed - Vulnerable to extreme heat and drought

FROM AN ERA OF FOOD ABUNDANCE TO AN ERA OF SCARCITY
• 1986
• Until 2001
• From 2002 to 2011
annual world carryoverstocks of grain: 74days of consumption
annual world carryover stocks of grain: 107 days of consumption
phasing out of the U.S. cropland program
• Now world living one year to the next
• Last half of the 20th century carryover stocks of grain+ U.S. farm programs
• Soon restricting exports to decrease domestic food price

EARLIER CIVILIZATIONS UNDERMINED BY FOOD SHORTAGES
• Sumerians: rising salt levels in the soil
• Mayans: deforestation and
losses of soil from erosion
Source: http://pixshark.com/sumerian-irrigation.htm
Source: Dunning et al. (1998)

SOURCES OF GRAIN DEMAND GROWTH
1. Population growth
Source: http://bixby.berkeley.edu/research/population/
2. Consumers moving up the food chain

3. Conversion of grain into fuel for cars
SOURCES OF GRAIN DEMAND GROWTH
Decline in stocks of grain
Rising food prices+ Spread of hunger

CHALLENGES ON THE PRODUCTION FRONT
1. Soil erosion

CHALLENGES ON THE PRODUCTION FRONT
2. Growing water shortages
• Aquifers being depleted
• Irrigation wells starting to go dry
3. Plateauing of rice and wheat yields in some agriculturally advanced countries

4. Earth’s rising temperature
CHALLENGES ON THE PRODUCTION FRONT
1 °C rise in temperature above the optimum 10% decline in grain yields

POPULATION GROWTH
• Consequences of the explosive population growth (forests, fisheries, grasslands, aquifers, soils)
• Forests: overcutting - growing demand for firewood, lumber, paper - forests are shrinking - Mauritania
• U.N. Demographic projections: - world population 9.3 billion in 2050 - enough water to grow food for the 2.3 billion more people?
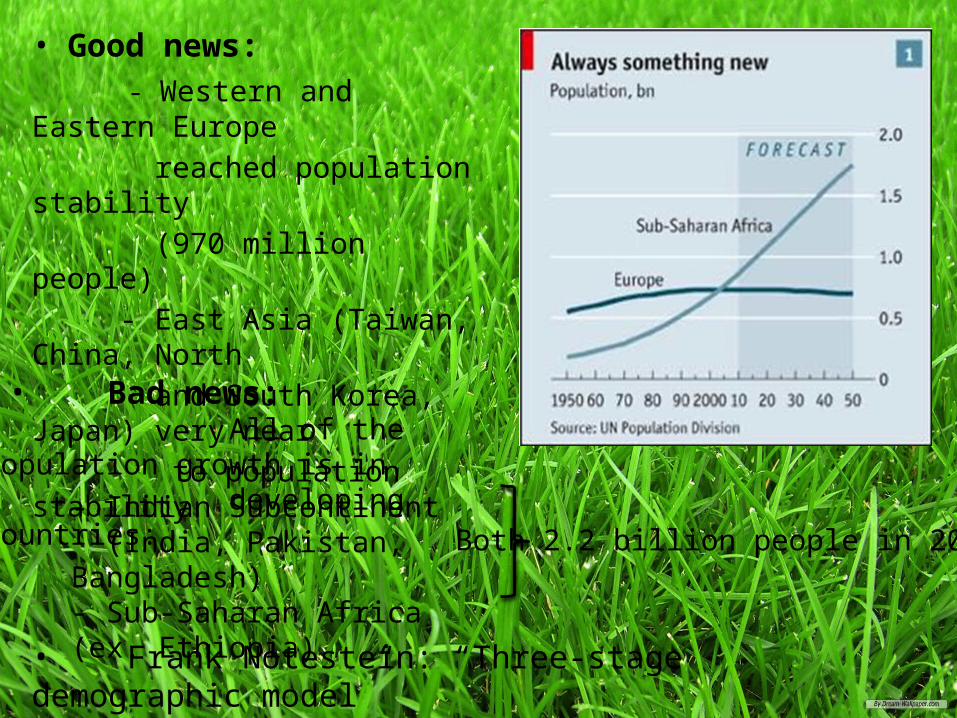
• Good news: - Western and Eastern Europe reached population stability (970 million people) - East Asia (Taiwan, China, North and South Korea, Japan) very near to population stability
- Indian Subcontinent (India, Pakistan, Bangladesh)- Sub-Saharan Africa (ex. Ethiopia)
• Bad news: All of the population growth is in developing countries:
Both 2.2 billion people in 2050
• Frank Notestein: “Three-stage demographic model”

SOLUTIONS:
• Smaller families
• Access to reproductive health care and family planning services for every woman
• Two children per couple
• Stabilized world population
• Every country moving into “stage-three”

MOVING UP THE FOOD CHAIN
• Food habits depend on geographic location protein change
USA, Brazil, Argentina:land-rich with grassland
Beef and mutton
Germany and China: densely populated with lack of space
Pork
• During the years, meat consumption is changed: - 1950: beef and pork dominated - 1997: poultry overtook beef

Nowadays : pork is the world’s leading meat China consumer #1

• During the years greatest restructuring in seafood consumption
Japan: too much land to produce rice and it has to turn to seafood to satisfy the demand of protein
China:First one that turned to fish
farming 2010: 37 million tons
Source:http://community.theaquaponicsource.com/profiles/blogs/fishes-for-aquaponics-in-china

• The consumption of meat, milk, eggs and farmed fish indirectly pushes
the consumption of grain
SalmonShrimps
Aquaculture is not always environmentally sustainable
and efficient
Source: http://www.shrimpnews.com/Graphics/Nicaragua/MangrovesNicaragua.jpg

1. Milk production in India
THREE DIFFERENT MODELS
2. Chinese model: cultivation turnover
3. Chinese aquaculture
Source: http://www.slideshare.net/sudarshanpatel5/dairy-presentation-pgdma

Necessity to occupy an intermediate position in the food chain: it will improve our life expectancy

EARTH’S CLIMATE: RISING TEMPERATURES What makes the Earth’s temperatures rise?
The massive burning of fossil fuels is increasing the level of carbon dioxid in the atmposhpere
http://climate.nasa.gov/

WHICH ARE THE CONSEQUENCES?
1. Agriculture: high temperatures interfere with pollination and reduce photosynthesis of basic food crops
- corn pollination - rice pollination
2. Increasing drought
3. Spreading of wildfires
4. Heat waves1988 U.S.A.
2003 U.E.
2010 Russia
5. Melting mountain glaciers

MELTING MOUNTAIN GLACIERS
• China: the glaciers on the Tibetan Plateau feedYangtze river
Yellow river• America
The Andes Perù
The Rocky Mountains Colorado River
• Greenland and Antarctic Rising sea level

BOOM OF PRODUCTION OF SOYBEAN
Reasons:
• Attainment of status as valued grain (oil and animal meal)
• Moving up in the food chain (more meat)
• Growth of population
• Function as source for biodiesel
19641968
19721976
19801984
19881992
19962000
20042008
020406080
100120140160180200
World Soybean Meal Use for Feed, 1964-2011
Feed Use (Million Tons)
Source: earth policy institution. See: http://www.earth-policy.org/books/fpep/fpep_data#10.

BOOM OF PRODUCTION OF SOYBEAN
Manifestation:
land for soybeanaccounts more thanthat for other grains inthe western hemispheric
• Surpassed wheat in 1994 (more than twice as wheat in 2010)
• Surpassed corn in 2010
19601964
19681972
19761980
19841988
19921996
20002004
20080
102030405060708090
Million ton
Wheat Corn Soybeans
Area Harvested for Wheat, Corn, and Soybeans in the Western Hemisphere, 1960-2011
Source: earth policy institution. See: http://www.earthpolicy.org/books/fpep/fpep_data#10

TOP 10 PRODUCERS, CONSUMERS, EXPORTERS, AND IMPORTERS OF SOYBEANS, 2011
Producers Consumers
Rank Country Quantity Rank Country Quantity
Million Tons Million Tons
1 United States 83,2 1 China 70,8
2 Brazil 65,5 2 United States 48,8
3 Argentina 41,0 3 Brazil 39,5
4 China 13,5 4 Argentina 37,8
5 India 11,0 5 European Union 12,4
6 Canada 4,2 6 India 11,2
7 Paraguay 4,0 7 Mexico 3,6
8 Bolivia 2,2 8 Japan 3,0
9 Ukraine 2,2 9 Indonesia 2,6
10 Russia 1,7 10 Russia 2,4
Rest of World 7,5 Rest of World 21,9
Total 236,0 Total 253,8
Exporters Importers
Rank Country Quantity Rank Country Quantity
Million Tons Million Tons
1 United States 36,7 1 China 57,5
2 Brazil 36,7 2 European Union 11,0
3 Argentina 7,8 3 Mexico 3,4
4 Paraguay 3,1 4 Japan 2,7
5 Canada 2,8 5 Taiwan 2,3
6 Uruguay 1,6 6 Indonesia 2,0
7 Ukraine 1,3 7 Thailand 1,9
8 China 0,3 8 Egypt 1,6
9 South Africa 0,1 9 Vietnam 1,2
10 Croatia 0,0 10 Turkey 1,1
Rest of World 0,2 Rest of World 5,5
Total 90,5 Total 90,1
Source: earth policy institution. See: www.earth-policy.org/datacenter/xls/book_fpep_ch9_3.xlsx

PROBLEMS OWING TO INCREASING SOYBEAN YIELD
Reason:
characteristic ofsoybean yield– Difficult to
raise yield by increasing the yield per acre
19501954
19581962
19661970
19741978
19821986
19901994
19982002
20062010
0
50
100
150
200
250
300
0
0.5
1
1.5
2
2.5
3
Production (Million Ton)Area Harvested (Million Hectares)Yield (Tons per Hectare)
World Soybean Production, Area, and Yield, 1950-2011
Source: earth policy institution. See: www.earth-policy.org/datacenter/xls/book_fpep_ch9_1.xlsx

PROBLEMS OWING TO INCREASING SOYBEAN YIELD
• Manifestations:– More lands was occupied for soybean production– Less lands was available for other grains– The adverse effects of transformation of usage of land• Starvation• Acceleration of deforestation• Loss of biodiversity• Increase of carbon emission
• Classic case: Brazil: land clearing plan in the Amazon Basin and the Cerrado

19701988
19901992
19941996
19982000
20022004
20062008
20100
100000200000300000400000500000600000700000800000
0
5000
10000
15000
20000
25000
30000
35000Loss of Forest Cover in the Brazilian Amazon, 1970-2011
Total Loss Since 1970 Annual Loss
19701988
19901992
19941996
19982000
20022004
20062008
20100.0%
5.0%
10.0%
15.0%
20.0%
Share of 1970 Cover lossing
Source: earth policy institution. See: http://www.earth-policy.org/books/fpep/fpep_data#10

SOLUTIONS FOR PROBLEMS OF MASS CONSUMPTION OF SOYBEAN
• Nexus in the problems: Economic pressure originated from the increasing demands of soybean at a
rapid rate
• Cardinal principle of the solutions: Curbing the growth in demand for soybean
• Concrete solutions:– Stabilization of population worldwide– Advocacy of downturn in meat consumption to affluent population
• Other ways?– Scientific progress in increasing the soybean yield per acre– Search for the substitute of soybean in animal meal– ……

GLOBAL LAND RUSHRising food prices Restriction of food exportations “land grabs”
• Leading countries: Saudi Arabia, South Korea, China, India• Countries selling or leasing lands: Sub-Saharan Africa, Southeast Asia

1. Land acquisition is also water acquisition
Who benefits?
PROBLEMS:
2. Secret agreements local farmers are not at the negotiating table
3. Increase in world’s hunger and human rights violations
4. Knowledge deficit problems in building infrastructures number of projects ≠ actual started productions
Source: http://www.bioecogeo.com/2014/10/28

• The World Bank working with the U.N. Food and Agriculture Organization: set of principles governing land acquisitions
Developing countries need international support for local village-level farmers and NOT big corporations bringing large-scale, heavily mechanized, capital- intensive agriculture
• Global power struggle for control of the earth’s land and water resources

DEMAND SIDE1. Stabilize world population2. Eradicate poverty3. Reduce excessive meat consumption4. Reverse biofuels policies that encourage the use of food, land or
water that could be used to feed people
SUPPLY SIDE5. Stabilize climate6. Raise water productivity7. Controlling soil erosion
‘’The challenge now is to move our civilization onto a sustainable path before climatechange spirals out of control and food shortages overwhelm our political system’’
PRESSING NEEDS


