

Banks
www.fitchratings.com 23 March 2012
Austria
Raiffeisen Bank International AG Full Rating Report
Key Rating Drivers
Sovereign Support: Raiffeisen Bank International AG‟s (RBI) ratings – except its Viability
Rating (VR) – reflect Fitch Ratings‟ view that as an integral part of Austria‟s largest banking
group, Raiffeisen Banking Group (RBG), the Austrian financial authorities would be extremely
likely to support RBI if need be. Fitch believes that RBG and hence RBI are systemically
important in Austria and most adjacent Central and Eastern European (CEE) countries.
RBI is a lender to Austria‟s corporates and a major bank in CEE. It is 78.5% owned by
Raiffeisen Zentralbank Oesterreich AG (RZB), the Raiffeisen sector‟s central institution.
Viability Rating Under Pressure: RBI‟s VR reflects its well-diversified franchise in CEE, its
sound domestic corporate franchise and its resilient pre-impairment profitability throughout the
financial crisis and the downturn in CEE. However, the quality of RBI‟s capital is below average,
containing a considerable share of non-core government (EUR1.75bn) and commercial
(EUR1.5bn) hybrid capital, and its core capital ratio is thin for RBI‟s current rating level.
Improving Capital a Challenge: While itself not subject to the European Banking Authority
(EBA) capital requirements, RBI‟s parent RZB has to make up a sizeable capital shortfall
(EUR2.1bn as of end-Q311) by end-H112 to meet the EBA‟s 9% core capital ratio. RZB and
RBI jointly aim to improve RZB‟s capitalisation by between EUR2.5bn and EUR3.6bn through a
combination of capital optimisation and reduction of risk-weighted assets (RWA), although
RBI/RZB may, in Fitch‟s view, find it challenging to achieve this by end-H112.
Performance Linked to CEE: Its diversified revenue base has helped RBI to report sound and
stable pre-impairment profitability throughout the financial crisis. Operating profitability has
stabilised at adequate levels largely as a result of sharply lower loan impairment charges (LICs)
and despite a drop in capital market revenue. In 2012, Fitch expects RBI‟s revenue generation
to remain subdued and LICs to remain relatively high albeit below levels observed in 2009.
Mainly CEE Credit Risk: At end-Q311, 51% of RBI‟s total credit exposure was in CEE. Its loan
book, of which around 90% was outside Austria (predominantly in CEE), was largely to
corporates with 67% of total loans. Due to its business model, bank counterparty risk is also
considerable (19% of end-Q311 assets, around half outside Austria), but this is being reduced.
Asset Quality Improvements Stalling: Overall, non-performing loans (NPLs) have stabilised
at elevated levels, with negative trends in Hungary and Croatia being offset by improvements in
Russia and, to a lesser extent, the Czech Republic. Coverage remains adequate. Moderate
market risk largely relates to unhedged capital investments in CEE.
Some Capital Market Sensitivity: Safeguarding or expanding its already sound deposit
franchise across CEE (aggregate loans/deposits ratio of 113% at end-Q311) is likely to be a
key priority for RBI. Still, wholesale funding remains an important secondary funding source.
What Could Trigger a Rating Action
Weakening Support: The government becoming less able to support Austria‟s large banks
(signalled by a change in Austria‟s sovereign rating) or Fitch‟s reassessment of the likelihood of
support (eg as a result of legislative changes) could lead to a downgrade of RBI‟s IDRs.
CEE: A significant delay in improving capitalisation and/or a worse-than-expected development
in CEE, suppressed earnings and increasing LICs could lead to a downgrade of RBI‟s VR.
Ratings
Foreign Currency
Long-Term IDR A
Short-Term IDR F1 Viability Rating bbb Support Rating 1 Support Rating Floor A Sovereign Risk Long-Term Foreign-Currency IDR AAA Long-Term Local-Currency IDR AAA
Outlooks
Long-Term Foreign-Currency IDR Stable Sovereign Long-Term Foreign-Currency IDR
Stable
Sovereign Long-Term Local-Currency IDR
Stable
Financial Data
Raiffeisen Bank International AG
30 Sep 11 31 Dec 10
Total assets (USDm) 200,334.9 175,271.4 Total assets (EURm) 148,368.0 131,173.1 Total equity (EURm) 7,847.0 7,903.9 Fitch core capital (EURm)
6,385.2 6,414.3
Operating profit (EURm)
1,034.0 1,282.6
Published net income (EURm)
759.0 1,177.2
Comprehensive income (EURm)
411.0 1,394.9
Pre-impairment operating ROAE (%)
30.44 33.93
Loan impairment charges/av. loans (%)
1.33 2.12
Operating ROAA (%) 0.99 1.46 Operating ROAE (%) 17.33 17.57 Fitch core capital/ RWA (%)
6.33 6.77
Tier 1 ratio (%) 8.70 9.70 Tangible common equity/tang. assets (%)
4.52 4.95
Equity/assets (%) 5.29 6.03
Related Research
2012 Outlook: Major Austrian Banks (December 2011)
Austrian Banks: Capital, the EBA and CEE (January 2011)
Analysts
Christian Kuendig +44 20 3530 1399 [email protected] Anna Deineko +44 20 3530 1538 [email protected]

Banks
Raiffeisen Bank International AG
March 2012 2
Profile and Strategy
Listed CEE and Corporate Bank of Raiffeisen Banking Group
RBI is the result of a merger between RZB‟s former CEE subsidiary, Raiffeisen International
Bank-Holding AG (RI, the absorbing entity), and the bulk of RZB‟s corporate lending and
investment banking business in October 2010. Listed in Vienna, RBI is majority-owned by RZB,
the central institution of RBG. RBG itself, a cooperative banking group, is Austria‟s largest
banking group, with market shares of around 29.3% in domestic deposits and 25.5% in lending
at end-2010. At end-2010, RBI employed almost 60,000 staff, spread between 2,961 branches.
RBG consists of three tiers: Firstly, 527 local (and typically small) Raiffeisen retail banks;
secondly, eight larger Landesbanks (regional central institutions owned by the Raiffeisen retail
banks); and thirdly, RZB, which is 87.8% owned by the Landesbanks. RZB itself holds around
78.5% in RBI. RBI in turn owns 15 banking and various non-banking subsidiaries in most
countries in CEE, south-eastern Europe (SEE) and the Commonwealth of Independent States
(CIS; CEE, SEE, CIS combined: CEE). Together with UniCredit S.p.A. („A−‟/Outlook Negative)
(through its Austrian subsidiary UniCredit Bank Austria AG, „A‟/Stable), RBI is one of the largest
western European banks in CEE.
Figure 1 Raiffeisen Banking Group (End-2010) (EURm) RBG RZB RBI (total) RBI – Austria RBI – foreign
Total assets 255,220 136,496 131,173 25,992 105,181 Total loans 162,777 78,270 75,657 7,914 67,743 Total deposits 149,742 57,936 57,633 5,718 51,915 Tier 1 ratio (%) 7.8 9.3 8.9 n.a. n.a. Employees 81,411 60,356 59,782 3,044 56,738 Branches 5,194 2,970 2,961 13 2,948
Source: RBI
Since retail operations in Austria are conducted by the individual Raiffeisen banks (not
consolidated into RBI), the vast majority of RBI‟s assets, liabilities, employees and branches
relate to its CEE activities (see table above).
Although the banks in the three tiers operate independently, there is an increasing degree of
cohesion within RBG. A cross-support mechanism (Raiffeisen-Kundengarantiegemeinschaft
Österreich; see Annex for further details), put in place in 2000, covers about 90% of the group‟s
customer deposits (end-2010).
Figure 2 Figure 3
USA
2%CIS other
4%
Asia
5%
Other
3%
SEE
14%
Russia
10%
CEE
24%
Austria
23%
Total Credit Exposure by Region(End-Q311; EUR186bn)
Source: RBI
Western Europe - EU
15%
Czech
Rep.
12%
Othersª
22%
Ukraine
8%
Romania
8%
Poland
10%
Hungary
11%
Slovakia
12%
Russia
17%
CEE Loan Book by Country(End-Q311; EUR55.3bn)
a Others includes Croatia, Bulgaria, Bosnia,
Serbia, Slovenia, Belarus, Albania, Kosovo
Source: RBI
Polish Acquisition Complements Comprehensive CEE Presence
RBI‟s predecessor was one of the first western European banks to enter CEE in 1986 through
entry into the Hungarian market. Today, RBI operates in 17 CEE markets and has one of the
most comprehensive networks in the region. Compared with its national and international peers,
Related Criteria
Global Financial Institutions Rating Criteria (August 2011)
Evaluating Corporate Governance (December 2011)
Main subsidiary of Austria‟s largest banking group.
One of the key Western European players in CEE region.
Polish acquisition complements comprehensive CEE franchise.

Banks
Raiffeisen Bank International AG
March 2012 3
RBI is disproportionately well represented in Russia, the Balkans and Ukraine. Outside the
CEE region, RBI is a major corporate lender in Austria, targeting the country‟s 1,000 largest
corporates. It also offers a wide range of treasury and investment banking services, the latter
partly concentrated in its Centrobank subsidiary. Proprietary trading and, notably, interbank
activities at RZB and RI had traditionally been relatively pronounced, but have been scaled
down somewhat at RBI. Conversely, in recent years RBI has expanded its presence in Asia,
where it predominately offers corporate lending and trade finance to both Austrian/CEE and, to
a lesser extent, Asian corporates.
Having been present in Poland since 1991, RBI complemented its largely corporate franchise
with the forthcoming acquisition of EFG Eurobank Ergasias S.A.‟s (rated „B−‟/Stable) former
branch network, Polbank, in 2011. The acquisition, announced in February 2011 and expected
to close in Q112, will establish RBI as the eighth-largest Polish bank by deposits and number of
branches (around 440) and the fourth-largest by loans.
Performance and Outlook
Revenue Base Well-Diversified by Type and Geography
RBI‟s diversified corporate and retail banking model allowed the bank to report relatively
resilient earnings throughout the financial crisis. During 9M11, net interest income (NII, typically
accounting for two-thirds of operating revenue) remained broadly unchanged quarter-on-
quarter (qoq) and Fitch expects revenue to remain relatively resilient in Q411 and 2012,
courtesy of adequate volumes and margins and despite significant macroeconomic headwinds
in CEE and, to a lesser extent, Austria. RBI‟s earnings base benefits from sound regional
diversification, with each CEE sub-region accounting for less than 30% (see Figure 3).
RBI‟s net interest margin (NIM) is narrower than most of its peers‟, largely due to its less
leveraged balance sheet (gross loans accounted for 54.8% of total assets at end-Q311) and its
sizeable low-margin interbank business. Still, its NIM has remained broadly stable in 9M11
despite sluggish loan volume growth, largely due to loan re-pricing efforts, above-average
growth in higher-yielding markets like Russia and Ukraine and its broad and relatively pricing-
insensitive deposit base (loans/deposits ratio of 118% at end-Q311), which in turn makes RBI
relatively insensitive to increasing wholesale funding costs.
Despite not being reduced in absolute terms, RBI‟s cost base is, in Fitch‟s view, well managed
and increases in operating expenses have been negligible in 9M11, supporting the bank‟s
operating profitability. Until Q311, operating profitability was also helped by gradually falling
LICs resulting from a marginally improving operating environment in CEE. Sizeable Hungarian
LICs in Q311 (EUR373m) however reversed this trend and Fitch expects LICs to remain
elevated throughout 2012.
Overall, RBI‟s operating profitability remained sound in 9M11 (operating ROAE of around 17%)
but given sluggish volume growth and a poor macroeconomic outlook for many CEE countries,
RBI will, in the agency‟s view, find it challenging to maintain this operating profitability in 2012.
Profitability in 2012 will also depend on RBI‟s ability to contain increases in funding costs,
which could be caused by increasing competition for deposits in selected CEE markets or
conditions remaining strained in capital markets.
While one-off operating effects remained relatively insignificant in 9M11, RBI will continue to be
burdened by balance-sheet-based bank levies in both Austria and Hungary, at least in the short
term (discussions to reduce or abolish the bank levies are ongoing).
Resilient NII Underpins Performance
Overall, NII remained broadly unchanged in 9M11, with NII falls in group markets and
Ukraine/Belarus compensated for by sound NII developments in CEE and SEE and a strong
improvement in Russia and group corporates (each up around 13% yoy). Also, the composition
Earnings diversification mitigates volatile operating environment across CEE.
Cost base likely to be reduced in 2012.
Sharp increase in Hungarian LICs stops improving trend; LIC developments not consistent across CEE.
Net income line burdened by bank levies in Austria and Hungary; levies unlikely to be withdrawn in the medium term.

Banks
Raiffeisen Bank International AG
March 2012 4
of interest income remained unchanged and continues to be dominated by interest income from
customer lending (71% of total interest income in 9M11), followed by bonds (12%) and
interbank business (7%). Importantly, increases in interest expenses for customer deposits
were well-contained (up 1% yoy) despite a strong rise in deposit balances (see Funding below).
Interest expenses for outstanding bonds were up by a moderate 0.7% yoy. As a result, RBI‟s
NIM remained broadly stable in 9M11, oscillating at around 2.8%.
RBI‟s net fee income largely relates to its lending and transaction-based businesses and tends
to move in line with business and transaction volumes, remaining broadly unchanged yoy in
9M11 (EUR1.125bn, or 27.4% of total operating revenue). At end-Q311, around 40% of RBI‟s
net fee income related to payment transactions, 22% to its FX and commodities business and
20% to its lending business. Wealth and asset management fee income accounted for a
relatively small 8% of total net fee income. By division, net fee income developed well across
all regions with the exception of SEE (down 5%; 24% of total net fee income) and Fitch expects
this trend to continue.
RBI‟s remaining operating revenue (around 6% in 9M11) mainly relates to net trading income,
the marking-to-market of derivatives and gains/losses from financial investments and tends to
be fairly volatile. Net trading income mainly relates to interest rate and FX transactions, with
smaller balances in equity and credit trading. Although trading and derivative income performed
well in 9M11, RBI reported a EUR146m loss on financial investments, largely due to mark-to-
market movements.
Operating Expenses
Reacting to the somewhat improving macroeconomic climate in CEE since early 2010, RBI‟s
cost base increased during 9M11, although given the more negative outlook for 2012 Fitch
expects operating expenses to be cut back in 2012. In 9M11, total operating expenses
increased by a relatively high 7.8% yoy and personnel expenses (accounting for roughly half of
total operating expenses) by 8.0%, largely due to expansion in Russia, Austria and the Czech
Republic.
However, increases in operating expenses in Q311 were markedly lower (total operating
expenses up 1.5%, staff costs up 2.4%). Reflecting RBI‟s decision to concentrate expansion on
well-performing countries, operating expense increases were largely limited to CEE and Russia
(up by around 11% yoy; accounting for 31% and 15% of total operating expenses respectively)
and remained broadly unchanged in other regions. Trends in operating expenses are to some
extent affected by exchange rate movements.
As a result of resilient revenue and well-contained operating expenses, RBI‟s operating
efficiency and flexibility remained sound during 9M11 and its cost/income and cost/assets
Figure 4 Peer Comparison – Performance
RBI Erste Group
Bank AG UniCredit Bank
Austria AG Intesa Sanpaolo
SpA KBC Group Sberbank of
Russia
(%) Q311 2010 Q311 2010 Q311 2010 Q311 2010 Q311 2010 Q311 2010
Total assets (EURm) 148,368 131,173 216,094 205,938 197,667 193,049 667,322 658,757 220,683 210,691 91,191 83,969 Fitch core capital (EURm) 6,385 6,414 9,769 10,601 14,011 13,135 28,901 24,228 23,694 3,772 4,074 Pre-impairment ROAE 30.44 33.93 21.08 23.9 17.84 19.74 12.68 11.93 37.08 44.6 13.79 13.73 Operating ROAE 17.33 17.57 4.69 10.21 7.55 8.8 5.88 6.05 38.97 26.34 12.43 11.43 Cost/income ratio 55.74 54.61 54.93 51.99 58.51 54.87 55.93 62.63 45.61 41.94 59.34 59.24 LIC/pre-impairment op. profit 43.06 48.21 77.75 57.28 57.65 55.42 53.64 49.29 (5.09) 40.95 9.82 16.8 LIC/average gross loans 1.33 2.12 1.86 1.55 1.02 1.37 0.74 0.81 (0.34) 2.72 0.15 0.27 Loans/deposits ratio 117.96 131.27 111.2 113.43 134.37 136.64 214.57 186.14 101.17 93.1 135.81 145.31 Fitch core capital ratio 6.33 6.77 8.15 8.85 11.32 10.27 8.97 7.29 12.89 8.47 9.53 Tangible common equity ratio 4.52 4.95 4.78 5.31 7.42 7.25 7.22 4.43 12.3 11.26 5.84 6.72 LT IDR/Outlook/VR ‘A’/Stable/‘bbb’ ‘A’/Stable/‘a−’ ‘A’/Stable/‘bbb+’ ‘A−’/Negative/‘a−’ ‘A-’/Stable/‘a-’ ‘BBB’/Stable/‘bbb’
Sovereign Rating/Outlook ‘AAA’/Stable ‘AAA’/Stable ‘AAA’/Stable ‘A−’/Negative ‘AA’/Negative ‘BBB’/Stable
Source: Banks‟ financial statements

Banks
Raiffeisen Bank International AG
March 2012 5
ratios amounted to 56% and 2.2% respectively at end-Q311, comparing reasonably well with
those of peers.
Sharp Increase in Hungarian LICs Hinders Improving LIC Trend
Like peers‟, LICs were markedly lower in Q111 (1.10% of average gross loans as opposed to
2.12% in 2010, 2.82% in 2009) and remained broadly flat in Q211 (1.06%). However, LIC
improvements came to an abrupt stop in Q311 when RBI booked EUR190m higher LICs in its
Hungarian operations (see Figure 5). Positively, LIC/average assets ratios remained broadly
unchanged in all other segments in Q311 with credit costs in Russia remaining particularly low.
Fitch expects LICs to remain elevated in 2012 but they should remain below levels observed in
2009 and 2010. The predictability of LICs is, however, currently poor – largely because of the
volatile situation in Hungary and potential spill-over effects from the eurozone crisis.
Bank Levies Burden Earnings Retention
RBI‟s operating profitability in 9M11 was negatively affected by higher charges relating to bank
levies in Austria and Hungary (9M11: EUR95m; 9M10: EUR31m). Both bank levies are asset-
based (in the case of Austria it relates to the end-2010 unconsolidated balance sheet). Both
bank levies are relatively significant: Austria‟s bank levy amounts to 0.055% of adjusted assets
for small banks (up to EUR20bn adjusted balance sheet) and 0.085% for larger banks
(including RBI) plus a flat 0.015% charge for derivatives. Both countries have announced that
they will revisit their respective bank levy in the coming years (by 2013 in the case of Austria),
although Fitch believes that the bank levies are likely to remain in place in the medium term.
Risk Management
RBI‟s risk management systems and policies are generally centralised, with most functions and
the risk committee being located at RBI group level. RZB‟s role is largely to set risk targets (in
the form of economic capital allocation) and monitor compliance with policies, although RZB
risk management staff sits on various RBI risk committees (eg for the extension of large
credits). For CEE subsidiaries, delegated risk authority depends on the size of the subsidiary
but is generally moderate compared to peers. Financial institutions credit risk is fully centralised
in Vienna and risk frameworks for local retail and corporate lending in CEE have to be
approved centrally. The appropriateness of foreign systems and policies relating to CEE
operations is audited by the bank‟s internal audit function every other year.
An economic capital model (99.95% confidence level, one-year time horizon, „A+‟ target rating)
is RBI‟s main internal risk steering tool. Unsurprisingly, credit risk is by far RBI‟s main source of
risk, accounting for 74% of total economic capital (including a 9% risk buffer, see Figure 6) at
end-Q311. While market risk overall is moderate (9% of economic capital), RBI‟s capitalisation
shows some sensitivity to exchange rate movements, as evidenced in 9M11 when its capital
ratios dropped due to an appreciation of the euro versus many CEE currencies, notably the
Russian rouble.
For regulatory purposes, RBI calculates around 50% of RWA under the standardised approach
(parts of its corporate loan book and the majority of its retail book) and the remainder under the
foundation internal ratings-based approach. Corporate lending (and exposure to financial
institutions) is assessed using a 10-point rating model, and project finance is assessed using a
five-point rating model. Application and behavioural scorecards are used for most types of retail
lending.
Credit Risk
Reflecting its business model, credit risk in RBI‟s corporate loan book is by far its largest
source of risk, absorbing 38% of economic capital and accounting for 67% of credit RWA at
end-Q311. While smaller in absolute terms, credit risk in retail lending is also significant and
likely to increase proportionately as RBI attempts to improve its retail franchise. Having scaled
it down in 2009 and 2010, in 2011 RBI decided to cautiously expand its well-established
Figure 5
0
70
140
210
280
350
CE
E
SE
E
Russia
CIS
Oth
er
Gro
up
corp
ora
tes
Q111 Q211 Q311
Loan Impairment Charges
(EURm)
Source: RBI
Corporate credit risk across CEE is main source of risk.
Large share of FX loans elevates risk profile.
Sizeable credit exposure to banks and sovereigns generally of good quality.
NPL improvements came to a halt in Q311; NPL ratio likely to increase in 2012.
Moderate exposure to market risk mainly through partially unhedged capital investments in CEE.

Banks
Raiffeisen Bank International AG
March 2012 6
financial institutions business, so bank counterparty risk is likely to remain significant.
In 9M11, total corporate credit exposure continued to grow significantly (by 14.5% annualised
to EUR89.7bn at end-Q311), notably in Russia and Asia, although Fitch would expect growth to
slow down in 2012. At end-Q311, 21.7% of corporate credit exposure was in CEE, followed by
Austria (19.6%), Russia (12.8%), western Europe (13.5%) and SEE (13.3%). In recent years
RBI has expanded corporate lending in Asia (facilitating trade flows between Austria/CEE and
Asia) and Asian corporate loans accounted for a meaningful 8.7% at end-Q311. By sector,
corporate lending is well diversified, with acceptable concentration in real estate (5.3% of total
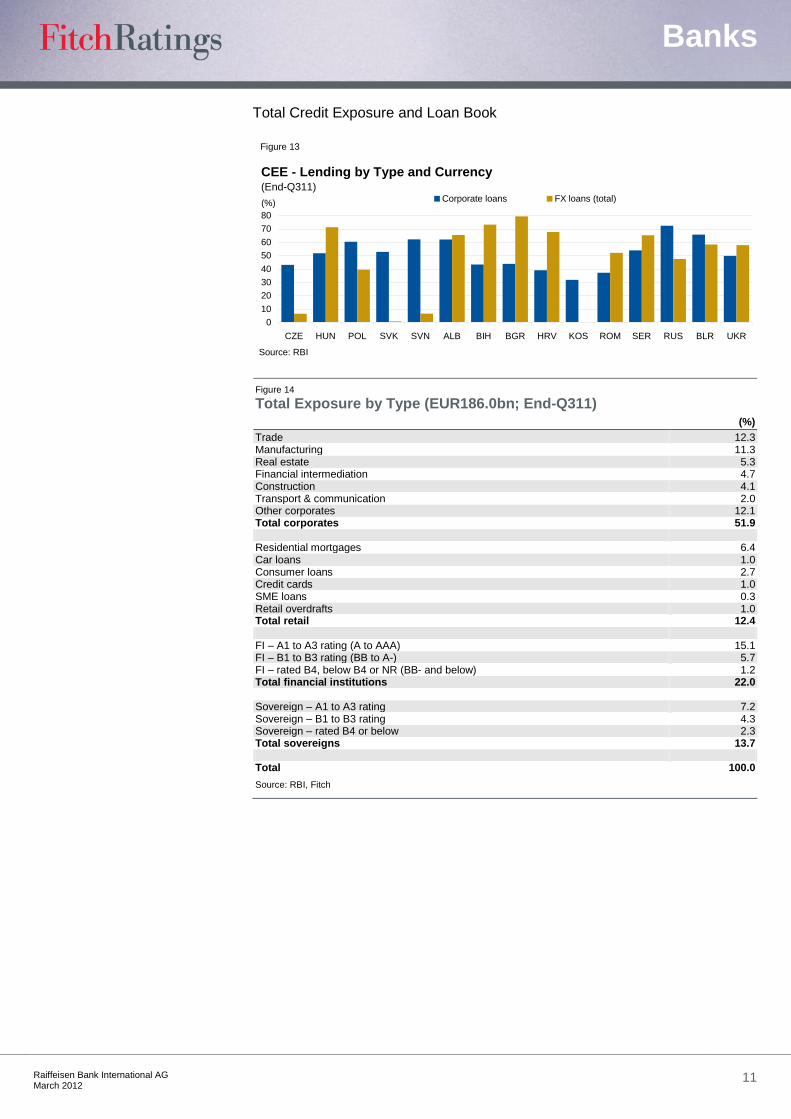
credit exposure at end-Q311; see Figure 14) and the construction industry (4.1%).
Reflecting its corporate lending business model, concentration risk at RBI is significant, Fitch
believes, with the 20 largest credit exposures accounting for around 5% of total credit exposure
(or 12% of gross loans) and 144% of Fitch core capital at end-2010. At the same time, 17
exposures exceeded 5% of Fitch core capital (nine exceeded 5% of regulatory Tier 1 capital).
The biggest exposure amounted to 13% of Fitch core capital. All large exposures had sound
internal ratings. Despite efforts to improve this, collateralisation of corporate exposures remains
relatively low and at end-2010, RBI‟s 20 largest exposures were only 20% covered by tangible
collateral.
After strong growth in 2008 and 2009, growth in retail loans (including SME loans) came to a
halt in 9M11, reflecting the deteriorating operating environment in CEE. At end-Q311, around
half of retail loans were extended in CEE, followed by SEE (30%) and Russia (11%). At the
same date, 51% of retail loans were residential mortgages, followed by consumer loans (22%)
and smaller balances of car loans, credit cards and overdrafts (each 8%). Despite the attempts
to reduce foreign-currency retail loans, FX retail loans remain significant, at 36% of total retail
loans. More importantly, the proportion of overall FX loans is not evenly distributed across CEE
countries and FX loans are particularly prevalent in Hungary, Bulgaria and Croatia (see Figure
13). Underwriting criteria for FX loans are somewhat stricter (20% additional collateral haircut
and tighter debt/income ratios) and have been altogether discontinued for certain markets and
product types.
Given RBI‟s role within RBG but also its sizeable trade finance business, interbank assets
account for a larger proportion of credit risk than at many of its peers (around 19% of total
assets at end-Q311). However, 37% of RBI‟s total bank exposure was to RBG, due to its role
as liquidity manager for the group. At end-Q311, the majority of interbank assets were in
Austria (41%) and western Europe (40%) with minor balances in Asia (7%) and the rest of the
world (12%). Around 69% of interbank assets were rated in the three best internal rating
classes, with 3.1% lowly rated and 1.8% at risk of default or in default.
While credit exposure to CEE banks is limited (around EUR3bn at end-Q311), exposure to
CEE sovereigns is significant, amounting to EUR15.6bn, or 61% of RBI‟s total sovereign
exposure at end-Q311 (the remainder largely related to Austria, 30%). Exposure to eurozone
peripheral countries is limited to some Italian sovereign (EUR434m at end-Q311) and Italian
(EUR909m) and Spanish (EUR755m) interbank exposure.
RBI is also exposed to credit risk in its EUR11bn trading and derivatives book (derivatives
accounting for EUR7bn) and its EUR18.8bn financial investments book (almost exclusively
Figure 6
Economic Capital by
Risk Type(End-Q311)
Source: RBI
Credit -
corporates
38%
Operational
risk
9%
Credit -
public sector
10%
Market risk
9%
Risk buffer
9%
Credit - FI
6%
Credit - retail
19%
Figure 7
Austria
26%
Other
3%
SEE
19%
CEE
30%
CIS
other
8%
Russia
14%
Economic Capital by Region(End-Q311)
Source: RBI
Figure 8 Asset Quality As of end-Q311 CZE HUN POL SVK SVN ALB BIH BGR HRV KOS ROM SER RUS BLR UKR Corp Markets Total
Loans (EURbn) 6.8 5.9 5.3 6.5 1.3 0.9 1.4 2.9 3.8 0.4 4.4 1.3 9.2 0.9 4.2 20.1 1.8 81.3 NPL ratio (%) 6.8 19.7 6.1 4.8 6.5 13.6 7.5 11.4 10.3 9.1 9.2 12.8 5.9 2.2 33.9 3.6 10.4 8.4 Coverage ratio (%) 56.9 66.9 59.0 67.1 52.8 71.4 62.8 62.8 53.8 73.9 71.0 56.6 107.3 263.4 68.9 75.4 88.6 70.5
Source: RBI, Fitch

Banks
Raiffeisen Bank International AG
March 2012 7
fixed income instruments, EUR15.8bn of which were ECB-eligible). RBI also holds a EUR700m
ABS portfolio (end-2011 market value: EUR477m) although legacy assets are being gradually
disposed of.
Having been somewhat reduced during the financial crisis, off-balance-sheet commitments
remain a sizeable source of credit risk for RBI. At end-Q311, they amounted to EUR39.6bn, or
26.7% of RBI‟s balance sheet and were roughly evenly split between contingent liabilities (31%;
largely credit and other guarantees), irrevocable credit lines (32%) and revocable credit lines.
Asset Quality
After a sharp deterioration, RBI‟s asset quality improved gradually during 2010 and H111.
During 9M11, RBI‟s NPL ratio remained broadly stable as a result of still moderate NPL inflows
but also due to positive FX effects, amounting to 8.8% at end-Q311. However, Fitch expects
this ratio to deteriorate in 2012 both as a result of lower volume growth and an increased inflow
of NPLs in some markets, notably Hungary and Croatia.
While recent trends indicate a renewed worsening of asset quality, this is by no means uniform
across all CEE markets: NPLs in markets like Hungary, Croatia, Bosnia and Bulgaria continued
to increase during 2011 and at least for Hungary and Croatia, Fitch expects asset quality to
continue to deteriorate in 2012. More worryingly, asset quality improvements in some of the
better-performing markets have started to slow down since mid-2011 and some of the stronger
countries, eg the Czech Republic or Poland, even reported an increased NPL ratio at end-
Q311. Among the largest CEE presences, RBI‟s Russian subsidiary was the only one still
reporting NPL ratio improvements in Q311.
More positively, RBI‟s NPL coverage ratio has improved, standing at around 71% at end-Q311.
Still, considering the relatively low collateralisation levels of RBI‟s corporate loans, Fitch
believes that this coverage ratio will have to be maintained at current levels. Despite RBI‟s
sizeable corporate loan book, NPLs tend to be fairly granular. At end-2010, RBI‟s 20 largest
NPLs (58.8% coverage ratio) accounted for 15.3% of Fitch core capital (6.3% after taking loan
loss reserves into account).
Market Risk
Market risk, which Fitch views as relatively moderate at RBI, largely relates to FX risk due to
unhedged capital investments in subsidiaries and, to a lesser degree, structural interest rate
risk in the banking book. In terms of FX positions, the bank partially hedges the book value of
its investments in CEE and sometimes part of the expected profit (the latter is decided by the
assets and liabilities committee (ALCO) every two months).
RBI uses a value-at-risk (VaR) model to calculate market risk capital requirements and
calculates both a trading book VaR and a banking book VaR (for both: 1-day holding period,
99% confidence level, one-business-year observation period). VaR is stress-tested weekly,
using the biggest market movements in the previous five years. Back-testing takes place
regularly. Total VaR (for both the trading and banking books) is limited to EUR380m (after
taking into account diversification effects; EUR425m on a gross basis). In early December 2011,
utilisation stood at 90% (peaking at 112% during 2011). During 9M11, RBI‟s maximum 10-day
VaR excluding diversification effects (as calculated by Fitch) amounted to an acceptable 11%
of Fitch core capital. Interest rate (4.5% of core capital) and FX risk (4.1%) tend to be RBI‟s
main VaR components followed by credit spread risk (2.4%).
Equity risk is small. Furthermore, interest rate risk in the banking book, defined as a 200bp
interest rate movement, has a regulatory limit of 20% of eligible own funds. The bank is known
as an active trading bank in Austria and emerging markets. Credit derivatives are used mostly
for hedging purposes.

Banks
Raiffeisen Bank International AG
March 2012 8
Operational Risk
For Basel II purposes, RBI uses the standardised approach. It has defined key risk indicators
and has implemented an early warning system. The group‟s main exposure to operational risk
probably resides in its extensive branch network in CEE.
Funding and Capital
Funding
CEE and (to a lesser extent) Austrian customer deposits fund around half of RBI‟s balance
sheet (and 85% of gross loans at end-Q311). RBI‟s loans/deposits ratio compares reasonably
well with peers‟ (118% at end-Q311). If adjusted for RBG liquidity placed with RBI (accounted
for as interbank funding), RBI‟s loans/deposits ratio falls to below 100% (95% at end-Q311).
Overall, despite having reduced, wholesale funding in the form of interbank funding and bond
issuance remains significant.
Reflecting its sizeable corporate business, deposits from corporates dominate RBI‟s customer
deposit base (53% of total deposits at end-Q311), followed by retail deposits (35%) and SME
deposits (9%). Geographically, RBI‟s deposit base is well diversified, with some concentration
in Russia (13% of total deposits), Slovakia (10%), the Czech Republic (9%), Austria (9%),
Hungary (7%) and Poland (6%). Deposits from RBI‟s overseas branches (London, Singapore,
Beijing, Malta) are also relatively significant.
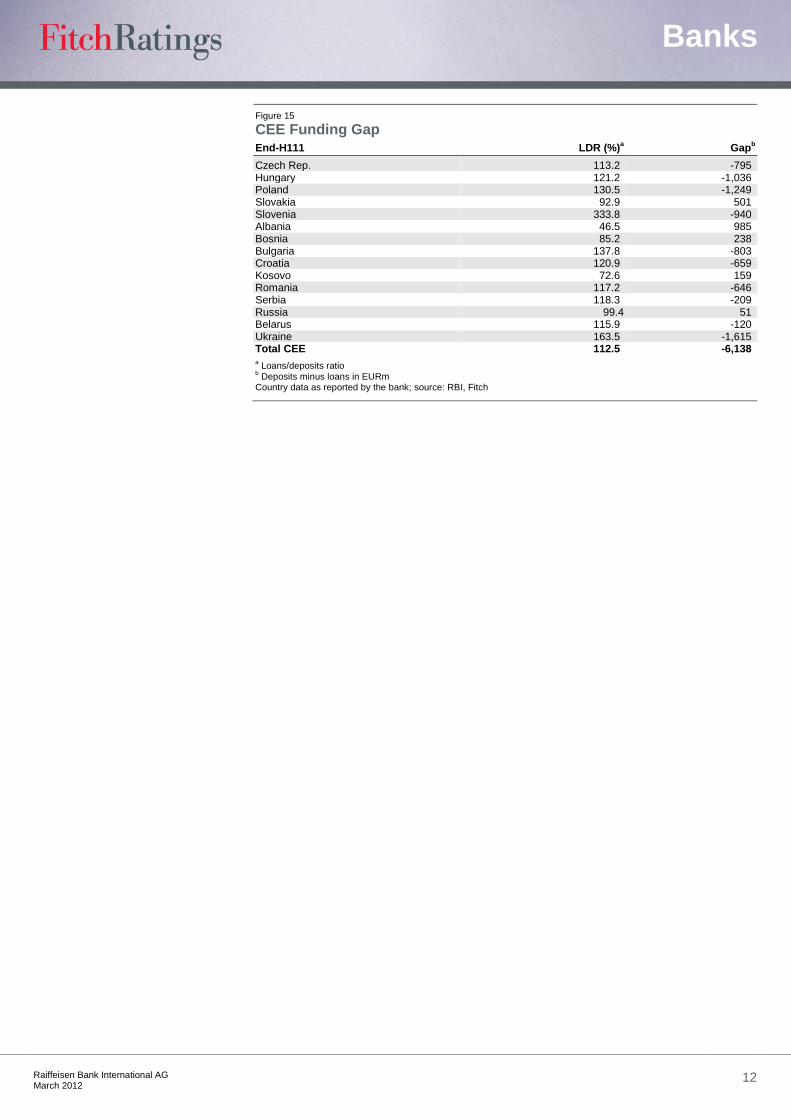
While some CEE subsidiaries are largely self-funded (eg Slovakia and Russia, see Figure 15),
RBI continues to be reliant on wholesale funding to finance part of its CEE operations. However,
sluggish growth in CEE and efforts to raise local deposits has meant that the CEE funding gap
has narrowed considerably to around EUR6bn at end-Q311. Moreover, RBI obtains a
significant part of interbank funding from within the RBG sector (around 45% at end-Q311). At
end-2011, RBI did not have any central bank funding, from either the ECB or the Swiss
National Bank (for CHF loans in CEE). In 2012, around EUR3bn of publicly placed bonds will
mature, in addition to EUR1.25bn of government-guaranteed bonds and EUR1.5bn of private
placements.
Liquidity management for all of RBI‟s subsidiaries is centralised. Reflecting its large and long-
term loan book (at end-Q311, 20% of loans matured after five years and 35% between one and
five years), RBI has, based on remaining contractual maturities, a significant liquidity gap in the
“up to three months” bucket (EUR13.9bn; excluding equity). According to its internal liquidity
assumptions (which include off-balance-sheet outflows), RBI had a more than two-year
“survival period” at end-Q311. RBI‟s liquidity stress test assumes no access to wholesale
markets for six months, budgeted credit growth and a 20% outflow in retail deposits. Liquidity is
supported by RZB‟s sizeable counterbalancing capacity, which at end-Q311 consisted of ECB-
eligible assets (EUR15bn; around EUR7bn of which were unencumbered) and assets eligible
for tender at local central banks.
Capital
RBI‟s majority owner, RZB, reported a EUR2.1bn capital shortfall under EBA scenarios
published in Q411. While the shortfall at RBI level has not been published, given that RBI
represents the bulk of RZB, Fitch assumes that the capital shortfall at RBI is of a similar
magnitude and addressing this shortfall by end-H112 (the EBA deadline) will be one of RBI‟s
key challenges in H112.
Capital strengthening measures announced in Q411 include making privately owned
participation capital (EUR750m) EBA-compliant (a boost to capitalisation of between EUR500m
and EUR1bn, according to RBI), generating regulatory capital at RZB level (EUR400m),
earnings retention (EUR600m to EUR800m), optimising RWA utilisation (EUR700m to
EUR900m) and various other capital-enhancing measures (EUR300m to EUR500m),.
According to RBI, business reduction (deleveraging) will roughly correspond to RWA growth in
Figure 9 RBI Funding Structure End-Q311 (EURm) (%)
a
Bank deposits 37,607 27 O/w from RBG sector
16,813 12
O/w ECB 0 0 O/w other Austrian 8,244 O/w foreign 13,325 Customer deposits
68,936 50
O/w Austrian 6,497 5 O/w foreign 62,439 45 Debt securities 15,161 11 O/w maturing Q411/2012
6,040
Subordinated debt 4,091 O/w Tier 2 3,279 Total non-equity 138,020 100 a As % of total non-equity funding
Source: RBI; Fitch
Good customer deposit franchise throughout CEE.
Efforts to contain wholesale funding requirements for CEE.
Thin core capital ratios.
Meeting EBA capital ratio requirements feasible, but challenging given market conditions.

Banks
Raiffeisen Bank International AG
March 2012 9
2011 and should therefore not be overly detrimental to business opportunities in CEE. The
bank does not intend to raise capital externally. Fitch views RZB‟s and RBI‟s capital-
strengthening plan as challenging, especially given the currently difficult operating environment.
In late January 2012, RBI/RZB stated that around two-thirds of the required additional capital
had already been raised.
Compared to many peers‟, RBI‟s core Tier 1 capitalisation is thin, reflected in a low Fitch core
capital ratio (see Figure 10), as RBI‟s Tier 1 capital contains a large proportion of privately-
placed hybrid and participation capital, and EUR1.75bn of government participation capital
injected in late-2008 and 2009. Both forms of participation capital are considered core Tier 1
capital by the Austrian regulator but have been reclassified as hybrid capital (100% equity
credit) by Fitch.
To limit the impact of FX on RBI‟s capital ratios, the bank partly hedges its non-euro capital
investments in CEE and elsewhere. Nonetheless, RBI‟s capital ratios remain sensitive to FX
volatility, as witnessed in 9M11 when FX effects had a significant negative impact on capital
ratios (20bp in Q311 alone).
Figure 10 RBI Capital Structure End-Q311 (EURm)
Core Tier 1 capital 5,506 Hybrid capital 800 Private part cap 750 Government par cap 1,750 Tier 2 capital 3,260 Total RWA 100,863 O/w credit 80,438 O/w market 10,575 O/w operational 9,850 (%)
Fitch core capital 6.3 RBI core Tier 1 7.9 Tier 1 8.7 Total capital ratio 12.1
Source: RBI; Fitch

Banks
Raiffeisen Bank International AG
March 2012 10
Annex
Group Structure and Support Mechanism
The Raiffeisen group has a cross-guarantee support mechanism in place. While there has
always been a voluntary support mechanism, a legally binding mechanism was established in
the early 2000s. The voluntary support scheme remains in place but has been enhanced by an
“ultimate payment guarantee” through the setting up of a fund (Raiffeisen ‐
Kundengarantiegemeinschaft Österreich). The regional cross-guarantee systems are also part
of the Raiffeisen-Kundengarantiegemeinschaft, with the exception of the regions of Salzburg
and Carinthia. Consequently, around 81% of all group banks are members of the guarantee
scheme, including RBI, resulting in around 90% of deposits being guaranteed.
Revenue by Region
Figure 12
Group markets
8%
Corporate centre
8%
SEE
22%Russia
14%
CEE
27%
Group corporates
10%
CIS other
11%
Revenue by Region(9M11)
Source: RBI; excluding consolidation effects
Figure 11
Raiffeisen Banking Group, RZB AG and RBI – Simplified Organisational Chart
a Legal merger with Polbank expected in Q112
Source: RBI
1.6m Members (Mainly Private Individuals in Austria) ZAO Raiffeisenbank Moscow (100%)
527 Austrian Raiffeisen Banks (Around 2,200 Domestic Branches)
8 Regional Raiffeisen Banks (Raiffeisenlandesbanken) and Zveza
Bank (Klagenfurt)
Raiffeisen Zentralbank Oesterreich Ag (RZB AG)
Raiffeisen Bank International AG
Ra
iffe
ise
n B
an
kin
g G
rou
p (
RB
G)
Raiffeisen Bank Zrt. Budapest (73.24%)
Raiffeisenbank a.s. Prague (51.0%)
Tatra banka a.s. Bratislava (70.6%)
Raiffeisen Bank Polska S.A. Warsaw (100%)a
Raiffeisen Bank S.A. Bucharest (99.5%)
Raiffeisenbank Austria d.d. Zagreb (75.0%)
Raiffeisen Bank Aval JSC Kiev (96.2%)
Raiffeisenbank (Bulgaria) EAD Sofia (100%)
Raiffeisen Bank d.d. Bosnia I Herce. (97.0%)
Raiffeisen Bank Sh.a. Tirana (100%)
Raiffeisen banka a.d. Belgrade (100%)
Raiffeisen Banka d.d. Maribor/Slovenia (86.3%)
Priorbank JSC Minsk (87.7%)
Other subsidiaries in CEE and elsewhere
Banks
Raiffeisen Bank International AG
March 2012 11
Total Credit Exposure and Loan Book
Figure 13
0
10
20
30
40
50
60
70
80
CZE HUN POL SVK SVN ALB BIH BGR HRV KOS ROM SER RUS BLR UKR
Corporate loans FX loans (total)
CEE - Lending by Type and Currency(End-Q311)
(%)
Source: RBI
Figure 14 Total Exposure by Type (EUR186.0bn; End-Q311) (%)
Trade 12.3 Manufacturing 11.3 Real estate 5.3 Financial intermediation 4.7 Construction 4.1 Transport & communication 2.0 Other corporates 12.1 Total corporates 51.9 Residential mortgages 6.4 Car loans 1.0 Consumer loans 2.7 Credit cards 1.0 SME loans 0.3 Retail overdrafts 1.0 Total retail 12.4 FI – A1 to A3 rating (A to AAA) 15.1 FI – B1 to B3 rating (BB to A-) 5.7 FI – rated B4, below B4 or NR (BB- and below) 1.2 Total financial institutions 22.0 Sovereign – A1 to A3 rating 7.2 Sovereign – B1 to B3 rating 4.3 Sovereign – rated B4 or below 2.3 Total sovereigns 13.7 Total 100.0
Source: RBI, Fitch
Banks
Raiffeisen Bank International AG
March 2012 12
Figure 15 CEE Funding Gap End-H111 LDR (%)
a Gap
b
Czech Rep. 113.2 -795 Hungary 121.2 -1,036 Poland 130.5 -1,249 Slovakia 92.9 501 Slovenia 333.8 -940 Albania 46.5 985 Bosnia 85.2 238 Bulgaria 137.8 -803 Croatia 120.9 -659 Kosovo 72.6 159 Romania 117.2 -646 Serbia 118.3 -209 Russia 99.4 51 Belarus 115.9 -120 Ukraine 163.5 -1,615 Total CEE 112.5 -6,138 a Loans/deposits ratio
b Deposits minus loans in EURm
Country data as reported by the bank; source: RBI, Fitch

Banks
Raiffeisen Bank International AG
March 2012 13
Figure 16 RBI – Peer Group Comparison
RBI* UniCredit Bank Austria AG Erste Group Bank AG
(EURm) 9M11 2010 9M11 2010 9M11 2010
Net interest income 2,724 3,578 3,402 4,574 4,115 5,392 Net fee income 1,125 1,491 1,401 1,991 1,352 1,936 Total non-interest operating income 1,379 1,878 1,877 2,552 1,149 1,951 Personal expenses 1,141 1,453 1,513 1,931 1,720 2,264 Other operating expenses 1,146 1,527 1,576 1,979 1,171 1,553 Total operating expenses 2,287 2,980 3,089 3,910 2,892 3,817 Pre-impairment operating profit 1,816 2,477 2,340 3,340 2,391 3,546 Loan impairment charge (LIC) 782 1,194 1,044 1,837 1,859 2,031 Operating profit 1,034 1,283 991 1,489 532 1,515 Pre-tax profit 1,034 1,283 287 1,146 (670) 1,515 Net income 759 1,177 43 798 (775) 1,186 Fitch comprehensive income 411 1,395 (144) 1,068 (691) 1,341 Net interest margin (%) 2.82 4.45 2.48 2.56 2.83 2.91 Pre-impairment op. profit/av. equity (%) 30.44 33.93 17.84 19.74 21.08 23.9 Pre-impairment op. profit/av. assets (%) 1.74 2.82 1.62 1.7 1.51 1.72 LIC/pre-impairment operating profit (%) 43.06 48.21 57.65 55.42 77.75 57.28 Operating profit/average equity (%) 17.33 17.57 7.55 8.8 4.69 10.21 Operating profit/average assets (%) 0.99 1.46 0.68 0.76 0.33 0.73 Comprehensive income/av. equity (%) 6.89 19.11 (1.1) 6.31 (6.09) 9.04 Eligible capital/risk-weighted assets (%) 6.33 9.4 11.65 10.58 8.15 9.83 Tang. common equity/tangible assets %) 4.52 4.95 7.42 7.25 4.78 5.31 Equity/assets (%) 5.29 6.03 8.74 9.05 6.33 7.46 Tier 1 ratio (%) 8.7 9.7 10.75 10.35 9.8 10.2 Impaired loans (EURm) 7,153 6,661 14,007 12,478 11,113 10,087 Loan loss reserve (LLR; EURm) 5,052 4,756 7,554 6,936 7,189 6,119 Impaired loans/total loans (%) 8.8 8.8 10.1 9.11 8.22 7.6 LLR/impaired loans (%) 70.63 71.4 53.93 55.59 64.69 60.66 LIC/average gross loans (%) 1.33 2.12 1.02 1.37 1.86 1.55 LLR/total assets (%) 3.33 3.33 3.33 3.33 3.33 3.33 Loans/customer deposits (%) 117.96 131.27 134.37 136.64 111.2 113.43 Total assets 148,368 131,173 197,667 193,049 216,094 205,938 Total customer deposits 68,937 57,633 103,209 100,284 121,594 117,016 Total long-term funding 18,439 19,737 31,474 24,539 39,341 35,957 Total equity 7,847 7,904 17,284 17,475 13,677 15,365 Fitch core capital 6,385 6,414 14,011 13,135 9,769 10,601
*2010 figures are not fully comparable due to the October 2010 merger of RI with RZB‟s corporate and investment banking business to form RBI. Source: Banks‟ financial statements

Banks
Raiffeisen Bank International AG
March 2012 14
Raiffeisen Bank International AG
Income Statement
9 Months - 3rd Quarter 9 Months - 3rd Quarter As % of Year End As % of Year End As % of Year End As % of Year End As % of
USDm EURm Earning EURm Earning EURm Earning EURm Earning EURm Earning
Unaudited Unaudited Assets Unqualified Assets Unqualified Assets Unqualified Assets Unqualified Assets
1. Interest Income on Loans 4,689.4 3,473.0 3.41 4,571.9 3.76 4,498.8 6.51 5,761.9 7.68 4,309.4 6.54
2. Other Interest Income 1,868.8 1,384.0 1.36 1,793.1 1.47 1,092.7 1.58 422.0 0.56 295.9 0.45
3. Dividend Income n.a. n.a. - n.a. - n.a. - n.a. - n.a. -
4. Gross Interest and Dividend Income 6,558.2 4,857.0 4.77 6,365.0 5.23 5,591.5 8.10 6,183.9 8.24 4,605.3 6.99
5. Interest Expense on Customer Deposits 1,328.7 984.0 0.97 1,251.0 1.03 1,593.8 2.31 2,697.6 3.59 1,998.5 3.03
6. Other Interest Expense 1,551.4 1,149.0 1.13 1,535.8 1.26 1,061.2 1.54 254.3 0.34 188.0 0.29
7. Total Interest Expense 2,880.1 2,133.0 2.10 2,786.8 2.29 2,655.0 3.84 2,951.9 3.93 2,186.5 3.32
8. Net Interest Income 3,678.1 2,724.0 2.68 3,578.2 2.94 2,936.5 4.25 3,232.0 4.31 2,418.8 3.67
9. Net Gains (Losses) on Trading and Derivatives 596.8 442.0 0.43 243.9 0.20 194.5 0.28 147.7 0.20 97.8 0.15
10. Net Gains (Losses) on Other Securities -81.0 -60.0 -0.06 n.a. - 0.0 0.00 0.0 0.00 0.0 0.00
11. Net Gains (Losses) on Assets at FV through Income Statement -116.1 -86.0 -0.08 137.2 0.11 41.4 0.06 -25.6 -0.03 -9.2 -0.01
12. Net Insurance Income n.a. n.a. - n.a. - n.a. - n.a. - n.a. -
13. Net Fees and Commissions 1,519.0 1,125.0 1.11 1,490.8 1.22 1,223.1 1.77 1,496.3 1.99 1,249.8 1.90
14. Other Operating Income -56.7 -42.0 -0.04 6.3 0.01 0.1 0.00 7.9 0.01 26.5 0.04
15. Total Non-Interest Operating Income 1,862.0 1,379.0 1.36 1,878.2 1.54 1,459.1 2.11 1,626.3 2.17 1,364.9 2.07
16. Personnel Expenses 1,540.6 1,141.0 1.12 1,452.9 1.19 1,054.2 1.53 1,275.9 1.70 1,084.9 1.65
17. Other Operating Expenses 1,547.4 1,146.0 1.13 1,526.8 1.25 1,235.9 1.79 1,372.9 1.83 1,104.2 1.68
18. Total Non-Interest Expenses 3,088.0 2,287.0 2.25 2,979.7 2.45 2,290.1 3.32 2,648.8 3.53 2,189.1 3.32
19. Equity-accounted Profit/ Loss - Operating n.a. n.a. - n.a. - n.a. - n.a. - n.a. -
20. Pre-Impairment Operating Profit 2,452.1 1,816.0 1.78 2,476.7 2.03 2,105.5 3.05 2,209.5 2.94 1,594.6 2.42
21. Loan Impairment Charge 1,055.9 782.0 0.77 1,194.1 0.98 1,737.9 2.52 780.3 1.04 357.0 0.54
22. Securities and Other Credit Impairment Charges n.a. n.a. - n.a. - n.a. - n.a. - n.a. -
23. Operating Profit 1,396.2 1,034.0 1.02 1,282.6 1.05 367.6 0.53 1,429.2 1.90 1,237.6 1.88
24. Equity-accounted Profit/ Loss - Non-operating 0.0 0.0 0.00 n.a. - n.a. - n.a. - n.a. -
25. Non-recurring Income n.a. n.a. - n.a. - n.a. - n.a. - n.a. -
26. Non-recurring Expense n.a. n.a. - n.a. - n.a. - n.a. - n.a. -
27. Change in Fair Value of Own Debt n.a. n.a. - n.a. - n.a. - n.a. - n.a. -
28. Other Non-operating Income and Expenses n.a. n.a. - n.a. - n.a. - n.a. - n.a. -
29. Pre-tax Profit 1,396.2 1,034.0 1.02 1,282.6 1.05 367.6 0.53 1,429.2 1.90 1,237.6 1.88
30. Tax expense 367.3 272.0 0.27 110.2 0.09 80.5 0.12 350.9 0.47 264.1 0.40
31. Profit/Loss from Discontinued Operations -4.1 -3.0 0.00 4.8 0.00 n.a. - n.a. - n.a. -
32. Net Income 1,024.8 759.0 0.75 1,177.2 0.97 287.1 0.42 1,078.3 1.44 973.5 1.48
33. Change in Value of AFS Investments -10.8 -8.0 -0.01 10.1 0.01 8.7 0.01 n.a. - n.a. -
34. Revaluation of Fixed Assets n.a. n.a. - n.a. - n.a. - n.a. - n.a. -
35. Currency Translation Differences -472.6 -350.0 -0.34 180.4 0.15 -248.9 -0.36 n.a. - n.a. -
36. Remaining OCI Gains/(losses) 13.5 10.0 0.01 27.2 0.02 0.0 0.00 n.a. - n.a. -
37. Fitch Comprehensive Income 555.0 411.0 0.40 1,394.9 1.15 46.9 0.07 1,078.3 1.44 973.5 1.48
38. Memo: Profit Allocation to Non-controlling Interests n.a. n.a. - n.a. - 74.9 0.11 96.3 0.13 132.2 0.20
39. Memo: Net Income after Allocation to Non-controlling Interests 1,024.8 759.0 0.75 1,177.2 0.97 212.2 0.31 982.0 1.31 841.3 1.28
40. Memo: Common Dividends Relating to the Period n.a. n.a. - 30.1 0.02 142.9 0.21 142.8 0.19 n.a. -
41. Memo: Preferred Dividends Related to the Period n.a. n.a. - n.a. - n.a. - n.a. - n.a. -
Exchange rate
31 Dec 2007
USD1 = EUR0.67930
31 Dec 2009
USD1 = EUR0.69416
31 Dec 2008
USD1 = EUR0.71855
30 Sep 2011
USD1 = EUR0.74060
31 Dec 2010
USD1 = EUR0.74840
Banks
Raiffeisen Bank International AG
March 2012 15
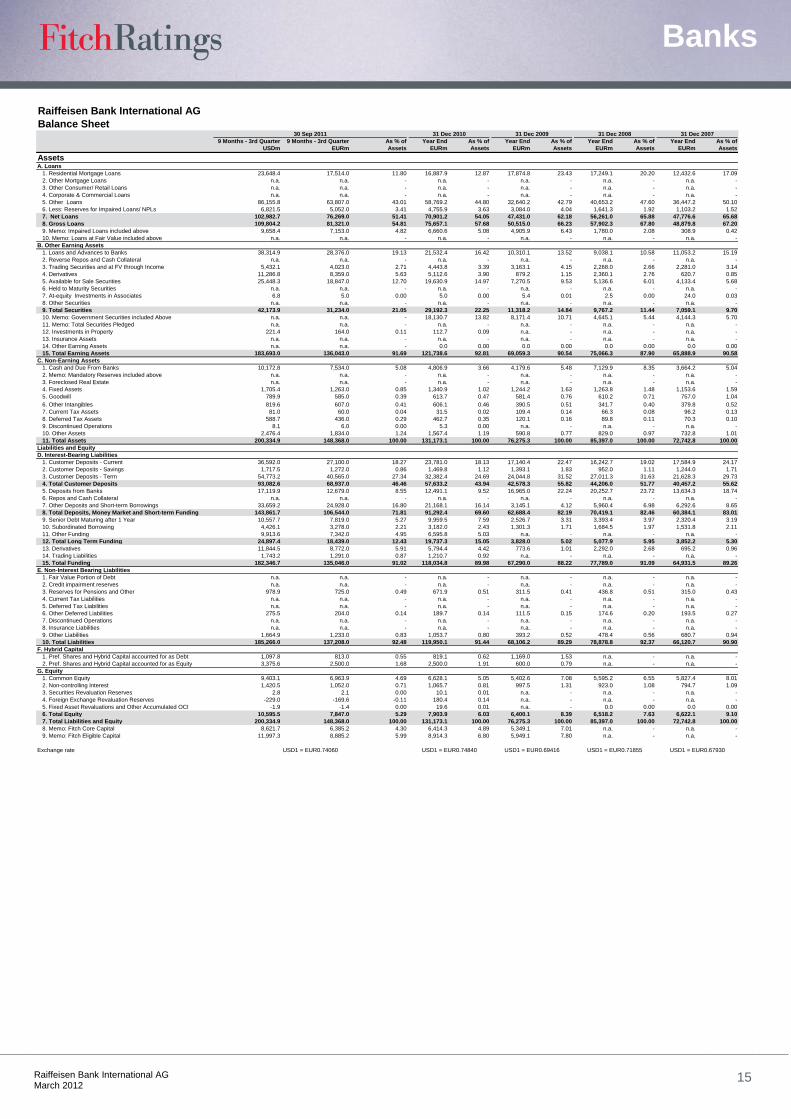
Raiffeisen Bank International AG
Balance Sheet
9 Months - 3rd Quarter 9 Months - 3rd Quarter As % of Year End As % of Year End As % of Year End As % of Year End As % of
USDm EURm Assets EURm Assets EURm Assets EURm Assets EURm Assets
AssetsA. Loans
1. Residential Mortgage Loans 23,648.4 17,514.0 11.80 16,887.9 12.87 17,874.8 23.43 17,249.1 20.20 12,432.6 17.09
2. Other Mortgage Loans n.a. n.a. - n.a. - n.a. - n.a. - n.a. -
3. Other Consumer/ Retail Loans n.a. n.a. - n.a. - n.a. - n.a. - n.a. -
4. Corporate & Commercial Loans n.a. n.a. - n.a. - n.a. - n.a. - n.a. -
5. Other Loans 86,155.8 63,807.0 43.01 58,769.2 44.80 32,640.2 42.79 40,653.2 47.60 36,447.2 50.10
6. Less: Reserves for Impaired Loans/ NPLs 6,821.5 5,052.0 3.41 4,755.9 3.63 3,084.0 4.04 1,641.3 1.92 1,103.2 1.52
7. Net Loans 102,982.7 76,269.0 51.41 70,901.2 54.05 47,431.0 62.18 56,261.0 65.88 47,776.6 65.68
8. Gross Loans 109,804.2 81,321.0 54.81 75,657.1 57.68 50,515.0 66.23 57,902.3 67.80 48,879.8 67.20
9. Memo: Impaired Loans included above 9,658.4 7,153.0 4.82 6,660.6 5.08 4,905.9 6.43 1,780.0 2.08 308.9 0.42
10. Memo: Loans at Fair Value included above n.a. n.a. - n.a. - n.a. - n.a. - n.a. -
B. Other Earning Assets
1. Loans and Advances to Banks 38,314.9 28,376.0 19.13 21,532.4 16.42 10,310.1 13.52 9,038.1 10.58 11,053.2 15.19
2. Reverse Repos and Cash Collateral n.a. n.a. - n.a. - n.a. - n.a. - n.a. -
3. Trading Securities and at FV through Income 5,432.1 4,023.0 2.71 4,443.8 3.39 3,163.1 4.15 2,268.0 2.66 2,281.0 3.14
4. Derivatives 11,286.8 8,359.0 5.63 5,112.6 3.90 879.2 1.15 2,360.1 2.76 620.7 0.85
5. Available for Sale Securities 25,448.3 18,847.0 12.70 19,630.9 14.97 7,270.5 9.53 5,136.6 6.01 4,133.4 5.68
6. Held to Maturity Securities n.a. n.a. - n.a. - n.a. - n.a. - n.a. -
7. At-equity Investments in Associates 6.8 5.0 0.00 5.0 0.00 5.4 0.01 2.5 0.00 24.0 0.03
8. Other Securities n.a. n.a. - n.a. - n.a. - n.a. - n.a. -
9. Total Securities 42,173.9 31,234.0 21.05 29,192.3 22.25 11,318.2 14.84 9,767.2 11.44 7,059.1 9.70
10. Memo: Government Securities included Above n.a. n.a. - 18,130.7 13.82 8,171.4 10.71 4,645.1 5.44 4,144.3 5.70
11. Memo: Total Securities Pledged n.a. n.a. - n.a. - n.a. - n.a. - n.a. -
12. Investments in Property 221.4 164.0 0.11 112.7 0.09 n.a. - n.a. - n.a. -
13. Insurance Assets n.a. n.a. - n.a. - n.a. - n.a. - n.a. -
14. Other Earning Assets n.a. n.a. - 0.0 0.00 0.0 0.00 0.0 0.00 0.0 0.00
15. Total Earning Assets 183,693.0 136,043.0 91.69 121,738.6 92.81 69,059.3 90.54 75,066.3 87.90 65,888.9 90.58
C. Non-Earning Assets
1. Cash and Due From Banks 10,172.8 7,534.0 5.08 4,806.9 3.66 4,179.6 5.48 7,129.9 8.35 3,664.2 5.04
2. Memo: Mandatory Reserves included above n.a. n.a. - n.a. - n.a. - n.a. - n.a. -
3. Foreclosed Real Estate n.a. n.a. - n.a. - n.a. - n.a. - n.a. -
4. Fixed Assets 1,705.4 1,263.0 0.85 1,340.9 1.02 1,244.2 1.63 1,263.8 1.48 1,153.6 1.59
5. Goodwill 789.9 585.0 0.39 613.7 0.47 581.4 0.76 610.2 0.71 757.0 1.04
6. Other Intangibles 819.6 607.0 0.41 606.1 0.46 390.5 0.51 341.7 0.40 379.8 0.52
7. Current Tax Assets 81.0 60.0 0.04 31.5 0.02 109.4 0.14 66.3 0.08 96.2 0.13
8. Deferred Tax Assets 588.7 436.0 0.29 462.7 0.35 120.1 0.16 89.8 0.11 70.3 0.10
9. Discontinued Operations 8.1 6.0 0.00 5.3 0.00 n.a. - n.a. - n.a. -
10. Other Assets 2,476.4 1,834.0 1.24 1,567.4 1.19 590.8 0.77 829.0 0.97 732.8 1.01
11. Total Assets 200,334.9 148,368.0 100.00 131,173.1 100.00 76,275.3 100.00 85,397.0 100.00 72,742.8 100.00
Liabilities and Equity
D. Interest-Bearing Liabilities
1. Customer Deposits - Current 36,592.0 27,100.0 18.27 23,781.0 18.13 17,140.4 22.47 16,242.7 19.02 17,584.9 24.17
2. Customer Deposits - Savings 1,717.5 1,272.0 0.86 1,469.8 1.12 1,393.1 1.83 952.0 1.11 1,244.0 1.71
3. Customer Deposits - Term 54,773.2 40,565.0 27.34 32,382.4 24.69 24,044.8 31.52 27,011.3 31.63 21,628.3 29.73
4. Total Customer Deposits 93,082.6 68,937.0 46.46 57,633.2 43.94 42,578.3 55.82 44,206.0 51.77 40,457.2 55.62
5. Deposits from Banks 17,119.9 12,679.0 8.55 12,491.1 9.52 16,965.0 22.24 20,252.7 23.72 13,634.3 18.74
6. Repos and Cash Collateral n.a. n.a. - n.a. - n.a. - n.a. - n.a. -
7. Other Deposits and Short-term Borrowings 33,659.2 24,928.0 16.80 21,168.1 16.14 3,145.1 4.12 5,960.4 6.98 6,292.6 8.65
8. Total Deposits, Money Market and Short-term Funding 143,861.7 106,544.0 71.81 91,292.4 69.60 62,688.4 82.19 70,419.1 82.46 60,384.1 83.01
9. Senior Debt Maturing after 1 Year 10,557.7 7,819.0 5.27 9,959.5 7.59 2,526.7 3.31 3,393.4 3.97 2,320.4 3.19
10. Subordinated Borrowing 4,426.1 3,278.0 2.21 3,182.0 2.43 1,301.3 1.71 1,684.5 1.97 1,531.8 2.11
11. Other Funding 9,913.6 7,342.0 4.95 6,595.8 5.03 n.a. - n.a. - n.a. -
12. Total Long Term Funding 24,897.4 18,439.0 12.43 19,737.3 15.05 3,828.0 5.02 5,077.9 5.95 3,852.2 5.30
13. Derivatives 11,844.5 8,772.0 5.91 5,794.4 4.42 773.6 1.01 2,292.0 2.68 695.2 0.96
14. Trading Liabilities 1,743.2 1,291.0 0.87 1,210.7 0.92 n.a. - n.a. - n.a. -
15. Total Funding 182,346.7 135,046.0 91.02 118,034.8 89.98 67,290.0 88.22 77,789.0 91.09 64,931.5 89.26
E. Non-Interest Bearing Liabilities
1. Fair Value Portion of Debt n.a. n.a. - n.a. - n.a. - n.a. - n.a. -
2. Credit impairment reserves n.a. n.a. - n.a. - n.a. - n.a. - n.a. -
3. Reserves for Pensions and Other 978.9 725.0 0.49 671.9 0.51 311.5 0.41 436.8 0.51 315.0 0.43
4. Current Tax Liabilities n.a. n.a. - n.a. - n.a. - n.a. - n.a. -
5. Deferred Tax Liabilities n.a. n.a. - n.a. - n.a. - n.a. - n.a. -
6. Other Deferred Liabilities 275.5 204.0 0.14 189.7 0.14 111.5 0.15 174.6 0.20 193.5 0.27
7. Discontinued Operations n.a. n.a. - n.a. - n.a. - n.a. - n.a. -
8. Insurance Liabilities n.a. n.a. - n.a. - n.a. - n.a. - n.a. -
9. Other Liabilities 1,664.9 1,233.0 0.83 1,053.7 0.80 393.2 0.52 478.4 0.56 680.7 0.94
10. Total Liabilities 185,266.0 137,208.0 92.48 119,950.1 91.44 68,106.2 89.29 78,878.8 92.37 66,120.7 90.90
F. Hybrid Capital
1. Pref. Shares and Hybrid Capital accounted for as Debt 1,097.8 813.0 0.55 819.1 0.62 1,169.0 1.53 n.a. - n.a. -
2. Pref. Shares and Hybrid Capital accounted for as Equity 3,375.6 2,500.0 1.68 2,500.0 1.91 600.0 0.79 n.a. - n.a. -
G. Equity
1. Common Equity 9,403.1 6,963.9 4.69 6,628.1 5.05 5,402.6 7.08 5,595.2 6.55 5,827.4 8.01
2. Non-controlling Interest 1,420.5 1,052.0 0.71 1,065.7 0.81 997.5 1.31 923.0 1.08 794.7 1.09
3. Securities Revaluation Reserves 2.8 2.1 0.00 10.1 0.01 n.a. - n.a. - n.a. -
4. Foreign Exchange Revaluation Reserves -229.0 -169.6 -0.11 180.4 0.14 n.a. - n.a. - n.a. -
5. Fixed Asset Revaluations and Other Accumulated OCI -1.9 -1.4 0.00 19.6 0.01 n.a. - 0.0 0.00 0.0 0.00
6. Total Equity 10,595.5 7,847.0 5.29 7,903.9 6.03 6,400.1 8.39 6,518.2 7.63 6,622.1 9.10
7. Total Liabilities and Equity 200,334.9 148,368.0 100.00 131,173.1 100.00 76,275.3 100.00 85,397.0 100.00 72,742.8 100.00
8. Memo: Fitch Core Capital 8,621.7 6,385.2 4.30 6,414.3 4.89 5,349.1 7.01 n.a. - n.a. -
9. Memo: Fitch Eligible Capital 11,997.3 8,885.2 5.99 8,914.3 6.80 5,949.1 7.80 n.a. - n.a. -
Exchange rate
31 Dec 2007
USD1 = EUR0.67930
31 Dec 2009
USD1 = EUR0.69416
31 Dec 2008
USD1 = EUR0.71855
30 Sep 2011
USD1 = EUR0.74060
31 Dec 2010
USD1 = EUR0.74840

Banks
Raiffeisen Bank International AG
March 2012 16
Raiffeisen Bank International AG
Summary Analytics30 Sep 2011 31 Dec 2010 31 Dec 2009 31 Dec 2008 31 Dec 2007
9 Months - 3rd Quarter Year End Year End Year End Year End
A. Interest Ratios
1. Interest Income on Loans/ Average Gross Loans 5.91 8.12 8.35 10.58 10.28
2. Interest Expense on Customer Deposits/ Average Customer Deposits 2.10 2.73 3.75 6.31 5.48
3. Interest Income/ Average Earning Assets 5.03 7.92 7.90 8.61 8.07
4. Interest Expense/ Average Interest-bearing Liabilities 2.27 3.58 3.71 4.12 3.82
5. Net Interest Income/ Average Earning Assets 2.82 4.45 4.15 4.50 4.24
6. Net Int. Inc Less Loan Impairment Charges/ Av. Earning Assets 2.01 2.97 1.69 3.42 3.61
7. Net Interest Inc Less Preferred Stock Dividend/ Average Earning Assets 2.82 4.45 4.15 4.50 4.24
B. Other Operating Profitability Ratios
1. Non-Interest Income/ Gross Revenues 33.61 34.42 33.19 33.47 36.07
2. Non-Interest Expense/ Gross Revenues 55.74 54.61 52.10 54.52 57.86
3. Non-Interest Expense/ Average Assets 2.20 3.40 2.88 3.33 3.43
4. Pre-impairment Op. Profit/ Average Equity 30.44 33.93 32.68 32.51 29.52
5. Pre-impairment Op. Profit/ Average Total Assets 1.74 2.82 2.65 2.78 2.50
6. Loans and securities impairment charges/ Pre-impairment Op. Profit 43.06 48.21 82.54 35.32 22.39
7. Operating Profit/ Average Equity 17.33 17.57 5.71 21.03 22.91
8. Operating Profit/ Average Total Assets 0.99 1.46 0.46 1.80 1.94
9. Taxes/ Pre-tax Profit 26.31 8.59 21.90 24.55 21.34
10. Pre-Impairment Operating Profit / Risk Weighted Assets 2.41 2.61 3.29 3.07 2.96
11. Operating Profit / Risk Weighted Assets 1.37 1.35 0.57 1.98 2.30
C. Other Profitability Ratios
1. Net Income/ Average Total Equity 12.72 16.13 4.46 15.87 18.02
2. Net Income/ Average Total Assets 0.73 1.34 0.36 1.35 1.53
3. Fitch Comprehensive Income/ Average Total Equity 6.89 19.11 0.73 15.87 18.02
4. Fitch Comprehensive Income/ Average Total Assets 0.39 1.59 0.06 1.35 1.53
5. Net Income/ Av. Total Assets plus Av. Managed Securitized Assets n.a. n.a. n.a. n.a. n.a.
6. Net Income/ Risk Weighted Assets 1.01 1.24 0.45 1.50 1.81
7. Fitch Comprehensive Income/ Risk Weighted Assets 0.54 1.47 0.07 1.50 1.81
D. Capitalization
1. Fitch Core Capital/Weighted Risks 6.33 6.77 8.35 n.a. n.a.
2. Fitch Eligible Capital/ Weighted Risks 8.81 9.40 9.29 n.a. n.a.
3. Tangible Common Equity/ Tangible Assets 4.52 4.95 7.11 6.49 7.66
4. Tier 1 Regulatory Capital Ratio 8.70 9.70 11.00 8.10 10.50
5. Total Regulatory Capital Ratio 12.10 13.30 13.00 9.70 12.40
6. Core Tier 1 Regulatory Capital Ratio 7.90 8.90 9.20 n.a. n.a.
7. Equity/ Total Assets 5.29 6.03 8.39 7.63 9.10
8. Cash Dividends Paid & Declared/ Net Income n.a. 2.56 49.77 13.24 n.a.
9. Cash Dividend Paid & Declared/ Fitch Comprehensive Income n.a. 2.16 304.69 13.24 n.a.
10. Cash Dividends & Share Repurchase/Net Income n.a. n.a. n.a. n.a. n.a.
11. Net Income - Cash Dividends/ Total Equity 12.93 14.51 2.25 14.35 14.70
E. Loan Quality
1. Growth of Total Assets 13.11 71.97 -10.68 17.40 30.21
2. Growth of Gross Loans 7.49 49.77 -12.76 18.46 39.49
3. Impaired Loans(NPLs)/ Gross Loans 8.80 8.80 9.71 3.07 0.63
4. Reserves for Impaired Loans/ Gross loans 6.21 6.29 6.11 2.83 2.26
5. Reserves for Impaired Loans/ Impaired Loans 70.63 71.40 62.86 92.21 357.14
6. Impaired Loans less Reserves for Imp Loans/ Equity 26.77 24.10 28.47 2.13 -11.99
7. Loan Impairment Charges/ Average Gross Loans 1.33 2.12 3.23 1.43 0.85
8. Net Charge-offs/ Average Gross Loans n.a. 0.55 n.a. n.a. n.a.
9. Impaired Loans + Foreclosed Assets/ Gross Loans + Foreclosed Assets 8.80 8.80 9.71 3.07 0.63
F. Funding
1. Loans/ Customer Deposits 117.96 131.27 118.64 130.98 120.82
2. Interbank Assets/ Interbank Liabilities 223.80 172.38 60.77 44.63 81.07
3. Customer Deposits/ Total Funding excl Derivatives 54.59 51.35 64.01 58.55 62.98

Banks
Raiffeisen Bank International AG
March 2012 17
Raiffeisen Bank International AG
Reference Data
9 Months - 3rd Quarter 9 Months - 3rd Quarter As % of Year End As % of Year End As % of Year End As % of Year End As % of
USDm EURm Assets EURm Assets EURm Assets EURm Assets EURm Assets
A. Off-Balance Sheet Items
1. Managed Securitized Assets Reported Off-Balance Sheet n.a. n.a. - n.a. - n.a. - n.a. - n.a. -
2. Other off-balance sheet exposure to securitizations n.a. n.a. - n.a. - n.a. - n.a. - n.a. -
3. Guarantees n.a. n.a. - n.a. - n.a. - n.a. - n.a. -
4. Acceptances and documentary credits reported off-balance sheet n.a. n.a. - n.a. - n.a. - n.a. - n.a. -
5. Committed Credit Lines n.a. n.a. - 11,992.5 9.14 5,395.1 7.07 6,342.9 7.43 8,080.9 11.11
6. Other Contingent Liabilities n.a. n.a. - 11,855.5 9.04 4,667.7 6.12 5,052.4 5.92 4,598.5 6.32
7. Total Business Volume 200,334.9 148,368.0 100.00 155,021.1 118.18 86,338.1 113.19 96,792.3 113.34 85,422.2 117.43
8. Memo: Total Weighted Risks 136,173.4 100,850.0 67.97 94,793.7 72.27 64,065.1 83.99 72,077.3 84.40 53,905.6 74.10
9. Fitch Adjustments to Weighted Risks. n.a. n.a. - n.a. - n.a. - n.a. - n.a. -
10. Fitch Adjusted Weighted Risks 136,173.4 100,850.0 67.97 94,793.7 72.27 64,065.1 83.99 72,077.3 84.40 53,905.6 74.10
B. Average Balance Sheet
Average Loans 105,816.2 78,367.5 52.82 56,321.8 42.94 53,884.3 70.64 54,469.7 63.78 41,939.8 57.65
Average Earning Assets 174,185.7 129,001.9 86.95 80,326.6 61.24 70,798.5 92.82 71,786.1 84.06 57,073.4 78.46
Average Assets 187,874.4 139,139.8 93.78 87,702.5 66.86 79,387.9 104.08 79,612.9 93.23 63,751.3 87.64
Average Managed Securitized Assets (OBS) n.a. n.a. - n.a. - n.a. - n.a. - n.a. -
Average Interest-Bearing Liabilities 169,605.3 125,609.7 84.66 77,847.4 59.35 71,515.0 93.76 71,562.8 83.80 57,212.3 78.65
Average Common equity 9,241.8 6,844.5 4.61 6,230.7 4.75 5,043.8 6.61 5,908.2 6.92 4,707.7 6.47
Average Equity 10,769.2 7,975.7 5.38 7,298.4 5.56 6,442.3 8.45 6,795.4 7.96 5,401.9 7.43
Average Customer Deposits 84,748.6 62,764.8 42.30 45,862.1 34.96 42,520.7 55.75 42,757.1 50.07 36,437.8 50.09
C. Maturities
Asset Maturities:
Loans & Advances < 3 months n.a. n.a. - 19,426.3 14.81 11,808.9 15.48 12,547.4 14.69 11,154.3 15.33
Loans & Advances 3 - 12 Months n.a. n.a. - 13,704.0 10.45 9,683.0 12.69 11,659.7 13.65 10,161.2 13.97
Loans and Advances 1 - 5 Years n.a. n.a. - 26,393.4 20.12 15,509.4 20.33 18,755.5 21.96 16,613.6 22.84
Loans & Advances > 5 years n.a. n.a. - 16,133.3 12.30 13,513.7 17.72 13,298.4 15.57 9,847.5 13.54
Debt Securities < 3 Months n.a. n.a. - n.a. - n.a. - n.a. - n.a. -
Debt Securities 3 - 12 Months n.a. n.a. - n.a. - n.a. - n.a. - n.a. -
Debt Securities 1 - 5 Years n.a. n.a. - n.a. - n.a. - n.a. - n.a. -
Debt Securities > 5 Years n.a. n.a. - n.a. - n.a. - n.a. - n.a. -
Interbank < 3 Months n.a. n.a. - 16,405.6 12.51 9,684.6 12.70 15,393.2 18.03 14,225.3 19.56
Interbank 3 - 12 Months n.a. n.a. - 2,004.7 1.53 506.6 0.66 419.9 0.49 375.8 0.52
Interbank 1 - 5 Years n.a. n.a. - 2,266.2 1.73 78.6 0.10 298.2 0.35 50.7 0.07
Interbank > 5 Years n.a. n.a. - 855.8 0.65 40.4 0.05 56.7 0.07 65.5 0.09
Liability Maturities:
Retail Deposits < 3 months n.a. n.a. - 43,798.2 33.39 33,245.6 43.59 n.a. - n.a. -
Retail Deposits 3 - 12 Months n.a. n.a. - 8,648.1 6.59 6,892.0 9.04 n.a. - n.a. -
Retail Deposits 1 - 5 Years n.a. n.a. - 3,115.8 2.38 2,330.2 3.05 n.a. - n.a. -
Retail Deposits > 5 Years n.a. n.a. - 2,071.1 1.58 110.4 0.14 n.a. - n.a. -
Other Deposits < 3 Months n.a. n.a. - n.a. - 3,145.1 4.12 34,840.1 40.80 33,509.2 46.07
Other Deposits 3 - 12 Months n.a. n.a. - n.a. - n.a. - 7,577.9 8.87 5,048.6 6.94
Other Deposits 1 - 5 Years n.a. n.a. - n.a. - n.a. - 1,788.0 2.09 1,899.4 2.61
Other Deposits > 5 Years n.a. n.a. - n.a. - n.a. - n.a. - n.a. -
Interbank < 3 Months n.a. n.a. - 16,969.7 12.94 562.1 0.74 6,071.0 7.11 5,157.5 7.09
Interbank 3 - 12 Months n.a. n.a. - 6,290.9 4.80 5,474.3 7.18 5,851.2 6.85 5,542.3 7.62
Interbank 1 - 5 Years n.a. n.a. - 7,954.4 6.06 10,040.9 13.16 14,291.0 16.73 9,227.2 12.68
Interbank > 5 Years n.a. n.a. - 2,444.2 1.86 887.8 1.16 n.a. - n.a. -
Senior Debt Maturing < 3 months n.a. n.a. - n.a. - n.a. - n.a. - n.a. -
Senior Debt Maturing 3-12 Months n.a. n.a. - n.a. - n.a. - n.a. - n.a. -
Senior Debt Maturing 1- 5 Years n.a. n.a. - n.a. - n.a. - n.a. - n.a. -
Senior Debt Maturing > 5 Years n.a. n.a. - n.a. - n.a. - n.a. - n.a. -
Total Senior Debt on Balance Sheet n.a. n.a. - n.a. - n.a. - n.a. - n.a. -
Fair Value Portion of Senior Debt n.a. n.a. - n.a. - n.a. - n.a. - n.a. -
Covered Bonds n.a. n.a. - n.a. - n.a. - n.a. - n.a. -
Subordinated Debt Maturing < 3 months n.a. n.a. - n.a. - n.a. - n.a. - n.a. -
Subordinated Debt Maturing 3-12 Months n.a. n.a. - n.a. - n.a. - n.a. - n.a. -
Subordinated Debt Maturing 1- 5 Year n.a. n.a. - n.a. - n.a. - n.a. - n.a. -
Subordinated Debt Maturing > 5 Years n.a. n.a. - n.a. - n.a. - n.a. - n.a. -
Total Subordinated Debt on Balance Sheet 4,426.1 3,278.0 2.21 3,182.0 2.43 1,301.3 1.71 1,684.5 1.97 1,531.8 2.11
Fair Value Portion of Subordinated Debt n.a. n.a. - n.a. - n.a. - n.a. - n.a. -
D. Equity Reconciliation
1. Equity 10,595.5 7,847.0 5.29 7,903.9 6.03 6,400.1 8.39 6,518.2 7.63 6,622.1 9.10
2. Add: Pref. Shares and Hybrid Capital accounted for as Equity 3,375.6 2,500.0 1.68 2,500.0 1.91 600.0 0.79 n.a. - n.a. -
3. Add: Other Adjustments n.a. n.a. - n.a. - n.a. - n.a. - n.a. -
4. Published Equity n.a. n.a. - n.a. - 7,000.1 9.18 n.a. - n.a. -
E. Fitch Eligible Capital Reconciliation
1. Total Equity as reported (including non-controlling interests) 10,595.5 7,847.0 5.29 7,903.9 6.03 6,400.1 8.39 6,518.2 7.63 6,622.1 9.10
2. Fair value effect incl in own debt/borrowings at fv on the B/S- CC only 0.0 0.0 0.00 0.0 0.00 0.0 0.00 n.a. - n.a. -
3. Non-loss-absorbing non-controlling interests 0.0 0.0 0.00 0.0 0.00 0.0 0.00 n.a. - n.a. -
4. Goodwill 789.9 585.0 0.39 613.7 0.47 581.4 0.76 610.2 0.71 757.0 1.04
5. Other intangibles 819.6 607.0 0.41 606.1 0.46 390.5 0.51 341.7 0.40 379.8 0.52
6. Deferred tax assets deduction 364.3 269.8 0.18 269.8 0.21 79.1 0.10 89.8 0.11 n.a. -
7. Net asset value of insurance subsidiaries 0.0 0.0 0.00 0.0 0.00 0.0 0.00 n.a. - n.a. -
8. First loss tranches of off-balance sheet securitizations 0.0 0.0 0.00 0.0 0.00 0.0 0.00 n.a. - n.a. -
9. Fitch Core Capital 8,621.7 6,385.2 4.30 6,414.3 4.89 5,349.1 7.01 n.a. - n.a. -
10. Eligible weighted Hybrid capital 1,012.7 750.0 0.51 750.0 0.57 600.0 0.79 n.a. - n.a. -
11. Government held Hybrid Capital 2,362.9 1,750.0 1.18 1,750.0 1.33 0.0 0.00 n.a. - n.a. -
12. Fitch Eligible Capital 11,997.3 8,885.2 5.99 8,914.3 6.80 5,949.1 7.80 n.a. - n.a. -
13. Eligible Hybrid Capital Limit 3,695.0 2,736.5 1.84 2,749.0 2.10 2,292.5 3.01 n.a. - n.a. -
Exchange Rate
31 Dec 2007
USD1 = EUR0.67930
31 Dec 2009
USD1 = EUR0.69416
31 Dec 2008
USD1 = EUR0.71855
30 Sep 2011
USD1 = EUR0.74060
31 Dec 2010
USD1 = EUR0.74840

Banks
Raiffeisen Bank International AG
March 2012 18
The ratings above were solicited by, or on behalf of, the issuer, and therefore, Fitch has been compensated for the provision of the ratings.
ALL FITCH CREDIT RATINGS ARE SUBJECT TO CERTAIN LIMITATIONS AND DISCLAIMERS. PLEASE READ THESE LIMITATIONS AND DISCLAIMERS BY FOLLOWING THIS LINK: HTTP://FITCHRATINGS.COM/UNDERSTANDINGCREDITRATINGS. IN ADDITION, RATING DEFINITIONS AND THE TERMS OF USE OF SUCH RATINGS ARE AVAILABLE ON THE AGENCY'S PUBLIC WEB SITE AT WWW.FITCHRATINGS.COM. PUBLISHED RATINGS, CRITERIA, AND METHODOLOGIES ARE AVAILABLE FROM THIS SITE AT ALL TIMES. FITCH'S CODE OF CONDUCT, CONFIDENTIALITY, CONFLICTS OF INTEREST, AFFILIATE FIREWALL, COMPLIANCE, AND OTHER RELEVANT POLICIES AND PROCEDURES ARE ALSO AVAILABLE FROM THE CODE OF CONDUCT SECTION OF THIS SITE.
Copyright © 2012 by Fitch, Inc., Fitch Ratings Ltd. and its subsidiaries. One State Street Plaza, NY, NY 10004.Telephone: 1-800-753-4824, (212) 908-0500. Fax: (212) 480-4435. Reproduction or retransmission in whole or in part is prohibited except by permission. All rights reserved. In issuing and maintaining its ratings, Fitch relies on factual information it receives from issuers and underwriters and from other sources Fitch believes to be credible. Fitch conducts a reasonable investigation of the factual information relied upon by it in accordance with its ratings methodology, and obtains reasonable verification of that information from independent sources, to the extent such sources are available for a given security or in a given jurisdiction. The manner of Fitch‟s factual investigation and the scope of the third-party verification it obtains will vary depending on the nature of the rated security and its issuer, the requirements and practices in the jurisdiction in which the rated security is offered and sold and/or the issuer is located, the availability and nature of relevant public information, access to the management of the issuer and its advisers, the availability of pre-existing third-party verifications such as audit reports, agreed-upon procedures letters, appraisals, actuarial reports, engineering reports, legal opinions and other reports provided by third parties, the availability of independent and competent third-party verification sources with respect to the particular security or in the particular jurisdiction of the issuer, and a variety of other factors. Users of Fitch‟s ratings should understand that neither an enhanced factual investigation nor any third-party verification can ensure that all of the information Fitch relies on in connection with a rating will be accurate and complete. Ultimately, the issuer and its advisers are responsible for the accuracy of the information they provide to Fitch and to the market in offering documents and other reports. In issuing its ratings Fitch must rely on the work of experts, including independent auditors with respect to financial statements and attorneys with respect to legal and tax matters. Further, ratings are inherently forward-looking and embody assumptions and predictions about future events that by their nature cannot be verified as facts. As a result, despite any verification of current facts, ratings can be affected by future events or conditions that were not anticipated at the time a rating was issued or affirmed.
The information in this report is provided “as is” without any representation or warranty of any kind. A Fitch rating is an opinion as to the creditworthiness of a security. This opinion is based on established criteria and methodologies that Fitch is continuously evaluating and updating. Therefore, ratings are the collective work product of Fitch and no individual, or group of individuals, is solely responsible for a rating. The rating does not address the risk of loss due to risks other than credit risk, unless such risk is specifically mentioned. Fitch is not engaged in the offer or sale of any security. All Fitch reports have shared authorship. Individuals identified in a Fitch report were involved in, but are not solely responsible for, the opinions stated therein. The individuals are named for contact purposes only. A report providing a Fitch rating is neither a prospectus nor a substitute for the information assembled, verified and presented to investors by the issuer and its agents in connection with the sale of the securities. Ratings may be changed or withdrawn at anytime for any reason in the sole discretion of Fitch. Fitch does not provide investment advice of any sort. Ratings are not a recommendation to buy, sell, or hold any security. Ratings do not comment on the adequacy of market price, the suitability of any security for a particular investor, or the tax-exempt nature or taxability of payments made in respect to any security. Fitch receives fees from issuers, insurers, guarantors, other obligors, and underwriters for rating securities. Such fees generally vary from US$1,000 to US$750,000 (or the applicable currency equivalent) per issue. In certain cases, Fitch will rate all or a number of issues issued by a particular issuer, or insured or guaranteed by a particular insurer or guarantor, for a single annual fee. Such fees are expected to vary from US$10,000 to US$1,500,000 (or the applicable currency equivalent). The assignment, publication, or dissemination of a rating by Fitch shall not constitute a consent by Fitch to use its name as an expert in connection with any registration statement filed under the United States securities laws, the Financial Services and Markets Act of 2000 of Great Britain, or the securities laws of any particular jurisdiction. Due to the relative efficiency of electronic publishing and distribution, Fi tch research may be available to electronic subscribers up to three days earlier than to print subscribers.


