

Functional dimensioning and tolerancing software forconcurrent engineering applications
M.N. Islam*
Department of Mechanical Engineering, Pohang University of Science and Technology, San 31 Hyoja-dong,
Nam-gu, Pohang, Kyungbuk 790-784, South Korea
Received 18 September 2002; accepted 13 September 2003
Abstract
This paper describes the development of a prototype software package for solving functional dimensioning and tolerancing
(FD&T) problems in a Concurrent Engineering environment. It provides a systematic way of converting functional requirements
of a product into dimensional specifications by means of the following steps: firstly, the relationships necessary for solving
FD&T problems are represented in a matrix form, known as functional requirements/dimensions (FR/D) matrix. Secondly, the
values of dimensions and tolerances are then determined by satisfying all these relationships represented in a FR/D matrix by
applying a comprehensive strategy which includes: tolerance allocation strategies for different types of FD&T problems and for
determining an optimum solution order for coupled functional equations. The prototype software is evaluated by its potential
users, and the results indicate that it can be an effective computer-based tool for solving FD&T problems in a CE environment.
# 2003 Elsevier B.V. All rights reserved.
Keywords: Functional dimensioning and tolerancing; Concurrent engineering; Tolerance allocation
1. Introduction
Functional Dimensioning and Tolerancing (FD&T)
is a concept widely used for specifying dimensions
and tolerances of the component parts and sub-assem-
blies of a product according to their functional
requirements. These functional requirements arise
from all life cycle issues, such as manufacturing,
assembly and inspection. Concurrent Engineering
(CE) is an engineering and management philosophy,
which also deals with the life cycle issues of a product.
CE is based on the idea of carrying out as many stages
of product development concurrently as possible,
rather than in a sequential order. It calls for the
formation of a cross-functional product development
team, which includes people from a wide range of
departments, such as: product planning, design, man-
ufacture, assembly, quality assurance, marketing,
sales and finance.
Dimensions and tolerances influence almost all
aspects of product development which are of interest
to CE team members who consider all the life cycle
issues of a product during its design stage. Therefore, a
CE approach will be ideal for selection of dimensions
and tolerances through applications of FD&T metho-
dology. Furthermore, FD&T can serve as a common
link between all members of the CE team; hence it can
enhance the CE team performance [1,2]. It is also
argued in [3] that CE offers the best option for finding
the values of dimensions and tolerances using informal
optimization methods because the data required for
Computers in Industry 54 (2004) 169–190
* Tel.: þ82-54-279-8639; fax: þ82-54-279-5899.
E-mail address: [email protected] (M.N. Islam).
0166-3615/$ – see front matter # 2003 Elsevier B.V. All rights reserved.
doi:10.1016/j.compind.2003.09.006

application of formal optimization methods are often
not available at the early design stage.
However, for the successful implementation of
FD&T principles in a CE environment, appropriate
tools are needed. The development of such a tool is the
main objective of this project. It will be a computer-
based tool to be used by product development teams
for quick ‘what-if’ analyses for evaluation of different
design alternatives and their influences on dimensions
and tolerances.
2. Review of existing FD&T tools
The first commercially available 3D tolerance ana-
lysis software package VSA was introduced by Varia-
tion Systems Analysis Inc.1 in 1982 [4]. At present
there are a number of other tolerance calculation
software packages available in the market, such as
CETOL from Sigmetrix [6], DCS from Dimensional
Control Systems [7], Mechanical Advantage from
Cognition Corporation [8], Analytix from Saltire Soft-
ware [9], VALISYS from Tecnomatix [10], Crystal
Ball from Decision Engineering [11] and CATS-1D
XL from ADCATS [12].
VSA, CETOL and DCS are the three most popular
brands of the commercially available tolerance calcu-
lation packages. VSA and DCS were initially sup-
ported by the big three automotive manufacturers (i.e.
General Motors, Ford and Chrysler) and are widely
used in automotive industry. CETOL, previously
known as TI/TOL, was backed by Texas Instruments
and based on research carried out at Brigham Young
University’s ADCATS program. Its focus has been
mechanical aspects of electronically based products.
Detailed description of these packages and their
capabilities can be found on their respective websites;
only briefs are given below:
� VSA is 3D tolerance analysis software package
available as modules within a number of leading
CAD systems. It has a module for checking
parts’ Geometric Dimensioning and Tolerancing
(GD&T) schemes. It allows two types of simula-
tions for tolerance analysis: Monte Carlo simula-
tions and High-Low-Median (HLM) simulations.
Monte Carlo simulation method provides distribu-
tion curve and quality parameters of the total output
variation. In graphic mode it can handle three2 types
of distributions of the input tolerances: actual,
normal and Pearson. HLM analysis is based on
variance analysis technique and is used for deter-
mining the percent contribution of each input fac-
tors to the total output variation.
� CETOL is a 3D vector assembly modeling package
fully integrated with Pro/ENGINEER; a CATIA
version is due out this year. It has the capability
to apply three tolerance accumulation models:
Worst case (WC), root sum square (RSS) and mean
shift based on Six Sigma analysis. It can handle
normal and non-normal distribution of input toler-
ances. It does not require any simulation and pro-
vides three outputs, viz. distribution curve and
quality parameters of the total output, contribution
plot and sensitivity plot.
� DCS is a tolerance simulation software package
integrated with Mechanical Desktop CAD package.
It consists of two modules: 1-DCS for solving 1D
problems and 3DCS for solving multi-dimensional
problems. It has the capability to apply three tol-
erance accumulation models: WC, RSS and Monte
Carlo simulation. Monte Carlo simulation can use
different types of distributions for input variables. It
can also take actual part data and use it by direct
loading or selecting the best curve to fit the data.
� Mechanical Advantage comes as a module within
Mechanical Advantage CAD package. It is a fea-
ture-based variational geometry package which can
perform WC, RSS and Monte Carlo analysis.
� Analtix is a mechanism design and analysis soft-
ware package which runs on Microsoft Windows. It
has a tolerance analysis module for tolerance stack-
up calculations using RSS or WC accumulation
models. It is capable of performing a percent con-
tribution analysis.
� VALISYS is a 3D assembly stack-up analysis soft-
ware package which uses Monte Carlo simulation
technique for variation analysis. It is fully inte-
grated with Unigraphics CAD system and has a
module for GD&T syntax checking.
� Crystal Ball is a Windows Excel spreadsheet add-on
software and performs tolerance and risk analysis
1 Recently purchased by Electronic Data Systems (EDS) [5]. 2 Eight in text mode.
170 M.N. Islam / Computers in Industry 54 (2004) 169–190

through Monte Carlo simulation technique; the
distribution gallery contains 12 different distribu-
tions.
� CATS-1D XL is 1D tolerance stack-up analysis
package which runs on Windows Excel. It supports
four stack-up analysis models: WC, RSS, Six Sigma
and Measured Data; available free on ADCATS
website [12].
From this review, it is noted that the emphasis of these
packages has been on tolerance analysis and as such, are
not very helpful for FD&T which primarily deals with
tolerance allocation problems. These packages often
apply statistical tolerancing theories (Monte Carlo
simulation found to be the most popular one) for finding
the combined effect of the input tolerances (part toler-
ances) on the assembly tolerance. In principle they
could be used for ‘what-if’ analysis. However, gener-
ally they lack any intervention strategy. They are sui-
table for verifying the results once the part tolerances
and their distributions are known, but generally are not
suitable for use in a CE environment, where the prime
objective is to allocate part tolerances based on func-
tional requirements of the product. Moreover, to the
best of the author’s knowledge, none of the commer-
cially available software includes any strategy for
handling coupled loop equations, i.e. when two or more
functional equations are related to each other.
3. FD&T methodology
Although FD&T plays an important role in product
design it lacks a comprehensive systematic methodol-
ogy. Such a methodology is considered necessary for
the application of FD&T concepts into the CE envir-
onment. Therefore, a new methodology has been
developed [13–17] and the prototype software is based
on this. The main features of the methodology are:
� Establishment of clear links between the customer’s
and stakeholders’ needs of a product and its func-
tional requirements. These links will assist the CE
team to understand the product requirements and
how they are to be satisfied through dimensional
aspects of a design.
� Graphical representation of all relationships neces-
sary for solving FD&T problems in a matrix form
known as a Functional Requirements/Dimensions
(FR/D) matrix. This graphical representation will
provide the total picture of the FD&T problem and
assist in considering different controllable vari-
ables, such as dimensions, tolerances, and manu-
facturing processes, concurrently.
� Development of a tolerance allocation strategy
suitable for a CE environment. It considers manu-
facturing, assembly, and inspection requirements in
the selection of dimensions and tolerances. It also
applies informal cost optimization methods, thus
the need for cost-tolerance data is avoided.
� Development of a strategy for grouping and solving
coupled functional equations. This will improve the
efficiency of the solution search.
� Development of a comprehensive strategy for finding
the values of dimensions and tolerances of a product
with the help of a FR/D matrix. A number of com-
monly used cost minimization strategies such as the
use of standard parts, the use of preferred sizes, the
use of preferred fits and others, have been incorpo-
rated into the proposed methodology.
� Compilation of a database, which includes data on
preferred sizes, preferred fits, process capability
tolerances and others, required for solving FD&T
problems.
4. Conceptual design of the software
The conceptual design of the proposed software is
illustrated in Fig. 1. It contains three major parts: (i)
main program, (ii) solution library and (iii) database.
4.1. Main program
The functions of the main program (MatrixSolver)
are: (i) to put all relationships necessary for solving
FD&T problems in a matrix form; (ii) separating
FD&T problems into groups; (iii) finding an optimum
solution order of a group of coupled loop equations;
and (iv) storing and cross-checking the solution
results. The flow-diagram of MatrixSolver is illu-
strated in Fig. 2.
4.1.1. Module for formation of FR/D matrix
The centerpiece of the prototype software is the
FR/D matrix (Fig. 3). It is a multiple relationship
matrix, which makes it possible to visually represent
M.N. Islam / Computers in Industry 54 (2004) 169–190 171

the interaction of a number of interrelated sets of items
viz. functional requirements, dimensions and toler-
ances, and process capability tolerances. Different
types of relationships illustrated in the FR/D matrix
(Fig. 3) are described below. Numbers shown in boxes
refer to relationship types.
1. Along each row dimensions and tolerances are
tied to a functional requirement. This relationship
is expressed by a loop equation and is controlled
by the target value, which imposes performance
constraints on the selection of dimensions and
tolerances.
2. Each chosen tolerance must satisfy the process
capability requirements. This type of relationship
imposes manufacturing process constraints on the
choice of tolerances.
3. All tolerances viz. size and geometric tolerances,
and surface texture parameters of a feature are
controlled by the process for manufacturing that
feature and should be compatible.
4. All dimensions, both functional and non-func-
tional, within a part are related through the parts
process plan and these relationships have profound
effects on the manufacturing cost of the product.
5. If one or more dimensions are shared by two or
more functional equations then the functional
equations are called coupled functional equations.
Coupled functional requirements should be solved
simultaneously.
Besides relationships among functional require-
ments, dimensions and tolerances, and process para-
meters, the FR/D matrix illustrates some other
information viz. target values, relationships (loop
equations), and types of functional requirement and
target differences. The target difference is the differ-
ence between the value calculated by functional con-
strains and the specified target value. The target
difference column will be helpful during the search
for a solution of the FR/D matrix.
4.1.2. Module for separating FD&T problems
into groups
The management of the FR/D matrix becomes more
difficult as the number of functional requirements
grow. However, it is anticipated that not all functional
equations will be related to each other. Therefore, it is
proposed to consider related functional equations as a
group which allows the CE team to concentrate on a
particular area in the FR/D matrix without losing sight
of the overall picture. This grouping is based on the
interrelationships between the functional equations
(relationship type 5 illustrated in Fig. 3).
Main Program (MatrixSolver) Database
Preferred Sizes Table Preferred Tolerances Table
Preferred Fit TableLimits and Fits Table
Standard TolerancesProcess Capability Data
Solution Library
Module for Solving Fitting Feature Problems (FitSolver)
Module for Solving LengthDimension Problems (LengthSolver)
Module for Solving MixedType Problems (MixSolver)
Module for Solving SurfaceTexture Problems (SurfaceSolver)
Module for Formation of FR/D Matrix
Module for Separating FD&T Problems into Groups
Module for Finding Optimum Solution Order
Module for Sorting and Crosschecking Solutions
Fig. 1. Conceptual design of the prototype software.
172 M.N. Islam / Computers in Industry 54 (2004) 169–190

Enter number of FRs
Enter FRs with their IDs Module for Separating FRs
into Groups
Enter number of parts
Select a FR
Enter part names
Module for Finding Optimum
Revise? Solution Order
No
Enter relationships between
FRs and parts
Enter details of relationships
between FRs and parts Module of Storing and
Cr osschecking Solutions
Enter type of FR
Enter relationships and
their target values
Preliminary FR/D matrix
Yes
Complete FR/D matrix
A
START
A coupled FR?
Yes
Solved all FRsin the group?
No Solved all FRs in FR/D
matrix?
STOP
Yes
Solution Library
Solved FR
No
Enter proposed tolerance values (if desired)
Enter proposed manufacturing processes and their capability
details
Enter purchased parts details
A
No
Solved FR/D matrix
Fig. 2. Flow diagram of MatrixSolver.
M.N. Islam / Computers in Industry 54 (2004) 169–190 173

Fig. 3. Types of relationships illustrated in FR/D matrix.
17
4M
.N.
Islam
/Co
mp
uters
inIn
du
stry5
4(2
00
4)
16
9–
19
0
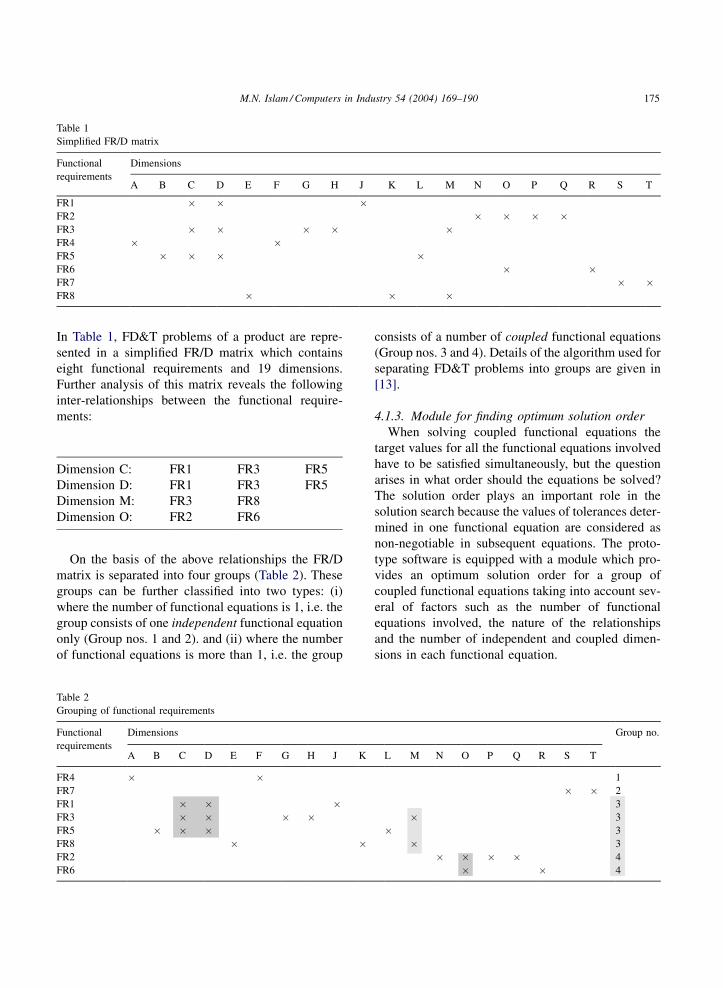
In Table 1, FD&T problems of a product are repre-
sented in a simplified FR/D matrix which contains
eight functional requirements and 19 dimensions.
Further analysis of this matrix reveals the following
inter-relationships between the functional require-
ments:
On the basis of the above relationships the FR/D
matrix is separated into four groups (Table 2). These
groups can be further classified into two types: (i)
where the number of functional equations is 1, i.e. the
group consists of one independent functional equation
only (Group nos. 1 and 2). and (ii) where the number
of functional equations is more than 1, i.e. the group
consists of a number of coupled functional equations
(Group nos. 3 and 4). Details of the algorithm used for
separating FD&T problems into groups are given in
[13].
4.1.3. Module for finding optimum solution order
When solving coupled functional equations the
target values for all the functional equations involved
have to be satisfied simultaneously, but the question
arises in what order should the equations be solved?
The solution order plays an important role in the
solution search because the values of tolerances deter-
mined in one functional equation are considered as
non-negotiable in subsequent equations. The proto-
type software is equipped with a module which pro-
vides an optimum solution order for a group of
coupled functional equations taking into account sev-
eral of factors such as the number of functional
equations involved, the nature of the relationships
and the number of independent and coupled dimen-
sions in each functional equation.
Table 1
Simplified FR/D matrix
Functional
requirements
Dimensions
A B C D E F G H J K L M N O P Q R S T
FR1 � � �FR2 � � � �FR3 � � � � �FR4 � �FR5 � � � �FR6 � �FR7 � �FR8 � � �
Dimension C: FR1 FR3 FR5
Dimension D: FR1 FR3 FR5
Dimension M: FR3 FR8
Dimension O: FR2 FR6
Table 2
Grouping of functional requirements
Functional
requirements
Dimensions Group no.
A B C D E F G H J K L M N O P Q R S T
FR4 � � 1
FR7 � � 2
FR1 � � � 3
FR3 � � � � � 3
FR5 � � � � 3
FR8 � � � 3
FR2 � � � � 4
FR6 � � 4
M.N. Islam / Computers in Industry 54 (2004) 169–190 175

This strategy is based on the following observa-
tions:
1. When functional equations are solved as coupled,
the number of choices for selection of values of
tolerances decreases gradually and decisions,
made in earlier equation, restrict the choice of
decisions in subsequent equations. It is proposed
to generate all the possible combinations of
solution sequences and then select the solution
sequence with minimum restricting effect of
coupled variables.
2. The functional equations with a greater number of
variables are easier to solve. This can be explained
by the fact that tolerance allocation is an economic
trade-off and the greater the number of variables
in a functional equation, the greater the flexibility.
Therefore, a functional equation with the lowest
number of independent variables will get pre-
ference over functional equations with a greater
number of independent variables.
Detailed treatment of this strategy can be found in
[17].
4.1.4. Module for storing and cross-checking
solutions
This module allows the user to save the project data
between each session. It is also applied for checking
whether all relationships illustrated in FR/D matrix in
Fig. 3 are fulfilled.
4.2. Solution library for different types of
FD&T problems
Different types of problems require different solu-
tion strategies. Therefore, it is proposed to build a
solution library for dealing with different FD&T
problems common to most engineering designs. How-
ever, due to the diverse range of problems involved, it
is not possible to include solution procedures for all
types of FD&T problems in the proposed software.
Therefore, at this stage, only four types of FD&T
problems are included, viz. fitting feature problems,
length dimension problems, mixed type of problems
(i.e. combination of length dimension problem and
fitting feature problem), and surface texture problems.
Here it should be noted that if desired, the solution
library can be expanded without interfering with the
proposed overall strategy. The strategies for solving
different types of FD&T problems adopted in the
prototype software are primarily from Gladman [18]
which are modified to suit computer applications.
4.2.1. Strategy for solving fitting feature problems
The fitting feature problem is one of the most
frequently encountered type of FD&T problems in
engineering design. It consists of an assembly between
two parts with cylindrical features: (i) one part with an
internal cylindrical feature, by convention referred to
as a hole, and (ii) another part with an external
cylindrical feature by convention referred to as a shaft.
The prototype software has a module (FitSolver) for
dealing with fitting feature problems. The flow dia-
gram of FitSolver is illustrated in Fig. 4. The solution
procedure for fitting feature problems depends on the
form in which the target values are specified. How-
ever, the first few steps involving selection of basic
sizes and selection of a fit system in the solution search
are the same for all cases as illustrated in Fig. 4. The
prototype software also provides two options for the
selection of a fit (i) select a fit and then select a suitable
manufacturing process and (ii) select a manufacturing
process and then find a suitable fit.
The target value of a fitting feature problem is
usually specified in one of the following forms:
1. general description (e.g. close running fit);
2. minimum and maximum clearance (Cmin, Cmax);
3. mean fit and variation (MF � VAR);
4. specification (e.g. H7f7).
The first form for specifying the target values of a
fitting feature problem is a general description of the
fit. This description expresses the type of fit according
to its function, e.g. precision fit, close running fit, etc.
In this case, the first step in the solution search is to
identify the fits suitable for that description from the
Preferred Fits Table. The final selection is made on the
basis of fit quality, i.e. normal, coarse, etc.
The second and the third form for specifying the
target values of a fitting feature problem are clearance
conditions. These two forms are equivalent. The
clearance conditions such minimum clearance (Cmin),
maximum clearance (Cmax), mean fit (MF) and varia-
tions (VAR) can be calculated using the following
formulas where LDH is lower deviation for the hole,
UDH is the upper deviation for the shaft, th is tolerance
176 M.N. Islam / Computers in Industry 54 (2004) 169–190

value for the hole and ts is the tolerance value for the
shaft.
Cmin ¼ LDH þ UDS (1)
Cmax ¼ Cmin þ th þ ts (2)
MF ¼ 12ðCmin þ CmaxÞ (3)
VAR ¼ � 12ðth þ tsÞ (4)
Select target requirement type
Enter target requirements
Enter symbolic dimensions
Select fit system
Enter basic size
Fit description Fit specification
No
START
Final Results FitSolver
STOP
Yes Enter values of non-negotiable
BA
Fit/ProcessProcess/Fit
Proposed manuf. processes Select fit searching database
Select fit ranking criteria
Select a fit from fit ranking table
Select manufacturing processes
Select fit ranking criteria
Select a fit from fit ranking table
Tolerance evaluation
Fit/Process
Select fit option
Select manufac. processesTolerance evaluation
A
Proposed manuf. processes
Non-negotiabledimensions?
Target requirement type?
Select search strategy
Clearance conditions
Validate fit description
Select search strategy
STOP
Process/Fit
Vlidate fit Specification
Select manuf. processes
B
Final Results FitSolver
STOP
Final Results FitSolver
Fig. 4. Flow diagram of FitSolver.
M.N. Islam / Computers in Industry 54 (2004) 169–190 177

For a hole-based fit,
LDH ¼ 0 and Cmin ¼ UDS (5)
For a shaft-based fit,
UDH ¼ 0 and Cmin ¼ LDH (6)
A new computer-based strategy has been developed
for selection of fits when clearance conditions are
given this consists of the following steps:
� Select fit selection criteria. There are differences of
opinion among designers about the use of particular
clearance conditions for fit selection [19]. The
prototype software package leaves the choice to
the user.
� Considering production costs, select a suitable fit
system, i.e. hole-based or shaft-based.
� Based on Eq. (5) or (6), select three shaft specifica-
tions for a hole (or three hole specifications for a
shaft) from the Limits and Fits Table [20] which are
nearest to the given value of Cmin.
� Vary hole and shaft IT grades between 5 and 12.
� For each combination calculate hole and shaft
tolerance values,
� Calculate variations from hole and shaft tolerance
values.
� Compare the calculated values with the given value
of variation.
� Pick combinations for which the differences are
least and rank them according to the criteria set by
the user.
� Compare each fit combination with preferred fits
stored in the database and show the findings.
� Illustrate the results in a tabular form known as Fit
Ranking Table.
The fourth form for expressing the target value of a
fit is fit specification. When the basic size is selected
the fit specification is sufficient to calculate the hole
and the shaft dimensions and tolerances using the
Limits and Fits Table [20].
Fitting features may contain non-negotiable dimen-
sions coming from purchased or existing parts. Exam-
ples of such component parts are: gears, pulleys, oil
seals, bearings, bushings, dowel pins, etc. FitSolver
can handle this type of fitting feature problems also.
In this case the designer has to specify only one
element of the fitting feature. In effect, non-negotiable
dimensions impose additional constraints on the solu-
tion search.
4.2.2. Strategy for solving length dimension
problems
Length dimension problem is another type of FD&T
problem frequently encountered in engineering
designs. It usually consists of two or more component
parts and deals with the dimensioning and tolerancing
of their length dimensions.3 In general, a functional
equation of a length dimension problem has the
following form:
ðZ � zÞ ¼Xn
i¼1
AiSiðXi � xiÞ (7)
where Z is the functional requirement (basic size), z
the functional requirement (size tolerance), Ai the sign
constants 1 or �1, Si the sensitivity factors, Xi the
functional dimensions (basic size), and xi is the func-
tional dimensions (size tolerance).
Applying the method of extremes to Eq. (7) it can be
shown that
Z ¼Xn
i¼1
AiSiXi (8)
and
z ¼Xn
i¼1
Sixi (9)
The prototype software has a module (LengthSol-
ver) for dealing with length dimension problems.
The flow chart of LengthSolver is shown in Fig. 5. It
uses Eq. (8) for selecting basic sizes. The usual
approach is to select all but one basic size, the
remaining one is calculated to satisfy Eq. (8). The
strategy is to select as many basic sizes as possible
from preferred sizes. Eq. (9), known as a tolerance
equation, is used for selection of individual tolerance
values. LengthSolver can also handle non-negotiable
dimensions.
For allocating the individual tolerance values a new
tolerance allocation strategy suitable for CE environ-
ment was applied. The strategy is based on a variation
3 Length dimensions are usually defined by distance between
two parallel planes.
178 M.N. Islam / Computers in Industry 54 (2004) 169–190

of tolerance allocation by the process capability model
proposed by Farmer [21] detail of which can be found
in [16]. The main steps of this strategy are described
below:
� To begin, the CE team needs to consider the pro-
duction of each part and propose manufacturing
processes which they think are the most suitable and
least costly for the manufacture of each feature.
� The next step is to find the achievable process
capability tolerances of all the dimensions with
the proposed manufacturing processes. The team
may consult the Process Capability database and
determine the IT grade range for each proposed
manufacturing process under average conditions.
� Then the CE team will assess the difficulty of
producing the feature by considering factors which
they feel may contribute to the particular case.
Fig. 5. Flow diagram of LengthSolver.
M.N. Islam / Computers in Industry 54 (2004) 169–190 179

On the basis of this assessment the CE team can
select the IT grade, which they think is achievable
� Based on the achievable IT grade and the selected
basic size the CE team is now able to calculate the
achievable process capability tolerance under real
conditions for each dimension and proposed man-
ufacturing process.
� The CE team selects the tolerance values equal to or
greater than the achievable process capability tol-
erance values for each dimension.
� It is proposed to enlarge the process capability
tolerances by safety factors to account for the
degree of uncertainty of process capability data
used.
� The CE team then selects tolerance values for each
dimension based on enlarged process capability
tolerance. If desired, the selected tolerance values
can be adjusted to standard values (preferred tol-
erances).
� The methodology also allows some or all of the
tolerance values be proposed by the CE team.4 In
search of an optimum solution these will have a
higher priority than other tolerances in the system
although all the proposed tolerance values must be
compatible with the proposed process capability
tolerances.
� The next step is to calculate the residual tolerance,
which is the difference between the available
tolerance band and the sum of all selected toler-
ance values. A negative value of residual tolerance
will indicate the target tolerance requirement has
not been met and some corrective action is neces-
sary.
� When a corrective action is necessary, the software
calculates the percentage change required for each
tolerance which shows the improvement necessary
to fulfill a target tolerance requirement if only one
process is altered. However, if necessary, the CE
team may decide to combine or change more than
one process rather than change only one.
� After deciding which process(es) is (are) to be
changed the CE team can recalculate the residual
tolerance and evaluate the outcome.
� The process is repeated until an acceptable solution
is found.
4.2.3. Strategy for solving mixed-type problems
Often fitting feature and length dimension problems
are combined. In this paper, these are termed mixed-
type problems. It is a length dimension problem where
one or more fitting feature problems are embedded
within the dimension loop. In general, mixed-type
problems have the following form:
ðZ � zÞ ¼Xp
i¼1
ðFFÞi þXq
i¼1
AiSiðXi � xiÞ (10)
where (FF)i is the length variations resulting from
pairs of fitting features, p the number of pair of fitting
features, q the number of length dimensions, Ai the
sign constants 1 or �1, Si the sensitivity factors, Xi the
functional dimensions (basic size), and xi the func-
tional dimensions (size tolerance).
For fitting features the choice of dimensions and
tolerances of the mating parts are restricted and the
proposed strategy assigns a higher priority in their
solution search over others. Thus, by solving fitting
features first, the mixed type of problem will be
converted into a length dimension problem. After
solving each fitting feature problem the target value
must be modified. For this modification the sign of the
clearance of each fitting feature has to be considered.
When a clearance is negative, i.e. interference fit, the
influence of that fit on the target value of the mixed-
type problem is neglected.
4.2.4. Strategy for solving surface texture problems
The solution of surface texture problems refers to
finding manufacturing processes which can be used
for achieving the specified Ra value. This is done by
consulting process capability databases containing
relationships between surface texture parameters
and manufacturing process. Examples of such rela-
tionships between surface texture parameters (Ra
values) and different machining processes are given
in Appendix C of AS1100.201-1992 [22].
4.3. Database for solving FD&T problems
The third major part of the prototype software is a
database containing information required for solving
4 Experienced designers tend to allocate tolerance values based
on past experience and while a formal method should always be
encouraged, there may be situations where previous experience will
prove to be beneficial.
180 M.N. Islam / Computers in Industry 54 (2004) 169–190

FD&T problems such as: preferred sizes table; pre-
ferred tolerances table; preferred fits table; limits and
fits table; fit application table, standard tolerances, and
process capability. Data adopted in the prototype
software are indicative only and are based on cap-
abilities of different processes under average condi-
tions gathered from different sources [18–24] reported
in literature. The process capability database contains
data on the process capability tolerances expressed in
IT grades and process capability surface texture para-
meter Ra values expressed in microns. The database
can be accessed from any part of the program; how-
ever, it can be updated only at the beginning of the
program.
5. Software development
The prototype software, Functional Dimensioning
and Tolerancing (FDT), has been developed using
Microsoft Visual Basic (Version 4.0, Professional
Edition) software development package. It has a menu
system of five titles viz. File, Revise, Database,
Results, and Help. Navigation between forms is per-
formed through clicking the Confirm and Previous
buttons placed at the bottom of the screen. All data
entry points are protected against entering the wrong
type of data. Not only that, where applicable, entered
data is checked for any errors of logic, such as target
values where Cmin cannot be greater than Cmax.
FDT starts with a screen where the user has two
options: (i) solve a group of loop equations and (ii)
solve one loop equation only. The main program
(MatrixSolver) deals with the first option. When the
second option is selected it solves one loop equation
by calling a particular module from the solution
library. The advantage of solving one loop equation
without the use of the main program is that it will
obviously save time because it will not represent the
problem in a matrix form.
6. Solved examples
To demonstrate the effectiveness of the prototype
software the following two examples have been
solved. The steps involved in solving these two exam-
ples are described below.
6.1. Problem no. 1
This problem is taken from Chase and Greenwood
[25] first introduced by Fortini [26]. The target values
are changed to demonstrate the effectiveness of the
strategy (all dimensions are in mm).
Functional requirements:
� Shafts endplay: (Z � z) (clearance in Fig. 6).
� Target values: ðZ � zÞ ¼ 0:5 � 0:266.
Functional equation:
ðZ � zÞ ¼ �ðA � aÞ þ ðB � bÞ � ðC � cÞ þ ðD � dÞ� ðE � eÞ þ ðF � f Þ � ðG � gÞ (11)
Purchased parts:
� Retaining ring, ðA � aÞ ¼ ð1:283 � 0:019Þ.� Bearing, ðC � cÞ ¼ ð12:936 � 0:032Þ.� Bearing, ðG � gÞ ¼ ð12:936 � 0:032Þ.
6.1.1. Solution
This is a length dimension problem represented by a
single functional equation; therefore, the LengthSol-
ver module was used for the solution. This assembly
contains three purchased parts; their dimensions are
non-negotiable and were taken out of both basic size
and tolerance equations. Fig. 7 shows the initially the
CE team proposed turning operation with IT grade 9
and capability index 1.33 for manufacture of the
remaining features. However, this proposal is not
acceptable because of negative residual tolerance
(�0.0177 mm). Fig. 7 also reveals that the problem
could be rectified by changing the process used for
Fig. 6. Shaft and bearing assembly [25].
M.N. Islam / Computers in Industry 54 (2004) 169–190 181

Fig. 7. Screen print showing the intervention strategy of LengthSolver.
Fig. 8. Screen print showing ‘what-if’ capability of LengthSolver.
182 M.N. Islam / Computers in Industry 54 (2004) 169–190

producing dimensions B or E by 1 IT grade (24%
reduction), whereas for achieving the same goal the IT
grade for the process used for the manufacture of
dimension D or F had to be reduced by 3 (68%
reduction). On this basis the CE team decided to
change the manufacturing operation for producing
the dimension B to fine turning with IT grade 8 and
capability index 1.33. Fig. 8 illustrates that where the
proposed manufacturing processes are acceptable
(residual tolerance þ0.093 mm), some of the proposed
tolerance values (d and f) are not compatible with the
process capability tolerances. At this stage the CE
team was able to do a ‘what if’ analysis, by trying out
different scenarios and finally came up with an accep-
table solution. The final results from the LengthSolver
are given in Fig. 9.
6.2. Problem no. 2
Fig. 10 illustrates a belt drive unit dimensioning and
tolerancing problem adopter from Williams [27]. The
following functional requirements are to be met (all
dimensions are in mm):
FR1: Fit 1, 2: Cmin ¼ 0, Cmax ¼ 0:092.
FR2: Fit 3, 4: MF ¼ �0:018 � 0:017.
FR3: Fit 5, 6: should be a ‘normal running’ fit.
FR4: Fit 7, 8: Cmin ¼ 0, Cmax ¼ 0:092.
FR5: The end play of the spindle is not to be less
than 0.06 and is not to exceed 0.188.
FR6: The distance Z1 is to be controlled within
65:� 0:064 taking into account the end play.
FR7: The distance Z2 is to be between 14.08 and
13.92 taking account the end play.
Calculate the values of the dimensions and toler-
ances to be placed on the drawing to satisfy the above
functional requirements.
6.2.1. Solution
The loop equations are as follows (see Fig. 11):
FR1: Fitting feature problem with type 2 target
value.
FR2: Fitting feature problem with type 3 target
value.
FR3: Fitting feature problem with type 1 target
value.
FR4: Fitting feature problem with type 2 target
value.
FR5: End play ¼ B � A.
FR6: Z1 ¼ B þ C
FR7: Z2 ¼ B � A þ D.
Fig. 9. Print showing final results of LengthSolver.
M.N. Islam / Computers in Industry 54 (2004) 169–190 183

The initial choices of the CE team for manufacture
of the different features in the proposed design are
given in Table 3.
This problem consists of seven functional equations;
the problem was firstly represented in the matrix format
with the help of MatrixSolver. Then the functional
requirements were grouped into five groups according
to the interrelationships among the variables. The soft-
ware then provided an optimum solution order. The first
four functional requirements are independent func-
tional requirements and were solved first. As FR1 to
FR4 are fitting feature problems, FitSolver module was
used for finding their solutions. Fig. 12 illustrates a fit
ranking table used in the process of solving FR2. The
final results from MatrixSolver are depicted in Fig. 13.
Note that the solution order of functional requirements
in Group no. 5 were changed from FR5 > FR6 > FR7
to FR6 > FR5 > FR7. The effectiveness of the proto-
type software becomes more evident with an increase in
the number of functional equations with more compli-
cated interrelationships. However, such problems were
not chosen here due to space constraints.
7. Software evaluation
The primary characteristic of the CE concept is its
team approach to product development; the prototype
software was designed with this in mind. However,
the evaluating of software for team work is difficult
[28] because it is difficult to create the dynamics of
interactions between individual team members in the
laboratory; it is also time-consuming, because team
interactions usually unfold over a relatively long period
of time. Anticipating these difficulties, the prototype
software was not evaluated in a CE environment. The
two evaluation processes followed are described below.
7.1. Software evaluation against selected criteria
First the requirements of a FD&T tool suitable for
a CE environment were formulated by considering
Fig. 10. Belt drive unit [27].
Table 3
Initial choices of the CE for manufacture of belt drive unit
Part name Feature name Dimension symbol Design size Material Manufacturing process Difficulty level
Pulley Hole diameter D2 10.00 Cast iron – –
Bush External diameter D4 20.00 Bronze – –
Spindle Bearing diameter D6 12.00 Steel – –
Gear Hole diameter D8 10.00 Steel – –
Housing Hub depth A 36.00 Cast iron Turning Moderate
Spindle Bearing length B 36.00 Steel Turning Moderate
Pulley Hub offset C 29.00 Cast iron Turning Moderate
Gear Boss depth D 14.00 Steel Turning Moderate
184 M.N. Islam / Computers in Industry 54 (2004) 169–190

various requirements for such a tool as reported
in the literature. Details of this establishment process
can be found in [13]. FDT was then evaluated
against these criteria and the evaluation results
are summarized in Table 4, with brief explanations in
subsequent paragraphs.
R1: The proposed methodology helps to describe or
quantify the functional requirements of the design
with the help of some existing CE tools, such as
QFD and tree diagram. However, this aspect of the
Fig. 11. Loop equations: belt drive unit.
Fig. 12. Screen print showing fit ranking table in FitSolver.
M.N. Islam / Computers in Industry 54 (2004) 169–190 185

methodology has not been integrated into the pro-
totype software. Software packages are available for
QFD analysis, e.g. QFD/CAPTURE developed by
International Technical Group [32] and for construc-
tion of Tree Diagrams, e.g. Microsoft Visio [33].
R2: FDT helps to develop functional equations in a
structured way, although the actual equations are
not generated.
R3: FDT tries to find economic solutions by
applying an informal optimization strategy.
Fig. 13. Screen print showing final results from MatrixSolver.
186 M.N. Islam / Computers in Industry 54 (2004) 169–190

R4: FDT considers assembly and inspection
requirements when specifying functional require-
ments in form of functional equations and
manufacturing requirements during finding a
solution for functional equations.
R5: FDT helps in decision making at multiple
stages of product development.
R6: FDT is easy to use and does not require
advanced technical knowledge.
R7: FDT is interactive and has an attractive
Graphic User Interface.
R8: FDT runs on Windows which is the most
widely used computer platform.
R9: FDT is easy to learn; many other usability
attributes are built into it.
R10: FDT has a structured methodology which
helps the user in solving FD&T problems through
step by step instructions.
R11: It can solve four commonly occurring types
of 1D, FD&T problems, viz. fitting feature
problems, length dimension problems, mixed-type
problems, and surface texture problems as well
as coupled loop equations for these types of
problems.
R12: The results obtained from the prototype
software were compared with the results obtained
through manual calculations and they matched
one another. This indicates that the results are
credible.
From the foregoing, its appears that the prototype
software has satisfied most of its requirements at a
satisfactory level and it has the potential to be an
effective tool for solving FD&T problems in a CE
environment. As the above evaluation was per-
formed by the developer there might be a perceived
bias in the evaluation findings. In this case, the
evaluation findings should be treated as the devel-
oper’s claims about the prototype and a survey of
the opinions of independent potential users was
undertaken.
7.2. Software evaluation by its potential users
The prototype software was evaluated by 15
volunteers chosen from the staff and students of
the School of Mechanical and Manufacturing Engi-
neering, The University of New South Wales, Aus-
tralia. Participants had varying degrees of familiarity
with FD&T problems. Evaluation sessions were run
within a lab environment with one participant at a
time. At the beginning of each session each partici-
pant was briefed on the evaluation procedure; cap-
abilities of the prototype software were demonstrated
by the evaluator solving some sample problems.
Participants were then individually asked to solve
some exercise problems and were monitored during
their use of the software and any difficulties faced by
them were noted as well any questions or additional
Table 4
Evaluation summary of the prototype software against selected criteria
Req. No Description Source Findings
R1 It should help the user to describe and quantify the functional requirements of the design [29] No
R2 It should help the user to develop functional equations [29] Yesa
R3 It should provide and economic solution to the functional equations [29,19] Yesb
R4 It should consider manufacturing, assembly, and inspection requirements in tolerance selection [29,30] Yes
R5 It should help in decision making at multiple stages of product development [30] Yes
R6 It should be suitable for team members from different tecchnical backgrounds [29,30] Yes
R7 It should be interactive [29] Yes
R8 It should run on a platform that is easily accessible [31] Yes
R9 It should be easy to learn [31] Yes
R10 It should be based on a structured methodology [31] Yes
R11 It should be applicatble to a wide range of products [31] Noc
R12 It should be provide credible results [31] Yes
a It helps but does not generate loop equations automatically.b It does this indirectly.c It can solve certain types of 1D problems and is capable of solving coupled requirements.
M.N. Islam / Computers in Industry 54 (2004) 169–190 187

information they requested. At the completion of
the tasks by each participant a short interview was
then recorded.
About 2 h of conversation was recorded, transcribed
and then evaluated. Details of the evaluation can be
found in [13]. From the analysis it appears that except
for three participants all were very satisfied with
the performance of the software. One participant
expressed reservations about its practical use. Another
participant felt that due to the sequential nature of the
program, making changes might be difficult. Some of
the participants praised its capability of making a
‘what-if’ analysis and were impressed with the good
use of colors. Others found the ability to produce fast
results most useful.
The prototype software required a great amount of
manual input. This problem will be rectified once it is
interfaces with a CAD system for which collaboration
of the CAD supplier is required. The inability of the
prototype software to illustrate the whole matrix on a
single screen was identified as the single most con-
cerning issue throughout the evaluation process. How-
ever, this is a common problem in most computer
programs and could be solved by displaying the screen
on a wall. This solution is particularly useful in a CE
environment where the members of the CE team
would be able to get a ‘total’ picture of the problem
being solved.
8. Discussion
FDT is FD&T software in its true sense. It is based
on a structured FD&T methodology that leads the user
towards an optimum solution for common 1D dimen-
sioning and tolerancing problems. The emphasis of
most of the commercially available packages has been
tolerance analysis. Therefore, during FD&T the CE
team members are only able to test the validly of their
selection using these packages. Still, the tolerance
values should not be changed on the basis of simula-
tion results only, which analyses the assembly require-
ments only, whereas FD&T involves the fulfillment of
a number of other requirements, such as manufactur-
ing and inspection. Furthermore, the statistical data
required by these packages, such as distributions of
input tolerances, are often not available at an early
design stage.
The use of a matrix or spreadsheet format for
organizing dimensioning and tolerancing problems
is not new; designers have been using different
custom-made formats for years. Some of the commer-
cially available packages, e.g. CATS-1D XL, also use
such format. However, their representation is not
meaningful. The format used by FDT is unique and
it represents the complexity of the FD&T problem of
product.
FDT increases the efficiency of the solution
search process, firstly, by dividing the whole
FD&T problem of a product into groups and then
by providing solution orders for functional require-
ments in each group. In a real life problem the
number of requirements and the number of variables
will be high and a way of storing and managing all
this information is required. Any FD&T tool suita-
ble for the CE environment should provide all of
these facilities.
FD&T requires frequent use of different types of
data which is catered for in FDT in form of a database.
The accessibility of the database from any part of the
software is of enormous help to its user. The upgrading
facility of the process capability data to reflect the
capability of actual manufacturing processes being
used is another plus.
FDT is PC-based and has an attractive GUI which
makes it very easy to use. It is a much simpler tool than
those available commercially. It does not require a
high level of technical knowledge, thus is suitable for
all members of a CE team, especially the non-tech-
nical members. It produces fast results, indeed almost
instantly, after entering required input data. It provides
a ‘what-if’ analysis facility for rapid evaluation of
different design alternatives. A number of error avoid-
ance measures are built into the software which pre-
vents the user from making any error in the first place
and if any error is made its step back facility allows
easy correction. It allows the user to save the project
data so that the user can come back to it later. It gives
attractive print-outs (both in graphical and text form)
which are useful for presenting results.
9. Concluding remarks
Evaluation of the prototype software indicated
that it can be a useful tool for solving FD&T
188 M.N. Islam / Computers in Industry 54 (2004) 169–190

problems, though its interface needs some improve-
ments. Although the prototype software was not
evaluated in a CE environment, the evaluations
results indicate that it could be an effective tool
for solving FD&T problems in a CE environment.
The evaluation results of the prototype software
presented in this paper are based on qualitative
evaluation only which highlighted some problems
areas. These problem areas should be further inves-
tigated through quantitative evaluation. Finally,
copies of the prototype software should be made
available to the members of the CE team for evalua-
tion, and the feedback should be incorporated into
further refinements.
Acknowledgements
The work presented in this paper was carried out
in the School of Mechanical and Manufacturing
Engineering, University of New South Wales,
Australia under the supervision of Dr. L. E. Farmer.
The author would like to thank Dr. Farmer for
his input and the Department of Employment, Train-
ing, and Youth Affairs, Government of Common-
wealth of Australia, for their financial support
through the provision of an Australian Postgraduate
Award.
References
[1] L.E. Farmer, Function Oriented Dimensioning Enhances Con-
current Engineering Performance, Proceedings of ACME’93,
I.E. Aust., 1993.
[2] R.G. Wilhem, S.C.Y. Lu, Tolerance synthesis to support
concurrent engineering, Annals CIRP 41 (1) (1992) 197–
200.
[3] M.N. Islam, Concurrent engineering offers the best solution
to tolerance allocation problems, New Eng. J. 6 (1) (2003)
14–15.
[4] Variation Systems Analysis Inc. (VSA) Home Page, http://
www.vsa.com, (15/7/99).
[5] Electronic Data Systems (EDS) Home Page, http://www.eds.-
com/, (13/3/2003).
[6] Sigmetrix Home Page, http://www.sigmetrix.com/default.asp,
(13/3/2003).
[7] Dimensional Control Systems (DCS) Home Page, http://
www.3dcs.com, (13/3/2003).
[8] Cognition Corporation, Advantage Products, http://www.
ci.com/products/products.html, (13/3/2003).
[9] Saltire Software Inc., Products, Analytix, http://www.saltir-
e.com/ax.html, (13/3/2003).
[10] Tecnomatix Home Page, http://www.tecnomatix.com/,
(13/3/2003).
[11] Crystal Ball: Decision Engineering Home Page, http://
www.decisionengineering.com, (13/3/2002).
[12] Association for the Development of Computer-Aided Toler-
ancing Systems (ADCATS) Home Page, http://adcats.et.-
byu.edu/home.html, (13/3/2003).
[13] M.N. Islam, Functional Dimensioning in a Concurrent
Engineering Environment, Ph.D. Thesis, The University of
New South Wales, 1999.
[14] M.N. Islam, A methodology for extracting dimensional
requirements for a product from customer needs. Int. J.
Adv. Manufac. Technol., in press.
[15] M.N. Islam, Structured approach to dimensioning and
tolerancing: graphical representation of the problem, in:
ASME 2003 Design Engineering Technical Conferences
and Computers and Information in Engineering Conference,
Chicago, IL, September 2–6, 2003, CD-ROM, Paper #DFM-
48148.
[16] M.N. Islam, A Tolerance Allocation Strategy Suitable for a
Concurrent Engineering Environment, in: Third International
ICSC-NAISO World Manufacturing Congress 2001, Roche-
ster, NY, September 24th–27th, 2001, CD-ROM, Paper
#1923-028.
[17] M.N. Islam, A strategy for solving coupled functional
equations, Int. J. Adv. Manufac. Technol., in press.
[18] C.A. Gladman, Geometric Analysis of Engineering De-
signs, 2nd edition, Australian Trade Publ. Pty. Ltd., Sydney,
1972.
[19] Dimensional Analysis of Engineering Designs, vol. 1,
Components. Part 1. His Majesty’s Stationery Office,
1948.
[20] Australian Standard, AS1654, Limits and Fits for Engineer-
ing, SAA, 1987.
[21] L.E. Farmer, Dimensioning and Tolerancing for Function and
Economic Manufacture, Blueprint Publications, Sydney,
1999.
[22] Australian Standard, AS1100.201-1992, Technical Drawing.
Part 101. General Principles, SAA, 1992.
[23] British Standards, BS1916. Part 2. Limits and Fits for
Engineers, BSI, 1953.
[24] O. Bjorke, Computer-Aided Tolerancing, 2nd edition, ASME
Press, New York, 1989.
[25] K.W. Chase, W.H. Greenwood, Design issues in mechan-
ical tolerance analysis, Manufac. Rev. 1 (1) (1988) 50–
59.
[26] E.T. Fortini, Dimensioning for Interchangeable Manufacture,
Industrial Press, New York, 1967.
[27] R.A. Williams, Fundamentals of Dimensioning and Toleran-
cing, Edward Arnold (Australia) Pty. Ltd., Caulfield East,
Victoria, 1991.
[28] J. Grudin, Groupware and cooperative work: problems and
prospects, in: B. Laurel (Ed.), The Art of Human–Computer
Interface Design, Addison-Wesely Publ. Co., 1990, pp. 171–
185.
M.N. Islam / Computers in Industry 54 (2004) 169–190 189

[29] L.E. Farmer, C.A. Gladman, Tolerance technology—
computer based analysis, Annals CIRP 35 (1) (1986)
7–10.
[30] G. Sohlenius, Concurrent engineering, Keynote Paper at the
42nd General Assembly of CIRP, Annals of the CIRP 41 (2)
(1992) 645–655.
[31] Tool and Manufacturing Engineers Handbook, vol. VI,
Design for Manufacturability, 4th edition, SME, Dearborn,
MI, 1992.
[32] International Technical Group Inc. Home Page, http://
www.qfdcapture.com, (13/3/2003).
[33] Microsoft Visio Home Page, http://www.microsoft.com/
office/visio/, (13/3/2003).
M.N. Islam obtained his engineering
degree from the Higher Institute for
Mechanical and Electrical Engineering,
Varna, Bulgaria, his M.E. (Hons.) from
the University of Wollongong, Australia
and his Ph.D. from the University of New
South Wales, Australia. Currently he is
working as a Visiting Professor at the
Department of Mechanical Engineering,
Pohang University of Science and Tech-
nology, South Korea. His research inter-
ests include Dimensioning and Tolerancing, Concurrent Engineering
in Product Development and Machine Quality Monitoring.
190 M.N. Islam / Computers in Industry 54 (2004) 169–190


