

Future Marine EnergyResults of the Marine Energy Challenge:
Cost competitiveness and growth of wave
and tidal stream energy

Preface 1
Executive Summary 2
1 About the Marine Energy
Challenge 4
2 Potential resource and
industry status 7
2.1 Energy resource and carbon
abatement potential 7
2.2 Development to date 8
3 Current costs of energy 10
3.1 Key factors affecting cost of energy 10
3.2 Current costs 12
3.3 Conclusions 15
Contents
4 Future costs of energy 16
4.1 Routes to cost reduction 16
4.2 Assessment of cost reduction
potential 17
4.3 Estimates of future costs 19
4.4 Conclusions 22
5 Future growth 23
5.1 Key factors affecting growth 23
5.2 Assessment of growth potential 28
5.3 Estimates of future growth 30
5.4 Conclusions 32
6 Next steps 33
6.1 Overall perspective 33
6.2 Strategic development objectives 34
6.3 Development costs and timescales 35
6.4 Approach to future support and
investment 35
6.5 Next steps for the Carbon Trust 36
This report has been prepared by John Callaghan, Programme Engineer at the Carbon Trust
with contributions from Richard Boud, Principal Consultant at Entec UK Ltd.

This report presents the findings of a detailed study into �the cost-competitiveness and potential growth of wave and
tidal stream energy (marine renewables). It follows the
completion of the Marine Energy Challenge (MEC), a
£3.0m, 18-month programme of directed engineering
support to accelerate the development of marine
renewable energy technologies.
The study sought to answer the following key questions:
� What affects the costs and performance of marine
renewables, and at what costs can electricity be
generated from waves and tidal streams today?
� Can the future costs of wave and tidal stream electricity
be reduced to become cost-competitive with other
renewables and conventional generation in the future?
� Can wave and tidal stream farms be developed to supply
large quantities of electricity to the grid and make
material contributions to energy supplies? What effect
would this have on carbon emissions?
In addition to answering these questions, this report also:
� Summarises the MEC approach and its outcomes;
� Indicates the size of wave and tidal stream energy
resources, the potential economic prize and status of
technology development; and
� Presents the Carbon Trust’s overall conclusions on the
marine renewables sector, identifying barriers to
development and making recommendations for future
support.
1Preface
Preface
What is marine renewable energy?
There are several types of marine (or ocean) renewable
energy. The Marine Energy Challenge has focused on two:
wave energy and tidal stream energy.
Wave energy occurs in the movements of water near the
surface of the sea. Waves are formed by winds blowing
over the sea surface, and the water acts as a carrier for
the energy. The amount of energy in waves depends on
their height and period (the time between successive
peaks). The annual average power per unit length of
wave crest (e.g. 40 kW/m) is a first indicator of how
energetic a particular site is.
Systems to convert wave energy to electricity are often
categorised by their location in the sea, particularly the
depth of water, because this has a bearing on the wave
height and therefore the amount of energy. Offshore
wave energy converters are designed for sites that are
tens of metres deep while near-shore and shoreline
systems are intended for shallower water. The latter are
actually built-in to the coastline.
Tidal streams are caused by the familiar rise and fall of
the tides, which occurs twice a day around the UK coast.
As water flows in and out of estuaries, it carries energy.
The amount of energy it is possible to extract depends
on the speed of the flowing stream and the area
intercepted. This is similar to wind power extraction,
but because water is much denser than air, an equivalent
amount of power can be extracted over smaller areas and
at slower velocities. The mean spring peak velocity* is a
first indicator of how energetic a tidal stream site is.
Channelsides
Flowing tidalstream
Waterdepth
Channel width
Wind blowing oversea surface
Wave height Waterdepth
Seabed
Waves
* The greatest velocity that occurs over the tidal cycles, abbreviated as Vmsp in this report.

Potential resource and
industry status
Wave and tidal stream energy have the potential for bulk
electricity supply in the UK and worldwide. The potential
energy resources are significant, particularly offshore wave
energy. Between 15% and 20% of current UK electricity
demand could be met by wave and tidal stream energy,
which is equivalent to carbon dioxide abatements of several
tens MtCO2. Estimates of market size are approximate, but
the market is likely to be sufficiently large to merit
considerable interest in its commercial development.
Interest in wave and tidal stream energy has picked up
over the last few years, particularly in the UK. Currently,
many different device concepts compete for support and
investment, and while some are more advanced than
others, all are at early stages compared to other
renewables and conventional generation. Optimal designs
have yet to be converged upon. A few large-scale
prototypes have been built and tested in real sea
conditions, but no commercial wave and tidal stream
projects have been completed to date. European and US
generation companies and project developers are taking
increasing interest in the sector.
Current costs of energy
Energy from initial wave energy farms has been estimated
to cost1between 12p/kWh and 44p/kWh, with central
estimates for offshore wave farms in the sub-range
22p/kWh to 25p/kWh. Initial tidal stream farms are
estimated to have costs of energy between 9p/kWh and
18p/kWh, with central estimates in the sub-range 12p/kWh
to 15p/kWh.
These current costs are much higher than other forms of
conventional and renewable generation. However, we
consider this is unsurprising, given that wave and tidal
stream energy technologies are at early stages and initial
farms have limited economies of scale.
Future costs of energy
There is potential for costs to reduce considerably in
future. We see four routes to cost reduction: concept
design developments; detailed design optimisations;
economies of scale; and learning in production,
construction, installation, operation and maintenance.
Design improvements are likely to be significant in the
short to medium term.
We have formed views on the likely extent of cost reduction
by a combination of engineering analysis and inference
from other industries. In the case of offshore wave energy,
cost reduction through concept design improvements is
likely and could lead to a step change reduction in costs.
Long-term learning rates2could be in the range of 10% to
15%. For tidal stream energy, we made a detailed survey of
generic designs and developed a computer optimisation
model for UK resource conditions. This included economies
of scale and learning rates in the range of 5% to 10%.
Our conclusions are that:
� Marine renewable energy has the potential to become
competitive with other generation forms in future.
In present market conditions, it is likely to be more
expensive than other renewables and conventional
generation until at least hundreds of megawatts
capacity are installed. By way of comparison, this
capacity is equivalent to several offshore wind farms at
the scale currently being constructed;
� Fast learning or a step change cost reduction is needed
to make offshore wave energy converters cost
competitive for reasonable amounts of investment; and
� Tidal stream energy could become competitive with
current base costs of electricity within the economic
installed capacity estimated for the UK, 2.8 GW.
Future growth
In addition to cost of energy, future growth of wave and
tidal stream energy will be affected by a range of factors.
These include:
� Strategic and security of supply considerations;
2 Future Marine Energy: Cost competitiveness and growth of wave and tidal stream energy
Executive summary
1All current cost estimates are based on technologies at their present stages of development deployed in small farms, with a 15% project rate of return.
See the main report for other details of costing basis.2Learning rate: Fraction of cost reduction per doubling of cumulative production. For example, if it costs £1 to produce the first unit, the second unit would
cost 90p at a learning rate of 10%.

� The availability of finance for technology and project
development (including public support);
� Technology and risks, particularly the readiness of
technologies to be commercially exploited, and the
approach to managing risks in the development process;
� Electricity networks, including the availability of grid
connections, network capacity, the electrical
engineering design of devices and
variability/intermittency of power generation; and
� Environmental and regulatory factors, including local
environmental impact, consents and permits processes
and regulatory change.
The number of factors and relationships between them
make growth complex to model. We took a ‘what you
need to believe approach’ based on detailed assumptions
in order to form a view on how growth could occur.
The assumptions made for an optimistic but achievable
view of the future.
Results from the model indicate that across Europe, up to
several gigawatts installed capacity of each of wave and
tidal stream energy could be installed by 2020. This is
comparable to the worldwide growth of wind energy during
the 1980s. It will require investment and support of up to
several £billion, and lead to annual carbon dioxide
abatements of 2.0 to 7.0 MtCO2/y.
It is possible that a large share of the European
deployment by 2020 could occur in the UK. Up to one sixth
of the UK Government aspiration of 20% renewable energy
by 2020 (i.e. 3% of total UK electricity supply) could be
met by marine renewables, and this could be a significant
share of the contribution by UK renewables overall. Beyond
2020, the industry could develop considerably further.
Next steps
We believe that UK public and private sector organisations
should continue to encourage the creation of a wave and
tidal stream industry, given:
� The potential for low carbon electricity generation in
this country and others, which could be highly material
amongst efforts to combat climate change and increase
security of energy supplies; and
� The potential significant economic returns to the UK
from sales of generation device, project development
and revenue from electricity generation.
The UK is well placed to leverage its skills and experience
in offshore oil and gas, ship-building and power generation
to accelerate progress in the marine renewables sector and
capture the economic value for the UK. While technologies
are at early stages, support and investment in technology�development can be seen as maintaining the marine
renewables option for future years, looking ahead to the
time when the technologies are cost-competitive.
In particular, we see that:
� There is a strong case for industry to accelerate the
overall pace of marine renewables development beyond
current levels. This translates into a requirement for
both significant further public support and private
investment in development activities;
� Considerable emphasis needs to be placed on cost
reduction to ensure commercial viability for wave and
tidal stream technologies; and
� Key to the availability of private equity is clarity of the
route to market, particularly in recognition of the cost
gap between marine renewables and other generation.
Public support for costs of energy above those of
conventional power and other renewables will be
necessary in the medium term.
Given this study’s findings about cost-competitiveness and
growth, we see a need for a parallel two-pronged approach
to public support and private investment, which:
� Accelerates the progress of technology development,
through ongoing RD&D into concept and detailed
engineering design to bring about substantial reductions
in cost; and
� Encourages early development of wave and tidal stream
farms to accelerate learning effects.
Public sector funders should consider:
� Giving increased support over time for marine
renewables technology development, with greater
support for RD&D and cross-cutting technology issues to
help deliver cost reductions;
� Supporting marine renewables project development
from now into the medium term, contingent on
technologies proving technically viable in the first
instance, and later, evidence of reducing costs; and
� Developing a clear long-term policy framework of
support to the sector to give greater investment
certainty.
Based on the success of the Marine Energy Challenge, the
Carbon Trust intends to continue playing an active role in
supporting marine renewables. We are already forming
ideas of what to do next in discussion with industry
players, and we will develop these further over the coming
months.
3Executive summary

In 2002 the Carbon Trust published the Low Carbon
Technology Assessment. This gave an overview of a range
of technology groups which have substantial potential for
carbon emissions reduction, and indicated where Carbon
Trust investments could be material in helping progress
these towards commercialisation. Of wave and tidal stream
energy in particular, the study identified that the UK could
play a leading role in developing generation technologies.
However it also noted that a better understanding of:
energy conversion performance, capital and operating
costs; approaches to construction; and survivability in
marine conditions were necessary before the technologies
could be considered viable.
The Carbon Trust report Building Options for UK Renewable
Energy was published in 2003. This developed findings of
the Low Carbon Technology Assessment for renewable
power generation, focusing particularly on the UK’s global
competitiveness. The study noted that to maximise
economic returns, UK public support for technology
development should be targeted where the country has
competitive strengths, and in this context identified that
the UK has substantial wave and tidal stream energy
resources and a high concentration of technology
developers. Acknowledging the UK’s expertise in offshore
oil and gas production, ship-building and power generation,
the report commented that “UK plc has the opportunity
and potential to create competitive positions in all areas of
design, manufacture, installation and operation” of marine
renewables, but it also noted the difficulty of assessing the
ultimate costs of wave and tidal stream energy at scale.
On the basis of these findings and other studies3, the
Carbon Trust designed the Marine Energy Challenge (MEC)4.
This was a £3.0m, 18-month programme of targeted
engineering support, intended to improve understanding of
wave and tidal stream generation technologies by helping
technology developers advance their designs. The
programme had a particular focus on cost of energy, and
sought both to clarify current costs and identify potential
for future cost reductions. Technology developers bid into
an open tender5and eight were selected to work with
engineering consultants specialist in offshore engineering
and power generation. The consultants worked directly
with the developers to improve the chosen concepts, which
were all offshore wave energy converters. In addition,
detailed studies were made into other technologies where
developers did not participate directly, including shoreline
and near-shore Oscillating Water Column (OWC) wave
energy converters and tidal stream energy generators.
To address concerns about survivability and reliability,
guidelines were prepared on the application of offshore
engineering standards to the design and operation of wave
energy converters, and research was supported into the
variability of marine renewables generation to clarify
implications for grid integration. Figure 1 overleaf shows
the parties that were involved in the MEC.
The MEC was completed in summer 2005. Subsequently,
the Carbon Trust has conducted a detailed study to assess
the future cost-competitiveness and potential growth of
marine renewables. This report presents the findings of
this analysis, together with conclusions on specific aspects
of marine renewables technology development. Given the
early stage of wave and tidal stream energy technologies
and the study’s forward-looking nature, all forecasts and
data should be considered to be rough estimates and any
decisions based on this work should be taken accordingly.
4 Future Marine Energy: Cost competitiveness and growth of wave and tidal stream energy
1. About the Marine Energy
Challenge
3Several studies have been conducted into wave and tidal stream energy in recent years, including the 1999 Office of Science and Technology’s Marine
Foresight Panel report Energies from the Sea – Towards 2020, and the Select Committee on Science and Technology’s 7th report of session 2000-2001 on
Wave and Tidal Stream Energy.4As well as the MEC, the Carbon Trust is supporting development of marine renewables technology through its Open Call R&D support programme, incubator
support and venture capital activities, and also helping fund the European Marine Energy Centre at Orkney.5Not restricted to the UK, and advertised in the Official Journal of the European Union.

Rationale behind the MEC
At present, most wave and tidal stream energy
technology developers are small teams based in start-
up companies, specialist equipment manufacturers,
university engineering departments or a combination of
the three. The engineering challenges of developing
marine renewables are considerable and require
specialist knowledge, skills and experience in several
areas. Not all developers have these capacities, and by
partnering them with engineering consultants who do,
we expected that development could be accelerated.
We also thought that independent validation of designs
would add credibility to claimed cost and performance
estimates and help developers to identify areas which
need further development effort.
There is a wide range of technology options for both wave
and tidal stream energy generation. Several hundred
wave energy converter concepts have been proposed to
date6along with tens of designs of tidal stream energy
generator. This poses a problem for anyone trying to
invest in the sector: Which technology should one choose?
Our approach was to engage developers of several
different technologies in parallel – a range of concepts at
different states of development – and, where we felt
other information would aid the assessment, conducting
directed studies. We intended to develop a view of the
sector that was both broad and deep, and seek trends
towards the best prospects in order to target future
support where it will be most beneficial.
5About the Marine Energy Challenge
6By measure of patent activities.
Figure 1 Marine Energy Challenge participants
Technology developers Engineering consultants Management team Other organisations
and overall consultants
Note: The assistance of other organisations and individuals, notably in providing inputs to the tidal stream and Shoreline/Near-shore OWC studies,
contributing to the peer review processes and helping steer the cost competitiveness and growth analyses, is gratefully acknowledged.
Paul Arwas Associates
University of Cambridge,
Faculty of Economics
University of Oxford,
Environmental Change
Institute
David Milborrow
The Carbon Trust
Chaucer Consulting
Entec UK
Future Energy Solutions
Abbott Risk Consulting
Arup Energy
Atkins Process
Black & Veatch
Det Norske Veritas
E On Power Technology
Frazer-Nash Consulting
Halcrow Group
Peter Brotherhood
AquaEnergy Development
UK
Clearpower Technology
Ecofys
Embley Energy
Lancaster University
Ocean Power Delivery
Seavolt Technologies
Wave Dragon

Outcomes of the MEC
The MEC has significantly accelerated the development of wave energy converters and produced improved engineering
designs. Some developers consider it has moved their concepts forward very considerably, to the effect of several years’
development effort, and the estimated costs of energy of several concepts have been reduced by more than 20%. At the
end of the programme, each developer received a report explaining how the MEC approach was applied to its concept and
giving an independent view of the costs and performance. As these reports refer specifically to developers’ commercial
intellectual property, they are confidential and will not be published by the Carbon Trust.
Throughout the MEC, the Carbon Trust gathered technical data on different marine renewables technologies to allow
costs of energy to be estimated. Again, because these estimates reflect commercial intellectual property, they will
not be published in detail, but this report gives indications for the wave and tidal stream energy sectors as a whole.
The whole sector estimates formed the starting point for the cost-competitiveness analysis discussed in this report.
The MEC has already produced several publications. These include the results of the shoreline/near-shore OWCs study,
new findings on the UK tidal stream resource and technology prospects, guidelines on the design and operation of
wave energy converters and preliminary conclusions on the variability of marine renewable generation. In addition,
a series of electronic newsletters has been published which give an introduction to marine renewables technology and
a glossary of technical terms. The reports and newsletters are available on the Carbon Trust website:
www.thecarbontrust.co.uk/ctmarine
6 Future Marine Energy: Cost competitiveness and growth of wave and tidal stream energy

7Potential resource and industry status
2.1 Energy resource and carbon
abatement potential
The amount of energy carried by wave and tidal streams
which is convertible to electricity has been estimated in
several previous studies. Building Options for UK
Renewable Energy indicated a practical7worldwide wave
energy resource of between 2000 and 4000 TWh/year,
while the UK practical offshore wave energy resource has
been estimated at 50 TWh/year8, (about one seventh of
current UK electricity consumption9). New findings during
the MEC suggest that the technical UK tidal stream
resource is 18 TWh/year10, which is about 10-15% of the
known worldwide tidal stream resource. The UK practical
near-shore and shoreline wave energy resources have been
re-estimated at 7.8 TWh/year and 0.2 TWh/year11,
respectively.
Given these estimates we consider that:
� Wave energy and tidal stream energy have the potential
for bulk electricity supply. In total, they could supply
between 15% and 20% of current UK electricity
consumption; and
� Offshore wave energy has the most potential for the UK.
Tidal stream energy could also make a reasonably large
contribution, but the potential for near-shore and
shoreline wave energy is niche.
Electricity can be generated from waves and tidal streams
without carbon emissions. In a generation mix that
includes fossil fuel plants, wave energy converters and
tidal stream energy generators could avoid carbon
emissions associated with electricity production.
The amounts of carbon avoided depend on the quantities
of generation, but as a first indication the resource
estimates suggest they could be tens of millions of tonnes
carbon dioxide per year for the UK, and hundreds of
millions of tonnes worldwide. Consequently, wave and tidal
stream energy can be considered on the world stage of
high potential low carbon technologies.
The economic prize of marine renewables
Due to uncertainties about future costs, estimates of
the long-term economic potential of wave and tidal
stream energy tend to be approximate. However, the
resource estimates suggest there could be both major
domestic and export markets for wave and tidal stream
energy generation equipment, as well as site
development, construction, installation and operation
services.
As indications of market size:
� Our consultants estimated that the value of
worldwide electricity revenues from wave and tidal
stream projects could ultimately be between
£60b/year and £190b/year12; and
� A previous study13
estimated that investments of
over £500b would be necessary for wave energy to
contribute 2000 TWh/year worldwide.
Overall, the market for marine renewables,
particularly offshore wave energy, is likely to be
sufficiently large to merit considerable interest in its
commercial development.
2. Potential resource and
industry status
7The practical resource allows for practical and economic factors that combine to make developments commercially attractive. The technical resource describes
the amount of energy technically available before such constraints are applied.8Source: ETSU (1985), The Department of Energy’s R&D Programme 1974-1983, ETSU Report R-26. Given developments in both wave energy technology and
the availability of resource data since this assessment, we believe this figure could be higher.9About 350 TWh/year. Source: DTI
10Source: Black & Veatch (2005), Phase II UK Tidal Stream Energy Resource Assessment.
11Source: Arup Energy (2005), Oscillating Water Column Wave Energy Converter Evaluation Report.
12Source: Entec (2005)
13ETSU (1999), A Brief Review of Wave Energy.
2.2 Development to date
Wave energy technology has been developed since the mid
1970s, but with sporadic progress. This is due partly to
government policy and R&D support being intermittently
favourable, partly in response to variations in fossil fuel
prices, which sent positive signals to private investors at
some times and negative signals at others. Tidal stream
energy technologies began to be developed during the
1990s after UK R&D programmes into tidal barrage schemes
were discontinued. To date, worldwide government R&D
support for wave and tidal stream energy has been much
less than other electricity generation and low carbon
technologies, including other renewables17.
Interest in marine renewables has picked up over the last
few years, particularly in the UK. New concepts have been
brought forward and old ones re-evaluated in the current
political and economic context of increasing support for
renewable energy to combat the threat of climate change,
increase security of supply and create economic growth.
Figure 3 (overleaf) shows notable recent UK events.
Currently, many different concepts of wave energy
converter and tidal stream energy generator compete for
support and investment in technology development. Some
concepts are more advanced than others, both in the
sophistication of the technology and development progress
to date. Overall, devices are at early stages compared to
other renewables and conventional plant, and crucially,
optimal designs have yet to be converged upon. A few large-
scale prototypes have been built and tested in real sea
conditions, but no commercial wave and tidal stream
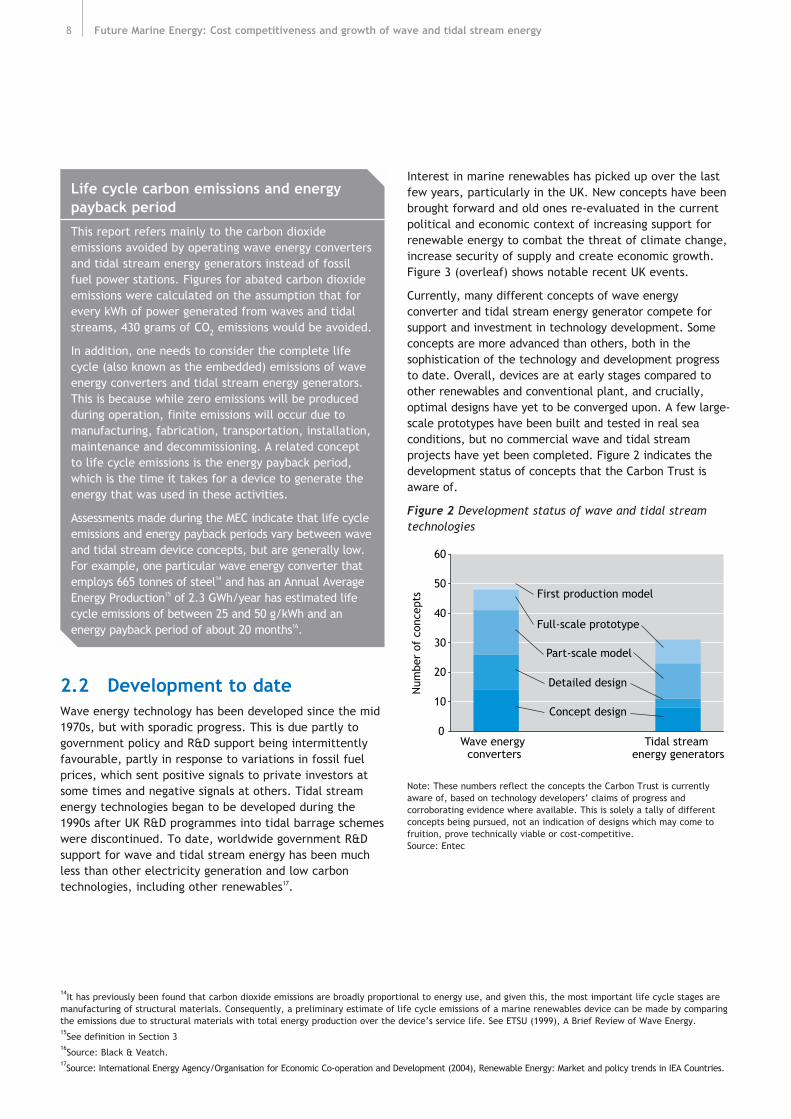
projects have yet been completed. Figure 2 indicates the
development status of concepts that the Carbon Trust is
aware of.
Figure 2 Development status of wave and tidal streamtechnologies
Note: These numbers reflect the concepts the Carbon Trust is currently
aware of, based on technology developers’ claims of progress and
corroborating evidence where available. This is solely a tally of different
concepts being pursued, not an indication of designs which may come to
fruition, prove technically viable or cost-competitive.
Source: Entec
0
10
20
30
40
50
60
Wave energy converters
Tidal stream energy generators
Concept design
Num
ber
of c
once
pts
Detailed design
Part-scale model
Full-scale prototype
First production model
Life cycle carbon emissions and energy
payback period
This report refers mainly to the carbon dioxide
emissions avoided by operating wave energy converters
and tidal stream energy generators instead of fossil
fuel power stations. Figures for abated carbon dioxide
emissions were calculated on the assumption that for
every kWh of power generated from waves and tidal
streams, 430 grams of CO2
emissions would be avoided.
In addition, one needs to consider the complete life
cycle (also known as the embedded) emissions of wave
energy converters and tidal stream energy generators.
This is because while zero emissions will be produced
during operation, finite emissions will occur due to
manufacturing, fabrication, transportation, installation,
maintenance and decommissioning. A related concept
to life cycle emissions is the energy payback period,
which is the time it takes for a device to generate the
energy that was used in these activities.
Assessments made during the MEC indicate that life cycle
emissions and energy payback periods vary between wave
and tidal stream device concepts, but are generally low.
For example, one particular wave energy converter that
employs 665 tonnes of steel14
and has an Annual Average
Energy Production15
of 2.3 GWh/year has estimated life
cycle emissions of between 25 and 50 g/kWh and an
energy payback period of about 20 months16.
8 Future Marine Energy: Cost competitiveness and growth of wave and tidal stream energy
14It has previously been found that carbon dioxide emissions are broadly proportional to energy use, and given this, the most important life cycle stages are
manufacturing of structural materials. Consequently, a preliminary estimate of life cycle emissions of a marine renewables device can be made by comparing
the emissions due to structural materials with total energy production over the device’s service life. See ETSU (1999), A Brief Review of Wave Energy.15
See definition in Section 316
Source: Black & Veatch.17
Source: International Energy Agency/Organisation for Economic Co-operation and Development (2004), Renewable Energy: Market and policy trends in IEA Countries.

9Potential resource and industry status
Figure 3 Recent UK activities in marine renewables
The New and Renewable Energy Centre launchedThe Carbon Trust published Low Carbon Technology Assessment
Scottish Renewables Order 3 included wave energyDTI re-started wave energy part of New and Renewable Energy Programme
Wavegen’s LIMPET was first UK wave energy converter to generate to grid
The Carbon Trust Marine Energy Challenge launchedDTI announced £50M Marine Deployment fundEuropean Marine Energy Centre officially opened Ocean Power Delivery’s Pelamis was first offshore wave energy converter to generate to grid
Marine Current Turbines’ Seaflow tidal stream turbine installedThe Carbon Trust published Building Options for UK Renewable EnergySupergen Marine R&D programme launchedRegen Southwest Wavehub concept launched
1999
2000
2001
2002
2003
2004
2005DTI ran workshops on consenting pre-commercial wave and tidal stream farmsThe Carbon Trust completed Marine Energy Challenge
DTI started tidal stream part of New and Renewable Energy Programme
Current landscape of public support and private investment
Technology developmentSince 2000, total public support for technology development has been around £20m. Most of this has been in the UK,
in grants for research and technology development plus support for test centre and infrastructure projects mainly from
the DTI, the Carbon Trust, Scottish Executive, Engineering and Physical Sciences Research Council, Scottish Enterprise
and Regional Development Agencies.
Private investment has also been forthcoming during the last five years. Several technology developers have obtained
venture capital investments18
in the range of several hundred thousand pounds per investor, totalling a few £m per
investment round. In addition, one technology developer is listed on the Alternative Investment Market (AIM) of the
London Stock Exchange.
Such funding and investment is considerably greater than seen previously, which is encouraging, but on the grand scale
of energy and other technology development, it remains fairly low.
Project developmentSome European and US generation companies and project developers are taking increasing interest in the wave and tidal
stream sector. Several have formed agreements with technology developers to pursue initial farms, and the pipeline of
projects is several tens of megawatts. To date, however, investments in project development have been limited.
18Including one by the Carbon Trust to date.

What affects the costs of marine renewables,
and at what costs can electricity be generated
from waves and tidal streams today?
These questions were the starting point for our assessment
of cost-competitiveness. This section summarises the
findings based on data gathered during the MEC.
3.1 Key factors affecting cost
of energy
The costs of energy of marine renewables technologies
depend on several factors. Principally, these include
capital costs, operating and maintenance (O&M) costs and
the amount of electricity produced (performance)19. Like
wind energy, wave and tidal stream energy are free at
source so there is no fuel cost.
Essentially, capital costs and O&M costs must be weighed
against performance, since this is the saleable output and
represents income to the generator. A high performance
device can afford to be expensive if its costs are more
than met by the value of electricity sold. But if the costs
are so great that they exceed the income from generation,
the device will not be economically viable. The balance of
costs and performance is manifested in the cost of energy,
and the target for this is the cheapest alternative: another
form of renewable or conventional power generation.
Capital costs
The capital cost of marine renewables technologies can
broken down into: the cost of the generation device itself
(materials, components and labour in manufacturing and
fabrication processes); the costs associated with installing
it (deployment); the costs of keeping it on station
(foundations or moorings); and the costs of connecting it to
the grid (electrical cables and switchgear). Some of these
costs are more dominant than others, and the relative
distribution of cost centres varies between different device
concepts and site locations. For example, Figure 4
illustrates the cost make-ups for a specific wave farm
(Figure 4a) and specific tidal stream farm (Figure 4b)
that have been envisaged.
It should be noted that the capital costs of wave and tidal
stream energy devices are not static and will change over
time due to developments in technology, the costs of raw
materials and components and experience gained in
manufacturing and deployment. As might be expected,
the total capital cost depends strongly on the number of
devices built and installed, and also where they are
deployed.
O&M costs
The O&M costs of marine renewables can also be
considered in several parts, including: maintenance, both
planned and unplanned; overhauls; where it is most
economic to re-fit components during the service life;
licences and insurance to allow the devices to be kept on
station and to manage the associated risks; and ongoing
monitoring of wave or tidal conditions and the
performance of devices.
Figure 4c gives a breakdown of O&M costs for a specific
wave farm envisaged. Like capital costs, O&M costs also
depend on the size of the installations and the location,
and are also likely to vary from year to year. At present, it
is much more difficult to estimate O&M costs than capital
costs due to the lack of experience in operating wave and
tidal stream farms, although it is possible to infer costs
from experience with upstream oil/gas installations and
offshore wind farms.
10 Future Marine Energy: Cost competitiveness and growth of wave and tidal stream energy
3. Current costs of energy
19There will also be costs of decommissioning. Current estimates indicate these will be small compared to initial capital costs, and because they fall at the
end of a project, the present value in a discounted cash flow analysis is low and has only a marginal effect on cost of energy.

Performance
The performance of marine renewables devices depends
on: the energy available in the resource; the design of the
prime mover (mechanical components) that extracts
energy from the resource – e.g. the rotor of a tidal stream
turbine; and the power take-off system (equipment used to
convert the mechanical energy into electricity).
As wave energy converters and tidal stream energy
generators can be configured in many different ways, their
performance characteristics vary. It is necessary to study
specific designs in order to understand performance
characteristics in detail, but it is possible to make general
observations about groups of devices and identify common
requirements for high performance. These include the
extent to which a device’s capacity for energy
extraction/conversion is matched to the available energy
resource, the efficiency of the system’s energy conversion
(‘resource-to-wire’) and its availability (proportion of time
the device is ready to generate, whether or not the
resource conditions are suitable for generation). Figure 5
indicates what the performance characteristics of wave
energy converters (Figure 5a) and tidal stream energy
generators (Figure 5b) may be like, in particular how the
power output depends on different physical parameters
(wave height, wave period and tidal stream flow velocity).
Like other renewables and conventional generation, the
generation performance of marine renewables can be
described using the following terms:
� Annual Average Energy Production. This is the total
amount of electricity expected over the service life
divided by the length of the service life (allowing for
the fact that annual generation may vary from year to
year due to changing resource conditions, device
availability and/or energy conversion efficiency); and
� Long-Term Capacity Factor. This is the ratio of average
annual energy production to the product of rated
capacity and the number of hours in a year. Data
gathered during the MEC suggests that long-term
capacity factors for wave farms and tidal stream farms
may be of a similar magnitude to wind farms – between
20% and 45%, depending on the technology and site.
11Current costs of energy
Figure 4 a) Breakdown of capital costs for a wave farm
Figure 4 b) Breakdown of capital costs for a tidalstream farm
Figure 4 c) Breakdown of operation and maintenance costsfor a wave farm
Notes: Based on data gathered during the Marine Energy Challenge.
The charts refer to specific types of wave energy converter and tidal stream
energy generator, and are not representative/typical of wave energy or
tidal stream technologies as a whole. There are considerable variations
between different technologies, project locations and project sizes
(numbers of machines installed). Also, future design improvements,
performance/cost optimisations and learning effects could change the
relative weighting of some cost centres. The O&M chart shows annual
average costs evaluated over the entire life of a wave farm.
Source: Entec, based on data provided by Atkins and Black & Veatch
Monitoring 4%
Planned
maintenance
29%
Unplanned
maintenance 28%Licences
1%
Insurance
14%
Refit
24%
Project
management 7%
Structure
39%
Mechanical and
electrical 39%
Installation
2%
Grid
connection
13%
Grid
connection
4%
Project
management
2%
Structure
27%
Mechanical and
electrical 49%
Mooring
5%
Installation
13%

Figure 5 Performance characteristics of wave energyconverters and tidal stream energy generators
a) Example wave energy converter power surface
b) Example tidal stream energy generator power curve
Notes: These graphs indicate ranges of operating conditions for wave energy
converters and tidal stream energy generators. They are for illustration
only, and neither represents a specific device technology. In each graph,
the grey area shows where power would normally be generated. The orange
area highlights conditions where there is insufficient energy in the resource
to generate economically, and the red areas where the available energy is
at or above the rated capacity of the generator.
Source: Entec
Calculating cost of energy
Drawing all of the above together, an installation’s cost
of energy is determined by a discounted cash flow
calculation. Given a certain discount rate and period, the
cost can be estimated using the following equation, where
‘PV’ indicates the present value over the service life:
Cost of energy = Capital cost + PV(O&M costs)
PV(Energy Production)
3.2 Current costs
Based on the evidence gathered during the MEC, it is
possible to indicate the costs of marine renewable energy
today. Although the previous section applies equally to
wave and tidal stream energy, it is important to point out
that the costs of each technology category are different,
and henceforth they are treated separately.
Choice of metrics
Given that costs depend strongly on the numbers of
machines built and installed, a practical difficulty in
discussing current costs is the present industry status.
With no commercial wave or tidal stream projects yet
built, the firmest evidence of costs and performance
comes from large-scale prototypes. However, the capital
costs of these are likely to be greater than production
models for commercial projects for two reasons:
MEC approach to cost of energy
The capital costs, O&M costs and performance of a
marine renewable device are interrelated and an
improvement in one may require a trade-off with
another. This means that before a device’s cost of
energy can be estimated, it is necessary to define a
self-consistent basis of design. This is not necessarily
the optimal design in the first instance, but one that
could actually be built (i.e. using certain materials and
known construction techniques), could be deployed
(i.e. using certain vessels and moorings or foundations)
and will work (i.e. survive the marine environment and
produce electricity reliably).
During the MEC, the first stage of evaluation was to
define a baseline design. The costs and performance
were then determined and the baseline cost of energy
estimated. In some cases, this indicated that the costs
were too high to justify the performance, and
subsequently ways were sought to either decrease the
costs, improve the performance, or both. An iterative
design process followed during which different design
possibilities were explored and their potential benefits
were quantified. This resulted in improved designs with
lower costs of energy and/or greater confidence that
certain cost and performance levels could be reached.
Above rated
Rated power
Power shedbelow cut-in
Cut-in
Power
Flow speed
Power capturedby device
by device
Power shed insmall waves
Power shed aboverated capacity
Power shed insteep waves
Rated
Survival Cut-in
Power captured
Significantwave height
Energyperiod
Power onvertical axis
12 Future Marine Energy: Cost competitiveness and growth of wave and tidal stream energy

� Prototypes are built as one-offs, whereas production
models may be constructed in batches with associated
economies of scale; and
� Design improvements resulting from prototype testing
may reduce costs and/or increase performance before
production models are built.
Also, the performance of prototypes is likely to be much
lower than production models because the prototypes are
used primarily to gather engineering data for ongoing
development, rather than generate electricity for revenue.
Furthermore, in practice, one can only make broad-brush
distinctions between prototype O&M costs and development
activities. Prototype costs of energy are therefore not a
good indicator of commercial costs of energy.
An alternative is to estimate the costs and performance
of first production models, but this usually requires
assumptions about economies of scale, design
improvements, performance levels and O&M costs. These
carry large uncertainties and may not make for a self-
consistent design basis, lending doubt as to the validity of
the results.
Given these issues, our approach to reporting current costs
is as follows:
� Describe capital costs for both first prototypes and first
production models, since these can be estimated
reasonably well and comparisons are instructive.
However, for the time being, we allow only batch
production benefits (small economies of scale) between
the two stages; the significance of design improvements
is discussed later. The capital cost figures therefore
represent today’s technologies manufactured in small
volumes. Figures are given per unit installed generating
capacity (£/kW) since this allows comparisons with
other technologies20
(e.g. offshore wind); and
� Give costs of energy for first production models, based
on the reported capital costs and technology-specific
estimates of performance levels and O&M costs. These
were developed in detail by bottom-up calculations of
annual average energy production and reference to O&M
strategies and procedures (as far as defined). The
following general assumptions apply to the figures
quoted:
– Devices are installed in farms of 10 MW total installed
capacity. This is broadly indicative of the size of early
stage developments; actual first projects (or first
stages of projects) may be smaller.
� – The project rate of return is 15%. This is based on
discussions with energy project investors about risk/
return expectations. 15% is higher than some projects
using conventional and renewable technologies
achieve, but reflects investors’ perceptions about
current technology risks for marine renewables.
Uncertainty and lowest-cost groups
Our analysis indicates that in the cases of both wave energy
and tidal stream energy, the variety of concepts reflects
itself in wide ranges of capital costs and costs of energy.
This range is exaggerated by uncertainties in the cost and
performance estimates of individual devices, which are large
in most cases and very large for less advanced concepts.
Although statistical average or median costs of energy can
be calculated, these tend to be misleading due to the
influence of unpromising, high cost devices. An alternative
approach is therefore necessary to contain the range and
describe the most promising, low cost technologies.
Our method was to identify ‘lowest-cost’ groups of wave
energy converters and tidal stream energy generators,
which are subsets of the whole technology range. These
groups were selected using engineering judgement and are
therefore partly subjective, but this shortcoming is
outweighed by their usefulness over other descriptions.
Each lowest-cost group consists of several fundamentally
different concepts, so should one prove technically
unviable and/or more expensive than estimated, there is
an alternative route to the same cost. This gives
confidence that the lowest-cost groups are reasonable
indicators of current costs.
Lowest cost groups of technologies are described below,
except near-shore and shoreline OWC wave energy
converters which are identified specifically on the basis of
design data in the public domain21.
Capital costs of prototypes and first
production models
Figure 6 compares the capital costs of first prototypes and
first production models. The total capital cost of first
prototype wave energy converters could be up to
£9,000/kW, but certain prototypes have already been built
at costs below £4,300/kW. This should not be taken to
exclude more expensive concepts, providing cost
reductions are possible between prototype and first
production models. Initial wave farms could be installed
for between £1,700/kW and £4,300/kW.
13Current costs of energy
20In theory, a better metric is capital cost per annual average power generation, which takes into account the long-term capacity factor. However, for this to
be meaningful for any single device, the certainty of the performance estimate needs to be high, and in order to compare between devices, the certainty of
estimates should be similar. Our experience is that performance estimates often have wide error bands and that the certainty varies considerably between
devices. This can make capital cost per annual average power generation figures misleading.21
Arup Energy (2005), Oscillating Water Column Wave Energy Converter Evaluation Report.

First prototype tidal stream energy generators could cost
up to £8,000/kW, but certain concepts have already been
built for under £4,800/kW. Again, this should not exclude
concepts with greater capital costs providing future cost
reductions are possible. Initial tidal stream farms could
have costs between £1,400/kW and £3,000/kW.
Figure 6 Capital costs of first prototypes and firstproduction models
As special cases:
• First prototype near-shore Oscillating Water Columns (OWCs) are
estimated to cost between £3000/kW and £9000/kW;
• First production model near-shore OWCs are estimated to cost between
£1150/kW and £2800/kW;
• First prototype shoreline Oscillating Water Columns (OWCs) are estimated
to cost between £5500/kW and £10000/kW; and
• First production model shoreline OWCs are estimated to cost between
£1550/kW and £5500/kW.
Source: Entec
Costs of energy of initial farmsFigure 7 shows the costs of energy generated by wave
energy converters deployed in initial farms. We consider
the lowest-cost group offshore wave energy converters to
range from 12p/kWh to 44p/kWh, with central estimates in
the sub-range of 22p/kWh to 25p/kWh. The wide range of
costs is due mainly to the diversity of concepts, but is also
caused by large uncertainties about performance and O&M
for individual designs. Central estimates for near-shore and
shoreline OWCs are within the lowest-cost offshore wave
energy converter range, at 15p/kWh and 28p/kWh
respectively. Other wave energy converters have costs in
excess of 50p/kWh, and performance no lower, nor O&M
costs any higher, than competitors. This suggests that
despite uncertainties in performance and O&M, capital cost
per kilowatt is a good indicator of competitiveness.
Energy from initial tidal stream farms has been predicted
to cost between 9p/kWh and 18p/kWh, with central
estimates in the sub-range 12p/kWh to 15p/kWh22. The fact
that this range is smaller than wave energy converters is
due partly to the choice of concepts being more limited,
and partly to greater certainty about performance.
Although O&M costs are uncertain, performance levels
between lowest-cost group concepts are similar. This again
points to capital cost per kilowatt as a good
competitiveness indicator.
It can readily be observed from Figure 7 that the central
estimate costs of tidal stream energy are lower than those
of offshore wave energy. It is important to emphasise that:
� This is solely a depiction of current costs, and gives no
indication of how the costs of wave and tidal stream
energy may reduce. This is discussed in Section 4; and
� The apparent advantage of tidal stream energy over
wave energy needs to be taken in context of the
resource estimates noted in Section 2. Notably, both
the UK and worldwide offshore wave resources are
estimated to be considerably greater than their tidal
stream counterparts.
Figure 7 Costs of energy today
Notes:
• The complete bars represent lowest-cost group technologies, at today's
stage of advancement, manufactured in small volumes and installed in
initial fams up to 10 MW capacity, at a project rate of return of 15%.
• The central estimate bands represent the ranges of central estimate costs
for different technologies.
• As special cases, near-shore Oscillating Water Columns (OWCs) are
estimated to have central estimate costs of 15p/kWh, and shoreline OWCs
28p/kWh.
• See Figure 9 on page 18 for details of the four target costs of energy
(vertical lines)
Source: Entec
0 5 10 15 20 25 30 35 40 45
Tidal streamenergy
generators
Offshorewave energy
converters
Cost of energy [p/kWh]
2.55.0
6.08.5
Uncertainty bandsCentral estimates
Offshore wave energy converters
Tidal stream energy generators
First prototype, upper estimateFirst prototype, lower estimateFirst production model, upper estimateFirst production model, lower estimate
Capit
al cost
per
unit
inst
alled
genera
ting c
apacit
y [£
/kw
]
0100020003000400050006000700080009000
10000
14 Future Marine Energy: Cost competitiveness and growth of wave and tidal stream energy
22Source: Black and Veatch

3.3 Conclusions
The current costs of both wave and tidal stream energy are
considerably higher than conventional and other renewable
energy generation. We consider this is unsurprising, given
the early stage of technologies and the implications of the
assumptions noted, particularly that projects are
constrained to 10 MW total installed capacity and thus
have limited economies of scale. The following section
discusses how and to what extent the costs of marine
renewable energy could be reduced.
Causes of high costs in prototypes and
initial farms
The capital and O&M costs of early wave and tidal
stream energy generators can be expected to be higher
than long-term costs due to several practical and
economic factors, including the following:
� While demand for materials and parts with which
to build marine renewable devices is low, these
materials and parts may not be ideal; technology
developers temporarily need to make do with what
is available ‘off-the-shelf’. Bespoke solutions to
reduce costs are the subject of R&D and will take
time to develop;
� There is limited experience of installing, operating
and maintaining plants in some situations that are
ideal for energy extraction from waves and tidal
streams. Contractors’ perceptions of risk are likely
to be reflected in higher costs; and
� Some routes to overall cost minimisation are
uneconomic while only small volumes of devices
are produced and installed. These include novel
manufacturing processes and the use of customised
vessels for installation, operation and maintenance.
15Current costs of energy

Can the costs of wave and tidal stream
electricity be reduced to become cost-
competitive with other renewables and
conventional generation?
This question is crucial to the future of technology
development, and to date, uncertainty about the answer
has been a barrier to commercialisation. This section
explains our approach to assessing future cost reduction
potential, indicates how the costs of wave and tidal stream
energy could reduce with increasing installed capacity and
notes implications for investment and support.
4.1 Routes to cost reduction
Broadly speaking, we expect economies of scale to be
possible in production (manufacturing, construction,
installation and O&M), and cost reductions to occur with
increasing numbers of devices produced – a concept known
as learning. This is based on knowledge of marine
renewables technology and also empirical evidence of
other generation technologies, including renewable
technologies such as photovoltaic cells and wind turbines23.
Cost reductions have been observed for these technologies
as manufacturing increases in scale and installed capacities
rise. Although there is some disagreement about exact
learning rates24, the general trends are widely accepted
and borne out by the fact that prices are lower today
than previously.
However, while conceptual and detailed designs of marine
renewables devices are still evolving, it is insufficient to
think about economies of scale and learning alone. More
significant at the current stage of development is the
ability of engineering design improvements to minimise
costs of energy before large numbers of devices are
manufactured and installed. Indeed, while only a few
large-scale prototypes have been deployed, design
improvements give the firmest evidence of cost reduction
potential. It will be some years before sufficient numbers
of devices have been produced that the impacts on
economies of scale and learning can be measured.
Engineering design can be considered in two respects:
concept design, which concerns the fundamental operating
principles and general assembly of devices, and detailed
design, which is how the concepts are actually realised.
Concept design improvements might involve changes to a
device’s size, shape or general assembly, while detailed
design optimisations could, for example, improve
performance in particular resource conditions or minimise
the time required in maintenance. Reflecting the state of
technologies on entry work in the MEC focused mainly on
concept design improvements, particularly identifying the
remaining design avenues to be explored as part of the
iterative design process. However, some technologies
within and outside the MEC are now ready for detailed
design optimisations to enhance performance or reduce
capital and O&M costs, beyond the platforms envisaged
for first large-scale prototypes.
In short, we identify four possible ways of reducing costs
of energy (Figure 8)25:
� Concept design developments;
� Detailed design optimisations;
� Economies of scale; and
� Learning in production, construction, installation and
O&M.
Although sequenced logically, cost reductions may not
occur in this order because the design process is iterative
and the latter two effects are linked. It is therefore
impossible to uniquely identify the benefit each
mechanism could have in future (indeed, such
disaggregation is often difficult for previously developed
technologies). However, we believe that design
improvements (both concept and detailed) are likely to be
significant in the short to medium term.
16 Future Marine Energy: Cost competitiveness and growth of wave and tidal stream energy
4 Future costs of energy
23See for instance IEA (2000), Experience Curves for Energy Technology Policy
24Learning rate: Fraction of cost reduction per doubling of cumulative production. For example, if it costs £1 to produce the first unit, the second unit would
cost 90p at a learning rate of 10%.25
An alternative interpretation of routes to cost reduction groups concept and detailed design into one category, ‘learning by searching’, and economies of
scale, learning in production, construction, installation and O&M in another, ‘learning by doing’. These terms are found in academic literature.

Figure 8 Routes to cost of energy reductionfor marine renewables
4.2 Assessment of cost reduction
potential
We have formed views on the extent of potential cost
reductions by a combination of engineering analysis of
marine renewable technologies and inference from other
industries.
The engineering analysis approach involved breaking down
designs into cost centres, sub-assemblies and components,
studying the potential for improvements to each, and then
re-building the devices at lower cost. This was essentially
the MEC approach to cost of energy, but in order to form a
medium-term view we looked beyond design platforms at
the end of the MEC. A practical constraint was uncertainty
about trade-offs between certain design changes and
performance enhancements, which could only be resolved
by further engineering analysis and testing beyond the
scope of this study. Limited industry knowledge about
certain novel engineering processes (e.g. volume
fabrication in concrete) was also a constraint.
We looked at the experience of other industries to form a
long-term view of learning rates (the combined cost reduction
arising from of economies of scale and learning). In particular,
ship-building, offshore oil/gas and wind power were
considered because the associated technologies have
similarities in design and function to marine renewables and
use many of the same parts. As far as possible we studied the
sectors’ initial stages in order to gauge leaps made early on,
but we also looked at cost reductions since the technologies
have become more mature.
This formed a common basis for our analyses of all marine
renewables technologies, but beyond this, different
approaches were taken for wave energy and tidal stream
energy.
Wave energy converters
The wide range of options for wave energy converters
makes a study of the potential for concept design
improvements very difficult. However, the early stages of
technologies suggests that cost reduction by this route is
quite likely. It could be that a present early-stage concept
is cheaper than more advanced designs, or that advanced
designs become cheaper through fundamental design
changes. It is impossible to foresee every potential design
change or quantify its benefits26, but overall, the impact
could be a step change reduction in cost of energy below
the current lowest-cost group.
We have some indications of the potential for detailed
design optimisations for more advanced concepts, and
these suggest material reductions in capital cost and
increases in performance are possible. However, for
devices we are familiar with, such enhancements have not
yet been combined to form a self-consistent design basis,
and/or theoretical evidence has not been validated, so the
net potential cost of energy reduction is unproven.
Our consultants found that economies of scale could be
possible in several aspects of construction, installation,
operation and maintenance. The cost reduction potential
varies considerably between different concept designs,
particularly due to differences in general assembly and
O&M strategies. For some designs, it is difficult to tell
whether long-term reductions in costs of energy will be
due mostly to capital cost reductions, O&M cost reductions
or performance improvements. Due to the uncertainties
about O&M, our consultants took O&M costs as a fixed
proportion of capital costs.
Concept design developments
Detailed design optimisations
Economies of scale
Learning in production, installation, operation and maintenance
17Future costs of energy
26Identification of design features likely to reduce costs is one objective of current work under the EPSRC Supergen Marine research programme (Work
Package 7). Conclusions had yet to be reached at the time of writing but we remain in touch with the study team.

By a combination of engineering analysis and inference,
our consultants consider that the long-term learning rate in
cost of energy for wave energy converters is likely to be
between 10% and 15%27.
Tidal stream energy generators
The smaller range of tidal stream energy generator
concepts allowed a detailed survey to be made of different
generic designs, including horizontal-axis turbines, vertical-
axis turbines, reciprocating hydrofoil machines and venturi
systems. Our consultants assessed the relative merits of
different approaches, including fundamental design options
such as foundations/moorings and shrouding, and then
estimated capital costs, O&M costs and performance.
Detailed design optimisations of the generic concepts could
not be considered in full, but basic optimisations for UK
resource conditions were possible. This was attractive in
order to understand whether tidal stream energy could
become cost-competitive in the UK, given the country’s
estimated share of the worldwide resource (10-15% – see
Section 2). A computer optimisation model was developed
to estimate costs of energy under different resources
conditions, including deep and shallow water. Economies
of scale and learning were embodied in this model, and our
consultants considered that long-term learning rates could
be between 5% – 10%28.
Source: Paul Arwas Associates
In future, one might take different target costs, due
to changes in both:
� The costs of energy of other conventional and
renewable technologies, some of which are
themselves following cost reduction trends
(e.g. wind power);
� Changes in government instruments and market
conditions to value carbon emissions.
Base cost(CCGT)
Revenuesupport
3.5p/kWh
2.5p/kWh 5.0p/kWh
Nil
Low fossil fuelsupported6.0p/kWh
Low fossil fuelunsupported2.5p/kWh
High fossil fuelunsupported5.0p/kWh
High fossil fuelsupported8.5p/kWh
Target costs of energy
In the present market conditions, we consider a
rational target for the base cost of energy to be the
cost of CCGT, since this is cheapest form of generation.
We considered two cost points: 2.5p/kWh and
5.0p/kWh. The former reflects the cost of CCGT over
the past few years in the UK, and the second is a view
of a future cost given a certain sustained increase in
fossil fuel prices and the cost of associated carbon
emissions. In order to gauge the future progress of
wave and tidal stream energy against other, more
mature renewables (particularly wind power), we also
counted the value of UK Renewable Obligation
Certificates (ROCs) and Climate Change Levy
Exemption Certificates (LECs)29. We assumed the
overall benefit of these to generators would be
3.5p/kWh. Together with the two electricity cost
points, this gave four target cost levels, as shown in
Figure 9.
Figure 9 Target cost of energy levels
Key sensitivities in future cost
of energy analyses
� Discount rate. We expect the rate of return required
to finance marine renewables projects to fall as
experience increases and risks reduce. This will be
linked to increasing amounts of installed capacity.
For both wave and tidal stream energy, a rate of
15% was applied to initial projects while 8% was
taken for the long term. Since reducing the discount
rate is effectively another form of learning, a
distinct learning rate was applied, independent of
learning on costs;
� Period. The financing period (or capital recovery
term) of marine renewables projects will depend on
the sources of finance and investors’ risk/reward
expectations. As a first approximation, we assumed
the period was equal to the service lives of wave
and tidal stream farms, predicted during the MEC to
be between 15 and 25 years, depending on the
device. For consistency, the term was normalised to
20 years.
18 Future Marine Energy: Cost competitiveness and growth of wave and tidal stream energy
27Source: Entec
28Source: Black & Veatch
29In the UK, the Renewables Obligation and Climate Change Levy effectively increase the value of renewable electricity over conventional (fossil fuel and
nuclear) power.

4.3 Estimates of future costs
Cost-curve scenarios for wave
energy converters
Due to the difficulty of quantifying concept design
improvements, the unproven nature of detailed design
optimisations, and the range of possible learning rates,
we approached predictions of the future costs of wave
energy on a scenario basis.
Initially, we considered how the costs of offshore wave
energy converters could reduce from the sub-range of
central estimates mentioned earlier if learning happened
continuously from now. Applying the slowest long-term
learning rate expected (10%) to the upper bound of the
current lowest-cost group (25p/kWh) gives a scenario for
slow technology development, (Scenario A). A faster
development scenario is produced by applying the fastest
rate (15%) to the lower bound (22p/kWh), (Scenario B).
Figures 10a and 10b show cost curves for these two
scenarios.
It can be seen that in Scenario A, about 5 GW of capacity
needs to be installed before the high fossil fuel supported
level (8.5p/kWh) is reached, while in Scenario B the same
level is met after only 250 MW. Effectively, the low fossil
fuel unsupported level (2.5p/kWh) is never realised in
Scenario A, whereas it takes about 40 GW to meet in
Scenario B. First and foremost, these results show there is
a strong sensitivity to the learning rate, and indicate the
benefit of progressing at a rate closer to 15% rather than
10%. But they also suggest that:
� An increase in base electricity costs, over recent
historic levels, may be necessary to make offshore wave
energy cost competitive; and
� Offshore wave energy is likely to be considerably more
expensive than other renewable and conventional
generation until at least hundreds of megawatts of
capacity is installed.
Given these findings, we considered what could happen if
there was a step change to reduce the starting point to
10p/kWh after 50 MW capacity had been installed, and
learning occurred at 15% thereafter. A cost curves for this
additional scenario, C, is shown in Figure 10c. It must be
emphasised that the 10p/kWh starting point does not
relate directly to an actual estimate for any offshore wave
energy converter studied by our consultants, and to be
realised, scenario C would require major cost reductions
before large wave farms are deployed, beyond levels our
consultants can currently foresee. However, a step change
to 10p/kWh could be considered a best case, and it is
instructive to compare scenario C to A and B.
Figure 10a Offshore wave energy cost reduction scenariosScenario A: 24.9p/kWh starting point, 10% learning rate
Figure 10b Offshore wave energy cost reduction scenariosScenario B: 21.6p/kWh starting point, 15% learning rate
Note: Curves implicitly includes a gradually falling discount rate from 15%
to 8%.
Source: Entec
2.55
10 MW 100 MW 1 GW 10 GW 100 GW 1 TW
68.5
0
5
10
15
20
25
30
Cumulative installed capacity
Cost
of
energ
y [p
/kW
h]
Range ofelectricity pricesexcluding ROCsand LECs
Range of pricesincluding ROCsand LECs
Estimated costof energy
2.55
10 MW 100 MW 1 GW 10 GW 100 GW 1 TW
68.5
0
5
10
15
20
25
30
Cumulative installed capacity
Cost
energ
y [p
/kW
h]
19Future costs of energy

Figure 10c Offshore wave energy cost reduction scenariosScenario C: 10.0p/kWh starting point, 10% learning rate
Note: Curve implicitly includes a gradually falling discount rate from 15%
to 8%.
Source: Entec
The obvious impact of the step change is to allow a much
more rapid progression to the lowest target levels.
Notably, the 6.0p/kWh hurdle is cleared below 400 MW,
and although not shown, it turns out that the same level
would be met below 1.0 GW had there been a step change
to 10p/kWh and learning at 10%. Taking these findings with
those for scenario B, it can be concluded that offshore
wave energy could become competitive with CCGT
generation within several gigawatts of installed capacity,
provided that:
� A step change to 10p/kWh occurs and learning is
anywhere in the range 10% to 15%; or
� A step change does not occur but learning is at 15%.
The total investment required to install wave and tidal
stream farms and make progress towards cost reductions
can be deduced from the area under each learning curve.
By comparing the three scenarios, it is possible to assess
the significance of the learning rate and step change to
10p/kWh on the amount of investment needed to reach
different target levels.
� To reach the high fossil fuel supported level
(8.5p/kWh), £18.5b is needed in Scenario A while only
£770m is required for Scenario B. This massive
difference points again to the sensitivity to learning
rate, but also indicates that with slow learning, it would
be prohibitively expensive to fund cost reduction down
to even the highest target considered; and
� To reach the low fossil fuel supported level (6.0p/kWh),
a total investment of £2.2b is required in Scenario B,
while only £500m is needed for Scenario C. This further
difference underlines the overall economic value of
efforts to reduce costs of energy before large capacities
of generation are deployed; particularly design
improvements (the first two routes shown in Figure 8).
Based on the total investment costs, it is possible to
estimate the necessary costs of support30
above the base
cost, ROC and LEC support. Assuming a constant high base
electricity cost of 5.0p/kWh, this is £3.1b in Scenario A
and £190m in Scenario B, but the figures are considerably
higher at the lower base cost of 2.5p/kWh. In any case of
base cost, the cost of additional support is much lower in
Scenario C. This suggests that to make long term support
above the RO and CCL likely, the base electricity cost may
have to rise in combination with fast learning, or a step
change reduction in the costs of offshore wave energy has
to occur.
2.55
10 MW 100 MW 1 GW 10 GW 100 GW 1 TW
6
8.5
0
5
10
15
20
25
30
Cumulative installed capacity
Range ofelectricity pricesexcluding ROCsand LECs
Range of pricesincluding ROCsand LECs
Estimated costof energy
Cost
of
energ
y [p
/kW
h]
20 Future Marine Energy: Cost competitiveness and growth of wave and tidal stream energy
30Again on a Net Present Value basis, such that no distinction is necessary between capital support and revenue support mechanisms.

Cost-resource curves for tidal stream energy
The computer optimisation model developed to estimate
costs of energy under different resource conditions was
used to generate the cost-resource curves presented in
Figure 11. These differ from the cost-curves generated
for the wave energy converters in that the cost-resource
curves recognise the available resource at tidal stream
sites around the UK. Figure 11a is based on a view of the
likely order of site exploitation with regard to water
depths and mean spring peak velocities. Developments are
assumed to happen in a particular sequence, which may
not actually occur in practice, but is necessary to assume
in order to estimate the cost of energy when most of the
UK resource has been exploited. Figure 11b illustrates how
the cost of energy may reduce in a more likely progression
of developments, where different sites are developed at
the same time rather than sequentially. 2.8 GW is an
estimate of the maximum economic UK installed capacity,
and represents the limit of this UK-only analysis.
Figure 11b shows that the cost of energy may have fallen
to 7p/kWh by the time 1.0 GW of capacity has been
installed, and after 1.5 GW could drop below 5p/kWh.
The indication is that tidal stream energy could reach the
lowest supported level some time before the entire UK
resource is exploited. At the highest velocity UK sites, the
ultimate lowest cost of energy is estimated to be 3p/kWh.
Near-shore and Shoreline OWCs
As a special case, we considered the cost reduction
potential of near-shore OWCs. Applying a learning rate
of 13%31
to the 15p/kWh central estimate of current
costs (see Figure 7) gave a cost curve similar to those
discussed for offshore wave energy. This suggested that
the high fossil fuel supported level could be reached
after 400 MW total installed capacity, and the low
fossil fuel supported level by around 1.1 GW. However,
the point at which the 6.0p/kWh level is crossed is
close to the total UK near-shore OWC resource, which
indicates that for costs to reduce further, it would be
necessary to develop overseas32.
We did not consider shoreline OWCs for the following
reasons:
� The UK shoreline OWC resource is insignificant
compared to UK electricity demand;
� Progress towards cost reductions is likely to be
constrained by the small resource size (see Section 2);
and
� A large part of the capital costs relate to site-
specific construction work. Unless included in other
large coastal structures (e.g. harbour defences), and
these are to be built in any case, it is difficult to
see how economies of scale could be achieved.
21Future costs of energy
31Source: Arup Energy.
32Overseas developments could happen before the UK resource limit is reached, of course, but this is nevertheless a useful marker.
Figure 11a UK tidal stream cost-resource curves a) Step wise cost-resource curve
Note: Assumes deployments in a logical sequence depending on mean spring peak velocity Vmsp
Sources: Black & Veatch, Entec
0
2
4
6
8
10
12
0 500 1000 1500 2000 2500 3000 3500 4000
Installed Capacity [MW]
Vmsp = 2.5-3.5 m/s
Vmsp = 3.5-4.5 m/s Vmsp = 4.5-5.5 m/s
Vmsp > 5.5 m/s Vmsp < 2.5 m/s
8.5
6.0
5.0
2.5
Cost
of
ener
gy [
p/kW
h]

Similar to the wave energy cost curves, the total
investment can be deduced from the area under the curve
in Figure 11b. This would be £4.3b to achieve the 2.8 GW
capacity. Depending on the base cost of electricity, the
cost of support above the base cost, ROC and LEC support
could be between only a few tens of million pounds to up
to £500m.
Figure 11b UK tidal stream cost-resource curvesb) Smooth cost-resource curve
Note: Solid line indicates central estimates while the dashed lines show
error bands.
4.4 Conclusions
Based on the above, we conclude that:
� There is potential for marine renewable energy to
become competitive with other generation forms in
future;
� In the present market conditions, wave and tidal stream
energy is likely to be more expensive than other
renewables and CCGT until at least hundreds of
megawatts capacity are installed. By way of
comparison, this capacity is equivalent to several
offshore wind farms at the scale currently being
constructed;
� Fast learning or a step change cost reduction is needed
to make offshore wave energy converters cost
competitive for reasonable amounts of investment; and
� Tidal stream energy could become competitive with
current base costs of electricity within the economic
total installed capacity estimated for the UK, 2.8 GW.2.5
56
8.5
0MW
500MW
1GW
1.5GW
2GW
2.5GW
3GW
0
2
4
6
8
10
12
Cumulativeinstalledcapacity
EstimatedUK economic
resource limit
Range of electricityprices excludingROCs and LECs
Range of pricesincluding ROCsand LECs
Estimated costof energy
Co
st o
f en
erg
y [p
/kW
h]
22 Future Marine Energy: Cost competitiveness and growth of wave and tidal stream energy

Can wave and tidal stream farms be developed
to supply large quantities of electricity to the
grid and make material contributions to
energy supplies? What effect would this have
on carbon emissions?
In this section we develop the findings about costs of
energy to consider the growth of marine renewables over
time. Key factors affecting future growth are introduced
and a set of assumptions necessary to take a future view
are stated. We then indicate what progress could be made
up to 2020, including estimates of total installed capacity,
investment and support.
5.1 Key factors affecting growth
Apart from cost of energy, a range of factors will affect
the future growth of marine renewables. These can be
considered in five categories:
� Strategic and security of supply;
� Financial;
� Technology and risks;
� Electricity networks; and
� Environmental and regulatory.
Strategic and security of supply
As apparent in Section 4, sustained high fossil fuel prices
leading to a high base cost of electricity would bring
forward the time when wave and tidal stream energy
become cost-competitive and reduce the necessary costs
of support. In addition, a rising oil price and/or shifts in
domestic and imported fossil fuel supplies in the UK could
raise interest in both the indigenous nature and lack of
fuel price volatility of marine renewables. This could mean
they are considered strategic within the energy mix and
important for security of energy supply. The potential for
carbon emissions reduction and economic development,
as indicated in Section 2, should also be seen in a
strategic context.
Financial
Fundamentally, growth of marine renewables depends on a
willingness to finance both technology development and
project development. Different parties will need to
provide funds at different stages, and it is important to
recognise the entry criteria, risk/reward expectations and
exit points of each investor. Figure 12 indicates the parties
who may be involved and the investment stages between
technology development and initial project development.
Given the early stages of technologies, financial support is
needed particularly for technology development at
present. This includes academic and industrial R&D,
engineering design and prototype testing. Academic R&D
support is likely to come mainly from governments,
although this may be supplemented by a flow of private
equity via technology development companies and/or
university commercialisation initiatives. A combination of
RD&D grants, venture capital and possibly strategic
investments is probable to support technology
development companies in engineering design and
prototype testing.
A few developers of more advanced concepts are now
seeking to develop initial farms. Support to meet current
costs of energy (see Section 3) will be necessary to make
such projects economic, and notably, this is currently
offered in two countries: the UK and Portugal33. While the
support in each country is structured differently, a
common feature is that it is effectively limited to tens of
megawatts of installed capacity. Depending on fossil fuel
prices and the extent of cost reductions within the scope
of the schemes (see Section 4), there may still be a cost
gap after the capacity limits are reached, and it is
uncertain what will happen then; specifically,
whether/how the cost gap will be bridged.
In the UK, the Renewables Obligation ends in 2027. So for
projects to benefit from ROCs over the 20 year period
envisaged in Section 4, they need to be installed by 2007.
It is likely that only a small number of wave and tidal
stream farms will achieve this. Without changes to
legislation, developments commissioned later than 2007
will benefit for only part of their project lives.
23Future growth
5. Future growth
33The UK DTI Wave and Tidal Stream Energy Demonstration Scheme was launched in 2005. This offers a capital grant of up to £5m for any single project plus
revenue support at 10p/kWh for 7 years post-commissioning. A total of £42m is available. In Portugal, revenue support is available at 23 Eurocents/kWh for
projects over 12 years post-commissioning. 50 MW total installed capacity is supported. Details about support in other countries are given in the Forum for
Renewable Energy Development in Scotland (FREDS) 2004 report Harnessing Scotland’s Marine Energy Potential.

Technology and risks
After the availability of finance, the second fundamental
requirement for growth is the readiness of technologies to
be commercially exploited. Finance and technology
readiness are closely linked, and one without the other will
not allow growth to occur.
At any point in time, technology readiness depends on the
rate and continuity of development in preceding years.
Judging by the experience of other technologies, fast,
continuous development is likely to be necessary to
maximise learning and bring about cost reductions in the
shortest possible time.
Important to the rate of development is the size and
number of individual actors, and relationships between
them. Many small, non-collaborating technology developers
are likely to make progress slower than either many small
collaborating actors or a few large non-collaborating ones,
principally due to their ability to attract investment and
deploy resources. However, the extent of collaboration will
be limited by the need to protect commercial intellectual
property (IP) to attract private investment.
Given the wide range of technology options, a key measure
of progress in technology development will be the extent
of convergence on optimal designs. This could be brought
about by collaboration between developers and
consolidation of IP. In parallel, developers of less promising
concepts are likely to fail to attract investment, thereby
further reducing the choice of technology options.
Knowledge on the part of investors to enable the selection
of promising technologies will have an important bearing
on the convergence process.
The success of technology development is also likely to
depend on the approach to managing risks. There is a
commercial pressure to develop rapidly in order to
maximise the value of investments in technology
development, and a related argument that to delay
developments is to delay learning and progress towards cost
24 Future Marine Energy: Cost competitiveness and growth of wave and tidal stream energy
Figure 12 Investment stages in technology development and project development
Initial technology Large-scale Initial small farms Larger farms
development prototype
Purpose of investment Concept and Manufacturing, Consents and As initial farms but
detailed engineering fabrication, permits, resource at larger scale
design, tank model installation and assessment,
testing, sub- testing/monitoring bathymetric and
assembly and sea-going prototype. geotechnical surveys,
component testing See note 1 site civil/electrical
engineering design,
transformers, subsea
cables and
switchgear, device
installation and
monitoring.
See note 2
Destination of Universities and Technology Technology Project developers
investment technology development development or stand-alone
development companies companies, project project vehicles
companies developers or stand-
alone project
vehicles
Risk-return expectation Very high Very high High Medium
Capital required Up to several £100k Several £m per £5m to £10m per Tens of £m per
per concept prototype. project. See note 2 project
See note 1
Notes:
1. This assumes testing at a dedicated facility, development of which has already occurred and been financed by a third party(ies), and which offers readily
available electrical connections. This is the model of the European Marine Energy Centre.
2. Some site development activities may not be necessary, and therefore associated costs not incurred, if third-party test ‘hubs’ are used. This is the model
of the proposed Regen Southwest Wavehub.
Source: Entec

reduction. However, because the engineering challenges of
design, manufacturing, fabrication and installation are
significant, a counter argument is that a slower, more
progressive approach is better to manage risks.
In practice, the balance between progress and risks is
likely to mean developers take a cautious approach to
deployment, particularly for first prototypes and small
initial farms consisting of a few devices. Larger
developments of increasing numbers of devices and
installed capacities could then follow, perhaps expanding
the same sites as initial farms. This represents a step-wise
approach, and both evidence of achieving certain cost and
performance targets and an assessment of marginal risks
are likely to be necessary between each step.
Electricity networks
The growth of marine renewables projects is highly
dependant on the ability to connect to the grid. Network
connection has already been demonstrated to be
technically possible37, but the number of sites where both a
suitable wave or tidal stream energy resource exists and it
is possible to grid-connect is limited. Information on this
constraint is scarce and the UK situation is currently being
investigated by an industry study38
(not complete at the
time of writing).
Where connections are possible around the UK, they will
most likely be to distribution networks close to the coast
which serve small populations. The capacity of these
networks is likely to be limited without modifications and
reinforcements, and given the high costs and risks of initial
wave and tidal stream farms in their own right, upgrade
costs are unlikely to be palatable to developers. This may
restrict the capacity of initial farms and/or the number of
initial individual developments, but the economics of later,
larger projects could possibly support upgrades to
overcome capacity constraints.
Wave and tidal stream farm development also has
implications for transmission networks. Figure 14 shows
that the UK’s most energetic wave energy resources are off
northwest Scotland, but unfortunately grid capacity here is
very limited. Interconnectors to the Scottish islands are
already insufficient to accommodate proposed wind farms,
and without upgrades, wave and tidal stream farms may be
precluded. If marine renewables were developed in
Scotland, north-south power flows could be increased
above levels already foreseen for wind farm developments,
and this has a bearing on the Scottish interconnector.
Managing technical risks in development
Survivability and reliability represent key challenges for
marine renewables, due to the economic consequences
of catastrophic failures and/or long periods of
unavailability. For the technologies to succeed, much
attention needs to be paid to technical risks in design,
construction, installation and operation.
From an engineering perspective, this can be tackled
in two ways. One is by importing knowledge and
experience from other industry sectors, such as
offshore oil and gas, including risk assessment
procedures (e.g. Failure Modes and Effects Analysis34)
and engineering standards. In recognition of this, we
commissioned guidelines on the application of existing
engineering standards to wave energy converters
during the MEC (see Figure 13). The other approach is
rigorous and extensive testing, including single
components, sub-assemblies and complete functional
prototypes. This will require dedicated test facilities
such as those established at EMEC35
and NaREC36, and
also the involvement of supply-chain manufacturers.
A combination of the two approaches is likely to lead
to the fastest development with lowest risks. Judging
by past experience, it could take several years to
develop technical evidence to levels comparable with
other generation technologies (e.g. wind turbines) and
to the satisfaction of investors and insurers.
25Future growth
34Source: Atkins
35The European Marine Energy Centre, Orkney, Scotland
36The New and Renewable Energy Centre, North East England
37In the UK, both EMEC and the Wavegen LIMPET shoreline OWC (Islay) are grid-connected.
38The British Wind Energy Association npower juice Path to Power project. This is also considering regulatory, environmental and financing issues.

For initial wave farms, transmission capacity may be a
secondary issue to the availability of distribution network
connections, due to the ability to locate in many possible
areas, some albeit with a compromise in energy resource,
(which due to subsequently lower performance could cause
costs of energy to be higher). However, if not
accommodated in current upgrade plans, transmission
capacity could be a major constraint to large wave farms
of tens of megawatts capacity. Tidal stream developments
of all sizes may be more affected by distribution and
transmission network constraints than wave farms due to
the more limited number of possible sites.
The electrical engineering design of marine renewables
devices impacts on their ability to be grid-connected.
In particular, the choice of electrical machine and/or use
of an inverter may influence the capacity that can be
installed, due to low fault levels close to the coast.
The response of generators under fault conditions may be
important as installed capacities increase, as has been the
case with wind turbines. However, these concerns are
secondary to network capacity in the short term.
Like the wind, waves and tidal streams are variable
renewable energy sources. Their intermittent generation
has implications for large scale grid integration, but at
small scales is likely to have only a marginal impact on
network management, similar to the effect of wind farms
in the UK today. Variability is therefore not an immediate
concern. In future, there could be some benefits of
combining wave and tidal stream energy with wind energy
(see box overleaf).
26 Future Marine Energy: Cost competitiveness and growth of wave and tidal stream energy
Figure 13 Guidelines on design and operation of wave energy converters
By design, wave energy converters are subject to challenging environmental conditions of large waves and strong
winds, and need to survive large structural forces. Access to offshore wave energy converters is also difficult, which
makes reliable operation with minimal manual intervention important.
Early in the MEC, we identified a need for guidance on the application of existing standards to wave energy
converters. This was in consultation with technology developers and offshore engineering experts, some of whom had
already begun applying standards to their designs. We subsequently commissioned Det Norske Veritas to produce a set
of guidelines that give signposts to particularly relevant standards and an interpretation of where and why these are
helpful. The guidelines are intended mainly as a design aid for wave energy technology developers but should also
interest investors and insurers.
The purpose of the guidelines is not to enforce existing standards onto wave energy converters necessarily. This would
be misguided, since wave energy converters differ from other offshore equipment in several key respects (such as that
they are unmanned and do not carry large quantities of hydrocarbons). Rather, it is intended that the guidelines will
help developers identify where standards may be helpful, and by applying them in these cases, gain a head-start in
designing technical risks out of their concepts.
The guidelines do not represent new technical standards but rather interpret what is known already for the specific
application of wave energy conversion. We see them as a ‘stop-gap’ while dedicated standards for wave energy
converters do not exist. Other parties such as EMEC have also begun work on standards for wave and tidal stream
energy, and these activities are important to the sector.
The Guidelines are available free on the Carbon Trust website.
Qualification of unproven technology
Failure mode identification and risk ranking
Value management and life cycle analysis
Reliability and cost
Safety philosophy
Structural design criteria
Foundation design Mooring system
analysis
Stability and watertight integrityFire protection
Commissioning and handover

27Future growth
Figure 14 UK areas of high wave energy and grid capacity constraints
Sources: Carbon Trust & DTI (2004), Renewables Network Impacts Study; DTI (2004), Atlas of UK Marine Renewable Energy Resources
a) Areas of high wave energy b) Key system capacity constraints
Variability of wave and tidal stream power
The amount of energy in waves and tidal streams naturally varies over time. Consequently, the power output of wave
energy converters and tidal stream energy generators will also vary. It is important to understand the variability of the
resource in order to predict amounts of generation, and also assess implications for grid integration, particularly
balancing supply and demand. Key issues are the degree of variation over different timescales, relationships between
power supply variability and demand variability, and the predictability of variations.
As part of the MEC, we commissioned the Environmental Change Institute at the University of Oxford to look into the
variability of marine energy resources. Key findings of the study are as follows:
� On average, wave power could deliver significantly more energy during high demand periods than at other times;
� Adding wave power to the grid may result in lower overall variability than adding just wind power;
� The capacity credit of a mixed system including wave, tidal stream and wind power could be higher than just wind
power, and the balancing costs could be lower;
� Existing wave forecasting models are valuable for predicting wave power up to five days ahead; and
� Due to the correlation characteristics between wind, wave and tidal stream energy, it could be that electricity
network capacity can be better utilised (allow greater net energy transfer) by a combination of these renewables,
rather than any one singly.
More details of the study are available on the Carbon Trust website.

Environmental and regulatory
Environmental concerns and government regulation may
affect the rate of growth of marine renewables. The
installation and operation of devices is likely to have some
impacts on the local natural environment. Studies to date
suggest that local environmental disbenefits are likely to
be minor, but further research is required into device-
environment interactions39
amongst other topics. The DTI
has allocated £2M of the £50M Marine Renewables
Deployment Fund to environmental studies, and some
Cowrie40
work is relevant to wave and tidal stream energy.
In the UK, processes to consent and permit initial wave and
tidal stream farms have recently been clarified by a DTI
guidance note41, which followed workshops in Spring 2005 to
identify the concerns of developers, government
departments and agencies (including the Crown Estate) and
environmental stakeholders. Environmental impact
assessments will be required, and the required consents
relate to the Electricity Act, Food and Environmental
Protection Act and Coastal Protection Act, similar to offshore
wind developments. Consenting arrangements for larger,
later wave and tidal stream farms are not yet clear, but
Crown Estate competitions for seabed leases could possibly
be held42
like the two rounds to date for offshore wind.
Key aspects of future UK regulatory frameworks are likely
to be Strategic Environmental Assessment (SEA) and marine
spatial planning. The Scottish Executive has begun a SEA
with a view to future wave and tidal stream developments,
and DEFRA is carrying out a marine spatial planning pilot
study. A Marine Bill has been proposed to manage
sustainable development of the UK marine and coastal
environment, and spatial planning is a central concept of
this. The government intends to produce a draft bill in
Autumn 2006, and the bill could be enacted by the end of
2007 at the earliest. The Marine Bill’s implications for wave
and tidal stream projects are unclear, although a stated
intention is to facilitate consents for offshore renewables
projects. It is possible that a new Marine Agency could be
created with responsibility for spatial planning.
Development of wave and tidal stream farms may also
impact upon other sea users and commercial activities,
including shipping, fishing and aggregate extraction.
However, due to limitations of available data, it was not
possible to address these during this study.
5.2 Assessment of growth potential
The number of factors affecting growth and the
relationships between them make growth complex to
model. The limited evidence of some key factors such as
grid capacity compounds this. However, it is possible to
take a ‘what you need to believe’ approach to form a view
on how growth could occur, based on a number of detailed
assumptions.
The following table shows a set of assumptions we have
developed in order to take a view of future growth.
We consider that overall, the assumptions make for an
optimistic but achievable view of the future. Given the
present stage of technologies, it is impossible to
characterise growth beyond 2020 with any certainty, and
for this reason the scope of assumptions is limited to the
next 15 years. All assumptions are made on a Europe-wide
basis.
28 Future Marine Energy: Cost competitiveness and growth of wave and tidal stream energy
39Such as the impact of tidal stream energy generators on flow momentum.
40A UK, industry-funded environmental research organisation for the offshore wind industry.
41DTI (2005), Guidance on consenting arrangements in England and Wales for a pre-commercial demonstration phase for wave and tidal stream energy devices
(marine renewables).42
As envisaged in the DTI consultation paper Future Offshore (2002).

29Future growth
Growth Factors Assumptions: 2005-2010 Assumptions: 2010-2020
Strategic and security � Fossil fuel prices are at sustained high levels, leading the base cost of electricity to rise
of supply gradually to 5.0p/kWh by 2020.
� Technologies converge on five or
fewer optimal concepts (both wave
and tidal stream). Subsequent efforts
are focused on developing these.
� The convergence of technologies
reduces the number of isolated actors
and allows technology development to
accelerate.
� Industrial R&D picks up in parallel
with continuing academic R&D.
� Larger farms up to several tens of
megawatts are developed, and their
performance and reliability is
demonstrated.
� A market pull occurs and causes
deployment rates to accelerate
rapidly.
� Technology development is continuous and
occurs at a rate proportionate to the amount
of finance available.
� Academic R&D efforts accelerate beyond
current levels and focus on key barriers to
cost-competitiveness.
� Detailed design optimisation of better
developed technologies progresses in parallel
with work to prove/disprove alternative
concepts.
� Large-scale prototypes of several types of
wave energy converter and tidal stream
energy generator are successfully
demonstrated.
� In proportion to the capital available for
project development, development of initial
wave and tidal stream farms proceeds to a
total installed capacity of between 60 MW and
100 MW.
� Progress with proving large-scale prototypes
and initial farms dictates overall progress.
� Survivability, performance and reliability
become clearer due to the results of large-
scale prototypes, but uncertainty remains
about large-scale farms.
� Progress with technology development is not
fast enough for a market pull to occur.
Technology and risks
� There is still a cost gap after capacity
limits associated with current support
schemes are reached.
� But the success of demonstrating
prototypes (see below) motivates
further government support and
private investment in both technology
development and project
development.
� £80m capital investment is made to support
academic R&D, engineering design and
prototype testing. This comprises government
grants and venture capital investments.
� Between £120m and £200m capital investment
is made into project development of initial
wave farms. This comprises private equity
investments in projects and government
capital grants.
Financial

5.3 Estimates of future growth
Deployment by 2020
Based on the ‘what you need to believe’ model, we predict
that up to a few gigawatts of wave and tidal stream energy
could be installed across Europe by 2020. Specifically, our
analysis indicates that between 1.0 GW and 2.5 GW of
each of wave energy and tidal stream energy could be
installed.
The investment necessary to reach these levels of
deployment, costs of support above the rising base price
and level of carbon dioxide abatements are shown in
Figure 15 below. To put the table in context:
� The overall deployment is greater than the current
installed capacity of UK wind farms, and equivalent
to several large offshore wind farms43; and
� The progress in increasing installed capacity is similar to
wind energy worldwide between 1980 and 1990. For
comparison, the box overleaf gives further details of
the historic progress of wind energy, including amounts
of public support.
It is possible that a large share of the deployment
envisaged across Europe could occur in the UK. If this
happened, up to one sixth of the UK government aspiration
of 20% renewable energy by 2020 could be met by marine
renewables (i.e. about 3% of total UK electricity demand).
30 Future Marine Energy: Cost competitiveness and growth of wave and tidal stream energy
Growth Factors Assumptions: 2005-2010 Assumptions: 2010-2020
� Risks are managed in progressive, step-wise technology and project development
programmes.
� Technical risks in design, construction, installation and operation are well managed by the
application of appropriate standards and testing.
� The environmental impacts of large-scale prototype wave energy converters and tidal
stream energy generators are monitored. Developments in some coastal areas are
prohibited or restricted by ecological concerns, but this does not restrict overall growth.
� Regulatory arrangements to consent and permit wave and tidal stream farms are
developed. They include strategic environmental assessment and spatial planning, both
of which facilitate rather than hinder developments. Projects take between 12 and
24 months to consent from the time a proposal is raised with the relevant authorities.
Environmental and
regulatory
� Project developers seek connections
for projects of tens of megawatts
installed capacity, some of which
require upgrades.
� Developers of initial wave and tidal stream
farms seek connection points where no
upgrade is required. Network capacity does
not increase due to demand from marine
renewables projects.
� Overall, there are sufficient grid-connectable
wave energy sites that distribution network
capacity is not a constraint. However, the
capacity of most sites is limited to 10 MW,
and the choice of larger sites is restricted.
Electricity networks
Wave energy Tidal stream energy
Total installed capacity (MW) 1,000 to 2,500 1,000 to 2,500
Total capital deployed (£m) 1,000 to 2,500 1,000 to 2,500
NPV cost of support above base electricity cost (£m) 700 to 2,200 500 to 2,000
Annual carbon dioxide abatement (MtCO2/y) 1.0 to 3.3 1.0 to 3.7
43For instance, the London Array is proposed to have a total installed capacity of 1.0 GW. Source: London Array Ltd.
Figure 15 Conclusions from growth model to 2020 across Europe
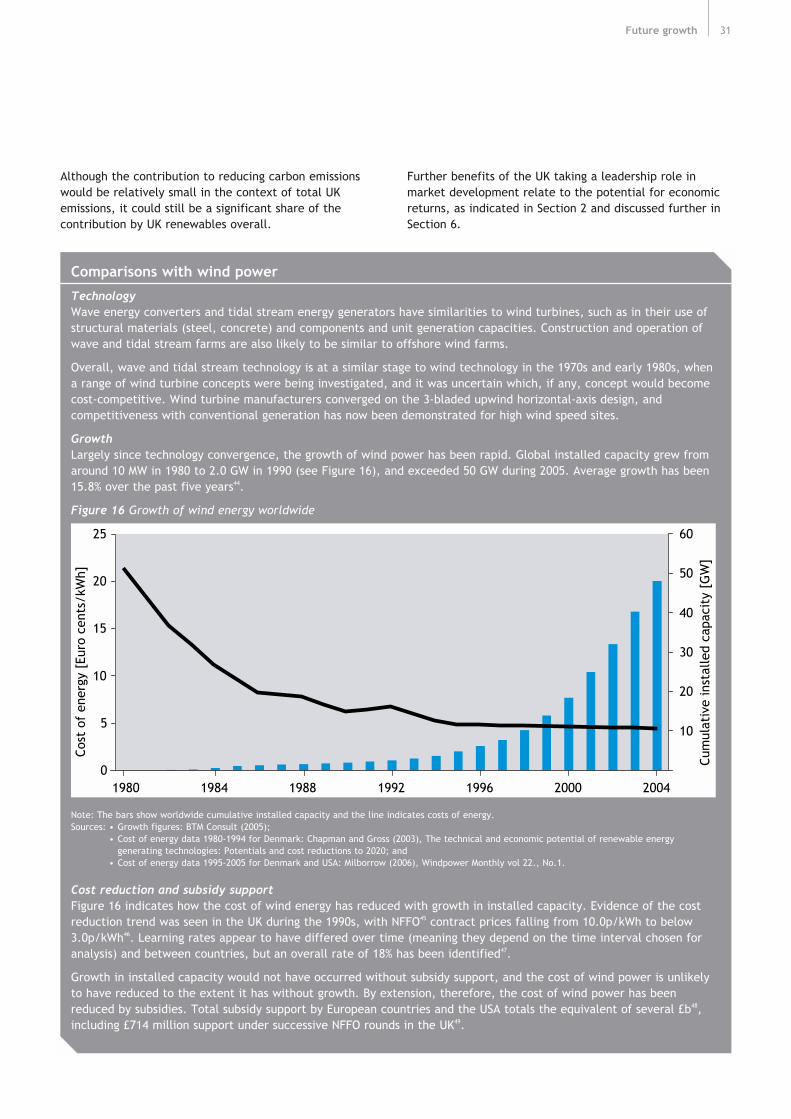
Although the contribution to reducing carbon emissions
would be relatively small in the context of total UK
emissions, it could still be a significant share of the
contribution by UK renewables overall.
Further benefits of the UK taking a leadership role in
market development relate to the potential for economic
returns, as indicated in Section 2 and discussed further in
Section 6.
31Future growth
Comparisons with wind power
TechnologyWave energy converters and tidal stream energy generators have similarities to wind turbines, such as in their use of
structural materials (steel, concrete) and components and unit generation capacities. Construction and operation of
wave and tidal stream farms are also likely to be similar to offshore wind farms.
Overall, wave and tidal stream technology is at a similar stage to wind technology in the 1970s and early 1980s, when
a range of wind turbine concepts were being investigated, and it was uncertain which, if any, concept would become
cost-competitive. Wind turbine manufacturers converged on the 3-bladed upwind horizontal-axis design, and
competitiveness with conventional generation has now been demonstrated for high wind speed sites.
GrowthLargely since technology convergence, the growth of wind power has been rapid. Global installed capacity grew from
around 10 MW in 1980 to 2.0 GW in 1990 (see Figure 16), and exceeded 50 GW during 2005. Average growth has been
15.8% over the past five years44.
Figure 16 Growth of wind energy worldwide
Note: The bars show worldwide cumulative installed capacity and the line indicates costs of energy.
Sources: • Growth figures: BTM Consult (2005);
• Cost of energy data 1980-1994 for Denmark: Chapman and Gross (2003), The technical and economic potential of renewable energy
generating technologies: Potentials and cost reductions to 2020; and
• Cost of energy data 1995-2005 for Denmark and USA: Milborrow (2006), Windpower Monthly vol 22., No.1.
Cost reduction and subsidy supportFigure 16 indicates how the cost of wind energy has reduced with growth in installed capacity. Evidence of the cost
reduction trend was seen in the UK during the 1990s, with NFFO45
contract prices falling from 10.0p/kWh to below
3.0p/kWh46. Learning rates appear to have differed over time (meaning they depend on the time interval chosen for
analysis) and between countries, but an overall rate of 18% has been identified47.
Growth in installed capacity would not have occurred without subsidy support, and the cost of wind power is unlikely
to have reduced to the extent it has without growth. By extension, therefore, the cost of wind power has been
reduced by subsidies. Total subsidy support by European countries and the USA totals the equivalent of several £b48,
including £714 million support under successive NFFO rounds in the UK49.
0
5
10
15
20
25
1980 1984 1988 1992 1996 2000 2004
Cost
of
ener
gy [
Euro
cen
ts/k
Wh]
10
20
30
40
50
60
Cum
ulat
ive
inst
alle
d ca
paci
ty [
GW
]

Deployment beyond 2020
Although it is difficult to characterise growth after 2020,
estimates of the total resource size (see Section 2) suggest
that the industry could develop much further beyond this
date, both in the UK and worldwide.
5.4 Conclusions
Although dependant on a complex array of factors, there
is considerable potential for marine renewables to grow.
By 2020, several gigawatts of generating capacity could
be installed, and potentially meet a small but significant
share of the 2020 UK renewables aspiration. Beyond 2020,
the industry could grow much further.
32 Future Marine Energy: Cost competitiveness and growth of wave and tidal stream energy
44Source: BTM Consult (2005).
45Non-Fossil Fuel Obligation (England and Wales), Scottish Renewables Order and Northern Ireland Non-Fossil Fuel Obligation.
46Source: DTI (2001), A summary of the experience of wind energy support through the NFFO. Note that between the early NFFO rounds, the price reduction
was partly due to a change in contract length.47
Sources: Junginger et al (2005), Global experience curves for wind farms; IEA (2000), Experience Curves for Energy Technology Policy.48
Information on subsidy levels in different countries is fragmented, but the following are useful indications: The US spent $1.2 billion (1999 dollars) between
1947 and 1999 on wind energy subsidies (Source; Goldberg (2000), Federal energy subsidies: Not all technologies are created equal). Denmark spent DKr 3.8
billion (about €0.75 billion) on subsidies for wind between 1993 and 1998, including tax expenditures and prices subsidies (Source: O’Brien et al (2001),
Encouraging Environmentally Sustainable Growth In Denmark, Economics Department Working Papers No. 277, OECD; in money of the day). Germany is
estimated to have spent a total €1.4 billion on R&D support, price subsidies and feed-in tariffs up to 2000, (source: Neij et al (2003), Experience curves- a
tool for energy policy programme assessment). A different source indicates Germany spent around €1 billion on wind support in 2001 alone (Source:
Eurelectric (2004), A Quantitative Assessment of Direct Support Schemes for Renewables). Data collated by Paul Arwas Associates.49
Between 1990 and 2001. Source: Frontier Economics (2001), Evaluation of DTI Support for New and Renewable Energy under NFFO and the Supporting
Programme

33Next steps
The preceding sections indicate the potential for future �cost reduction of wave and tidal stream energy generation,
and how growth could occur over the next fifteen years.
Based on this evidence and our experience of working with
technology developers in the MEC, this final section draws
conclusions on next steps for the development of marine
renewables in the UK.
6.1 Overall perspective
At a high level, we consider that UK public and private
sector organisations should continue to encourage the
creation of a wave and tidal stream industry. This view is
based on:
� The potential for low carbon electricity generation in
this country and others, which could be highly material
amongst efforts to combat climate change and increase
security of energy supplies; and
� The potential significant economic returns to the UK
from sales of generation devices, project development
and revenue from electricity generation, as indicated
in Section 2.
The UK is well placed to leverage its skills and experience
in offshore oil and gas, ship-building and power generation
to accelerate progress in the marine renewables sector and
capture the economic value for the UK. While technologies
are at early stages, support and investment in technology
development can be seen as maintaining the option of
marine renewables for future years, looking ahead to the
time when cost reductions have occurred to an extent
where the technologies are competitive with other
conventional and renewable generation.
We consider there is a strong case for industry to
accelerate the overall pace of development of marine
renewables beyond current levels, which translates into
6. Next steps
Figure 17 Key actions to put marine renewables on the path to growth
� Take a pragmatic, prioritised approach to overcoming environmental uncertainties; and
� Take a proportionate approach to local environmental impacts of small developments,
recognising the global environmental benefits of low carbon generation from future,
larger projects.
Government, industry
and environmental
stakeholders
� Actively consider the future capacity of wave and tidal stream energy when planning grid
modifications and upgrades.
Ofgem and electricity
network operators
� Place greater emphasis on cost reduction topics, particularly to overcome cost barriers
that are common to many device concepts.
Academic researchers
and funding bodies
� Give increased support over time for marine renewables technology development, with
greater support for RD&D and cross-cutting technology issues to help deliver cost reductions;
� Support marine renewables project development from now into the medium term,
contingent on technologies proving technically viable in the first instance, and later,
evidence of reducing costs; and
� Develop a clear long-term policy framework of support to the sector to give greater
investment certainty.
Public sector funders
� Maintain strong focus on cost reduction; and
� Accelerate engineering testing and prototype demonstration to develop track records of
survivability, reliability and generation performance characteristics.
Technology developers

a requirement for both significant further public support
and private investment in development activities.
Given the current costs of energy found in this study, we
think that considerable emphasis needs to be placed on
cost reduction to ensure the commercial viability of wave
and tidal stream technologies. The MEC has demonstrated
that certain technologies have considerable potential
for cost reduction, but further efforts in maximising
performance and minimising capital and O&M costs will
be needed for some years to come.
Key to the availability of private equity is clarity of the
route to market, particularly in recognition of the cost gap
between marine renewables and other means of generating
electricity. Our cost-competitiveness analysis indicates
that public support for costs of energy above those of
conventional power and other renewables will be necessary
in the medium term.
Figure 17 summarises our view of actions key players
should consider to accelerate progress.
6.2 Strategic development
objectives
With wave and tidal stream energy resources being
significant in the UK and overseas (see Section 2) there is
potential for both strong domestic and export markets in
marine renewables. Noting the experience of countries
exporting generation technologies (particularly Denmark
with wind turbines50), considerable returns can be gained
from developing both generation products and services to
construct, install and operate in parallel. We consider that
to maximise economic returns and make the fastest
progress towards cost reduction and growth, UK plc should
encourage both wave and tidal stream technology
development and project development. We therefore see a
need for a two-pronged approach to public support and
private investment, which:
� Accelerates the progress of technology development,
through ongoing RD&D into concept and detailed
engineering design to bring about substantial reductions
in cost; and
� Encourages early development of wave and tidal stream
farms to accelerate learning effects.
Noting the key barriers identified in this report of high
costs, uncertain costs and performance, and the unproven
nature and diversity of technologies, we identify four key
objectives for development support:
1. Maximise the extent of cost reductions by all four of the
routes identified in this study (concept design
improvements, detailed design optimisations, economies
of scale and learning). For offshore wave energy, set an
environment for fast learning and maximise the
likelihood of step change cost reductions;
2. Increase certainty about costs and performance;
3. Develop track records of survivability and reliability; and
4. Encourage convergence on optimal technologies as soon
as possible.
34 Future Marine Energy: Cost competitiveness and growth of wave and tidal stream energy
50For details, see the case study in Carbon Trust (2003), Building Options for UK Renewable Energy.

Approach to technology development
Our assessment of a range of technologies in the MEC leads
us to the view that there are no fundamental engineering
barriers to the technical proving of wave and tidal stream
energy devices. However, considerable further engineering
effort will be necessary to see wave energy converters and
tidal stream energy generators succeed.
To maximise the likelihood of success, we see a strong
need to:
� Accelerate the development of promising technologies
that are already advanced. This should not be without
heed to the balance of progress and risks, but is in
recognition that a considerable number of engineering
challenges lie ahead;
� Continue investigating promising concepts that are less
advanced but have potential to compete with current
front-runners; especially those offering step change cost
reductions. This is because current front-runners may
not ultimately be most economic; and
� Stop developing unpromising technologies. This sounds
obvious, but, in our assessment, some concepts
currently being pursued, including those falling outside
the lowest-cost groups described in Section 3, are
unlikely ever to be cost-competitive.
Technical barriers to project development
Apart from generation technologies, there are a range of
technical barriers to development of wave and tidal stream
farms. These are related to financing and insurance, and
can be defined on a top-down basis by considering the
evidence needed to satisfy a technical due diligence
exercise. Present uncertainties include a lack of:
� Proven methodologies to conduct resource assessments
and energy yield predictions, which are key inputs to
project financial models;
� Standards for certification of device structural integrity,
reliability and moorings or foundations; and
� Evidence of long-term availability, linked to robust
maintenance philosophies.
Again, from an engineering perspective, we see no reasons
why these barriers cannot be overcome. Some are likely to
be solved in the course of technology development, but we
see a role for coordinated industry projects in parallel.
6.3 Development costs
and timescales
Our experience of the MEC and observations about the
progress of technology development teams indicate that:
� Evaluation of wave and tidal stream concepts to the
point that costs of energy are reasonably firm can cost
up to several hundred thousand pounds;
� Development of engineering designs to the point of
finalisation for initial large-scale prototypes is likely to
cost several million pounds; and
� Manufacturing, installation and testing a large-scale
prototype is also likely to cost several million pounds.
Furthermore, the capital costs of initial wave and tidal
stream farms are likely to be upwards of £5m per project,
with several hundred thousand pounds of O&M costs.
Given the progress of successful technology development
teams to date, we think the passage of designs from initial
concepts to full-scale prototypes is likely to take at least
five years. Initial projects could take between one year and
three years to develop and finance, and can be expected to
operate for at least 5-10 years in order to make
investments worthwhile. Noting these timescales, it can be
concluded that substantial public funding and private
investment in technology development is likely to be
needed for at least 10 years. In addition, public support for
project development will be necessary for at least 15 years.
6.4 Approach to future support
and investment
We consider that greater private investment in technology
development is likely to be most material to accelerating
progress and achieving cost reductions. At present, there is
an important role for venture capital and strategic
investments, and more involvement of both large industrial
equipment manufacturers and smaller, more specialist
manufacturers, fabricators and installers could bring great
benefits.
However, public funding and policy support are also
critical, and public sector organisations need to take a
leadership role for two key reasons:
� While technology risks are high, the appetite of private
investors in technology development will be limited.
Interest is picking up but will take time to grow as
uncertainty reduces and track records are developed; and
35Next steps

� In order for technology developers to make robust cases
for private investment, they must be able to
demonstrate a clear route to market which satisfies
investors’ entry and exit criteria. Crucially, this requires
a visible long-term policy commitment to support cost
reduction and growth.
6.5 Next steps for the
Carbon Trust
Based on the success of the MEC, the Carbon Trust intends
to continue to play an active role in supporting marine
renewables. We are already forming ideas of what to do
next in discussion with industry players and will develop
these over the coming months. We are also developing the
above conclusions within a review of the policy framework
to support renewables to 2010 and 2020, which will form
part of our input to the UK Energy Review and be
published later in 2006.
As further specific outcomes of this work, we intend �to publish two technical reports:
� A summary of the MEC methodology for cost of energy
assessment. This is to help others replicate the MEC
process and help bring clarity and consistency to the
commercial assessment of device concepts; and
� A summary of R&D requirements for cost reduction.
This is to input to the R&D Roadmap initiative being
conducted by Edinburgh University under the Future
Sources of Energy theme of the UK Energy Research
Centre.
36 Future Marine Energy: Cost competitiveness and growth of wave and tidal stream energy


The Carbon Trust works with business and the public sector to cut carbon emissions and capture the commercial
potential of low carbon technologies.
An independent company set up by the Government to help the UK meet its climate change obligations through
business-focused solutions to carbon emission reduction, the Carbon Trust is grant funded by the Department
for Environment, Food and Rural Affairs, the Scottish Executive, the Welsh Assembly Government and Invest
Northern Ireland.
Whilst the Carbon Trust and its consultants that have contributed to this report have taken reasonable steps to
ensure that the information contained in the report is correct, they give no warranty and make no representation
as to its accuracy and accept no liability for any errors or omissions. Neither the Carbon Trust or its consultants
are providing investment advice in this report and you must take your own view on the merits of, and the risks
attached to, any investment decision you may undertake. You may wish to obtain professional advice.
Nothing in this publication is intended to be, or should be interpreted as, an endorsement of or recommendation
for any supplier, service or product.
Any trademarks, service marks or logos used in this publication and copyright in it are the property of the Carbon
Trust. Nothing in this publication shall be construed as granting any licence or right to use or reproduce any of the
trademarks, service marks, logos, copyright or any proprietary information in any way without the Carbon Trust’s
prior written permission. The Carbon Trust enforces infringements of its intellectual property rights to the full
extent permitted by law.
The Carbon Trust is a company limited by guarantee and registered in England and Wales under
Company number 4190230 with its Registered Office at: 8th Floor, 3 Clement’s Inn, London WC2A 2AZ.
Printed on paper containing a minimum of 75% de-inked post-consumer waste.
Published in the UK: January 2006.
© The Carbon Trust 2006. All rights reserved. CTC601
www.thecarbontrust.co.uk
0800 085 2005


