

FY2021 Financial Results for the 1st Half
サワイグループホールディングス株式会社
4887.T, TSE 1st section
Nov 12, 2021

© 2021 SAWAI GROUP HOLDINGS Co., Ltd. 2
FY 2020 1H FY 2021 1H
YoY
Japan US Japan US
Net Sales 90,172 72,098 18,074 97,302 82,818 14,484+7.9%
(+7,130)
Core Operating
Income 17,581 14,307 3,268 16,120 16,219 -107-8.3%
(-1,461)
Operating
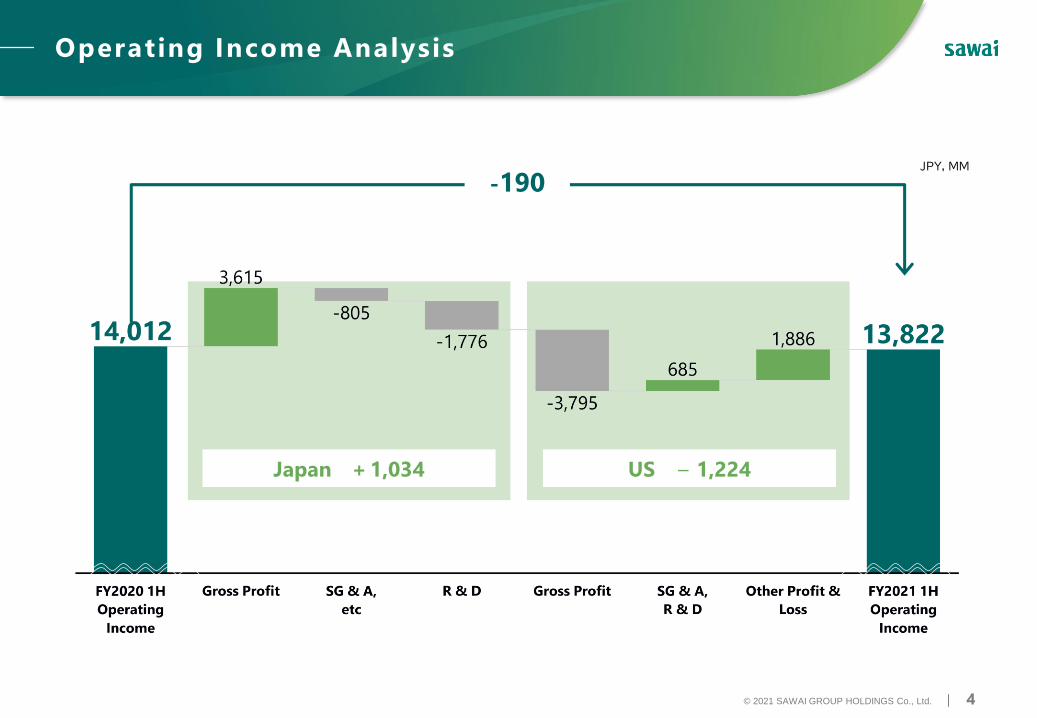
Income 14,012 13,397 615 13,822 14,431 -609-1.4%
(-190)
Profit before
tax 13,812 - - 13,649 - --1.2%
(-163)
Profit
attributable to
owners of the
parent
10,800 - - 9,422 - --12.8%
(+1,378)
Over view
- Results by segment in Japan and the U.S. are not consistent with the overall figures, as each segment profit includes inter-segment transactions.
- Core operating income is calculated by excluding profits and losses attributed to non-recurring factors from operating income.
Japan: Despite the impact of the NHI drug price revision, both sales and core operating income exceeded the same
period of the previous fiscal year due to increased sales of products launched in FY2020 and increased demand for
Sawai Pharmaceutical products due to the supply stoppages etc. of products from other generics companies.
United States: Both sales and core operating income decreased from the same period last year, due to the impact of
competitor entries into key USL generic product markets.JPY, MM
Average rate US$1= ¥107 US$1= ¥110

© 2021 SAWAI GROUP HOLDINGS Co., Ltd. 3
Japan + 1,902 US - 3,374
-1,461JPY, MM
- Results by segment in Japan and the U.S. are not consistent with the overall figures, as each segment profit includes inter-segment transactions.
Core Operating Income Analysis
© 2021 SAWAI GROUP HOLDINGS Co., Ltd. 4
Japan + 1,034 US - 1,224
-190
Operating Income Analysis
JPY, MM

© 2021 SAWAI GROUP HOLDINGS Co., Ltd. 5
Sales by Channel in Japan, Unconsolidated
(単位:軒、%)
Significant growth in sales due to the adoption of products launched in FY2020 and main products.
Medical institutions FY2020 1H FY2021 1H YoY
ChannelTotal,
Nationwide# of
Customers
Sales
Share
# of
Customers
Coverage
Rate
Sales
Share
# of
Customers
Sales
Growth
Hospital 8,249 7,978 10.9% 7,975 96.7% 9.9% -3 +7.0%
DPC*
Hospital 1,757 1,748 6.6% 1,749 99.5% 6.0% +1 +7.3%
Clinic 106,677 35,249 9.0% 36,768 34.5% 8.5% +1,519 +11.2%
Pharmacy 89,352 58,815 78.9% 59,821 66.9% 80.5% +1,006 +20.1%
Dispensing 62,270 58,527 78.3% 59,538 95.6% 80.0% +1,011 +20.3%
Drug Stores,
etc. 27,082 288 0.6% 283 1.0% 0.5% -5 +1.8%
Others - - 1.2% - - 1.1% - +7.9%
Total 204,278 102,042 100.0% 104,564 51.2% 100.0% +2,522 +17.1%
*DPC: Diagnosis Procedure Combination, a fixed payment system for inpatients

© 2021 SAWAI GROUP HOLDINGS Co., Ltd. 6
2,182 2,401(+10.1%)
2,338 2,542(+8.7%)
2,093 2,317(+10.7%)
2,982 3,556(+19.3%)
834 1,013(+21.5%)
3,236 3,447(+6.5%)
3,217
3,467(+7.7%)808
1,034(+28.0%)4,428
8,934(+101.8%)
1,203(-)
0
5,000
10,000
15,000
20,000
25,000
30,000
35,000
FY2020 1H FY2021 1H
FY2021 FY2020
FY2019 FY2018
FY2017 FY2016
FY2015 FY2014
FY2013 FY2012
Sales by Product Launch Year, Japan
Steady growth in sales of products launched in FY2020
72,098(Excluding others : 49,979)
82,818(YoY +14.9%)
(Excluding others : 52,905)
JPY, MM

7© 2021 SAWAI GROUP HOLDINGS Co., Ltd.
FY2020 1H FY2021 1HYoY
Actual Comp. Actual Comp.
Gener ic
products 15,126 83.7% 10,263 70.9% -32.1%
Main
products *1 8,584 47.5% 4,675 32.3% -45.5%
New
produ c t s
l a u n c h ed i n
FY2021
‐ ‐ 351 2.4% ‐
O t her s 6,542 36.2% 5,237 36.2% -19.9%
Brand
products *2 2,948 16.3% 4,221 29.1% +43.2%
Tota l 18,074 100.0% 14,484 100.0% -19.9%
FY2020 1H FY2021 1HYoY
Actual Comp. Actual Comp.
C en t ra l n e rv ou s
s y s t em 9,215 51.0% 7,171 49.5% -22.2%
Ca rd iov a s c u l a r 5,726 31.7% 4,948 34.2% -13.6%
D erm a t o log i c
a gen t s 341 1.9% 616 4.3% +81.0%
Horm on e
p repa ra t ion s
( i n c lu d i n g
a n t iho rmone
prepa ra t ion s )
613 3.4% 583 4.0% -5.0%
Agen t s fo r
u rogen i t a l
o rga n s a n d t h e
a n u s
866 4.8% 360 2.5% -58.5%
O t h er s 1,312 7.2% 806 5.5% -38.6%
Tota l 18,074 100.0% 14,484 100.0% -19.9%
JPY, MM
Sales declined significantly, due to the impact of competitor entries into key USL generic product markets.
Steady progress in brand products.
Three products have launched in the first half of FY2021.
▍By Segment ▍By therapeutic areas
*1 Klor-con® 、Chlorpromazine、Qudexy®
*2 Zembrace® Symtouch®、Tosymra™ 、Vigadrone®
US Sales Analysis
Average rate US$1= ¥107 US$1= ¥110
JPY, MM

8© 2021 SAWAI GROUP HOLDINGS Co., Ltd.
865
1,254
1,345
1H FY20
Actual
1H FY21
Plan
1H FY21
Actual
Net Sales (Zembrace & Tosymra)
Drive improved Average Selling Price (ASP) through improved
Prior Authorization (PA) performance (both submission rates
and success rates for submitted PAs) and new Platinum Pass
business rules
Drive new prescription growth via new Direct-to-Consumer
channel partnerships with Cove, an online migraine
telemedicine company, and two regional pharmacies to
conduct patient consultations on non-oral migraine solutions
(Tosymra)
Engage new managed care partner, Eversana, and leverage
real world economic data to influence better coverage from
managed care
Continue to drive first fill success through specialty
pharmacy channel with Blink Pharmacy
▍Key Actions to Accelerate Tosymra Growth
Combined performance for Zembrace and Tosymra is ahead of expectations for FY21; Tosymra volumes are
in line with plan while Revenue is slightly behind plan due to lower than planned average selling price (ASP)
Zembrace & Tosymra Performance, US
JPY, MM

© 2021 SAWAI GROUP HOLDINGS Co., Ltd. 9
FY 2021 Full Year Forecast FY2021 1H Actual Progress
rate for
full-year
forecastsJapan US Japan US
Net Sales 196,400 163,700 32,700 97,302 82,818 14,484 49.5%
Core
Operating
Income31,300*3 27,900 3,400 16,120 16,219 -107 51.5%
Operating
Income 26,400 26,400 0 13,822 14,431 -609 52.4%
Profit before
tax 26,100 - - 13,649 - - 52.3%
Profit
attributable
to owners of
the parent
19,500 - - 9,422 - - 48.3%
The business in Japan grew steadily, while the sales in the US fell short of the initial forecast due to a sharp decline
in sales of main generics products.
On a consolidated basis, both net sales and core operating income slightly exceeded the FY2021 first half forecast.
Our full-year forecast remains unchanged as the circumstances surrounding the business environment are unclear,
considering shipment adjustments due to the supply stoppages of products from other generics companies etc.
Progress towards FY2021 Forecasts, Consolidated
*1 Results by segment in Japan and the U.S. are not consistent with the overall figures, as each segment profit includes inter-segment transactions.
*2 Core operating income is calculated by excluding profits and losses attributed to non-recurring factors from operating income.
*3 Adjust the followings from operating income
- Japan: SG&A expenses 500, R&D expenses 1,000
- US : SG&A expenses 4,600, R&D expenses 600, other income and expenditure -1,800
JPY, MM
Average rate US$1= ¥110 US$1= ¥110
Progress of
the Mid-Term Business Plan,
“START 2024”

© 2021 SAWAI GROUP HOLDINGS Co., Ltd. 11
Investment to Increase Production Capacity in Japan
Decided to invest in the construction of a new solid dosage form facility in order to increase production capacity
As a result of this investment, the total in-house production capacity of Sawai Pharmaceutical increases by
approximately 20% from the current capacity, 15.5 billion tablets per year
▍Overview
PurposeIn response to rising demand and further market
expansion for generics in the future
Planned
amount of
Investment
STEP1 : approx. 35 billion yen
STEP2 : approx. 5.5 billion yen
Production
Capacity
STEP1 : 2 billion tablet capacity to be added in 2024
STEP2 : 1 billion tablet capacity to be added
(Step 2 will be implemented without delay in
consideration of market trends including other companies
and the status of our new product development)
Number of new
employment
(plan)
STEP1 : 330
STEP2 : 490 (Total number including step 1)
▍Schedule
From Dec. 2023
Construction
Completion
From Jan.2024
Fully
Operational
From Apr. 2024
(STEP1 Completion)
Start Shipping
From Oct. 2021
(11 month)
Design
From Sep. 2022
Construction
Commencement
From Oct. 2023
(7 months)
Validation

12Copyright © 2021 Sawai Pharmaceutical Co., Ltd. All Rights Reserved.
Meaningful positive Net Income impact beginning in 2023 through
consolidation of facilities and repatriation of CMO products
Improved efficiencies driven by the long-term benefit of consolidating
operations into modernized facility
Improved quality through electronic batch records, better material
and manufacturing flow and improved equipment
Project to Create a New Factory in the US
2
3
Project to Create a New Factory
We continue to be on schedule and budget for the consolidation of our
Denver, CO and Plymouth, MN manufacturing facilities into a modern
facility connected to our Maple Grove, MN HQ to lower operating
expenses and improve quality and efficiency.
▍Key Milestones
Construction for Denver Products
Complete
Qualification & validation complete Denver product transfer complete
Despite the environment due to COVID, we focused on
cost/schedule control with external consultants and are on schedule
and within expected budget
Denver site sale completed in April 2021 with flexible lease-back to
allow for certain transfer of Denver product to Maple Grove facility
Maple Grove Pilot Plant is fully operational
Phase 2 build-out to transfer Plymouth products and allow for sale
of Plymouth plant will be considered in Q3 FY21
Dec 2022Jul 2022Feb 2022
Expected Benefits Cost Estimates & Deliverables

© 2021 SAWAI GROUP HOLDINGS Co., Ltd. 13
New Businesses: Launch of Personal Health Record
Management App, “SaluDi”
Medical
Institutions
Useful data and
health data
management format
Inputting and
recording PHR data
This app features functions of recording and managing daily health conditions, making online medical care
appointments, consultation, and access to information on pre-symptomatic illness and disease prevention.
This is the first step to realize “Contributing to improving people's lifestyles, health, and quality of life by
providing and utilizing medical and health information, not only pharmaceuticals” set in our medium-term
business plan, “START 2024” announced in May 2021.
Confirmation
of PHR data
PHR data
upload
Sawai Pharma App
SaluDi is an OEM app of Smart One Health provided by Integrity Healthcare.
Smart One
Health Cloud
PHR management
System
Patients
Measuring
equipment
Plans to expand targets
for companies, health
insurance associations,
local governments, etc.
Integrating patient data to visualize their
health conditions
Medical and Nutritional Guidance
(Prevention and treatment of chronic diseases
such as lifestyle-related diseases)

R e f e r e n c e
M a t e r i a l s

© 2021 SAWAI GROUP HOLDINGS Co., Ltd. 15
Comparison of Sales Volume by Therapeutic Area, Japan
Significant increase in sales volume for each therapeutic category.
FY2020 1H FY2021 1HYoY
(volume)
YoY
(value)Comp. Comp.
Cardiovascular drugs 30.0% 30.2% +21.5% +10.0%
Gastro-intestinal
drugs 19.0% 17.2% +8.9% +2.7%
Central nervous
system drugs 13.4% 13.8% +23.9% +27.2%
Blood/body fluid
pharmaceutical
products8.4% 8.6% +22.8% +15.2%
Other metabolic
drugs 6.9% 7.0% +22.9% +21.4%
Vitamin drugs 5.2% 6.0% +38.4% +51.9%
Respiratory organ
agents 5.1% 4.9% +16.2% +14.2%
Antibiotics drugs 1.8% 1.9% +23.9% +20.7%
Agents for urogenital
organs and the anus 1.5% 1.7% +40.2% +21.3%
Others 8.7% 8.7% +21.7% +9.0%
Total 100.0% 100.0% +20.6% +14.9%
(Unit: %)

16© 2021 SAWAI GROUP HOLDINGS Co., Ltd.
FDA ANDA Activity, US
Source: US FDA
440409
492
650
763 781
935
737
2013 2014 2015 2016 2017 2018 2019 2020
ANDA Approvals
107
179 170
248214
606
388
293
2013 2014 2015 2016 2017 2018 2019 2020
Approved ANDAs Withdrawn
The FDA approved 737 new ANDA products in their FY2020 (Oct 19-Sep 20), down from the record
935 approvals in FY2019. ANDA’s withdrawn peaked in FY2018 and have declined the past two
years. Approvals and withdrawn ANDA’s are trending to end slightly lower for FDA’s FY2021.
17© 2021 SAWAI GROUP HOLDINGS Co., Ltd.
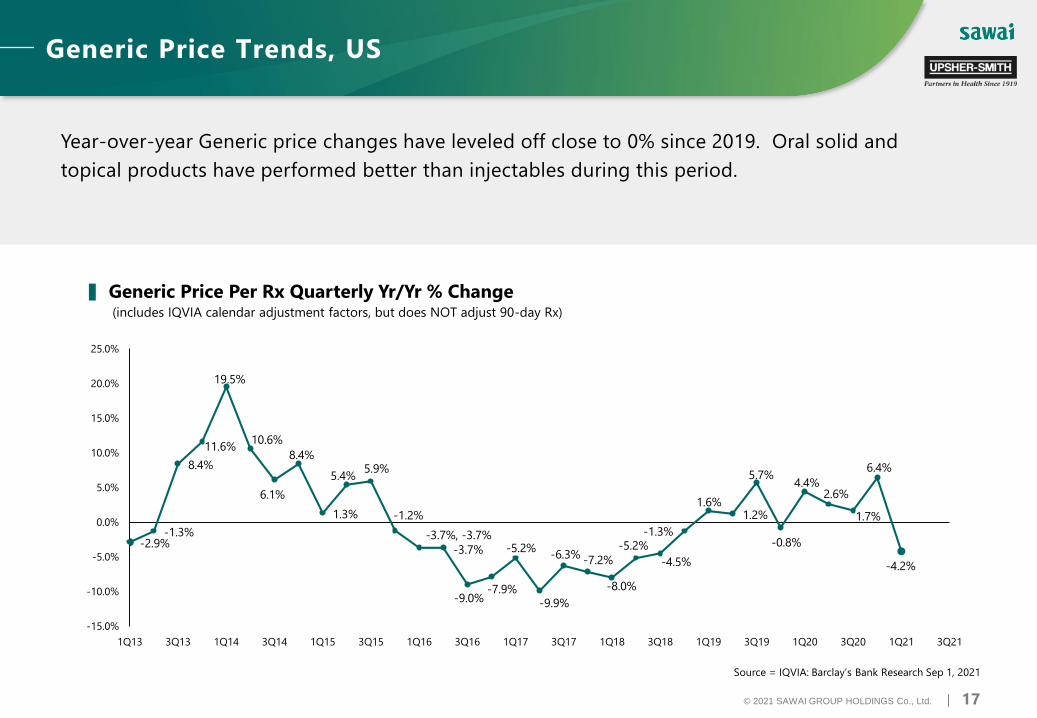
Source = IQVIA: Barclay’s Bank Research Sep 1, 2021
Generic Price Trends, US
Year-over-year Generic price changes have leveled off close to 0% since 2019. Oral solid and
topical products have performed better than injectables during this period.
-2.9%-1.3%
8.4%
11.6%
19.5%
10.6%
6.1%
8.4%
1.3%
5.4%5.9%
-1.2%
-3.7%, -3.7%
-3.7%
-9.0%-7.9%
-5.2%
-9.9%
-6.3%-7.2%
-8.0%
-5.2%
-4.5%
-1.3%
1.6%1.2%
5.7%
-0.8%
4.4%2.6%
1.7%
6.4%
-4.2%
-15.0%
-10.0%
-5.0%
0.0%
5.0%
10.0%
15.0%
20.0%
25.0%
1Q13 3Q13 1Q14 3Q14 1Q15 3Q15 1Q16 3Q16 1Q17 3Q17 1Q18 3Q18 1Q19 3Q19 1Q20 3Q20 1Q21 3Q21
Generic Price Per Rx Quarterly Yr/Yr % Change(includes IQVIA calendar adjustment factors, but does NOT adjust 90-day Rx)

© 2021 SAWAI GROUP HOLDINGS Co., Ltd. 18
Consolidated Financial Highlights-1
* Core operating income + amortization and depreciation expenses included in core operating income
FY2020 Actual FY2021 Actual FY2021 Forecast
1Q/Sales
(%)1Q
/Sales
(%)YoY 1H
/Sales
(%)Full Year
/Sales
(%)YoY
Net Sales 90,172 100.0% 97,302 100.0% 7.9% 94,800 100.0% 196,400 100.0% +4.9%
Cost of Sales 54,103 60.0% 61,414 63.1% 13.5% 58,800 62.0% 120,600 61.4% +5.1%
Gross Profit 36,069 40.0% 35,888 36.9% -0.5% 36,000 38.0% 75,800 38.6% +4.6%
SG&A Expenses 16,110 17.9% 16,196 16.6% 0.5% 17,100 18.0% 34,800 17.7% -12.9%
R&D Expenses 6,148 6.8% 8,118 8.3% 32.0% 7,400 7.8% 16,400 8.4% +18.1%
Other
income( expenses) 202 0.2% 2,247 2.3% 1011.8% 1,800 1.9% 1,800 0.9% +557.1%
Core operating
income 17,581 19.5% 16,120 16.6% -8.3% 14,800 15.6% 31,300 15.9% -8.1%
Operating Income 14,012 15.5% 13,822 14.2% -1.4% 13,300 14.0% 26,400 13.4% +39.8%
Profit before tax 13,812 15.3% 13,649 14.0% -1.2% 13,100 13.8% 26,100 13.3% +41.4%
Profit attributable to
owners of the parent10,800 12.0% 9,422 9.7% -12.8% 10,000 10.5% 19,500 9.9% +58.0%
EBITDA * 23,364 25.9% 21,464 22.1% -8.1% 20,400 21.5% 42,500 21.6% -6.6%
As of March 31,
2021
As of Sep 30,
2021
Total Assets 393,341 398,667
Equity 240,750 248,567
Ratio of equity attributable
to owners of the company
to total assets (%)
55.5% 56.7%
FY2020 1H
Actual
FY2021 1H
Actual
FY2021 Full
Year Forecast
Basic earnings
per share246.65 215.15 445.29
Diluted earnings
per Share246.41 214.96 -
Dividend 65.00 65.00 130.00
JPY, MM
▍Key Balance Sheets Data ▍Amounts Per
Common Share
▍Key Income Statements Data
JPY, MMJPY

© 2021 SAWAI GROUP HOLDINGS Co., Ltd. 19
Consolidated Financial Highlights-2
FY2020 Actual FY2021 Actual FY2021 Forecast
1H /Sales(%) 1H /Sales(%) YoY Full Year /Sales(%) YoY
Net Sales 72,098 100.0% 82,818 100.0% +14.9% 163,700 100.0% +6.6%
Cost of Sales 45,437 63.0% 52,544 63.4% +15.6% 103,600 63.3% +6.4%
Gross Profit 26,660 37.0% 30,275 36.6% +13.6% 60,100 36.7% +7.0%
SG&A Expenses 9,885 13.7% 10,861 13.1% +9.9% 23,300 14.2% +6.8%
R&D Expenses 3,434 4.8% 5,210 6.3% +51.7% 10,400 6.4% +27.9%
Other
income( expenses)55 0.1% 215 0.3% +291.9%
0- -
Core operating
income14,307 19.8% 16,219 19.6% +13.4% 27,900 17.0% -7.8%
Operating Income 13,397 18.6% 14,431 17.4% +7.7% 26,400 16.1% +0.4%
EBITDA * 19,552 27.1% 21,008 25.4% +7.4% 37,900 23.2% -6.7%
* Core operating income + amortization and depreciation expenses included in core operating income
FY2020 Actual FY2021 Actual FY2021 Forecast
1H /Sales(%) 1H /Sales(%) YoY Full Year /Sales(%) YoY
Net Sales 18,074 100.0% 14,484 100.0% -19.9% 32,700 100.0% -2.8%
Cost of Sales 8,665 47.9% 8,870 61.2% +2.4% 17,000 52.0% -2.2%
Gross Profit 9,409 52.1% 5,614 38.8% -40.3% 15,700 48.0% -3.4%
SG&A Expenses 6,228 34.5% 5,349 36.9% -14.1% 11,500 35.2% -36.5%
R&D Expenses 2,718 15.0% 2,913 20.1% +7.2% 6,000 18.3% +4.0%
Other
income( expenses)153 0.8% 2,039 14.1% +1233.0%
1,8005.5% +649.3%
Core operating
income3,268 18.1% - 107 - - 3,400 10.4% -9.7%
Operating Income 615 3.4% - 609 - - 0 - -
EBITDA * 18,074 100.0% 14,484 100.0% -19.9% 32,700 100.0% -2.8%
▍Sales and Operating Income by Area, Japan
▍Sales and Operating Income by Area, US
JPY, MM
JPY, MM

© 2021 SAWAI GROUP HOLDINGS Co., Ltd. 20
Consolidated Financial Highlights-3
FY2020 1H Actual FY2021 1H Actual
Ful l Bas isAdjusting Core
BasisFul l Bas is
Adjusting Core
BasisJapan US Japan US
Net Sales 90,172 - - 90,172 97,302 - - 97,302
Cost of Sales -54,103 126 32 -53,944 -61,414 -196 57 -61,553
Inventory step-up -21 - 21 - - 6 - 6 -
Impairment loss - - - - - - - -
Others -137 126 12 - -38 38 0 -
Gross Profit 36,069 126 32 36,227 35,888 -196 57 35,750
SG&A Expenses -16,110 264 2,361 -13,485 -16,196 300 2,080 -13,816
Amortization of intangible
assets-2,625 264 2,361 - -2,382 296 2,086 -
Others - - - - 3 4 -6 -
R&D Expenses -6,148 575 412 -5,161 -8,118 1,899 404 -5,814
Amortization of intangible
assets- 819 456 363 - -972 568 404 -
Impairment loss -168 119 49 - -1,331 1,331 - -
Other income 210 -57 -153 - 2,254 -220 -2,034 -
Other expenses -9 6 3 - -6 6 - -
Operat ing Income 14,012 913 2,655 17,581 13,822 1,791 507 16,120
JPY, MM
▍Adjusted from Full basis to Core basis
© 2021 SAWAI GROUP HOLDINGS Co., Ltd. 21
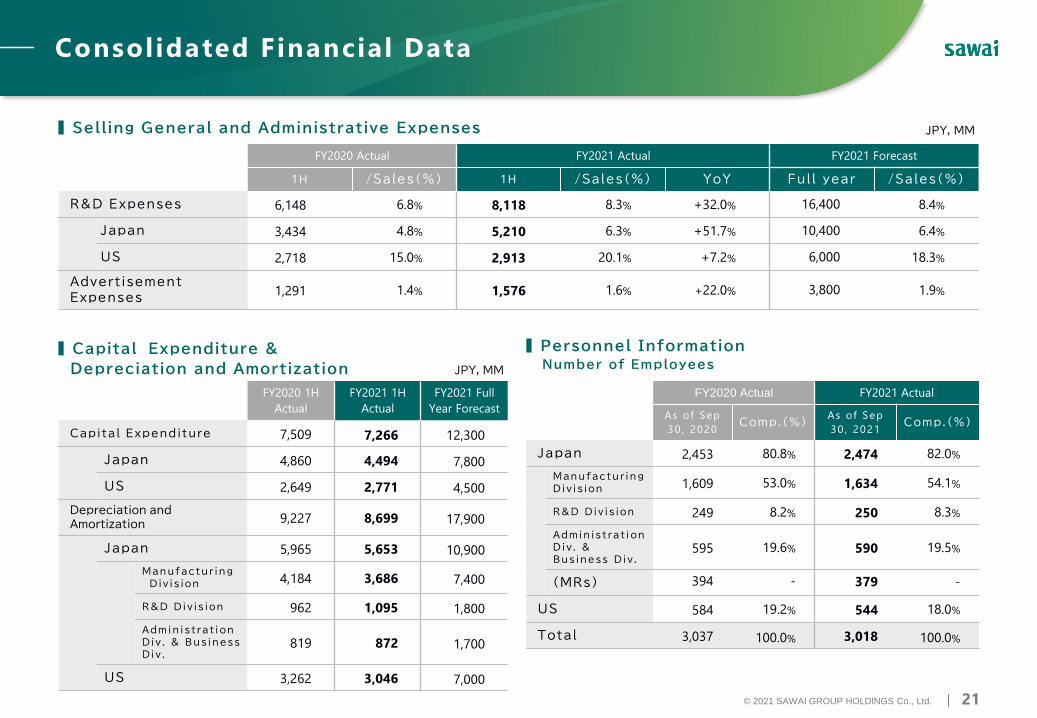
Consolidated Financial Data
FY2020 Actual FY2021 Actual FY2021 Forecast
1H /Sales(%) 1H /Sales(%) YoY Full year /Sales(%)
R&D Expenses 6,148 6.8% 8,118 8.3% +32.0% 16,400 8.4%
Japan 3,434 4.8% 5,210 6.3% +51.7% 10,400 6.4%
US 2,718 15.0% 2,913 20.1% +7.2% 6,000 18.3%
Advertisement
Expenses1,291 1.4% 1,576 1.6% +22.0% 3,800 1.9%
FY2020 1H
Actual
FY2021 1H
Actual
FY2021 Full
Year Forecast
Capital Expenditure 7,509 7,266 12,300
Japan 4,860 4,494 7,800
US 2,649 2,771 4,500
Depreciation and
Amortization 9,227 8,699 17,900
Japan 5,965 5,653 10,900
Manufactur ing
Div is ion 4,184 3,686 7,400
R&D Div is ion 962 1,095 1,800
Admin istrat ion
Div . & Business
Div .819 872 1,700
US 3,262 3,046 7,000
FY2020 Actual FY2021 Actual
As of Sep
30 , 2020Comp.(%)
As of Sep
30 , 2021Comp.(%)
Japan 2,453 80.8% 2,474 82.0%
Manufactur ing
Div is ion 1,609 53.0% 1,634 54.1%
R&D Div is ion 249 8.2% 250 8.3%
Admin istrat ion
Div . &
Business Div .595 19.6% 590 19.5%
(MRs) 394 - 379 -
US 584 19.2% 544 18.0%
Total 3,037 100.0% 3,018 100.0%
JPY, MM▍Selling General and Administrative Expenses
▍Capital Expenditure &
Depreciation and Amortization
▍Personnel Information
Number of EmployeesJPY, MM

© 2021 SAWAI GROUP HOLDINGS Co., Ltd. 22
The plans, forecasts, strategy and other information regarding the Sawai Group contained in
this presentation are based on the Company’s assumptions and judgments using information
available at the time of publication. Therefore, due to potential risks and uncertainties, there
is no guarantee of the accuracy of this information.
Potential risks and uncertainties include, but are not limited to, the economic environment
for prescription drugs, which is the main operating domain of the Sawai Group, market
competition and services offered by the Group.
Sawai Group Holdings Co., Ltd.
Group Public Relations & Investor Relations Office
Contact
Information


