

Genetic population structure of penaeid prawns Penaeus monodon Fabricius 1798,
Fenneropenaeus indicus H. Milne Edwards 1837 and Metapenaeus monoceros Fabricius
1798 in the Malindi–Ungwana Bay, Kenya
By
Thomas Kalama Mkare
Supervisor: Prof. Conrad A. Matthee
Co–supervisors: Prof. Johan C. Groeneveld and Dr. Sophie von der Heyden
Faculty of Science
Department of Botany and Zoology
March 2013
i
Declaration
By submitting this thesis/dissertation electronically, I declare that the entirety of the work
contained therein is my own, original work, that I am the sole author thereof (save to the extent
explicitly otherwise stated), that reproduction and publication thereof by Stellenbosch University
will not infringe any third party rights and that I have not previously in its entirety or in part
submitted it for obtaining any qualification.
Verklaring
Deur hierdie tesis elektronies in te lewer, verklaar ek dat die geheel van die werk hierin vervat,
my eie, oorspronklike werk is, dat ek die alleenouteur daarvan is (behalwe in die mate uitdruklik
anders aangedui), dat reproduksie en publikasie daarvan deur die Universiteit van Stellenbosch
nie derdepartyregte sal skend nie en dat ek dit nie vantevore, in die geheel of gedeeltelik, ter
verkryging van enige kwalifikasie aangebied het nie.
March 2013
Copyright © 2013 Stellenbosch University
All rights reserved
Stellenbosch University http://scholar.sun.ac.za
ii
Abstract
Comparative analyses of genetic diversity, population structure and evolutionary relationships
among co–distributed species can provide useful insights into fisheries management. In this
study, mitochondrial DNA control region (mtCR) sequences were used to investigate genetic
population structure and recruitment patterns of three co–occurring shallow water penaeid prawn
species; Penaeus monodon, Fenneropenaeus indicus and Metapenaeus monoceros. These taxa
dominate artisanal and commercial prawn catches in the Malindi–Ungwana Bay in Kenya, where
juvenile prawns inhabit estuarine habitats, and adults occur further offshore, on mudbanks in the
bay. A total of 296 [i.e. (P. monodon; n = 129), (F. indicus; n = 96), (M. monoceros; n = 71)]
specimens were sampled from five sites; two estuarine nursery areas (juveniles), a nearshore
mid–station (adults), and two offshore areas (adults). The sites were chosen to represent the bulk
of the Kenyan fishery activities, and to include juvenile and adult cohorts that are presumably
connected to each other through larval dispersal processes and migrations. Juveniles were
obtained during 2010 from local fishermen, and adult prawns during 2011 using a commercial
prawn trawler. Analysis of the mtCR sequences indicated high haplotype diversity (P. monodon;
h = 0.9996 ± 0.0010; F. indicus; h = 0.9998 ± 0.0015; M. monoceros; h = 0.9815 ± 0.0110) for
all three species. Genetic differentiation results for each species using AMOVA indicated no
significant population differentiation (P. monodon; ΦST = 0.000, = p > 0.05; F. indicus; ΦST =
0.000, = p > 0.05; M. monoceros; ΦST = 0.0164, = p > 0.05) and pairwise ΦST statistics among
sampling sites indicated the complete absence of spatial differentiation of female genes for all
three species. In addition, the mtDNA data of P. monodon (i.e. n = 103) was augmented by using
six polymorphic nuclear microsatellite loci. The pattern of panmixia was supported by the
Stellenbosch University http://scholar.sun.ac.za

iii
microsatellite analyses of P. monodon where AMOVA (i.e. RST = 0.00113, = p > 0.05), pairwise
RST statistics (i.e. RST = 0.0000–0.0223, = p > 0.05) and STRUCTURE all confirmed the
complete absence of genetic differentiation, among all sampled localities. Based on the absence
of genetic population structure, each of the three species can be regarded as a single management
unit throughout the Malindi–Ungwana Bay area. Spatial management strategies for prawn
fisheries in the bay should therefore rely on factors other than genetic metapopulations, such as
seasonal prawn recruitment and distribution patterns, ecosystem functioning and socio–economic
implications to fishing communities and commercial trawl fishing companies.
Stellenbosch University http://scholar.sun.ac.za
iv
Opsomming
Vergelykende analise van genetiese diversiteit, bevolkings stuktuur en evolutionêre
verwantskappe tussen spesies wat ‗n verspreidingsgebied deel kan nuttige insigte lewer oor
vissery bestuur. In hierdie studie was die mitokondriale DNS kontrole area (mtCR)
volgordebepalings gebruik om die bevolkings genetiese stuktuur en werwingspatrone van drie
mede-verspreide vlak water penaeid garnaal spesies; Penaeus monodon, Fenneropenaeus indicus
and Metapenaeus monoceros te ondersoek. Hierdie taksa domineer die ambagtelike en
kommersiële vangste in die Malindi-Ungwanabaai in Kenya waar, onvolwasse garnale in
riviermondings voorkom en volwassenes in dieper waters op modderbanke in die baai voorkom.
‗n Totaal van 296 [(P. monodon; n = 129), (F. indicus; n = 96), (M. monoceros; n = 71)]
monsters was geneem vanaf vyf lokaliteite; twee in riviermondings (onvolwassenes), ‗n naby-
kus mid stasie (volwasse) en twee diep water (volwasse) areas. Hierdie lokaliteite was gekies
om die oorgrote meerderheid van Kenya se vissery aktiwiteite, asook die onvolwasses en
volwassene kohorte te verteenwoordig wat vermoedelik geneties verbind is aan mekaar deur
larwale verspreidingsprosesse en migrasies. Onvolwasse diere was verkry in 2010 vanaf
plaaslike vissermanne en volwasse diere was in 2011 gekollekteer deur gebruik te maak van ‗n
kommersiële garnaal vissersboot. Analise van die mtCR volgorde bepaling het gewys dat daar
‗n hoë haplotipiese diversiteit (P. monodon; h = 0.9996 ± 0.0010; F. indicus; h = 0.9998 ±
0.0015; M. monoceros; h = 0.9815 ± 0.0110) vir al drie spesies bestaan. Genetiese differensiasie
resultate vir elke spesie, bepaal deur ‗n AMOVA toets, dui op geen beduidende bevolking
differensiasie nie (P. monodon; ΦST = 0.000, = p > 0.05; F. indicus; ΦST = 0.000, = p > 0.05; M.
monoceros; ΦST = 0.0164, = p > 0.05) en paarsgewyse ΦST statistiek tussen die lokaliteite waar
Stellenbosch University http://scholar.sun.ac.za
v
monsters geneem was, dui op geen ruimtelike differensiasie van die vroulike gene in al drie
spesies nie. Hierbenewens is die mtDNS datastel van P. monodon (i.e. n = 103) uitgebrei deur
ses polimorfiese kern mikrosatelliete in te sluit. Die patroon van mtCR panmixia was ondersteun
deur die mikro-satelliet analise van P. monodon waar die AMOVA (i.e. RST = 0.00113, = p >
0.05), paarsgewyse RST statistiek (i.e. RST = 0.0000-0.0223, = p > 0.05) en STRUCTURE
bevestig het dat daar totale afwesigheid is van genetiese differensiasie tussen alle vergelyk-te
lokaliteite. Gebaseer op die afwesigheid van genetiese bevolking-struktuur kan elk van die drie
spesies beskou word as ‗n enkele bestuurseenheid deur die Malindi-Ungwanabaai area. Die
bestuurstrategieë vir garnaal vissery aktiwiteite in die baai moet dus steun op ander faktore as
genetiese meta-bevolking. Belangrike faktore om in ag te neem is seisoenale garnaal werwing en
verspreidings patrone, ekosisteem funksionering en sosio-ekonomiese implikasies van vissers
gemeenskappe en kommersiële visserymaatskappye.
Stellenbosch University http://scholar.sun.ac.za

vi
Dedication
I dedicate this thesis first to my mother Salome Dzidza Mkare and my loving wife Janet Ningala
Kalama for their love, care, support and prayers that have kept me going.
Second, I dedicate this thesis to you my first child and daughter Faith Dzidza Kalama. Faith, you
were born when your father was spending sleepless nights writing this thesis. Thank you for your
calmness.
Third, I dedicate this thesis to my late Dad Mr. Mkare Ndiro (1952–2012) who was not fortunate
to see the glorious moments of his son.
Fourth, to all my brothers (Samson Mkare, Ephantus Mkare and Dennis Mkare) and sister
(Christine Mkare) for their support and encouragements since I took this path of honour.
Stellenbosch University http://scholar.sun.ac.za
vii
Acknowledgments
I am sincerely grateful to you my supervisors, Prof. Conrad A. Matthee, Prof. Johan C.
Groeneveld and Dr. Sophie von der Heyden for giving me the opportunity to learn under your
guidance. The effort you invested on me was not wasted; it changed my life for the better.
To you Dr. Renison K. Ruwa thank you for spending much of your precious time while advising
and encouraging me more about this glorious career.
My thanks also go to SWIOFP for awarding me an MSc grant and for funding this research.
Thanks also to Prof. Tin Yam Chan for clarifying Metapenaeus species using morphological
approach for this study.
Thank you Dr Cecile Berthouly–Salazar for the assistance you gave on microsatellite
amplification and genotyping. Again, thank you for ensuring that all microsatellite data was
correct before it proceeded to further analyses.
To all members of the Evolutionary Genomics Group (EGG), I extend my word of appreciation
for the time you spent while discussing with me about molecular genetics issues. Thank you for
broadening my understanding on population genetics.
Finally, thanks to all fishermen and KMFRI technicians and prawn field experts who assisted me
in acquiring prawns samples. Thank you all and may the Almighty God bless.
Stellenbosch University http://scholar.sun.ac.za

viii
Table of Contents
Declaration ................................................................................................................................ i
Abstract..........................................................................................................................................ii
Opsomming ............................................................................................................................. iv
Dedication ................................................................................................................................ vi
Acknowledgments .................................................................................................................. vii
Table of Contents .................................................................................................................. viii
List of Tables ........................................................................................................................... xi
List of Figures........................................................................................................................ xiii
List of plates ............................................................................................................................ xv
CHAPTER 1: General introduction .........................................................................................1
1.1 Zoogeography and systematics of penaeid prawns .................................................................1
1.2 Reproduction and life history characteristics of penaeid prawns.............................................4
1.4 Economic importance and management of Kenyan prawn fisheries ..................................... 10
1.5 The study area ..................................................................................................................... 12
1.6 Recruitment patterns, genetic diversity and population structure in the marine environment 15
Stellenbosch University http://scholar.sun.ac.za
ix
1.7 Aims of the study ................................................................................................................ 18
1.7.1 Research Questions ................................................................................................... 19
CHAPTER 2: Materials and Methods ................................................................................... 21
2.1 Collection of samples and DNA extraction .......................................................................... 21
2.2 PCR amplification and sequencing of mtDNA control region (mtCR) fragment ................... 22
2.3 Mitochondrial data analysis ................................................................................................. 23
2.4 PCR amplification and genotyping of Penaeus monodon ..................................................... 25
2.5 Microsatellite data analysis .................................................................................................. 26
CHAPTER 3: Results.............................................................................................................. 28
3.1 Mitochondrial DNA data ..................................................................................................... 28
3.2Microsatellite data ................................................................................................................ 37
CHAPTER 4: Discussion ........................................................................................................ 41
4.1 Genetic diversity of P. monodon, F. indicus and M. monoceros in the Malindi–Ungwana
Bay, Kenya.....................................................................................................................................41
4.2 Dispersal and recruitment patterns in the Malindi–Ungwana Bay ........................................ 46
4.3 Management of prawn fisheries in the MUB region ............................................................. 47
4.3.1 Local management recommendations ............................................................................... 47
Stellenbosch University http://scholar.sun.ac.za

x
CHAPTER 5: General conclusions......................................................................................... 50
References................................................................................................................................ 52
Appendix 1............................................................................................................................... 70
Stellenbosch University http://scholar.sun.ac.za
xi
List of Tables
Table 1. The taxonomy of the family Penaeidae showing the old and the latest taxonomic
revisions. The genera occurring in the IWP and SWIO regions are listed. The penaeidae species
inhabiting the SWIO waters are listed .........................................................................................3
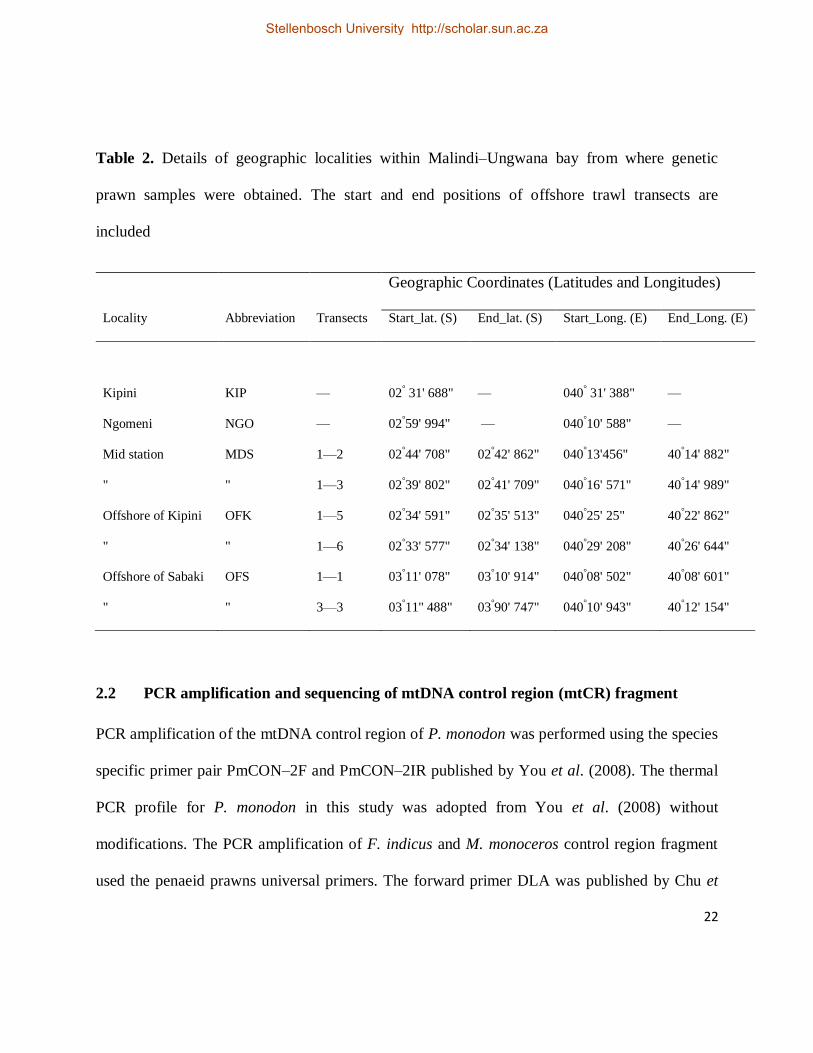
Table 2. Details of geographic localities within Malindi–Ungwana bay from where genetic
prawn samples were obtained. The start and end positions of offshore trawl transects are
included .................................................................................................................................... 22
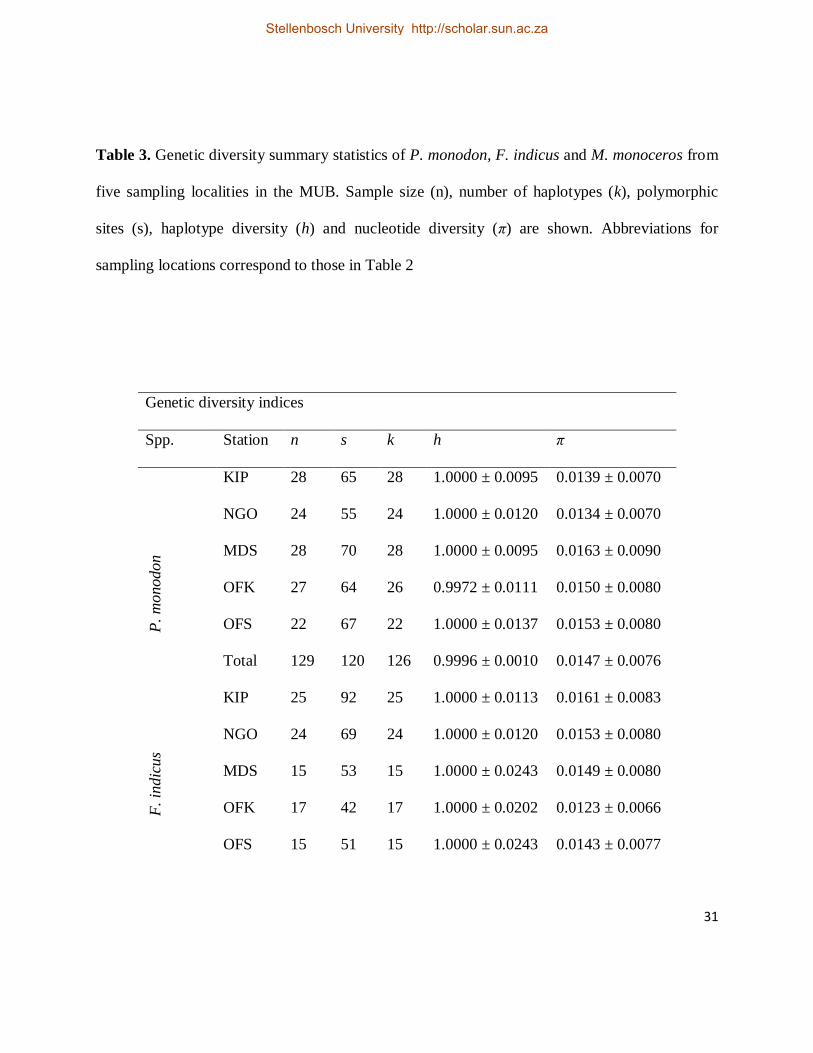
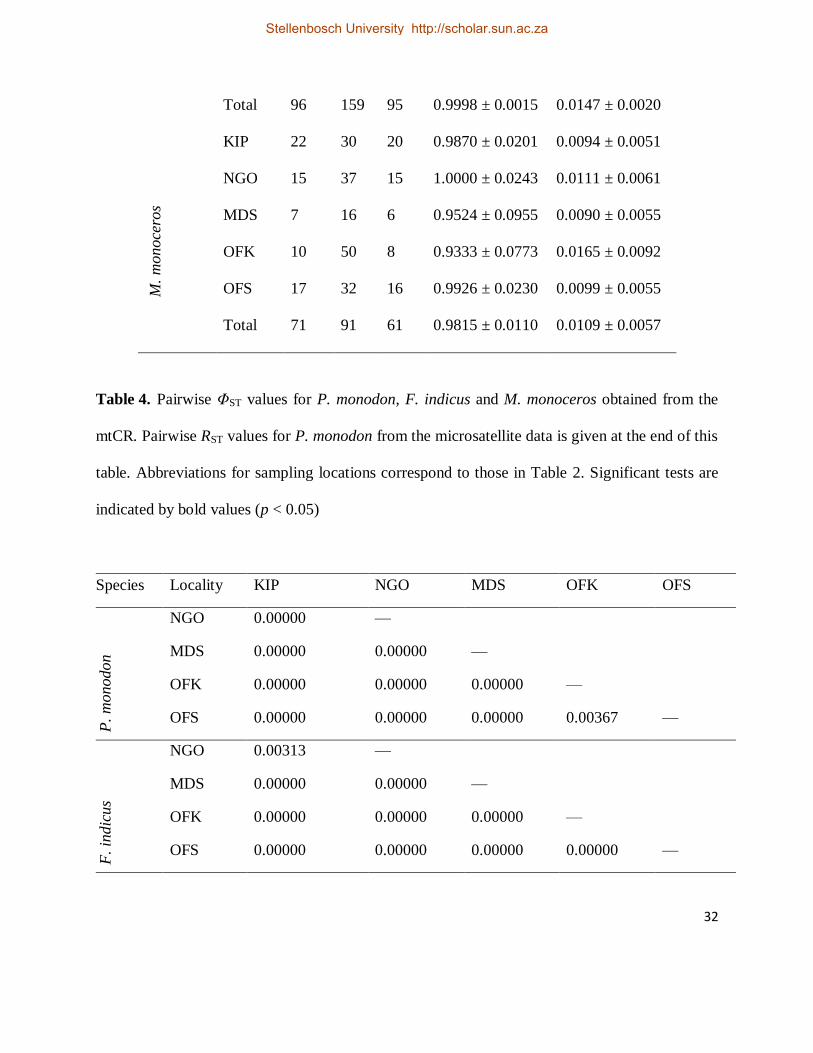
Table 3. Genetic diversity summary statistics of P. monodon, F. indicus and M. monoceros from
five sampling localities in the MUB. Sample size (n), number of haplotypes (k), polymorphic
sites (s), haplotype diversity (h) and nucleotide diversity (π) are shown. Abbreviations for
sampling locations correspond to those in Table 2 ..................................................................... 31
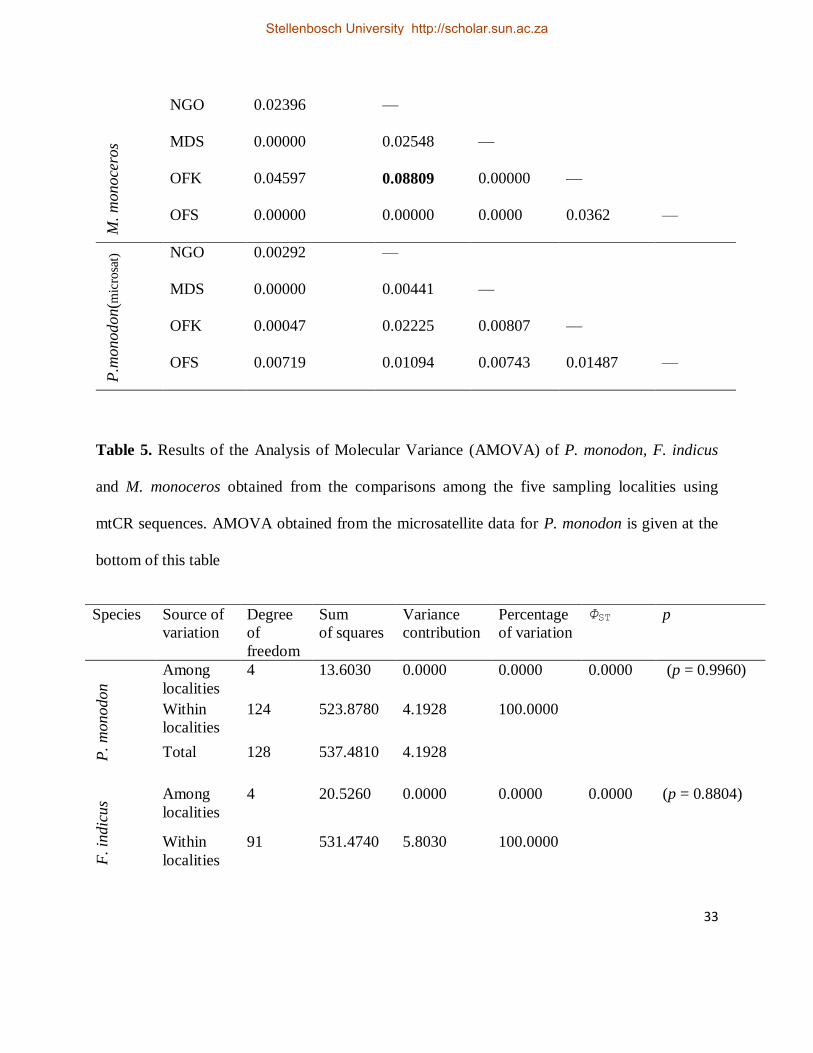
Table 4. Pairwise ΦST values for P. monodon, F. indicus and M. monoceros obtained from the
mtCR. Pairwise RST values for P. monodon from the microsatellite data is given at the end of this
table. Abbreviations for sampling locations correspond to those in Table 2. Significant tests are
indicated by bold values (p < 0.05) ............................................................................................ 32
Table 5. Results of the Analysis of Molecular Variance (AMOVA) of P. monodon, F. indicus
and M. monoceros obtained from the comparisons among the five sampling localities using
mtCR sequences. AMOVA obtained from the microsatellite data for P. monodon is given at the
bottom of this table ................................................................................................................... 33
Stellenbosch University http://scholar.sun.ac.za
xii
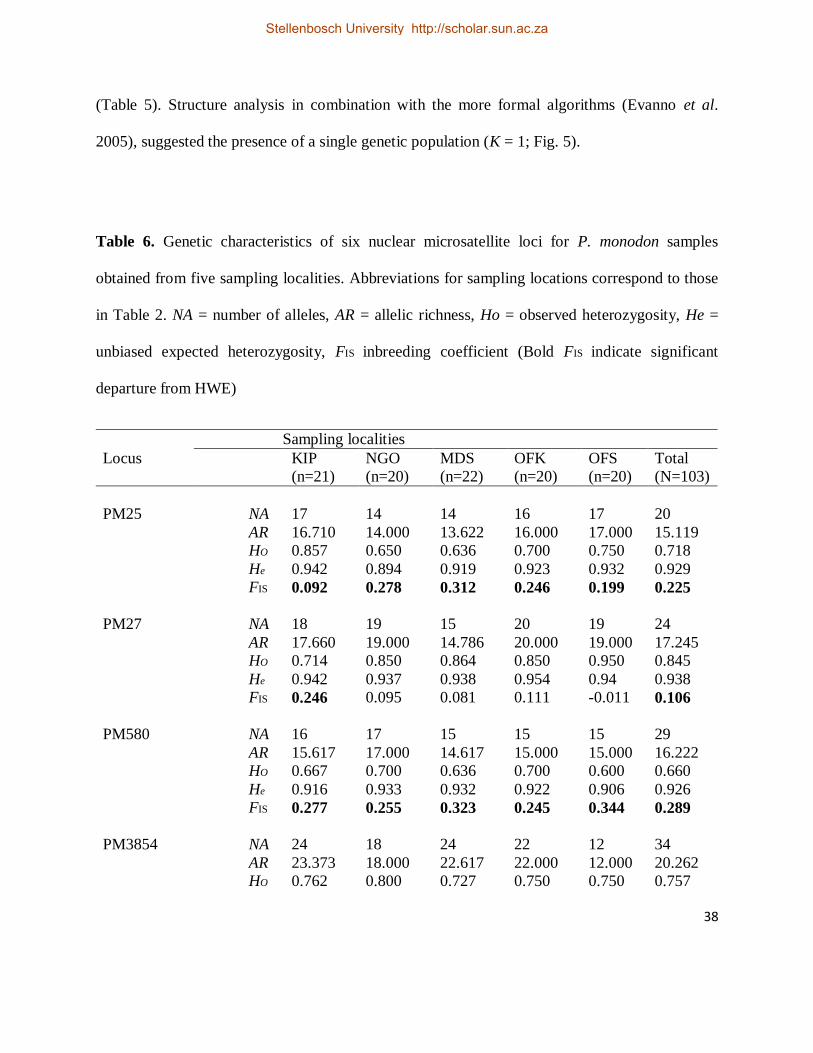
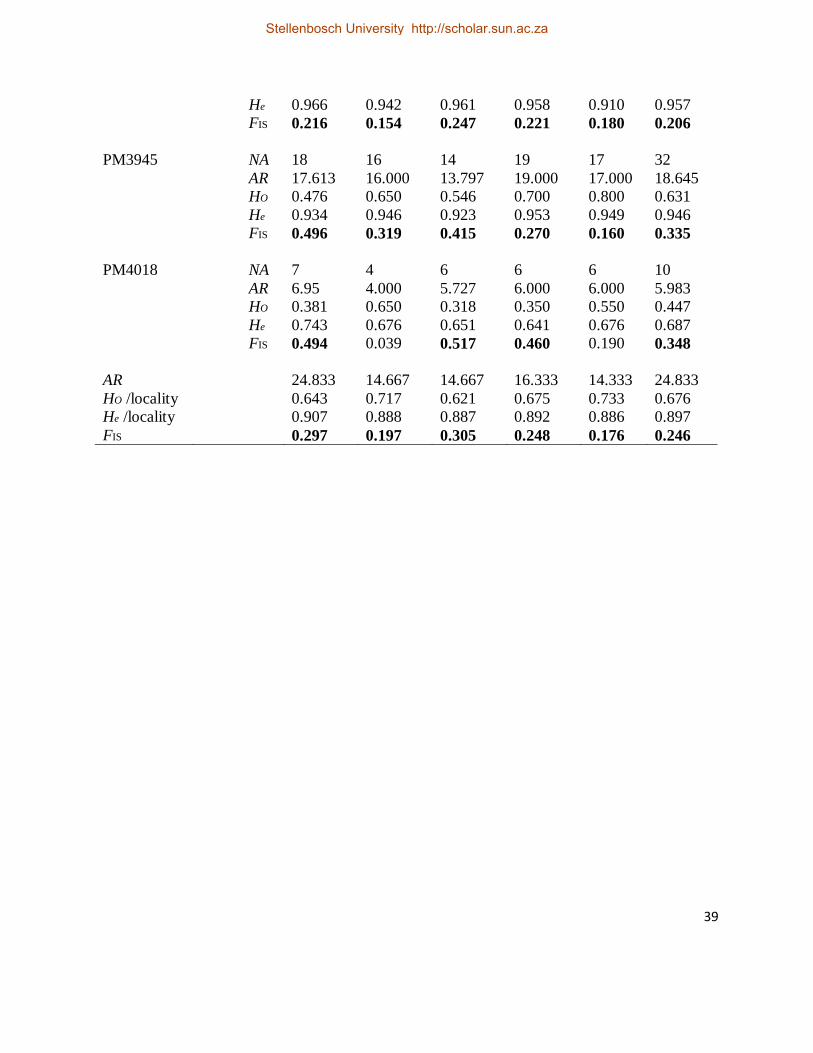
Table 6. Genetic characteristics of six nuclear microsatellite loci for P. monodon samples
obtained from five sampling localities. Abbreviations for sampling locations correspond to those
in Table 2. NA = number of alleles, AR = allelic richness, Ho = observed heterozygosity, He =
unbiased expected heterozygosity, FIS inbreeding coefficient (Bold FIS indicate significant
departure from HWE)................................................................................................................ 38
Table 7. Raw genotypic data obtained from six polymorphic nuclear microsatellite loci for P.
monodon. .................................................................................................................................. 70
Stellenbosch University http://scholar.sun.ac.za
xiii
List of Figures
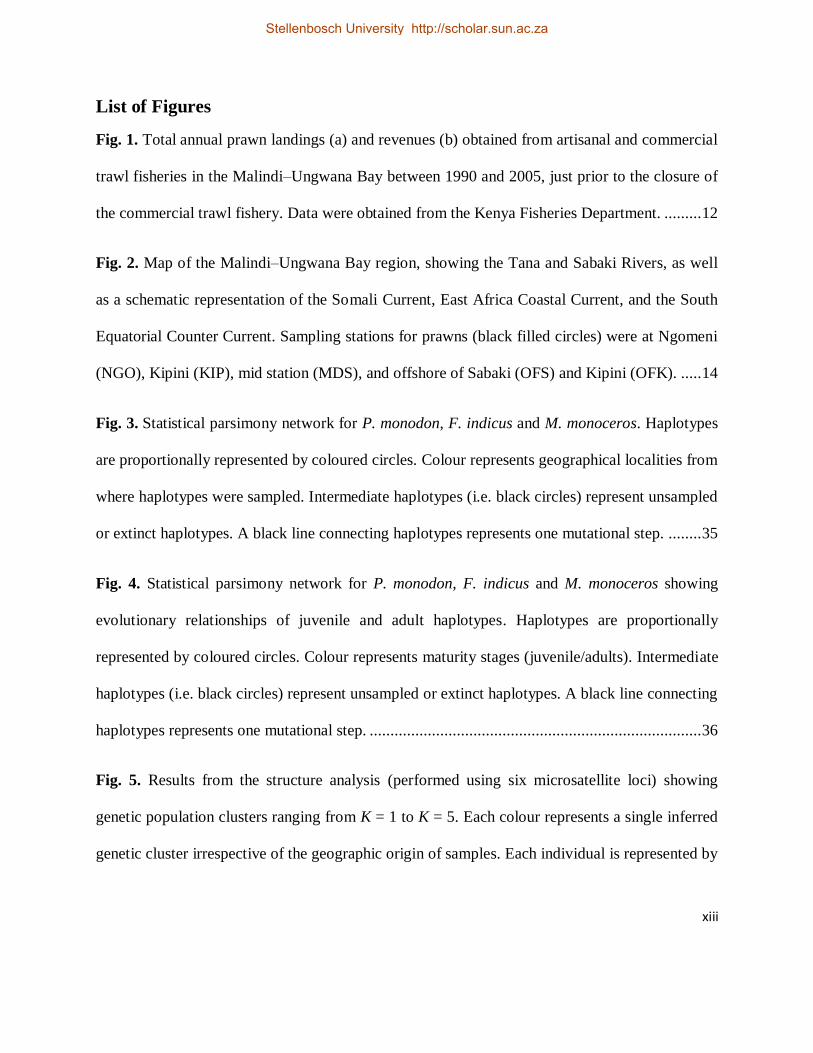
Fig. 1. Total annual prawn landings (a) and revenues (b) obtained from artisanal and commercial
trawl fisheries in the Malindi–Ungwana Bay between 1990 and 2005, just prior to the closure of
the commercial trawl fishery. Data were obtained from the Kenya Fisheries Department. ......... 12
Fig. 2. Map of the Malindi–Ungwana Bay region, showing the Tana and Sabaki Rivers, as well
as a schematic representation of the Somali Current, East Africa Coastal Current, and the South
Equatorial Counter Current. Sampling stations for prawns (black filled circles) were at Ngomeni
(NGO), Kipini (KIP), mid station (MDS), and offshore of Sabaki (OFS) and Kipini (OFK). ..... 14
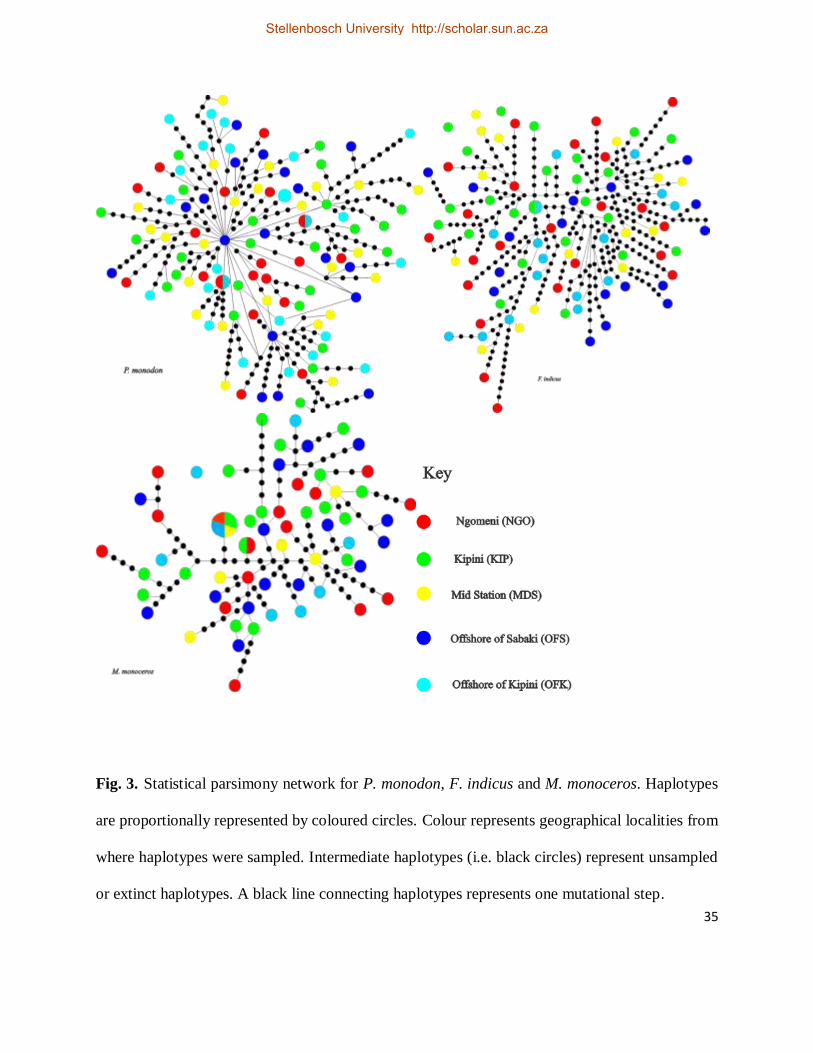
Fig. 3. Statistical parsimony network for P. monodon, F. indicus and M. monoceros. Haplotypes
are proportionally represented by coloured circles. Colour represents geographical localities from
where haplotypes were sampled. Intermediate haplotypes (i.e. black circles) represent unsampled
or extinct haplotypes. A black line connecting haplotypes represents one mutational step. ........ 35
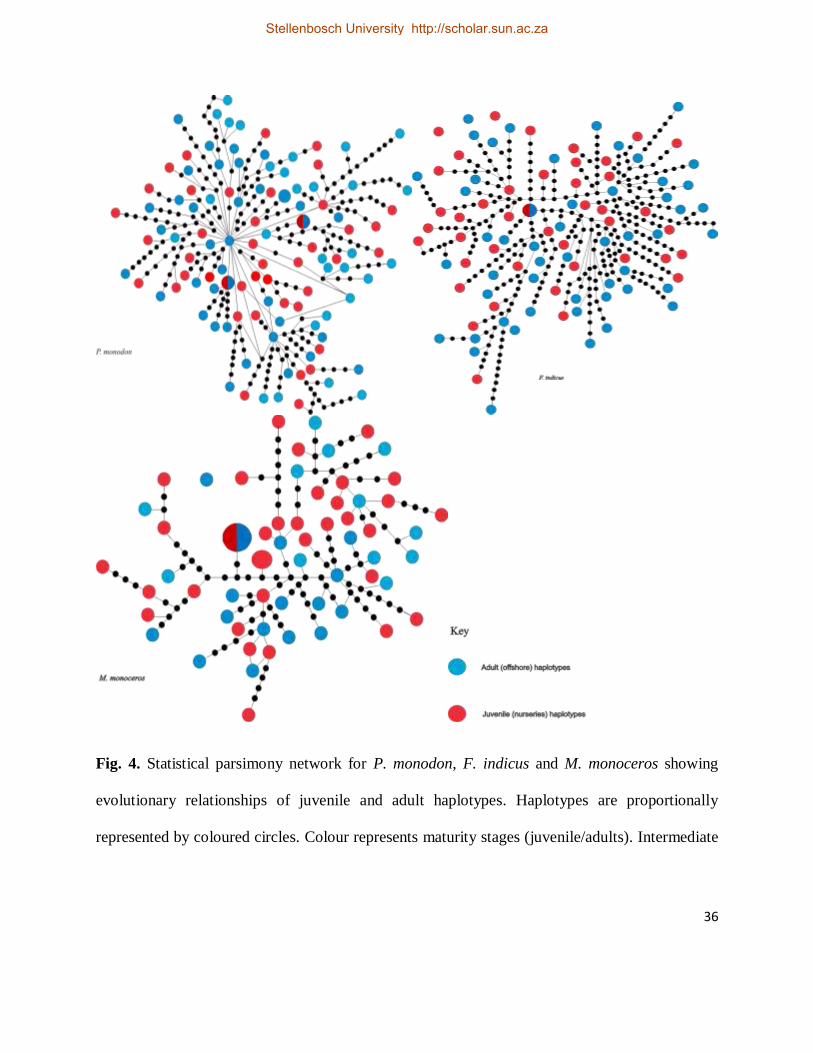
Fig. 4. Statistical parsimony network for P. monodon, F. indicus and M. monoceros showing
evolutionary relationships of juvenile and adult haplotypes. Haplotypes are proportionally
represented by coloured circles. Colour represents maturity stages (juvenile/adults). Intermediate
haplotypes (i.e. black circles) represent unsampled or extinct haplotypes. A black line connecting
haplotypes represents one mutational step. ................................................................................ 36
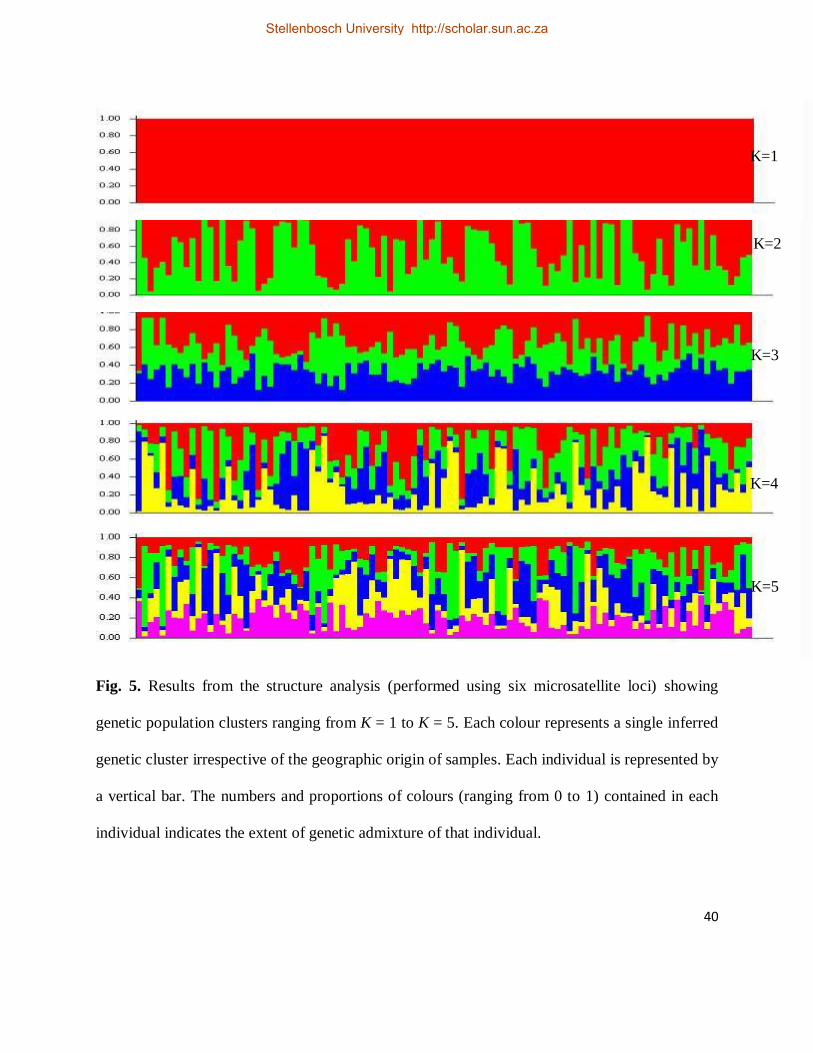
Fig. 5. Results from the structure analysis (performed using six microsatellite loci) showing
genetic population clusters ranging from K = 1 to K = 5. Each colour represents a single inferred
genetic cluster irrespective of the geographic origin of samples. Each individual is represented by
Stellenbosch University http://scholar.sun.ac.za

xiv
a vertical bar. The numbers and proportions of colours (ranging from 0 to 1) contained in each
individual indicates the extent of genetic admixture of that individual. ...................................... 40
Fig. 6. Neighbour joining tree reconstructed from the mtCR sequences, showing M. monoceros
and M. stebbingi clades, originating from the MUB. The three clades were confirmed using
morphological examinations of sub–adults or adults specimens. ................................................ 75
Stellenbosch University http://scholar.sun.ac.za
xv
List of plates
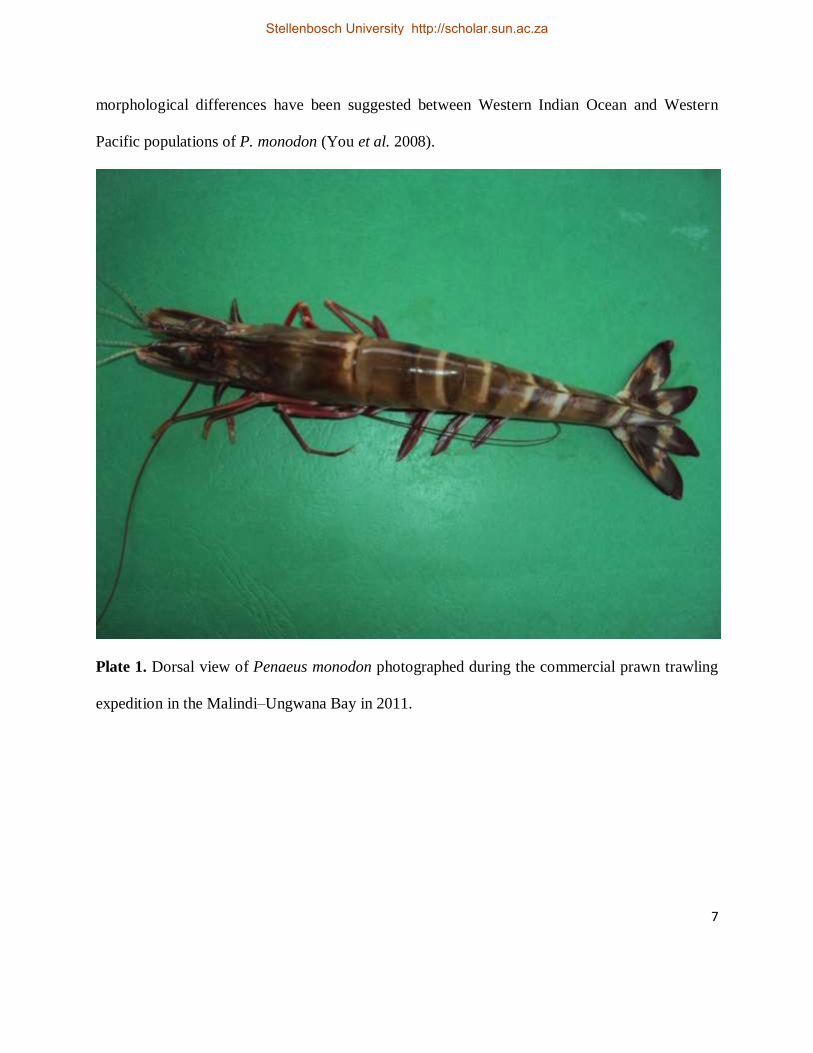
Plate 1. Dorsal view of Penaeus monodon photographed during the commercial prawn trawling
expedition in the Malindi–Ungwana Bay in 2011. .......................................................................7
Plate 2. Dorsal view of Fenneropenaeus indicus photographed during the commercial prawn
trawling expedition in the Malindi–Ungwana Bay in 2011. .........................................................8
Plate 3. Lateral view of Metapenaeus monoceros photographed during the commercial prawn
trawling expedition in the Malindi–Ungwana Bay in 2011. .........................................................9
Stellenbosch University http://scholar.sun.ac.za
1
CHAPTER 1
General introduction
1.1 Zoogeography and systematics of penaeid prawns
The terms prawns or shrimps are synonyms and are used interchangeably in different parts of the
world. Penaeid prawns (Crustacea, Decapoda, Penaeidae) have a global distribution and occur in
four major marine basins including the Indo–West Pacific, eastern Pacific, the western and the
eastern Atlantic (Holthuis 1980; Dall et al. 1990). The Indo–Pacific region has a larger
continental shelf area and more suitable habitat when compared to the Atlantic, and this has
given rise to higher marine species diversity (i.e. about five times more species) and increased
abundance (Dall et al. 1990; Briggs 1999).
The four marine basins are also regarded as bioregions (Spalding et al. 2007) and some
features can be put forward separating some of the regions. For instance, the eastern Atlantic is
separated from the western Atlantic by deep oceanic waters. Similarly, the western Pacific is
separated by deep oceanic waters from the eastern Pacific, and isolated islands and cold water
masses add further diversity. There is no documented barrier separating the Indian and west
Pacific Oceans, and this region is regarded as a single and complex bioregion, the Indo–West
Pacific (Briggs 1999). Contemporary barriers (including land masses, temperature gradients,
ocean currents and ocean deeps) can all restrict the dispersal of pelagic larvae or eggs by ocean
currents, or migrations by fish or benthic organisms such as penaeid prawns, giving rise to
structured populations and eventually to speciation. Similarly, vicariance events (formation of
physical barriers which disconnect previously continuous regions) such as seaway closures (e.g.
Stellenbosch University http://scholar.sun.ac.za
2
closure of the Tethys seaway between the Atlantic and Indo-Pacific via the Mediterranean during
the Oligocene/Miocene [Hrbek and Meyer, 2003] or of the Isthmus of Panama [Keigwin, 1978;
Coates et al. 1992]) in the marine environment can limit dispersal and result in the formation of
genetic differentiations among taxa (Teske et al. 2007).
The taxonomic revision of the family Penaeidae Rafinesque–Schmaltz 1815 recognises
17 extant genera (Table 1), with at least 200 extant species across the four basins (Dall et al.
1990; Chan et al. 2008). Many of the genera inhabit shallow waters with the exception of
Metapenaeopsis, Parapenaeus and Penaeopsis which are distributed in deeper oceanic waters
(Dall et al. 1990). The Indo–West Pacific (IWP) is characterized by 11 of the 17 genera (Table
1). Moreover, nine of the 11 genera constitute about 24 species which occur in the South West
Indian Ocean (SWIO) (Table 1; Dall et al. 1990). Endemism in the SWIO is however extremely
low and most of these taxa have wide distributions (Dall et al. 1990).
The latest taxonomic revision of the family Penaeidae (Pérez Farfante and Kensley 1997)
suggests a total of 26 genera (Table 1); in the revision Trachypenaeus was divided into five
genera and Penaeus into six. Several phylogenetic analyses using mitochondrial fragments (e.g.
Baldwin et al. 1998; Maggioni et al. 2001; Lavery et al. 2004; Quan et al. 2004; Voloch et al.
2005; Chan et al. 2008), nuclear genes (Ma et al. 2009) and a combination of mitochondrial and
nuclear genes (e.g. Ma et al. 2011) have questioned the validity of the classification by Pérez
Farfante and Kensley (1997). Based on available phylogenetic evidence, it is clear that
taxonomic revision, especially for the traditional genus Penaeus (currently including Penaeus,
Stellenbosch University http://scholar.sun.ac.za

3
Fenneropenaeus, Litopenaeus, Farfantepenaeus, Melicertus and Marsupenaeus) is needed (Dall
2007; Flegel 2007; 2008; Chan et al. 2008; Ma et al. 2011).
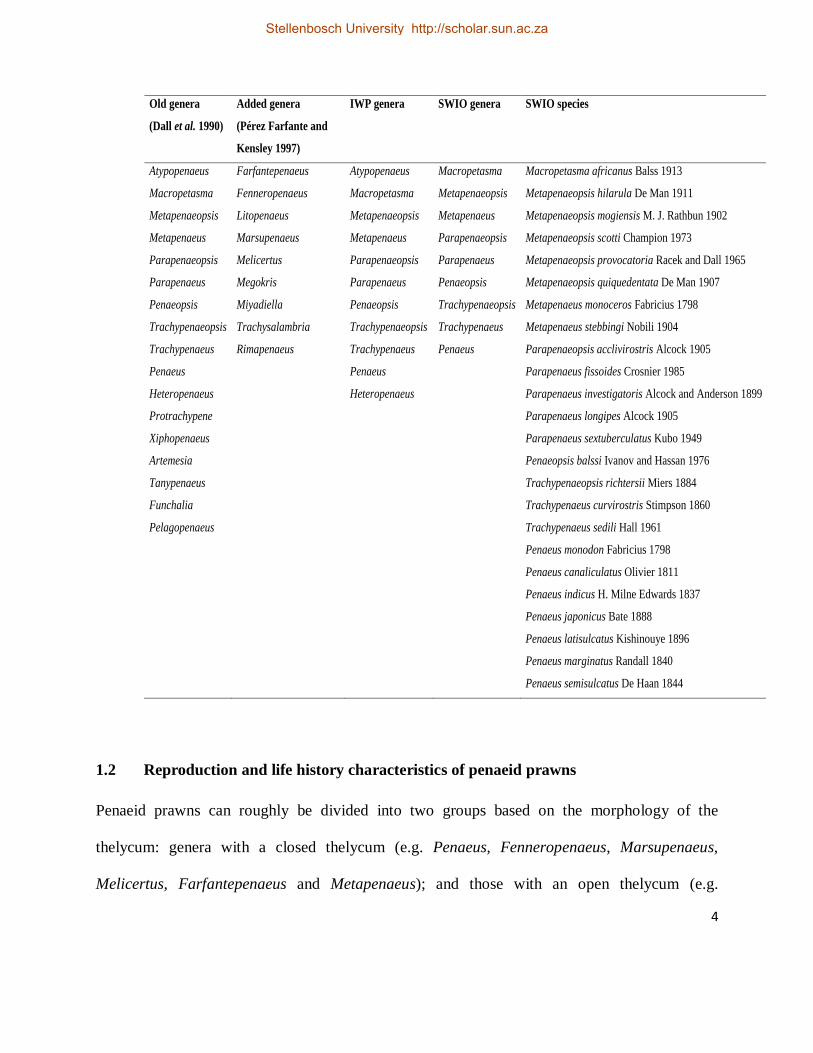
Table 1. The taxonomy of the family Penaeidae showing the old and the latest taxonomic
revisions. The genera occurring in the IWP and SWIO regions are listed. The penaeidae species
inhabiting the SWIO waters are listed
Stellenbosch University http://scholar.sun.ac.za
4
Old genera
(Dall et al. 1990)
Added genera
(Pérez Farfante and
Kensley 1997)
IWP genera SWIO genera SWIO species
Atypopenaeus Farfantepenaeus Atypopenaeus Macropetasma Macropetasma africanus Balss 1913
Macropetasma Fenneropenaeus Macropetasma Metapenaeopsis Metapenaeopsis hilarula De Man 1911
Metapenaeopsis Litopenaeus Metapenaeopsis Metapenaeus Metapenaeopsis mogiensis M. J. Rathbun 1902
Metapenaeus Marsupenaeus Metapenaeus Parapenaeopsis Metapenaeopsis scotti Champion 1973
Parapenaeopsis Melicertus Parapenaeopsis Parapenaeus Metapenaeopsis provocatoria Racek and Dall 1965
Parapenaeus Megokris Parapenaeus Penaeopsis Metapenaeopsis quiquedentata De Man 1907
Penaeopsis Miyadiella Penaeopsis Trachypenaeopsis Metapenaeus monoceros Fabricius 1798
Trachypenaeopsis Trachysalambria Trachypenaeopsis Trachypenaeus Metapenaeus stebbingi Nobili 1904
Trachypenaeus Rimapenaeus Trachypenaeus Penaeus Parapenaeopsis acclivirostris Alcock 1905
Penaeus Penaeus Parapenaeus fissoides Crosnier 1985
Heteropenaeus Heteropenaeus Parapenaeus investigatoris Alcock and Anderson 1899
Protrachypene Parapenaeus longipes Alcock 1905
Xiphopenaeus Parapenaeus sextuberculatus Kubo 1949
Artemesia Penaeopsis balssi Ivanov and Hassan 1976
Tanypenaeus Trachypenaeopsis richtersii Miers 1884
Funchalia Trachypenaeus curvirostris Stimpson 1860
Pelagopenaeus Trachypenaeus sedili Hall 1961
Penaeus monodon Fabricius 1798
Penaeus canaliculatus Olivier 1811
Penaeus indicus H. Milne Edwards 1837
Penaeus japonicus Bate 1888
Penaeus latisulcatus Kishinouye 1896
Penaeus marginatus Randall 1840
Penaeus semisulcatus De Haan 1844
1.2 Reproduction and life history characteristics of penaeid prawns
Penaeid prawns can roughly be divided into two groups based on the morphology of the
thelycum: genera with a closed thelycum (e.g. Penaeus, Fenneropenaeus, Marsupenaeus,
Melicertus, Farfantepenaeus and Metapenaeus); and those with an open thelycum (e.g.
Stellenbosch University http://scholar.sun.ac.za
5
Litopenaeus). The term thelycum (woman–like) in penaeids refers to a structure usually found in
female prawns and its function is to receive and store male spermatophores during mating. An
open thelycum has ridges and protuberances to allow for the attachment of spermatophores,
whereas a closed thelycum has lateral plates which lead into a seminal receptacle where
spermatophores can be inserted (Primavera 1979; 1985; Yano et al. 1988).
Reproduction in penaeids is through copulation and their mating behaviour begins with
an approach, crawling, chasing and finally insertion/attachment of the male spermatophore into
the female thelycum (Alfaro-Montoya 2010). Mating behaviour differs between the two groups:
species with a closed thelycum mate when the gonads of moulted females are still immature,
whereas those with an open thelycum mate after ovarian maturation, when females are at an
intermolt stage. Irrespective the shape of the thelycum, fertilization is always external.
The life cycles of all extant species of the family Penaeidae involve eggs, planktonic
larvae (with naupliar, protozoeal, mysis, postlarvae stages), followed by juvenile and adult
stages. Four types of life cycles are recognized and these depend on habitat preferences among
postlarvae, juveniles and adults and the nature of the eggs (either demersal or pelagic; Dall et al.
1990). Type I represents a life cycle that is exclusively estuarine. The postlarve of type I species
migrate to upstream waters that are characterised by lower salinities where they feed and grow
before recruiting back to estuarine waters of higher salinities where they join adult populations.
Type II species require both estuarine and offshore marine waters to complete their life cycle; the
post–larvae of this group prefer estuaries or estuarine–like environments, whereas the juveniles
and sub–adults emigrate from estuaries to offshore adult breeding grounds (Forbes and
Demetriades 2005). Species with a Type III life cycle are highly restricted to sheltered inshore
Stellenbosch University http://scholar.sun.ac.za
6
waters, preferably those with higher salinities, whereas Type IV species complete their entire life
cycle in offshore waters (Dall et al. 1990).
Most Penaeus and Metapenaeus species have a Type II life cycle, in which larval,
juvenile and adult migrations between estuaries and offshore areas play a major role. Larvae and
postlarvae can migrate both passively (along prevailing currents) and actively (vertical
movements), but they probably don‘t swim against prevailing currents. Larvae are thus
transported by oceanic currents while juveniles and adults migrate by drifting in prevailing
currents, swimming against them, or by benthic migrations (Dall et al. 1990; Criales et al. 2005;
Vance and Pendrey 2008).
1.3 Study species
The three species selected for this study were P. monodon, F. indicus and M. monoceros
(Plates1–3). Penaeus mondon and F. indicus are restricted to the Indo–West Pacific whereas M.
monoceros has a wider distribution spanning the Indo–West Pacific and the Eastern Atlantic
bioregions (Dall et al. 1990). At the local scale, the three species co–occur along the Kenyan
shallow water continental shelf, but they are more abundant in the Malindi–Ungwana Bay
(MUB) (Wakwabi and Jaccarini 1993; Mwaluma 2002). Identification of the three species can
easily be achieved by using the FAO species catalogue (Holthuis 1980). They differ in general
body colour patterns, rostrum shape and structure (presence/absence of rostral teeth on the
ventral and dorsal sides) and thelycum (even though they are all closed thelycum species) for
females or petasma for males (e.g. Plates1–3) throughout their range of distribution. Some
Stellenbosch University http://scholar.sun.ac.za
7
morphological differences have been suggested between Western Indian Ocean and Western
Pacific populations of P. monodon (You et al. 2008).
Plate 1. Dorsal view of Penaeus monodon photographed during the commercial prawn trawling
expedition in the Malindi–Ungwana Bay in 2011.
Stellenbosch University http://scholar.sun.ac.za
8
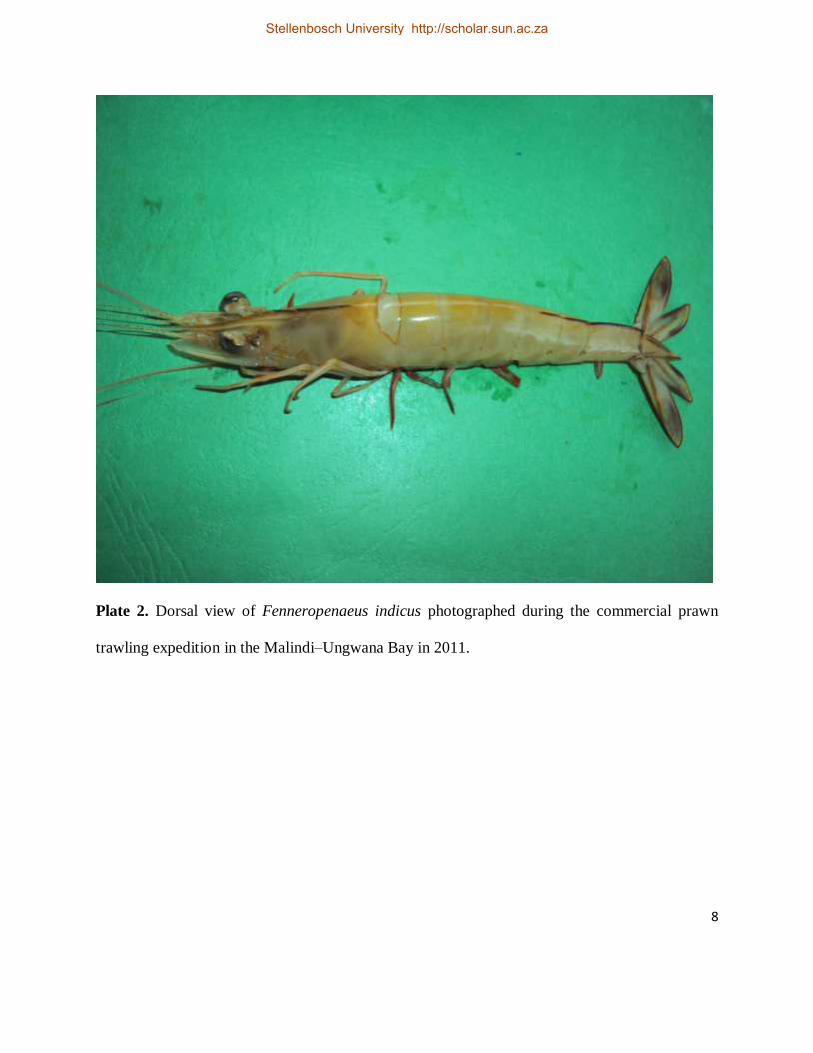
Plate 2. Dorsal view of Fenneropenaeus indicus photographed during the commercial prawn
trawling expedition in the Malindi–Ungwana Bay in 2011.
Stellenbosch University http://scholar.sun.ac.za
9
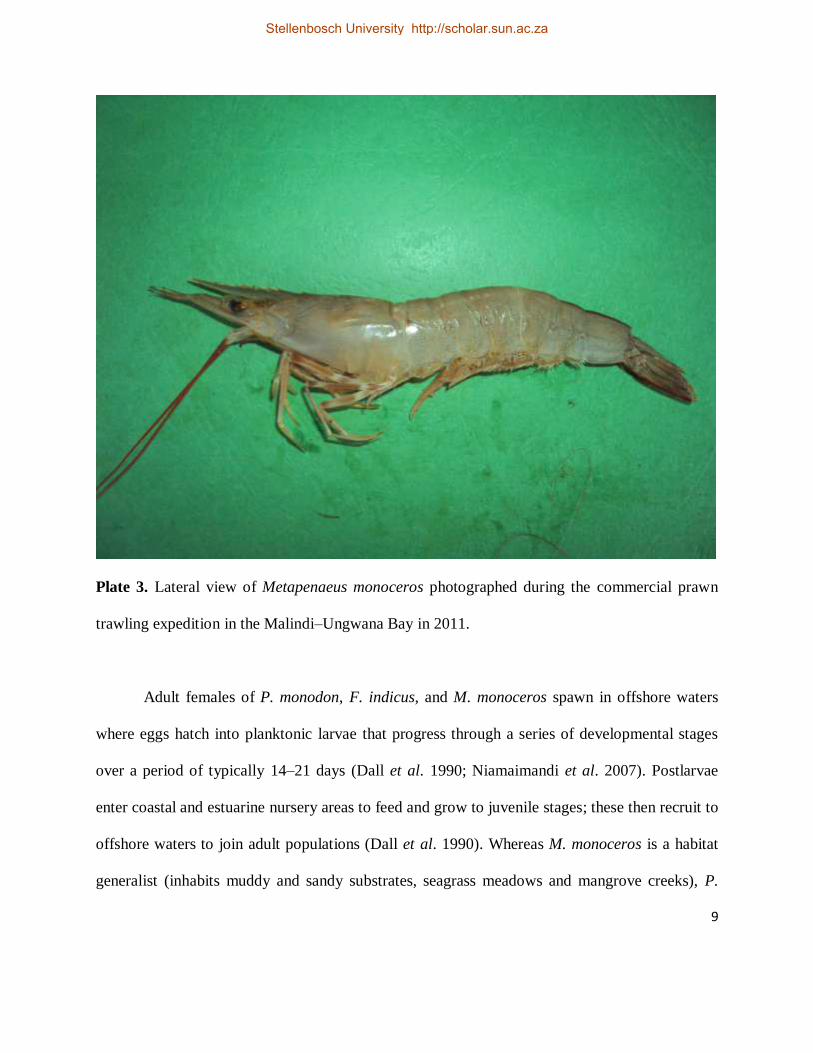
Plate 3. Lateral view of Metapenaeus monoceros photographed during the commercial prawn
trawling expedition in the Malindi–Ungwana Bay in 2011.
Adult females of P. monodon, F. indicus, and M. monoceros spawn in offshore waters
where eggs hatch into planktonic larvae that progress through a series of developmental stages
over a period of typically 14–21 days (Dall et al. 1990; Niamaimandi et al. 2007). Postlarvae
enter coastal and estuarine nursery areas to feed and grow to juvenile stages; these then recruit to
offshore waters to join adult populations (Dall et al. 1990). Whereas M. monoceros is a habitat
generalist (inhabits muddy and sandy substrates, seagrass meadows and mangrove creeks), P.
Stellenbosch University http://scholar.sun.ac.za
10
monodon and F. indicus co–occur in more limited habitat types, such as sandy and muddy
substrates, and mangrove creeks (Sheridan and Hays 2003; Macia 2004). All three species have
high fecundity, and may produce several broods throughout their lifetime (Nandakumar 2001;
Jayawardane et al. 2002; Mgaya and Teikwa 2003).
1.4 Economic importance and management of Kenyan prawn fisheries
Prawns are the economic mainstay of fisheries along the Kenyan coast, and artisanal and
commercial fisheries are focussed on the MUB area. Five co–occurring species are harvested: F.
indicus, 55–70% of landings; M. monoceros, 10–15%; P. monodon, < 10%; P. semisulcatus, <
10%; and M. japonicus, < 5% (Fulanda et al. 2011). The prawn fisheries contribute to the local
economy through job creation, food security and as a source of foreign earnings (Kenya
Fisheries Department 2006a; van der Elst et al. 2009). For instance, during 2006, 10,726
artisanal fishers were active, and > 250,000 Kenyan people depended on marine organisms for
food security and commerce (Kenya Fisheries Department 2006b). It is therefore important that
the prawn resources of MUB are managed sustainably.
The MUB is traditionally divided into three main fishing zones: an artisanal prawn
fishing zone (also called a trawling exclusion zone) between zero and five nautical miles (nm)
from the coast; a commercial trawling zone between five and 12 nm; and an Exclusive
Economic Zone (EEZ) between 12 and 200 nm (Cap 378; Kenya Gazette 1999; 2000; 2001).
However, a recently gazetted prawn fishery management plan designated the area between zero
Stellenbosch University http://scholar.sun.ac.za
11
and three nm from the shore to artisanal fishing, while permitting commercial fishing further
offshore than three nm (Kenya Gazette 2011).
Artisanal and commercial trawl fisheries have been managed by the Kenyan Department
of Fisheries since 1963 and 1970, respectively (FAO 1971), and have been faced with conflicts
among resource users. Conflicts stemmed from poorly defined prawn fishing zones, gear
damage, use of environmentally damaging fishing gears, and reduced prawn catches and
revenues (Fig. 1) (McClanahan et al. 2005; Munga et al. 2012). The commercial trawl fishery
was suspended between 2006 and June 2011, whereafter trawling was continued. The motivation
for the closure was to recover prawn catch rates, and to allow for scientific investigation to assist
in fisheries management decisions. The present genetic population analysis of the three dominant
prawn species in the MUB fisheries should be seen in this light.
Stellenbosch University http://scholar.sun.ac.za

12
Fig. 1. Total annual prawn landings (a) and revenues (b) obtained from artisanal and commercial
trawl fisheries in the Malindi–Ungwana Bay between 1990 and 2005, just prior to the closure of
the commercial trawl fishery. Data were obtained from the Kenya Fisheries Department.
1.5 The study area
The MUB starts from Malindi in the south and extends to Ras–Shaka in the north, and lies
between latitudes 2°30´–3°30´S and longitudes 40°00´– 41°00′E (Fig. 2). The bay is
characterised by a shallow continental shelf that ranges from 15 to 60 km offshore (Kitheka
Stellenbosch University http://scholar.sun.ac.za
13
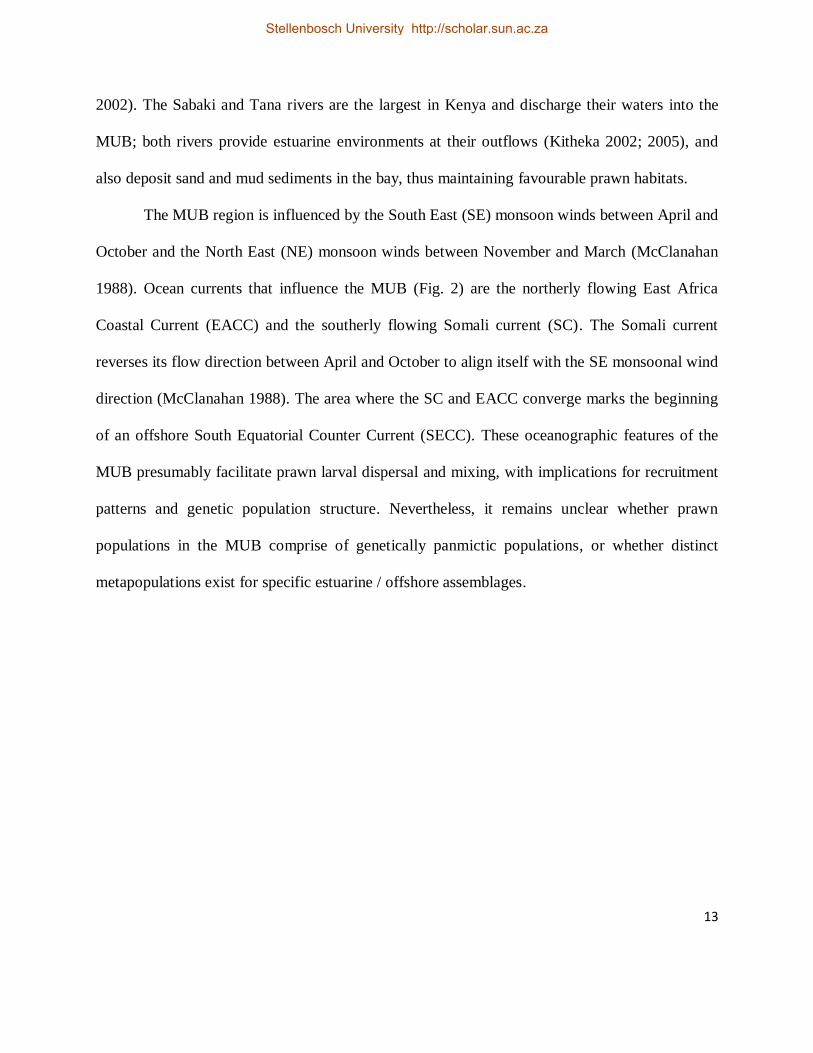
2002). The Sabaki and Tana rivers are the largest in Kenya and discharge their waters into the
MUB; both rivers provide estuarine environments at their outflows (Kitheka 2002; 2005), and
also deposit sand and mud sediments in the bay, thus maintaining favourable prawn habitats.
The MUB region is influenced by the South East (SE) monsoon winds between April and
October and the North East (NE) monsoon winds between November and March (McClanahan
1988). Ocean currents that influence the MUB (Fig. 2) are the northerly flowing East Africa
Coastal Current (EACC) and the southerly flowing Somali current (SC). The Somali current
reverses its flow direction between April and October to align itself with the SE monsoonal wind
direction (McClanahan 1988). The area where the SC and EACC converge marks the beginning
of an offshore South Equatorial Counter Current (SECC). These oceanographic features of the
MUB presumably facilitate prawn larval dispersal and mixing, with implications for recruitment
patterns and genetic population structure. Nevertheless, it remains unclear whether prawn
populations in the MUB comprise of genetically panmictic populations, or whether distinct
metapopulations exist for specific estuarine / offshore assemblages.
Stellenbosch University http://scholar.sun.ac.za
14
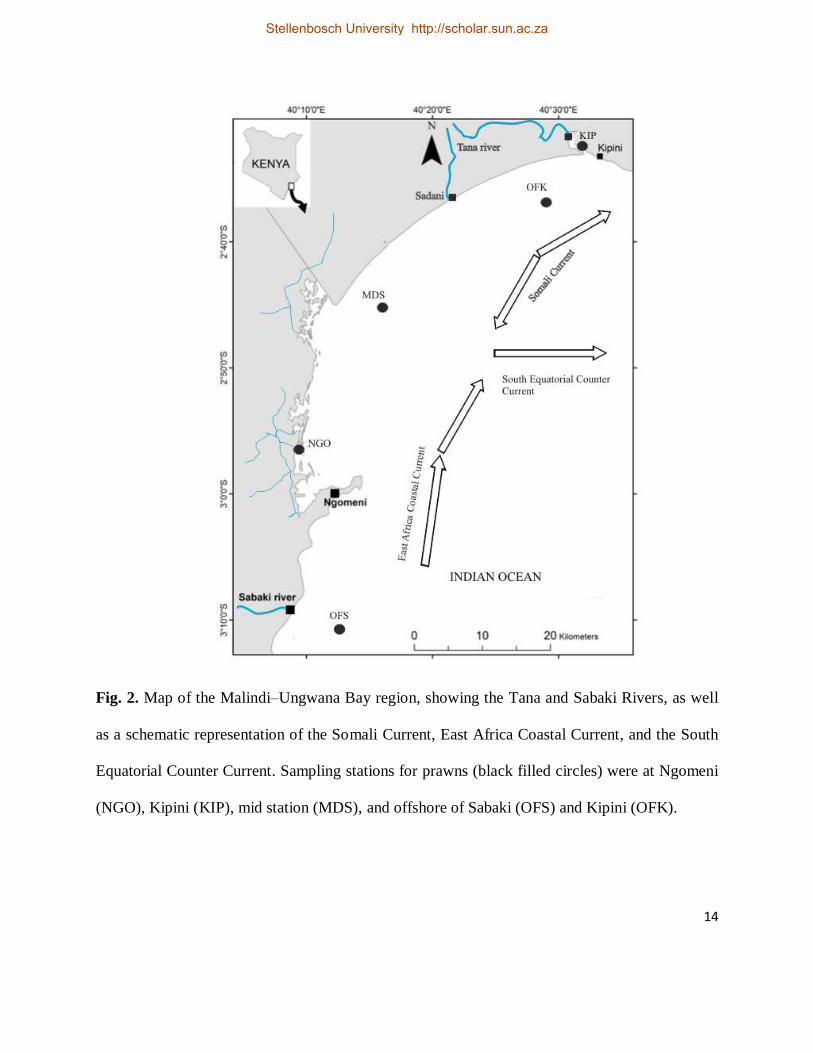
Fig. 2. Map of the Malindi–Ungwana Bay region, showing the Tana and Sabaki Rivers, as well
as a schematic representation of the Somali Current, East Africa Coastal Current, and the South
Equatorial Counter Current. Sampling stations for prawns (black filled circles) were at Ngomeni
(NGO), Kipini (KIP), mid station (MDS), and offshore of Sabaki (OFS) and Kipini (OFK).
Stellenbosch University http://scholar.sun.ac.za
15
1.6 Recruitment patterns, genetic diversity and population structure in the marine
environment
Marine species with a planktonic larval dispersal phase (e.g. the three study species) can be
considered to be demographically open because larvae may originate from local or
geographically distant sources (Caley et al. 1996; Lowe and Allendorf 2010). This means that
local nursery grounds can receive larvae from many sources, which recruit to local adult
populations. This pattern in larval dispersal, settlement and recruitment has implications for
genetic population structure and fisheries dynamics. A comparative genetic analysis of
genealogical relationships among larvae and adult genes (e.g. haplotypes) is appropriate to assess
the geographic origin of larvae and/or juveniles (e.g. Bunn and Hughes 1997; Malhi et al. 2002;
Silva–Rocha et al. 2012).
Genetic variation is an important element with regard to the ability of species to adapt
and evolve and this measure is also used by conservation officials to form management opinions
(Schwartz et al. 2007; Reynolds et al. 2012). The neutral population genetic theory suggests that
genetic variation within species at mutation–random drift equilibrium is correlated with effective
population size. However, other factors that could affect genetic diversity include; differences in
evolutionary rate between genes and species, life histories, distribution, abundances, bottlenecks,
overfishing exploitation and founder effects (Amos and Harwood 1998; Bromham 2009; Leffler
et al. 2012).
The spatial pattern in which genetic variation is organised within and among animal
populations is referred to as genetic population structure, and in the marine environment it has
been reviewed extensively by Laikre et al. (2005) and Waples and Gaggiotti (2006). Three
Stellenbosch University http://scholar.sun.ac.za
16
general patterns are recognized; no differentiation (homogeneous populations), continuous
genetic change (isolation by distance; Wright 1943) and complete differentiation (island model;
Wright 1931).
In the absence of genetic differentiation, genetic variation within a species may be
homogeneous over large geographic ranges, and could extend to its entire distribution. In this
case, geneflow or effective migrations between geographic areas would be extensive and
individuals within a species might migrate and randomly mate without constraints (Laikre et al.
2005). Sometimes, species belonging to this pattern could have a single geographic spawning
area where mature adults gather to reproduce before dispersing to adult feeding grounds.
In a continuous change in genetic structure scenario (i.e. isolation by distance), random
mating and geneflow is extensive between individuals that are geographically close to each
other. However, individuals that occur at extreme opposite ends of a species distribution tend to
have a limited chance of mating, thus leading to an increase in the change in allele frequencies as
geographic distances become greater.
In the complete genetic differentiation scenario (island model), organisms are organised
into systems (local populations) where gene flow among them is limited by factors such as
physical barriers (e.g. Williams and Benzie 1998; von der Heyden et al. 2011), oceanographic
barriers (e.g. Gilg and Hilbish 2003) or reproductive isolation (e.g. Dai et al. 2000). Given
enough time, populations separated from their most recent common ancestor (MRCA) without
gene exchange may result in allopatric speciation.
Shank et al. (2003) and Shanks (2009) suggested that animal species with an extended
pelagic larval duration (PLD) would be more dispersive showing homogeneous genetic
Stellenbosch University http://scholar.sun.ac.za
17
population patterns (e.g. Crandall et al. 2010), even over very long distances (Groeneveld et al.
2012), while brooding or live–bearing taxa and those with short PLD could exhibit genetic
discontinuities over small geographic ranges (e.g. Hellberg 1996; Baird et al. 2012; Ledoux et al.
2012). However, the link between PLD and population structure is not straightforward (Sponer
and Roy 2002; Becker et al. 2007; Weersing and Toonen 2009; Faurby and Barber 2012), and
life history characteristics alone are thus unlikely to explain genetic patterns among marine
crustaceans (but see McMillen–Jackson and Bert 2003; Sivasundar and Palumbi 2010).
Despite life history, sudden intraspecific genetic disjunctions can also occur in areas
where interchange between individuals is constrained by factors associated with physical barriers
and other environmental factors (e.g. sharp salinity gradients, deep waters and circular
currents/eddies etc.) (Gilg and Hilbish 2003; von der Heyden et al. 2011). In the MUB, no
barrier has yet been documented that may cause genetic differentiation among prawn
populations, however it is interesting to report that a large–scale genetic population analysis of P.
monodon indicated significant genetic differentiation of the Kenyan population when compared
to western Madagascar (You et al. 2008). In addition, studies on P. monodon populations in the
SWIO have shown a genetic break between Tanzania and western Madagascar (Duda and
Palumbi 1999), and no genetic structure among populations in South Africa, Mozambique and
Madagascar (Benzie et al. 2002). A previous genetic analysis of F. indicus indicated a general
lack of genetic differentiation among populations from South Africa, Tanzania and Oman, using
Cytochrome c oxidase sub–unit 1 gene (COI) sequences (Querci 2003). Conversely, Random
Amplification of Polymorphic DNA (RAPD) analysis indicated genetic differentiation among
Stellenbosch University http://scholar.sun.ac.za
18
the above three geographic units (Querci 2003). This latter result emphasised that using different
genetic markers can provide contrasting insights, based on the level of polymorphism.
Presently, there are two main classes of DNA markers frequently used in
phylogeographic investigations; those derived from mitochondrial DNA (e.g. mitochondrial
control region fragment) and those obtained from nuclear DNA (e.g. nuclear microsatellite;
reviewed in Sunnucks 2000; Selkoe and Toonen 2006; White et al. 2008; Fromentin et al. 2009;
Galtier et al. 2009). The selection of genetic markers to be used in population genetics studies
depends on individual marker characteristics (e.g. sample requirement, reproducibility, mode of
inheritance and scoring, level of polymorphism) and the nature of the research questions being
addressed (Sunnucks 2000; Karl et al. 2012).
Recently, the presence of paralogous sequences (either due to Numts [nuclear insertions
of mitochondrial sequences], duplication of the control region, or heteroplasmy) have been
suggested for P. monodon (Walther et al. 2011). Paralogous sequences may not have similar
evolutionary rates when compared with mtDNA genes, thus accidental inclusion of these
sequences into analysis may introduce erroneous interpretations. Thus it was important to ensure
that paralogous sequences were not present in the DNA of P. monodon analysed in the present
study.
1.7 Aims of the study
The aims of this research were to investigate genetic population structure of P. monodon, F.
indicus and M. monoceros in the Malindi–Ungwana Bay fishing area in Kenya using
mitochondrial DNA control region sequences and nuclear microsatellite loci.
Stellenbosch University http://scholar.sun.ac.za
19
1.7.1 Research Questions
The following research questions were posed:
1) Do juvenile and adult P. monodon, F. indicus and M. monoceros on offshore banks in the
MUB originate from the local estuarine and/or nursery areas of Ngomeni and Kipini, or do they
come from distant larval sources?
The null hypothesis suggesting an offshore recruitment that originates from the two local nursery
(local recruitment) areas of Ngomeni and Kipini was tested. The alternative hypothesis, that
adults in the bay originate from distant sources, supposed that long–lived pelagic larvae might
have drifted from afar in oceanic currents. To test the above hypotheses, a genetic analysis of
sequences (haplotypes) obtained from juveniles that occur in local estuaries and adults from
offshore banks was undertaken.
2) Do the prawn populations of MUB belong to a single mixed population, or is there genetic
structure in the bay congruent with separate nursery grounds?
The null hypothesis which suggests a lack of genetic differentiation was tested. The alternative
hypothesis suggesting genetic differentiation in the bay supposed that physical/environmental
factors (current systems) and life histories (habitat preferences) might have acted to separate
populations. In the event of genetic differentiation between estuaries or among sampling sites;
the alongshore ocean currents occurring in the bay (detailed in section 1.5) is not responsible for
mixing/homogenising populations; perhaps due the less migratory nature of the benthic
Stellenbosch University http://scholar.sun.ac.za
20
juveniles. In addition, in the event of genetic differentiation for the habitat specific species (P.
monodon and F. indicus) but not for the habitat generalist species (M. monoceros); differences in
life histories (habitat preferences) should then be invoked to explain for such observations. To
test the above hypotheses, analyses of the mitochondrial DNA control region sequences were
undertaken. In addition, microsatellite data for P. monodon were included to validate sequences
results.
Stellenbosch University http://scholar.sun.ac.za
21
CHAPTER 2
Materials and Methods
2.1 Collection of samples and DNA extraction
Sampling localities were chosen to represent the MUB prawn populations that support both
artisanal and commercial trawl fisheries, and to include juvenile and adult cohorts that are
presumably connected to each other through larval dispersal processes and migrations. A total of
five sites were sampled; Ngomeni (NGO), Kipini (KIP), mid station (MDS), offshore of Sabaki
(OFS) and offshore of Kipini (OFK) (Fig. 2). Ngomeni sampling station is situated far from the
mouth of the Sabaki river whereas Kipini station is located within the river mouth (Fig. 2).
Prawns sampled for this study included juveniles and adults of P. monodon, F. indicus and M.
monoceros, and between seven to 28 specimens per species were collected from each of the five
localities (Fig. 2 & Table 3). Juveniles were obtained during 2010 from local fishers in NGO and
KIP (Fig. 2). Adults were obtained from MDS, OFS and OFK (Fig. 2) during 2011 using a
commercial prawn trawler under survey SWIOFP2011C201a. Total genomic DNA was extracted
from ethanol (96%) preserved muscle tissues using the Wizard® SV Genomic DNA Extraction
Kit (Promega, Madison, WI, USA) following the manufacturers instructions and stored at –20°C
prior to further analysis.
Stellenbosch University http://scholar.sun.ac.za
22
Table 2. Details of geographic localities within Malindi–Ungwana bay from where genetic
prawn samples were obtained. The start and end positions of offshore trawl transects are
included
Geographic Coordinates (Latitudes and Longitudes)
Locality Abbreviation Transects Start_lat. (S) End_lat. (S) Start_Long. (E) End_Long. (E)
Kipini KIP — 02° 31' 688" — 040° 31' 388" —
Ngomeni NGO — 02°59' 994" — 040°10' 588" —
Mid station MDS 1—2 02°44' 708" 02°42' 862" 040°13'456" 40°14' 882"
" " 1—3 02°39' 802" 02°41' 709" 040°16' 571" 40°14' 989"
Offshore of Kipini OFK 1—5 02°34' 591" 02°35' 513" 040°25' 25" 40°22' 862"
" " 1—6 02°33' 577" 02°34' 138" 040°29' 208" 40°26' 644"
Offshore of Sabaki OFS 1—1 03°11' 078" 03°10' 914" 040°08' 502" 40°08' 601"
" " 3—3 03°11'' 488" 03°90' 747" 040°10' 943" 40°12' 154"
2.2 PCR amplification and sequencing of mtDNA control region (mtCR) fragment
PCR amplification of the mtDNA control region of P. monodon was performed using the species
specific primer pair PmCON–2F and PmCON–2IR published by You et al. (2008). The thermal
PCR profile for P. monodon in this study was adopted from You et al. (2008) without
modifications. The PCR amplification of F. indicus and M. monoceros control region fragment
used the penaeid prawns universal primers. The forward primer DLA was published by Chu et
Stellenbosch University http://scholar.sun.ac.za
23
al. (2003) and the reverse primer DLB by McMillen–Jackson and Bert (2003). The thermal
profile for the latter two species was one cycle of 3 minutes at 95°C; 35 cycles each 50 seconds at
95°C; 60 seconds at 48°C, 90 seconds at 72°C, and one cycle of 5 minutes at 72°C. PCR products
were gel purified and the reverse strand was sequenced using the BigDye terminator chemistry
(Applied Biosystems) and analysed on an ABI 3100 automated sequencer.
In addition, a subset of P. monodon DNA samples sequenced previously using the
species specific primers, were re–amplified and sequenced using the universal primers (i.e. PCR
amplification and sequencing of the control region for each of the selected DNA samples was
conducted on separate reaction tubes for each of the two primer pairs. This was to ensure two
control region sequences were generated from a single DNA sample). This was conducted
specifically to confirm whether sequences generated using the You et al. (2008) primers would
amplify the authentic control region, or instead the paralogous genes as was recently reported by
Walther et al. (2011).
2.3 Mitochondrial DNA data analysis
SEQUENCHER v.4.8 (Gene Codes, Corp., Ann Arbor, Michigan) was used to edit all
sequences, which were then aligned using Clustal W (Thompson et al. 1994) as implemented in
MEGA v.5 (Tamura et al. 2011). The correctness of specimens sampled as belonging to each of
the three species was confirmed by blasting each of the mtCR sequences using GenBank
(http://blast.ncbi.nlm.nih.gov). When sequences blasted to nothing (i.e. sequence unavailable on
database for that species), the sequences were aligned and a phylogenetic analysis (Neighbour
Joining trees) using MEGA v.5 (Tamura et al. 2011) was used in order to see how such
sequence(s) clustered with others. When more than one clade was observed, whole prawn
Stellenbosch University http://scholar.sun.ac.za
24
specimens were compared morphologically before proceeding with further analyses. Data for
each species was treated separately throughout the analysis. DNASP v.5.0 (Librado and Rozas
2009) was used to prepare input files for subsequent analyses. Genetic diversity summary
statistics were calculated for juveniles (NGO & KIP) and adult (OFK, MDS & OFS) sampling
localities. Moreover, sampling localities (including both juveniles & adults) were also combined
to obtain overall species specific diversity statistics. Sampling localities were also treated as
natural groupings in order to conduct genetic differentiation analyses.
Genetic diversity estimates [i.e. number of polymorphic sites (s), number of haplotypes
(k), haplotype diversity (h) and nucleotide diversity (π)] were obtained from ARLEQUIN v.3.11
(Excoffier et al. 2005). The predefined groupings (i.e. localities) were tested for genetic
differentiation using ARLEQUIN v.3.11 (Excoffier et al. 2005) under the null assumption of no
differentiation. First, pairwise ΦST statistics among sampling localities (which takes into account
haplotype frequencies and genetic distances information) were calculated and significance was
obtained using 10,000 random permutations. Second, analysis of Molecular Variance (AMOVA)
was performed and the significance level of the population fixation index ΦST was obtained
through a nonparametric permutation procedure (Excoffier et al. 1992) with 10,000
permutations. Within species evolutionary divergence between sequences (haplotypes) was
estimated using the uncorrected p–distance model (uncorrected site changes between haplotypes)
using MEGA v.5 (Tamura et al. 2011). We determined evolutionary relationships among
juvenile and adult haplotypes in each of the three datasets (species wise) using a statistical
parsimony network (Templeton et al. 1992) using TCS v.1.21 (Clement et al. 2000), and
enforcing a 95% connection limit. The above networks (showing evolutionary relationships
Stellenbosch University http://scholar.sun.ac.za
25
among juvenile and adult haplotypes) were used to give indications of the recruitment pattern for
each of the three species.
2.4 PCR amplification and genotyping of Penaeus monodon
Microsatellite analyses were performed on P. monodon and six out of 10 polymorphic di–
nucleotide microsatellite loci developed for this species were successfully amplified (Brooker et
al. 2000; Pan et al. 2004). Microsatellite loci were grouped into three panels (groups) for
multiplex PCR amplifications. This grouping relied on fluorescent dyes of the forward primer
(e.g. FAM, VIC, NED or PET), published allelic size ranges and annealing temperatures. Panel 1
included loci PM09 (accession number AF068826), PM25 (AF068827), PM27 (AF068828) and
PM2345 (AY500860); Panel 2 consisted of loci PM138 (AY500853), PM3854 (AY500863) and
PM1713 (AY500858) and Panel 3 consisted of PM580 (AY500856), PM3945 (AY500864) and
PM4018 (AY500865).
Multiplex PCR amplification was carried out in a 10μl reaction final volume containing
1μl of (5–50ng) template DNA, 6μl of Qiagen multiplex PCR master mix, 2μl of ddPCR H2O
and 1μl of primer mix (0.2μM final concentration). The annealing temperature (Ta°C) was
57.3oC for panel 1 and 3, and 58.0
oC for panel 2. The thermal profile followed that of Pan et al.
(2004). The internal size standard GenescanTM 500Liz (Applied Biosystems) was added to the
amplified PCR products and run in an ABI PRISM 3730 genetic analyzer (Applied Biosystems).
Microsatellite alleles were obtained using GeneMapperTM
software version 3.7 (Applied
Biosystems) using the size standard GS500(–250)LIZ. Allele scoring was done automatically
from established bins and edited manually. Individuals that had ambiguous peaks were re–
Stellenbosch University http://scholar.sun.ac.za
26
amplified using positive and negative controls (i.e. one sample for each case) and rescored.
About 20% of individuals were randomly chosen for re–amplification and genotyping so as to
determine consistency of results. The scored alleles were all verified by an independent
researcher before proceeding to further analysis.
2.5 Microsatellite data analysis
Genetic diversity summary statistics were estimated for each sampling locality and also for the
combined localities. The programme GENAIEX v.6.41 (Peakall and Smouse 2006) was used to
perform quick exploratory analyses as well as to prepare input files for other software.
Genotypic linkage disequilibrium (LD) between pairs of loci was determined as
implemented in FSTAT v.2.9.3 (Goudet 2002). We used sequential Bonferroni correction (Rice
1989) to adjust p values for multiple tests when a significant level was observed. Deviations
from Hardy–Weinberg equilibrium (HWE) were determined using GENEPOP v.4.1 (Rousset
2008), where the Wright‘s (1951) inbreeding coefficient (FIS) with heterozygosity deficit as the
alternate hypothesis was used. Genotyping errors which normally take the form of null alleles
(alleles that fail to be detected through PCR amplification), stuttering and large allele dropouts
were investigated using MICROCHECKER v.2.2.3 (Van Oosterhout et al. 2004). When null
alleles were suspected, their frequencies were estimated using the Oosterhout and sequential
Bonferroni method (Rice 1989).
Genetic diversity summary statistics [i.e. number of alleles (NA), observed
heterozygosity (Ho) and expected heterozygosity (He) were obtained using the
MICROSATELLITE TOOLKIT (Park 2001). Allelic richness (AR) which is not affected by
Stellenbosch University http://scholar.sun.ac.za

27
sample sizes was obtained as implemented in FSTAT v.2.9.3 (Goudet 2002). The rarefaction
method (Petit et al. 1998) was used to obtain AR.
Population differentiation was examined using ARLEQUIN v.3.1 (Excoffier et al. 2005)
where pairwise RST values were used to test the null hypothesis of panmixia. Significance levels
were obtained using the exact test of population differentiation which is robust even when
sample sizes are small and also when alleles with low frequencies are included (Raymond and
Rousset 1995). The same program was also used to perform an analysis of Molecular Variance
(AMOVA; Excoffier et al. 1992). To determine the number of homogenous genetic clusters (K),
the program STRUCTURE v.2.3 (Pritchard et al. 2000) was used. The Admixture model
(Pritchard et al. 2000) in combination with the correlated allele frequencies model (Falush et al.
2003) was used. A burnin length of 1,000,000 and 10,000 Markov chain Monte Carlo (MCMC)
samples and sequential independent runs were performed with values of K ranging from one to
five. However, because the structure program does not automatically give the correct number of
possible K present in the dataset (Kalinowski 2011), we identified the correct K through the ad
hoc guidelines suggested by the STRUCTURE manual v. 2.3 and the statistic (delta K) as
suggested by Evanno et al. (2005).
Stellenbosch University http://scholar.sun.ac.za
28
CHAPTER 3
Results
3.1 Mitochondrial DNA data
Penaeus monodon
Electropherograms that were obtained from the two pairs of primers [PmCON–2F/PmCON–2IR
(You et al. 2008) and DLA/ DLB (Chu et al. 2003; McMillen–Jackson and Bert 2003)] did not
show any signs of double reads (evidence for co–amplification of pseudo genes and/or
paralogous genes; Walther et al. 2011) and sequences for the same individuals were identical.
Alignment of sequences to the mtCR fragment of You et al. (2008) produced a 570 base pair
region of perfect matching for 129 specimens. A total of 126 haplotypes (k) were obtained
(including three shared and 123 unique haplotypes) which were defined by a total of 120
polymorphic nucleotide sites (s) (Table 3). All haplotypes were deposited in GenBank (accession
numbers). There were 120 transitions and 32 transversions present in the aligned data set.
Nucleotide frequencies estimated from the entire data set was A–T rich—i.e. A = 39.55%, T =
39.46%, C = 11.61% and G = 9.38%. Haplotype diversity was generally high coupled to lower
nucleotide diversity in each of the five localities; this pattern was consistent in the overall dataset
(Table 3). The within species uncorrected sequence divergences between haplotypes (±SE)
ranged from 0.2% ± 0.2% to 3.3% ± 0.7% (mean: 1.49% ± 0.18%).
Pairwise ΦST values among sampling localities were not significant (Table 4; ΦST ~0, p >
0.05) and AMOVA supported the complete absence of genetic differentiation among localities
Stellenbosch University http://scholar.sun.ac.za
29
(i.e. Table 5; ΦST = 0, p > 0.05). The distribution and evolutionary relationships among juvenile
and adult sequences (haplotypes) are illustrated in the TCS haplotype networks (Figs. 4 & 5).
Haplotypes were not distributed according to a geographic pattern (Fig. 4), and in many
occasions, haplotypes originating from a similar sampling locality were randomly connected
among haplotypes originating from other sampling sites (Fig. 4). In this species also, the gene
sequence of a few juvenile individuals were similar to those of adult specimens (shared
haplotypes: Fig. 5).
Fenneropenaeus indicus
The DNA from a total of 96 specimens of F. indicus was PCR amplified and sequenced.
Alignment of those sequences produced a region of 791 base pairs. Ninety–five haplotypes
(including one shared and 94 unique haplotypes) were obtained and deposited in GenBank
(accession numbers). Haplotype nucleotide frequencies estimated from the overall population
was A = 37.96%, T = 42.68%, C = 9.84% and G = 9.52%. High haplotype and lower nucleotide
diversity values were observed in each of the five localities and this pattern was concordant with
the combined dataset (Table 3). The within species uncorrected sequence divergences between
haplotypes (±SE) ranged from 0.1% ± 0.1% to 7.1% ± 0.9% (mean = 1.48% ± 0.2%). Pairwise
ΦST values for F. indicus among localities were not significant (Table 4; ΦST ~0, p > 0.05) and
AMOVA supported the complete absence of genetic differentiation (i.e. Table 5; ΦST = 0, p >
0.05). The distribution and pattern of evolutionary relationships among juvenile and adult
haplotypes of F. indicus indicated by the TCS networks were similar to the observations made
Stellenbosch University http://scholar.sun.ac.za
30
for P. monodon above. However, three haplotypes of F. indicus were not connected to the main
network (Figs. 4 & 5).
Metapenaeus monoceros
A total of 88 DNA samples from individuals prawns identified in the field as M. monoceros were
PCR amplified and sequenced. However, only 71 sequences (Clade A; Fig. 6) were confirmed as
belonging to M. monoceros and were thus available for analysis. The 71 sequences of authentic
M. monoceros produced 774 base pairs for analysis, and a total of 61 haplotypes (including two
shared and 59 unique haplotypes) were obtained and deposited in GenBank (accession numbers).
The nucleotide frequencies estimated from the entire data set was A = 40.67%, T = 43.33%, C =
7.97% and G = 8.03%. High haplotype and lower nucleotide diversity values were observed in
each locality and from the combined dataset (Table 3). The within species uncorrected sequence
divergence (±SE) ranged from 0.1% ± 0.1% to 4.7% ± 0.7% (mean = 1.1% ± 0.18%). Significant
pairwise ΦST value between NGO and OFK populations was observed (Table 4) (i.e. ΦST =
0.08809, p < 0.002), although the overall ΦST value for AMOVA did not support differentiation
(i.e. Table 5; ΦST = 0.01638, p > 0.05). The TCS network for this species (Figs. 4 & 5) were
comparable to those of P. monodon and F. indicus above, except that more juvenile and adult M.
monoceros shared sequences than in the other two species (Fig. 5).
Stellenbosch University http://scholar.sun.ac.za
31
Table 3. Genetic diversity summary statistics of P. monodon, F. indicus and M. monoceros from
five sampling localities in the MUB. Sample size (n), number of haplotypes (k), polymorphic
sites (s), haplotype diversity (h) and nucleotide diversity (π) are shown. Abbreviations for
sampling locations correspond to those in Table 2
Genetic diversity indices
Spp. Station n s k h π
P.
monodon
KIP 28 65 28 1.0000 ± 0.0095 0.0139 ± 0.0070
NGO 24 55 24 1.0000 ± 0.0120 0.0134 ± 0.0070
MDS 28 70 28 1.0000 ± 0.0095 0.0163 ± 0.0090
OFK 27 64 26 0.9972 ± 0.0111 0.0150 ± 0.0080
OFS 22 67 22 1.0000 ± 0.0137 0.0153 ± 0.0080
Total 129 120 126 0.9996 ± 0.0010 0.0147 ± 0.0076
F. in
dic
us
KIP 25 92 25 1.0000 ± 0.0113 0.0161 ± 0.0083
NGO 24 69 24 1.0000 ± 0.0120 0.0153 ± 0.0080
MDS 15 53 15 1.0000 ± 0.0243 0.0149 ± 0.0080
OFK 17 42 17 1.0000 ± 0.0202 0.0123 ± 0.0066
OFS 15 51 15 1.0000 ± 0.0243 0.0143 ± 0.0077
Stellenbosch University http://scholar.sun.ac.za
32
Total 96 159 95 0.9998 ± 0.0015 0.0147 ± 0.0020
M.
monoce
ros
KIP 22 30 20 0.9870 ± 0.0201 0.0094 ± 0.0051
NGO 15 37 15 1.0000 ± 0.0243 0.0111 ± 0.0061
MDS 7 16 6 0.9524 ± 0.0955 0.0090 ± 0.0055
OFK 10 50 8 0.9333 ± 0.0773 0.0165 ± 0.0092
OFS 17 32 16 0.9926 ± 0.0230 0.0099 ± 0.0055
Total 71 91 61 0.9815 ± 0.0110 0.0109 ± 0.0057
Table 4. Pairwise ΦST values for P. monodon, F. indicus and M. monoceros obtained from the
mtCR. Pairwise RST values for P. monodon from the microsatellite data is given at the end of this
table. Abbreviations for sampling locations correspond to those in Table 2. Significant tests are
indicated by bold values (p < 0.05)
Species Locality KIP NGO MDS OFK OFS
P.
monodon
NGO 0.00000 —
MDS 0.00000 0.00000 —
OFK 0.00000 0.00000 0.00000 —
OFS 0.00000 0.00000 0.00000 0.00367 —
F. in
dic
us
NGO 0.00313 —
MDS 0.00000 0.00000 —
OFK 0.00000 0.00000 0.00000 —
OFS 0.00000 0.00000 0.00000 0.00000 —
Stellenbosch University http://scholar.sun.ac.za
33
M.
monoce
ros
NGO 0.02396 —
MDS 0.00000 0.02548 —
OFK 0.04597 0.08809 0.00000 —
OFS 0.00000 0.00000 0.0000 0.0362 —
P.m
onodon(m
icro
sat)
NGO 0.00292 —
MDS 0.00000 0.00441 —
OFK 0.00047 0.02225 0.00807 —
OFS 0.00719 0.01094 0.00743 0.01487 —
Table 5. Results of the Analysis of Molecular Variance (AMOVA) of P. monodon, F. indicus
and M. monoceros obtained from the comparisons among the five sampling localities using
mtCR sequences. AMOVA obtained from the microsatellite data for P. monodon is given at the
bottom of this table
Species Source of
variation
Degree
of
freedom
Sum
of squares
Variance
contribution
Percentage
of variation
ΦST p
P.
monodon
Among
localities
4 13.6030 0.0000 0.0000 0.0000 (p = 0.9960)
Within
localities
124 523.8780 4.1928 100.0000
Total 128 537.4810 4.1928
F. in
dic
us
Among
localities
4 20.5260 0.0000 0.0000 0.0000 (p = 0.8804)
Within
localities
91 531.4740 5.8030 100.0000
Stellenbosch University http://scholar.sun.ac.za

34
Total 95 552.000 5.8030 M
. m
onoce
ros Among
localities
4 20.584
0.06978
1.6384 0.01638
(p = 0.10861)
Within
localities
66 276.487
4.18919
98.3616
Total 70 297.070
4.25897
Species Source of
variation
Degree
of
freedom
Sum
of squares
Variance
contribution
Percentage
of variation
RST p
P.m
onodon(m
icro
sat)
Among
localities
4 13.926 0.00305 0.1131 0.00113 (p = 1.00000)
Within
localities
98 328.875 0.66337 2.4610
Within
individual
s
103 209 2.02913 75.2770
Total 205 551.801 2.69555
Stellenbosch University http://scholar.sun.ac.za
35
Fig. 3. Statistical parsimony network for P. monodon, F. indicus and M. monoceros. Haplotypes
are proportionally represented by coloured circles. Colour represents geographical localities from
where haplotypes were sampled. Intermediate haplotypes (i.e. black circles) represent unsampled
or extinct haplotypes. A black line connecting haplotypes represents one mutational step.
Stellenbosch University http://scholar.sun.ac.za
36
Fig. 4. Statistical parsimony network for P. monodon, F. indicus and M. monoceros showing
evolutionary relationships of juvenile and adult haplotypes. Haplotypes are proportionally
represented by coloured circles. Colour represents maturity stages (juvenile/adults). Intermediate
Stellenbosch University http://scholar.sun.ac.za
37
haplotypes (i.e. black circles) represent unsampled or extinct haplotypes. A black line connecting
haplotypes represents one mutational step.
3.2 Microsatellite data
Penaeus monodon
Optimization of the three multiplex PCR reactions allowed for successful amplification of six
polymorphic loci. All six microsatellite loci in our study indicated significant deviations from
Hardy–Weinberg Equilibrium (HWE) when samples were combined (Table 6). Nonetheless,
there were 24 out of 30 cases where locality–locus significant HWE deviations were observed
(Table 6). The significant deviations from HWE were all indicated by positive and significant
inbreeding coefficient FIS relative to heterozygote deficiency. MICROCHECKER analysis
suggested the presence of null alleles in each of the six loci and their estimated frequencies were
0.1119 for PM25, 0.0489 for PM27, 0.1438 for PM580, 0.103 for PM3854, 0.1652 for PM3945
and 0.1761 for PM4018. We did not detect any two loci that had significant genotypic linkage
disequilibrium, thus each locus represents a unique evolutionary pathway. All loci except
PM4018 were highly polymorphic as indicated by high values of allelic richness (AR) and
expected heterozygosity (summarised in Table 6).
Pairwise RST values among localities were not statistically significant [Table 4; (RST
range = 0.000–0.0222, p > 0.05)]. AMOVA results indicated an absence of genetic differentiation
Stellenbosch University http://scholar.sun.ac.za
38
(Table 5). Structure analysis in combination with the more formal algorithms (Evanno et al.
2005), suggested the presence of a single genetic population (K = 1; Fig. 5).
Table 6. Genetic characteristics of six nuclear microsatellite loci for P. monodon samples
obtained from five sampling localities. Abbreviations for sampling locations correspond to those
in Table 2. NA = number of alleles, AR = allelic richness, Ho = observed heterozygosity, He =
unbiased expected heterozygosity, FIS inbreeding coefficient (Bold FIS indicate significant
departure from HWE)
Sampling localities
Locus KIP
(n=21)
NGO
(n=20)
MDS
(n=22)
OFK
(n=20)
OFS
(n=20)
Total
(N=103)
PM25 NA 17 14 14 16 17 20
AR 16.710 14.000 13.622 16.000 17.000 15.119
HO 0.857 0.650 0.636 0.700 0.750 0.718
He 0.942 0.894 0.919 0.923 0.932 0.929
FIS 0.092 0.278 0.312 0.246 0.199 0.225
PM27 NA 18 19 15 20 19 24
AR 17.660 19.000 14.786 20.000 19.000 17.245
HO 0.714 0.850 0.864 0.850 0.950 0.845
He 0.942 0.937 0.938 0.954 0.94 0.938
FIS 0.246 0.095 0.081 0.111 -0.011 0.106
PM580 NA 16 17 15 15 15 29
AR 15.617 17.000 14.617 15.000 15.000 16.222
HO 0.667 0.700 0.636 0.700 0.600 0.660
He 0.916 0.933 0.932 0.922 0.906 0.926
FIS 0.277 0.255 0.323 0.245 0.344 0.289
PM3854 NA 24 18 24 22 12 34
AR 23.373 18.000 22.617 22.000 12.000 20.262
HO 0.762 0.800 0.727 0.750 0.750 0.757
Stellenbosch University http://scholar.sun.ac.za
39
He 0.966 0.942 0.961 0.958 0.910 0.957
FIS 0.216 0.154 0.247 0.221 0.180 0.206
PM3945 NA 18 16 14 19 17 32
AR 17.613 16.000 13.797 19.000 17.000 18.645
HO 0.476 0.650 0.546 0.700 0.800 0.631
He 0.934 0.946 0.923 0.953 0.949 0.946
FIS 0.496 0.319 0.415 0.270 0.160 0.335
PM4018 NA 7 4 6 6 6 10
AR 6.95 4.000 5.727 6.000 6.000 5.983
HO 0.381 0.650 0.318 0.350 0.550 0.447
He 0.743 0.676 0.651 0.641 0.676 0.687
FIS 0.494 0.039 0.517 0.460 0.190 0.348
AR 24.833 14.667 14.667 16.333 14.333 24.833
HO /locality 0.643 0.717 0.621 0.675 0.733 0.676
He /locality 0.907 0.888 0.887 0.892 0.886 0.897
FIS 0.297 0.197 0.305 0.248 0.176 0.246
Stellenbosch University http://scholar.sun.ac.za
40
Fig. 5. Results from the structure analysis (performed using six microsatellite loci) showing
genetic population clusters ranging from K = 1 to K = 5. Each colour represents a single inferred
genetic cluster irrespective of the geographic origin of samples. Each individual is represented by
a vertical bar. The numbers and proportions of colours (ranging from 0 to 1) contained in each
individual indicates the extent of genetic admixture of that individual.
K=1
K=2
K=3
K=4
K=5
Stellenbosch University http://scholar.sun.ac.za
41
CHAPTER 4
Discussion
4.1 Genetic diversity of P. monodon, F. indicus and M. monoceros in the Malindi–
Ungwana Bay, Kenya
Genetic diversity at the mtCR at each of the five localities was generally high for all three
species analysed (i.e. P. monodon: h = 0.9972–1.0000; F. indicus: h = 1.0000; M. monoceros: h
= 0.9333–1.0000). A high genetic diversity estimate per species was also observed when
haplotypes from the five sampling localities were combined. High genetic diversity of penaeids
in the MUB is congruent with previous results for P. monodon from IWP (h = 0.969–1.000; You
et al. 2008), Farfantepenaeus duorarum from the southeastern United States (h = 1.000;
McMillen–Jackson and Bert 2004) and Fenneropenaeus chinensis from northern China seas (h =
0.9500–0.9900; Kong et al. 2010). The microsatellite analysis confirmed the high genetic
diversity of P. monodon, based on heterozygosity levels (He = 0.886–0.907) and allelic richness
(AR = 14.333–24.833).
The high heterozygosity is comparable to P. monodon from IWP (He = 0.82–0.91;
Waqairatu et al. 2012), but these values are much higher than those detected in the open
thelycum Litopenaeus vannamei from the eastern Pacific (He = 0.241–0.388; Valles–Jimenez et
al. 2005). The discrepancy might be due to a homozygote excess in the present data set,
compared to a homozygote deficit in the data set used for L. vannamei by Valles–Jimenez et al.
(2005). Also, the life histories of the two species differ in that the P. monodon life cycle involves
Stellenbosch University http://scholar.sun.ac.za
42
both marine and estuarine waters, making them highly migratory species. To the contrary, L.
vannamei inhabits predominantly estuarine waters, thus limiting its dispersal range.
The high genetic diversity of the three species reflects the large effective population sizes
of these taxa (Ovenden et al. 2007; Leffler et al. 2012), high rates of mitochondrial evolution
(Palumbi and Benzie 1991; Baldwin et al. 1998; McMillen–Jackson and Bert 2003) and at the
nuclear microsatellite DNA (Chakraborty et al. 1997). Moreover, the neutral theory of molecular
evolution (Kimura and Crow 1964; Kimura 1983) suggests that species with large effective
population sizes tend to reach mutation–random drift equilibrium, thus such species retain high
levels of genetic diversity. This is consistent with present observations. There was no genetic
evidence of inbreeding or overfishing, both of which may be associated with a smaller effective
population size (reviewed in Charlesworth and Wright 2001; Allendorf et al. 2008; Leffler et al.
2012). Lower effective population sizes may lead to a faster rate of loss of variation (alleles) due
to genetic random drift (Charlesworth 2009), which was not evident in this study.
Penaeus monodon, F. indicus and M. monoceros in the MUB exhibit some differences in
habitat preference, and abundance and distribution patterns (see sections 1.2 and 1.4), but likely
share similar mechanisms of dispersal and recruitment between the local estuaries and offshore
habitats. Presumably, therefore, comparable levels of genetic diversities can be explained by a
combination of similar life–history patterns, rates of molecular evolution and effective
population sizes. Nevertheless, M. monoceros indicated the lowest haplotype diversity when
compared to the other two species, despite its more generalist habitat preferences and higher
abundance than P. monodon. A possible explanation to the above genetic diversity patterns
could be an imprint due to a difference in the timing of historical demographic events. For
Stellenbosch University http://scholar.sun.ac.za
43
instance, M. monoceros might have experienced a recent population bottleneck, or alternatively,
the effective population size of M. monoceros might be lower than the other two species. Ramos-
Onsins et al. (2004) and Piganeau and Eyre–Walker (2009) showed that effective population
sizes could vary even among closely related species. Another cause might be due to differences
in mutation rates among the three taxa. Kumar et al. (2012) found that the rate of mitochondrial
evolution is not uniform among penaeid species.
Exceptionally high numbers of unique haplotypes (as shown in the present study,
especially for P. monodon and F. indicus) appear to be relatively common among penaeid
prawns, and were previously found at the mtCR fragment of P. monodon (You et al. 2008;
Waqairatu et al. 2012), F. duorarum (McMillen–Jackson and Bert 2004) and F. chinensis (Kong
et al. 2010). This characteristic of penaeid prawns suggest that the rate at which neutral
mutations are being incorporated into the mtCR fragment is very rapid, and given the possession
of large effective population sizes usually associated with these taxa, a large number of
haplotypes can thus be maintained. It is noteworthy that a high number of haplotypes can
generally be expected in the highly evolving markers, but not from every gene in those species.
This is because the intra–species evolutionary rate among mitochondrial genes is not similar. For
instance, the mitochondrial Cytochrome c Oxidase Subunit 1 (CO1) gene of F. indicus did not
show as many unique haplotypes (Querci 2003; De Croos and Palsson 2010).
The significant deviation from Hardy–Weinberg Equilibrium (HWE) indicated by
heterozygote deficiency in this study is also not unique, and has been shown elsewhere for P.
monodon (Brooker et al. 2000; Pan et al. 2004; You et al. 2008; Waqaitaru et al. 2012), and in
other marine invertebrates (Raymond et al. 1997; Huang et al. 2000; Addison and Hart 2005)
Stellenbosch University http://scholar.sun.ac.za
44
and fish (Hoarau et al. 2002; Morin et al. 2009). As mentioned earlier, factors that can cause a
microsatellite locus to deviate from HWE due to heterozygote deficits include stuttering, large
allele dropouts, null alleles, selection, inbreeding and Wahlund effect (reviewed in Selkoe and
Toonen 2006). In our study, however, heterozygote deficit (i.e. positive significant FIS or excess
in homozygotes) could be caused either by null alleles or Wahlund effect. This is because
stuttering, which is most often detected in microsatellite loci that contain di–nucleotide repeat
motifs, was rare or completely eliminated from our study because individuals that produced
ambiguous peaks were re–amplified and scored more than once, using controls. In addition,
alleles were consistently scored in established bins and edited manually prior to verification by
an independent researcher, thus eliminating the inclusion of wrongly scored alleles in our
analysis.
Inbreeding, which is expected to affect all neutral loci, is also unlikely to explain our data
since all samples originated from the wild, and the mtDNA results indicate an extreme high level
of haplotypic diversity (i.e. indirectly suggesting the absence of inbreeding). Selection is also
unlikely to explain the present findings, because the microsatellite loci analysed (with di–
nucleotide repeat units) occurred in the non–coding region of the nuclear genome (Selkoe and
Toonen 2006). Heterozygosity at neutral loci can be extensively reduced through genetic hitch
hiking when loci are linked to selected regions of the genome (Maynard–Smith and Haigh 1974;
Kim and Stephan 2000) – no signature for this was detected because no two loci were linked.
The presence of null alleles cannot be completely excluded from our study because they
have previously been reported in many invertebrates species (Pan et al. 2004; Gruenthal and
Stellenbosch University http://scholar.sun.ac.za
45
Burton 2008; You et al. 2008), and were also suggested by MICROCHECKER in the present
analysis. However, if the presence of null alleles was indeed driving ―non equilibrium‖, it would
be unique to this study. For instance, null alleles arise if the conserved microsatellite flanking
region from where priming was expected to occur inadvertently mutates, the PCR condition is
not fully optimised to allow amplification of all alleles present in a locus. In our case it is
unlikely that null alleles caused the heterozygote deficit, since the deficit occurred across all six
loci and at 24 out of 30 locus/locality cases.
The Wahlund effect (the occurrence of individuals in a single sampling unit that
originated from genetically distinct populations, but were brought together erroneously during
sampling) may be a plausible reason for present deviations from HWE expectation, however
there was no genetic differentiation among the five geographical localities from where samples
were obtained (see Ni et al. 2011; You et al. 2008). Alternatively, the Wahlund effect may have
been caused by inadvertent sampling of individuals occurring in similar localities, but belong to
different age groups (cohorts) thus forming a temporal Wahlund effect (Selkoe and Toonen
2006). This phenomenon can occur in the complete absence of genetic differentiation and has
been observed in larval cod Gadus morhua (Ruzzante et al. 1996) and flat fish Pleuronectes
platessa (Hoarau et al. 2002). Penaeid prawns are highly fecund, iteroparous and characterised
by several broods per year (Rao 1968; Jayawardane et al. 2002). These life history characteristics
coupled with ocean currents might facilitate dispersal among localities and the occurrence of
different cohorts in the same localities, thus leading to temporal Wahlund effect. It is noteworthy
that the Wahlund effect is expected to affect all microsatellite loci (reviewed in Selkoe and
Toonen 2006) which is the case we observed in our study.
Stellenbosch University http://scholar.sun.ac.za
46
4.2 Dispersal and recruitment patterns in the Malindi–Ungwana Bay
A complete lack of genetic differentiation in the MUB, as shown for the three penaeids in the
present study, was also observed in parrot fish Scarus ghobban (Visram et al. 2010), and two
mangrove crab species; Neosarmatium meinerti (Ragionieri et al. 2010) and Perisesarma
guttatum (Silva et al. 2010). These six species all rely on larval dispersal processes driven by
water movements, and the lack of genetic structure therefore suggests the absence of clear
barriers to gene flow in the MUB region of Kenyan marine waters. It therefore appears that
pelagic larvae of several taxa, including fish and crustaceans, are mixed throughout the MUB
region, where water movements are facilitated by river outflow, tidal exchange, and monsoonal
winds coupled with ocean currents (see Chapter 1). Furthermore, it appears that differences in
distribution ranges and habitat preferences in the MUB among the three penaeids (Chapter 1),
and among several other taxa, do not influence the genetic differentiation patterns at the local
scale that was studied here.
The absence of genetic differentiation observed for the three prawn species in MUB,
coupled to the distribution pattern of juveniles and adult haplotypes (see Fig. 3 & 4) strongly
suggest local recruitment patterns. Nevertheless, the MUB populations may also be receiving
larvae from more distant sources along the East African coast, such as Tanzania, Mozambique or
South Africa.
The alongshore currents and absence of clear physical barriers to geneflow along the East
African coast may facilitate long distance dispersal of pelagic larvae, and therefore some prawns
in the MUB might have originated from distant sources. This is supported by the genetic
panmixia of F. indicus along the East African coast (Querci 2003), as well as the genetically
Stellenbosch University http://scholar.sun.ac.za
47
diverged haplotypes (i.e. unconnected haplotypes; Fig 3 & 4) in the present study. Even though
the occurrence of unconnected haplotypes to the main network may signal under–sampling
(inadvertent failure to sample intermediate haplotypes; Chen et al. 2010) or sympatric speciation
(Barluenga et al. 2006), it is more likely an indication of some recruitment from distant sources.
This hypothesis is supported by previous studies on marine crustaceans that have shown
extensive regional geneflow along the East African coast, but disjunct from populations
surrounding island states such as Madagascar, Seychelles and Mauritius (Duda and Palumbi
1999; You et al. 2008; Ragionieri et al. 2010).
4.3 Management of prawn fisheries in the MUB region
4.3.1 Local management recommendations
Each of the three prawn species studied exhibited single genetically panmictic populations in the
MUB region. Consequently, the traditional and recent demarcations of the MUB to form
artisanal (< 3nm) and commercial (3< nm) fisheries is not supported by molecular data, and both
fisheries target the same stocks with a single gene pool per species. The present study therefore
shows that indicators other than genetically separate stocks need to be developed to support
fisheries management strategies, and particularly the division of fishing grounds among artisanal
and commercial fishing sectors. These may more appropriately be based on factors such as
prawn distribution and abundance patterns, recruitment trends, and socio–economic criteria.
Stellenbosch University http://scholar.sun.ac.za

48
The present study showed that nearly all prawn recruits into the MUB originate from the
nearby estuaries. It is therefore important that estuaries be recognized as nurseries that support
artisanal and commercial prawn fisheries, and that they are conserved and managed to maintain
prawn nursery habitats. The destruction of nursery habitats through discharge of untreated wastes
or chemicals, clearance of mangrove habitats for human settlements or commerce (e.g. ports and
harbour constructions), and upstream building activities such as dams, that may reduce river
discharge and therefore alter juvenile recruitment to offshore habitats, need to be identified and
mitigated. Failure to do so may eventually collapse prawn fisheries in MUB, as was illustrated
for the shallow-water prawn fishery on the Tugela Banks off eastern South Africa (Turpie and
Lamberth 2010). The latter fishery also depended on P. monodon, F. indicus and M. monoceros.
A high genetic diversity of prawns in the MUB implies that they are more likely to be
able to adapt to human and/or climatic induced pressures. However, management of these
fisheries need to conserve and protect this diversity from overfishing exploitation, because these
prawn stocks support numerous anthropogenic needs in the region.
4.3.2 Regional management issues
The three penaeid species addressed in the present study are the mainstay of the artisanal and
commercial trawl fisheries in the MUB region of Kenya, and are also caught as primary target
species in similar fisheries in several other countries of the SWIO (Tanzania, Mozambique,
South Africa, Madagascar) (van der Elst et al. 2009). To date, prawn fisheries in the SWIO are
managed individually by countries in which they occur, and consequently a variety of
management policies and methods has developed in the region (see FAO 2006).
Stellenbosch University http://scholar.sun.ac.za

49
It is likely that the genetic panmixia observed in prawn populations in the MUB extends
further along the East African coast, because of the effects of alongshore current regimes on
drifting larvae. Indeed, previous studies on P. monodon have indicated that East African coastal
populations differ genetically from those occurring along the west coast of Madagascar (Duda
and Palumbi 1999; You et al. 2008). Furthermore, studies on mangrove crabs Neosarmatium
meinerti and Perisesarma guttatum have also indicated a lack of genetic differentiation along the
East African coast, but differentiated crabs from these areas from those at SWIO island states
(Ragionieri et al. 2010; Silver et al. 2010). The present study can therefore be extended to
include populations from Tanzania, Mozambique, South Africa and Madagascar, to obtain
genetic population structure of the dominant shallow-water penaeid prawns of the SWIO region.
Such a study would contribute to the development of regional management strategies for
shallow-water prawn fisheries in the SWIO region.
Stellenbosch University http://scholar.sun.ac.za
50
CHAPTER 5
General conclusions
This study presents the first finer scale comparative population genetic analyses of closed
thelycum species P. monodon, F. indicus and M. monoceros within the range of their natural
distribution. Further, the study increases the number of genetic population examinations in the
Kenyan coastal waters conducted for prawn species (i.e. P. monodon from one [You et al. 2008]
to two), but presents the first genetic analyses of F. indicus and M. monoceros, not only in the
Kenyan waters but also throughout their range of distributions, when using mtDNA control
region sequences data.
The use of two DNA markers with different evolutionary histories (i.e. mitochondrial and
nuclear microsatellite DNA) is usually a more robust approach in genetic studies (see section 1.6
and Karl et al. 2012). The lack of spatial genetic differentiation among the three species of
prawns in the MUB compares well with results from studies on other taxa (fish, crabs), all of
which found single genetic populations. Contributing factors are likely to include dispersive
planktonic larvae, monsoonal winds, ocean tides and currents, and the complete absence of
physical or environmental barriers to dispersal in the MUB.
Recruitment into the bay is dominated by larvae/juveniles that come from local/nearby
estuarine nursery areas. However, recruitment from distant origins (especially along the
mainland of the east African coast) cannot completed be precluded from this study (discussed in
section 4.2).
Stellenbosch University http://scholar.sun.ac.za

51
The present study needs to be expanded regionally, to include samples from other SWIO
countries (i.e. Tanzania, Mozambique, South Africa and Madagascar), to investigate the extent to
which ocean current systems in the SWIO contribute to larval dispersal patterns, and whether
isolation by distance theory can be applied to prawn populations along the East African
coastline. From a fisheries management perspective, a regional extension of this study will likely
inform on whether prawn stocks are shared among neighbouring countries, or regionally, thus
opening the door for regional fisheries management strategies.
Stellenbosch University http://scholar.sun.ac.za

52
References
Addison, J.A., and Hart, M.W. (2005). Spawning, copulation and inbreeding coefficients in
marine invertebrates. Biology letters 1, 450–453.
Alfaro–Montoya, J. (2010). The reproductive conditions of male shrimps, genus Penaeus, sub–
genus Litopenaeus (open thelyca penaeoid shrimps): A review. Aquaculture 300, 1–9.
Allendorf, F.W., England, P.R., Luikart, G., Ritchie, P.A., and Ryman, N. (2008). Genetic
effects of harvest on wild animal populations. Trends in Ecology and Evolution 23, 327–
337.
Amos, W., and Harwood, J. (1998). Factors affecting levels of genetic diversity in natural
populations. Phil.Trans. R. Soc. Lond. B 353, 177–186.
Baird, H.P., Miller, K.J., and Stark, J.S. (2012). Genetic Population Structure in the Antarctic
Benthos: Insights from the Widespread Amphipod, Orchomenella franklini. PLoS ONE
7, e34363.
Baldwin, J.D., Bass, A.L., Bowen, B.W., and Clark, W.H. Jr. (1998). Molecular Phylogeny and
Biogeography of the Marine Shrimp Penaeus. Molecular phylogenetics and evolution 10,
399–407.
Barluenga, M., Stölting, K. N., Salzburger, W., Muschick, M., and Meyer, A. (2006). Evidence
for sympatric speciation? Nature 439, 719–723.
Becker, B.J., Levin, L.A., Fodrie, F.J. and McMillan, P.A. (2007). Complex larval connectivity
patterns among marine invertebrate populations. Proceedings of the National Academy of
Sciences of the United States of America 104, 3267–3272.
Stellenbosch University http://scholar.sun.ac.za
53
Benzie, J. A. H. M., Ballment, E. Forbes, A. T., Demetriades, N. T., Sugama, K., and Haryanti,
M. S. (2002). Mitochondrial DNA variation in Indo–Pacific populations of the giant
tiger prawn, Penaeus monodon. Molecular Ecology 11, 2553–2569.
Briggs, J.C. (1999). Coincident biogeographic patterns: Indo–West Pacific Ocean. Evolution 53.
Bromham, L. (2009).Why do species vary in their rate of molecular evolution? Biology letters 5,
401–404.
Brooker, A.L., Benzie, J.A.H., Blair, D. and Versini, J.J. (2000). Population structure of the
giant tiger prawn Penaeus monodon in Australian waters, determined using microsatellite
markers. Marine Biology 136, 149–57.
Bunn, S.E., and Hughes, J.M. (1997). Dispersal and recruitment in streams: evidence from
genetic studies. J. N. Am. Benth. Soc. 16, 338–46.
Caley, M. J., Carr, M. H., Hixon, M. A., Hughes, T P, Jones, G. P., and Menge, B. A. (1996).
Recruitment and the local dynamics of open marine populations. Annual Reviews in
Ecology and Systematics 27, 477–500.
Chakraborty, R., Kimmel, M., Stivers, D.N., Davison, L.J., and Deka, R. (1997). Relative
mutation rates at di–, tri–, and tetranucleotide microsatellite loci. Proc. Natl. Acad. Sci.
USA 94, 1041–1046.
Chan, T.Y., Tong, J., Tam, Y.K., and Chu, K.H. (2008). Phylogenetic relationships among the
genera of the Penaeidae (Crustacea: Decapoda) revealed by mitochondrial 16S rRNA
gene sequences. Zootaxa 1694, 38–50.
Charlesworth, D., and Wright, S.I. (2001). Breeding systems and genome evolution. Curr Opin
Genet Dev 11, 685–690.
Stellenbosch University http://scholar.sun.ac.za
54
Charlesworth, B. (2009). Effective population size and patterns of molecular evolution and
variation. Genetics 10, 195–205.
Chen, H., Strand, M., Norenburg, J.L., Sun, S., Kajihara, H., Chernyshev, A.V., Maslakova,
S.A., and Sundberg, P. (2010). Statistical Parsimony Networks and Species
Assemblages in Cephalotrichid Nemerteans (Nemertea). PLoS ONE 5, e12885.
Chu, K.H., Li, C.P., Tam, Y.K., and Lavery, S. (2003). Application of mitochondrial control
region in population genetic studies of the shrimp Penaeus. Molecular ecology notes 3,
120–122.
Clement, M., Posada, D., and Crandall, K. A. (2000). TCS: a computer program to estimate gene
genealogies. Molecular Ecology 9, 1657–1660.
Coates, A.G., Jackson, J.B.C., Collins, L.S., Cronin, T.M., Dowsett, H.J., Bybell, L.M., Jung, P.,
and Obando, J. (1992). Closure of the Isthmus of Panama: The near-shore marine record
of Costa Rica and western Panama. Geol Soc Am Bull 104, 814–828.
Crandall, E.D., Taffel, J.R., and Barber, P.H. (2010). High gene flow due to pelagic larval
dispersal among South Pacific archipelagos in two amphidromous gastropods
(Neritomorpha: Neritidae). Heredity 104, 563–572.
Criales, M.M., Wang, J., Browder, J.A., and Robblee, M.B. (2005).Tidal and seasonal effects on
transport of pink shrimp postlarvae. Marine Ecology Progress Series 286, 231–238.
Dai, C.F., Fan, T.Y., and Yu, J.K. (2000). Reproductive isolation and genetic differentiation of a
scleractinian coral Mycedium elephantotus. Marine ecology progress series 201, 179–
187.
Stellenbosch University http://scholar.sun.ac.za
55
Dall, W. (2007). Recent molecular research on Penaeus sensu lato. Journal of Crustacean
Biology 27, 380–382.
Dall, W., Hill, B.J., Rothlisberg, P.C., and Staples, D.J. (1990). The biology of Penaeidae.
Advances in Marine Biology 27, 1–484.
De Croos, M.D.S.T., and Pálsson, S. (2010). Mitochondrial DNA variation and population
genetic structure of white shrimp Fenneropenaeus indicus along the coastal belt of Sri
Lanka. Aquatic Living Resources 23, 315–323.
Duda, T. F., and Palumbi, S. R. (1999) Population structure of the black tiger prawn, Penaeus
monodon among Western Indian Ocean and Western Pacific Populations. Marine
Biology 134, 705–710.
Evanno, G., Regnaut, S., and Goudet, J. (2005). Detecting the number of clusters of individuals
using the software STRUCTURE: a simulation study. Molecular Ecology 14, 2611–2620.
Excoffier, L. Laval,G., and Schneider, S. (2005). Arlequin ver. 3.0: An integrated software
package for population genetics data analysis. Evolutionary Bioinformatics Online 1, 47–
50.
Excoffier, L, Smouse, P. E. and Quattro, J. M. (1992). Analysis of molecular variance inferred
from metric distances among DNA haplotypes: Application to human mitochondrial
DNA restriction data. Genetics 131, 479–491.
Falush, D., Stephens, M., and Pritchard, J. K. (2003). Inference of population structure:
Extensions to linked loci and correlated allele frequencies. Genetics 164, 1567–1587.
Stellenbosch University http://scholar.sun.ac.za
56
FAO, 1971. Report to the Government of Kenya on the evaluation of Prawn (Penaeidae) and
spiny lobster (Palinuridae) Marine resources. Based on the work of H.A. Brusher, Marine,
Marine Fishery Biologist. Rep. FAO/UNDP/(TA) (3006), 40p.
FAO (2006). Review of the state of world marine capture fisheries management: Indian Ocean.
FAO Fisheries Technical Paper 488.
Faurby, S., and Barber, P.H. (2012).Theoretical limits to the correlation between pelagic larval
duration and population genetic structure. Molecular Ecology 21, 3419–3432.
Flegel, T.W. (2007). The right to refuse revision in the genus Penaeus. Aquaculture 264, 2–8.
Flegel, T.W. (2008). Confirmation of the right to refuse revision in the genus Penaeus.
Aquaculture 280, 1–4.
Forbes, A.T., and Demetriades, N.T. (2005). A Review of the Commercial, Shallow water
Penaeid Prawn Resource of South Africa. Marine and Estuarine Research; Report.
Fromentin, J.M., Ernande, B., Fablet, R., and de Pontual, H. (2009). Importance and future of
individual markers for the ecosystem approach to fisheries. Aquatic Living Resources 22,
395–408.
Fulanda, B., Ohtomi, J., Mueni, E., and Kimani, E. (2011). Fishery trends, resource–use and
management system in the Ungwana Bay fishery Kenya. Ocean and Coastal
Management 54, 401–414.
Stellenbosch University http://scholar.sun.ac.za
57
Groeneveld, J.C., Von der Heyden, S., and Matthee, C.A. (2012). High connectivity and lack of
mtDNA differentiation among two previously recognized spiny lobster species in the
southern Atlantic and Indian Oceans. Marine Biology Research 8, 764–770.
Hellberg, M. (1996). Dependence of gene flow on geographic distance in two solitary corals with
different larval dispersal capabilities. Evolution 50, 1167–1175.
Hoarau, G., Rijnsdorp, A.D., van der Veer, H.W., Stam, W.T., and Olsen, J.L. (2002).
Population structure of plaice (Pleuronectes platessa L.) in northern Europe:
microsatellites revealed large–scale spatial and temporal homogeneity. Molecular
Ecology 11, 1165–1176.
Holthuis, L.B. (1980). FAO Species Catalogue. Vol. 1 Shrimps and prawns of the world. FAO
Fish. Synop. 125, 1–271.
Hrbek, T., and Meyer, A. (2003). Closing of the Tethys Sea and the phylogeny of Eurasian
killifishes (Cyprinodontiformes: Cyprinodontidae). Journal of Evolutionary Biology16,
17–36.
Huang, B., Peakall, X.R., and Hanna, P.J. (2000). Analysis of genetic structure of blacklip
abalone (Haliotis rubra) populations using RAPD, minisatellites and microsatellites.
Marine biology 136, 207–216.
Galtier, N., Nabholz, B., Gle´min, S., and Hurst, G. D. D. (2009). Mitochondrial DNA as a
marker of molecular diversity: a reappraisal. Molecular Ecology 18, 4541–4550.
Gilg, M. R., and Hilbish, T. J. (2003). The geography of marine larval dispersal: coupling
genetics with fine–scale physical oceanography. Ecology 84, 2989–2998.
Stellenbosch University http://scholar.sun.ac.za
58
Goudet, J. (2002). ‗FSTAT, a program to estimate and test gene diversities and fixation indices
(ver. 2.9.3.2).‘ Available at http://www2.unil.ch/ popgen/softwares/fstat.htm.
Gruenthal, K.M., and Burton R.S. (2008). Genetic structure of natural populations of the
California black abalone (Haliotis cracherodii Leach, 1814), a candidate for endangered
species status. Journal of Experimental Marine Biology and Ecology 355, 47–58.
Jayawardane, P.A.A.T., McLuscky, D.S., and Tytler, P. (2002). Reproductive Biology of
Penaeus indicus (H. Milne Edwarsd, 1837) from the Western Coast of Srilanka. Asian
Fish. Sci. 15, 315–328.
Kalinowski, S.T. (2011). The computer program STRUCTURE does not reliably identify the
main genetic clusters within species: simulations and implications for human population
structure. Heredity 106, 625–632.
Karl, S.A., Toonen, R.J., Grant, W.S., and Bowen, B.W. (2012). Common misconceptions in
molecular ecology: echoes of the modern synthesis. Molecular Ecology 21, 4171–4189.
Keigwin, L.D. (1978). Pliocene closing of the isthmus of Panama based on biostratigraphic
evidence from nearby Pacific and Caribbean sea cores. Geology 6, 630-634.
Kenya Fisheries Department (2006a). Fisheries Annual Statistical bulletin. 53pp.
Kenya Fisheries Department (2006b). Marine waters frame survey report. 48pp.
Kim, Y., and Stephan, W. (2000). Joint Effects of Genetic Hitchhiking and Background
Selection on Neutral Variation. Genetics 155, 1415–1427.
Kimura, M., and Crow, J. F. (1964). The number of alleles that can be maintained in a finite
population. Genetics 49, 725–738.
Stellenbosch University http://scholar.sun.ac.za
59
Kimura, M. (1983). The neutral theory of molecular evolution. Cambridge Univ. Press,
Cambridge, U.K.
Kitheka, J.U. (2002). Freshwater and sediment discharge in Ungwana bay: the role of the Tana
and Sabaki rivers. KMFRI Techical report. 12/200, pp 2–16.
Kitheka, J.U., Obiero, M., and Nthenge, P. (2005). River discharge, sediment transport and
exchange in the Tana estuary Kenya. Estuarine, Coastal and Shelf Science 63, 455–468.
Kumar, C.P., John, B.A., Khan, S.A., Lyla, P.S., and Jalal, K.C.A. (2012). Limit of DNA
Barcode in Delineating Penaeus monodon and in its Developing Stages. Sains
Malaysiana 41, 1527–1533.
Laikre, L., Palm, S., and Ryman, N. (2005). Genetic Population Structure of Fishes: Implications
for Coastal Zone Management. AMBIO: A Journal of the Human Environment 34, 111–
119.
Lavery, S., Chan, T.Y., Tam, Y.K., and Chu, K.H. (2004). Phylogenetic relationships and
evolutionary history of the shrimp genus Penaeus s.l. derived from mitochondrial DNA.
Molecular Phylogenetics and Evolution 31, 39–49.
Ledoux, J.B., Tarnowska, K., Gérard, K., Lhuillier, E., Jacquemin, B., Weydmann, A., Feral,
J.P., and Chenuil, A. (2012). Fine–scale spatial genetic structure in the brooding sea
urchin Abatus cordatus suggests vulnerability of the Southern Ocean marine invertebrates
facing global change. Polar Biology 35, 611–623.
Leffler, E.M., Bullaughey, K., Matute, D.R., Meyer, W.K., Se´gurel, L., Venkat, A., Andolfatto,
P., and Przeworski, M. (2012). Revisiting an Old Riddle: What Determines Genetic
Diversity Levels within Species? PLoS Biology 10, e1001388.
Stellenbosch University http://scholar.sun.ac.za
60
Librado, P., and Rozas, J. (2009). DnaSP v5: a software for comprehensive analysis of DNA
polymorphism data. Bioinformatics 25, 1451–1452.
Lowe, W.H., and Allendorf, F.W. (2010). What can genetics tell us about population
connectivity? Molecular Ecology 19, 3038–3051.
Ma, K.Y., Chan, T.Y., and Chu, K.H. (2009). Phylogeny of penaeoid shrimps (Decapoda:
Penaeoidea) inferred from nuclear protein–coding genes. Molecular Phylogenetics and
Evolution 53, 45–55.
Ma, K. Y., Chan, T. Y., and Chu, K. H. (2011). Refuting the six-genus classification of Penaeus
s.l. (Dendrobranchiata, Penaeidae): a combined analysis of mitochondrial and nuclear
genes. Zoologica Scripta 40, 498–508.
Macia, A. (2004). Juvenile Penaeid Shrimp density, Spatial distribution and Size Composition in
four adjacent habitats within a Mangrove–Fringed Bay on Inhaca Island, Mozambique.
Western Indian Ocean Journal of Marine Science 3, 163–178.
Maggioni, R., Rogers, A. D., Maclean, N., and D‘Incao, F. (2001). Molecular phylogeny of
western Atlantic Farfantepenaeus and Litopenaeus shrimp based on mitochondrial 16S
partial sequences. Molecular Phylogenetics and Evolution 18, 66–73.
Malhi, R.S., Eshleman, J.A., Greenberg, J.A., Weiss, D.A., Shook, B.A.S., Kaestle, F.A.,
Lorenz, J.G., Kemp, B.M., Johnson, J.R., and Smith, D.G. (2002). The Structure of
Diversity within New World Mitochondrial DNA Haplogroups: Implications for the
Prehistory of North America. American Journal of Human Genetics 70, 905–919.
Maynard–Smith, J., and Haigh, J. (1974). The hitch–hiking effect of a favourable gene.
Genetical Research 23, 23–35.
Stellenbosch University http://scholar.sun.ac.za
61
McClanahan, T.R. (1988). Seasonality in East Africa‘s coastal waters. Marine Ecology Progress
Series 44, 191–199.
McClanahan, T.R., Maina, J., and Davies, J. (2005). Perceptions of resource users and managers
towards fisheries management options in Kenyan coral reefs. Fisheries Management and
ecology 12, 105–112.
McMillen–Jackson, A., and Theresa M. Bert, T.M. (2003). Disparate patterns of population
genetic structure and population history in two sympatric penaeid shrimp species
(Farfantepenaeus aztecus and Litopenaeus setiferus) in the eastern United States.
Molecular Ecology 12, 2895–2905.
McMillen–Jackson, A., and Theresa M. Bert, T.M. (2004). Genetic diversity in the MtDNA
control region and population structure in the pink shrimp Farfantepenaeus duorarum.
Journal of Crustacean Biology 24, 101–109.
Mgaya, Y.D., and Teikwa, E.D. (2003). Abundance and reproductive biology of the penaeid
prawns of Bagamoyo coastal waters, Tanzania. Western Indian Ocean. Journal of Marine
Science 2, 117–126.
Morin, P.A., Leduc, R.G., Archer, F.I., Martien, K.K., Huebinger, R., Bickham, J.W., and Taylor
B.L. (2009). Significant deviations from Hardy–Weinberg equilibrium caused by low
levels of genotyping errors. Molecular Ecology Resources 9, 498–504.
Munga, C., Ndegwa, S., Fulanda, B., Manyala, J., Kimani, E., Ohtomi, J., and Vanreusel, A.
(2012). Bottom shrimp trawling impacts on species distribution and fishery dynamics;
Ungwana Bay fishery Kenya before and after the 2006 trawl ban. Fisheries Science 78,
209–219.
Stellenbosch University http://scholar.sun.ac.za
62
Mwaluma, J. (2002). Zooplankton abundance, distribution and species composition in Ungwana
Bay. KMFRI Tech Rep–12/2001, pp 20–23.
Nabholz, B., Mauffrey, J.F., Bazin, E., Galtier, N., and Glemin, S. (2008) Determination of
mitochondrial genetic diversity in mammals. Genetics 178, 351–361.
Nandakumar, G. (2001). Reproductive biology of the speckled shrimp Metapenaeus monoceros
(Fabricius). Indian Journal of Fisheries 48, 1–8.
Ni, L., Li, Q., and Kong, L. (2011). Microsatellites reveal fine–scale genetic structure of the
Chinese surf clam Mactra chinensis (Mollusca, Bivalvia, Mactridae) in Northern China.
Marine Ecology 32, 488–497.
Niamaimandi, N., Arshad, A., Daub, S.K., Saed, R.C., and Kiabi, B. (2007). Population
dynamic of green tiger prawn, Penaeus semisulcatus (De Haan) in Bushehr coastal
waters, Persian Gulf. Fisheries Research 86, 105–112.
Osore, M.K.W. (1992). A note on the zooplankton distribution and diversity in a tropical
mangrove creek system, Gazi, Kenya. Hydrobiologia 247, 119–120.
Ovenden, J.R., Peel, D., Street, R., Courtney, A.J., Hoyle, S.D., Peel, S.L., and Oodlich, H.
(2007). The genetic effective and adult census size of an Australian population of tiger
prawns (Penaeus esculentus). Molecular Ecology 16, 127–138.
Pérez Farfante, I., and Kensley, B. (1997). Penaeoid and Sergestoid Shrimps and Prawns of the
World. Éditions du Muséum national d‘Histoire naturelle, Paris, 152 pp.
Primavera, J.H. (1979). Notes on the courtship and mating behavior in Penaeus monodon
Fabricius (Decapoda, Natantia). Crustaceana 37, 287–292.
Stellenbosch University http://scholar.sun.ac.za
63
Primavera, J.H. (1985). A Review of Maturation and Reproduction in Closed Thelycum
Penaeids. Proceedings of the First International Conference on the Culture of Penaeid
Prawns/Shrimps, Iloilo City, Philippines, 1984.
Peakall, R., and Smouse, P.E. (2006). GENALEX 6: genetic analysis in Excel. Population
genetic software for teaching and research. Molecular Ecology Notes 6, 288 – 295.
Pan, Y.W., Chou, H.H., You, E.M., and Yu, H.T. (2004). Isolation and characterization of 23
polymorphic microsatellite markers for diversity and stock analysis in tiger shrimp
(Penaeus monodon). Molecular Ecology Notes 4, 345–347.
Petit, R, El Mousadik, A., and Pons, O. (1998). Identifying populations for conservation on the
basis of genetic markers. Conservation Biology 12, 844–855.
Piganeau, G., and Eyre–Walker, A. (2009), Evidence for Variation in the Effective Population
Size of Animal Mitochondrial DNA. PLoS ONE 4, e4396.
Pritchard, J. K., Stephens, M., and Donnelly, P. (2000). Inference of population structure using
multilocus genotype data. Genetics 155, 945–959.
Quan, J., Zhuang, Z., Deng, J., Dai, J., and Zhang, Y. (2004). Phylogenetic Relationships of 12
Penaeoidea Shrimp Species Deduced from Mitochondrial DNA Sequences. Biochemical
Genetics 42, 331–345.
Querci, J. (2003). Population genetics of the prawn Penaeus indicus (crustacean: Decapoda) in
the Western Indian Ocean. PhD Thesis. University of Durban.
Ragionieri, L., Cannicci, S., Schubart, C.D., and Fratini, S. (2010). Gene flow and demographic
history of the mangrove crab Neosarmatium meinerti: A case study from the western
Indian Ocean. Estuarine Coastal and Shelf Science 86, 179–188.
Stellenbosch University http://scholar.sun.ac.za
64
Ramos–Onsins, S.E., Stranger, B.E., Mitchell–Olds, T., and Aguade, M. (2004). Multilocus
Analysis of Variation and Speciation in the Closely Related Species Arabidopsis halleri
and A. lyrata. Genetics 166, 373–388.
Rao, P.V. (1968). Maturation and spawning of the penaeid prawns of the southwest coast of
India. FAO Fisheries Report 57, 285–302.
Raymond, M., and Rousset, F. (1995). An exact test for population differentiation. Evolution 49,
1280–1283.
Raymond, M., Vaanto, R. L., Thomas, F., Rousset, F., de Meeus, T., and Renaud, F. (1997).
Heterozygote deficiency in the mussel Mytilus edulis species complex revisited. Marine
ecology progress series 156, 225–237.
Reynolds, L.K., McGlathery, K.J., and Waycott, M. (2012). Genetic Diversity Enhances
Restoration Success by Augmenting Ecosystem Services. PLoS ONE 7, e38397.
Rice, W.R. (1989). Analyzing tables of statistical tests. Evolution 43, 223–225.
Rousset, F. (2008). Genepop‘007: a complete reimplementation of the Genepop software for
Windows and Linux. Molecular Ecology Resources 8, 103–106.
Ruzzante, D.E., Taggart, C.T., and Cook, D. (1996). Spatial and temporal variation in the genetic
composition of larval cod (Gadus morhua) aggregation; Cohort contribution and genetic
stability. Canadian Journal of Fisheries and Aquatic Sciences 53, 2695–2705.
Selkoe, K.A., and Toonen, R.J. (2006). Microsatellites for ecologists: a practical guide to using
and evaluating microsatellite markers. Ecology letters 9, 615–629.
Stellenbosch University http://scholar.sun.ac.za
65
Schwartz, M.K., Luikart, G., and Waples, R.S. (2007). Genetic monitoring as a promising tool
for conservation and management. TRENDS in Ecology and Evolution 22.
Shanks, A. L., Grantham, B. A., and Carr, M. H. (2003). Propagule dispersal distance and the
size and spacing of marine reserves. Ecological Applications 13, S159–S169.
Shanks, A.L. (2009). Pelagic Larval Duration and Dispersal Distance Revisited. Biology Bulletin
216, 373–385.
Sheridan, P., and Hays, C. (2003). Are mangroves nursery habitat for transient fisheries and
decapods. Wetlands 23, 449–458.
Silva–Rocha, I., Salvi, D., and Carretero, M.A. (2012). Genetic data reveal multiple origin for
the populations of the Italian wall lizard Podarcis sicula (Squamata:Lacertidae)
introduced in the Iberian Peninsula and Balearic islands. Italian Journal of Zoology
iFirst, 1–9.
Silva, I.C., Mesquita, N., and Paula, J. (2010). 1Genetic and morphological differentiation of the
mangrove crab Perisesarma guttatum (Brachyura: Sesarmidae) along an East African
latitudinal gradient. Biological Journal of the Linnean Society 99, 28–46.
Sivasundar, A., and Palumbi, S.R. (2010). Life history, ecology and the biogeography of strong
genetic breaks among 15 species of Pacific rockfish, Sebastes. Marine biology 157,
1433–1452.
Spalding, M.D., Fox, H.E., Allen, G.R., Davidson, N., Ferdaña, Z.A., Finlayson,M., Halpern,
B.S., Jorge, M.A., Lombana, A., Lourie, S.A., Martin, K.D., McManus, E., Molnar, J.,
Recchia, C.A., and Robertson, J. (2007). Marine ecoregions of the world: a
bioregionalization of coastal and shelf areas. BioScience 57, 573–583.
Stellenbosch University http://scholar.sun.ac.za
66
Sponer, R., and Roy, M.S. (2002). Phylogeographic analysis of the brooding brittle star
Amphipholis squamata (Echinodermata) along the coast of New Zealand reveals high
cryptic genetic variation and cryptic dispersal potential. Evolution 56, 1954–1967.
Sunnucks, P. (2000). Efficient genetic markers for population biology. TREE 15.
Tamura, K., Peterson, D., Peterson, N., Stecher, G., Nei, M., and Kumar, S. (2011). MEGA5: Molecular
Evolutionary Genetics Analysis using Maximum Likelihood, Evolutionary Distance, and
Maximum Parsimony Methods. Molecular Biology and Evolution 28, 2731–2739.
Templeton, A.R., Crandall, K.A., and Sing, C.F. (1992). A Cladistic Analysis of Phenotypic
Associations With Haplotypes Inferred From Restriction Endonuclease Mapping and
DNA Sequence Data. 111. Cladogram Estimation. Genetics 132, 619–633.
Teske, P.R., Hamilton, H., Matthee, C.A., and Barker, N.P. (2007). Signatures of seaway
closures and founder dispersal in the phylogeny of a circumglobally distributed seahorse
lineage. BMC Evolutionary Biology 7, 138.
Thomas, J.A., Welch, J.J., Lanfear, R. and Bromham, L. (2010). A generation time effect on the
rate of molecular evolution in invertebrates. Molecular Biology and Evolution 27, 1173–
1180.
Thompson, J. D., Higgins, D. G., and Gibson, T. J. (1994). CLUSTALW: improving the
sensitivity of progressive multiple sequence alignment through sequence weighting,
position–specific gap penalties and weight matrix choice. Nucleic Acids Research 22,
4673–4680.
Stellenbosch University http://scholar.sun.ac.za
67
Turpie, J. K. and Lamberth, S. J. (2010). Characteristics and value of the Thukela Banks
crustacean and linefish fisheries, and the potential impacts of changes in river flow.
African Journal of Marine Science 323, 613–624.
Valles–Jimenez, R., Cruz, P., and Perez–Enriquez, R. (2005).Population Genetic Structure of
Pacific White Shrimp (Litopenaeus vannamei) from Mexico to Panama: Microsatellite
DNA Variation. Marine Biotechnology 6, 475–484.
Vance, D.J., and R. C. Pendrey, R.C. (2008). Vertical migration of postlarval penaeid prawns in
two Australian estuaries: the effect of tide and day/night. Marine and Freshwater
Research 59, 671–683.
van der Elst, R.P., Groeneveld, J.C., Baloi, A.P., Marsac, F., Katonda, K.I., Ruwa, R.K., and
Lane, W.L. (2009). Nine nations, one ocean: A benchmark appraisal of the South West
Indian Ocean Fisheries Project (2008–2012). Ocean and Coastal Management 52, 258–
267.
Van Oosterhout, C., Hutchinson, W.F., Wills, D.P.M., and Shipley, P. (2004). MICRO–
CHECKER: software for identifying and correcting genotyping errors in microsatellite
data. Molecular Ecology Notes 4, 535–538.
Visram, S., Yang, M.C., Pillay, R.M., Said, S., Henriksson, O.,Grahn, M., and Chen, C.A.
(2010). Genetic connectivity and historical demography of the blue barred parrotfish
(Scarus ghobban) in the western Indian Ocean. Marine Biology 157,1475– 1487.
Voloch, C.M., Freire, P.R., and Russo, C.A.M. (2005). Molecular phylogeny of penaeid shrimps
inferred from two mitochondrial markers. Genetics and Molecular Research 4, 668–674
Stellenbosch University http://scholar.sun.ac.za
68
Von der Heyden, S., Bowie, R.C.K., Prochazka, K., Bloomers, P., crane, N.L., and Bernard, G.
(2011). Phylogeographic patterns and cryptic speciation across oceanographic barriers in
South African intertidal fishes. Journal of Evolutionary Biology 24, 2505–2519.
Yano, I., Kanna, R.A., Oyama, R. N., and Wyban, J. A. (1988). Mating behaviour in the penaeid
shrimp Penaeus vannamei. Marine Biology 97, 171–175.
You, E.M., Chiu, T.S., Liu, K.F, Tassanakajon, A., Klinbunga, S., Triwitayakorn, K., Pena, L.D.,
Li, Y., and Yu, H.T. (2008). Microsatellite and mitochondrial haplotype diversity reveals
population differentiation in the tiger shrimp (Penaeus monodon) in the Indo–Pacific
region. Animal Genetics 39, 267–277.
Wakwabi, E.O., and Jaccarini, V. (1993). The distribution and abundance of planktonic penaeid
larvae in Tudor creek, Mombasa, Kenya. Hydrobiologia 264, 185–192.
Walther, E., Schöfl, G., Mrotzek, G., Haryanti, Sugama, K., and Saluz, H.P. (2011). Paralogous
mitochondrial control region in the giant tiger shrimp, Penaeus monodon (F.) affects
population genetics inference: A cautionary tale. Molecular Phylogenetics and
Evolution 58, 404–408.
Waples, R.S., and Gaggiotti, O. (2006). What is a population? An empirical evaluation of some
genetic methods for identifying the number of gene pools and their degree of
connectivity. Molecular Ecology 15, 1419–1439.
Waqairatu, S.S., Dierens, L., Cowley, J.A., Dixon, T.J., Johnson, K.N., Barnes, A.C., and Li, Y.
(2012). Genetic analysis of Black Tiger shrimp (Penaeus monodon) across its natural
distribution range reveals more recent colonization of Fiji and other South Pacific islands.
Ecology and Evolution 2, 2057–2071.
Stellenbosch University http://scholar.sun.ac.za
69
Weersing, K.. and Toonen, R. J. (2009). Population genetics, larval dispersal, and connectivity in
marine systems. Marine Ecology Progres Series 393, 1–12.
White, D.J., Wolff, J.N., Pierson, M., and Gemmell, N.J. (2008). Revealing the hidden
complexities of mtDNA inheritance. Molecular Ecology 17, 4925–4942.
Williams, S.T., and Benzie, J.A.H. (1998). Evidence of a biogeographic break between
populations of a high dispersal starfish: congruent regions within the Indo–West Pacific
defined by color morphs, mtDNA, and allozyme data. Evolution 52, 87–99.
Wright, S. (1931). Evolution in Mendelian populations. Genetics 16, 97–159.
Wright, S. (1943). Isolation by distance. Genetics 28, 114–138.
Wright, S. (1951). The genetical structure of populations. Ann.Eugen 15, 323–354.
Stellenbosch University http://scholar.sun.ac.za
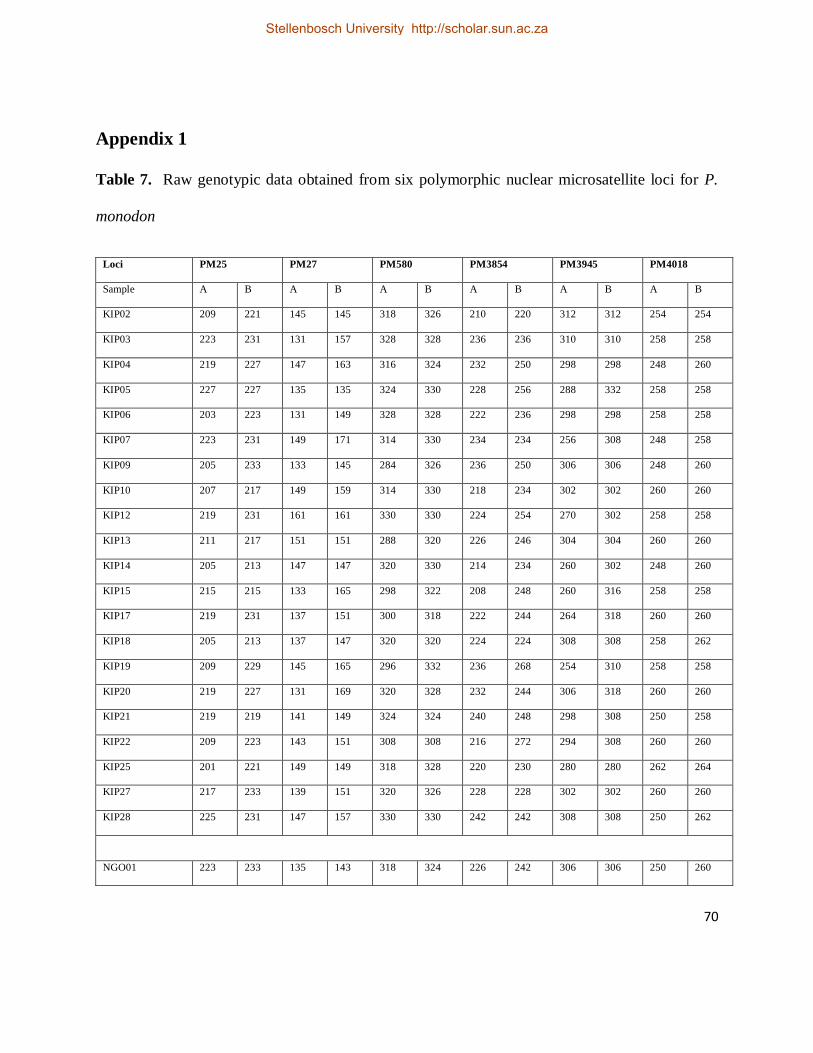
70
Appendix 1
Table 7. Raw genotypic data obtained from six polymorphic nuclear microsatellite loci for P.
monodon
Loci PM25 PM27 PM580 PM3854 PM3945 PM4018
Sample A B A B A B A B A B A B
KIP02 209 221 145 145 318 326 210 220 312 312 254 254
KIP03 223 231 131 157 328 328 236 236 310 310 258 258
KIP04 219 227 147 163 316 324 232 250 298 298 248 260
KIP05 227 227 135 135 324 330 228 256 288 332 258 258
KIP06 203 223 131 149 328 328 222 236 298 298 258 258
KIP07 223 231 149 171 314 330 234 234 256 308 248 258
KIP09 205 233 133 145 284 326 236 250 306 306 248 260
KIP10 207 217 149 159 314 330 218 234 302 302 260 260
KIP12 219 231 161 161 330 330 224 254 270 302 258 258
KIP13 211 217 151 151 288 320 226 246 304 304 260 260
KIP14 205 213 147 147 320 330 214 234 260 302 248 260
KIP15 215 215 133 165 298 322 208 248 260 316 258 258
KIP17 219 231 137 151 300 318 222 244 264 318 260 260
KIP18 205 213 137 147 320 320 224 224 308 308 258 262
KIP19 209 229 145 165 296 332 236 268 254 310 258 258
KIP20 219 227 131 169 320 328 232 244 306 318 260 260
KIP21 219 219 141 149 324 324 240 248 298 308 250 258
KIP22 209 223 143 151 308 308 216 272 294 308 260 260
KIP25 201 221 149 149 318 328 220 230 280 280 262 264
KIP27 217 233 139 151 320 326 228 228 302 302 260 260
KIP28 225 231 147 157 330 330 242 242 308 308 250 262
NGO01 223 233 135 143 318 324 226 242 306 306 250 260
Stellenbosch University http://scholar.sun.ac.za
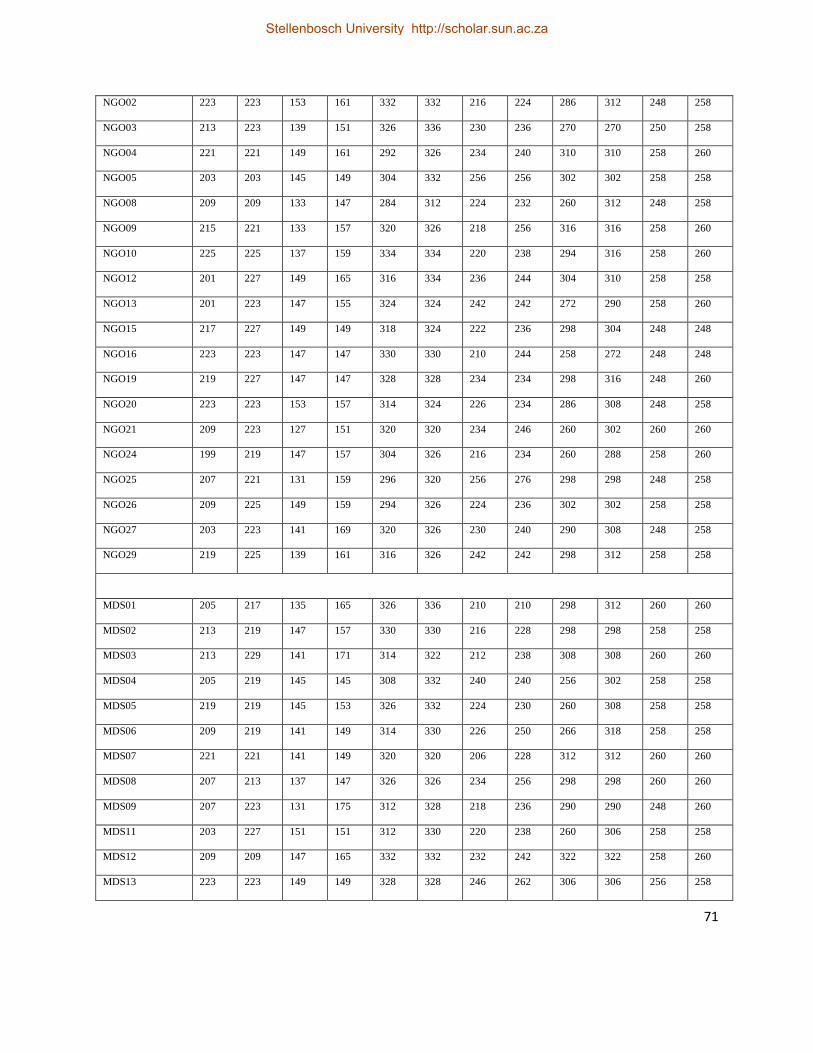
71
NGO02 223 223 153 161 332 332 216 224 286 312 248 258
NGO03 213 223 139 151 326 336 230 236 270 270 250 258
NGO04 221 221 149 161 292 326 234 240 310 310 258 260
NGO05 203 203 145 149 304 332 256 256 302 302 258 258
NGO08 209 209 133 147 284 312 224 232 260 312 248 258
NGO09 215 221 133 157 320 326 218 256 316 316 258 260
NGO10 225 225 137 159 334 334 220 238 294 316 258 260
NGO12 201 227 149 165 316 334 236 244 304 310 258 258
NGO13 201 223 147 155 324 324 242 242 272 290 258 260
NGO15 217 227 149 149 318 324 222 236 298 304 248 248
NGO16 223 223 147 147 330 330 210 244 258 272 248 248
NGO19 219 227 147 147 328 328 234 234 298 316 248 260
NGO20 223 223 153 157 314 324 226 234 286 308 248 258
NGO21 209 223 127 151 320 320 234 246 260 302 260 260
NGO24 199 219 147 157 304 326 216 234 260 288 258 260
NGO25 207 221 131 159 296 320 256 276 298 298 248 258
NGO26 209 225 149 159 294 326 224 236 302 302 258 258
NGO27 203 223 141 169 320 326 230 240 290 308 248 258
NGO29 219 225 139 161 316 326 242 242 298 312 258 258
MDS01 205 217 135 165 326 336 210 210 298 312 260 260
MDS02 213 219 147 157 330 330 216 228 298 298 258 258
MDS03 213 229 141 171 314 322 212 238 308 308 260 260
MDS04 205 219 145 145 308 332 240 240 256 302 258 258
MDS05 219 219 145 153 326 332 224 230 260 308 258 258
MDS06 209 219 141 149 314 330 226 250 266 318 258 258
MDS07 221 221 141 149 320 320 206 228 312 312 260 260
MDS08 207 213 137 147 326 326 234 256 298 298 260 260
MDS09 207 223 131 175 312 328 218 236 290 290 248 260
MDS11 203 227 151 151 312 330 220 238 260 306 258 258
MDS12 209 209 147 165 332 332 232 242 322 322 258 260
MDS13 223 223 149 149 328 328 246 262 306 306 256 258
Stellenbosch University http://scholar.sun.ac.za
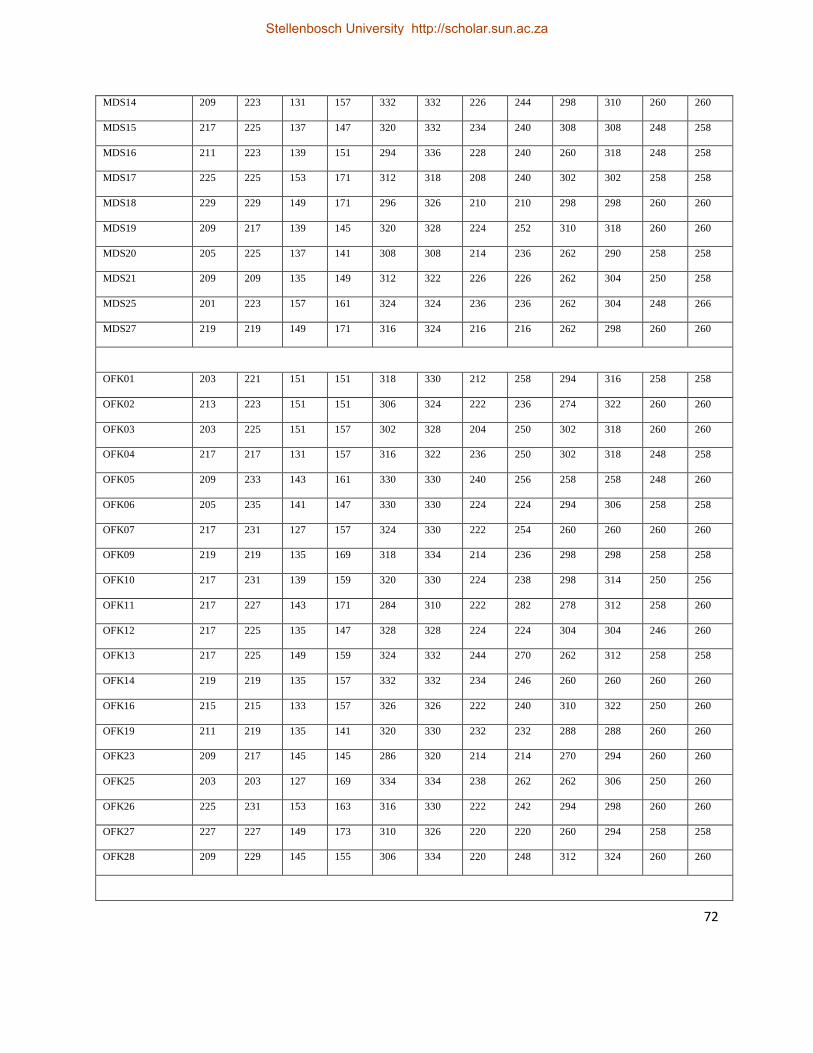
72
MDS14 209 223 131 157 332 332 226 244 298 310 260 260
MDS15 217 225 137 147 320 332 234 240 308 308 248 258
MDS16 211 223 139 151 294 336 228 240 260 318 248 258
MDS17 225 225 153 171 312 318 208 240 302 302 258 258
MDS18 229 229 149 171 296 326 210 210 298 298 260 260
MDS19 209 217 139 145 320 328 224 252 310 318 260 260
MDS20 205 225 137 141 308 308 214 236 262 290 258 258
MDS21 209 209 135 149 312 322 226 226 262 304 250 258
MDS25 201 223 157 161 324 324 236 236 262 304 248 266
MDS27 219 219 149 171 316 324 216 216 262 298 260 260
OFK01 203 221 151 151 318 330 212 258 294 316 258 258
OFK02 213 223 151 151 306 324 222 236 274 322 260 260
OFK03 203 225 151 157 302 328 204 250 302 318 260 260
OFK04 217 217 131 157 316 322 236 250 302 318 248 258
OFK05 209 233 143 161 330 330 240 256 258 258 248 260
OFK06 205 235 141 147 330 330 224 224 294 306 258 258
OFK07 217 231 127 157 324 330 222 254 260 260 260 260
OFK09 219 219 135 169 318 334 214 236 298 298 258 258
OFK10 217 231 139 159 320 330 224 238 298 314 250 256
OFK11 217 227 143 171 284 310 222 282 278 312 258 260
OFK12 217 225 135 147 328 328 224 224 304 304 246 260
OFK13 217 225 149 159 324 332 244 270 262 312 258 258
OFK14 219 219 135 157 332 332 234 246 260 260 260 260
OFK16 215 215 133 157 326 326 222 240 310 322 250 260
OFK19 211 219 135 141 320 330 232 232 288 288 260 260
OFK23 209 217 145 145 286 320 214 214 270 294 260 260
OFK25 203 203 127 169 334 334 238 262 262 306 250 260
OFK26 225 231 153 163 316 330 222 242 294 298 260 260
OFK27 227 227 149 173 310 326 220 220 260 294 258 258
OFK28 209 229 145 155 306 334 220 248 312 324 260 260
Stellenbosch University http://scholar.sun.ac.za
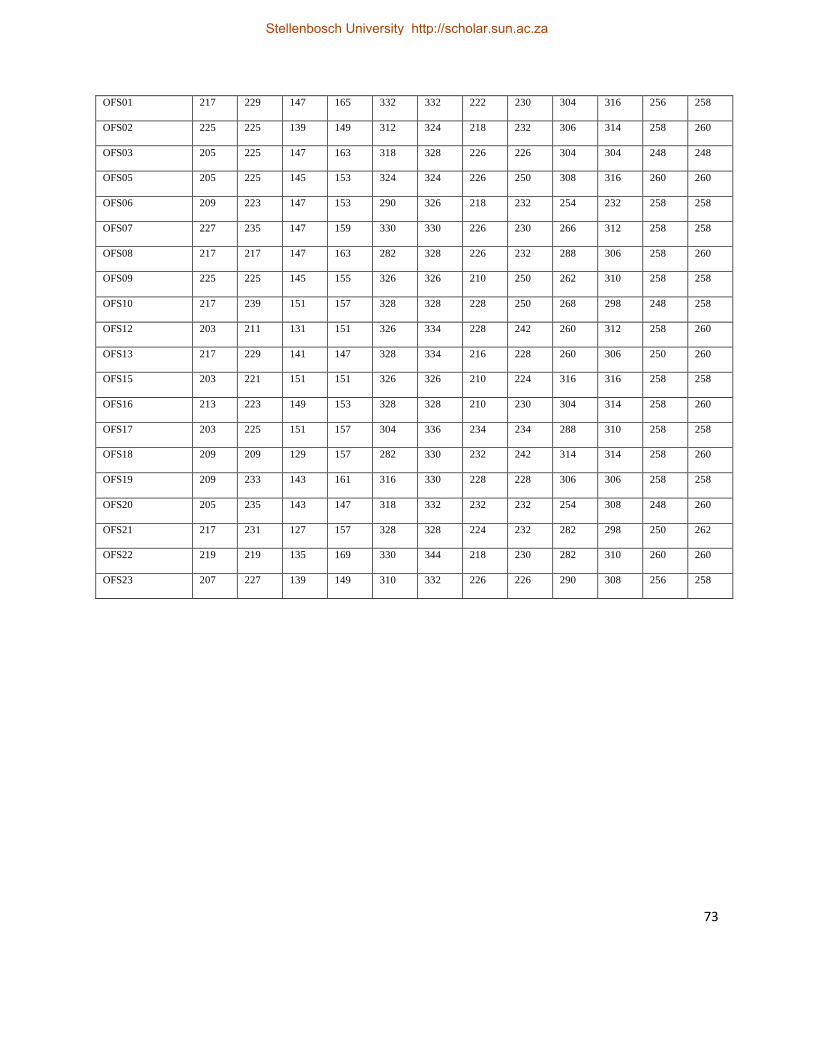
73
OFS01 217 229 147 165 332 332 222 230 304 316 256 258
OFS02 225 225 139 149 312 324 218 232 306 314 258 260
OFS03 205 225 147 163 318 328 226 226 304 304 248 248
OFS05 205 225 145 153 324 324 226 250 308 316 260 260
OFS06 209 223 147 153 290 326 218 232 254 232 258 258
OFS07 227 235 147 159 330 330 226 230 266 312 258 258
OFS08 217 217 147 163 282 328 226 232 288 306 258 260
OFS09 225 225 145 155 326 326 210 250 262 310 258 258
OFS10 217 239 151 157 328 328 228 250 268 298 248 258
OFS12 203 211 131 151 326 334 228 242 260 312 258 260
OFS13 217 229 141 147 328 334 216 228 260 306 250 260
OFS15 203 221 151 151 326 326 210 224 316 316 258 258
OFS16 213 223 149 153 328 328 210 230 304 314 258 260
OFS17 203 225 151 157 304 336 234 234 288 310 258 258
OFS18 209 209 129 157 282 330 232 242 314 314 258 260
OFS19 209 233 143 161 316 330 228 228 306 306 258 258
OFS20 205 235 143 147 318 332 232 232 254 308 248 260
OFS21 217 231 127 157 328 328 224 232 282 298 250 262
OFS22 219 219 135 169 330 344 218 230 282 310 260 260
OFS23 207 227 139 149 310 332 226 226 290 308 256 258
Stellenbosch University http://scholar.sun.ac.za
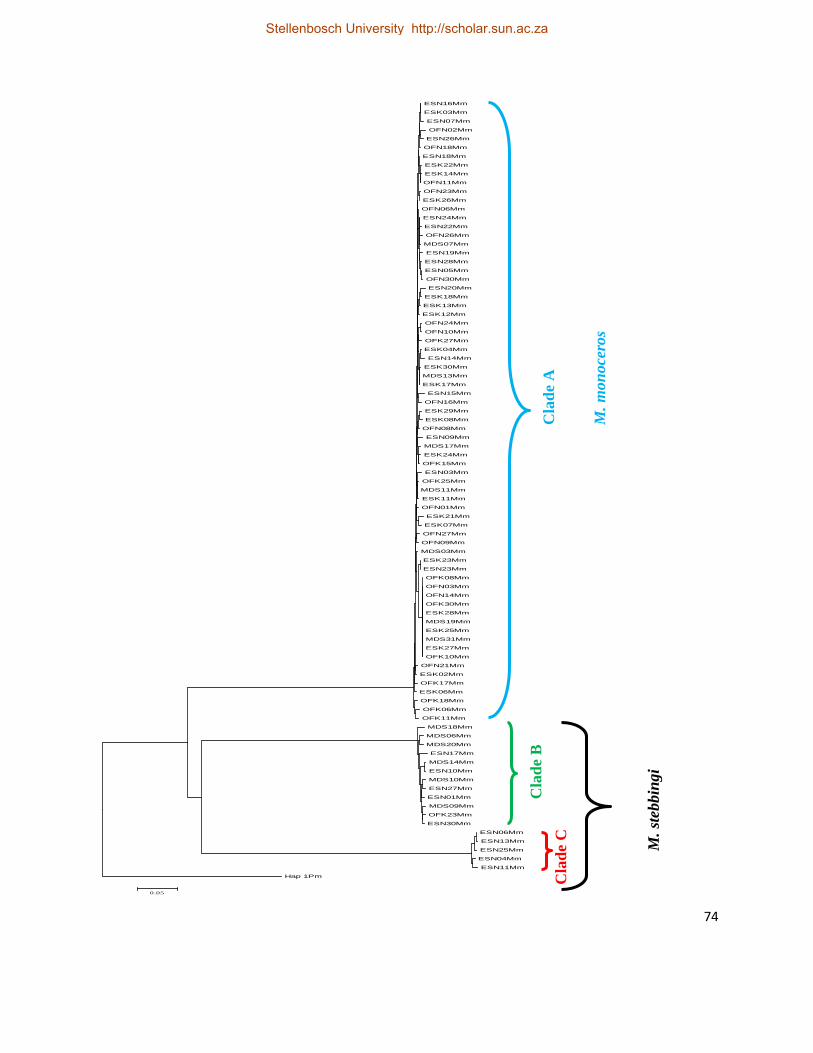
74
ESN16Mm
ESK03Mm
ESN07Mm
OFN02Mm
ESN26Mm
OFN18Mm
ESN18Mm
ESK22Mm
ESK14Mm
OFN11Mm
OFN23Mm
ESK26Mm
OFN06Mm
ESN24Mm
ESN22Mm
OFN26Mm
MDS07Mm
ESN19Mm
ESN28Mm
ESN05Mm
OFN30Mm
ESN20Mm
ESK18Mm
ESK13Mm
ESK12Mm
OFN24Mm
OFN10Mm
OFK27Mm
ESK04Mm
ESN14Mm
ESK30Mm
MDS13Mm
ESK17Mm
ESN15Mm
OFN16Mm
ESK29Mm
ESK08Mm
OFN08Mm
ESN09Mm
MDS17Mm
ESK24Mm
OFK15Mm
ESN03Mm
OFK25Mm
MDS11Mm
ESK11Mm
OFN01Mm
ESK21Mm
ESK07Mm
OFN27Mm
OFN09Mm
MDS03Mm
ESK23Mm
ESN23Mm
OFK08Mm
OFN03Mm
OFN14Mm
OFK30Mm
ESK28Mm
MDS19Mm
ESK25Mm
MDS31Mm
ESK27Mm
OFK10Mm
OFN21Mm
ESK02Mm
OFK17Mm
ESK06Mm
OFK18Mm
OFK06Mm
OFK11Mm
MDS18Mm
MDS06Mm
MDS20Mm
ESN17Mm
MDS14Mm
ESN10Mm
MDS10Mm
ESN27Mm
ESN01Mm
MDS09Mm
OFK23Mm
ESN30Mm
ESN06Mm
ESN13Mm
ESN25Mm
ESN04Mm
ESN11Mm
Hap 1Pm
0.05
Cla
de
A
M.
mon
oce
ros
Cla
de
B
Cla
de
C
M.
steb
bin
gi
Stellenbosch University http://scholar.sun.ac.za

75
Fig. 6. Neighbour joining tree reconstructed from the mtCR sequences, showing M. monoceros
and M. stebbingi clades, originating from the MUB. The three clades were confirmed using
morphological examinations of sub–adults or adults specimens.
Stellenbosch University http://scholar.sun.ac.za


