

Geobiology 2013 Lecture 6 Biogeochemical Tracers
Isotopics #3: Biosynthetic fractionations and Intramolecular
isotopic data, more of multi-element isotopics and the Precambrian C-Cycle
Acknowledgements: John Hayes, David DesMarais Assigned Reading
• Hayes JM 2001 Fractionation of the isotopes of carbon and hydrogen inbiosynthetic processes. Reviews in Mineralogy Stable IsotopicGeochemistry, John W. Valley and David R. Cole (eds.)
• David J Des Marais 1997. Isotopic evolution of the biogeochemical carboncycle during the Proterozoic Eon Original Research Article, Organic Geochemistry, Volume 27, Issues 5–6, Pages 185-193
1
Revision of carbon isotopic principles
And examining isotopic fractionation at molecular, organismic and planetary
scales
2

3
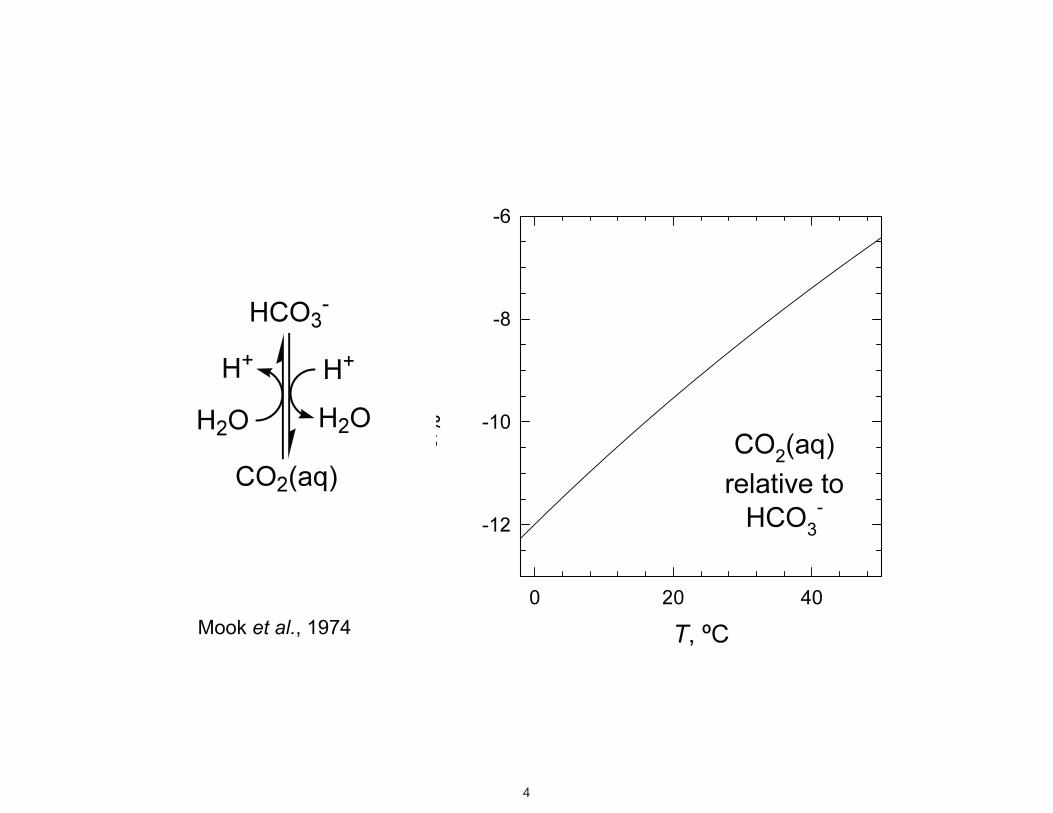
Mook et al., 1974
4
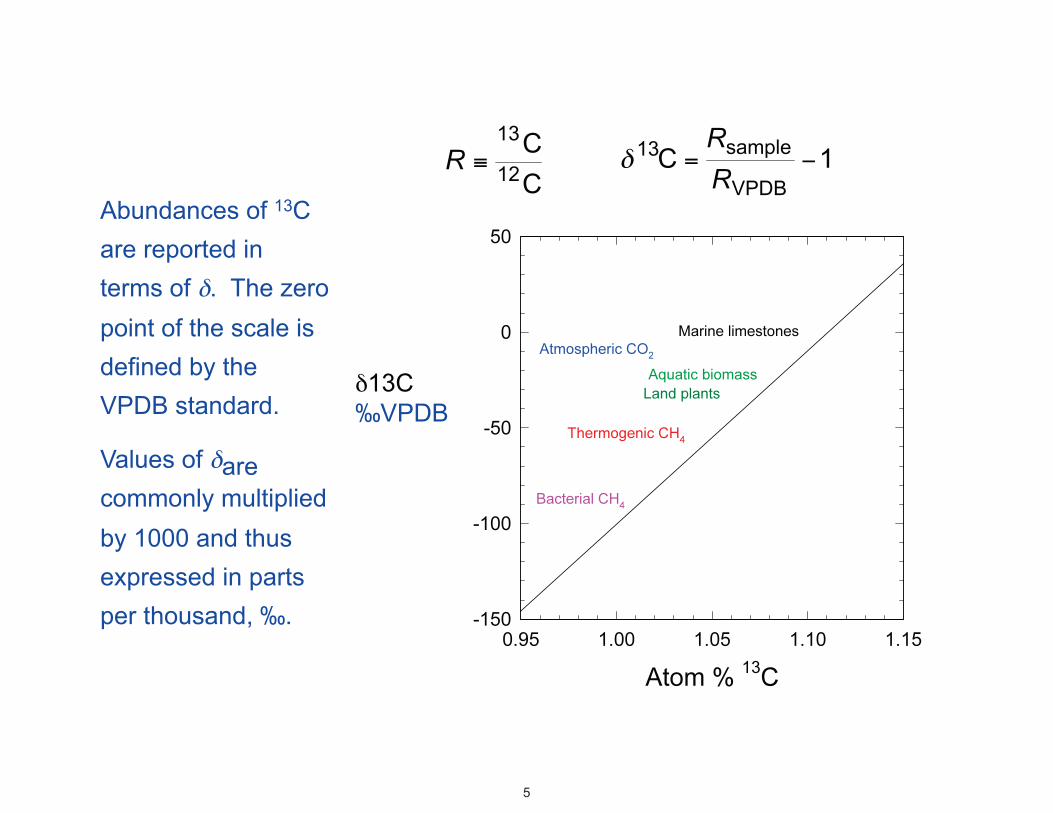
Abundances of 13C are reported in terms of δ. The zero point of the scale is defined by the VPDB standard.
Values of δare commonly multiplied by 1000 and thus expressed in parts per thousand, ‰.
δ13C ‰VPDB
5
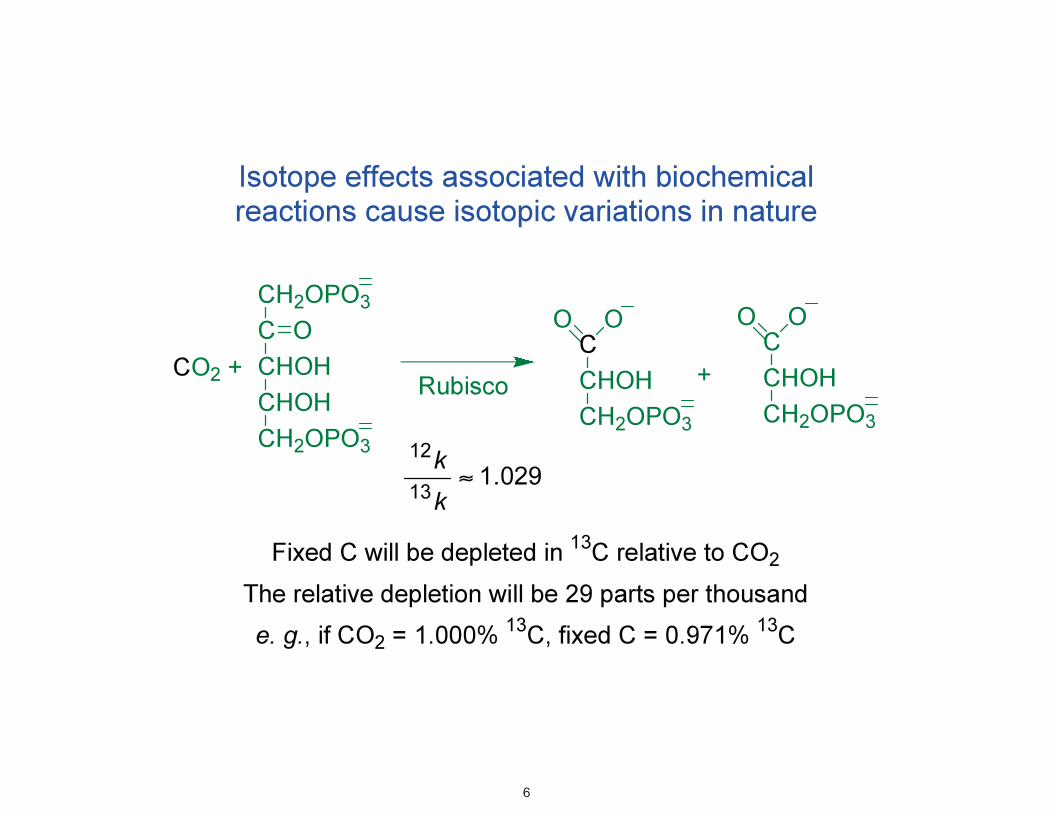
6
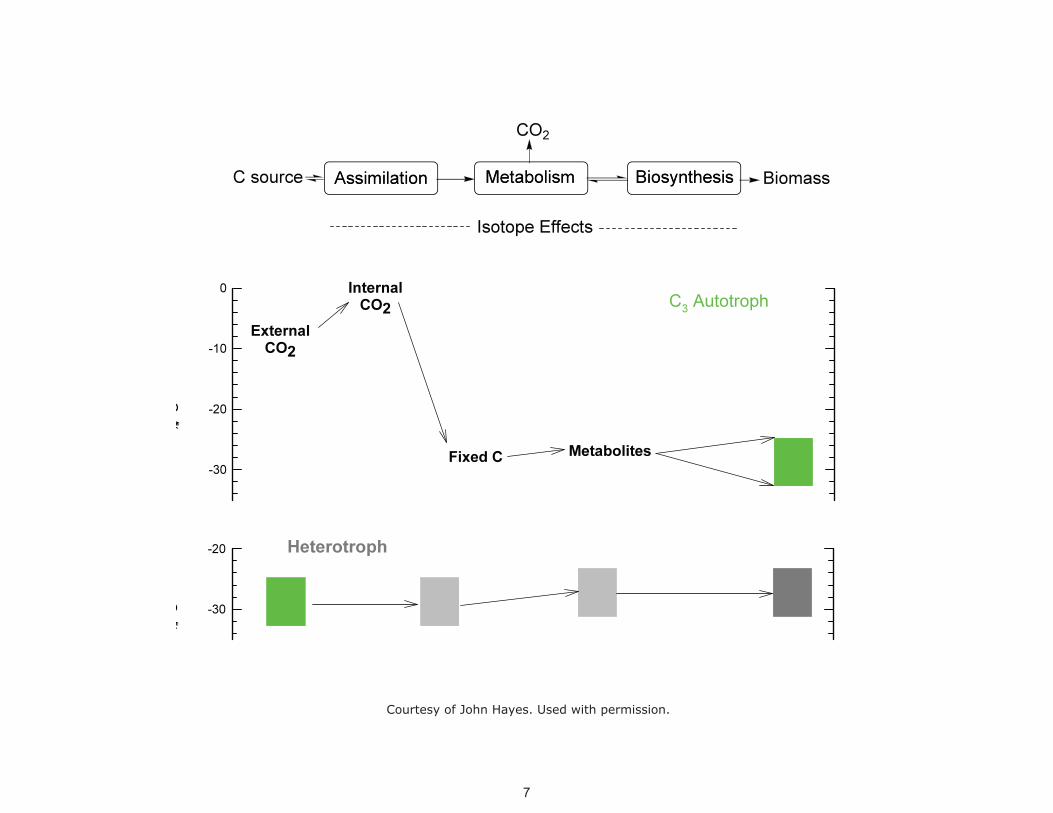
Courtesy of John Hayes. Used with permission.
7

Pathway, enzyme React & substr Product ε ‰ Organisms C3 Rubisco1 Rubisco2 PEP carboxylase PEP carboxykinase
CO2 +RUBP CO2 +RUBP HCO3
-+PEP CO2 +PEP
3-PGA x 2 3-PGA x 2 oxaloacetate oxaloacetate
10-22 30 22 2
plants & algae cyanobacteria plants & algae plants & algae
C4 and CAM PEP carboxylase Rubisco1
HCO3 - +PEP CO2
+RUBP oxaloacetate 3-PGA x 2
2-15 2 30
plants & algae (C4)
Acetyl-CoA CO dehydrog Pyruvate synthase PEP carboxylase PEP carboxykinase
CO2 + 2H+ CoASH CO2 + Ac-CoA HCO3
-+PEP CO2 +PEP
AcSCoA pyruvate oxaloacetate Oxaloacetate
15-36 52
2
bacteria
Reductive or reverse TCA
CO2 + succinyl-CoA (+ others)
α-ketoglutarate
4-13 Bacteria esp green sulfur
3-hydroxypropionate HCO3 - +
acetylCoA Malonyl-CoA Green non-S
Fractionation of C-Isotopes during Autotrophy
8
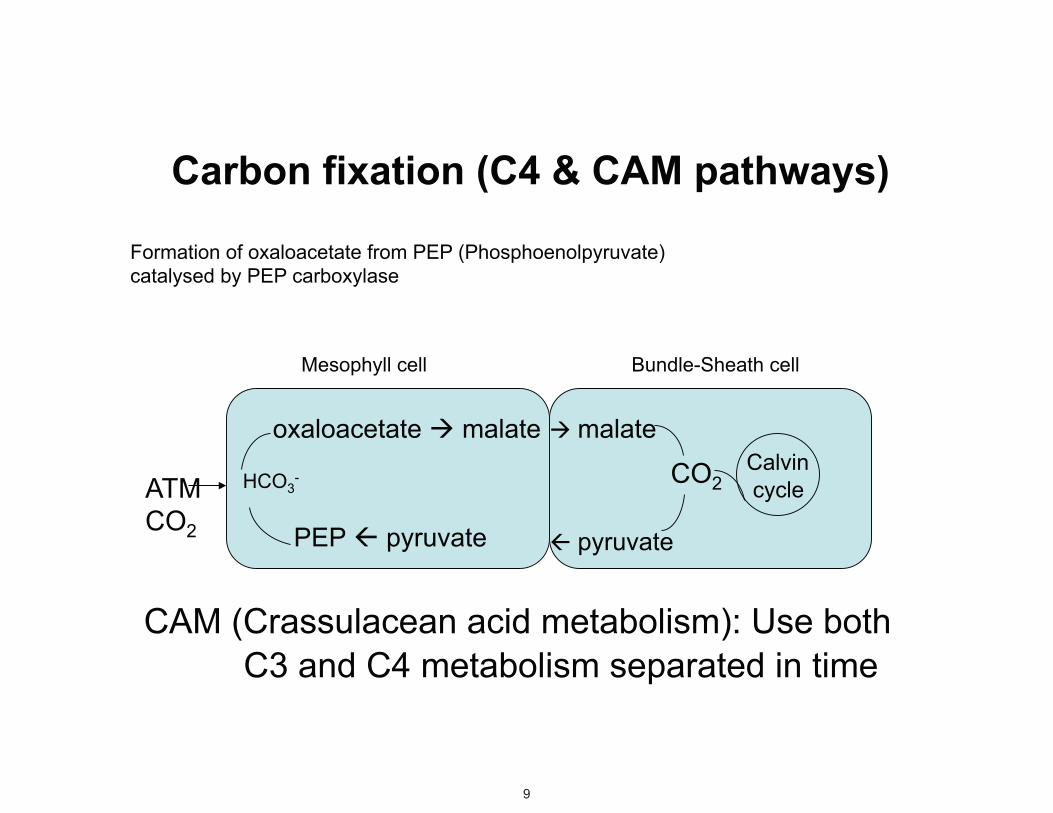
Carbon fixation (C4 & CAM pathways)
Formation of oxaloacetate from PEP (Phosphoenolpyruvate) catalysed by PEP carboxylase
Mesophyll cell Bundle-Sheath cell
ATM CO2
HCO3 -
oxaloacetate � malate
PEP � pyruvate
� malate
� pyruvate
CO2 Calvin cycle
CAM (Crassulacean acid metabolism): Use both C3 and C4 metabolism separated in time
9

Isotopic consequences of different food sources
A. W. Stott, E. Davies, R. P. Evershed, & N. Tuross (1997) Naturwissenschaften 84, 82–86.
10

Trophic Shifts
11
Intramolecular C-isotopic Differences (DeNiro and Epstein, 1977; Monson and Hayes, 1980,
1982; reviewed Hayes, 2001)
Reactions occur between molecules but isotope selectivity is expressed as chemical bonds that are made or broken at particular carbon positions.
Isotope effects pertain to those specific positions and control fractionations only at that reaction site, not throughout the whole molecule.
To calculate changes in the isotopic compositions of whole molecules we must first calculate the change at the site and then allow for the rest of the molecule because the isotopic shift is diluted by mixing with carbon that is just along for the ride………………..Hayes, 2002
12
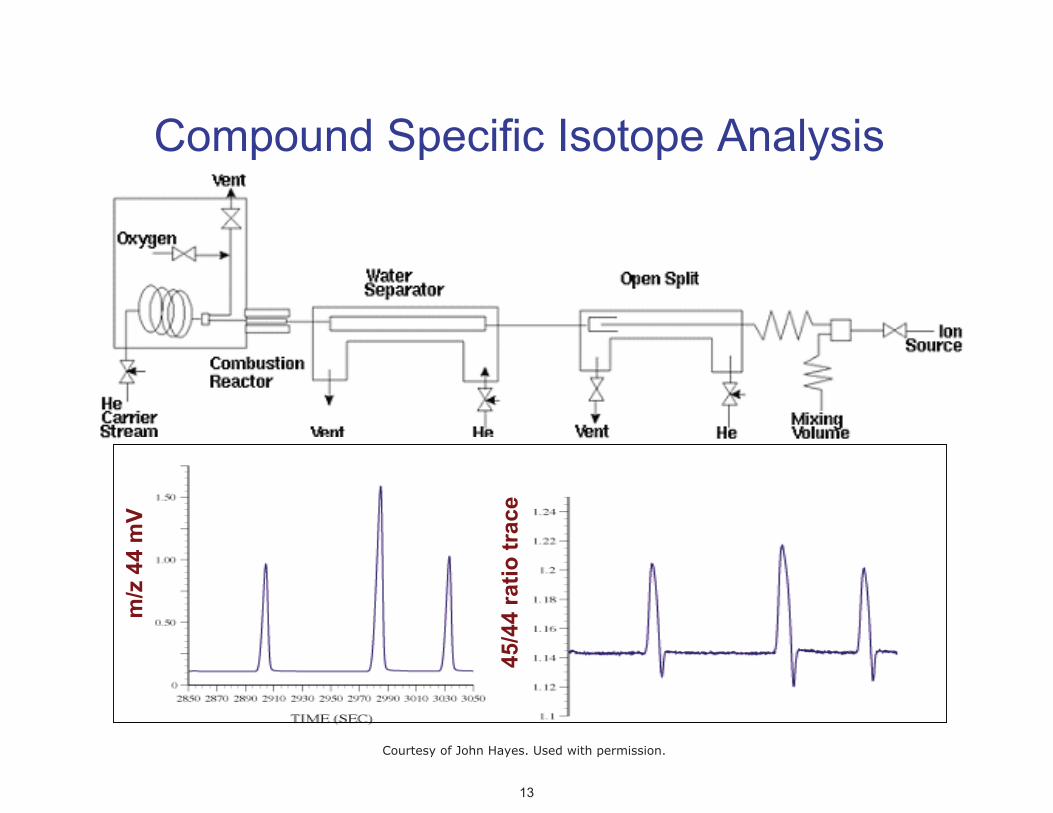
Compound Specific Isotope Analysism
/z 4
4 m
V
45/4
4 ra
tio tr
ace
Courtesy of John Hayes. Used with permission.
13

Reprinted by permission from Macmillan Publishers Ltd. Katherine H. Freeman,J. M. Hayes, et al. Evidence from Carbon Isotope Measurements for DiverseOrigins of Sedimentary Hydrocarbons. Nature 343 (1990): 254-6.
14

C-isotopic Composition of Individual Organic Compounds
Three major controls
• Source of carbon and its C-isotopiccomposition
• Fractionation during assimilation (egheterotrophy, photosynthesis, methanotrophy)
• Fractionation during biosynthesis (lipids)
15

C-isotopic Composition of Organic Compounds
Source of carbon and its C-isotopic composition
– Inorganic carbon • (-7‰ atm. CO2) assimilated by photosynthesis
ε � 5-35 per mil depending on pathway extent of consumption
16
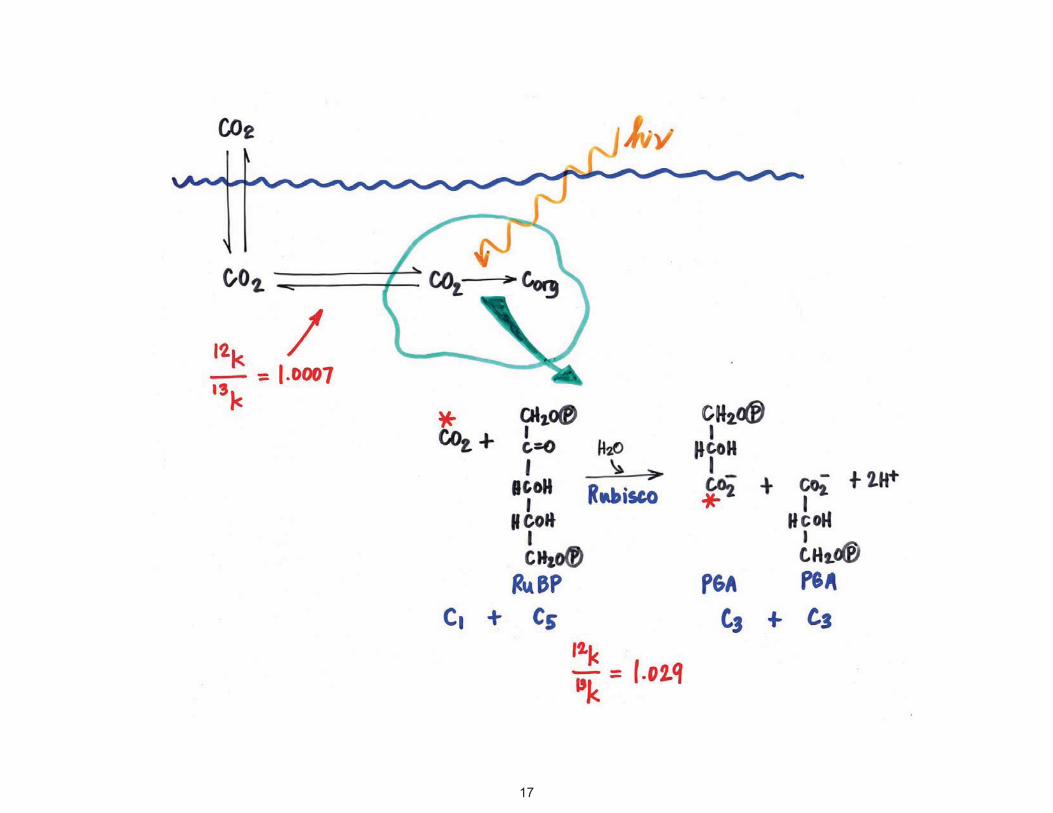
17

C-isotopic Composition of Individual Organic Compounds
Source of carbon and its C-isotopic composition
– Inorganic carbon • (-7‰ atm. CO2) assimilated by photosynthesis
ε � 5-35 per mil depending on pathway extent of consumption
– Organic carbon • (-25‰ on average) assimilated during heterotrophy
�ε � -1 (you are what you eat plus 1 per mil!!)
– Methane carbon • (-30 to -100‰) assimilated during methanotrophy
�ε � 0-30 per mil depending on pathway and extent ofconsumption
18

http://www.astrobio.net/news/modules.php?op=modload&name=News&file=article&sid=34
Image removed due to copyright restrictions. Café Methane
Image removed due to copyright restrictions. Image removed due to copyright restrictions.
Gas hydrates (yellow) are ice with gas trapped At the very edge of the brine pool, the mussels are inside; exposed beds are accessible to especially abundant and happy. This area is often filled submersibles on the deep sea floor of the Gulf of with newly settled baby mussels perched on the shells Mexico. Ice worms, a new species only seen in of larger mussels just above the brine. hydrate, were discovered in 1997 by C. Fisher, Credit: Penn State University, Dept. of Biology Penn State University.
Credit: I. MacDonald
19

Methane-rich water is pumped into the mussel and across its gills. The symbiotic bacteria in the gills use methane as both a carbon and energy source. The mussels, in turn, live off the symbiotic bacteria.
Courtesy of Charles Fisher, Penn State University, Dept. of Biology. Used with permission.
Using the scanning electron microscope, we can see over a dozen mussel gill cells in the panel on the left. On the right is a closer look at the cell with its outer membrane partially removed. Look into the cell to see hundreds of symbiotic bacteria.
20

Table 3 removed due to copyright restrictions.
Using the scanning electron microscope, we can see over a dozen mussel gill cells in the panel on the left. On the right is a closer look at the cell with its outer membrane partially removed. Look into the cell to see hundreds of symbiotic bacteria.
Courtesy of Charles Fisher, Penn State University, Dept. of Biology. Used with permission.
21

Courtesy Elsevier, Inc., http://www.sciencedirect.com. Used with permission.
22

Lanostane (XVIII; δδ13C: -70‰)hop-17-(21)-ene XII; δ13C: -32‰)
Norlanostane (XVII; δ13C: -80‰),
Courtesy Elsevier, Inc., http://www.sciencedirect.com. Used with permission.
23

C-isotopic Composition of Organic Compounds
• Fractionation during biosynthesis (lipids)
24

25
Carbohydratemetabolism
Glucose, C6H12O6
Pyruvate
H3C C
C
CO2
O
-
Alternatefates
CO2
H3C
C2 units for biosynthesisand oxidative metabolism
SCoA
O
Pyruvate dehydrogenase
DeNiro and Epstein, 1977
Kinetic lsotopeEffect
Image by MIT OpenCourseWare.
26

Courtesy of John Hayes. Used with permission.
27

These images have been removed due to copyright restrictions.
Flows of C at the pyruvate branch point in the metabolism of E. coli grown aerobically on glucose (Roberts 1955). 74% of the pyruvate is decarboxylated to yield Ac-CoA. The observed depletion at odd-numbered positions of FAcids is shown at the right indicating that the isotope effect at C-2 in the pyruvate dehydrogenase reaction is 23‰
28
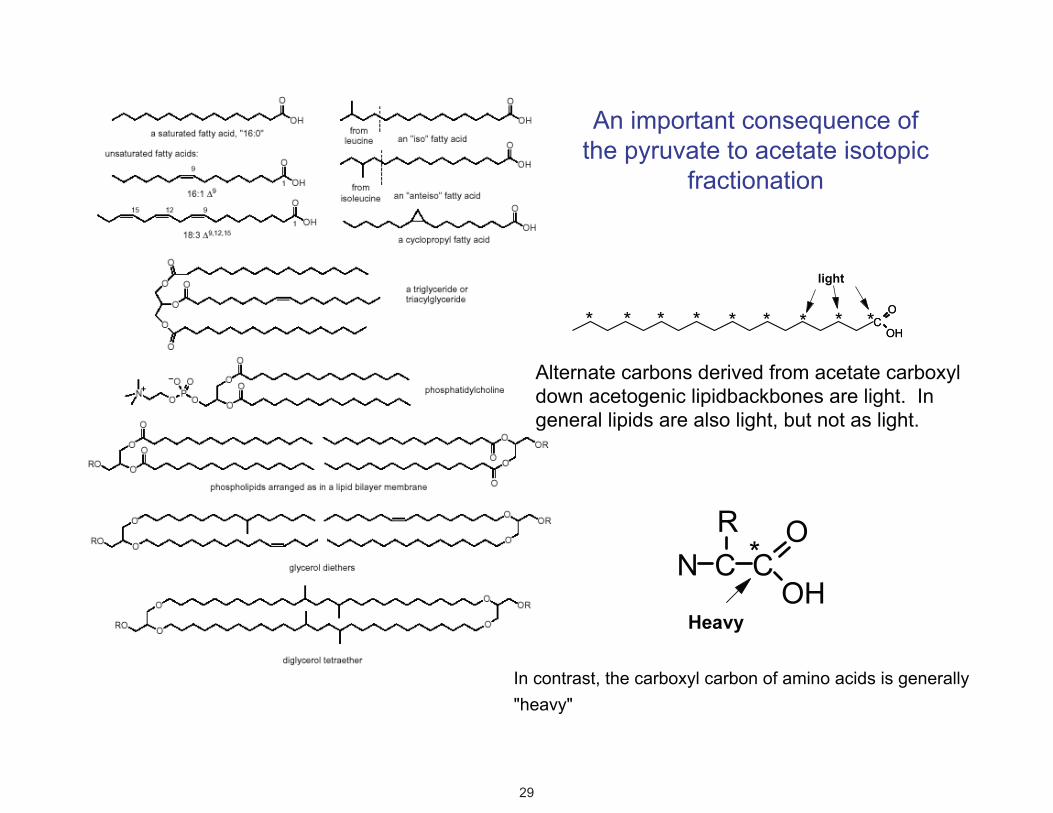
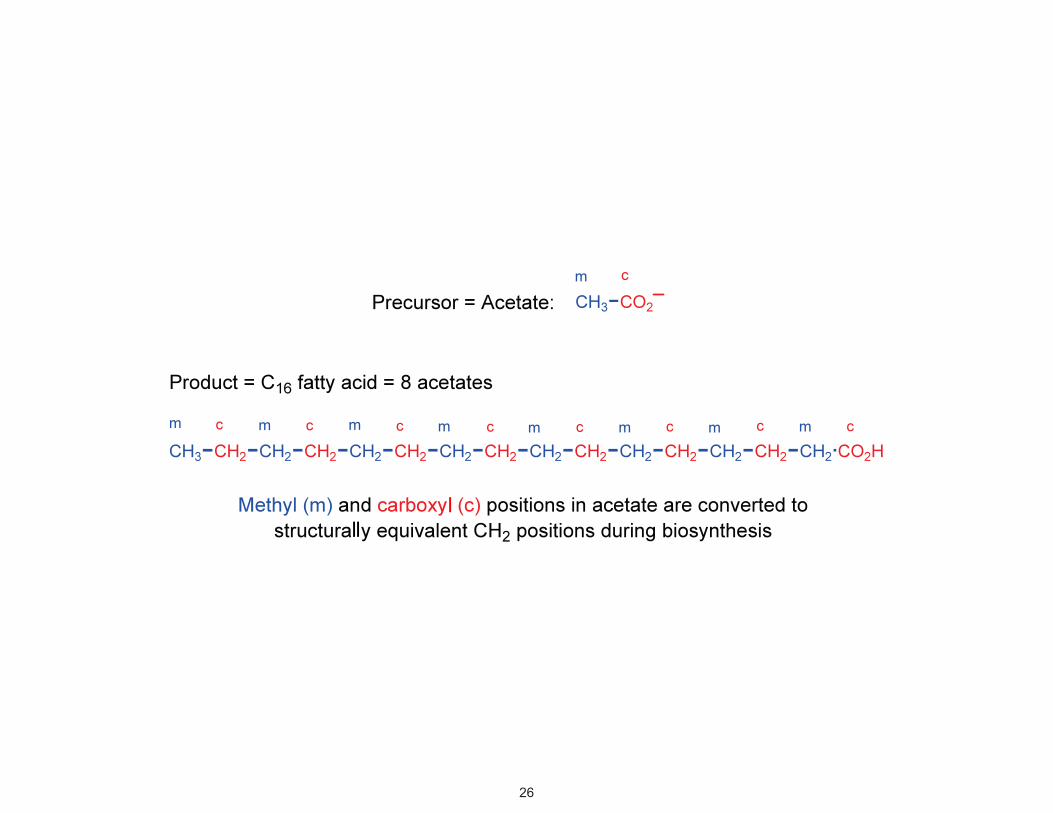
An important consequence of the pyruvate to acetate isotopic
fractionation
Alternate carbons derived from acetate carboxyl down acetogenic lipidbackbones are light. In general lipids are also light, but not as light.
In contrast, the carboxyl carbon of amino acids is generally "heavy"
O
OHC
O
OH C* * * * * * * * *
light
29
{ { { { { { head tail
isoprene
head-to-tail
head-to-tail
OH
OPP
2 x C5 2 x C5
geraniol
tail-to-tail
tail-to-tail
tail-to-tail
C5
C5
C5
head-to-head
head-to-head
isopentenyl pyrophosphate
irregular tail-to-tail
irregular
phytol OHC15 farnesol
C30 squalene
sterols bacteriohopanols C20 highly branched isoprenoid
C20
C20
biphytane archaea
phytoene and carotenoids
pmi methanogenic
archaea
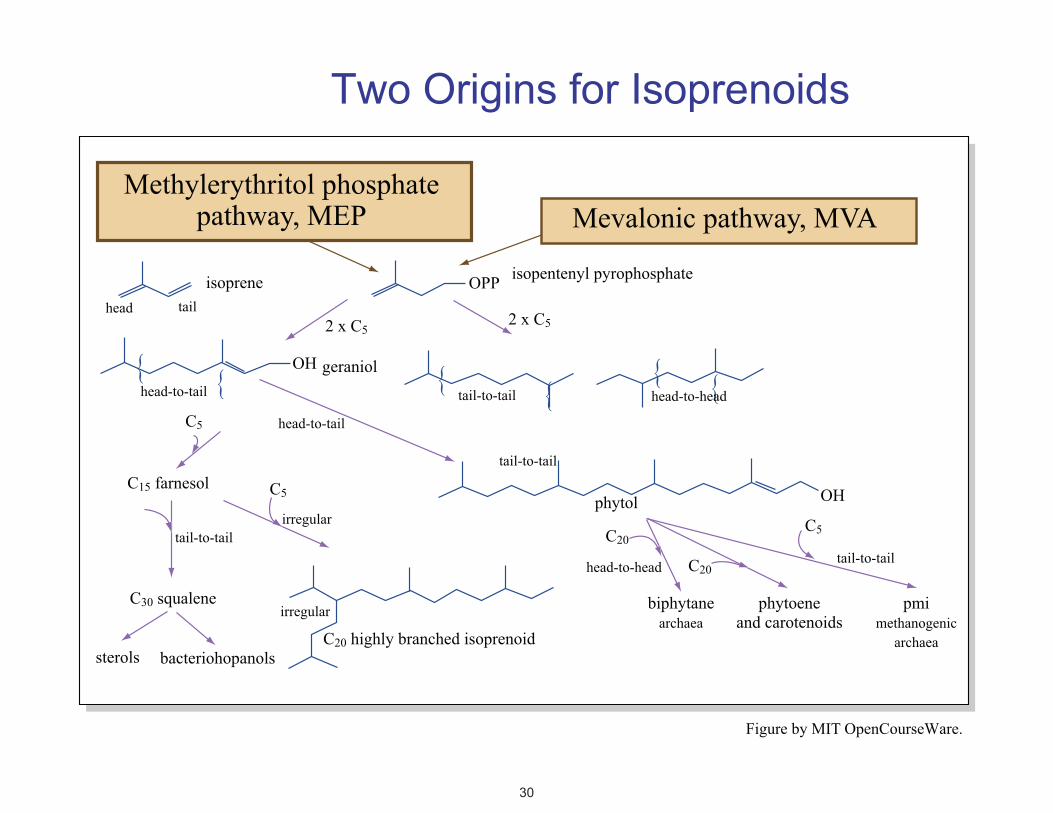
Methylerythritol phosphate pathway, MEP Mevalonic pathway, MVA
Two Origins for Isoprenoids
Figure by MIT OpenCourseWare.
30
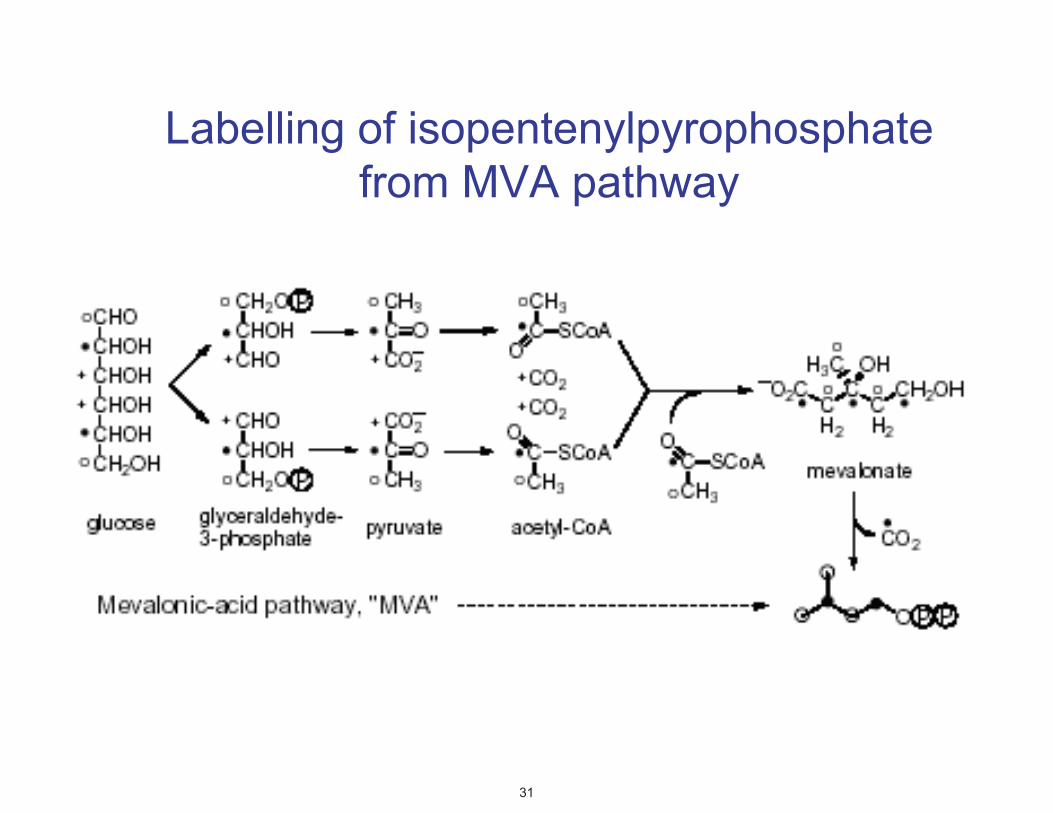
Labelling of isopentenylpyrophosphate from MVA pathway
31

Labelling of isopentenylpyrophosphate from MEP pathway
32
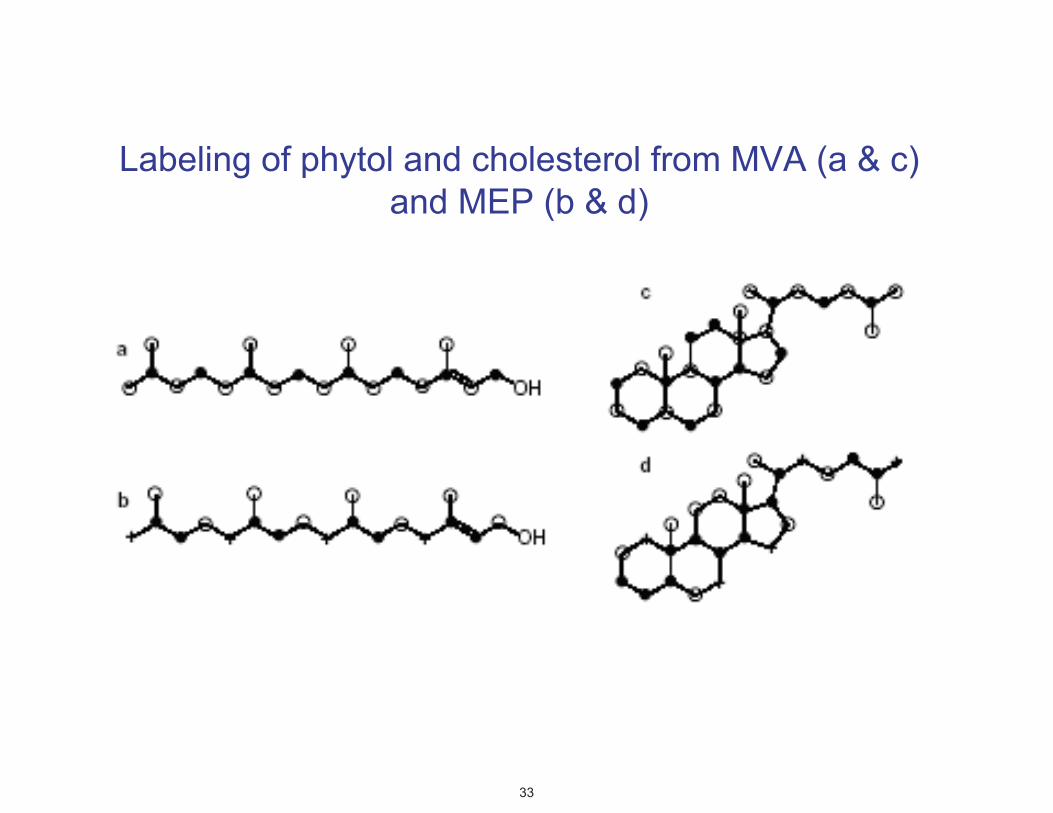
Labeling of phytol and cholesterol from MVA (a & c) and MEP (b & d)
33

34
Lange et al., 2000Boucher and Doolittle, 2000
Rieder et al., 1998
Boucher and Doolittle, 2000
Boucher and Doolittle, 2000
Boucher and Doolittle, 2000
Kohl et al., 1983Disch et al., 1998Lange et al., 2000
Lange et al., 2000
Schwender et al., 2001Lichtenthaler et al., 1997Lichtenthaler 1999
Seto et al., 1996
MEP
MVAMEP
MEP
MEP
MEP
MEP
MVA
MVA
MVA
MVA
MVAPlastid Cytosol
MEP MEPMEP MVAMVA MVA
MEP & MVA
BacteriaProkaryotes
Aquificales, ThermotogalesPhotosynthetic bacteria
ChloroflexusChlorobium
Gram positive eubacteriaCommonlyStreptococcus, StaphylococcusStreptomyces
SpirochaetesBorrelia burgdorferiTreponema pallidum
ProteobacteriaCommonly
Myxococcus, NannocystisCyanobacteria
ArchaeaEukaryotes
Non-plastid-bearingPlastid-bearing
Euglenoids
Chlorophyta
Streptophyta
ReferenceOrganism Pathway
Pathways Used for The Biosynthesis of Isoprenoid Lipids.
-
-
-
-
-
-
---
-
-
-
-
-
-
-
-
Image by MIT OpenCourseWare.
-20 -19 -18 -17 -16 7
8
9
10
11
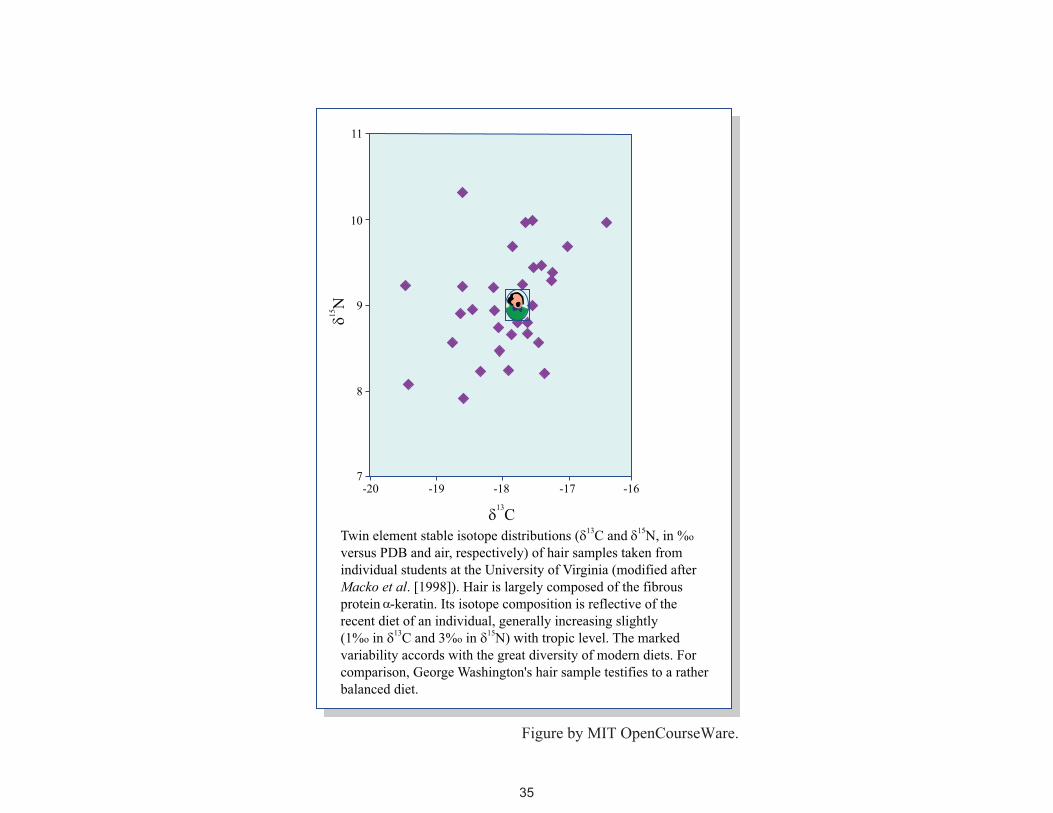
α
Figure by MIT OpenCourseWare.
35
-7 -6 -5 -4 -3 -2 -1 0 1 -40
-35
-30
-25
-20
-15
Synthetic
Biotechnological
Mexico Comores
Tahiti H
H
H
H
O
OH OMe
?
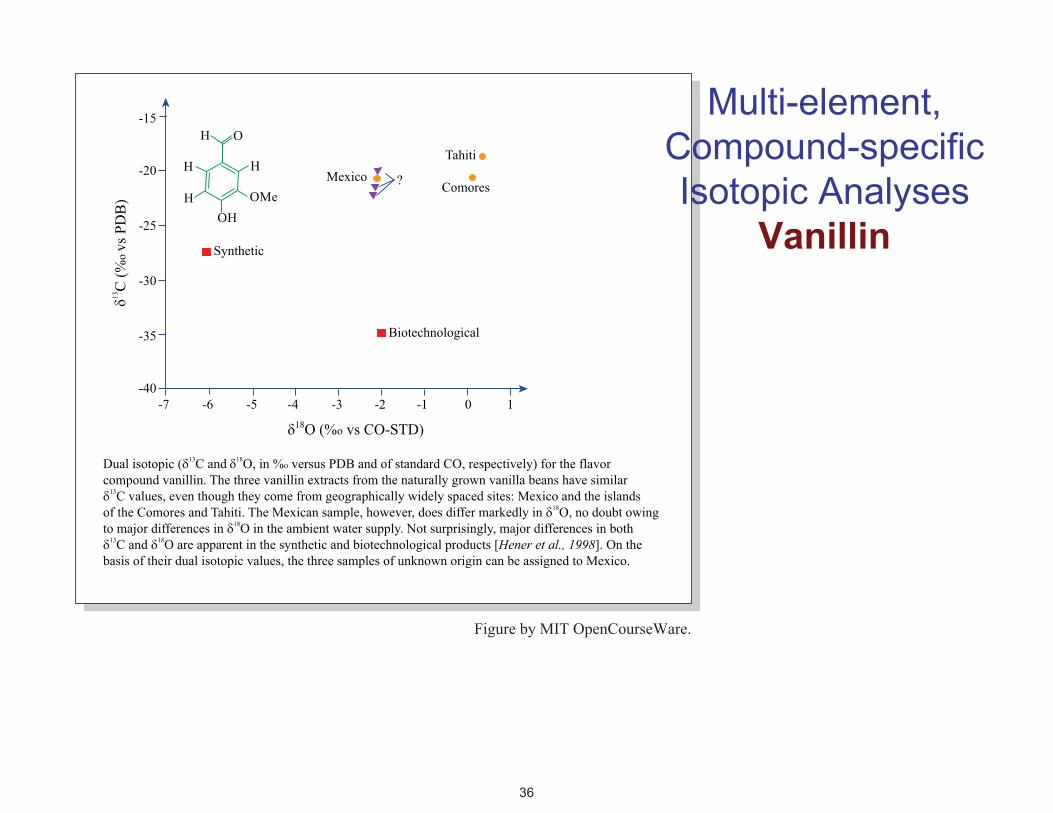
Multi-element, Co mpound-specific Is otopic Analyses
Vanillin
Figure by MIT OpenCourseWare.
36

Characterising Cocaine Sources
These images have been removed due to copyright restrictions.
37

-7 -6 -5 -4 -3 -2 -1 0 1 -40
-35
-30
-25
-20
-15
Synthetic
Biotechnological
Mexico Comores
Tahiti H
H
H
H
O
OH OMe
?
Multi-element, Co mpound-specific Is otopic Analyses
Vanillin
Figure by MIT OpenCourseWare.
38
39
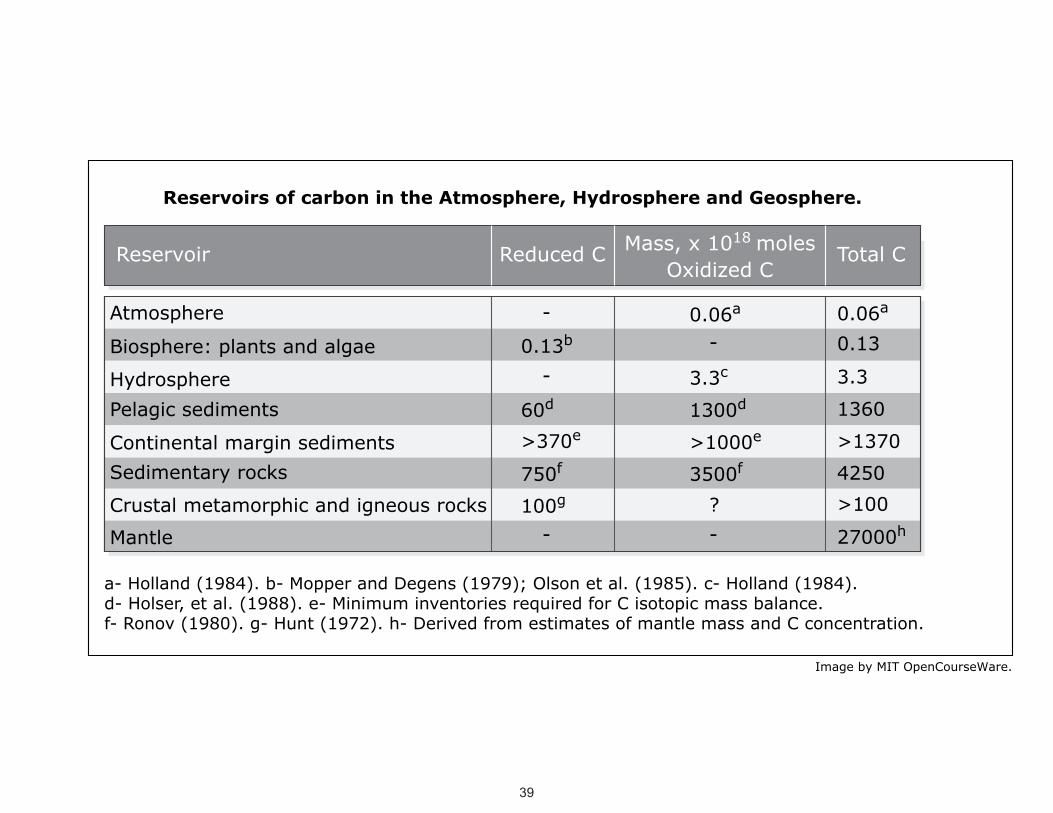
Reservoir Reduced C Mass, x 1018 molesOxidized C
Total C
--
-
-
-
0.13b0.06a 0.06a
0.13
3.3
1360
4250>1370
>100
27000h
3.3c
1300d
>1000e
3500f
?
60d
>370e
750f
100g
Biosphere: plants and algae
Atmosphere
HydrospherePelagic sediments
Continental margin sedimentsSedimentary rocks
Crustal metamorphic and igneous rocks
Mantle
a- Holland (1984). b- Mopper and Degens (1979); Olson et al. (1985). c- Holland (1984).d- Holser, et al. (1988). e- Minimum inventories required for C isotopic mass balance.f- Ronov (1980). g- Hunt (1972). h- Derived from estimates of mantle mass and C concentration.
Reservoirs of carbon in the Atmosphere, Hydrosphere and Geosphere.
Image by MIT OpenCourseWare.
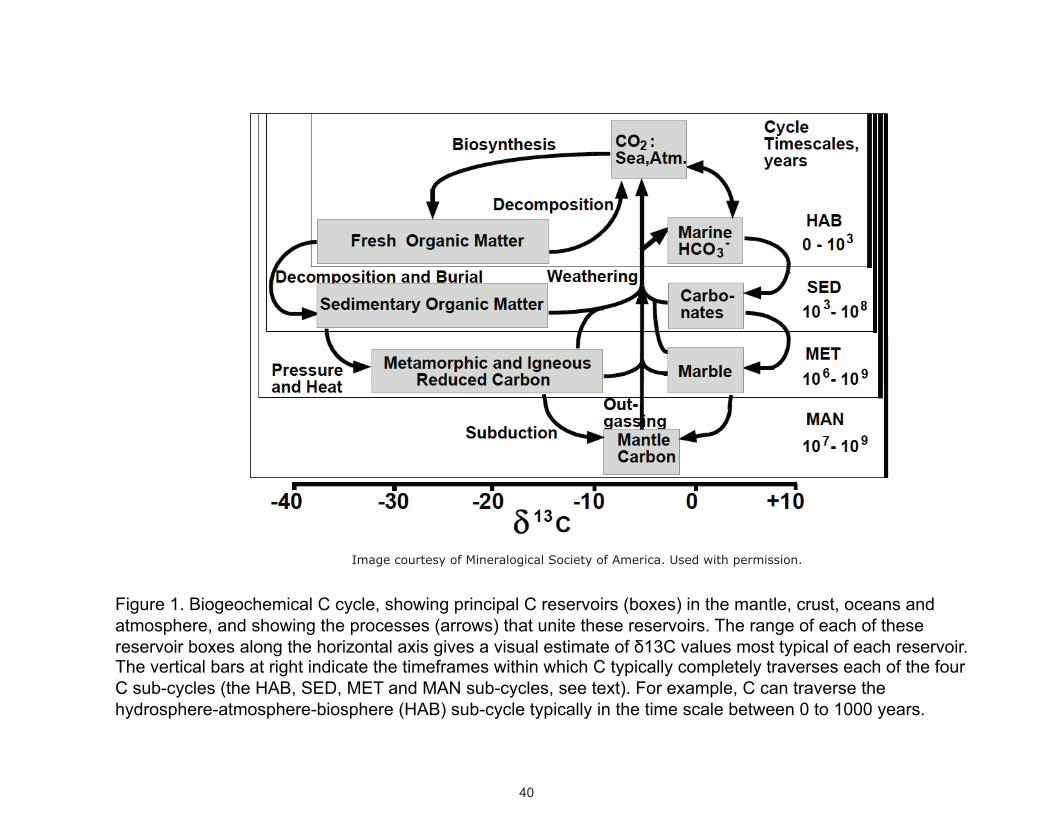
Image courtesy of Mineralogical Society of America. Used with permission.
Figure 1. Biogeochemical C cycle, showing principal C reservoirs (boxes) in the mantle, crust, oceans and atmosphere, and showing the processes (arrows) that unite these reservoirs. The range of each of these reservoir boxes along the horizontal axis gives a visual estimate of δ13C values most typical of each reservoir. The vertical bars at right indicate the timeframes within which C typically completely traverses each of the four C sub-cycles (the HAB, SED, MET and MAN sub-cycles, see text). For example, C can traverse the hydrosphere-atmosphere-biosphere (HAB) sub-cycle typically in the time scale between 0 to 1000 years.
40
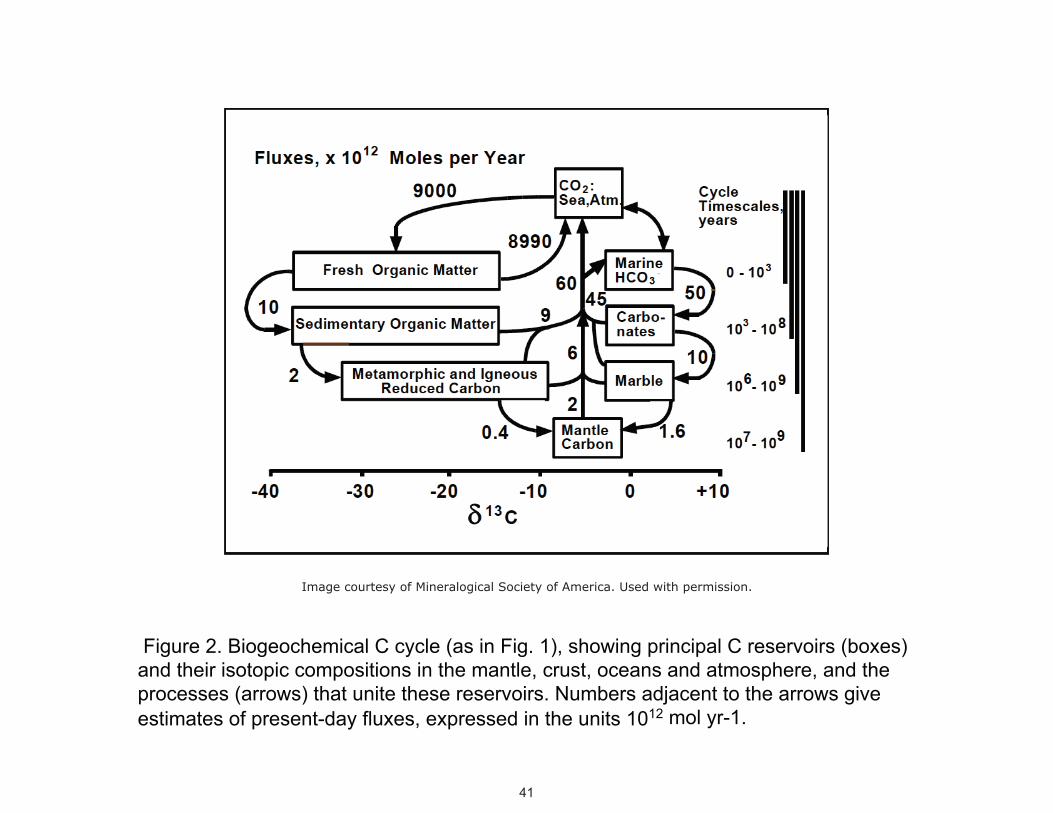
Image courtesy of Mineralogical Society of America. Used with permission.
Figure 2. Biogeochemical C cycle (as in Fig. 1), showing principal C reservoirs (boxes) and their isotopic compositions in the mantle, crust, oceans and atmosphere, and the processes (arrows) that unite these reservoirs. Numbers adjacent to the arrows give estimates of present-day fluxes, expressed in the units 1012 mol yr-1.
41
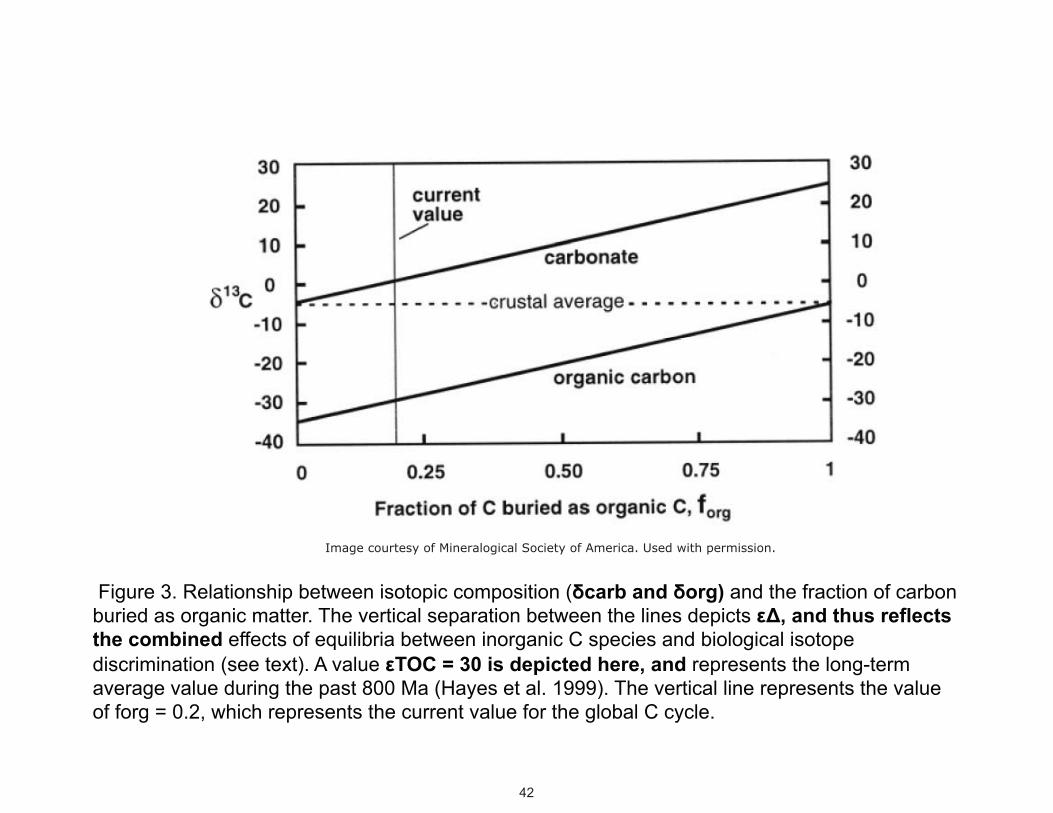
Image courtesy of Mineralogical Society of America. Used with permission.
Figure 3. Relationship between isotopic composition (δcarb and δorg) and the fraction of carbon buried as organic matter. The vertical separation between the lines depicts εΔ, and thus reflects the combined effects of equilibria between inorganic C species and biological isotope discrimination (see text). A value εTOC = 30 is depicted here, and represents the long-term average value during the past 800 Ma (Hayes et al. 1999). The vertical line represents the value of forg = 0.2, which represents the current value for the global C cycle.
42
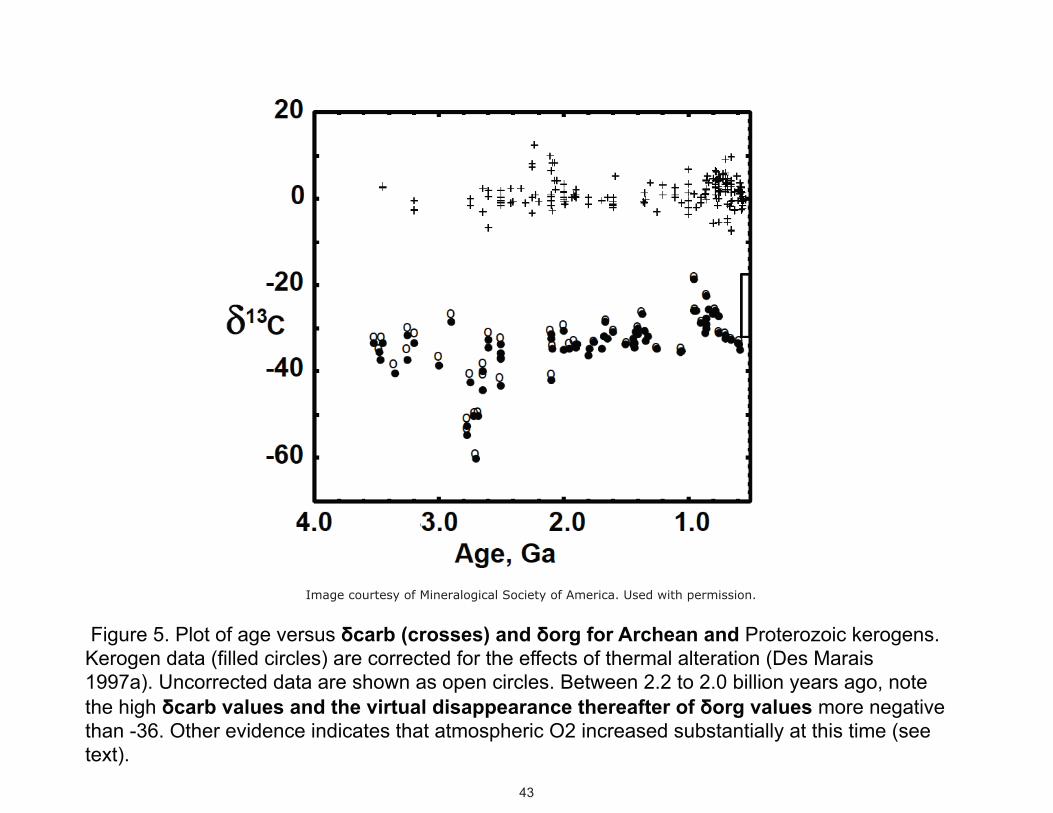
Image courtesy of Mineralogical Society of America. Used with permission.
Figure 5. Plot of age versus δcarb (crosses) and δorg for Archean and Proterozoic kerogens. Kerogen data (filled circles) are corrected for the effects of thermal alteration (Des Marais 1997a). Uncorrected data are shown as open circles. Between 2.2 to 2.0 billion years ago, note the high δcarb values and the virtual disappearance thereafter of δorg values more negative than -36. Other evidence indicates that atmospheric O2 increased substantially at this time (see text).
43
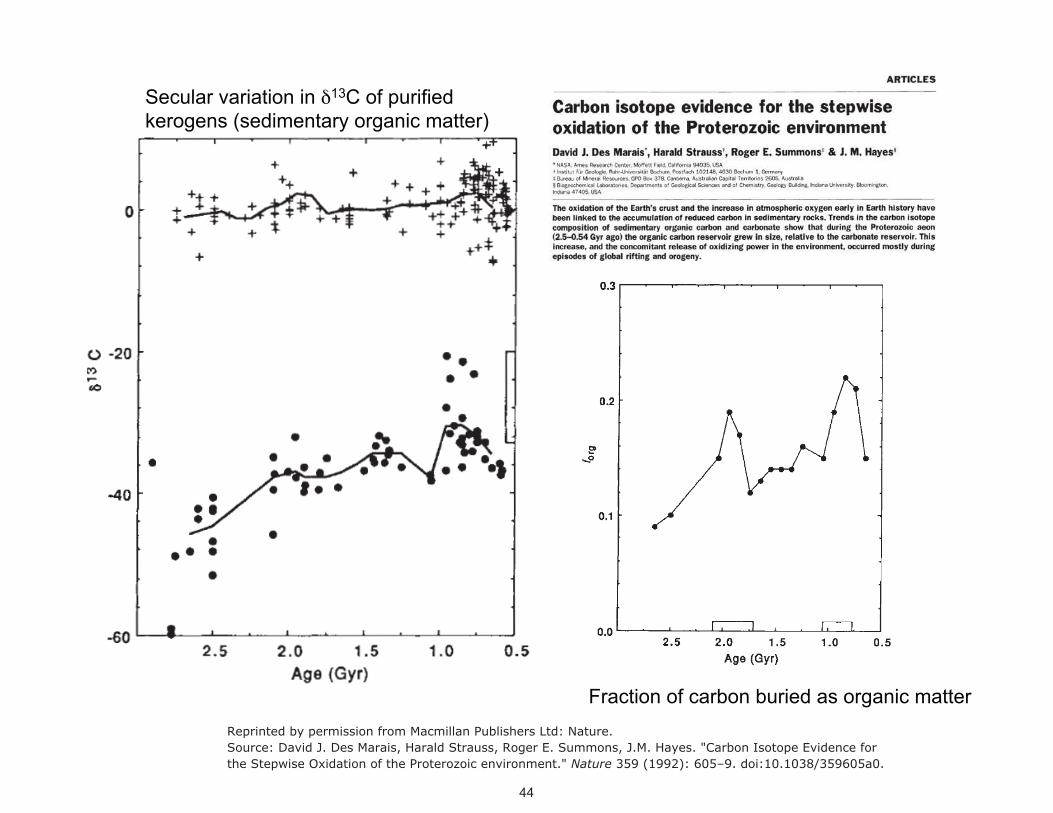
Secular variation in δ13C of purified kerogens (sedimentary organic matter)
Fraction of carbon buried as organic matter Reprinted by permission from Macmillan Publishers Ltd: Nature.Source: David J. Des Marais, Harald Strauss, Roger E. Summons, J.M. Hayes. "Carbon Isotope Evidence forthe Stepwise Oxidation of the Proterozoic environment." Nature 359 (1992): 605–9. doi:10.1038/359605a0.
44

45
Reprinted by permission from Macmillan Publishers Ltd: Nature.Source: David J. Des Marais, Harald Strauss, Roger E. Summons, J.M. Hayes. "Carbon Isotope Evidence forthe Stepwise Oxidation of the Proterozoic environment." Nature 359 (1992): 605–9. doi:10.1038/359605a0.

Image courtesy of Mineralogical Society of America. Used with permission.
Figure 8. Range of δcarb and δCO2 values (open boxes) and δorg values (shaded boxes), together with the processes proposed to explain their distribution prior to 2.2 Ga and subsequent to 2.1 Ga. A temperature of 15°C was assumed for the isotopic equilibrium between δcarb and δCO2. The lines associated with the various groups of autotrophic bacteria and algae illustrate the maximum discrimination expected for each group. The sloped line at right depicts declining discrimination over time, perhaps in response to declining CO2 levels.
46
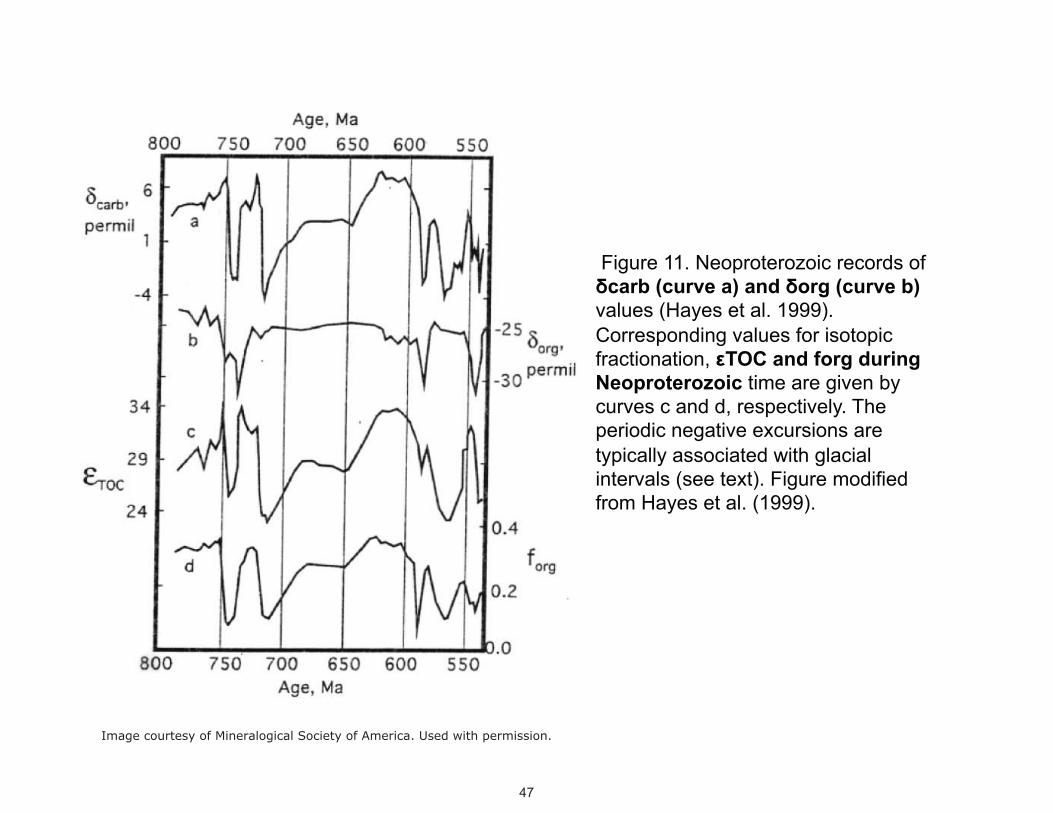
Figure 11. Neoproterozoic records of δcarb (curve a) and δorg (curve b) values (Hayes et al. 1999). Corresponding values for isotopic fractionation, εTOC and forg during Neoproterozoic time are given by curves c and d, respectively. The periodic negative excursions are typically associated with glacial intervals (see text). Figure modified from Hayes et al. (1999).
Image courtesy of Mineralogical Society of America. Used with permission.
47
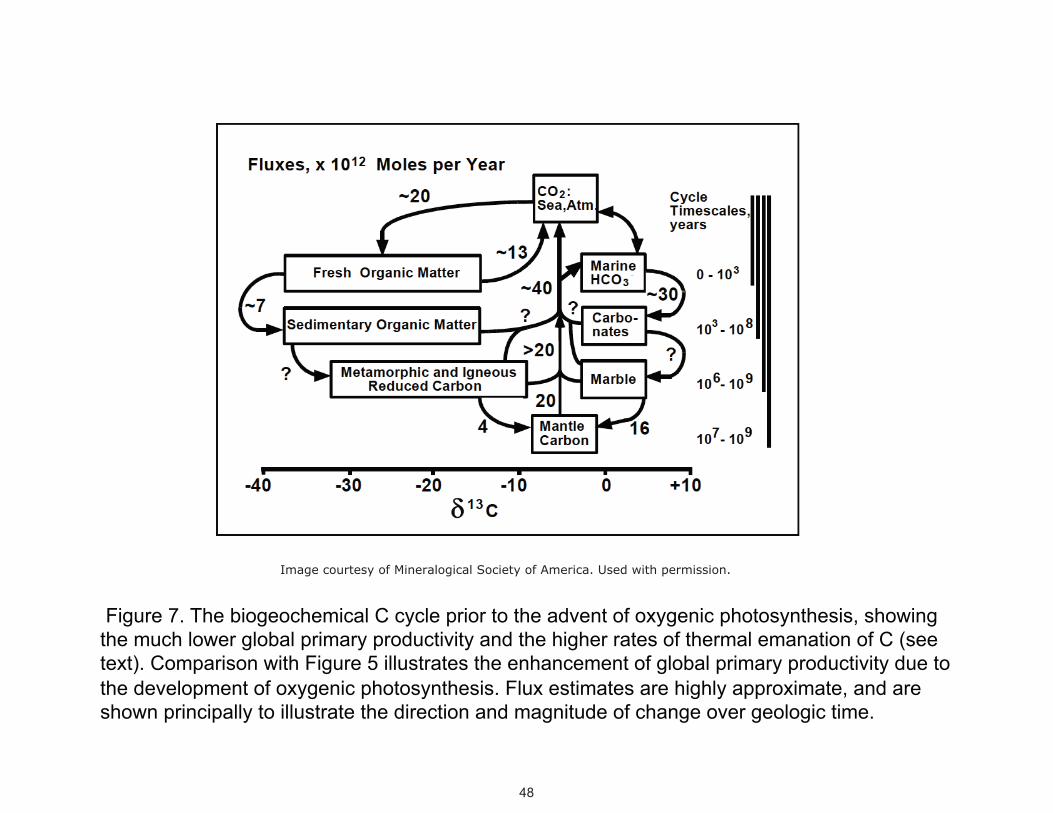
Image courtesy of Mineralogical Society of America. Used with permission.
Figure 7. The biogeochemical C cycle prior to the advent of oxygenic photosynthesis, showing the much lower global primary productivity and the higher rates of thermal emanation of C (see text). Comparison with Figure 5 illustrates the enhancement of global primary productivity due to the development of oxygenic photosynthesis. Flux estimates are highly approximate, and are shown principally to illustrate the direction and magnitude of change over geologic time.
48

Biosynthesis of Organic Compounds
Autotrophs
13C —— 12C
Carbon Source Intermediate Lipids ———————————— Straight- Polyisoprenoidal Chain CO2
Photosynthate
εP
εb
εb
3‰
49
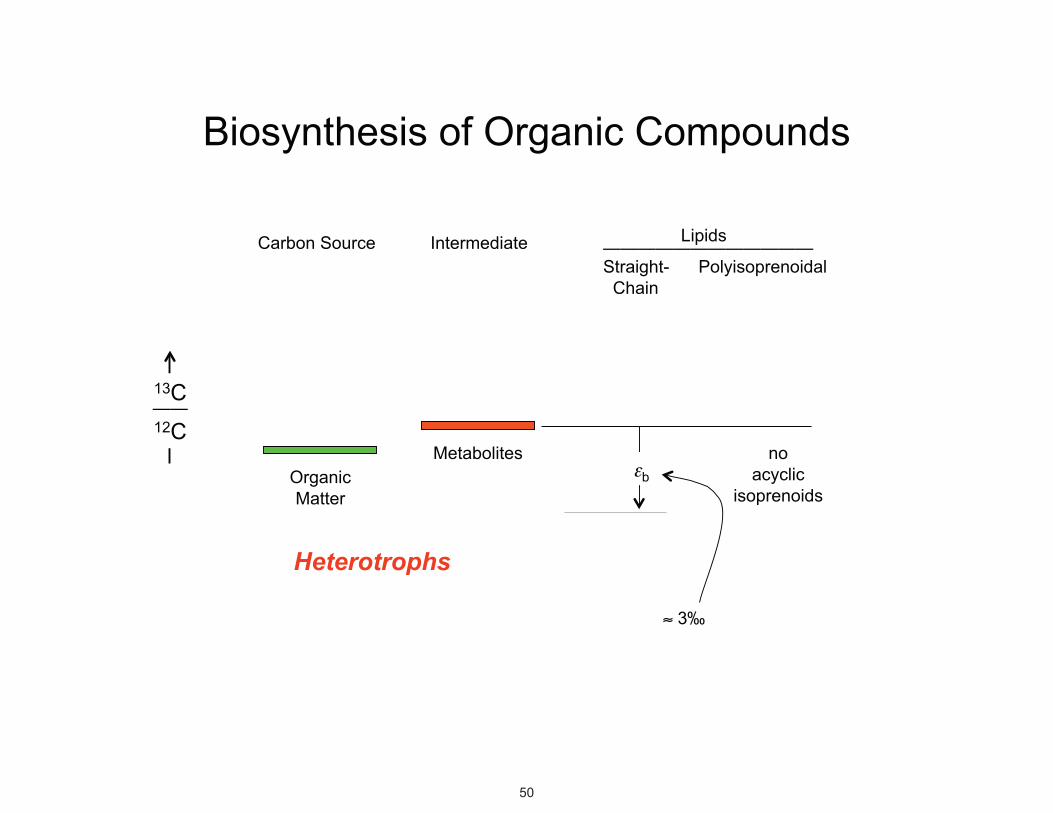
Biosynthesis, heterotrophsBiosynthesis of Organic Compounds
13C —— 12C
Carbon Source Intermediate Lipids ———————————— Straight- Polyisoprenoidal Chain
Heterotrophs
Metabolites εb Organic
Matter
no acyclic
isoprenoids
≈ 3‰
50

Cell-Sediment Cell
δ, ‰
51
Nucleic Acids Proteins
Carbohydrates
Plastidic Isoprenoids
Resistant Biopolymer
Acetogenic Lipids

MIT OpenCourseWarehttp://ocw.mit.edu
12.007 GeologySpring 2013 For information about citing these materials or our Terms of Use, visit: http://ocw.mit.edu/terms.


