
Geobiology of the stratified
central Baltic Sea water column
Dissertation
zur Erlangung des mathematisch-naturwissenschaftlichen Doktorgrades
„Doctor rerum naturalium“
der Georg-August-Universität Göttingen
im Promotionsprogramm Geowissenschaften
der Georg-August University School of Science (GAUSS)
vorgelegt von
Christine Berndmeyer
aus Cloppenburg
Göttingen, 2014
Betreuungsausschuss
Prof. Dr. Volker Thiel, GZG, Abteilung Geobiologie
Dr. Martin Blumenberg, Bundesanstalt für Geowissenschaften und Rohstoffe
Mitglieder der Prüfungskomission
Referent: Prof. Dr. Volker Thiel, GZG, Abteilung Geobiologie
Korreferent: Dr. Martin Blumenberg, Bundesanstalt für Geowissenschaften und Rohstoffe
weitere Mitglieder der Prüfungskomission:
Prof. Dr. Joachim Reitner, GZG, Abteilung Geobiologie
Prof. Dr. Daniel Jackson, Courant Research Center Geobiology
Dr. Steffen Kiel, GZG, Abteilung Geobiologie
Dr. Oliver Schmale, Leibnizinstitut für Ostseeforschung Warnemünde
Tag der mündlichen Prüfung:
20. August 2014

Acknowledgments Working in this project was a great experience and although Göttingen is not necessarily
famous for its maritime flair, my work here allowed me keeping my marine background.
First of all, I cordially thank Martin Blumenberg for the opportunity to work in this Baltic
Sea project, for his patient and diligent mentoring and his support during all stages of this
thesis. I furthermore thank Volker Thiel for his scientific support, good advice, the hours
spent for proofreading, and critical questions.
I thank Joachim Reitner, Daniel Jackson, Steffen Kiel, and Oliver Schmale for being members
of my thesis committee.
In addition, I thank Oliver Schmale for help with sampling and onboard ship, and for
constructive discussions. I am very thankful to my co-doctoral candidate Gunnar Jakobs for
the nice times spent onboard ships, the scientific discussions and exchange of ideas, the non-
scientific discussions and the mutual support.
Thomas Bode and Nadine Schäfer have always been helpful with any PC problems.
For help in laboratory and analytical support, I thank Cornelia Conradt, Lukas Kammel,
Birgit Röhring, Andreas Reimer, Tobias Licha, Karsten Nödler and Jens Dyckmans.
Thanks to my colleagues Jan Bauermeister, Juliane Germer, Ines Herlitze, Jennifer Hohagen,
Tim Leefmann, Eva-Maria Sadowski, and Leyla Seyfullah for lunch breaks, chats on the roof,
and help with this work. Special thanks to Jan-Peter Duda for all his support during years of
study in Bremen and the current support for our “double-finish”.
I am very grateful to my family for never ending support, help, encouragement, and interest
in what I am doing.
I am especially indebted to Timo Köhnsen who always supported my work but steadily
reminds me what is really important.
This thesis was written as a part of the DFG research project “Aerobic and anaerobic
methane consumption in the central Baltic Sea water column”.
This thesis is dedicated to Anette and Klaus Berndmeyer.
Preface The following papers and manuscripts are part of this doctoral thesis: Berndmeyer, C., Thiel, V., Blumenberg, M., 2014. Test of microwave, ultrasound and Bligh &
Dyer extraction for quantitative extraction of bacteriohopanepolyols (BHPs) from marine
sediments. Organic Geochemistry 68, 90-94.
Berndmeyer, C., Thiel, V., Schmale, O., Blumenberg, M., 2013. Biomarkers for aerobic
methanotrophy in the water column of the stratified Gotland Deep (Baltic Sea). Organic
Geochemistry 55, 103-111.
Berndmeyer, C., Thiel, V., Schmale, O., Wasmund, N., Blumenberg, M., 2014b. Biomarkers in
the stratified water column of the Landsort Deep (Baltic Sea). Biogeosciences Discussions
11, 9853-9887. Under review.
Blumenberg, M., Berndmeyer, C., Moros, M., Muschalla, M., Schmale, O., Thiel, V., 2013.
Bacteriohopanepolyols record stratification, nitrogen fixation and other biogeochemical
perturbations in Holocene sediments of the central Baltic Sea. Biogeosciences 10, 2725-
2735.
Schmale, O., Blumenberg, M., Kießlich, K., Jakobs, G., Berndmeyer, C., Labrenz, M., Thiel, V.,
Rehder, G., 2012. Microbial methane oxidation at the redoxcline of the Gotland Deep (Baltic
Sea). Biogeosciences 9, 4969-4977.
Contents Abstract 1
Chapter 1 - Introduction 3
1.1 Molecular biomarkers 4
1.2 Stratified water columns 7
1.3 Geobiology of stratified water columns 10
1.4 Holocene development of the Baltic Sea and the present situation 11
1.5 Sampling and analytical methods 16
1.6 Introduction to the following chapters 18
References 19
Chapter 2 – “Test of microwave, ultrasound and Bligh & Dyer extraction for
quantitative extraction of bacteriohopanepolyols (BHPs) from marine
sediments”
27
2.1 Abstract 27
2.2 Introduction 27
2.3 Methods 28
2.4 Results 30
2.5 Discussion 31
2.6 Conclusions 34
Acknowledgments 34
References 35
Chapter 3 – “Biomarkers in the stratified water column of the Landsort Deep
(Baltic Sea)”
41
3.1 Abstract 41
3.2 Introduction 42
3.3 Material and methods 43
3.4 Results 46
3.5 Discussion 53
3.6 Conclusions 59
Acknowledgments 60
References 61

Chapter 4 – “Aerobic methanotrophy within the pelagic redox-zone of the
Gotland Deep”
73
4.1 Abstract 73
4.2 Introduction 74
4.3 Methods 76
4.4 Results and discussion 79
4.5 Conclusions 85
Acknowledgments 86
References 86
Chapter 5 – “Biomarkers for aerobic methanotrophy in the water column of the
stratified Gotland Deep (Baltic Sea)”
95
5.1 Abstract 95
5.2 Introduction 96
5.3 Methods 98
5.4 Results 101
5.5 Discussion 105
5.6 Conclusions and outlook 110
Acknowledgments 111
References 111
Chapter 6 – “Bacteriohopanepolyols record stratification, nitrogen fixation and
other biogeochemical perturbations in Holocene sediments of the central Baltic
Sea”
121
5.1 Abstract 121
5.2 Introduction 122
5.3 Study site and core stratigraphy 124
5.4 Materials and methods 126
5.5 Results 127
5.6 Discussion 130
5.7 Conclusions 137
Acknowledgments 137
References 138

Chapter 7 – Summary and conclusions 145
Curriculum Vitae 149

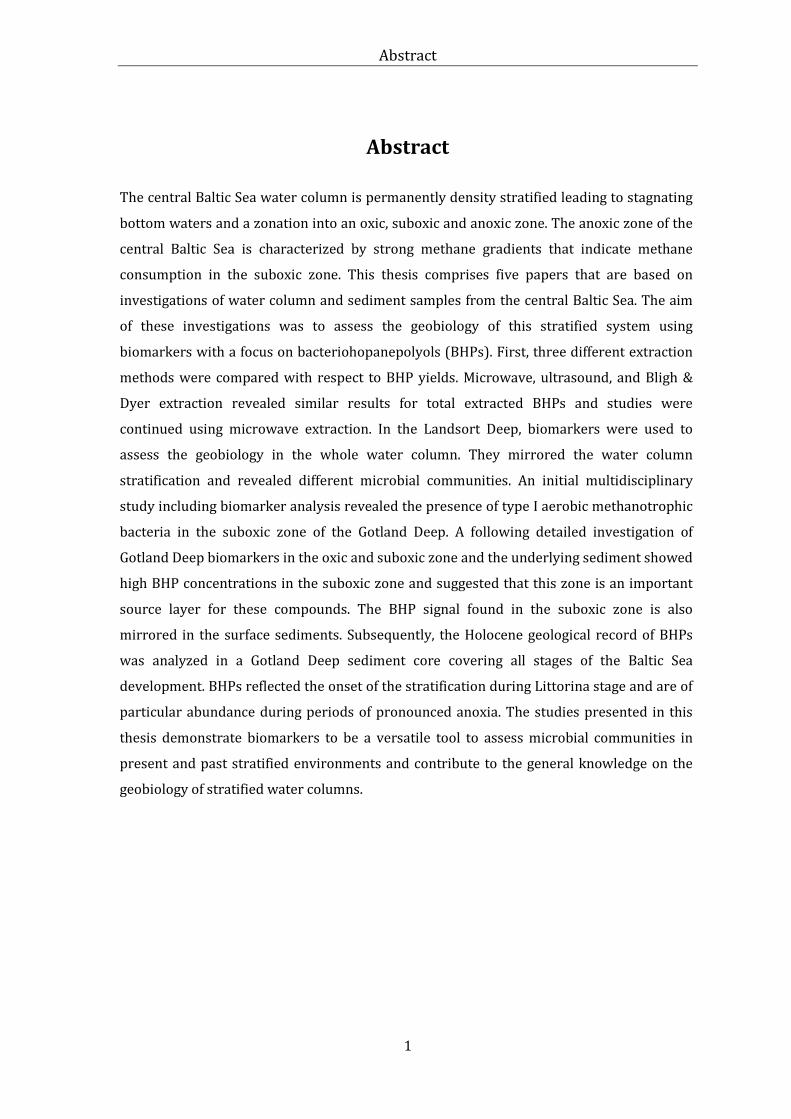
Abstract
1
Abstract
The central Baltic Sea water column is permanently density stratified leading to stagnating
bottom waters and a zonation into an oxic, suboxic and anoxic zone. The anoxic zone of the
central Baltic Sea is characterized by strong methane gradients that indicate methane
consumption in the suboxic zone. This thesis comprises five papers that are based on
investigations of water column and sediment samples from the central Baltic Sea. The aim
of these investigations was to assess the geobiology of this stratified system using
biomarkers with a focus on bacteriohopanepolyols (BHPs). First, three different extraction
methods were compared with respect to BHP yields. Microwave, ultrasound, and Bligh &
Dyer extraction revealed similar results for total extracted BHPs and studies were
continued using microwave extraction. In the Landsort Deep, biomarkers were used to
assess the geobiology in the whole water column. They mirrored the water column
stratification and revealed different microbial communities. An initial multidisciplinary
study including biomarker analysis revealed the presence of type I aerobic methanotrophic
bacteria in the suboxic zone of the Gotland Deep. A following detailed investigation of
Gotland Deep biomarkers in the oxic and suboxic zone and the underlying sediment showed
high BHP concentrations in the suboxic zone and suggested that this zone is an important
source layer for these compounds. The BHP signal found in the suboxic zone is also
mirrored in the surface sediments. Subsequently, the Holocene geological record of BHPs
was analyzed in a Gotland Deep sediment core covering all stages of the Baltic Sea
development. BHPs reflected the onset of the stratification during Littorina stage and are of
particular abundance during periods of pronounced anoxia. The studies presented in this
thesis demonstrate biomarkers to be a versatile tool to assess microbial communities in
present and past stratified environments and contribute to the general knowledge on the
geobiology of stratified water columns.

2

Chapter 1 – Introduction
3
1
Introduction
Geobiology is the science of the interactions between the non-living geosphere and
the living biosphere. Much like the geosphere has an influence on the development
and distribution of life, life, inversely, is able to change and shape the geosphere.
Numerous topics such as early life environments, the photosynthetic oxygenation of
the atmosphere, microbial mineral precipitation, or nutrient cycles are of
geobiological interest. This thesis, however, is focused on the geobiology of the
central Baltic Sea stratified water column, i.e. the distribution of microbial life in
physicochemically differing water layers. A permanent pycnocline divides the
present central Baltic Sea water column into an oxic, suboxic and anoxic zone. The
resulting chemocline supports numerous microbial metabolisms, including the
aerobic oxidation of methane.
This thesis was written in the context of the multidisciplinary project “Aerobic and
anaerobic methane consumption in the central Baltic Sea water column” conducted
by the geobiology group of the Georg-August-University of Göttingen and the
working group “trace gases” of the Leibniz Institute for Baltic Sea Research
Warnemünde (IOW). Methane is known to be a highly effective greenhouse gas that
is amongst others produced in marine sediments. Microbial methane oxidation in
the sediments and in the water column removes large amounts of the produced
methane before it can reach the atmosphere and affects climate. Little was known
about the microbial key players in methane oxidation, the amounts of methane
consumed, and spatial and temporal variations of this process. Key questions within
the project were:
• Is there aerobic and anaerobic oxidation of methane?
• Which microorganisms are involved in the consumption of methane?
• Are there spatial differences in the communities of these microorganisms
and the amounts of methane consumed?
• Do seasonal variations have an influence on the communities and if so, how
do they adapt?

Chapter 1 – Introduction
4
The first steps in answering these questions were done using a number of different
methods, one of them being the analysis of molecular biomarkers. Some of these
biomarkers, e.g. bacteriohopanepolyols, can be highly specific for certain
microorganisms and related biogeochemical processes. Presence and distribution of
biomarkers in the water, thus, are the main focus of this thesis. With respect to the
biomarkers and with emphasis on bacteriohopanepolyols, further questions arose:
• Do the biomarkers in the water column reflect in situ production or are their
distributions a result of transport?
• Apart from methanotrophy, what information do biomarkers yield on the
occurrence of other biogeochemical processes?
• Are biomarker signals from the water column preserved in the sediment and
can they be used to reconstruct the development of the Baltic Sea
stratification?
Aim of this thesis was to apply water column biomarker data to identify microbial
communities, methanotrophic microorganisms, their distribution in the water
column, and the preservation of their signals in the sediments. The results of the
studies discussed in the following chapters give insight into the highly dynamic and
complex system of the present and past stratified water columns of the central Baltic
Sea.
1.1 Molecular biomarkers
Biomarkers are biosynthetic organic compounds such as lipids (Brocks and Pearson,
2005). They can be preserved in sediments and sedimentary rocks and some are
specific for certain groups of organisms (Brocks and Pearson, 2005; Brocks and
Grice, 2011). Lipids are derived from lipid membranes that are used by all living
cells as a boundary between the living intracellular and the non-living extracellular
environment (Fig. 1a). These membranes are a semipermeable heterogeneous
assembly of primarily lipids and proteins and their main function is to control the
passage of water and solutes in or out of a cell (Fig. 1b; Kannenberg and Poralla,
1999). Constituents and internal structure vary between the domains of life. The
basic construction, however, is an approximately 8 nm thick bilayer of amphipathic
Chapter 1 – Introduction
5
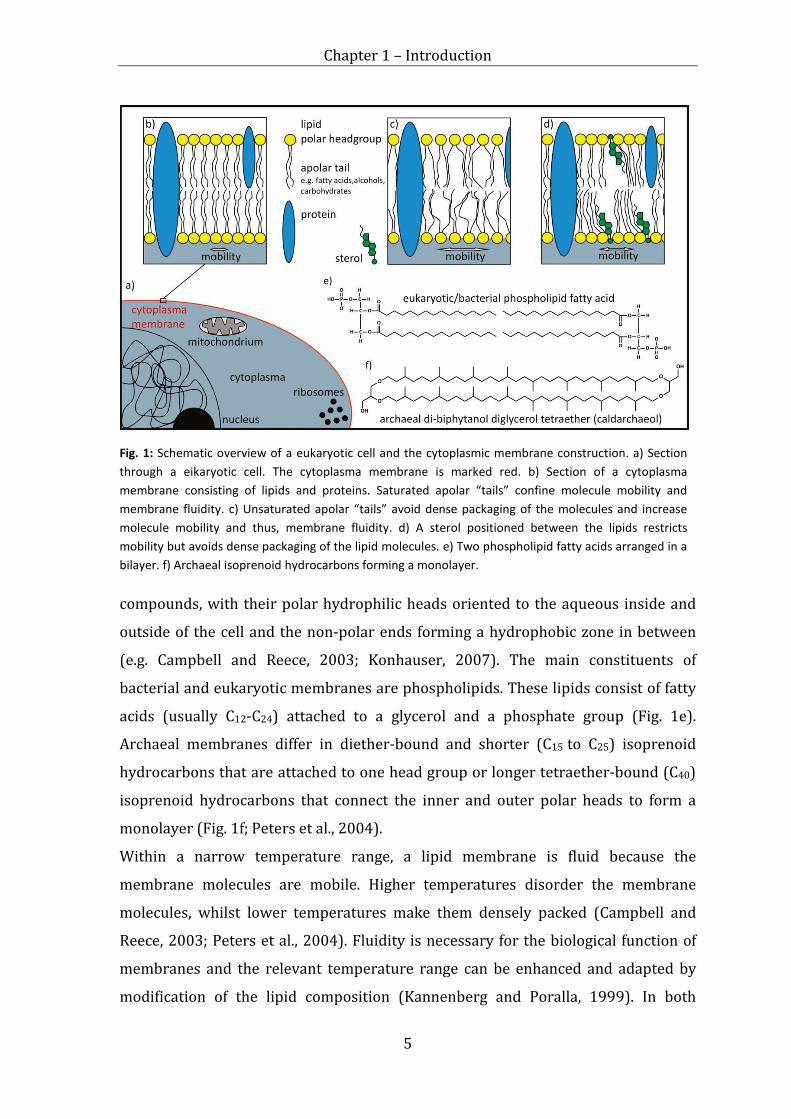
compounds, with their polar hydrophilic heads oriented to the aqueous inside and
outside of the cell and the non-polar ends forming a hydrophobic zone in between
(e.g. Campbell and Reece, 2003; Konhauser, 2007). The main constituents of
bacterial and eukaryotic membranes are phospholipids. These lipids consist of fatty
acids (usually C12-C24) attached to a glycerol and a phosphate group (Fig. 1e).
Archaeal membranes differ in diether-bound and shorter (C15 to C25) isoprenoid
hydrocarbons that are attached to one head group or longer tetraether-bound (C40)
isoprenoid hydrocarbons that connect the inner and outer polar heads to form a
monolayer (Fig. 1f; Peters et al., 2004).
Within a narrow temperature range, a lipid membrane is fluid because the
membrane molecules are mobile. Higher temperatures disorder the membrane
molecules, whilst lower temperatures make them densely packed (Campbell and
Reece, 2003; Peters et al., 2004). Fluidity is necessary for the biological function of
membranes and the relevant temperature range can be enhanced and adapted by
modification of the lipid composition (Kannenberg and Poralla, 1999). In both
Fig. 1: Schematic overview of a eukaryotic cell and the cytoplasmic membrane construction. a) Section through a eikaryotic cell. The cytoplasma membrane is marked red. b) Section of a cytoplasma membrane consisting of lipids and proteins. Saturated apolar “tails” confine molecule mobility and membrane fluidity. c) Unsaturated apolar “tails” avoid dense packaging of the molecules and increase molecule mobility and thus, membrane fluidity. d) A sterol positioned between the lipids restricts mobility but avoids dense packaging of the lipid molecules. e) Two phospholipid fatty acids arranged in a bilayer. f) Archaeal isoprenoid hydrocarbons forming a monolayer.
Chapter 1 – Introduction
6
bacterial and eukaryotic membranes, fluidity is enhanced by the incorporation of
unsaturated fatty acids into the phospholipids (Fig. 1c). Other compounds
influencing fluidity are hopanoids and sterols that are positioned between the
phospholipids (Fig 1d). They are able to reduce movement of the phospholipids
when the temperature is rising but also avoid dense packaging at low temperatures
(Campbell and Reece, 2003; Peters et al., 2004). Archaea adapt their membranes to
temperatures by either building monolayer membranes from tetraether-bound
isoprenoids that reduce movement of the membrane molecules and preserve fluidity
in high temperature environments, or by the incorporation of several cyclopentyl
rings (Peters et al., 2004). There are numerous molecules that change membrane
properties. These membrane constituents do not only differ between the domains of
life. Some are even characteristic, for certain genera (Brocks and Pearson, 2005;
Brocks and Grice, 2011). Thus, membrane constituents are biological markers for
the presence of these organisms. The analysis of membrane constituents or their
residues is a useful tool to gain information about microbial communities in recent
environments but can also be used to reconstruct paleo-communities.
If analyzed for stable carbon isotope composition, biomarkers can yield further
information about their producers and the substrates used for membrane
construction. During the uptake of carbon in form of CO2 (and HCO3-), CH4, or
organic material, the lighter 12C is fractionated over the heavier 13C. In the case of
methanotrophy, the substrate CH4 is often already strongly depleted in 13C,
especially if of biogenic origin. Methanotrophs further fractionate during uptake and
incorporation into their membranes. Therefore, lipids of methanotrophs are usually
characterized by very low δ13C values, compared to other organic materials (Pancost
and Pagani, 2006).
1.1.2 Bacteriohopanepolyols (BHPs)
Bacteriohopanepolyols are biomarkers that are so far only known to be produced by
bacteria (Ourisson and Albrecht, 1992). BHPs consist of the basic pentacyclic C30
hopane linked to a C5 n-alkyl polyhydroxylated unit (Fig. 2; Rohmer et al., 1984;
Neunlist and Rohmer, 1985). This side chain is highly variable, with attached polar
moieties at its end, different numbers of hydroxy groups, or the C35 hydroxy group
can be exchanged with an amino group (Neunlist and Rohmer, 1985). The function

Chapter 1 – Introduction
7
of BHPs remains unresolved so far. A
first assumption was that BHPs in
bacterial membranes might fulfill the
same membrane stabilizing function as
the structurally similar sterols in
eukaryotes (Ourisson and Albrecht,
1992; Kannenberg and Poralla, 1999).
The squalene-hopene-cyclase necessary
for BHP production, however, was only
identified in ~10% of bacteria with
sequenced genomes and hence, BHPs
might not be as important as assumed
for bacterial membranes (Pearson et al.,
2007). An alternative relation of BHP
production to N-fixation is also under
debate (e.g. Berry et al., 1991; Pearson
et al., 2007; Blumenberg et al., 2009;
Blumenberg et al., 2012). Despite the
uncertainty of their function, some
BHPs are produced by distinct bacterial
genera and are nevertheless useful
tools for their identification in present
and past environments.
1.2 Stratified water columns
Stratified water columns are the result of natural salinity and temperature
variations leading to density variations in different water layers. Put simply, every
water column is at least seasonally stratified, usually by a warmer mixed surface
layer and an underlying colder deep water layer, divided by a pycnocline (zone of
strong density gradient; Colling et al., 2001). The modern world ocean’s conveyor-
belt circulation, for example, is based on a strong stratification with very cold and
oxygen rich water masses sinking down and ventilating the deep sea (Colling et al.,
2001; Meyer and Kump, 2008).
Fig. 2: The basic hopane and a selection of the variable BHPs. a) hopane b) bacteriohopane-32,33,34,35-tetrol (BHT) c) 2-methyl-35-aminobacteriohopane-32,33,34-triol d) 35-aminobacteriohopane-30,31,32,33,34-pentol e) bacteriohopanetetrol cyclitol ether
Chapter 1 – Introduction
8
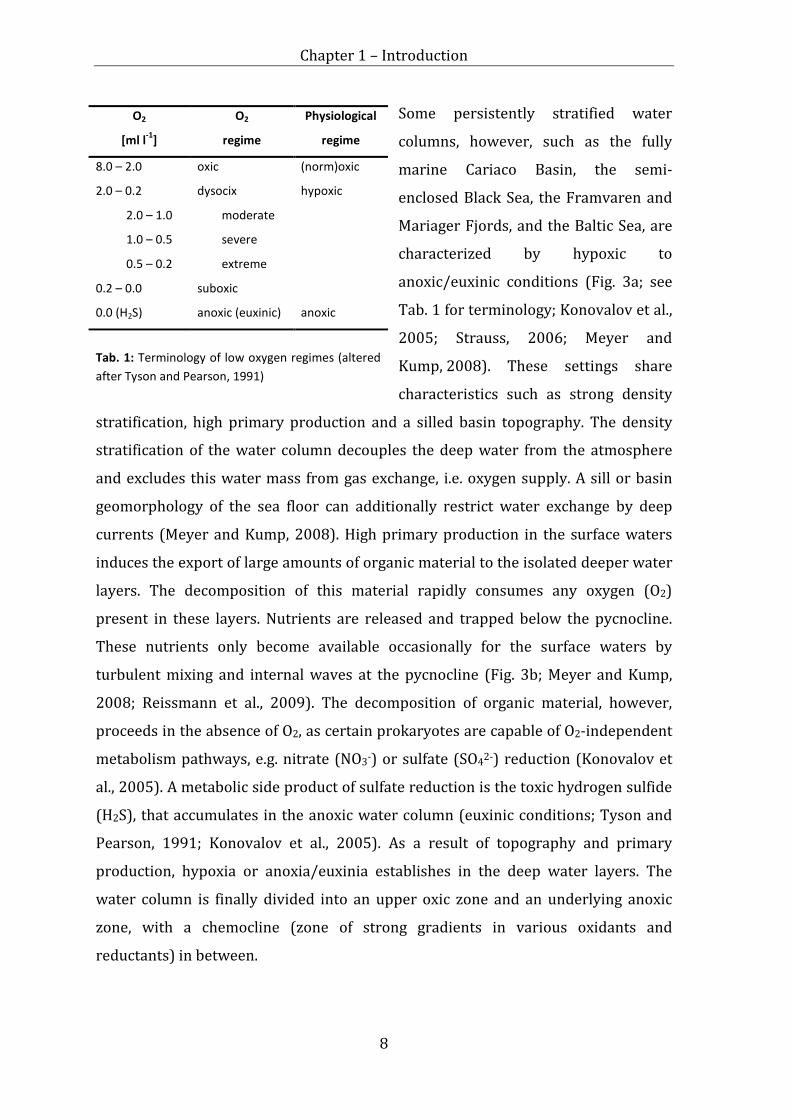
Some persistently stratified water
columns, however, such as the fully
marine Cariaco Basin, the semi-
enclosed Black Sea, the Framvaren and
Mariager Fjords, and the Baltic Sea, are
characterized by hypoxic to
anoxic/euxinic conditions (Fig. 3a; see
Tab. 1 for terminology; Konovalov et al.,
2005; Strauss, 2006; Meyer and
Kump, 2008). These settings share
characteristics such as strong density
stratification, high primary production and a silled basin topography. The density
stratification of the water column decouples the deep water from the atmosphere
and excludes this water mass from gas exchange, i.e. oxygen supply. A sill or basin
geomorphology of the sea floor can additionally restrict water exchange by deep
currents (Meyer and Kump, 2008). High primary production in the surface waters
induces the export of large amounts of organic material to the isolated deeper water
layers. The decomposition of this material rapidly consumes any oxygen (O2)
present in these layers. Nutrients are released and trapped below the pycnocline.
These nutrients only become available occasionally for the surface waters by
turbulent mixing and internal waves at the pycnocline (Fig. 3b; Meyer and Kump,
2008; Reissmann et al., 2009). The decomposition of organic material, however,
proceeds in the absence of O2, as certain prokaryotes are capable of O2-independent
metabolism pathways, e.g. nitrate (NO3-) or sulfate (SO42-) reduction (Konovalov et
al., 2005). A metabolic side product of sulfate reduction is the toxic hydrogen sulfide
(H2S), that accumulates in the anoxic water column (euxinic conditions; Tyson and
Pearson, 1991; Konovalov et al., 2005). As a result of topography and primary
production, hypoxia or anoxia/euxinia establishes in the deep water layers. The
water column is finally divided into an upper oxic zone and an underlying anoxic
zone, with a chemocline (zone of strong gradients in various oxidants and
reductants) in between.
O2
[ml l-1]
O2
regime
Physiological
regime
8.0 – 2.0 oxic (norm)oxic
2.0 – 0.2 dysocix hypoxic
2.0 – 1.0 moderate
1.0 – 0.5 severe
0.5 – 0.2 extreme
0.2 – 0.0 suboxic
0.0 (H2S) anoxic (euxinic) anoxic
Tab. 1: Terminology of low oxygen regimes (altered after Tyson and Pearson, 1991)

Chapter 1 – Introduction
9
Such a chemocline is also occurring in coastal upwelling regions. Modern upwelling
is mainly located at western continental margins, e.g. at the Peru and Chile Margin
and the coasts of California and Namibia (Strauss, 2006). These areas are naturally
rich in nutrients brought up with cold deep waters (Colling et al., 2001), and primary
production in these settings is high. Microbial respiration of organic material
exported to deeper water layers leads to an oxygen minimum zone (OMZ) and a
similar O2 zonation as in the semi-enclosed continental seas (Fig. 3c). The same
effect can be observed for monsoon-driven upwelling in the Arabian Sea and the Bay
of Bengal (Bange et al., 2000; Helly and Levin, 2004; Strauss, 2006).
Naturally occurring hypoxic conditions, especially in the semi-enclosed continental
seas, were enhanced in the last decades by human eutrophication. The resulting
planktonic algal blooms and the extensive amounts of organic material fueled
Fig. 3: Physicochemical properties and development of stratified water columns. a) Physicochemical properties of a stratified water column. Warmer water of lower density are overlying cooler, denser deep waters (ρ = density). Oxygen levels are indicated by color change and notes at the right side (compare Tab. 1). The chemocline (area of steepest gradients) is located between the dashed gray lines. b) A density stratified water column in a silled basin topography. Organic material from a highly productive surface is sinking below the pycnocline and is decomposed under O2 consumption in the isolated deep water layers. Nutrients are trapped below the pycnocline; new nutrients enter the system via e.g. riverine input. c) Formation of a stratified water column under upwelling regions. Nutrient-rich deep water masses are brought into the photic zone, strongly enhancing primary production. Sinking organic material is decomposed under O2 consumption.
Chapter 1 – Introduction
10
microbial respiration, which further intensified oxygen consumption and thus,
hypoxic environments were spreading (Tyson and Pearson, 1991; Zaitsev and
Mamaev, 1997a; Diaz and Rosenberg, 2008). Consequently, habitat compressions
and the loss of benthic organisms not only had severe effects for the original flora
and fauna, but also negatively affected fishery economies (Zaitsev, 1992; Diaz and
Rosenberg, 2008; Meyer and Kump, 2008).
1.3 Geobiology of stratified water columns
Stratified water columns comprise many physical and chemical gradients that
support different layers of biological activity (Wakeham et al., 2007; Meyer and
Kump, 2008). The oxic surface is usually inhabited by a mixed
prokaryotic/eukaryotic community, including bacteria, algae, protists, invertebrates
and vertebrates. High primary production by microalgae and cyanobacteria in the
photic zone leads to nutrient depletion in this water layer and export of organic
material to deeper water layers. In settings with a deep photic zone or a shallow
chemocline, photosynthetic anoxygenic green and purple sulfur bacteria also
contribute to primary production (Overmann et al., 1992; Mandernack et al., 2003,
and citations therein). As previously mentioned, a stratified water column means a
compressed habitat for organisms that are sensitive to low O2 concentrations and
the toxic H2S. A sufficient O2 supply thus limits their vertical distribution to oxic
water layers (Tyson and Pearson, 1991; Diaz and Rosenberg, 2008). Some protists
are more tolerant with respect to O2 and H2S. These do not only thrive in oxic layers
and the chemocline, but in the case of some grazing ciliates also in anoxic/euxinic
layers (Behnke et al., 2006; Anderson et al., 2012; Edgcomb and Pachiadaki, 2014).
The chemocline supports a multitude of microbial physiologies because of its steep
physicochemical gradients. Various oxidants and reductants co-occur, and especially
the lower chemocline is known to be a hotspot of microbial activity (Wakeham et al.,
2007; Wakeham et al., 2012; Edgcomb and Pachiadaki, 2014). Important
biogeochemical processes in the chemocline are sulfide oxidation and the aerobic
oxidation of methane (CH4) by O2 consumption, iron (Fe(III)) and manganese
(Mn(IV)) reduction, as well as de-nitrification and anaerobic ammonium oxidation
(anammox), both leading to the formation of di-nitrogen (N2). The high abundance
of bacteria and archaea within the chemocline makes it a productive zone with rapid

Chapter 1 – Introduction
11
turnover of organic material (Detmer et al., 1993). Heterotrophic bacteria and
eukaryotes, such as ciliates and dinoflagellates, are also important members of the
chemocline microbial community (Detmer et al., 1993; Wakeham et al., 2007; Stock
et al., 2009; Anderson et al., 2012; Wakeham et al., 2012; Edgcomb and Pachiadaki,
2014).
The anoxic zone is dominated by archaea and bacteria, although some ciliates are
usually found below the chemocline and in case of the Cariaco Basin, even down to
900 m water depth (Anderson et al., 2012; Edgcomb and Pachiadaki, 2014). The
main processes in the anoxic zone are sulfate reduction and anaerobic oxidation of
methane (AOM). The reduction of sulfate, which is abundant in sea water, is
energetically more favorable than methanogenesis and the presence of sulfate limits
methanogenesis. Thus, methanogenesis usually occurs in the underlying sediments
in the absence of sulfate.
Benthic macrofauna can only be found under either periodically and short, or
persistent hypoxic conditions. In usually oxic environments, where the benthic
macrofauna is not adapted to low oxygen concentrations, only episodic hypoxic
events in the range of days to weeks can be survived by a few species. Instead, the
persistent OMZs below upwelling regions, e.g. Peru Margin, are characterized by
high benthic biomass, because species could adapt to the continuously low oxygen
and high organic matter environment (Diaz and Rosenberg, 1995, 2008). Persistent
and spreading anoxia, however, leads to mass mortalities of benthic macrofauna.
Basins such as the Black and Baltic Sea are therefore free of such organisms (Diaz
and Rosenberg, 1995; Zaitsev and Mamaev, 1997a, b).
1.4 Holocene development of the Baltic Sea and the present situation
The development of the modern stratified Baltic Sea is characterized by a complex
interplay of melting glaciers, eustatic and isostatic processes, opening and closing
thresholds, and freshwater periods interchanging with brackish periods. The history
of the Baltic Sea is divided into the (unstratified) Baltic Ice Lake, Yoldia Sea, Ancylus
Sea, and the (stratified) Littorina Sea stages, followed by a Post-Littorina and the
present stage. Ages (in calendar years) were taken from Zillén et al. (2008) and
Zillén and Conley (2010). It has to be taken into account, that these ages can vary

Chapter 1 – Introduction
12
depending on the sample location and thus, only reflect a basic time scale. See Fig. 4
for locations mentioned in the text.
1.4.1 Baltic Ice Lake (~16,000-11,600 cal. yr. BP)
The onset of deglaciation in
the southwestern Baltic Sea
area is dated from ~17,000
to 15,000 cal. yr. BP, with the
formation of a first lake in
the Mecklenburg Bay/Hanö
Bay region (Björck, 1995;
Andrén et al., 2000b). With
proceeding melting, large
parts of the southern Baltic
became ice free and the
Baltic Ice Lake developed
from ~16,000 cal. yr. BP on
(Zillén et al., 2008), with
drainage through the
Øresund.
Sediments deposited close to the ice sheet during that time were reddish-brown
varved clays. Further away, more homogenous clays were deposited (Björck, 1995;
Moros et al., 2002).
Because of isostatic uplift in the ice free regions, the Øresund was successively
closed. The Baltic Ice Lake was dammed and the water level rose above sea level.
Finally, at ~11,600 cal. yr. BP, the water drained abruptly at Mount Billingen in
south central Sweden and caused water levels to drop up to 25 m (Björck, 1995;
Zillén et al., 2008).
1.4.2 Yoldia Sea (~11,600-10,700 cal. yr. BP)
After the Baltic Ice Lake drained, the Yoldia Sea was established and its water level
was determined by the global ocean (Zillén et al., 2008). Deglaciation increased and
sedimentation rates were high, with exposed formerly Ice Lake clays now being
Fig. 4: The south western Baltic Sea with locations mentioned in the text (adapted and changed from Björck, 1995).
Chapter 1 – Introduction
13
reworked. Sediments changed to dark gray clays with thick varves (Björck, 1995;
Sohlenius et al., 1996).
In the south central Swedish Lowlands, the Närke Strait opened and connected the
Yoldia Sea to the ocean. The continuous outflow of melt water prevented salt water
intrusions, until melting slowed down and the global sea level rose (Björck, 1995;
Andrén et al., 2000b). A brackish phase of about 200-300 cal. yr. could be tracked
(Wastegård et al., 1995), until isostatic uplift closed the Närke Strait and the Yoldia
Sea became fresh again (Sohlenius et al., 1996).
1.4.3 Ancylus Lake (~10,700-8,000 cal. yr. BP)
After the closing of the Närke Strait, only a narrow drainage in this area remained,
and the Ancylus Transgression was initiated. Again, the water level was dammed
above sea level. Because melting glaciers were no longer influencing sedimentation,
a homogenous gray clay was deposited rather than varves (Sohlenius et al., 1996).
Main drainage of the Ancylus Lake with a substantial water level drop occurred at
~10,000 cal. yr. BP, when the Darss Sill was eroded and a connection to the Kattegat
was established (Björck, 1995). The narrow and long connection, however,
prevented salt water inflows until ~8,000 cal. yr. BP, when the global sea level rose
above Øresund sill (Björck, 1995). Before the intrusion of salt water, the absence of a
halocline and a relatively low deposition of organic matter preserved oxic bottom
waters in the entire Ancylus Lake (Sohlenius et al., 1996).
1.4.4 Littorina Sea (~8,000 – 4,000 cal. yr. BP)
The initial Littorina stage began with the first intrusion of salt water and ended
when fully brackish conditions were achieved at ~6,000 cal. yr. BP (Andrén et al.,
2000a; Andrén et al., 2000b; Zillén and Conley, 2010). During this time, the Øresund
transect was about twice of its present size (Gustafsson and Westman, 2002).
Climate changes reduced river runoff and increased nutrient input into the Littorina
Sea (Andrén et al., 2000a). A permanent halocline was established and flora and
fauna changed to more marine species (Andrén et al., 2000a). The following
Littorina stage was the most marine stage in the history of the Baltic Sea with
salinity values as high as 10-15 ‰ (modern: 7-8‰; Andrén et al., 2000b;
Gustafsson and Westman, 2002; Zillén et al., 2008). The strong pycnocline and the

Chapter 1 – Introduction
14
increased primary production, dominated by cyanobacteria (Andrén et al., 2000a),
most likely lead to hypoxic bottom waters as far north as the Bothnian Sea and Bay
(Zillén and Conley, 2010). In the deep central Baltic basins, hypoxic bottom waters
probably have been established since the first salt water intrusion (Sohlenius et al.,
1996). In these basins, sediments changed to laminated clay gyttja (clay with 6-30%
organic matter) containing pyrite (Sohlenius et al., 1996).
1.4.5 Post-Littorina Sea (~4,000-present cal. yr. BP)
From ~4,000 cal. yr. BP on, salinity started to drop considerably. The Kattegat
connection was reduced in size by isostatically induced sea level changes and less
salt water was flowing in (Zillén and Conley, 2010). The flora and fauna shifted back
to more freshwater species (Andrén et al., 2000a). Fewer saltwater inflows lead to a
weakened pycnocline and the end of anoxia in the northern Baltic Sea. The main
physicochemical conditions established during this time have not changed until
today and conditions of the basin were very similar to the modern ones (Zillén and
Conley, 2010).
From ~2,000 cal. yr. BP on, warmer climate phases and human activities influenced
the Baltic Sea. Warmer climates during Roman (100-400 AD) and Medieval times
(1000-1100 AD) lead to increased primary production and hypoxia (Andrén et al.,
2000a; Andrén et al., 2000b; Leipe et al., 2008). Growing populations around the
Baltic and greater land use during the early-Medieval expansion (800-1300 AD)
enhanced these processes (Zillén and Conley, 2010). In contrast to the warmer
periods before, a cold phase from ~1300-1850 AD (including the Little Ice Age) with
reduced salt water inflows and a population decline during the late-Medieval crisis
(~1300 AD) caused more oxic conditions and a reduced primary production (Leipe
et al., 2008; Zillén and Conley, 2010).
Human population growth increased from the 18th century, including a boom which
occurred after 1850 with the Industrial Revolution. This change had a considerable
impact on the Baltic Sea. Modern agriculture, deforestation and synthetic fertilizers
lead to eutrophication of the Baltic Sea and a strong increase in primary production
that caused expanding hypoxia which remains today (Jonsson and Carman, 1994;
Zillén and Conley, 2010).
Chapter 1 – Introduction
15
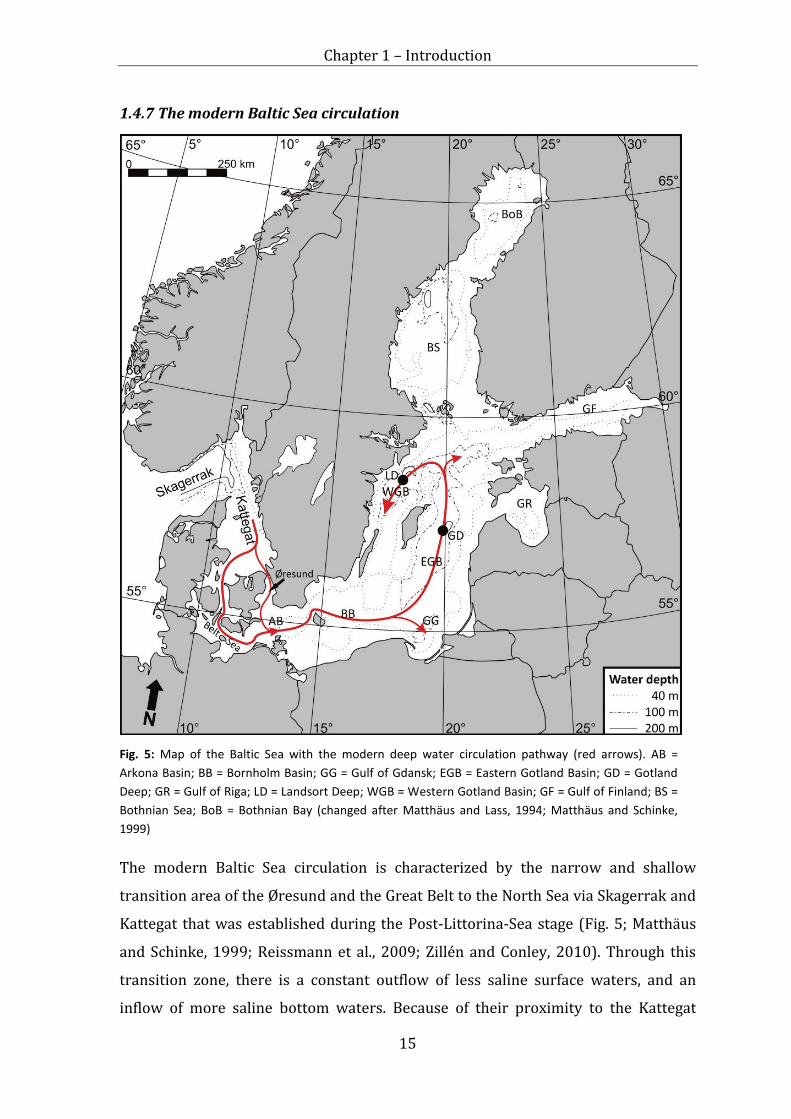
1.4.7 The modern Baltic Sea circulation
The modern Baltic Sea circulation is characterized by the narrow and shallow
transition area of the Øresund and the Great Belt to the North Sea via Skagerrak and
Kattegat that was established during the Post-Littorina-Sea stage (Fig. 5; Matthäus
and Schinke, 1999; Reissmann et al., 2009; Zillén and Conley, 2010). Through this
transition zone, there is a constant outflow of less saline surface waters, and an
inflow of more saline bottom waters. Because of their proximity to the Kattegat
Fig. 5: Map of the Baltic Sea with the modern deep water circulation pathway (red arrows). AB = Arkona Basin; BB = Bornholm Basin; GG = Gulf of Gdansk; EGB = Eastern Gotland Basin; GD = Gotland Deep; GR = Gulf of Riga; LD = Landsort Deep; WGB = Western Gotland Basin; GF = Gulf of Finland; BS = Bothnian Sea; BoB = Bothnian Bay (changed after Matthäus and Lass, 1994; Matthäus and Schinke, 1999)
Chapter 1 – Introduction
16
(surface salinity (dimensionless) ~17; bottom salinity ~30), salinity is generally
higher e.g. in the Arkona and Bornholm Basin (surface ~7-10; bottom ~20) and
Eastern Gotland Basin (surface ~7; bottom ~12) than in the Western Gotland Basin
(surface ~6; bottom ~10), the Bothnian Sea (~6) and the Bothnian Bay (~3; Winsor
et al., 2001; Stal et al., 2003; Reissmann et al., 2009).
Large amounts of saline waters from the North Sea, however, can only enter the
Baltic Sea under very specific meteorological conditions including continuous zonal
winds, sea level and density differences (Matthäus and Lass, 1995; Meier et al., 2006;
Reissmann et al., 2009). Significant inflows (Major Baltic Inflows, MBIs) were
observed in 1993 and another, although considerably smaller with respect to water
volume, salinity and oxygenation, in 2003 (Feistel et al., 2006). The inflow of 1993
was able to end a stagnation period in the Eastern Gotland Basin that had continued
since 1977 (Matthäus and Lass, 1995), but was not strong enough to have a
considerable influence on the deeper water layers of the Western Gotland Basin and
the Landsort Deep (Bergström and Matthäus, 1996). The entering saline waters are
diluted by turbulent mixing and entrainment of less saline water masses and they
ultimately are no longer dense enough to reach more distant basins as bottom
currents. Thus, the central Baltic deep waters are only sporadically ventilated
(Matthäus and Lass, 1995; Meier et al., 2006). Only such strong MBIs of dense saline
waters as the ones from 1993 and 2003 have the potential to propagate through the
system of successional sills and basins into the Eastern, and finally, the Western
Gotland Basin (Matthäus and Lass, 1995; Matthäus and Schinke, 1999).
1.5 Sampling and analytical methods
1.5.1 Sampling
Particulate organic carbon (POC) from water column samples includes
phytoplankton, zooplankton, bacteria and archaea, but can also contain pollen or
other parts of land plants. POC can be sampled either using filters or sediment traps
(Fig. 6).
Sediment traps gather sinking particles. Collected POC in these traps reflect an
integrated signal of the material derived from the water column above. Thus,
sediment traps cannot give information about the exact origin of the POC within the
water column and are rather used for the estimation of sediment or surface

Chapter 1 – Introduction
17
productivity fluxes (Harvey, 2006).
Filtering, instead, allows selective
sampling of different water depths.
As in our studies, POC often is
collected using glass fiber filters with
certain pore sizes (nominally 0.7
µm) and pore sizes thus define the
lower size boundary of POC (Harvey,
2006). In the following chapters,
water samples were taken with an in
situ pump (with the exception of
chapter 3, where samples were
taken with a pump-CTD connected to filtration on board). The pump was supplied
with a glass fiber filter and remained for several hours in the relevant water depth
and filtered up to ~250 l. This method allows sampling of distinct water layers
within the oxic, suboxic and anoxic zones.
Surface sediments were sampled with a “Frahmlot” that yielded undisturbed surface
layers and up to 1 m of deeper sediments. A gravity corer was used to recover an
11.6 m long sediment core covering all stages of the Baltic Sea Holocene history.
1.5.2 Extraction, fractionation and analysis of biomarkers
For a detailed description of extraction methods, see chapter 2. Briefly, filters and
sediment samples were freeze dried. Filters were then cut into small pieces, and
sediment samples were homogenized. Both were then extracted three times using a
mixture of dichloromethane (DCM)/methanol (MeOH) (3:1; v:v) and a CEM Mars 5
microwave (Matthews, NC, USA). The extracts were combined.
The total extracts were further divided into hydrocarbons, ketones and alcohols, and
fatty acids by column chromatography (for exact methods applied, see for example
chapter 3). Analysis was done with gas chromatography – mass spectrometry (GC-
MS). In GC-MS, the compounds of the vaporized sample are separated by a heated
capillary column (stationary phase) and a continuous flow of a carrier gas (mobile
phase, helium in the case of the following studies). Individual compounds become
mobile again depending on the affinity for the stationary phase of the column and
Fig. 6: Sediment trap and in situ pump sampling. Particles sampled with sediment traps (left) are derived from the complete overlying water column. In situ pumping (right) allows sampling of distinct water layers.

Chapter 1 – Introduction
18
their relative vapor pressure. The released uncharged molecules become positively
ionized and fragmented under high vacuum in the ion source of the mass
spectrometer. The ions are accelerated and mass separated in the homogenous
magnetic field of the quadrupole mass analyzer. The resulting ion current is
intensified and finally detected. In GC-combustion isotope ratio mass spectrometry
(GC-C-IRMS), the compounds are combusted and oxidized after column separation.
Water is removed from the resulting CO2 before it enters the IRMS. The molecules
are ionized, accelerated and mass sorted according to their isotopic composition.
Most BHPs are highly functionalized and too amphiphilic for analysis by GC-MS. GC-
MS analysis is only possible by the treatment of BHPs with periodic acid (oxidation
of the 1,2-diols yielding aldehyde products) and sodium borohydrate (reduction of
the aldehyde products to terminal alcohols), but this leads to a loss of structural
information of the side chain (Talbot et al., 2001). Thus, BHPs are analyzed by liquid
chromatography-mass spectrometry (LC-MS) that allows for identification of
complex and highly polar molecules. In LC-MS, a liquid mobile phase with gradually
changing polarities is used for mobilization of the compounds from the capillary
column instead of the temperature program applied in GC-MS. The sample is
vaporized before entry into the mass spectrometer. The molecules become ionized
and are processed as described for GC-MS.
1.6 Introduction to the following chapters
A comparison of different extraction methods with respect to bacteriohopanepolyols
(BHPs) is discussed in Chapter 2 (“Test of microwave, ultrasound and Bligh & Dyer
extraction for quantitative extraction of bacteriohopanepolyols (BHPs) from marine
sediments”). All methods are applicable for the extraction of BHPs and microwave
extraction was the method preferentially used in the following chapters. [Own
contribution: First author; reprocessing of samples, measurements, interpretation,
discussion, writing.]
In chapter 3, the general distribution of biomarkers in the stratified central Baltic
Sea water column was analyzed with samples collected in the Landsort Deep
(“Biomarkers in the stratified water column of the Landsort Deep (Baltic Sea)”).
[Own contribution: First author; reprocessing of samples, measurements,
interpretation, discussion, writing.]
Chapter 1 – Introduction
19
First results on aerobic methanotrophy in the Baltic Sea Gotland Deep are presented
in Chapter 4 (“Aerobic methanotrophy within the pelagic redox-zone of the Gotland
Deep (central Baltic Sea)”). Interdisciplinary methods performed on water samples
collected in summer 2008 gave information about the amount of methane consumed
and the bacteria involved in the suboxic zone. [Own contribution: Co-Author; partial
reprocessing of samples, contribution to interpretation, discussion, writing.]
In Chapter 5 (“Biomarkers for aerobic methanotrophy in the water column of the
stratified Gotland Deep (Baltic Sea)”), Gotland Deep samples collected in summer
2008 were further analyzed with respect to molecular biomarkers. BHPs were of
special interest. It was shown that suboxic zone BHP production controls BHP
signals in the underlying surface sediment. [Own contribution: First author;
reprocessing of samples, measurements, interpretation, discussion, writing.]
The geological record of BHPs in sediments and their applicability to reconstruct
water column stratification during the Baltic Sea Holocene history is discussed in
chapter 6 (“Bacteriohopanepolyols record stratification, nitrogen fixation and other
biogeochemical perturbations in Holocene sediments of the central Baltic Sea”).
[Own contribution: Co-Author; partial reprocessing of samples, BHP measurements,
contribution to writing.]
References
Anderson, R., Winter, C., Jürgens, K., 2012. Protist grazing and viral lysis as
prokaryotic mortality factors at Baltic Sea oxic-anoxic interfaces. Marine Ecology
Progress Series 467, 1-14.
Andrén, E., Andrén, T., Kunzendorf, H., 2000a. Holocene history of the Baltic Sea as a
background for assessing records of human impact in the sediments of the Gotland
Basin. The Holocene 10, 687-702.
Andrén, E., Andrén, T., Sohlenius, G., 2000b. The Holocene history of the
southwestern Baltic Sea as reflected in a sediment core from the Bornholm Basin.
Boreas 29.
Chapter 1 – Introduction
20
Bange, H.W., Rixen, T., Johansen, A.M., Siefert, R.L., Ramesh, R.L., Ittekott, V.,
Hoffmann, M.R., Andreae, M.O., 2000. A revised nitrogen budget for the Arabian Sea.
Global Biogeochemical Cycles 14, 1283-1297.
Behnke, A., Bunge, J., Barger, K., Breiner, H.-W., Alla, V., Stoeck, T., 2006.
Microeukaryote community patterns along an O2/H2S gradient in a supersulfidic
anoxic fjord (Framvaren, Norway). Applied and Environmental Microbiology 72,
3626-3636.
Bergström, S., Matthäus, W., 1996. Meteorology, hydrology and hydrography. In:
Third periodic assessment of the state of the marine environment of the Baltic Sea,
1989-1993; Background document HELCOM, Helsinki.
Berry, A.M., Moreau, R.A., Jones, A.D., 1991. Bacteriohopanetetrol: abundant lipid in
Frankia cells and in nitrogen-fixing nudule tissue. Plant Physiology 95, 111-115.
Björck, S., 1995. A review of the history of the Baltic Sea, 13.0-8.0 ka BP. Quaternary
International 27, 19-40.
Blumenberg, M., Hoppert, M., Krüger, M., Dreier, A., Thiel, V., 2012. Novel findings on
hopanoid occurrences among sulfate reducing bacteria: Is there a direct link to
nitrogen fixation? Organic Geochemistry 49, 1-5.
Blumenberg, M., Oppermann, B.I., Guyoneaud, R., Michaelis, W., 2009. Hopanoid
production by Desulfovibrio bastinii isolated from oilfield formation water. FEMS
Microbiology Letters 293, 73-78.
Brocks, J.J., Grice, K., 2011. Biomarkers (molecular fossils). In: Reitner, J., Thiel, V.,
Encyclopedia of Geobiology. Springer, Dordrecht, The Netherlands, pp. 147-167.
Brocks, J.J., Pearson, A., 2005. Building the biomarker tree of life. Reviews in
Mineralogy and Geochemistry 59, 233-258.
Campbell, N.A., Reece, J.B., 2003. Biologie, 6th Edition. Spektrum Akademischer
Verlag, Heidelberg, Berlin.

Chapter 1 – Introduction
21
Colling, A., Brown, E., Park, D., Philips, J., Rothery, D., Wright, J., 2001. Ocean
Circulation. Butterworth Heinemann, Oxford.
Detmer, A.E., Giesenhagen, H.C., Trenkel, V.M., Auf dem Venne, H., Jochem, F., 1993.
Phototrophic and hetreotrophic pico- and nanoplankton in anoxic depths of the
central Baltic Sea. Marine Ecology Progress Series 99, 197-203.
Diaz, R.J., Rosenberg, R., 1995. Marine benthic hypoxia: a review of its ecological
effects and the behavioural responses of benthic macrofauna. Oceanography and
Marine Biology: an annual Review 33, 245-303.
Diaz, R.J., Rosenberg, R., 2008. Spreading dead zones and consequences for marine
ecosystems. Science 321, 926-929.
Edgcomb, V.P., Pachiadaki, M., 2014. Ciliates along oxyclines or permanently
stratified marine water columns. Journal of Eukaryotic Microbiology 0, 1-12.
Feistel, R., Nausch, G., Hagen, E., 2006. Unusual Baltic inflow activity in 2002-2003
and varying deep-water properties. Oceanologia 48, 21-35.
Gustafsson, B.G., Westman, P., 2002. On the causes of salinity variations in the Baltic
Sea during the last 8500 years. Paleoceanography 17, 12-11-12-14.
Harvey, H.R., 2006. Sources and cycling of organic matter in the marine water
column. In: Volkmann, J.K., The handbook of environmental chemistry, Volume 2:
Marine organic matter. Springer, Berlin, Heidelberg, pp. 1-25.
Helly, J.J., Levin, L.A., 2004. Global distribution of naturally occurring marine hypoxia
on continental margins. Deep-Sea Research I 51, 1159-1168.
Jonsson, P., Carman, R., 1994. Changes in deposition of organic matter and nutrients
in the Baltic Sea during the twentieth century. Marine Pollution Bulletin 28, 417-426.
Kannenberg, E.L., Poralla, K., 1999. Hopanoid biosythesis and function in bacteria.
Naturwissenschaften 86, 168-176.
Konhauser, K., 2007. Introduction to Geomicrobiology. Blackwell Publishing, Oxford.

Chapter 1 – Introduction
22
Konovalov, S.K., Murray, J.W., Luther III, G.W., 2005. Basic processes of Black Sea
biogeochemistry. Oceanography 18, 24-35.
Leipe, T., Dippner, J.W., Hille, S., Voss, M., Christiansen, C., Bartholdy, J., 2008.
Environmental changes in the central Baltic Sea during the past 1000 years:
inferences from sedimentary records, hydrography and climate. Oceanologia 50, 23-
41.
Mandernack, K.W., Krouse, H.R., Skei, J.M., 2003. A stable sulfur and oxygen isotopic
investigation of sulfur cycling in an anoxic marine basin, Framvaren Fjord, Norway.
Chemical Geology 195, 181-200.
Matthäus, W., Lass, H.U., 1995. The recent salt inflow into the Baltic Sea. Journal of
Physical Oceanography 25, 280-286.
Matthäus, W., Schinke, H., 1999. The influence of river runoff on deep water
conditions of the Baltic Sea. Hydrobiologia 393, 1-10.
Meier, H.E.M., Feistel, R., Piechura, J., Arneborg, L., Burchard, H., Fiekas, V., Golenko,
N., Kuzmina, N., Mohrholz, V., Nohr, C., Paka, V.T., Sellschopp, J., Stips, A., Zhurbas, V.,
2006. Ventilation of the Baltic Sea deep water: A brief review of present knowledge
from observations and models. Oceanologia 48, 133-164.
Meyer, K.M., Kump, L.R., 2008. Oceanic euxinia in earth history: causes and
consequences. Annual Review of Earth and Planetary Sciences 36, 251-288.
Moros, M., Lemke, W., Kuijpers, A., Endler, R., Jensen, J.B., Bennike, O., Gingele, F.,
2002. Regressions and transgressions of the Baltic basin refelcted by a new hogh-
resolution deglacial and postglacial lithostratigraphy for Arkona Basin sediments
(western Baltic Sea). Boreas 31, 151-162.
Neunlist, S., Rohmer, M., 1985. Novel hopanoids from the methylotrophic bacteria
Methylococcus capsulatus and Methylomonas methanica. (22S)-35-
aminobacteriohopane-30,31,31,33,34-pentol and (22S)-35-amino-3β-
methylbacteriohopane-30,31,32,33,34-pentol. Biochemical Journal 231, 635-639.
Chapter 1 – Introduction
23
Ourisson, G., Albrecht, P., 1992. Hopanoids. 1. Geohopanoids: The most abundant
natural products on earth? Accounts of Chemical Research 25, 398-402.
Overmann, J., Cypionka, H., Pfennig, N., 1992. An extremely low-light-adapted
phototrophic sulfur bacterium from the Black Sea. Limnology and Oceanography 37,
150-155.
Pancost, R.D., Pagani, M., 2006. Controls on the carbon isotopic compositions of
lipids in marine environments. In: Volkman, J.K., The handbook of environmental
chemistry, Volume 2: Marine organic matter. Springer, Berlin, Heidelberg, pp. 209-
249.
Pearson, A., Flood Page, S.R., Jorgensen, T.L., Fischer, W.W., Higgins, M.B., 2007. Novel hopanoid cyclases from the environment. Environmental Microbiology 9, 2175-2188.
Peters, K.E., Walters, C.C., Moldowan, J.M., 2004. The biomarker guide, Volume 1, 2nd
Edition. Cambridge University Press, Cambridge.
Reissmann, J.H., Burchard, H., Feistel, R., Hagen, E., Lass, H.U., Mohrholz, V., Nausch,
G., Umlauf, L., Wieczorek, G., 2009. State-of-the-art review on vertical mixing in the
Baltic Sea and consequences for eutrophication. Progress in Oceanography 82, 47-
80.
Rohmer, M., Bouvier-Nave, P., Ourisson, G., 1984. Distribution of hopanoid
triterpenes in prokaryotes. Journal of General Microbiology 130, 1137-1150.
Sohlenius, G., Sternbeck, J., Andrén, E., Westman, P., 1996. Holocene history of the
Baltic Sea as recorded in a sediment core from the Gotland deep. Marine Geology
134.
Stal, L.J., Albertano, P., Bergmann, B., von Bröckel, K., Gallon, J.R., Hayes, P.K., Sivonen,
K., Walsby, A.E., 2003. BASIC: Baltic Sea cyanobacteria. An investigation of the
structure and dynamics of water blooms of cyanobacteria in the Baltic Sea -
responses to a changing environment. Continental Shelf Research 23, 1695-1714.

Chapter 1 – Introduction
24
Stock, A., Jürgens, K., Bunge, J., Stoeck, T., 2009. Protistan diversity in suboxic and
anoxic waters of the Gotland Deep (Baltic Sea) as revealed by 18S rRNA clone
libraries. Aquatic Microbial Ecology 55, 267-284.
Strauss, H., 2006. Anoxia through time. In: Neretin, L.N., Past and Present Water
Column Anoxia. Springer Netherlands, pp. 3-19.
Talbot, H.M., Watson, D.F., Murrel, J.C., Carter, J.F., Farrimond, P., 2001. Analysis of
intact bacteriohopanepolyols from methanotrophic bacteria by reversed-phase high-
performance liquid chromatography-atmospheric pressure chemical ionisation
mass spectrometry. Journal of chromatography A 921, 175-185.
Tyson, R.V., Pearson, T.H., 1991. Modern and ancient continental shelf anoxia: an
overview. Geological Society Special Publication 58, 1-24.
Wakeham, S.G., Amann, R., Freeman, K.H., Hopmans, E.C., Jørgensen, B.B., Putnam,
I.F., Schouten, S., Sinninghe Damsté, J.S., Talbot, H.M., Woebken, D., 2007. Microbial
ecology of the stratified water column of the Black Sea as revealed by a
comprehensive biomarker study. Organic Geochemistry 38, 2070-2097.
Wakeham, S.G., Turich, C., Schubotz, F., Podlaska, A., Xiaona, N.L., Varela, R., Astor, Y.,
Sáenz, J.P., Rush, D., Sinninghe Damsté, J.S., Summons, R.E., Scranton, M.I., Taylor,
G.T., Hinrichs, K.U., 2012. Biomarkers, chemistry and microbiology show
chemoautotrophy in a multilayer chemocline in the Cariaco Basin. Deep Sea
Research Part I 163, 133-156.
Wastegård, S., Andrén, T., Sohlenius, G., Sandgren, P., 1995. Different phases of the
Yoldia Sea in the North-Western Baltic proper. Quaternary International 27, 121-
129.
Winsor, P., Rodhe, J., Omstedt, A., 2001. Baltic Sea ocean climate: an analysis of 100
yr of hydrographic data with focus on the freshwater budget. Climate Research 18,
5-15.
Zaitsev, Y.P., 1992. Recent changes in the trophic structure of the Black Sea. Fisheries
Oceanography 1, 180-189.

Chapter 1 – Introduction
25
Zaitsev, Y.P., Mamaev, V., 1997a. Main man-made impacts on Black Sea Biodiversity.
In, Biological diversity in the Black Sea: a study of change and decline. United
Nations Publications, New York, pp. 49-74.
Zaitsev, Y.P., Mamaev, V., 1997b. Present state of Black Sea Biodiversity. In,
Biological diversity in the Black Sea: a study of change and decline. United Nations
Publications, New York, pp. 75-130.
Zillén, L., Conley, D.J., 2010. Hypoxia and cyanobacteria blooms - are they really
natural features of the late Holocene history of the Baltic Sea? Biogeosciences 7,
2567-2580.
Zillén, L., Conley, D.J., Andrén, T., Andrén, E., Björck, S., 2008. Past occurrences of
hypoxia in the Baltic Sea and the role of climate variability, environmental chnage
and human impact. Earth-Science Reviews 91, 77-92.

26

Chapter 2 – Test of microwave, ultrasound and Bligh & Dyer extraction
27
2
Test of microwave, ultrasound and Bligh & Dyer extraction for quantitative extraction of bacteriohopanepolyols
(BHPs) from marine sediments
Christine Berndmeyer, Volker Thiel and Martin Blumenberg
Organic Geochemistry (2014) 68, 90-94.
DOI: 10.1016/j.orggeochem.2014.01.003; reprinted with permission of Elsevier
2.1 Abstract
Microwave, ultrasound and Bligh & Dyer extraction methods were tested for the
yield of bacteriohopanepolyols (BHPs) from sediments and their potential to bias
compound distributions. Differences in the concentration of abundant BHPs were
not apparent for the three methods. However, the two phase solvent Bligh & Dyer
extraction method generally showed greater extraction efficiency for minor BHPs
containing an amino group. Our comparison demonstrates that all three methods
are suitable for the extraction of BHPs, but quantitative comparisons of individual
compounds between studies using different extraction approaches may be biased
due to different extraction efficiency for amino BHPs.
2.2 Introduction
Bacteriohopanepolyols (BHPs) are increasingly used because of their potential in
paleoreconstruction and for the characterization of viable bacterial communities
(e.g. Farrimond et al., 2000; Blumenberg et al., 2007, 2009, 2013; Talbot and
Farrimond, 2007; Wakeham et al., 2007; Sáenz et al., 2011a; Berndmeyer et al.,
2013). A number of methods have been applied to extract BHPs from sediments,
microbial cells and other geobiological samples, those based on single phase solvent
mixtures [usually dichloromethane (DCM) and MeOH] being particularly common.
For example, single phase solvent mixtures are used in combination with microwave
extraction (Schmidt et al., 2010; Berndmeyer et al., 2013; Blumenberg et al., 2013)
or in combination with ultrasound and/or temperature (e.g. Talbot et al., 2003a,b;

Chapter 2 – Test of microwave, ultrasound and Bligh & Dyer extraction
28
Sinninghe Damste et al., 2004; Blumenberg et al., 2009). Another widely used
method for the extraction of BHPs is the so called Bligh & Dyer extraction (Bligh and
Dyer, 1959) using a monophase mixture for extraction consisting of CHCl3 (or DCM),
MeOH and water or phosphate- buffered water, followed by a two phase separation
to produce the organic extract (Summons et al., 1994; Jahnke et al., 1999; Cooke et
al., 2008, 2009; Rethemeyer et al., 2010; Sáenz et al., 2011a, 2012; Doğrul Selver et
al., 2012; Kharbush et al., 2013). For many widely used biomarkers, like intact polar
lipids (IPLs) or fatty acids, there are comparative investigations of the extraction
efficiency of different methods (e.g. Macnaughton et al., 1997; Lewis et al., 2000;
Iverson et al., 2001; Blyth et al., 2006; Jansen et al., 2006; Péres et al., 2006; Huguet
et al., 2010), but this is lacking for BHPs. In this study, we have compared the widely
used single solvent mixture of DCM/MeOH, supported by microwave and
ultrasound, respectively, with the common Bligh & Dyer method. We focus on the
differences in extraction efficiency and effect on the relative abundance of individual
BHPs.
2.3 Methods
Two samples from the Baltic Sea Gotland Deep (sample 1) and Landsort Deep
(sample 2; both 6–8 cm sediment depth), collected in summer 2011, were freeze
dried and homogenized. Each was divided into 3 g aliquots and extracted using: (i)
microwave extraction, (ii) ultrasound extraction (both using a single phase solvent
mixture) and (iii) a modified Bligh & Dyer extraction using a monophase solvent
mixture for extraction followed by a two phase separation.
2.3.1 Microwave extraction
The two samples were extracted 3 x with a single phase mixture of DCM/MeOH (40
ml; 3:1, v:v) in a CEM Mars 5 device (Matthews, NC, USA). The microwave was
operated at 800 W as follows: heating to 60 °C over 10 min, extraction for 15 min,
cooling to room temperature over 20 min. The combined extracts were dried under
reduced pressure at 40 °C using a rotary evaporator.
Chapter 2 – Test of microwave, ultrasound and Bligh & Dyer extraction
29
2.3.2 Ultrasound extraction
The two samples were extracted with a single phase DCM/MeOH mixture (40 ml,
3:1, v:v) and sonicated (3 x 15 min) in a water bath (room temperature) with a
BANDELIN Sonorex digital 10P (Bandelin Electronics, Berlin, Germany). After
centrifugation (20 min, 2000 rpm), the combined extracts were dried as above.
2.3.3 Modified Bligh & Dyer extraction
The extraction was carried out as described by White and Ringelberg (1998), except
that CHCl3 was replaced with DCM, as increasingly done in recent studies (Rashby et
al., 2007; Pearson et al., 2008; Saenz et al., 2011a,b, 2012; Sessions et al., 2013). DCM
has very similar properties to CHCl3, but is less toxic; 11.4 ml of
MeOH/DCM/phosphate buffer (2:1:0.8, v:v; phosphate buffer: 8.7 g K2HPO4 in 1 l
nanopure water, adjusted to pH 7.4 with 6 N HCl) were added to the samples and the
mixture was sonicated in an ultrasonic bath (30 s only, so as not to bias via intensive
ultrasonication). Samples were then shaken on a shaker table for 60 min. They were
centrifuged (30 min, 2000 rpm) and the supernatant decanted into a separating
funnel. DCM and water were added to a final ratio of 1:1:0.9 MeOH/DCM/buffer. The
separating funnel was vigorously shaken and the aqueous (MeOH and water) phase
and organic phase (DCM) were allowed to separate overnight. The lower DCM phase
was obtained and dried as above.
2.3.4 Acetylation and liquid chromatography–mass spectrometry (LC–MS)
The extracts were acetylated using 2 ml Ac2O and pyridine (1:1, v:v) for 1 h at 50 °C
and left overnight at room temperature. LC–MS was performed using a Prostar
Dynamax high performance LC (HPLC) system coupled to a 1200L triple quadrupole
mass spectrometry (MS) instrument (both Varian) equipped with a Merck
Lichrocart [Lichrosphere 100; reversed phase (RP) C18e column (250 x 4 mm)] and a
Merck Lichrosphere pre-column of the same material. A solvent gradient profile of
100% A [MeOH/water (9:1v:v), 0–1 min] to 100% B [MeOH/propan-2-ol (1:1, v:v)]
at 35 min, then isocratic to 60 min was used. All solvents were HPLC grade (Fisher
Scientific). The LC–MS instrument was operated with an atmospheric pressure
chemical ionization (APCI) source in positive ion mode (capillary 150 °C, vaporizer
400 °C, corona discharge 8 µA, nebulizing flow 70 psi and auxiliary gas 17 psi). For
Chapter 2 – Test of microwave, ultrasound and Bligh & Dyer extraction
30
determination of concentration, peak areas of selected ions (SIM mode;
bacteriohopane-32,33,34,35-tetrol, m/z 655; 32,35-anhydrobacteriohopanetetrol,
m/z 613; 35-aminobacteriohopane-32,33,34-triol, m/z 714; 35-
aminobacteriohopane-31,32,33,34-tetrol, m/z 772; 35-aminobacteriohopane-
30,31,32,33,34-pentol, m/z 830; bacteriohopanetetrol cyclitol ether, m/z 1002, after
Talbot et al., 2008) were compared with an acetylated authentic BHT and 35-
aminobacteriohopanetriol standard with known concentrations (external
calibration). Amino BHPs had a 7x higher response factor than non-amino BHPs and
concentrations in the samples were corrected accordingly. Comparisons with elution
times of previously identified compounds were used for BHP assignment.
Concentration was corrected for individual responses of amino and non-amino
BHPs. Each aliquot was measured 5x.
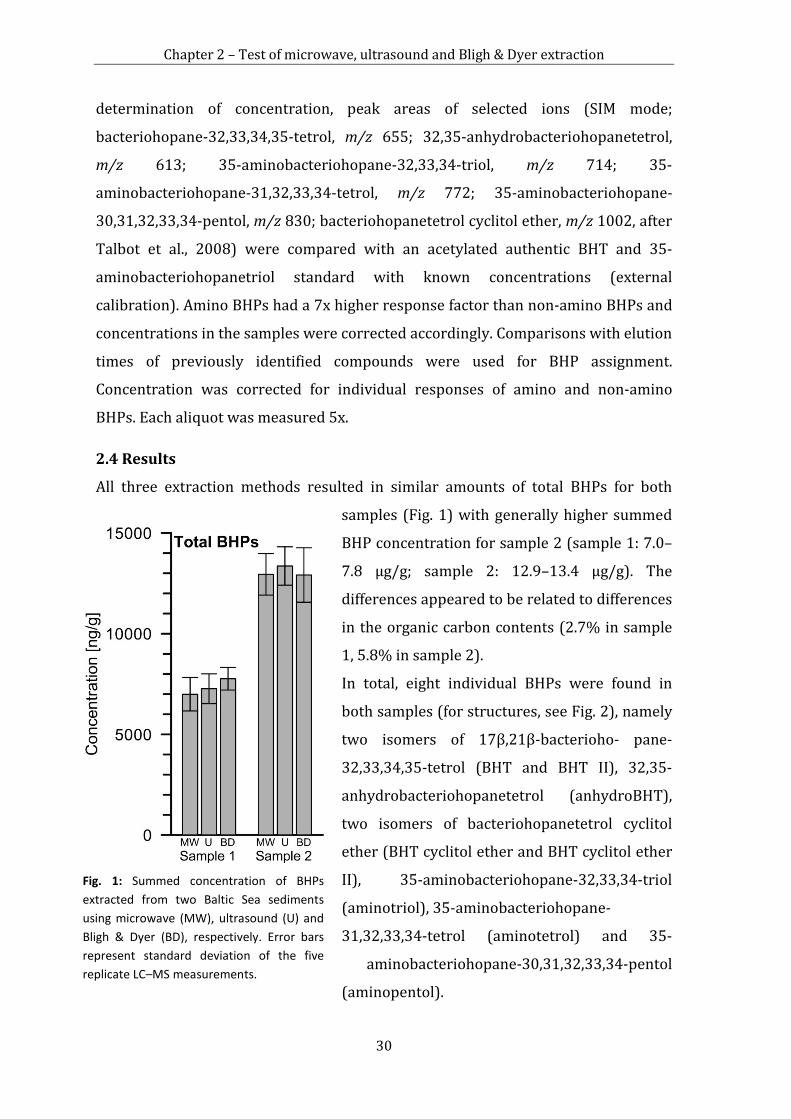
2.4 Results
All three extraction methods resulted in similar amounts of total BHPs for both
samples (Fig. 1) with generally higher summed
BHP concentration for sample 2 (sample 1: 7.0–
7.8 µg/g; sample 2: 12.9–13.4 µg/g). The
differences appeared to be related to differences
in the organic carbon contents (2.7% in sample
1, 5.8% in sample 2).
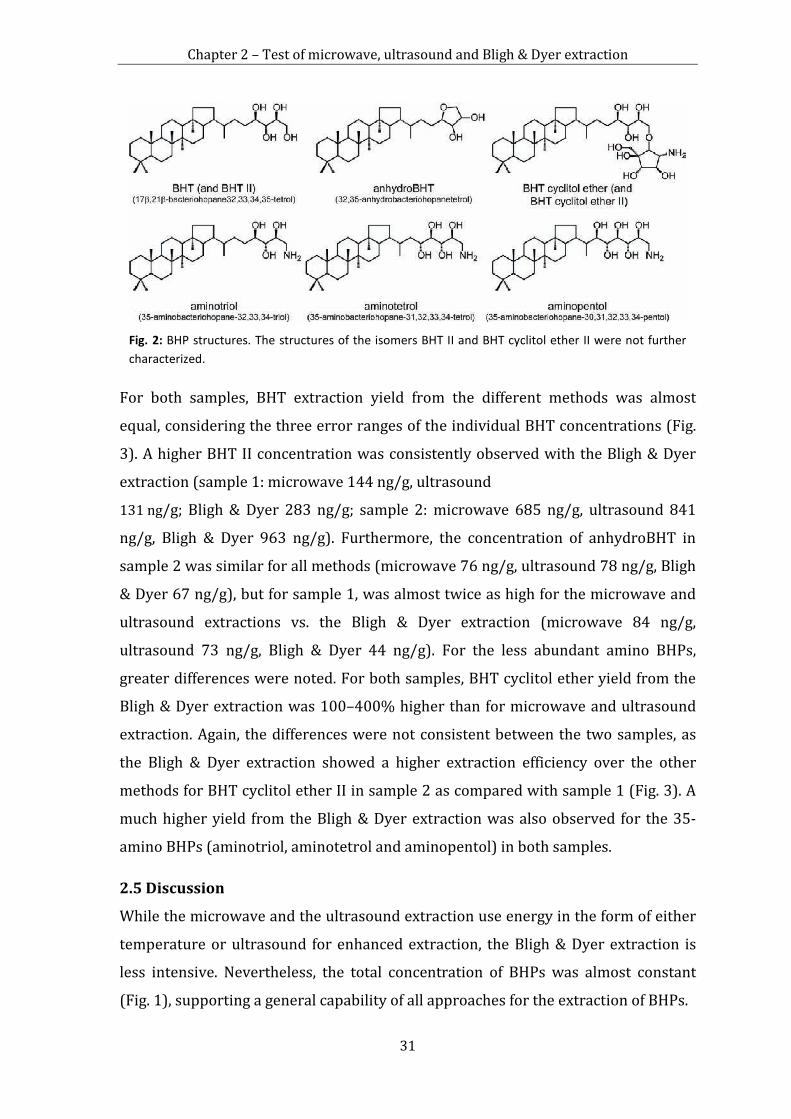
In total, eight individual BHPs were found in
both samples (for structures, see Fig. 2), namely
two isomers of 17β,21β-bacterioho- pane-
32,33,34,35-tetrol (BHT and BHT II), 32,35-
anhydrobacteriohopanetetrol (anhydroBHT),
two isomers of bacteriohopanetetrol cyclitol
ether (BHT cyclitol ether and BHT cyclitol ether
II), 35-aminobacteriohopane-32,33,34-triol
(aminotriol), 35-aminobacteriohopane-
31,32,33,34-tetrol (aminotetrol) and 35-
aminobacteriohopane-30,31,32,33,34-pentol
(aminopentol).
Fig. 1: Summed concentration of BHPs extracted from two Baltic Sea sediments using microwave (MW), ultrasound (U) and Bligh & Dyer (BD), respectively. Error bars represent standard deviation of the five replicate LC–MS measurements.
Chapter 2 – Test of microwave, ultrasound and Bligh & Dyer extraction
31
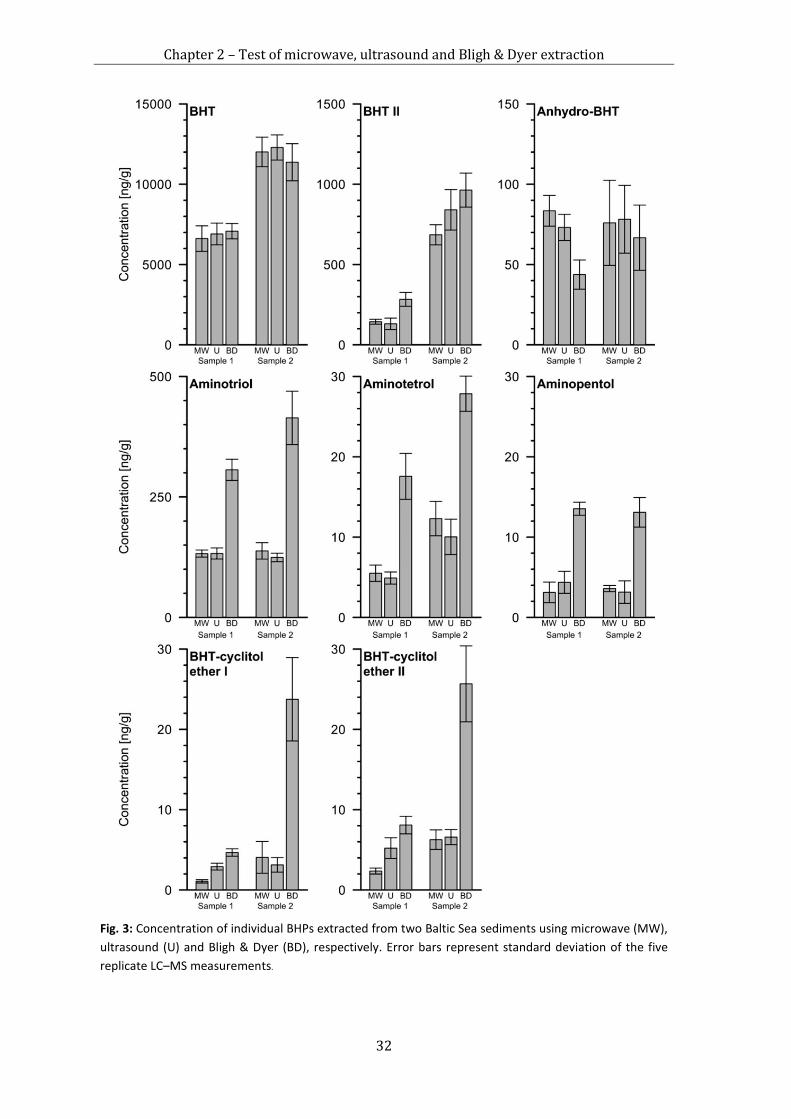
For both samples, BHT extraction yield from the different methods was almost
equal, considering the three error ranges of the individual BHT concentrations (Fig.
3). A higher BHT II concentration was consistently observed with the Bligh & Dyer
extraction (sample 1: microwave 144 ng/g, ultrasound
131 ng/g; Bligh & Dyer 283 ng/g; sample 2: microwave 685 ng/g, ultrasound 841
ng/g, Bligh & Dyer 963 ng/g). Furthermore, the concentration of anhydroBHT in
sample 2 was similar for all methods (microwave 76 ng/g, ultrasound 78 ng/g, Bligh
& Dyer 67 ng/g), but for sample 1, was almost twice as high for the microwave and
ultrasound extractions vs. the Bligh & Dyer extraction (microwave 84 ng/g,
ultrasound 73 ng/g, Bligh & Dyer 44 ng/g). For the less abundant amino BHPs,
greater differences were noted. For both samples, BHT cyclitol ether yield from the
Bligh & Dyer extraction was 100–400% higher than for microwave and ultrasound
extraction. Again, the differences were not consistent between the two samples, as
the Bligh & Dyer extraction showed a higher extraction efficiency over the other
methods for BHT cyclitol ether II in sample 2 as compared with sample 1 (Fig. 3). A
much higher yield from the Bligh & Dyer extraction was also observed for the 35-
amino BHPs (aminotriol, aminotetrol and aminopentol) in both samples.
2.5 Discussion
While the microwave and the ultrasound extraction use energy in the form of either
temperature or ultrasound for enhanced extraction, the Bligh & Dyer extraction is
less intensive. Nevertheless, the total concentration of BHPs was almost constant
(Fig. 1), supporting a general capability of all approaches for the extraction of BHPs.
Fig. 2: BHP structures. The structures of the isomers BHT II and BHT cyclitol ether II were not further characterized.
Chapter 2 – Test of microwave, ultrasound and Bligh & Dyer extraction
32
Fig. 3: Concentration of individual BHPs extracted from two Baltic Sea sediments using microwave (MW), ultrasound (U) and Bligh & Dyer (BD), respectively. Error bars represent standard deviation of the five replicate LC–MS measurements.

Chapter 2 – Test of microwave, ultrasound and Bligh & Dyer extraction
33
However, differences in the three methods became evident. Visually, the extracts
from the microwave and the ultrasound extractions appeared to contain much more
organic material (black color, thick and oily appearance). In contrast, the extracts
from the Bligh & Dyer extraction were golden in color. Differences were also obvious
in the LC chromatograms, as the peaks were sharper and the noise was considerably
lower for the Bligh & Dyer samples in agreement with a previous study comparing
Bligh & Dyer extraction with a number of other procedures (Cooke, 2011). Thus, in
contrast to Bligh & Dyer, the more energy intensive microwave and ultrasound
methods obviously led to extraction of much more, non-LC amenable material.
The concentration of BHT showed only minor variation. The isomer BHT II
appeared, however, to be slightly more efficiently extracted with Bligh & Dyer (Fig.
3). Interestingly, it appeared that BHT II showed an improved signal with the Bligh &
Dyer extraction, as the LC–MS peak shapes were much cleaner and sharper (signal to
noise ratio for BHT II: sample 1: microwave 13, ultrasound 12, Bligh & Dyer 19;
sample 2: microwave 30, ultrasound 28, Bligh & Dyer 37) and the separation
between BHT and BHT II was much clearer than for the other methods.
Concentration of anhydroBHT was similar for all three methods with sample 2,
considering the error range of the individual concentration, but was elevated for
microwave and ultrasound extraction of sample 1 (Fig. 3). AnhydroBHT is assumed
to be a product of other BHPs, formed during early diagenesis (Talbot et al., 2005;
Schaeffer et al., 2008, 2010). Our results raise the question as to whether the more
energetic extraction methods (microwave and ultrasound) can lead to the formation
of anhydroBHT during extraction. Schaeffer et al. (2008, 2010) have shown that
anhydroBHT is formed under low pH, as induced by the presence of acidic clay
minerals such as montmorillonite and high temperature. Montmorillonite is the
dominating clay mineral in the sediments of the northern and middle Baltic proper
(Carman and Rahm, 1997), where the samples from the Gotland and Landsort Deep
were taken. Thus, the sediment matrix provided favorable conditions for the
formation of anhydroBHT in our samples. Schaeffer et al. (2008, 2010) treated their
samples for 3 h and 8 days, respectively, in the presence of montmorillonite at
120 °C. Although significant amounts of anhydroBHT were generated from BHT and
BHT cyclitol ether after 8 days, only trace amounts of anhydroBHT were found after
3 h. The microwave method, where the highest anhydroBHT concentration was

Chapter 2 – Test of microwave, ultrasound and Bligh & Dyer extraction
34
found, only uses a temperature of up to 60 °C for 15 min. Therefore, it is unlikely
that anhydroBHT was formed from other BHPs during extraction.
Regarding extraction of the 35-amino BHPs (aminotriol, aminotetrol and
aminopentol), an advantage of the Bligh & Dyer method became obvious. Although
the concentrations of these minor compounds obtained with microwave and
ultrasound extraction were reproducible for both samples, the yield was much
higher with the Bligh & Dyer extraction. Similar concentration differences were
observed for the BHT cyclitol ethers I and II, which also contain an amino group
(Renoux and Rohmer, 1985). At this point, however, we can only speculate about the
possible reasons for this observation. The possibility of amino BHP destruction by
relatively harsh (microwave and ultrasound) extraction methods seems unlikely, as
studies have shown that aminotriol does not decompose after 4 h acid treatment at
120 °C (Schaeffer et al., 2008). On the other hand, the solvent mixture in the Bligh &
Dyer extraction contains a water phase that causes cellular swelling. Therefore, the
cell walls would become more permeable for the solvent (Guckert and White, 1988).
Although the definite cell location of BHPs in general or that of individual BHPs (e.g.
35-amino BHPs) is not known for certain, such a cellular swelling effect of the Bligh
& Dyer extraction might particularly affect specific cell membranes rich in 35- amino
BHPs. This, however, remains to be clarified and we can only state that Bligh & Dyer
extraction in particular improves the extraction efficiency for 35-amino-BHPs.
2.6 Conclusions
With respect to the major BHPs, our work has shown that single phase solvent
extraction using microwave, ultrasound or Bligh & Dyer extraction gave similar
yields, with microwave and ultrasound revealing the closest similarity. For studies
aimed in particular at BHPs with an amino group, Bligh & Dyer extraction may,
however, be preferred due to higher recovery of this group of compounds. The
extraction method should therefore be taken into account when comparing BHP
distributions from different studies.
Acknowledgments
We thank C. Conradt for laboratory assistance, and T. Licha and K. Nödler for help
with LC–MS. We also thank O. Schmale for providing the sediment samples and D.
Rush and an anonymous reviewer for constructive comments. The German Research

Chapter 2 – Test of microwave, ultrasound and Bligh & Dyer extraction
35
Foundation (Deutsche Forschungsgemeinschaft, DFG) is acknowledged for financial
support (Grants BL 971/1-3 and 971/3-1).
References
Berndmeyer, C., Thiel, V., Schmale, O., Blumenberg, M., 2013. Biomarkers for aerobic
methanotrophy in the water column of the stratified Gotland Deep (Baltic Sea).
Organic Geochemistry 55, 103–111.
Bligh, E.G., Dyer, W.J., 1959. A rapid method of total lipid extraction and purification.
Canadian Journal of Biochemistry and Physiology 37, 911–917.
Blumenberg, M., Berndmeyer, C., Moros, M., Muschalla, M., Schmale, O., Thiel, V.,
2013. Bacteriohopanepolyols record stratification, nitrogen fixation and other
biogeochemical perturbations in Holocene sediments of the central Baltic Sea.
Biogeosciences 10, 2725–2735.
Blumenberg, M., Seifert, R., Kasten, S., Bahlmann, E., Michaelis, W., 2009. Euphotic
zone bacterioplankton sources major sedimentary bacteriohopanepolyols in the
Holocene Black Sea. Geochimica et Cosmochimica Acta 73, 750–766.
Blumenberg, M., Seifert, R., Michaelis, W., 2007. Aerobic methanotrophy in the oxic–
anoxic transition zone of the Black Sea water column. Organic Geochemistry 38, 84–
91.
Blyth, A.J., Farrimond, P., Jones, M., 2006. An optimised method for the extraction
and analysis of lipid biomarkers from stalagmites. Organic Geochemistry 37, 882–
890.
Carman, R., Rahm, L., 1997. Early diagenesis and chemical characteristics of
interstitial water and sediments in the deep deposition bottoms of the Baltic proper.
Journal of Sea Research 37, 25–47.
Chapter 2 – Test of microwave, ultrasound and Bligh & Dyer extraction
36
Cooke, M.P., 2011. The Role of Bacteriohopanepolyols as Biomarkers for Soil
Bacterial Communities and Soil derived Organic Matter. PhD Thesis, Newcastle
University, UK. <http://hdl.handle.net/10443/1139>.
Cooke, M.P., Talbot, H.M., Farrimond, P., 2008. Bacterial populations recorded in
bacteriohopanepolyol distributions in soils from Northern England. Organic
Geochemistry 39, 1347–1358.
Cooke, M.P., van Dongen, B.E., Talbot, H.M., Semiletov, I., Shakhova, N., Guo, L.,
Gustafsson, O., 2009. Bacteriohopanepolyol biomarker composition of organic
matter exported to the Arctic Ocean by seven of the major Arctic rivers. Organic
Geochemistry 40, 1151–1159.
Doğrul Selver, A., Talbot, H.M., Gustafsson, O., Boult, S., van Dongen, B.E., 2012. Soil
organic matter transport along an sub-Arctic river-sea transect. Organic
Geochemistry 51, 63–72.
Farrimond, P., Head, I.M., Innes, H.E., 2000. Environmental influence on the
biohopanoid composition of recent sediments. Geochimica et Cosmochimica Acta 64,
2985–2992.
Guckert, J.B., White, D.C., 1988. Evaluation of a hexane/isopropanol lipid solvent
system for analysis of bacterial phospholipids and application to chloroformsoluble
Nuclepore (polycarbonate) membranes with retained bacteria. Journal of
Microbiological Methods 8, 131–137.
Huguet, C., Martens-Habbena, W., Urakawa, H., Stahl, D.A., Ingalls, A.E., 2010.
Comparison of extraction methods for quantitative analysis of core and intact polar
glycerol dialkyl glycerol tetraethers (GDGTs) in environmental samples. Limnology
and Oceanography: Methods 8, 127–145.
Iverson, S.J., Lang, S.L.C., Cooper, M.H., 2001. Comparison of the Bligh and Dyer and
Folch methods for total lipid determination in a broad range of marine tissue. Lipids
36, 1283–1287.
Chapter 2 – Test of microwave, ultrasound and Bligh & Dyer extraction
37
Jahnke, L.L., Summons, R.E., Hope, J.M., Des Marais, D.J., 1999. Carbon isotopic
fractionation in lipids from methanotrophic bacteria II: the effects of physiology and
environmental parameters on the biosynthesis and isotopic signatures of
biomarkers. Geochimica et Cosmochimica Acta 63, 79–93.
Jansen, B., Nierop, K.G.J., Kotte, M.C., de Voogt, P., Verstraten, J.M., 2006. The
applicability of accelerated solvent extraction (ASE) to extract lipid biomarkers from
soils. Applied Geochemistry 21, 1006–1015.
Kharbush, J.J., Ugalde, J.A., Hogle, S.L., Allen, E.E., Aluwihare, L.I., 2013. Composite
bacterial hopanoids and their microbial producers across oxygen gradients in the
water column of the California Current. Applied and Environmental Microbiology,
79.
Lewis, T., Nichols, P.D., McMeekin, T.A., 2000. Evaluation of extraction methods for
recovery of fatty acids from lipid-producing microheterotrophs. Journal of
Microbiological Methods 43, 107–116.
Macnaughton, S.J., Jenkins, T.L., Wimpee, M.H., Cormier, M.R., White, D.C., 1997.
Rapid extraction of lipid biomarkers from pure cultures and environmental samples
using pressurized accelerated hot solvent extraction. Journal of Microbiological
Methods 31, 19–27.
Pearson, A., Leavitt, W.D., Sáenz, J.P., Summons, R.E., Tam, M.C.M., Close, H.G., 2008.
Diversity of hopanoids and squalene-hopene cyclases across a tropical land-sea
gradient. Environmental Microbiology 11, 1208–1223.
Péres, V.F., Saffi, J., Melecchi, M.I.S., Abad, F.C., de Assis Jacques, R., Martinez, M.M.,
Oliveira, E.C., Caramão, E.B., 2006. Comparison of soxhlet, ultrasound-assisted and
pressurized liquid extraction of terpenes, fatty acids and vitamin E from Piper
gaudichaudianum Kunth. Journal of Chromatography A 1105, 115–118.
Rashby, S.E., Sessions, A.L., Summons, R.E., Newman, D.K., 2007. Biosynthesis of 2-
methylbacteriohopanepolyols by an anoxygenic phototroph. Proceedings of the
National Academy of Sciences USA 104, 15099–15104.

Chapter 2 – Test of microwave, ultrasound and Bligh & Dyer extraction
38
Renoux, J.M., Rohmer, M., 1985. Prokaryotic triterpenoids: New
bacteriohopanetetrol cyclitol ethers from the methylotrophic bacterium
Methylobacterium organophilum. European Journal of Biochemistry 151, 405–410.
Rethemeyer, J., Schubotz, F., Talbot, H.M., Cooke, M.P., Hinrichs, K.U., Mollenhauer, G.,
2010. Distribution of polar membrane lipids in permafrost soils and sediments of a
small high Arctic catchment. Organic Geochemistry 41, 1130– 1145.
Sáenz, J.P., Eglinton, T.I., Summons, R.E., 2011a. Abundance and structural diversity
of bacteriohopanepolyols in suspended particulate matter along a river to ocean
transect. Organic Geochemistry 42, 774–780.
Sáenz, J.P., Wakeham, S.G., Eglinton, T.I., Summons, R.E., 2011b. New constraints on
the provenance of hopanoids in the marine geologic record: bacteriohopanepolyols
in marine suboxic and anoxic environments. Organic Geochemistry 42, 1351–1362.
Sáenz, J.P., Waterbury, J.B., Eglinton, T.I., Summons, R.E., 2012. Hopanoids in marine
cyanobacteria: probing their phylogenetic distribution and biological role.
Geobiology 10, 311–319.
Schaeffer, P., Schmitt, G., Adam, P., Rohmer, M., 2008. Acid-catalyzed formation of
32,35-anhydrobacteriohopanetetrol from bacteriohopanetetrol. Organic
Geochemistry 39, 1479–1482.
Schaeffer, P., Schmitt, G., Adam, P., Rohmer, M., 2010. Abiotic formation of 32,35-
anhydrobacteriohopanetetrol: a geomimetic approach. Organic Geochemistry 41,
1005–1008.
Schmidt, F., Hinrichs, K.U., Elvert, M., 2010. Sources, transport, and partitioning of
organic matter at a highly dynamic continetal margin. Marine Chemistry 118, 37–55.
Sessions, A.L., Zhang, L., Welander, P.V., Doughty, D., Summons, R.E., Newman, D.K.,
2013. Identification and quantification of polyfunctionalized hopanoids by high
temperature gas chromatography-mass spectrometry. Organic Geochemistry 56,
120–130.
Chapter 2 – Test of microwave, ultrasound and Bligh & Dyer extraction
39
Sinninghe Damste, J.S., Rijpstra, W.I.C., Schouten, S., Fuerst, J.A., Jetten, M.S.M., Strous,
M., 2004. The occurrence of hopanoids in planctomycetes: implications for the
sedimentary biomarker record. Organic Geochemistry 35, 561–566.
Summons, R.E., Jahnke, L.L., Roksandic, Z., 1994. Carbon isotopic fractionation in
lipids from methanotrophic bacteria: relevance for interpretation of the geochemical
record of biomarkers. Geochimica et Cosmochimica Acta 58, 2853–2863.
Talbot, H.M., Farrimond, P., 2007. Bacterial populations recorded in diverse
sedimentary biohopanoid distributions. Organic Geochemistry 38, 1212–1225.
Talbot, H.M., Farrimond, P., Schaeffer, P., Pancost, R.D., 2005. Bacteriohopanepolyols
in hydrothermal vent biogenic silicates. Organic Geochemistry 36, 663–672.
Talbot, H.M., Squier, A.H., Keely, B.J., Farrimond, P., 2003a. Atmospheric pressure
chemical ionisation reversed-phase liquid chromatography/ion trap mass
spectrometry of intact bacteriohopanepolyols. Rapid Communications in Mass
Spectrometry 17, 728–737.
Talbot, H.M., Summons, R.E., Jahnke, L.L., Cockell, C.S., Rohmer, M., Farrimond, P.,
2008. Cyanobacterial bacteriohopanepolyol signatures from cultures and natural
environmental settings. Organic Geochemistry 39, 232–263.
Talbot, H.M., Summons, R.E., Jahnke, L.L., Farrimond, P., 2003b. Characteristic
fragmentation of bacteriohopanepolyols during atmospheric pressure chemical
ionisation liquid chromatography/ion trap mass spectrometry. Rapid
Communications in Mass Spectrometry 17, 2788–2796.
Wakeham, S.G., Amann, R., Freeman, K.H., Hopmans, E.C., Jorgensen, B.B., Putnam,
I.F., Schouten, S., Sinninghe Damste, J.S., Talbot, H.M., Woebken, D., 2007. Microbial
ecology of the stratified water column of the Black Sea as revealed by a
comprehensive biomarker study. Organic Geochemistry 38, 2070–2097.
Chapter 2 – Test of microwave, ultrasound and Bligh & Dyer extraction
40
White, D.C., Ringelberg, D.B., 1998. Signature lipid biomarker analysis. In: Burlage,
R.S., Atlas, R., Stahl, D., Geesey, G., Sayler, G. (Eds.), Techniques in Microbial Ecology.
Oxford University Press, New York, pp. 255–272.
Chapter 3 – Biomarkers in the stratified water column of the Landsort Deep
41
3
Biomarkers in the stratified water column of the Landsort Deep (Baltic Sea)
Christine Berndmeyer, Volker Thiel, Oliver Schmale, Norbert Wasmund, and
Martin Blumenberg
Biogeosciences Discussions (2014) 11, 9853-9887.
DOI: 10.5194/bgd-11-9853-2014, Open Access
3.1 Abstract
The water column of the Landsort Deep, central Baltic Sea, is stratified into an oxic,
suboxic and anoxic zone. This stratification controls the distributions of individual
microbial communities and biogeochemical processes. In summer 2011, particulate
organic matter was filtered from these zones using an in situ pump. Lipid
biomarkers were extracted from the filters to establish water column profiles of
individual hydrocarbons, alcohols, phospholipid fatty acids, and
bacteriohopanepolyols (BHPs). As a reference, a cyanobacterial bloom sampled in
summer 2012 in the central Baltic Sea Gotland Deep was analyzed for BHPs. The
biomarker data from the surface layer of the oxic zone showed major inputs from
different cyanobacteria and eukaryotes such as dinoflagellates and ciliates, while the
underlying cold winter water layer was characterized by a low diversity and
abundance of organisms, with copepods as a major group. The suboxic zone
supported bacterivorous ciliates, type I aerobic methanotrophic bacteria, sulfate
reducing bacteria, and, most likely, methanogenic archaea. In the anoxic zone,
sulfate reducers and archaea were the dominating microorganisms as indicated by
the presence of distinctive branched fatty acids, archaeol and PMI derivatives,
respectively. Our study of in situ biomarkers in the Landsort Deep thus provided an
integrated insight into the distribution of relevant players and the related
biogeochemical processes in stratified water columns of marginal seas.
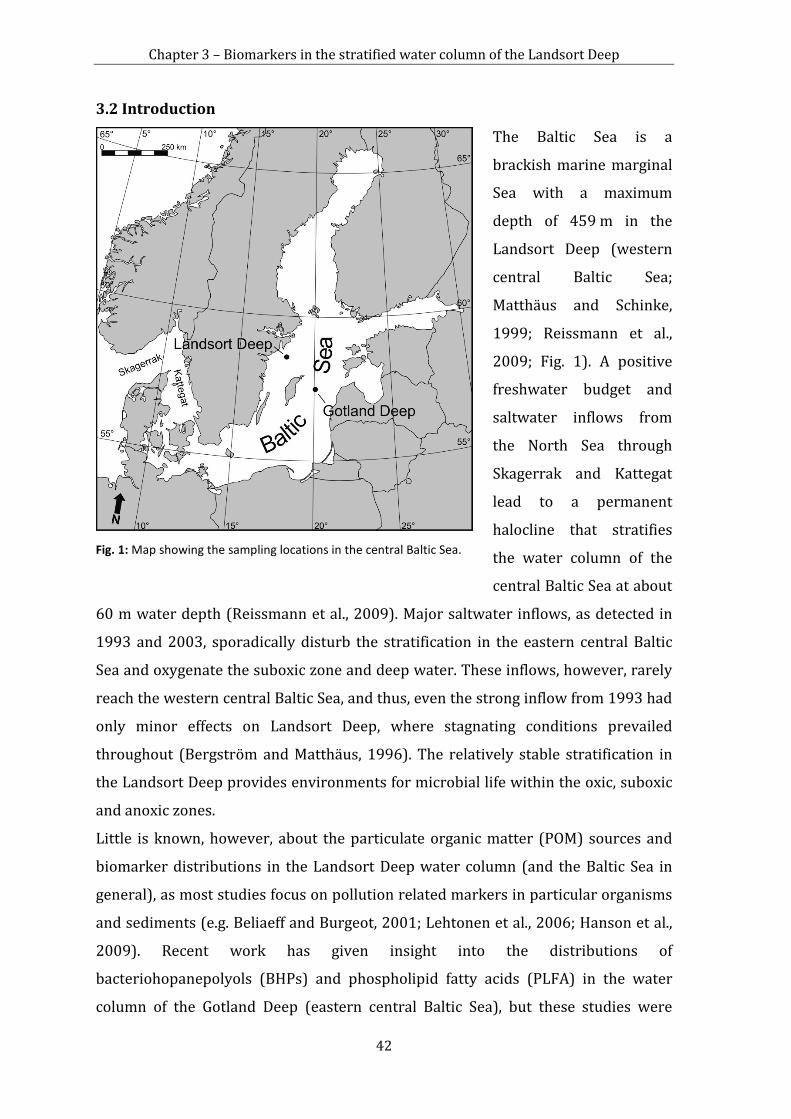
Chapter 3 – Biomarkers in the stratified water column of the Landsort Deep
42
3.2 Introduction
The Baltic Sea is a
brackish marine marginal
Sea with a maximum
depth of 459 m in the
Landsort Deep (western
central Baltic Sea;
Matthäus and Schinke,
1999; Reissmann et al.,
2009; Fig. 1). A positive
freshwater budget and
saltwater inflows from
the North Sea through
Skagerrak and Kattegat
lead to a permanent
halocline that stratifies
the water column of the
central Baltic Sea at about
60 m water depth (Reissmann et al., 2009). Major saltwater inflows, as detected in
1993 and 2003, sporadically disturb the stratification in the eastern central Baltic
Sea and oxygenate the suboxic zone and deep water. These inflows, however, rarely
reach the western central Baltic Sea, and thus, even the strong inflow from 1993 had
only minor effects on Landsort Deep, where stagnating conditions prevailed
throughout (Bergström and Matthäus, 1996). The relatively stable stratification in
the Landsort Deep provides environments for microbial life within the oxic, suboxic
and anoxic zones.
Little is known, however, about the particulate organic matter (POM) sources and
biomarker distributions in the Landsort Deep water column (and the Baltic Sea in
general), as most studies focus on pollution related markers in particular organisms
and sediments (e.g. Beliaeff and Burgeot, 2001; Lehtonen et al., 2006; Hanson et al.,
2009). Recent work has given insight into the distributions of
bacteriohopanepolyols (BHPs) and phospholipid fatty acids (PLFA) in the water
column of the Gotland Deep (eastern central Baltic Sea), but these studies were
Fig. 1: Map showing the sampling locations in the central Baltic Sea.

Chapter 3 – Biomarkers in the stratified water column of the Landsort Deep
43
focused on bacterial methanotrophy (Schmale et al., 2012; Berndmeyer et al., 2013;
Jakobs et al., under review). In these investigations, as well as in our current study,
in situ pumping was used for sampling. In situ pumping allows sampling of
biomarkers in exactly the water depth where they are produced, thus providing
information about the coupling of water column chemistry and microbial life.
Several focused in situ biomarker water column studies exist (Schouten et al., 2001;
Schubert et al., 2006; Blumenberg et al., 2007; Sáenz et al., 2011; Xie et al., 2014, and
others). Comprehensive in situ biomarker reports exist from the Black Sea water
column (Wakeham et al., 2007; 2012). These studies gave a wide-ranging overview
of various biomarkers and their producers, and identified a close coupling of
microorganisms to water layers. With respect to bacterial methane oxidation, the
importance of the Baltic Sea suboxic zone for microbial processes was recently
confirmed by Jakobs et al. (2013; under review). The authors also stated the
theoretical possibility of sulfate-dependent methane oxidation in the anoxic zone, a
process that still has to be proven in the central Baltic Sea water column. Because
the eastern central Baltic Sea is regularly disturbed by lateral intrusions in
intermediate water depths (Jakobs et al., 2013), we chose the more stable Landsort
Deep in the western central Baltic Sea as a sampling site for this biomarker study.
Here we report the depth profiles of individual lipids from Landsort Deep, providing
further insight into the distribution of relevant biota and the connected
biogeochemical processes in stratified water columns.
3.3 Material and methods
3.3.1 Samples
Samples were taken during cruise 06EZ/11/05 of R/V Elisabeth Mann Borghese in
summer 2011. The Landsort Deep is located north of Gotland (58°35.0’ N 18°14.0’ E;
Fig. 1). A Seabird sbe911+ CTD system and a turbidity sensor ECO FLNTU (WET
Labs) were used for continuous water column profiling. Oxygen and hydrogen
sulfide concentrations were measured with Winkler’s method and colometrically,
respectively (Grasshoff et al., 1983). Filter samples of 65 to 195 l obtained from 10,
65, 70, 80, 90, 95 and 420 m water depth were taken with an in situ pump and
particulate material was filtered onto precombusted glass microfiber filters (Ø
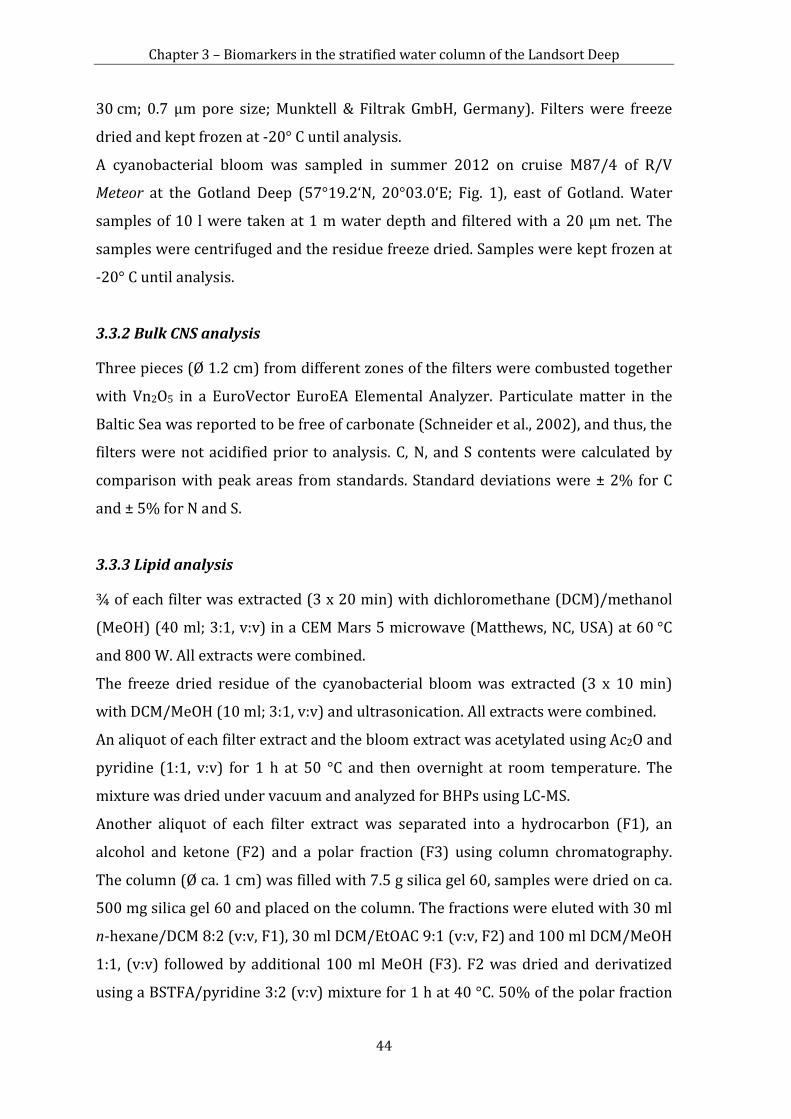
Chapter 3 – Biomarkers in the stratified water column of the Landsort Deep
44
30 cm; 0.7 µm pore size; Munktell & Filtrak GmbH, Germany). Filters were freeze
dried and kept frozen at -20° C until analysis.
A cyanobacterial bloom was sampled in summer 2012 on cruise M87/4 of R/V
Meteor at the Gotland Deep (57°19.2‘N, 20°03.0‘E; Fig. 1), east of Gotland. Water
samples of 10 l were taken at 1 m water depth and filtered with a 20 µm net. The
samples were centrifuged and the residue freeze dried. Samples were kept frozen at
-20° C until analysis.
3.3.2 Bulk CNS analysis
Three pieces (Ø 1.2 cm) from different zones of the filters were combusted together
with Vn2O5 in a EuroVector EuroEA Elemental Analyzer. Particulate matter in the
Baltic Sea was reported to be free of carbonate (Schneider et al., 2002), and thus, the
filters were not acidified prior to analysis. C, N, and S contents were calculated by
comparison with peak areas from standards. Standard deviations were ± 2% for C
and ± 5% for N and S.
3.3.3 Lipid analysis
¾ of each filter was extracted (3 x 20 min) with dichloromethane (DCM)/methanol
(MeOH) (40 ml; 3:1, v:v) in a CEM Mars 5 microwave (Matthews, NC, USA) at 60 °C
and 800 W. All extracts were combined.
The freeze dried residue of the cyanobacterial bloom was extracted (3 x 10 min)
with DCM/MeOH (10 ml; 3:1, v:v) and ultrasonication. All extracts were combined.
An aliquot of each filter extract and the bloom extract was acetylated using Ac2O and
pyridine (1:1, v:v) for 1 h at 50 °C and then overnight at room temperature. The
mixture was dried under vacuum and analyzed for BHPs using LC-MS.
Another aliquot of each filter extract was separated into a hydrocarbon (F1), an
alcohol and ketone (F2) and a polar fraction (F3) using column chromatography.
The column (Ø ca. 1 cm) was filled with 7.5 g silica gel 60, samples were dried on ca.
500 mg silica gel 60 and placed on the column. The fractions were eluted with 30 ml
n-hexane/DCM 8:2 (v:v, F1), 30 ml DCM/EtOAC 9:1 (v:v, F2) and 100 ml DCM/MeOH
1:1, (v:v) followed by additional 100 ml MeOH (F3). F2 was dried and derivatized
using a BSTFA/pyridine 3:2 (v:v) mixture for 1 h at 40 °C. 50% of the polar fraction

Chapter 3 – Biomarkers in the stratified water column of the Landsort Deep
45
F3 was further fractionated to obtain PLFA (F3.3) according to Sturt et al. (2004).
Briefly, the column was filled with 2 g silica gel 60 and stored at 200°C until use. The
F3 aliquot was dried on ca. 500 mg silica gel 60 and placed on the column. After
successive elution of the column with 15 ml DCM and 15 ml acetone, the PLFA
fraction was eluted with 15 ml MeOH (F3.3). F3.3 was transesterified using
trimethylchlorosilane (TMCS) in MeOH (1:9; v:v) for 1 h at 80 °C. In the resulting
fatty acid methyl ester (FAME) fractions, double bond positions in monounsaturated
compounds were determined using dimethyldisulfide (DMDS; Carlson et al.,
1989;Gatellier et al., 1993). The samples were dissolved in 200 µl DMDS, 100 µl n-
hexane, and 30 µl I2 solution (60 mg I2 in 1 ml Et2O) and derivatized at 50 °C for 48 h.
Subsequently, 1 ml of n-hexane and 200 µl of NaHSO4 (5% in water) were added and
the n-hexane extract was pipetted off. The procedure was repeated 3 x, the n-hexane
extracts were combined, dried on ca. 500 mg silica gel 60 and put onto a small
column (ca. 1 g silica gel 60). For cleaning, the n-hexane extract was eluted with ten
dead volumes of DCM. F1, F2, F3.3 and the samples treated with DMDS were
analyzed using GC-MS.
3.3.4 Gas chromatography-mass spectrometry (GC-MS) and GC-combustion
isotope ratio mass spectrometry (GC-C-IRMS)
GC-MS was performed using a Varian CP-3800 chromatograph equipped with a
Phenomenex Zebron ZB-5MS fused silica column (30 m x 0.32 mm; film thickness
0.25 µm) coupled to a Varian 1200L mass spectrometer. Helium was used as carrier
gas. The temperature program started at 80 °C (3 min) and ramped to 310 °C (held
25 min) with 4 °C min-1. Compounds were assigned comparing mass spectra and
retention times to published data. Concentrations were determined by comparison
with peak areas of internal standards.
Compound specific stable carbon isotope ratios of biomarkers in F2 and F3.3 were
measured (2x) using a Thermo Trace GC gas chromatograph coupled to a Thermo
Delta Plus isotope ratio mass spectrometer. The GC was operated under the same
conditions and with the same column as for GC-MS. The combustion reactor
contained CuO, Ni and Pt and was operated at 940 °C. Isotopic compositions are
reported in standard delta notation relative to the Vienna PeeDee Belemnite (V-

Chapter 3 – Biomarkers in the stratified water column of the Landsort Deep
46
PDB) and were calculated by comparison with an isotopically known CO2 reference
gas. GC-C-IRMS precision and linearity was checked daily using an external n-alkane
isotopic standard (provided by A. Schimmelmann, Indiana University).
3.3.5 Liquid chromatography-mass spectrometry (LC-MS)
LC-MS was performed using a Varian Prostar Dynamax HPLC system fitted with a
Merck Lichrocart (Lichrosphere 100; reversed phase (RP) C18e column [250 x
4 mm]) and a Merck Lichrosphere pre-column of the same material coupled to a
Varian 1200L triple quadrupole mass spectrometer (both Varian). Used solvents
were MeOH/water 9:1 (v:v; solvent A) and MeOH/propan-2-ol 1:1 (v:v; solvent B),
and all solvents were Fisher Scientific HPLC grade. The solvent gradient profile was
100% A (0-1 min) to 100% B at 35 min, then isocratic to 60 min. The MS was
equipped with an atmospheric pressure chemical ionization (APCI) source operated
in positive ion mode (capillary temperature 150 °C, vaporizer temperature 400 °C,
corona discharge current 8 µA, nebulizing gas flow 70 psi, auxiliary gas 17 psi). In
SIM (single ion monitoring) mode, ions obtained from acetylated BHP peaks in the
samples were compared to authentic BHP standards with known concentration
(acetylated BHP and aminotriol) to determine BHP concentrations (external
calibration). Amino BHPs had a 7x higher response factor than non-amino BHPs and
concentrations in the samples were corrected accordingly. Comparisons with elution
times of previously identified compounds further aided in BHP assignment. The
quantification error is estimated to be ± 20%.
3.4 Results
3.4.1 Physicochemical parameters of the water column
In summer 2011, the Landsort Deep showed a strong vertical stratification (Fig. 2).
The oxic zone consisted of the uppermost 80 m and was divided by a strong
thermocline into a warm surface layer (~0-10 m) and a cold winter water layer
(~10-70 m). The halocline was located between 60 m and 80 m. O2 concentrations
rapidly decreased from >8 ml l-1 at ~50 m to <0.2 ml l-1 at ~80 m, defining the upper
boundary of the suboxic zone (Tyson and Pearson, 1991). H2S was first detected at
83 m. Because O2 concentrations could methodically only be measured in the
complete absence of H2S, oxygen could not be traced below this depth. Therefore,

Chapter 3 – Biomarkers in the stratified water column of the Landsort Deep
47
Fig. 2: Physico-chemical characteristics of the Landsort Deep water column in summer 2011. The suboxic zone is shaded light grey. Temperature and methane data partially taken from Jakobs et al. (under review).
the lower boundary of the suboxic zone was defined to be at 90 m, where H2S
concentrations were sharply increasing. The suboxic zone also showed a sharp peak
in turbidity that is possibly caused by precipitation of Fe and Mn oxides (Dellwig et
al., 2010) or zero-valent sulfur (Kamyshny Jr. et al., 2013) and can be used as an
indicator for the O2-H2S transition (Kamyshny Jr. et al., 2013). The anoxic zone
extends from 90 m to the bottom and is characterized by the complete absence of O2
and high concentrations of H2S and CH4.
CH4 was highest in the deep anoxic zone, decreased strongly towards the suboxic
zone but was still present in minor concentrations in the oxic zone. A small CH4 peak
was detected at the suboxic-anoxic interface (Fig. 2). Particulate organic carbon
(POC) was highest at 10 m (380 µg l-1), decreased to a minimum in the cold winter
water layer (48 µg l-1) and showed almost constant values of ~70 µg l-1 in the
suboxic and anoxic zones.
Generally, we follow the zonation of the Landsort Deep water column as used in
Jakobs et al. (under review). We used the onset of H2S as the top of the anoxic zone,
however, as this is better supported by our biomarker data (see below).
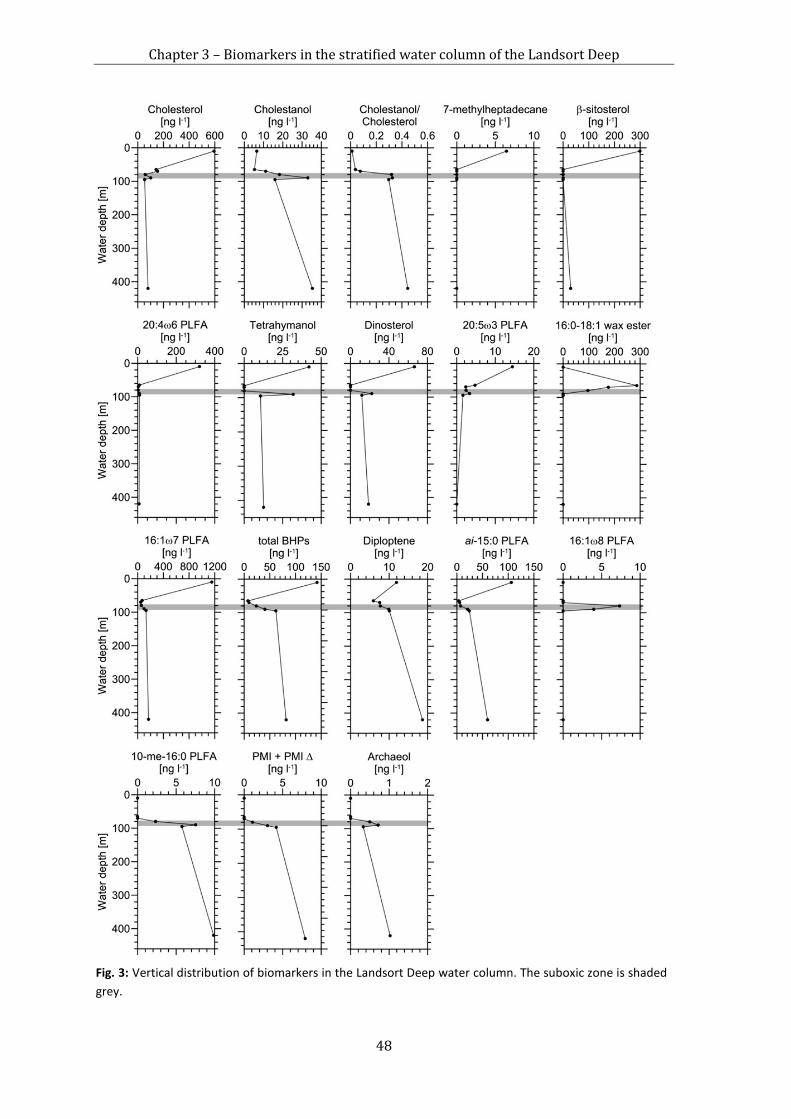
Chapter 3 – Biomarkers in the stratified water column of the Landsort Deep
48
Fig. 3: Vertical distribution of biomarkers in the Landsort Deep water column. The suboxic zone is shaded grey.

Chapter 3 – Biomarkers in the stratified water column of the Landsort Deep
49
3.4.2 Lipid analysis
To obtain an overview about the sources and
distributions of biomarkers in the water
column, 17 major compounds were selected,
specifying inputs from prokaryotes and
eukaryotes (with phototrophic,
chemotrophic and/or heterotrophic
metabolisms). The concentrations of these
compounds are shown in Fig. 3 and were
distinguished into four major groups
according to their profiles in the water
column. Compound-specific δ13C values are
given in Table 1. Additionally, the n-alkane
and n-alkene distributions in the sea surface
layer (Fig. 4), the distribution of individual
BHPs (Fig. 5a) and BHPs from bloom
cyanobacteria were taken into account (Fig.
5b).
3.4.3 Group 1: surface maximum
The first group is defined by a strong maximum in the surface layer. It contains
cholest-5-en-3β-ol (cholesterol), 7-methylheptadecane, 24-ethylcholest-5-en-3β-ol
(β-sitosterol), and 20:4ω6 PLFA. Within this group, cholesterol showed the highest
concentrations (594 ng l-1), and 7-methylheptadecane the lowest (6 ng l-1, Fig. 3).
Apart from their maxima in the surface layer, the trend of these biomarkers differed
somewhat in deeper water layers. 20:4ω6 PLFA was traceable throughout the water
column, whereas 7-methylheptadecane exclusively occurred in the surface layer.
β-sitosterol occurred in the surface and the bottom layer. Unlike the other
compounds, cholesterol did not show a straight decrease with depth, rather are
there minor peaks right above and at the bottom of the suboxic zone, respectively.
These variations were small, however, and were not considered for grouping the
compounds. δ13C values of all compounds were between -32 and -26 ‰ (Table 1).
δ13C [‰] Compound oxic
zone suboxic zone
anoxic zone
Group 1 cholesterol -26.8 -28.9 -31.7 7-me-17:0 alkane n.d. n.d. n.d. β-sitosterol -29.9 n.d. -30.1 20:4ω6 PLFA -30.1 -31.7 -31.6 Group 2 tetrahymanol -28.7 -27.9 -25.9 dinosterol -29.9 -30.9 -32.0 Group 3 16:1ω7 PLFA -30.6 -28.0 -28.3 diploptene n.d. n.d. n.d. ai-15:0 PLFA -29.3 -32.5 -34.2 Group 4 10-me-16:0 PLFA n.d. -32.5 -35.4 PMI +PMI Δ n.d. n.d. n.d. archaeol n.d. n.d. n.d. Others cholestanol -27.8 -28.9 -30.1 20:5ω3 PLFA -29.2 n.d. n.d. 16:0-18:1 wax ester -28.1 -28.2 n.d. 16:1ω8 PLFA n.d. -45.4 n.d. Tab. 1: δ13C values of the major compounds. The compounds were grouped according to their profile in the water column. N.d. = not detectable.
Chapter 3 – Biomarkers in the stratified water column of the Landsort Deep
50
3.4.4 Group 2: surface and lower suboxic zone maxima
This group contains only two compounds, 4α,23,24-trimethyl-5α-cholest-22E-en-
3β-ol (dinosterol) and gammacer-3β-ol (tetrahymanol). Both had their maximum
concentration in the surface water (dinosterol: 66 ng l-1; tetrahymanol: 42 ng l-1) and
were not detectable in the layers below, until a sharp second maximum occurred at
the bottom of the suboxic zone. Concentrations decreased again below the suboxic
zone and remained constantly low in the bottom water. Tetrahymanol was
isotopically heavier in the oxic than in the anoxic zone (δ13C: -28.1 vs. -25.9 ‰),
whereas the opposite was observed for dinosterol (δ13C: -29.9 vs. -32.0 ‰).
3.4.5 Group 3: surface maximum, continuous increase in suboxic zone
The third group contains 16:1ω7 PLFA, total BHPs, the hopanoid hydrocarbon hop-
22(29)-ene (diploptene), and ai-15:0 PLFA. All these compounds were abundant in
the surface layer, with 16:1ω7 PLFA showing the highest concentrations (1154
ng l-1) and diploptene the lowest (12 ng l-1). A further feature is the continuous
increase that extends throughout the suboxic zone and the anoxic zone. ai-15:0
PLFA shows a slight isotopic depletion in the anoxic zone (-34.2 ‰) whereas the
other compounds of this group showed consistently higher δ13C values of about -28
to -30 ‰.
3.4.6 Group 4: Absent in the oxic zone, bottom layer maximum
10-me-16:0 PLFA, the irregular C25 isoprenoid 2,6,10,15,19-pentamethylicosane
(PMI), three unsaturated derivatives thereof (PMI Δ), and 2,3-di-0-isopranyl
sn-glycerol diether (archaeol) showed profiles defined in group four. These
compounds were all absent in the oxic zone and only occurred in the suboxic zone
and below. In all cases, maxima were detected in the anoxic zone, with highest
amounts observed for 10-me-16:0 PLFA (10 ng l-1) followed by PMI and PMI Δ
(8 ng l-1) and archaeol (1 ng l-1). 10-me-16:0 PLFA shows a slight 13C depletion in the
anoxic zone (-35.4 ‰). Concentrations of archaeol, PMI, and PMI Δ were too low to
determine δ13C.

Chapter 3 – Biomarkers in the stratified water column of the Landsort Deep
51
3.4.7 Others
5α(H)-cholestan-3β-ol (cholestanol), 16:0-18:1 wax ester, 16:1ω8 PLFA, and 20:5ω3
PLFA showed individual profiles not related to any of the groups defined above.
Cholestanol shows lowest values within the oxic zone, although concentrations start
to increase in the cold winter water layer. Maxima occur at the suboxic-anoxic
interface (33 ng l-1) and in the deep anoxic zone (35 ng l-1). The wax ester shows
maximum concentrations (286 ng l-1) in the cold winter water layer, and a decrease
through the suboxic zone. It was absent in the surface layer and in the anoxic zone.
20:5ω3 PLFA has maximum concentrations in the surface layer (15 ng l-1), remains
at relatively high concentrations in the cold winter water layer (6 ng l-1) and shows a
second peak at the suboxic-anoxic interface. 16:1ω8 PLFA is absent in the oxic and
anoxic layers. It only occurs in the suboxic zone with a maximum concentration at its
top (7 ng l-1). Of all compounds measured, it shows the lowest δ13C (-45.4 ‰).
3.4.8 n-alkanes and n-alkenes in the sea surface layer
The concentrations of n-alkanes and n-alkenes in the surface sample (10 m water
depth) are given in Fig. 4. The longest n-alkane chain was n-C33, and odd carbon
numbers dominated over even. Highest concentrations were found for n-C27
(21 ng l-1), n-C29 (30 ng l-1), and n-C31 (26 ng l-1). The longest n-alkene chain was n-
Fig. 4: Concentrations of n-alkanes and n-alkenes in the Landsort Deep surface layer (oxic zone, 10 m water depth).
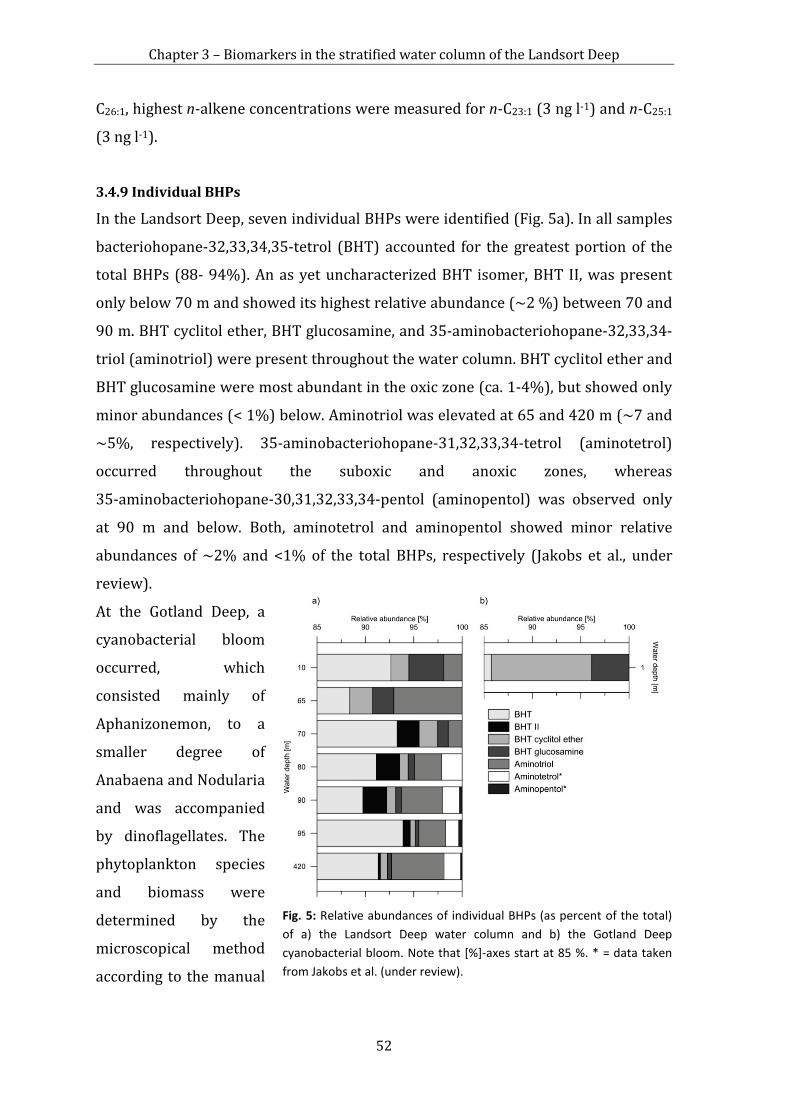
Chapter 3 – Biomarkers in the stratified water column of the Landsort Deep
52
C26:1, highest n-alkene concentrations were measured for n-C23:1 (3 ng l-1) and n-C25:1
(3 ng l-1).
3.4.9 Individual BHPs
In the Landsort Deep, seven individual BHPs were identified (Fig. 5a). In all samples
bacteriohopane-32,33,34,35-tetrol (BHT) accounted for the greatest portion of the
total BHPs (88- 94%). An as yet uncharacterized BHT isomer, BHT II, was present
only below 70 m and showed its highest relative abundance (~2 %) between 70 and
90 m. BHT cyclitol ether, BHT glucosamine, and 35-aminobacteriohopane-32,33,34-
triol (aminotriol) were present throughout the water column. BHT cyclitol ether and
BHT glucosamine were most abundant in the oxic zone (ca. 1-4%), but showed only
minor abundances (< 1%) below. Aminotriol was elevated at 65 and 420 m (~7 and
~5%, respectively). 35-aminobacteriohopane-31,32,33,34-tetrol (aminotetrol)
occurred throughout the suboxic and anoxic zones, whereas
35-aminobacteriohopane-30,31,32,33,34-pentol (aminopentol) was observed only
at 90 m and below. Both, aminotetrol and aminopentol showed minor relative
abundances of ~2% and <1% of the total BHPs, respectively (Jakobs et al., under
review).
At the Gotland Deep, a
cyanobacterial bloom
occurred, which
consisted mainly of
Aphanizonemon, to a
smaller degree of
Anabaena and Nodularia
and was accompanied
by dinoflagellates. The
phytoplankton species
and biomass were
determined by the
microscopical method
according to the manual
Fig. 5: Relative abundances of individual BHPs (as percent of the total) of a) the Landsort Deep water column and b) the Gotland Deep cyanobacterial bloom. Note that [%]-axes start at 85 %. * = data taken from Jakobs et al. (under review).

Chapter 3 – Biomarkers in the stratified water column of the Landsort Deep
53
of HELCOM (2012). Three BHPs were observed in the bloom POM (Fig. 5b). Among
these compounds, the most abundant was BHT (~86 %), followed by BHT cyclitol
ether (~10%), and BHT glucosamine (~4%).
3.5 Discussion
In the following, we discuss several aspects of the biomarker profiles with respect to
their significance as tracers for the relevant biota and biogeochemical processes in
stratified water columns.
3.5.1 Water column redox zones as reflected by cholestanol/cholesterol ratios
Different redox states of the Landsort Deep water column and the associated
microbial processes are reflected by the profiles of cholesterol and its diagenetic
product, cholestanol (Fig. 3). Cholesterol is produced by various eukaryotes such as
plankton and higher plants (Parrish et al., 2000) and abundant in water columns and
sediments In sediments as well as in stratified water columns, stanols are produced
from sterols by anaerobic bacterial hydrogenation (Gaskell and Eglinton, 1975;
Wakeham, 1989) and by the abiotic reduction of double bonds by reduced inorganic
species such as H2S (Hebting et al., 2006; Wakeham et al., 2007). Therefore,
cholestanol/cholesterol ratios typically increase under more reducing conditions. In
the Black Sea, low ratios of ~0.1 were associated with oxygenated surface waters
(Wakeham et al., 2007). The suboxic zone showed ratios between 0.1 and 1 whereas
the anoxic zone revealed values >1 (Wakeham et al., 2007). In the Landsort Deep,
the cholestanol/cholesterol ratios showed a slight increase with depth from the
surface towards the suboxic zone, but always remained <0.1. Below, the values
increased to ~0.3 in the suboxic zone, and further to a maximum of 0.45 in the
anoxic zone. Whereas the ratios in the Landsort Deep are considerably lower than in
the Black Sea, the depth trend still clearly mirrors the changes from oxic to suboxic,
and further to anoxic conditions. It is also interesting to note that total cholesterol
and cholestanol concentrations in the Landsort Deep were ten- and fourfold higher,
respectively, as in the Black Sea (Wakeham et al., 2007).

Chapter 3 – Biomarkers in the stratified water column of the Landsort Deep
54
3.5.2 Phototrophic primary production
As expected, in situ biomarkers for phototrophic organisms showed a clear
preference for the surface layer. Among these compounds, 7-methylheptadecane is a
characteristic marker for cyanobacteria (Shiea et al., 1990; Köster et al., 1999). Its
most likely source are members of the subclass Nostocophyceae that were often
reported to produce isomeric mid-chain branched alkanes, including
7-methylheptadecane (Shiea et al., 1990; Hajdu et al., 2007; Liu et al., 2013).
Nostocophyceae are key members of the photoautotrophic community in the Baltic
Sea. Particularly the filamentous genera Nodularia and Aphanizonemon (see 3.2.7),
and the picocyanobacterium Synechococcus play a major role in blooms during
summer time (Stal et al., 2003; Labrenz et al., 2007). The importance of
cyanobacteria in the surface layer of the Landsort Deep is further reflected by the
presence of C21:1, C23:1 and C25:1 n-alkenes (Fig. 4). These compounds have been
reported from Anacystis (Gelpi et al., 1970) and Oscillatoria (Matsumoto et al., 1990).
Oscillatoria vaucher is also known to occur in the Baltic Sea, but is of only minor
abundance (Kononen et al., 1996; Vahtera et al., 2007).
20:4ω6 PLFA is a biomarker traditionally assigned to eukaryotic phytoplankton
(Nanton and Castell, 1999; Lang et al., 2011) and organisms grazing thereon, such as
protozoa (Findlay and Dobbs, 1993; Pinkart et al., 2002; Risse-Buhl et al., 2011).
High concentrations of 20:4ω6 PLFA, as observed in the surface layer of the oxic
zone, are in good agreement with such an authochthonous plankton-based source.
Long-chain n-alkanes with a strong predominance of the odd-numbered n-C25 to n-
C33 homologues (Eglinton and Hamilton, 1967; Bi et al., 2005) and β-sitosterol
(Volkman, 1986) are typical components of higher plant lipids. The occurrence and
distributions of these compounds reflect a significant contribution from terrestrial
higher plants and thus, continental runoff and/or aeolian input of terrigenous OM
into the Landsort Deep.
3.5.3 Phototrophic vs. heterotrophic dinoflagellates, and ciliates
The distribution of dinoflagellates and ciliates in the water column is reflected by
two specific biomarkers, dinosterol and tetrahymanol (see 3.2.2, Fig. 3). Dinosterol
is mainly produced by dinoflagellates (Boon et al., 1979), although it was also
reported in minor abundance from a diatom (Navicula sp., Volkman et al., 1993). The

Chapter 3 – Biomarkers in the stratified water column of the Landsort Deep
55
dinosterol concentrations in the Landsort Deep showed a bimodal distribution. The
strong peak in the surface layer of the oxic zone most likely represents phototrophic
dinoflagellates. Plausible candidates are Peridiniella catenata and Scrippsiella
hangoei, both of which are involved in the spring phytoplankton blooms in the
central Baltic Sea (Wasmund et al., 1998; Höglander et al., 2004). The latter species
was previously reported to produce dinosterol (Leblond et al., 2007). However, P.
catenata as well as S. hangoei are virtually absent below 50 m water depth
(Höglander et al., 2004) and can thus not account for the second peak of dinosterol
at the suboxic-anoxic transition zone. A likely source of dinosterol at this water
depth are heterotrophic dinoflagellates that are abundant in the suboxic zones of the
central Baltic Sea (Anderson et al., 2012). Due to their enhanced productivity, these
environments provide good conditions to sustain communities of eukaryotic grazers
(Detmer et al., 1993). A possible candidate, Gymnodinium beii, was described from
the suboxic zones of the central Baltic Sea (Stock et al., 2009). Indeed, several
Gymnodinium species are known to be heterotrophs (Strom and Morello, 1998) and
some have been reported to produce dinosterol (Mansour et al., 1999).
A similar concentration distribution as for dinosterol was observed for
tetrahymanol. Tetrahymanol is produced by ciliates as a substitute for cholesterol
when grazing on prokaryotes instead of eukaryotes such as algae (Conner et al.,
1968; Boschker and Middelburg, 2002). High concentrations of tetrahymanol were
also described for the suboxic zone of the Black Sea (Wakeham et al., 2007), where
ciliates were assumed to feed on chemoautotrophic bacteria. This is also a feasible
scenario for the Baltic Sea where the ciliate genera Metopus, Strombidium,
Metacystis, Mesodinium, and Coleps are abundant in the suboxic zone and at the
suboxic-anoxic interface (Detmer et al., 1993; Anderson et al., 2012). Unidentified
ciliates also occurred in the anoxic waters of the Landsort Deep (Anderson et al.,
2012). We therefore assume ciliates living under suboxic to anoxic conditions to be
the source of tetrahymanol in the suboxic zone and below.
In the Black Sea, tetrahymanol was absent in the surface waters (Wakeham et al.,
2007) whereas the Landsort Deep showed the highest concentration at 10 m depth
(Fig. 3). The occurrence of tetrahymanol at this depth appears paradox, as
cholesterol is also abundant in the surface waters and thus, the ciliates could
incorporate it, e.g. through grazing on eukaryote derived OM. On the other hand,

Chapter 3 – Biomarkers in the stratified water column of the Landsort Deep
56
some ciliates seem to prefer prokaryotes as a prey. Sinking agglomerates of cyano-
and other bacteria are known to be covered by feeding ciliates (Gast and Gocke,
1988). Such a selective diet would plausibly explain the abundance of tetrahymanol
in the shallow waters of the Landsort Deep.
δ13C values of tetrahymanol revealed an opposite trend as compared to dinosterol.
While dinosterol became isotopically lighter with depth (-29.9 to -32.0‰),
tetrahymanol became heavier (-28.7 to -25.9‰) and showed its highest δ13C values
in the anoxic zone. Although ciliates and dinoflagellates are both grazers at the
suboxic-anoxic interface, they seem to occupy different ecological niches and feed on
different bacterial sources.
3.5.4 Heterotrophs in the cold winter water layer
The only biomarkers with enhanced concentrations in the cold winter water layer
are wax esters (e.g. 16:0-18:1 wax ester, Fig. 3) and 20:5ω3 PLFA. Known producers
of wax esters and 20:5ω3 PLFA are copepods (Lee et al., 1971; Sargent et al., 1977;
Kattner and Krause, 1989; Nanton and Castell, 1999; Falk-Petersen et al., 2002).
These organisms synthesize wax esters with total chain lengths between 28 and 44
carbon atoms (Lee et al., 1971; Kattner and Krause, 1989; Falk-Petersen et al., 2002)
of which several were present in the Landsort Deep (data not shown in Fig. 3),
following the distribution of the most prominent 16:0-18:1. Particularly copepods
rich in wax esters prefer deep water or near-surface cold water (Sargent et al.,
1977), which is in full agreement with the high amounts of these compounds in the
cold winter water layer. Copepods are abundant and diverse in the Baltic Sea, with
major species being Pseudocalanus elongatus, Temora longicornis, and Acartia spp.
(Möllmann et al., 2000; Möllmann and Köster, 2002). Like the wax esters, the
20:5ω3 FA shows high concentrations in the cold winter water layer, but it is also
abundant in the surface and at the suboxic-anoxic interface (Fig. 3), suggesting
multiple biological origins for this compound. Dinoflagellates are known producers
of 20:5ω3 PLFA (Parrish et al., 1994; Volkman et al., 1998) and may be an
alternative source in the surface layer and at the suboxic-anoxic interface, which is
supported by a good correlation with dinosterol at these depths.
Unlike the abovementioned compounds, all other selected biomarkers show
particularly low concentrations in the cold winter water layer. This is also true for

Chapter 3 – Biomarkers in the stratified water column of the Landsort Deep
57
widespread compounds such as the 16:1ω7 PLFA which is produced by eukaryotes
(Pugh, 1971; Shamsudin, 1992) as well as prokaryotes (Parkes and Taylor, 1983;
Vestal and White, 1989). While a mixed origin of 16:1ω7 PLFA has to be assumed for
the oxic zone, a bacterial source is more probable in the suboxic zone and in the
anoxic zone. Regardless of the biological source, a very low amount of this
ubiquitous FA (Fig. 3) indicates that the cold winter water layer of the Landsort
Deep does not support abundant planktonic life. Based on microscopy, similar
observations have been made for the cold winter water layers of the Gotland,
Bornholm and Danzig Basins (Gast and Gocke, 1988, and citations therein).
3.5.5 BHPs as indicators for aerobic and anaerobic metabolisms
Bacteria are the only known source of BHPs (Kannenberg and Poralla, 1999).
Although the biosynthesis of BHPs and their precursor, diploptene, does not require
oxygen, the production of hopanoids was long assumed to be restricted to aerobic
bacteria, as reports from facultatively or strictly anaerobic bacteria were initially
missing. More recently, however, planctomycetes (Sinninghe Damsté et al., 2004),
metal reducing Geobacter (Fischer et al., 2005), and sulfate reducing Desulfovibrio
(Blumenberg et al., 2006; Blumenberg et al., 2009; Blumenberg et al., 2012) were
identified as anaerobic producers of BHPs. In the Landsort Deep, cyanobacteria are
abundant in the surface water layer and may be considered as a major source of
BHPs (cf. Talbot et al., 2008; Welander et al., 2010). Evidence for such cyanobacterial
BHP contributions may come from our analysis of a Gotland Deep bloom from
summer 2012 (see 3.2.7). BHPs identified in this bloom were BHT, BHT cyclitol
ether, and BHT glucosamine (Fig. 5b) which is in line with the BHP composition of
the Landsort Deep surface layer (Fig. 5a). These three cyanobacterial BHPs were
present throughout the Landsort Deep water column, although they were minor in
the suboxic zone and below. In addition, the surface layer contained aminotriol that
was also present in the whole water column. Aminotriol is an abundant BHP
produced by various bacteria (e.g. Talbot and Farrimond, 2007, and references
therein), indicating BHP sources other than cyanobacteria in the surface layer.
A further notable feature is the occurrence of BHT II at 70 m and below. The source
of BHT II is not fully resolved yet. It was recently related to bacteria performing
anaerobic ammonium oxidation in sediments (Rush et al., 2014), but two recent
Chapter 3 – Biomarkers in the stratified water column of the Landsort Deep
58
studies in the Landsort Deep could not give evidence for anammox in the water
column of the Landsort Deep (Hietanen et al., 2012; Thureborn et al., 2013). BHT II
was also described from stratified water columns of the Arabian Sea, Peru Margin
and Cariaco Basin (Sáenz et al., 2011) Gotland Deep (Berndmeyer et al., 2013) and
has therefore been proposed as a proxy for stratified water columns. This theory has
positively been adopted to reconstruct the water column stratification in the Baltic
Sea Holocene development (Blumenberg et al., 2013).
Like BHT II, aminotetrol and aminopentol are absent from the surface layer.
Whereas both BHPs are biomarkers for methanotrophic bacteria, the latter typically
occurs in type I methanotrophs (Talbot et al., 2001). The presence of type I
methanotrophic bacteria is further supported by the co-occurrence of the specific
16:1ω8 PLFA (Nichols et al., 1985; Bowman et al., 1991; Bowman et al., 1993) and
its considerably depleted δ13C value (-45.4‰).
Whereas a major in situ production of BHPs in the suboxic zone is evident from our
data, the sources of BHPs in the anoxic zone are more difficult to establish. BHPs in
the anoxic zone may partly derive from sinking POM as well as being newly
produced by anaerobic bacteria. The further may apply for BHT cyclitol ether and
BHT glucosamine which seem to derive from cyanobacteria thriving in the oxic zone,
as discussed above. Aminotriol, aminotetrol, and aminopentol, however, are known
products of sulfate reducing bacteria (Blumenberg et al., 2006; Blumenberg et al.,
2009; Blumenberg et al., 2012) and may have their origin within the anoxic zone.
This interpretation is supported by the close correlation of the total BHPs with the
ai-15:0 PLFA, which is considered as indicative for sulfate reducers (see 4.7.). Thus,
the anoxic zone of the Landsort Deep is likely an active source for BHPs instead of
solely being a pool for transiting compounds.
3.5.6 Microbial processes in the anoxic zone
Sulfate reducing bacteria were traced using ai-15:0 PLFA and 10-me-16:0 PLFA
(Parkes and Taylor, 1983; Taylor and Parkes, 1983; Vainshtein et al., 1992). The high
abundance of ai-15:0 PLFA in the surface layer (Fig. 3) is surprising at first glance, as
sulfate reducers are not supposed to thrive in oxic environments. However, these
bacteria were previously reported from oxygenated surface waters of the Gotland
Deep where they were associated with sinking cyanobacterial agglomerates (Gast

Chapter 3 – Biomarkers in the stratified water column of the Landsort Deep
59
and Gocke, 1988). 10-Me-16:0 PLFA, on the other hand, is absent from the oxic zone.
This FA was reported to occur in Desulfobacter and Desulfobacula (Taylor and
Parkes, 1983; Kuever et al., 2001), both strictly anaerobic organisms (Szewzyk and
Pfennig, 1987; Widdel, 1987; Kuever et al., 2001). Indeed, Desulfobacula toluolica
was genetically identified by Labrenz et al. (2007) in suboxic and anoxic waters of
the central Baltic Sea.
In addition to the bacterial FA, two archaeal in situ biomarkers, archaeol and PMI,
were identified. Archaeol is the most common ether lipid in archaea, but is especially
abundant in euryarchaeotes, including methanogens (Tornabene and Langworthy,
1979; Koga et al., 1993). Likewise, PMI and its unsaturated derivatives are
diagnostic for methanogenic euryarchaeotes (Tornabene et al., 1979; De Rosa and
Gambacorta, 1988; Schouten et al., 1997). In the Landsort Deep, both compounds are
virtually absent in the oxic zone, and increase in abundance with depth through the
suboxic zone (Fig. 3). The same trend has been described for PMI in the Black Sea
(Wakeham et al., 2007) and the presence of euryarchaeota in Landsort Deep anoxic
waters has recently been proven by Thureborn et al. (2013).
Given the available sample resolution, it is impossible to further elucidate the exact
distribution of archaea in the anoxic zone of the Landsort Deep. Likewise, δ13C
values could not be obtained for archaeol and PMI due to low compound
concentrations, which excludes statements on inputs of these lipids from archaea
involved in the sulfate-dependent anaerobic oxidation of methane (AOM; cf. Hinrichs
et al., 1999; Thiel et al., 1999; Pancost et al., 2001). Whereas it has been shown that
AOM is theoretically possible in the anoxic zone of the Landsort Deep and anaerobic
methane consumption was demonstrated to occur (Jakobs et al., 2013), a clear
evidence for abundant AOM is as yet lacking and requires further investigations
focused at the anoxic water bodies of the Baltic Sea.
3.6 Conclusions
The Landsort Deep in the western central Baltic Sea is characterized by a stratified
water column. Marine microbial organisms have adapted to the vertical chemical
limitations of their ecosystems and their distributions in the water column can be
reconstructed using diverse in situ biomarkers. Within the oxic zone, a clear
preference for the surface layer became obvious for distinctive biomarkers.

Chapter 3 – Biomarkers in the stratified water column of the Landsort Deep
60
7-methylheptadecane, different alkenes and the BHPs BHT cyclitol ether and BHT
glucosamine indicated the presence of cyanobacteria. Dinosterol concentrations and
δ13C values not only supported a phototrophic dinoflagellate population in the
surface, but a second, heterotrophic community at the suboxic-anoxic interface.
Similarly, tetrahymanol was most abundant at the surface, indicating ciliates feeding
on cyanobacterial agglomerates, but showed a second maximum at the suboxic-
anoxic interface where ciliates graze on chemo-autotrophic bacteria. The cold winter
water layer at the bottom of the oxic zone showed only low concentrations of
biomarkers and seemed to be avoided by most organisms, except copepods. In
contrast, biomarkers in the suboxic zone reflected a high abundance and diversity of
eukaryotes and prokaryotes. 16:1ω8 PLFA and aminopentol were indicative for the
presence of type I aerobic methane oxidizing bacteria whereas ai-15:0 PLFA,
10-me-16:0 and total BHPs indicated the distribution of sulfate reducing bacteria in
the Landsort Deep water column. ai-15:0 PLFA was also present in the surface layer,
indicating sulfate reducers associated with cyanobacteria agglomerates. The close
coupling of ai-15:0 PLFA with total BHPs make these bacteria a likely in situ source
for hopanoids in the anoxic zone. The anoxic zone was further inhabited by archaea,
as shown by the presence of archaeol and PMI and its derivatives. Our study of in
situ biomarkers in the water column of the Landsort Deep thus provided a better
insight into the distribution of relevant players and the related biogeochemical
processes. Yet, still only little is known about the microorganisms, their distribution,
and their metabolisms in the anoxic zone. Thus, further studies in the anoxic part of
the water column would be of great interest for an advanced understanding of
microbial communities in the central Baltic Sea.
Acknowledgments
We thank the Captains and crews of R/Vs Elisabeth Mann Borghese and Meteor for
assistance during the cruises. We thank C. Conradt and L. Kammel for laboratory
assistance, and T. Licha and K. Nödler for help with LC–MS. The German Research
Foundation (Deutsche Forschungsgemeinschaft, DFG) is acknowledged for financial
support (Grants BL 971/1-3 and 971/3-1).

Chapter 3 – Biomarkers in the stratified water column of the Landsort Deep
61
References
Anderson, R., Winter, C., Jürgens, K., 2012. Protist grazing and viral lysis as
prokaryotic mortality factors at Baltic Sea oxic-anoxic interfaces. Marine Ecology
Progress Series 467, 1-14.
Beliaeff, B. and Burgeot, T., 2001. Integrated biomarker response: a useful tool for
ecological risk assessment. Environmental Toxicology and Chemistry 21, 1316-1322.
Bergström, S. and Matthäus, W., 1996. Meteorology, hydrology and hydrography.
HELCOM, Helsinki, 1996.
Berndmeyer, C., Thiel, V., Schmale, O., Blumenberg, M., 2013. Biomarkers for aerobic
methanotrophy in the water column of the stratified Gotland Deep (Baltic Sea).
Organic Geochemistry 55, 103-111.
Bi, X., Sheng, G., Liu, X., Li, C., Fu, J., 2005. Molecular and carbon and hydrogen
isotopic composition of n-alkanes in plant leaf waxes. Organic Geochemistry 36,
1405-1417.
Blumenberg, M., Krüger, M., Nauhaus, K., Talbot, H. M., Oppermann, B. I., Seifert, R.,
Pape, T., Michaelis, W., 2006. Biosynthesis of hopanoids by sulfate-reducing bacteria
(genus Desulfovibrio). Environmental Microbiology 8, 1220-1227.
Blumenberg, M., Seifert, R., Michaelis, W., 2007. Aerobic methanotrophy in the oxic–
anoxic transition zone of the Black Sea water column, Organic Geochemistry 38, 84-
91.
Blumenberg, M., Oppermann, B. I., Guyoneaud, R., Michaelis, W., 2009. Hopanoid
production by Desulfovibrio bastinii isolated from oilfield formation water. FEMS
Microbiology Letters 293, 73-78.
Blumenberg, M., Hoppert, M., Krüger, M., Dreier, A., Thiel, V., 2012. Novel findings on
hopanoid occurrences among sulfate reducing bacteria: Is there a direct link to
nitrogen fixation? Organic Geochemistry 49, 1-5.
Blumenberg, M., Berndmeyer, C., Moros, M., Muschalla, M., Schmale, O., Thiel, V.,
2013. Bacteriohopanepolyols record stratification, nitrogen fixation and other
Chapter 3 – Biomarkers in the stratified water column of the Landsort Deep
62
biogeochemical perturbations in Holocene sediments of the central Baltic Sea.
Biogeosciences, 10, 2725-2735.
Boon, J. J., Rijpstra, W. I. C., De Lange, F., De Leeuw, J. W., 1979. Black Sea sterol - a
molecular fossil for dinoflagellate blooms. Nature, 277, 125-127.
Boschker, H. T. S. and Middelburg, J. J., 2001. Stable isotopes and biomarkers in
microbial ecology. FEMS Microbiology Ecology 40, 85-95.
Bowman, J. P., Skeratt, J. H., Nichols, P. D., Sly, L. I., 1991. Phopsholipid fatty acid and
lipopolysaccharide fatty acid signature lipids in methane-utilizing bacteria. FEMS
Microbiology Ecology 85, 15-22.
Bowman, J. P., Sly, L. I., Nichols, P. D., Hayward, A. C., 1993. Revised taxonomy of the
methanotrophs: Description of Methylobacter gen. nov., emendation of
Methylococcus, validation of Methylosinus and Methylocystis species, and a proposal
that the family Methylococcaceae includes only the group I methanotrophs.
International Journal of Systematic Bacteriology 43, 735-753.
Carlson, D. R., Roan, C.-S., Yost, R. A., Hector, J., 1989. Dimethyl disulfide derivatives
of long chain alkenes, alkadiens, and alkatrienes for gas chromatography / mass
spectrometry. Analytical Chemistry 61, 1564-1571.
Conner, R. L., Landrey, J. R., Burns, C. H., Mallory, F. B., 1968. Cholesterol inhibition of
pentacyclic triterpenoid biosythesis in Tetrahymena pyriformis, Journal of
Protozoology 15, 600-605.
De Rosa, M. and Gambacorta, A., 1988. The lipids of archaebacteria. Progress in Lipid
Research 27, 153-175.
Dellwig, O., Leipe, T., März, C., Glockzin, M., Pollehne, F., Schnetger, B., Yakushev, E. V.,
Böttcher, M. E., Brumsack, H.-J., 2010. A new particulate Mn–Fe–P-shuttle at the
redoxcline of anoxic basins. Geochimica et Cosmochimica Acta 74, 7100-7115.
Detmer, A. E., Giesenhagen, H. C., Trenkel, V. M., Auf dem Venne, H., Jochem, F., 1993.
Phototrophic and hetreotrophic pico- and nanoplankton in anoxic depths of the
central Baltic Sea. Marine Ecology Progress Series 99, 197-203.

Chapter 3 – Biomarkers in the stratified water column of the Landsort Deep
63
Eglinton, G. and Hamilton, R. J., 1967. Leaf epicuticular waxes. Science, 156, 1322-
1335.
Falk-Petersen, S., Dahl, T. M., Scott, C. L., Sargent, J. R., Gulliksen, B., Kwasniewski, S.,
Hop, H., Millar, R.-M., 2002. Lipid biomarkers and trophic linkages between
ctenophores and copepods in Svalbard waters. Marine Ecology Progress Series 227,
187-194.
Findlay, R. H. and Dobbs, F. C., 1993. Quantitative description of microbial
communities using lipid analysis. In: Cole, J. J. (Ed.). Handbook of methods in aquatic
microbial ecology. CRC Press, Florida, USA, 1993.
Fischer, W. W., Summons, R. E., Pearson, A., 2005. Targeted genomic detection of
biosynthetic pathways: anaerobic production of hopanoid biomarkers by a common
sedimentary microbe. Geobiology, 3, 33-40.
Gaskell, S. J. and Eglinton, G., 1975. Rapid hydrogenation of sterols in a
contemporary lacustrine sediment. Nature, 254, 209-211, 1975.
Gast, V. and Gocke, K., 1988. Vertical distribution of number, biomass and size-class
spectrum of bacteria in relation to oxic/anoxic conditions in the Central Baltic Sea.
Marine Ecology Progress Series 45, 179-186.
Gatellier, J.-P. L. A., de Leeuw, J. W., Sinninghe Damsté, J. S., Derenne, S., Largeau, C.,
Metzger, P., 1993. A comparative study of macromolecular substances of a
Coorongite and cell walls of the extant alga Botryococcus braunii, Geochimica et
Cosmochimica Acta 57, 2053-2068.
Gelpi, E., Schneider, H., Mann, J., Oró, J., 1970. Hydrocarbons of geochemical
significance in microscopic algae. Phytochemistry 9, 603-612.
Hajdu, S., Höglander, H., Larsson, U., 2007. Phytoplankton vertical distributions and
compositions in Baltic Sea cyanobacterial blooms. Harmful Algae 6, 189-205.
Hanson, N., Förlin, L., Larsson, Â., 2009. Evaluation of long-term biomarker data from
perch (Perca fluviatilis) in the Baltic Sea suggests increasing exposure to
environmental pollutants. Environmental Toxicology and Chemistry 28, 364-373.

Chapter 3 – Biomarkers in the stratified water column of the Landsort Deep
64
Hebting, Y., Schaeffer, P., Behrens, A., Adam, P., Schmitt, G., Schneckenburger, P.,
Bernasconi, S. M., Albrecht, P., 2006. Biomarker evidence for a major preservation
pathway of sedimentary organic carbon. Science 312, 1627-1631.
Hietanen, S., Jäntti, H., Buizert, C., Jürgens, K., Labrenz, M., Voss, M., Kuparinen, J.,
2012. Hypoxia and nitrogen processing in the Baltic Sea water column. Limnology
and Qceanography 57, 325-337.
Hinrichs, K. U., Hayes, J. M., Sylva, S. P., Brewer, P. G., DeLong, E. F., 1999. Methane-
consuming archaebacteria in marine sediments. Nature 398, 802-805.
Höglander, H., Larsson, U., Hajdu, S., 2004. Vertical distribution and settling of spring
phytoplankton in the offshore NW Baltic Sea proper. Marine Ecology Progress Series
283, 15-27.
Jakobs, G., Rehder, G., Jost, G., Kießlich, K., Labrenz, M., Schmale, O., 2013.
Comparative studies of pelagic microbial methane oxidation within the redox zones
of the Gotland Deep and Landsort Deep (central Baltic Sea). Biogeosciences 10,
7863-7875.
Jakobs, G., Holtermann, P., Berndmeyer, C., Rehder, G., Blumenberg, M., Jost, G.,
Nausch, G., Schmale, O., 2014. Seasonal and spatial methane dynamic in the water
column of the central Baltic Sea (Gotland Sea), Continental Shelf Research, under
review.
Kamyshny Jr., A., Yakushev, E. V., Jost, G., Podymov, O. I., 2013. Role of sulfide
oxidation intermediates in the redox balance of the oxic-anoxic interface of the
Gotland Deep, Baltic Sea. In: Yakushev, E. V. (Ed.). The handbook of environmental
chemistry. Springer, Berlin Heidelberg, 95-119, 2013.
Kannenberg, E. L. and Poralla, K., 1999. Hopanoid biosythesis and function in
bacteria. Naturwissenschaften 86, 168-176.
Kattner, G. and Krause, M., 1989. Seasonal variations of lipids (wax esters, fatty acids
and alcohols) in calanoid copepods from the North Sea, Marine Chemistry 26, 261-
275.

Chapter 3 – Biomarkers in the stratified water column of the Landsort Deep
65
Koga, Y., Nishihara, M., Morii, H., Akagawa-Matsushita, M., 1993. Ether polar lipids of
methanogenic bacteria: structures, comparative aspects, and biosynthesis.
Microbiological Reviews 57 164-182.
Kononen, K., Kuparinen, J., Mäkelä, K., Laanemets, J., Pavelson, J., Nõmman, S., 1996.
Initiation of cyanobacterial blooms in a frontal region at the entrance to the Gulf of
Finland, Baltic Sea. Limnology Oceanography 41, 98-112.
Köster, J., Volkman, J. K., Rullkötter, J., Scholz-Böttcher, B. M., Rethmeier, J., Fischer,
U., 1999. Mono-, di- and trimethyl-branched alkanes in cultures of the filamentous
cyanobacterium Calothrix scopulorum. Organic Geochemistry 30, 1367-1379.
Kuever, J., Könnecke, M., Galushko, A., Drzyzga, O., 2001. Reclassification of
Desulfobacterium phenolicum as Desulfobacula phenolica comb. nov. and description
of strain SaxT as Desulfotignum balticum gen. nov., sp. nov. International Journal of
Systematic and Evolutionary Microbiology 51, 171-177.
Labrenz, M., Jost, G., Jürgens, K., 2007. Distribution of abundant prokaryotic
organsims in the water column of the central Baltic Sea with an oxic-anoxic
interface. Aquatic Microbial Ecology 46, 177-190.
Lang, I., Hodac, L., Friedl, T., Feussner, I., 2011. Fatty acid profiles and their
distribution patterns in microalgae: a comprehensive analysis of more than 2000
strains from the SAG culture collection. BMC Plant Biology 11, 124-140.
Leblond, J. D., Anderson, B., Kofink, D., Logares, R., Rengefors, K., Kremp, A., 2007.
Fatty acid and sterol composition of two evolutinary closely related dinoflagellate
morphospecies from cold Scandinavian brackish and freshwaters. European Journal
of Phycology 41, 303-311.
Lee, R. F., Nevenzel, J. C., Paffenhöfer, G.-A., 1971. Importance of wax esters and other
lipids in the marine food chain: phytoplankton and copepods. Marine Biology 9, 99-
108.
Lehtonen, K. K., Schiedek, D., Köhler, A., Lang, T., Vuorinen, P. J., Förlin, L., Baršienė, J.,
Pempkowiak, J., Gercken, J., 2006. The BEEP project in the Baltic Sea: Overview of
Chapter 3 – Biomarkers in the stratified water column of the Landsort Deep
66
results and outline for a regional biological effects monitoring strategy. Marine
Pollution Bulletin 53, 523-537.
Liu, A., Zhu, T., Lu, X., Song, L., 2013. Hydrocarbon profiles and phylogenetic analyses
of diversified cyanobacterial species. Applied Energy 111, 383-393.
Mansour, M. P., Volkman, J. K., Jackson, A. E., Blackburn, S. I., 1999. The fatty acid and
sterol composition of five marine dinoflagellates. Journal of Phycology 35, 710-720.
Matsumoto, G. I., Akiyama, M., Watanuki, K., Torii, T., 1990. Unusual distribution of
long-chain n-alkanes and n-alkenes in Antarctic soil. Organic Geochemistry 15, 403-
412.
Matthäus, W. and Schinke, H., 1999. The influence of river runoff on deep water
conditions of the Baltic Sea. Hydrobiologia 393, 1-10.
Möllmann, C., Kornilovs, G., Sidrevics, L., 2000. Long-term dynamics of main
mesozooplankton species in the central Baltic Sea. Journal of Plankton Research 22,
2015-2038.
Möllmann, C. and Köster, F. W., 2002. Population dynamics of calanoid copepods and
the implications of their predation by clupeid fish in the Central Baltic Sea. Journal of
Plankton Research 24, 959-977.
Nanton, D. A. and Castell, J. D., 1999. The effects of temperature and dietary fatty
acids on the fatty acid composition of harpacticoid copepods, for use as a live food
for fish larvae. Aquaculture 175, 167-181.
Nichols, P. D., Smith, G. A., Antworth, C. P., Hanson, R. S., White, D. C., 1985.
Phospholipid and lipopolysaccharide normal and hydroxy fatty acids as potential
signatures for methane-oxidizing bacteria. FEMS Microbiology Ecology 0, 327-335.
Pancost, R. D., Hopmans, E. C., Sinninghe Damsté, J. S., s. s. party, T. M., 2001.
Archaeal lipids in Mediterranean cold seeps: molecular proxies for anaerobic
methane oxidation. Geochimica et Cosmochimica Acta 65, 1611-1627.

Chapter 3 – Biomarkers in the stratified water column of the Landsort Deep
67
Parkes, R. J. and Taylor, J., 1983. The relationship between fatty acid distributions
and bacterial respiratory types in contemporary marine sediments. Estuarine,
Coastal and Shelf Science 16, 173-189.
Parrish, C. C., Bodennec, G., Gentien, P., 1994. Time courses of intracellular and
extracellular lipid classes in batch cultures of the toxic dinoflagellate, Gymnodinium
cf. nagasakiense. Marine Chemisty 48, 71-82.
Parrish, C. C., Abrajano, T. A., Budge, S. M., Helleur, R. J., Hudson, E. D., Pulchan, K.,
Ramos, C., 2000. Lipid and Phenolic Biomarkers in Marine Ecosystems: Analysis and
Applications. In: Wangersky, P. J. (Ed.). The Handbook of Environmental Chemistry.
Springer Berlin Heidelberg, 193-223, 2000.
Pinkart, H. C., Ringelberg, D. B., Piceno, Y. M., Macnaughton, S. J., White, D. C., 2002.
Biochemical approaches to biomass measurements and community structure
analysis. In: Hurt, C. J. (Ed.). Manual of environmental microbiology, 2nd ed. ASM
Press, Washington, DC, 101-113, 2002.
Pugh, P. R., 1971. Changes in the fatty acid composition of Coscinodiscus eccentricus
with cultur-age and salinity. Marine Biology 11, 118-124.
Reissmann, J. H., Burchard, H., Feistel, R., Hagen, E., Lass, H. U., Mohrholz, V., Nausch,
G., Umlauf, L., Wieczorek, G., 2009. State-of-the-art review on vertical mixing in the
Baltic Sea and consequences for eutrophication. Progress in Oceanography 82, 47-
80.
Risse-Buhl, U., Trefzeger, N., Seifert, A.-G., Schönborn, W., Gleixner, G., Küsel, K., 2011.
Tracking the autochthonous carbon transfer in stream biofilm food webs. FEMS
Microbiology Ecology 79, 118-131.
Rush, D., Sinninghe Damsté, J. S., Poulton, S. W., Thamdrup, B., Garside, A. L.,
González, J. A., Schouten, S., Jetten, M. S. M., Talbot, H. M., 2014. Anaerobic
ammonium-oxidising bacteria: a biological source of the bacteriohopanetetrol
stereoisomer in marine sediments. Geochimica et Cosmochimimica Acta 140, 50-64.

Chapter 3 – Biomarkers in the stratified water column of the Landsort Deep
68
Sáenz, J. P., Wakeham, S. G., Eglinton, T. I., Summons, R. E., 2011. New constraints on
the provenance of hopanoids in the marine geologic record: Bacteriohopanepolyols
in marine suboxic and anoxic environments. Organic Geochemisty 42, 1351-1362.
Sargent, J. R., Gatten, R. R., McIntosh, R., 1977. Wax esters in the marine environment
- their occurence, formation, transformation and ultimate fates. Marine Chemistry 5,
573-584.
Schmale, O., Blumenberg, M., Kießlich, K., Jakobs, G., Berndmeyer, C., Labrenz, M.,
Thiel, V., Rehder, G., 2012. Microbial methane oxidation at the redoxcline of the
Gotland Deep (Baltic Sea). Biogeosciences 9, 4969-4977.
Schneider, B., Nausch, G., Kubsch, H., Petersohn, I., 2002. Accumulation of total CO2
during stagnation in the Baltic Sea deep water and its relationship to nutrient and
oxygen concentrations. Marine Chemistry 77, 277-291.
Schouten, S., Van der Maarel, M. J. E. C., Huber, R., Sinninghe Damsté, J. S., 1997.
2,6,10,15,19-Pentamethylicosenes in Methanolobus bombayensis, a marine
methanogenic archaeon, and in Methanosarcina mazei. Organic Geochemistry 26,
409-414.
Schouten, S., Wakeham, S. G., Sinninghe Damsté, J. S., 2001. Evidence for anaerobic
methane oxidation by archaea in euxinic waters of the Black Sea. Organic
Geochemistry 32, 1277-1281.
Schubert, C. J., Coolen, M. J., Neretin, L. N., Schippers, A., Abbas, B., Durisch-Kaiser, E.,
Wehrli, B., Hopmans, E. C., Damste, J. S., Wakeham, S., Kuypers, M. M., 2006. Aerobic
and anaerobic methanotrophs in the Black Sea water column. Environmental
Microbiology 8, 1844-1856.
Shamsudin, L., 1992. Lipid and fatty acid composition of microalgae used in
Malaysian aquaculture as live food for the early stage of penaeid larvae. Journal of
Applied Phycology 4, 371-378.
Shiea, J., Brassel, S. C., Ward, D. M., 1990. Mid-chain branched mono- and dimethyl
alkanes in hot spring cyanobacterial mats: A direct biogenic source for branched
alkanes in ancient sediments? Organic Geochemistry 15, 223-231.

Chapter 3 – Biomarkers in the stratified water column of the Landsort Deep
69
Sinninghe Damsté, J. S., Rijpstra, W. I. C., Schouten, S., Fuerst, J. A., Jetten, M. S. M.,
Strous, M., 2004. The occurrence of hopanoids in planctomycetes: implications for
the sedimentary biomarker record. Organic Geochemistry 35, 561-566.
Stal, L. J., Albertano, P., Bergmann, B., von Bröckel, K., Gallon, J. R., Hayes, P. K.,
Sivonen, K., Walsby, A. E., 2003. BASIC: Baltic Sea cyanobacteria. An investigation of
the structure and dynamics of water blooms of cyanobacteria in the Baltic Sea -
responses to a changing environment. Continental Shelf Research 23, 1695-1714.
Stock, A., Jürgens, K., Bunge, J., Stoeck, T., 2009. Protistan diversity in suboxic and
anoxic waters of the Gotland Deep (Baltic Sea) as revealed by 18S rRNA clone
libraries. Aquatic Microbial Ecology 55, 267-284.
Strom, S. L. and Morello, T. A., 1998. Comparative growth rates and yields of ciliates
and heterotrophic dinoflagellates. Journal of Plankton Research 20, 571-584.
Sturt, H. F., Summons, R. E., Smith, K., Elvert, M., Hinrichs, K. U., 2004. Intact polar
membrane lipids in prokaryotes and sediments deciphered by high-performance
liquid chromatography/electrospray ionization multistage mass spectrometry - new
biomarkers for biogeochemistry and microbial ecology. Rapid Communications in
Mass Spectrometry 18, 617-628.
Szewzyk, R. and Pfennig, N., 1987. Complete oxidation of catechol by the strictly
anaerobic sulfate-reducing Desulfobacterium catecholicum sp. nov. Archives of
Microbiology 147, 163-168.
Talbot, H. M., Watson, D. F., Murrel, J. C., Carter, J. F., Farrimond, P., 2001. Analysis of
intact bacteriohopanepolyols from methanotrophic bacteria by reversed-phase high-
performance liquid chromatography-atmospheric pressure chemical ionisation
mass spectrometry. Journal of Chromatography 921, 175-185.
Talbot, H. M. and Farrimond, P., 2007. Bacterial populations recorded in diverse
sedimentary biohopanoid distributions. Organic Geochemistry 38, 1212-1225.
Talbot, H. M., Summons, R. E., Jahnke, L. L., Cockell, C. S., Rohmer, M., Farrimond, P.,
2008. Cyanobacterial bacteriohopanepolyol signatures from cultures and natural
environmental settings. Organic Geochemistry 39, 232-263.
Chapter 3 – Biomarkers in the stratified water column of the Landsort Deep
70
Taylor, J. and Parkes, J., 1983. The cellular fatty acids of the sulphate-reducing
bacteria, Desulfobacter sp., Desulfobulbus sp. and Desulfovibrio desulfuricans. Journal
of General Microbiology 129, 3303-3309.
Thiel, V., Peckmann, J., Seifert, R., Wehrung, P., Reitner, J., Michaelis, W., 1999. Highly
isotopically depleted isoprenoids: molecular markers for ancient methane venting.
Geochimica et Cosmochimica Acta 63, 3959-3966.
Thureborn, P., Lundin, D., Plathan, J., Poole, A. M., Sjöberg, B.-M., Sjöling, S., 2013. A
metagenomics transect into the deepest point of the Baltic Sea reveals clear
stratification of microbial functional capacities. PLOS One 8 (9), e74983.
Tornabene, T. G. and Langworthy, T. A., 1979. Diphytanyl and dibiphytanyl glycerol
ether lipids of methanogenic archaebacteria. Science 203, 51-53.
Tornabene, T. G., Langworthy, T. A., Holzer, G., Orò, J., 1979. Sqalenes, phytanes and
other isoprenoids as major neutral lipids of methanogenic and thermoacidophilic
"archaebacteria". Journal of Molecular Evolution 13, 73-83.
Tyson, R. V. and Pearson, T. H., 1991. Modern and ancient continental shelf anoxia:
an overview. Geological Society, London, Special Publications 58, 1-24.
Vahtera, E., Conley, D. J., Gustafsson, B. G., Kuosa, H., Pitkänen, H., Savchuk, O. P.,
Tamminen, T., Viitasalo, M., Voss, M., Wasmund, N., Wulff, F., 2007. Internal
ecosystem feedbacks enhance nitrogen-fixing cyanobacteria blooms and complicate
management in the Baltic Sea. AMBIO 36, 186-194.
Vainshtein, M., Hippe, H., Kroppenstedt, R. M., 1992. Cellular fatty acid composition
of Desulfovibrio species and its use in classification of sulfate-reducing bacteria.
Systematic and Applied Microbiology 15, 554-556.
Vestal, R. J. and White, D. C., 1989. Lipid analysis in microbial ecology. BioScience 39,
535-541.
Volkman, J. K., 1986. A review of sterol markers for marine and terrigenous organic
matter. Organic Geochemistry 9, 83-99.
Chapter 3 – Biomarkers in the stratified water column of the Landsort Deep
71
Volkman, J. K., Barrett, S. M., Dunstan, G. A., Jeffrey, S. W., 1993. Geochemical
significance of the occurrence of dinosterol and other 4-methyl sterols in a marine
diatom. Organic Geochemistry 20, 7-15.
Volkman, J. K., Barrett, S. M., Blackburn, S. I., Mansour, M. P., Sikes, E. L., Gelin, F.,
1998. Microalgal biomarkers: A review of recent research developments. Organic
Geochemistry 29, 1163-1179.
Wakeham, S. G., 1989. Reduction of stenols to stanols in particulate matter at oxic-
anoxic boundaries in sea water. Nature 342, 787-790.
Wakeham, S. G., Amann, R., Freeman, K. H., Hopmans, E. C., Jørgensen, B. B., Putnam,
I. F., Schouten, S., Sinninghe Damsté, J. S., Talbot, H. M., Woebken, D., 2007. Microbial
ecology of the stratified water column of the Black Sea as revealed by a
comprehensive biomarker study. Organic Geochemistry 38, 2070-2097.
Wakeham, S. G., Turich, C., Schubotz, F., Podlaska, A., Xiaona, N. L., Varela, R., Astor,
Y., Sáenz, J. P., Rush, D., Sinninghe Damsté, J. S., Summons, R. E., Scranton, M. I.,
Taylor, G. T., Hinrichs, K. U., 2012. Biomarkers, chemistry and microbiology show
chemoautotrophy in a multilayer chemocline in the Cariaco Basin. Deep Sea
Research Part I 163, 133-156.
Wasmund, N., Nausch, G., Matthäus, W., 1998. Phytoplankton spring blooms in the
southern Baltic Sea - spatio temporal development and long-term trends. Journal of
Plankton Research 20, 1099-1117.
Welander, P. V., Coleman, M., Sessions, A. L., Summons, R. E., Newman, D. K., 2010.
Identification of a methylase required for 2-methylhopanoid production and
implications for the interpretation of sedimentary hopanes. PNAS 107, 8537-8542.
Widdel, F., 1987. New types of acetate-oxidizing, sulfate-reducing Desulfobacter
species, D. hydrogenophilus sp. nov., D. latus sp. nov., and D. curvatus sp. nov.
Archives of Microbiology 148, 286-291.
Xie, S., Liu, X.-L., Schubotz, F., Wakeham, S. G., Hinrichs, K. U., 2014. Distribution of
glycerol ether lipids in the oxygen minimum zone of the Eastern Tropical North
Pacific Ocean. Organic Geochemistry 71, 60-71.

72
Chapter 4 – Aerobic methanotrophy within the Gotland Deep pelagic redox-zone
73
4
Aerobic methanotrophy within the pelagic redox-zone of the Gotland Deep (central Baltic Sea)
Oliver Schmale, Martin Blumenberg, Kathrin Kießlich, Gunnar Jakobs, Christine
Berndmeyer, Matthias Labrenz, Volker Thiel, and Gregor Rehder
Biogeosciences (2012) 9: 4969-4977.
DOI:10.5194/bg-9-4969-2012, Open Access
4.1 Abstract
Water column samples taken in summer 2008 from the stratified Gotland Deep
(central Baltic Sea) showed a strong gradient in dissolved methane concentrations
from high values in the saline deep water (max. 504 nM) to low concentrations in
the less dense, brackish surface water (about 4 nM). The steep methane-gradient
(between 115 and 135m water depth) within the redox-zone, which separates the
anoxic deep part from the oxygenated surface water (oxygen concentration 0–0.8
mL L−1), implies a methane consumption rate of 0.28 nM d−1. The process of
microbial methane oxidation within this zone was evident by a shift of the stable
carbon isotope ratio of methane between the bottom water (δ13C CH4 = −82.4 ‰)
and the redoxzone (δ13C CH4 = −38.7 ‰). Water column samples between 80 and
119m were studied to identify the microorganisms responsible for the methane
turnover in that depth interval. Notably, methane monooxygenase gene expression
analyses for water depths covering the whole redox-zone demonstrated that
accordant methanotrophic activity was probably due to only one phylotype of the
aerobic type I methanotrophic bacteria. An imprint of these organisms on the
particular organic matter was revealed by distinctive lipid biomarkers showing
bacteriohopanepolyols and lipid fatty acids characteristic for aerobic type I
methanotrophs (e.g., 35-aminobacteriohopane-30,31,32,33,34-pentol),
corroborating their role in aerobic methane oxidation in the redox-zone of the
central Baltic Sea.
Chapter 4 – Aerobic methanotrophy within the Gotland Deep pelagic redox-zone
74
4.2 Introduction
Methane as an atmospheric trace gas is known to have a relevant impact on Earth’s
climate. Aquatic systems represent the most significant source of atmospheric
methane. However, the importance of the marine system seems to be marginal
(Bange et al., 1994), although enormous amounts of methane are formed in marine
sediments (Reeburgh, 2007). One effective mechanism that is limiting the flux of
methane from the sedimentary reservoir into the atmosphere is the microbial
oxidation of methane in the sediment and the water column (Reeburgh, 2007).
Comprehensive studies on aquatic sediments in different settings show that
methane is microbially oxidized by the use of different electron acceptors, with
oxygen being most important for the water column and sulfate for the sedimentary
turnover (Barnes and Goldberg, 1976; Reeburgh, 1976; Hinrichs and Boetius, 2002;
Reeburgh, 2007). Recently, anaerobic methane oxidation using iron, manganese and
nitrite has also been reported (Beal et al., 2009; Ettwig et al., 2010). Although these
processes are efficient and consume the main part of dissolved methane before it
escapes from the sediment/water interface, some parts of the ocean are
characterised by strongly elevated methane concentrations in the water column.
This holds particularly true for stagnant, oxygen-deficient basins like the Black Sea,
Cariaco Basin or central Baltic Sea (Scranton et al., 1993; Kessler et al., 2006;
Schmale et al., 2010a). Compared to the number of studies on the microbial
processes of methane oxidation in sediments, water column studies are scarce, and
could to date just identify the oxidation of methane through oxygen and sulfate
(Reeburgh, 2007 and references therein). Nevertheless, multidisciplinary studies in
the water column of the Black Sea could impressively demonstrate that the flux of
methane from the deep-water reservoir into the atmosphere is effectively buffered
by the microbial oxidation of methane under anaerobic and aerobic conditions
(Schouten et al., 2001; Schubert et al., 2006; Wakeham et al., 2007; Blumenberg et
al., 2007; Schmale et al., 2011).
Our present investigations were carried out in the Gotland Deep in the central part
of the Baltic Sea (Fig. 1). The Baltic Sea is a European semi-enclosed marginal sea
characterized by limnic to brackish surface water and more saline deep and bottom
water. Especially for the central deep basins of the Baltic Sea, this results in limited
vertical mixing, the development of a prominent redox-zone with oxic to anoxic

Chapter 4 – Aerobic methanotrophy within the Gotland Deep pelagic redox-zone
75
conditions, and the
formation of stable
biogeochemical zones
(Nausch et al., 2008). In
these basins, the stagnant
deep water can only be
renewed by strong temporal
inflow events of saline
oxygenated water from the
North Sea (Reissmann et al.,
2009) or by long-term
vertical transport
mechanisms mainly induced
by bottom boundary mixing
along the sloping
topography (Holtermann
and Umlauf, 2012). More frequent are weak inflows of North Sea water that are
periodically perturbing the intermediate water column stratification and
biogeochemical zones in the central basins (Matthäus et al., 2008). The Baltic Sea,
like other marginal seas, is characterized by high terrestrial inputs and production
rates of organic matter that are to a considerable extent accumulated and
decomposed in the sediment. Under anoxic conditions, the final step of
decomposition of organic matter leads to the generation of methane within the
sediment. In the Baltic Sea, pore-water as well as acoustic investigations
demonstrated that methane is abundant in high concentrations within the sediment
and that in some regions methane is also released as free or dissolved gas into the
water column (Dando et al., 1994; Piker et al., 1998; Thießen et al., 2006). Extensive
water column investigations in the Baltic Sea identified the strongest methane
enrichment within the stagnant anoxic water bodies of the deep basins (Gotland
Deep and Landsort Deep; max. 504 nM at 230 m water depth and 1058 nM at 435 m
water depth, respectively; Schmale et al., 2010b). In contrast, surface water methane
concentrations in these areas are only slightly enriched compared to the
atmospheric equilibrium, indicating an effective sink that prevents the escape of
Fig. 1: The Baltic Sea and the location of the Gotland Deep. The study area is indicated with a black dot.
Chapter 4 – Aerobic methanotrophy within the Gotland Deep pelagic redox-zone
76
methane from the deep water into the atmosphere (Schmale et al., 2010b). However,
little is as yet known about the processes that regulate the methane flux in this
environment. In this paper, we use a multidisciplinary approach that combines gas
chemistry, molecular biology and lipid biomarker geochemistry and present data on
a microbial methane sink within the pelagic redox-zone of the Gotland Deep. Thus,
this study aims to investigate whether aerobic methane oxidation also plays a role in
the more dynamic and turbulent redox-zone of the central Baltic Sea.
4.3 Methods
Samples were retrieved during a scientific cruise in summer 2008 with the German
research vessel Maria S. Merian (MSM 08/3, 18 June to 18 July. The Gotland Deep
(57°18’ N, 20°04’ E; Fig. 1) represents the deepest location in the eastern Gotland
Basin (water depth at our water station 231 m). The sampling strategy at this
location was directed at (1) identifying the depth interval of aerobic methane
oxidation within the redox-zone based on physical parameters and on board gas
chemistry, and (2) recovering samples from the relevant depth interval for home-
based molecular biological and lipid biomarker studies to identify the
microorganisms involved in methane oxidation. These samples were taken within a
time frame of 3 days and with different sampling equipment (as described below).
4.3.1 Physical parameters and gas chemistry
Water stations for analyses of the gas chemistry were carried out with a rosette
water sampler equipped with twenty-four 10 L Hydro-bios Free Flow bottles. For
continuous CTD and turbidity profiling a Seabird sbe911+ system, together with a
turbidity sensor (ECO FLNTU, WET Labs) were attached to the underwater unit.
The oxygen distribution was measured according to Winkler’s method, whereas
hydrogen sulfide was analysed colorimetrically with the methylene blue method
(Grasshoff et al., 1983).
Water samples (600 mL) for methane analyses were transferred directly from the
sample bottle into pre-evacuated 1100 mL glass bottles. Dissolved methane was
extracted using a vacuum degassing method and its mole fraction was determined
with a gas chromatograph equipped with a flame ionisation detector (Trace GC,
Thermo Electron). The average precision of this method is ± 3% (Keir et al., 2009).
Chapter 4 – Aerobic methanotrophy within the Gotland Deep pelagic redox-zone
77
For the determination of δ13C CH4 values, subsamples of the extracted gas were
analysed at the Leibniz Institute for Baltic Sea Research Warnemünde using an
isotope-ratio mass spectrometer (modified after Schmale et al., 2010a). These
subsamples were collected in 10 mL pre-evacuated crimp-top glass vials containing
4 mL of supersaturated salt solution (degassed Millipore water, poisoned with
HgCl2) and sealed with a butyl rubber septum. Stable carbon isotope analysis
involved removal of water and carbon dioxide on a NaOH/Ascarite trap, double
cryofocusing at −110 °C (ethanol/nitrogen) on Hayesep D and Poraplot S columns,
gas-release by heating the traps separately to 40 °C and gas separation on a
MolSieve 5A Plot capillary column (Supelco, 30 m, I.D. 0.32 mm) at 30 °C (Trace GC
Ultra, Thermo Electron), combustion to CO2 using a Ni catalyst at 1050 °C, removal
of combustion water using a Nafion trap, and injection into a MAT 253 mass
spectrometer (Thermo Electron, Bremen) using a continuous flow technique. The
δ13C CH4 data is expressed vs. Vienna Pee Dee Belemnite (VPDB) standard.
Calibration of the system was performed daily by the use of a CH4 standard with
known isotopic composition. The average precision of that method is ± 1‰.
4.3.2 pmoA gene expression analyses
Within the identified redox-zone filter samples were taken in 80, 100, 105 and 119
m water depth using a rosette water sampler. 1000 mL of sample water were
filtered on a Durapore filter (0.2 μm pore size), frozen in liquid nitrogen and stored
at −80 °C.
For each sample RNA was extracted from the frozen filter with acidic phenol
(Weinbauer et al., 2002) and quantified using a NanoDrop ND-1000 spectrometer
(NanoDrop Technologies). To generate pmoA-specific cDNA, 100 ng RNA was
reverse transcribed using the iScript Select cDNA Synthesis Kit (Biorad) and reverse
primer mb661r (Costello and Lidstrom, 1999). To detect potential DNA
contamination one sample was incubated without reverse transcriptase. 1 μL of
cDNA was amplified by Polymerase Chain Reaction (PCR). For the generation of
specific GC-clamped PCR products a discontinuous PCR was applied: reactions (50
μL) containing 1×PCR buffer, 200 μM of each dNTP, 0.3 μM reverse primer mb661r,
0.1 μM forward primer A189f (Holmes et al., 1995), 0.5mM MgCl2, 0.5 μL polymerase
(Herculase II, Fusion) and template cDNA were incubated at initial 94 °C for 5 min.
Chapter 4 – Aerobic methanotrophy within the Gotland Deep pelagic redox-zone
78
After 20 cycles of 60 s at 94 °C, 60 s at 56 °C and 30 s at 72 °C, the PCR was paused at
72 °C and 0.12 μM A189f GC primer were added to each reaction. Afterwards the
PCR was resumed for another 15 cycles with conditions as described above,
followed by a final elongation step of 5 min at 72 °C. Specificity of the PCR products
was documented by agarose gel electrophoresis and staining with ethidium
bromide. The described discontinuous PCR yielded more specific and distinct PCR
products than a conventional PCR with GC-primer (data not shown).
PCR products were separated by Denaturing Gradient Gel Electrophoresis (DGGE)
using a gradient of 35% to 80% denaturant in a 6% polyacrylamide gel.
Electrophoresis ran at 100 V and 60 °C for 16 h in 1×TAE buffer. The gel was stained
with a 1 : 5000 dilution of SYBRGold (Invitrogen) for 30 min. All bands from each
depth were excised and reamplified in a PCR reaction containing 1×PCR buffer, 0.3
μM of A189f and mb661r each, 200 μM of each dNTP and 0.5 μL polymerase in 30
cycles with an annealing temperature of 56 °C. PCR products were purified with
NucleoSpin purification kit (Macherey-Nagel) and sequenced with primers A189f
and mb661r by AGOWA (Berlin, Germany). Forward and reverse sequences were
checked for quality applying Seqman software (DNASTAR).
For phylogenetic analysis the ARB software package was used (Ludwig et al., 2004).
Alignment was based on partial DNA sequences of pmoA and amoA genes obtained
from GenBank Database with partial sequences of amoA (Accession numbers:
AF037107, AF043710, AF037108) serving as an outgroup in the tree construction.
Sequences for analysis were reduced to unambiguously alignable positions.
Three different trees were calculated using the algorithms maximum likelihood
(PHYML), maximum parsimony and neighbour-joining with Jukes-Cantor correction.
Nucleotide sequence accession numbers are deposited in the GenBank database
(accession number KC188735).
4.3.3 Lipid biomarkers
For lipid biomarker studies a sample was selected from the centre of the redox-zone
at 100 m water depth. That depth was chosen to obtain a POM sample that reflects
the in situ microbial turnover of methane under low-oxygen conditions and is not
“contaminated” by external water masses (i.e. increased oxygen concentrations or
anoxic conditions) which may also include other methane consuming

Chapter 4 – Aerobic methanotrophy within the Gotland Deep pelagic redox-zone
79
microorganisms (e.g. consortia performing the anaerobic oxidation of methane). 214
L of water were filtered on glass microfiber filters (Ø 30 cm; 0.7 μm pore size) over a
time span of two hours using a PUMP-CTD system (Strady et al., 2008). Half of the
filter was extracted in triplicate with dichloromethane and methanol (3 : 1, v : v) in a
CEM Mars 5 microwave (Matthews, NC) at 80 °C and 800 W. An aliquot of the sample
was acetylated with acetic acid/pyridine as described elsewhere (Blumenberg et al.,
2007) and analyzed using high performance liquid chromatography-mass
spectrometry (LC-MS). LC-MS was performed using a Varian Prostar Dynamax HPLC
system coupled to a Varian 1200 L triple quadrupole mass spectrometer (for
analytical details see Blumenberg et al., 2010). Another aliquot of the extract was
separated by column chromatography into a hydrocarbon (F1), an alcohol and
ketone (F2), and a polar fraction (F3) using a column (Ø 1 cm) filled with 7.5 g silica
gel 60 (according to Blumenberg et al., 2010). (F3) was transmethylated using
trimethylchlorosilane in methanol (1 : 8; v : v; 1.5 h at 80 °C). Double bond positions
within unsaturated fatty acid methyl esters were determined by derivatisation with
dimethyldisulfide (DMDS; method modified after Carlson et al., 1989 and Gatellier et
al., 1993). The polar fraction (F3), and the DMDS derivatized sample were analysed
with coupled gas chromatography-mass spectrometry (GC-MS) using a Varian CP-
3800 gas chromatograph equipped with a fused silica column (Phenomenex Zebron
ZB-5MS, 30 m, I.D. 0.32 mm) coupled to a Varian 1200L mass spectrometer. He was
used as carrier gas. The temperature program was 80 °C (3 min) to 310 °C (held 25
min) at 4 °C min−1. Compounds were identified by comparing mass spectra and
retention times to published data. δ13C values of fatty acid methyl esters from the
polar fraction (F3) were measured in replicate as described previously (Blumenberg
et al., 2010). The precision was generally better than 0.5‰ .
4.4 Results and discussion 4.4.1 Physical parameters and gas chemistry
The estuarine circulation in the Baltic Sea causes a strong vertical salinity gradient
between the surface and deep water (Lass and Matthäus, 2008). This gradient is
very pronounced in the deep basins of the central Baltic Sea (e.g. Gotland and
Landsort Deep; Fig. 2) and reflects a water column stratification that limits the
vertical mixing and water renewal in the deep strata (Reissmann et al., 2009).

Chapter 4 – Aerobic methanotrophy within the Gotland Deep pelagic redox-zone
80
Oceanographic
investigations, carried out
at the redox-zone of the
Gotland Deep, show that
this depth is periodically
perturbed by intrusions,
internal waves or eddies
which can shift the
amplitudes of isoclines up
to 10 m within time spans
less than an hour (shown
for temperature and
salinity in Lass et al.,
2003; Dellwig et al.,
2012). During sampling,
the specific water column
structure led to oxygen
deficiency below a water depth of about 80 m. Further downward, the oxygen
concentrations decreased below 0.8 mL L−1, characterizing the redox-zone between
the oxic surface and anoxic deep waters. The lower boundary of the redox-zone was
located at about 138 m water depth where the concentration of hydrogen sulfide
(H2S) started to increase. A distinct turbidity anomaly was observed at about 120 m
water depth (Fig. 2). This specific feature is known from other anoxic basins like the
Black Sea and is most likely caused by the precipitation of iron and manganese
oxides (Kempe et al., 1991) and an enrichment of particulate organic matter (POM)
due to enhanced microbial activity (Prokhorenko et al., 1994). The concentrations of
H2S and other reduced chemical species like ammonium (NH4+) are constantly
increasing with depth, indicating an upward flux from the sediment or deep water
towards the redox-zone (Nausch et al., 2008). The same concentration pattern was
observed for methane (Fig. 2). Highest methane concentrations were detected close
to the seafloor (504 nM at 230 m water depth) supporting an origin from
methanogenesis in the sediment (Piker et al., 1998). Indeed, low δ13C CH4 values
(−82.4‰ to −75.2 ‰, Fig. 2) observed in the anoxic water body clearly point at a
Fig. 2: Left: vertical distribution of salinity (black), temperature (red), and turbidity (grey). Right: vertical distribution of oxygen and hydrogen sulfide (expressed as negative oxygen equivalents, blue), methane (red), and δ13C value of methane (green). The depth interval of the redox-zone is displayed in grey (oxygen concentration 0–0.8mL L−1). The water depths for molecular biological and lipid biomarker studies are indicated with colored horizontal lines (black=molecular biology, red=molecular biology together with lipid biomarkers).
Chapter 4 – Aerobic methanotrophy within the Gotland Deep pelagic redox-zone
81
microbial methane source (Whiticar, 1999). The methane concentration profile
shows a pronounced decrease within the redox-zone from 124 nM at 135 m water
depth to 4.8 nM at 115 m water depth. At the same time, δ13C CH4 values
substantially increase (up to −38.7‰ at 80 m water depth). As microbial reactions
favour the incorporation of 12C and thus, enrichment in 13CH4 in the residual
methane pool, this isotopic shift clearly indicates microbial methane oxidation
within that water level (Whiticar, 1999). In a first approximation the methane
oxidation rate can be derived from the methane gradient and the vertical transport
velocity. Using the vertical diffusivity (kz) of 0.95 m2 d−1 (Axell, 1998) in
combination with the methane distribution between 115 m (4.8 nM) and at 135 m
water depth (124 nM) this calculation leads to a flux of methane of 5.7 μmol m−2 d−1.
If we assume that this flux is oxidized within the 20 m depth interval, we receive a
methane consumption rate of 0.28 nM d−1. An inverse trend in methane carbon
isotope ratios is observed above the suboxic layer (Fig. 2; δ13C ratios between
−59.9‰ and −48.5 ‰). This trend is probably caused by (1) the downward
ventilation ofatmospheric methane (−47.4 ‰; http://www.esrl.noaa.gov
/gmd/ccgg/ iadv/), and/or (2) microbial methane production in shallow waters.
The process of methane formation in an oxygenated water column has been
observed in many regions (Holmes et al., 2000; Schmale et al., 2010a) and seems to
be related to the decay of methylphosphonates, in particular under phosphate-
limiting conditions, and/or methanogenesis in the anoxic interior of particles (Karl
et al., 2008). Such methane forming processes are also indicated in our dataset by a
pronounced 13CH4 depletion at 20 m water depth (δ13C = −59.9 ‰) together with
slightly elevated methane concentrations of 7 nM (surrounding water depths around
4 nM). However, within the surface water, methane is only slightly enriched
compared with the atmospheric equilibrium (144% saturation ratio; Schmale et al.,
2010b), indicating that the local emission of methane into the atmosphere is rather
low.
4.4.2 Methanotrophic microorganisms within the redox-zone
Chemical gradients feature versatile environments and are known to harbour
enhanced microbial abundance and activity. Within the redox-zone of the central
Baltic Sea, various biogeochemical processes have been identified, such as

Chapter 4 – Aerobic methanotrophy within the Gotland Deep pelagic redox-zone
82
denitrification, ammonia
oxidation, or dark CO2
fixation (Labrenz et al.,
2005; Jost et al., 2008;
Glaubitz et al., 2009;
Labrenz et al., 2010) and
also microbial
consumption of methane
was proposed as
mechanism explaining the
strong methane decrease
in this water layer
(Schmale et al., 2010a). To
gain information on the
contribution of
methanotrophic
microorganisms to the
POM within the redox-zone, we performed expression analyses of the methane
monooxygenase gene (pmoA), and studied concentrations and distributions of
bacteriohopanepolyols (BHPs). The presence of methanotrophic bacteria was
proved by molecular biological studies carried out on samples obtained from 80,
100, 105 and 119 m water depth (Fig. 2). Although the two groups of
methanotrophs, type I and type II, use different physiological pathways for the
assimilation of carbon from methane, namely the ribulose monophosphate pathway
and the serine pathway, the key enzyme methane monooxygenase responsible for
the initial oxidation of methane to methanol is present in both groups. The gene
coding for the alpha subunit of the particulate form of the enzyme (pmoA) has been
used as a marker for the detection and characterization of methanotrophic
communities in different habitats (Costello and Lidstrom, 1999; Bourne et al., 2001;
Chen et al., 2007; Chen et al., 2008). In order to identify active methanotrophs we
investigated pmoA gene expression in situ. Based on DGGE analysis only one type of
pmoA transcript, named Uncultured GotDeep pmoA1, was present throughout the
redox-zone. Phylogenetically it is affiliated with the type I methanotrophs and
Fig. 3: Unrooted maximum likelihood tree showing the phylogenetic affiliation of the partial pmoA DNA sequence generated from the filter samples taken in 80, 100, 105 and 119m water depth (marked bold). Black circles=validation of subtree by neighbourjoining and parsimony; white circles=validation of subtree by parsimony; black diamond=validation of subtree by neighbourjoining. Scale bar represents 10 substitutions per 100 nucleotides. For tree construction partial amoA sequences were used as an outgroup (not shown).
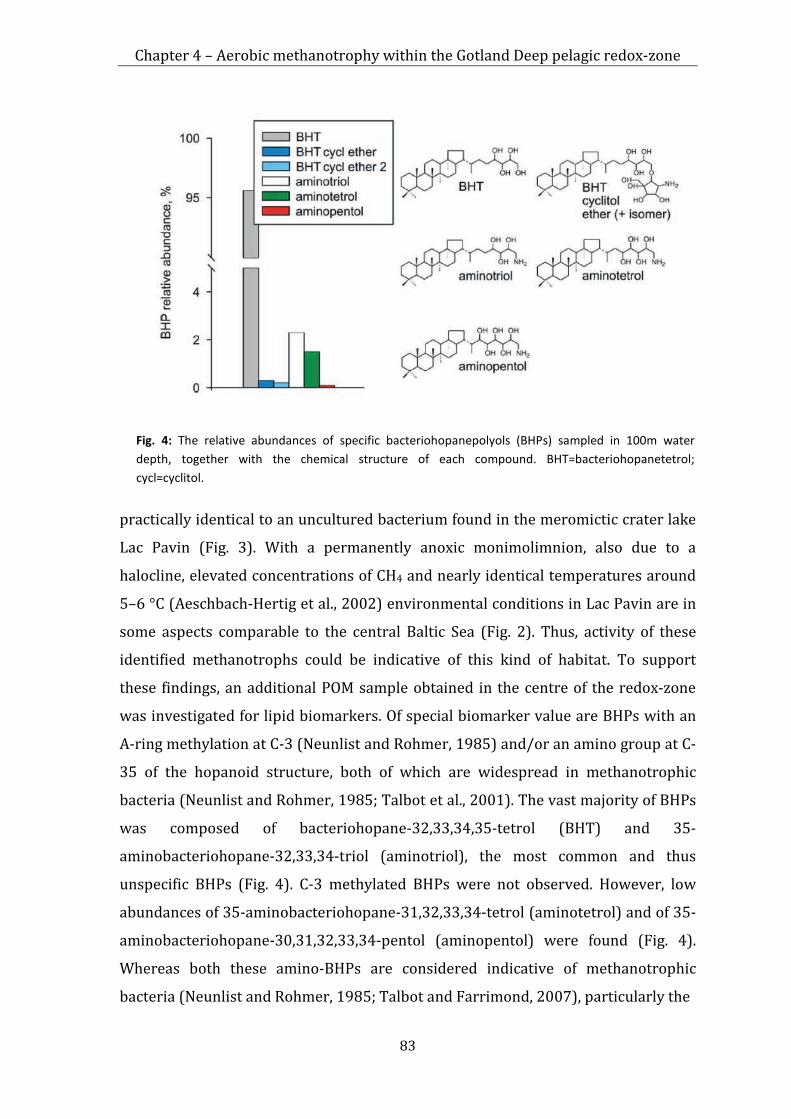
Chapter 4 – Aerobic methanotrophy within the Gotland Deep pelagic redox-zone
83
practically identical to an uncultured bacterium found in the meromictic crater lake
Lac Pavin (Fig. 3). With a permanently anoxic monimolimnion, also due to a
halocline, elevated concentrations of CH4 and nearly identical temperatures around
5–6 °C (Aeschbach-Hertig et al., 2002) environmental conditions in Lac Pavin are in
some aspects comparable to the central Baltic Sea (Fig. 2). Thus, activity of these
identified methanotrophs could be indicative of this kind of habitat. To support
these findings, an additional POM sample obtained in the centre of the redox-zone
was investigated for lipid biomarkers. Of special biomarker value are BHPs with an
A-ring methylation at C-3 (Neunlist and Rohmer, 1985) and/or an amino group at C-
35 of the hopanoid structure, both of which are widespread in methanotrophic
bacteria (Neunlist and Rohmer, 1985; Talbot et al., 2001). The vast majority of BHPs
was composed of bacteriohopane-32,33,34,35-tetrol (BHT) and 35-
aminobacteriohopane-32,33,34-triol (aminotriol), the most common and thus
unspecific BHPs (Fig. 4). C-3 methylated BHPs were not observed. However, low
abundances of 35-aminobacteriohopane-31,32,33,34-tetrol (aminotetrol) and of 35-
aminobacteriohopane-30,31,32,33,34-pentol (aminopentol) were found (Fig. 4).
Whereas both these amino-BHPs are considered indicative of methanotrophic
bacteria (Neunlist and Rohmer, 1985; Talbot and Farrimond, 2007), particularly the
Fig. 4: The relative abundances of specific bacteriohopanepolyols (BHPs) sampled in 100m water depth, together with the chemical structure of each compound. BHT=bacteriohopanetetrol; cycl=cyclitol.
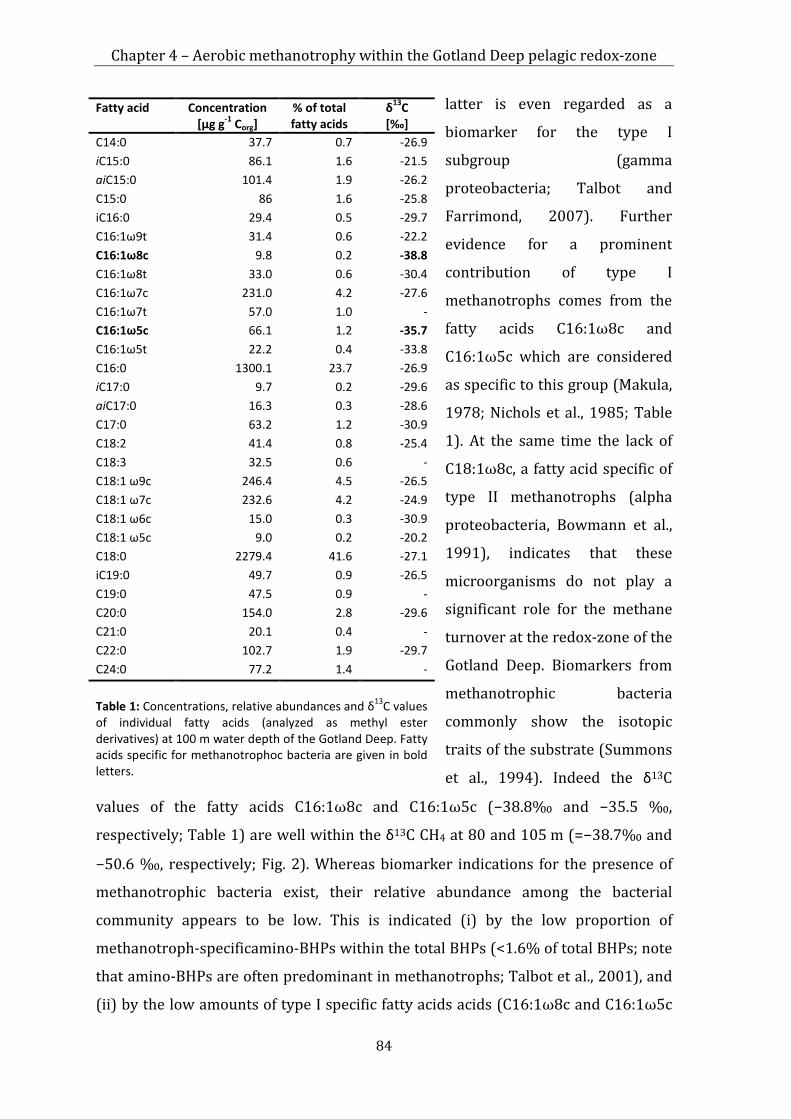
Chapter 4 – Aerobic methanotrophy within the Gotland Deep pelagic redox-zone
84
latter is even regarded as a
biomarker for the type I
subgroup (gamma
proteobacteria; Talbot and
Farrimond, 2007). Further
evidence for a prominent
contribution of type I
methanotrophs comes from the
fatty acids C16:1ω8c and
C16:1ω5c which are considered
as specific to this group (Makula,
1978; Nichols et al., 1985; Table
1). At the same time the lack of
C18:1ω8c, a fatty acid specific of
type II methanotrophs (alpha
proteobacteria, Bowmann et al.,
1991), indicates that these
microorganisms do not play a
significant role for the methane
turnover at the redox-zone of the
Gotland Deep. Biomarkers from
methanotrophic bacteria
commonly show the isotopic
traits of the substrate (Summons
et al., 1994). Indeed the δ13C
values of the fatty acids C16:1ω8c and C16:1ω5c (−38.8‰ and −35.5 ‰,
respectively; Table 1) are well within the δ13C CH4 at 80 and 105 m (=−38.7‰ and
−50.6 ‰, respectively; Fig. 2). Whereas biomarker indications for the presence of
methanotrophic bacteria exist, their relative abundance among the bacterial
community appears to be low. This is indicated (i) by the low proportion of
methanotroph-specificamino-BHPs within the total BHPs (<1.6% of total BHPs; note
that amino-BHPs are often predominant in methanotrophs; Talbot et al., 2001), and
(ii) by the low amounts of type I specific fatty acids acids (C16:1ω8c and C16:1ω5c
Fatty acid Concentration [µg g-1 Corg]
% of total fatty acids
δ13C [‰]
C14:0 37.7 0.7 -26.9 iC15:0 86.1 1.6 -21.5 aiC15:0 101.4 1.9 -26.2 C15:0 86 1.6 -25.8 iC16:0 29.4 0.5 -29.7 C16:1ω9t 31.4 0.6 -22.2 C16:1ω8c 9.8 0.2 -38.8 C16:1ω8t 33.0 0.6 -30.4 C16:1ω7c 231.0 4.2 -27.6 C16:1ω7t 57.0 1.0 - C16:1ω5c 66.1 1.2 -35.7 C16:1ω5t 22.2 0.4 -33.8 C16:0 1300.1 23.7 -26.9 iC17:0 9.7 0.2 -29.6 aiC17:0 16.3 0.3 -28.6 C17:0 63.2 1.2 -30.9 C18:2 41.4 0.8 -25.4 C18:3 32.5 0.6 - C18:1 ω9c 246.4 4.5 -26.5 C18:1 ω7c 232.6 4.2 -24.9 C18:1 ω6c 15.0 0.3 -30.9 C18:1 ω5c 9.0 0.2 -20.2 C18:0 2279.4 41.6 -27.1 iC19:0 49.7 0.9 -26.5 C19:0 47.5 0.9 - C20:0 154.0 2.8 -29.6 C21:0 20.1 0.4 - C22:0 102.7 1.9 -29.7 C24:0 77.2 1.4 - Table 1: Concentrations, relative abundances and δ13C values of individual fatty acids (analyzed as methyl ester derivatives) at 100 m water depth of the Gotland Deep. Fatty acids specific for methanotrophoc bacteria are given in bold letters.

Chapter 4 – Aerobic methanotrophy within the Gotland Deep pelagic redox-zone
85
represent 1.4% of total fatty acids). Thus, in contrast to studies in the redox-zone of
the Black Sea, where indications for type I, II and X were found (Gal’chenko et al.,
1988; Durisch-Kaiser et al., 2005; Blumenberg et al., 2007), the diversity of active
aerobic methanotrophs in the redox-zone of the Gotland Deep seemed to be
restricted. These findings are only based on one dataset, but it would be in line with
previous studies investigating the microbial catalysts of denitrification, nitrification,
or dark CO2 fixation in central Baltic Sea redox-zones which also revealed that these
pathways were actively driven by only a few bacterial or archaeal key species (Grote
et al., 2008; Glaubitz et al., 2009; Labrenz et al., 2010). An explanation for the
reduced diversity of active microorganisms along the central Baltic Sea redox-zone
could be the periodic perturbation of the stratification which does not occur in the
same strength and frequency in the Black Sea. An overlap of sulfide- and oxygen-
containing waters can occur in the Gotland Basin (Axell, 1998), and it is known that
sulfide is toxic for many organisms or at least can inhibit the activity of specific
microorganisms (Erguder et al., 2009). Thus, potential sulfide stress could inhibit
other than type I methanotrophic bacteria within the redox-zone of the Gotland
Deep, but this interesting aspect needs further investigation.
4.5 Conclusions
Using a multidisciplinary approach of gas chemistry, molecular biology, and lipid
geochemistry, we identified the process of aerobic methane oxidation within the
pelagic redox-zone of the Gotland Deep (central Baltic Sea). This was evidenced by a
strong decrease in methane concentrations together with a 13C CH4 enrichment, the
detection of the key enzyme methane monooxygenase (pmoA), and the occurrence of
lipids specific for methanotrophic bacteria (e.g., aminopentol; 16:1ω8c fatty acid).
Phylogenetic and biomarker data indicate that the diversity of active aerobic
methanotrophs in the redox-zone of the Gotland Deep was restricted to members of
the type I subgroup. In contrast to other marine settings with a permanent
stratification, e.g. the Black Sea, the physical and biogeochemical structure of the
Gotland Deep is periodically disturbed by intrusions, eddies, internal waves or long-
term vertical transport mechanisms. How this variable environment is affecting the
methane turnover in the water column and the microbial community responsible for
this process is an interesting question that needs to be investigated in future studies.

Chapter 4 – Aerobic methanotrophy within the Gotland Deep pelagic redox-zone
86
Also the transferability of our results on a basin scale needs to be addressed as some
parts of the basin (e.g. the basin boundaries) are permanently influenced by
intrusions and elevated vertical mixing that might influence the processes involved
in the turnover of methane.
Acknowledgments
We thank the captain, officers and crew aboard R/V Maria S. Merian (MSM 08/3) for
their assistance on sea. We gratefully acknowledge the efforts of G. Nausch and S.
Krüger in carrying out the oxygen and hydrogen sulfide analysis as well as the CTD
work on the cruise. We also thank J. Dyckmans (Centre for Stable Isotope Research
and Analysis, University of Göttingen) for help with compound specific carbon
isotope analysis and T. Licha and K. Nödler for support with LC-MS analyses. We
thank Marcus Elvert and an unknown reviewer for their thoughtful reviews and
comments. The study was supported by the Deutsche Forschungsgemeinschaft
(DFG) through grants SCHM 2530/2-1, BL 971/3-1, and BL 971/1-3.
References
Aeschbach-Hertig, W., Hofer, M., Schmid, M., Kipfer, R., Imboden, D. M., 2002. The
physical structure and dynamics of a deep, meromictic crater lake (Lac Pavin,
France). Hydrobiologia 487, 111–136.
Axell, L. B., 1998. On the variability of Baltic Sea deepwater mixing. Journal of
Geophysical Research: Oceans 103, 21667–21682.
Bange, H.W., Bartell, U. H., Rapsomanikis, S., Andreae, M. O., 1994. Methane in the
Baltic and Noth Seas and a reassessment of the marine emission of methane. Global
Biogeochemical Cycles 8, 465– 480.
Barnes, R. O. and Goldberg, E. D., 1976. Methane production and consumption in
anaerobic marine sediments. Geology, 4, 297–300.
Beal, E. J., House, C. H., Orphan, V. J., 2009. Manganese- and iron-dependent marine
methane oxidation. Science 325, 184–187.

Chapter 4 – Aerobic methanotrophy within the Gotland Deep pelagic redox-zone
87
Blumenberg, M., Seifert, R., Michaelis, W., 2007. Aerobic methanotrophy in the oxic-
anoxic transition zone of the Black Sea water column. Organic Geochemistry 38, 84-
91.
Blumenberg, M., Mollenhauer, G., Zabel, M., Reimer, A., Thiel, V., 2010. Decoupling of
bio- and geohopanoids in sediments of the Benguela Upwelling System (BUS).
Organic Geochemistry 41, 1119–1129.
Bourne, D. G., McDonald, I. R., Murrell, J. C., 2001. Comparison of pmoA PCR primer
sets as tools for investigating methanotroph diversity in three Danish soils, Applied
and Environmental Microbiology 67, 3802–3809.
Bowmann, J. P., Skerratt, J. H., Nichols, P. D., Sly, L. I., 1991. Phospholipid fatty acid
and lipopolysaccharide fatty acid signature lipids in methane-utilizing bacteria.
FEMS Microbiology Ecology 85, 15–22.
Carlson, D. A., Roan, C. S., Yost, R. A., Hector, J., 1989. Dimethyl disulfide derivatives
of long chain alkenes, alkadienes, and alkatrienes for gas chromatography/mass
spectrometry. Analytical Chemistry 61, 1564–1571.
Chen, Y., Dumont, M. G., Cébron, A., Murrell, J. C., 2007. Identification of active
methanotrophs in a landfill cover soil through detection of expression of 16S rRNA
and functional genes. Environmental Microbiology 9, 2855–2869.
Chen, Y., Dumont, M. G., McNamara, N. P., Chamberlain, P. M., Bodrossy, L., Stralis-
Pavese, N., Murrell, J. C., 2008. Diversity of the active methanotrophic community in
acidic peatlands as assessed by mRNA and SIP-PLFA analyses. Environmental
Microbiology 10, 446–459.
Costello, A. M. and Lidstrom, M. E., 1999. Molecular characterization of fuctional and
phylogenetic genes from natural populations of methanotrophs in lake sediments.
Applied and Environmental Microbiology 65, 5066–5074.
Dando, P. R., O’Hara, S. C. M., Schuster, U., Taylor, L. J., Clayton, C. J., Baylis, S., Laier, T.,
1994. Gas seepage from a carbonate-cemented sandstone reef on the Kattegat coast
of Denmark, Marine and Petroleum Geology 11, 182–189.

Chapter 4 – Aerobic methanotrophy within the Gotland Deep pelagic redox-zone
88
Dellwig, O., Schnetger, B., Brumsack, H.-J., Grossart, H.-P., Umlauf, L., 2012. Dissolved
reactive manganese at pelagic redoxclines (part II): Hydrodynamic conditions for
accumulation. Journal of Marine Systems 90, 31–41.
Durisch-Kaiser, E., Klauser, L., Wehrli, B., Schubert, C., 2005. Evidence of intense
archaeal and bacterial methanotrophic activity in the Black Sea water column.
Applied and Environmental Microbiology 71, 8099–8106.
Erguder, T. H., Boon, N., Wittebolle, L., Marzorati, M., Verstraete, W., 2009.
Environmental factors shaping the ecological niches of ammonia-oxidizing archaea.
FEMS Microbiology Reviews 33, 855– 869.
Ettwig, K. F., Butler, M. K., Le Paslier, D., Pelletier, E., Mangenot, S., Kuypers, M. M. M.,
Schreiber, F., Dutilh, B. E., Zedelius, J., de Beer, D., Gloerich, J., Wessels, H. J. C. T., van
Alen, T., Luesken, F., Wu, M. L., van de Pas-Schoonen, K. T., Op den Camp, H. J. M.,
Janssen-Megens, E. M., Francoijs, K.-J., Stunnenberg, H., Weissenbach, J., Jetten, M. S.
M., Strous, M., 2010. Nitrite-driven anaerobic methane oxidation by oxygenic
bacteria. Nature 464, 543–548.
Gal’chenko, V. F., Abranochkina, F. N., Bezukova, L. V., Sokolova, E. N., Ivanov, M. V.,
1988. Species composition of the aerobic methanotrophic microflora of the Black
Sea. Microbiology 57, 305–311.
Gatellier, J.-P. L. A., de Leeuw, J. W., Sinninghe Damst´e, J. S., Derenne, S., Largeau, C.,
Metzger, P., 1993. A comparative study of macromolecular substances of a
Coorongite and cell walls of the extant alga Botryococcus braunii, Geochimica et
Cosmochimica Acta 57, 2053–2068.
Glaubitz, S., Lueders, T., Abraham, W.-R., Jost, G., Jürgens, K., Labrenz, M., 2009. 13C-
isotope analyses reveal that chemolithoautotrophic Gamma- and
Epsilonproteobacteria feed a microbial food web in a pelagic redoxcline of the
central Baltic Sea. Environmental Microbiology 11, 326–337.
Grasshoff, K., Erhardt, M., Kremling, K. (Eds), 1983. Methods of seawater analysis.
Verlag Chemie, Weinheim, Germany.
Chapter 4 – Aerobic methanotrophy within the Gotland Deep pelagic redox-zone
89
Grote, J., Jost, G., Labrenz, M., Herndl, G. J., Jürgens, K., 2008. Epsilonproteobacteria
represent the major portion of chemoautotrophic bacteria in sulfidic waters of
pelagic redoxclines of the Baltic and Black Seas, Applied and Environmental
Microbiology 74, 7546– 7551.
Hinrichs, K. U. and Boetius, A., 2002. The anaerobic oxidation of methane: new
insights in microbial ecology and biogeochemistry. In: Wefer, G., Billett, D., Hebbeln,
D., Jørgensen, B. B., Schlüter, M., Van Weering, T. (Eds). Ocean Margin Systems.
Springer Verlag, Berlin Heidelberg, 457–477.
Holmes, A. J., Costello, A., Lidstrom, M. E., Murrell, J. C., 1995. Evidence that
participate methane monooxygenase and ammonia monooxygenase may be
evolutionarily related. FEMS Microbiology Letters 132, 203–208.
Holmes, M. E., Sansone, F. J., Rust, T. M., Popp, B. N., 2000. Methane production,
consumption, and air-sea exchange in the open ocean: an evaluation based on
carbon isotopic ratios. Global Biogeochemical Cycles 14, 1–10.
Holtermann, P. L. and Umlauf, L., 2012. The Baltic Sea tracer release experiment: 2.
Mixing processes, Journal of Geophysical Research 117, C01022.
Jost, G., Zubkov, M. V., Yakushev, E. V., Labrenz, M., Jürgens, K., 2008. High abundance
and dark CO2 fixation of chemolithoautotrophic prokaryotes in anoxic waters of the
Baltic Sea, Limnology and Oceanography 53, 14–22.
Karl, D. M., Beversdorf, L., Bjorkman, K. M., Church, M. J., Martinez, A., Delong, E. F.,
2008. Aerobic production of methane in the sea, Nature Geoscience 1, 473–478.
Keir, R., Schmale, O., Seifert, R., Sültenfuß, J., 2009. Isotope fractionation and mixing
in methane plumes from the Logatchev hydrothermal field, Geochemistry
Geophysics Geosystems 10, Q05005.
Kempe, S., Diercks, A.-R., Liebezeit, G., Prange, A., 1991. Geochemical and structural
aspects of the pycnocline in the Black Sea (R/V Knorr 134-8 Leg 1, 1988). In: Izdar,
E. and Murray, J. W. (Eds). Black Sea Oceanography. NATO ASI Series C, Kluwer
Academic Publisher, Dordrecht, 89–110.
Chapter 4 – Aerobic methanotrophy within the Gotland Deep pelagic redox-zone
90
Kessler, J. D., Reeburgh, W. S., Southon, J., Seifert, R., Michaelis, W., Tyler, S. C., 2006.
Basin-wide estimates of the input of methane from seeps and clathrates to the Black
Sea. Earth and Planetary Science Letters 243, 366–375.
Labrenz, M., Jost, G., Pohl, C., Beckmann, S., Martens-Habenna, W., Jürgens, K., 2005.
Impact of different in vitro electron donor/acceptor conditions on potential
chemolithoautotrophic communities from marine pelagic redoxclines. Applied and
Environmental Microbiology 71, 6664–6672.
Labrenz, M., Sintes, E., Toetzke, F., Zumsteg, A., Herndl, G. J., Seidler, M., Jürgens, K.,
2010. Relevance of a crenarchaeotal subcluster related to Candidatus Nitrosopumilus
maritimus to ammonia oxidation in the suboxic zone of the central Baltic Sea. ISME
4, 1496–1508.
Lass, H. U. and Matthäus, W., 2008. General oceanography of the Baltic Sea. In:
Feistel, R., Nausch, G., and Wasmund, N. (Eds). State and evolution of the Baltic Sea,
1952–2005. John Wiley & Sons, Inc., New Jersey, 5–44.
Lass, H. U., Prandke, H., Liljebladh, B., 2003. Dissipation in the Baltic proper during
winter stratification. Journal of Geophysical Research 108, 3187.
Ludwig, W., Strunk, O., Westram, R., Richter, L., Meier, H., Yadhukumar, Buchner, A.,
Lai, T., Steppi, S., Jobb, G., Forster, W., Brettske, I., Gerber, S., Ginhart, A. W., Gross, O.,
Grumann, S., Hermann, S., Jost, R., Konig, A., Liss, T., Lussmann, R., May, M., Nonhoff,
B., Reichel, B., Strehlow, R., Stamatakis, A., Stuckmann, N., Vilbig, A., Lenke, M.,
Ludwig, T., Bode, A., Schleifer, K.-H., 2004. ARB: a software environment for
sequence data. Nucleic Acids Research 32, 1363–1371.
Makula, R. A., 1978. Phospholipid composition of methane-utilizing bacteria. Journal
of Bacteriology 134, 771–777.
Matthäus, W., Nehring, D., Feistel, R., Nausch, G., Mohrholz, V., Lass, H. U., 2008. The
inflow of high saline water into the Baltic Sea. In: Feistel, R., Nausch, G., and
Wasmund, N. (Eds). State and evolution of the Baltic Sea, 1952–2005. John Wiley &
Sons, Inc., New Jersey, 265–310.

Chapter 4 – Aerobic methanotrophy within the Gotland Deep pelagic redox-zone
91
Nausch, G., Nehring, D., Nagel, K., 2008. Nutrient concentrations, trends and their
relation to eutrophication. In: Feistel, R., Nausch, G., and Wasmund, N. (Eds). State
and evolution of the Baltic Sea, 1952–2005. John Wiley & Sons, Inc., New Jersey,
337– 366.
Neunlist, S. and Rohmer, M., 1985. Novel hopanoids from the methylotrophic
bacteria Methylococcus capsulatus and Methylomonas methanica. Biochemical
Journal 231, 635–639.
Nichols, P. D., Shaw, P. M., Johns, R. B., 1985. Determination of the double bond
position and geometry in monoenoic fatty acids from complex microbial and
environmental samples by capillary GC-MS of their Diels-Alder adducts. Journal of
Microbiological Methods 3, 311–319.
Piker, L., Schmaljohann, R., Imhoff, J. F., 1998. Dissimilatory sulfate reduction and
methane production in Gotland Deep sediments (Baltic Sea) during a transition
period from oxic to anoxic bottom water (1993–1996). Aquatic Microbial Ecology
14, 183–193.
Prokhorenko, Y. A., Krasheninnikov, B. N., Agafonov, E. A., Basharin, V. A., 1994.
Experimental studies of the deep turbid layer in the Black Sea. Physical
Oceanography 5, 133–139.
Reeburgh, W. S., 1976. Methane consumption in Cariaco Trench waters and
sediments. Earth and Planetary Science Letters 28, 337–344.
Reeburgh, W. S., 2007. Ocean methane biogeochemistry. Chemical Reviews 107,
486–513.
Reissmann, J. H., Burchard, H., Feistel, R., Hagen, E., Lass, H. U., Mohrholz, V., Nausch,
G., Umlauf, L., Wieczorek, G., 2009. Vertical mixing in the Baltic Sea and
consequences for eutrophication – A review. Progress in Oceanography 82, 47–80.
Schmale, O., Beaubien, S. E., Rehder, G., Greinert, J., Lombardi, S., 2010a. Gas seepage
in the Dnepr paleo-delta area (NW-Black Sea) and its regional impact on the water
column methane cycle. Journal of Marine Systems 80, 90–100.

Chapter 4 – Aerobic methanotrophy within the Gotland Deep pelagic redox-zone
92
Schmale, O., Schneider von Deimling, J., Gülzow, W., Nausch, G., Waniek, J. J., Rehder,
G., 2010b. Distribution of methane in the water column of the Baltic Sea. Geophysical
Research Letters 37, L12604.
Schmale, O., Haeckel, M., McGinnis, D. F., 2011. Response of the Black Sea methane
budget to massive short-term submarine inputs of methane. Biogeosciences 8, 911–
918.
Schouten, S., Wakeham, S. G., Sinninghe Damsté, J. S., 2001. Evidence for anaerobic
methane oxidation by archaea in euxinic waters of the Black Sea. Organic
Geochemistry 32, 1277–1281.
Schubert, C. J., Coolen, M. J. L., Neretin, L. N., Schippers, A., Abbas, B., Durisch-Kaiser,
E., Wehrli, B., Hopmans, E. C., Sinninghe Damsté, J. S., Wakeham, S., Kuypers, M. M. M.,
2006. Aerobic and anaerobic methanotrophs in the Black Sea water column.
Environmental Microbiology 8, 1844–1856.
Scranton, M. I., Crill, P., Angelis, M., Donaghay, P., Sieburth, J., 1993. The importance
of episodic events in controlling the flux of methane from an anoxic basin. Global
Biogiochemical Cycles 7, 491– 507.
Strady, E., Pohl, C., Yakushev, E. V., Krüger, S., Hennings, U., 2008. PUMP-CTD-System
for trace metal sampling with a high vertical resolution. A test in the Gotland Basin,
Baltic Sea. Chemosphere 70, 1309–1319.
Summons, R. E., Jahnke, L. L., Roksandic, Z., 1994. Carbon isotopic fractionation in
lipids from methanotrophic bacteria: Relevance for interpretation of the
geochemical record of biomarkers. Geochimica et Cosmochimica Acta 58, 2853–
2863.
Talbot, H. M. and Farrimond, P., 2007. Bacterial populations recorded in diverse
sedimentary biohopanoid distributions. Organic Geochemistry 38, 1212–1225.
Talbot, M., Watson, D. F., Murrell, J. C., Carter, J. F., Farrimond, P., 2001. Analysis of
intact bacteriohopanepolyols from methanotrophic bacteria by reversed-phase high-
performance liquid chromatography-atmopheric pressure chemical ionisation mass
spectrometry. Journal of Chromatography A 921, 175–185.
Chapter 4 – Aerobic methanotrophy within the Gotland Deep pelagic redox-zone
93
Thießen, O., Schmidt, M., Theilen, F., Schmitt, M., Klein, G., 2006. Methane formation
and distribution of acoustic turbidity in organic-rich surface sediments in the
Arkona Basin, Baltic Sea. Continental Shelf Research 26, 2469–2483.
Wakeham, S. G., Amann, R., Freeman, K. H., Hopmans, E. C., Joergensen, B. B., Putnam,
I. F., Schouten, S., Damste, J. S. S., Talbot, M., Woebken, D., 2007. Microbial ecology of
the stratified water column of the Black Sea as revealed by a comprehensive
biomarker study. Organic Geochemistry 38, 2070–2097.
Weinbauer, M. G., Fritz, I., Wenderoth, D. F., Höfle, M. G., 2002. Simultaneous
extraction from bacterioplankton of total RNA and DNA suitable for quantitative
structure and functional analyses. Applied and Environmental Micobiology 68,
1082–1084.
Whiticar, M. J., 1999. Carbon and hydrogen isotope systematics of bacterial
formation and oxidation of methane. Chemical Geology 161, 291– 314.

94

Chapter 5 – Biomarkers for aerobic methanotrophy in the water column of the Gotland Deep
95
5
Biomarkers for aerobic methanotrophy in the water column of the stratified Gotland Deep
Christine Berndmeyer, Volker Thiel, Oliver Schmale, and Martin Blumenberg
Organic Geochemistry (2013) 55, 103-111.
DOI: 10.1016/j.orggeochem.2012.11.010; reprinted with permission of Elsevier
5.1 Abstract
Filter samples from the oxic zone and suboxic zone of the physically stratified water
column and sediment samples of the Gotland Deep, Baltic Sea, were analyzed for
bacteriohopanepolyol (BHP) and phospholipid fatty acid (PLFA) concentrations. In
total, eight BHPs were identified, with the greatest diversity in the suboxic zone.
There, 35-aminobacteriohopane-31,32,33,34-tetrol (aminotetrol) and
35-aminobacteriohopane-30,31,32,33,34-pentol (aminopentol), whose
concentrations decreased concurrently from the lower to the upper suboxic zone,
indicated type I methanotrophic bacteria and thus aerobic oxidation of methane. The
presence and activity of type I aerobic methanotrophic bacteria was further
supported by the presence of 13C-depleted PLFAs, specifically 16:1ω8c and 16:1ω5c
(δ13C as low as -41.2‰). However, the relative amount of methanotroph-specific
compounds was low (aminopentol, <0.2% of total BHPs; 16:1ω8c, ca. 0.5% of total
PLFAs), suggesting a minor contribution of aerobic methanotrophic bacteria to the
particulate organic matter. The distinctive BHP pattern in the suboxic zone,
including aerobic methanotroph biomarkers and a tentative marker for a pelagic
redoxcline [putative 22S isomer of the ubiquitous 22R-bacteriohopanetetrol (BHT)],
was mirrored in the sediment samples. Our data indicate that a major portion of the
sedimentary hopanoids of the Gotland Deep is sourced from the suboxic part of the
water column via an effective but unknown transport mechanism.

Chapter 5 – Biomarkers for aerobic methanotrophy in the water column of the Gotland Deep
96
5.2 Introduction
Microbial methane consumption (methanotrophy) is crucial for the removal of
methane from marine sediments before it reaches the atmosphere (Reeburgh, 1976,
2007; Wakeham et al., 2004). Methane can be effectively oxidized by
microorganisms in the sediment and water column, using a number of different
electron acceptors (Beal et al., 2009; Ettwig et al., 2010), with the sulfate dependent
anaerobic oxidation of methane as the quantitatively most important process
(Barnes and Goldberg, 1976; Reeburgh, 2007 and references therein). As a
consequence, only a low amount of methane is released to the atmosphere, where it
is a highly effective greenhouse gas (IPCC, 2007). Of special importance for its
production and methanotrophy in the ocean are stagnant anoxic basins, such as the
Cariaco Basin and the Black Sea (Reeburgh, 1976, 2007; Scranton et al., 1993;
Wakeham et al., 2004). Little is known about methane consumption in oceanic water
columns, but studies have indicated that microbial oxidation of methane occurs
particularly in the suboxic zone, a part of the redoxcline, as shown for the Black Sea
(Durisch-Kaiser et al., 2005; Schubert et al., 2006; Blumenberg et al., 2007;
Wakeham et al., 2007). The redoxcline, the transition zone between the oxic and
anoxic layers, is an important
element, as it acts as a relatively
stable region for several
biogeochemical transformations
(Schubert et al., 2006). Like the
Black Sea and the Cariaco Basin, the
central Baltic Sea is characterized
by a stratified water column as a
result of freshwater supply from
rivers and salt water from the
North Sea. It is a semi-enclosed
marginal sea composed of a
succession of basins divided by sills
(Matthäus and Schinke, 1999; Lass
and Matthäus, 2008). A connection
Fig. 1: Sample location in the Gotland Deep, East Gotland Basin.

Chapter 5 – Biomarkers for aerobic methanotrophy in the water column of the Gotland Deep
97
to the North Sea exists via the Skagerrak/Kattegat strait (Fig. 1). According to its
density, the inflowing saline North Sea water spreads in intermediate to deep Baltic
Sea water layers and along the bottom, where the sills hamper its progress into the
more distant basins (Reissmann et al., 2009). The frequent but small horizontal
inflows from the North Sea have only little impact on the deep water of the more
distant basins like the East-Gotland Basin and the Gotland Deep (249 m; Fig. 1) of
the central Baltic. Only the rare, so-called major baltic inflows are able to carry large
amounts of oxygenated saline water dense enough to renew the deep water of these
basins (Matthäus and Schinke, 1999; Meier et al., 2006). The abundance of these
inflows has, however, significantly decreased since the 1970s (Meier et al., 2006)
and the last major inflows occurred in 1993 and 2003. Hence, the deeper central
Baltic basins are characterized by longer stagnation phases of the deep water,
leading to high concentrations of methane and S2- (Meier et al., 2006; Schmale et al.,
2010). The physically different upper and lower water masses inhibit vertical mixing
and lead to the stratified water column, where relatively stable physico- and
biogeochemical zones become established, namely the upper oxic zone, the lower
anoxic zone, with the suboxic zone in between. The latter in particular is a highly
productive layer with a rapid turnover of organic material and a high abundance of
microorganisms (Detmer et al., 1993). Anoxic bottom water conditions are also
reflected in the upper laminated sediments of the Gotland Deep and their increasing
organic carbon content, which is related to increasing primary production because
of eutrophication and prolonged phases of O2 deficiency (Andrén et al., 2000; Harff
et al., 2001).
A recent multidisciplinary study by our group reported initial biomarker, gas
geochemical and microbiological indications for the occurrence of type I
methanotrophic bacteria in a water sample from 100 m, i.e. within the suboxic zone
(Schmale et al., 2012). For a detailed view of the aerobic methanotrophic processes
we have now quantitatively studied biomarkers, including phospholipid fatty acids
(PLFAs) and bacteriohopanepolyols (BHPs; for structures, see Fig. 2) along a profile
of several sampling depths within the oxic and suboxic zones. PLFAs occur in the
membranes of all living cells, but not in storage lipids, and are rapidly turned over in
dead cells (Fang et al., 2000). Some can be highly specific for certain source
organisms, such as sulfate reducing bacteria (e.g. Taylor and Parkes, 1983) or
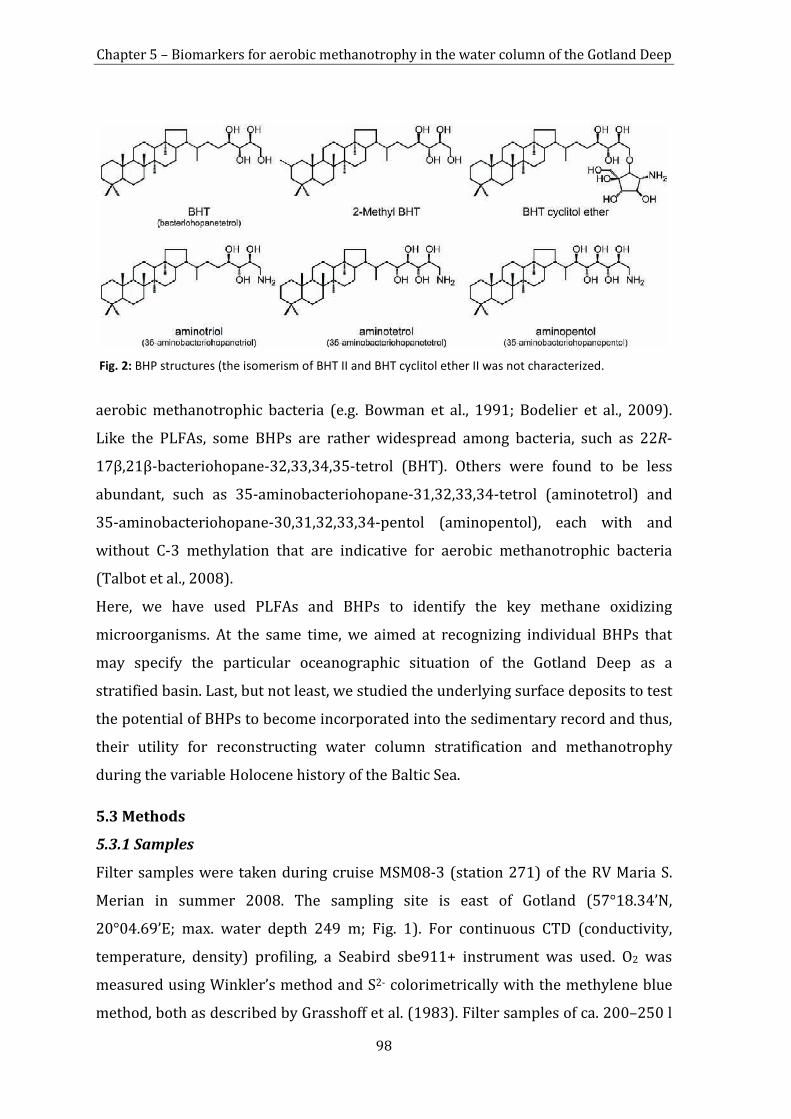
Chapter 5 – Biomarkers for aerobic methanotrophy in the water column of the Gotland Deep
98
aerobic methanotrophic bacteria (e.g. Bowman et al., 1991; Bodelier et al., 2009).
Like the PLFAs, some BHPs are rather widespread among bacteria, such as 22R-
17β,21β-bacteriohopane-32,33,34,35-tetrol (BHT). Others were found to be less
abundant, such as 35-aminobacteriohopane-31,32,33,34-tetrol (aminotetrol) and
35-aminobacteriohopane-30,31,32,33,34-pentol (aminopentol), each with and
without C-3 methylation that are indicative for aerobic methanotrophic bacteria
(Talbot et al., 2008).
Here, we have used PLFAs and BHPs to identify the key methane oxidizing
microorganisms. At the same time, we aimed at recognizing individual BHPs that
may specify the particular oceanographic situation of the Gotland Deep as a
stratified basin. Last, but not least, we studied the underlying surface deposits to test
the potential of BHPs to become incorporated into the sedimentary record and thus,
their utility for reconstructing water column stratification and methanotrophy
during the variable Holocene history of the Baltic Sea.
5.3 Methods
5.3.1 Samples
Filter samples were taken during cruise MSM08-3 (station 271) of the RV Maria S.
Merian in summer 2008. The sampling site is east of Gotland (57°18.34’N,
20°04.69’E; max. water depth 249 m; Fig. 1). For continuous CTD (conductivity,
temperature, density) profiling, a Seabird sbe911+ instrument was used. O2 was
measured using Winkler’s method and S2- colorimetrically with the methylene blue
method, both as described by Grasshoff et al. (1983). Filter samples of ca. 200–250 l
Fig. 2: BHP structures (the isomerism of BHT II and BHT cyclitol ether II was not characterized.
Chapter 5 – Biomarkers for aerobic methanotrophy in the water column of the Gotland Deep
99
were taken from 10, 48, 80, 100, 108, 124 and 135 m water depth using a CTD pump
on precombusted glass microfiber filters (Ø 30 cm; 0.7 µm pore size). The filters
were kept frozen until analysis. Surface sediments were sampled at the same station
using a Frahm corer during research cruise MSM16-1 in 2010. For sediment analysis
ca. 2–3 g freeze dried sample were taken.
5.3.2 Bulk CNS analysis
Three pieces (Ø 1.2 cm) from different zones of each filter were combusted with
Vn2O5 in a EuroVector EuroEA Elemental Analyzer. Sediment samples were also
analyzed for bulk C/N/S. No acidification of the samples was performed, because
suspended particulate material in the Gotland Sea was reported to be free of
carbonate (Schneider et al., 2002), which was also demonstrated for the samples
used for this study. The C, N and S contents were calculated from comparisons with
peak areas from a standard. The error in C/N/S analysis was ± 2% for C, and ± 5%
for N and S.
5.3.3 Extraction
The sediment samples and half of each filter were extracted (3x, 20 min) with
dichloromethane (DCM)/MeOH (40 ml; 3:1, v:v) in a CEM Mars 5 microwave
(Matthews, NC, USA) at 80 °C and 800 W. All extracts were combined.
5.3.4 BHP acetylation and liquid chromatography–mass spectrometry (LC–MS)
An aliquot of the extract (25%) was acetylated using Ac2O and pyridine (1:1, v:v; 1 h,
50 °C; then overnight at room temperature). The mixture was then dried under
vacuum and analyzed for BHPs using LC–MS. LC–MS was performed using a Prostar
Dynamax HPLC system coupled to a 1200L triple quadrupole mass spectrometer
(both Varian), equipped with a Merck Lichrocart (Lichrosphere 100; reversed phase
(RP) C18e column [250 x 4 mm]) and a Merck Lichrosphere pre-column of the same
material. The solvent gradient profile was 100% A (0–1 min) to 100% B at 35 min,
then isocratic to 60 min [solvent A, MeOH/water (9:1; v:v); solvent B,
MeOH/propan-2-ol (1:1; v:v); all Fisher Scientific HPLC grade]. The flow rate was 0.5
ml min-1. The MS instrument was equipped with an atmospheric pressure chemical
ionization (APCI) source operated in positive ion mode (capillary temperature

Chapter 5 – Biomarkers for aerobic methanotrophy in the water column of the Gotland Deep
100
150 °C, vaporizer temperature 400 °C, corona discharge current 8 µA, nebulizing gas
flow 70 psi and auxiliary gas 17 psi). Peaks from authentic BHP standards with
known concentration (acetylated BHT and aminotriol) were compared with selected
ions (SIM [single ion monitoring mode] mode) from acetylated BHP peaks in the
samples to determine BHP concentration (external calibration). Assignment of BHPs
was via MS characteristics and comparison with elution times of previously
identified compounds. Response of BHPs was corrected for individual responses of
amino- and non-amino-BHPs. The quantification error was estimated to be ± 20%.
5.3.5 PLFA fractionation, derivatization, gas chromatography–mass
spectrometry (GC–MS) and GC–combustion isotope ratio mass spectrometry (GC–
C-IRMS)
An aliquot (25%) of the extract was separated via column chromatography into a
hydrocarbon (F1), an alcohol and ketone (F2) and a polar fraction (F3) using a
column (Ø ca. 1 cm) filled with 7.5 g silica gel 60. The sample was dried on ca. 500
mg silica gel and placed on the column. After elution of F1 with 30 ml n-hexane/DCM
8:2 (v/v) and F2 with 30 ml DCM/EtOAc 9:1 (v/v; data not shown), F3 was obtained
with 100 ml DCM/MeOH 1:1 (v/v) plus 100 ml MeOH. To obtain the PLFAs, the polar
fraction was separated using column chromatography of an aliquot (50%) of F3,
according to Sturt et al. (2004). Briefly, the column was filled with 2 g silica gel 60
and stored at 120 °C until use. The sample was dried on ca. 500 mg silica gel and
added to the column. F3.1 (non-polar FAs) was eluted with 15 ml DCM, F3.2
(glycolipid FAs) with 15 ml acetone and F3.3 (PLFAs) with 15 ml MeOH. F3 and F3.3
were methylated using trimethylchlorosilane in MeOH (1:8; v/v; 1.5 h, 80 °C).
Double bond positions in unsaturated methyl esters were determined by
derivatisation with dimethyldisulfide (DMDS; Carlson et al., 1989; Gatellier et al.,
1993). The sample was dissolved in 100 µl n-hexane and 30 µl I2 solution (60 mg I2
in 1 ml Et2O) added. The sample was derivatized at 50 °C for 48 h. Subsequently,
1 ml of n-hexane and 200 µl of NaHSO4 (5% in water) were added and the hexane
layer was pipetted of. The procedure was repeated 3x. The hexane phase was dried
on ca. 500 mg silica gel and added to a small column filled with ca. 1 g silica gel 60. It
was eluted with 10 dead volumes of DCM. The methyl esters prepared from the
polar fraction (F3) and the PLFAs (F3.3), and the DMDS derivatized samples were
Chapter 5 – Biomarkers for aerobic methanotrophy in the water column of the Gotland Deep
101
analyzed with GC-MS using a Varian CP-3800 chromatograph equipped with a fused
silica column (Phenomenex Zebron ZB-5MS, 30 m x 0.32 mm) coupled to a 1200L
mass spectrometer, using He as carrier gas. The temperature program was 80 °C
(3 min) to 310 °C (held 25 min) at 4 °C min-1. Compounds were assigned by
comparing mass spectra and retention times with published data. The δ13C values of
FAMEs from the polar fraction (F3) and the phospholipids (F3.3) were measured
(2x) using a Trace GC gas chromatograph under the same conditions and equipped
with the same column as for GC–MS, coupled to a Delta Plus isotope ratio mass
spectrometer (both Thermo Scientific). The combustion reactor contained CuO, Ni
and Pt and was operated at 940 °C. Isotopic composition values were calculated
from comparisons with an isotopically known CO2 reference gas and are reported vs.
Vienna Peedee Belemnite (V-PDB). GC–C-IRMS precision and linearity were checked
daily by using an external n-alkane isotopic standard provided by A. Schimmelmann
(Indiana University).
5.4 Results
5.4.1 Bulk parameters
The highest concentration of particulate organic carbon (POC) of 327 µg l-1 was in
the surface water sample from 10 m (Table 1). The value was ca. 10x those of the
deeper water samples. The lowest concentration (27 µg l-1) was at 100 m in the
suboxic zone. The samples below showed a steady increase in POC concentration to
64 µg l-1 at 135 m. Concentration of total organic carbon (TOC) in the surface
sediment was 109 mg g-1 d.w. (dry wt.) at 0–2 cm and 105 mg g-1 d.w. at 6–8 cm.
5.4.2 Physicochemical parameters for the water column
The physicochemical parameters for the water column are given in Fig. 3 (Schmale
et al., 2012). The pycnocline was at ca. 75 m. Below the pycnocline, O2 decreased to
<0.2 ml l-1 at ca. 90 m, defining the onset of the redoxcline and thus the upper
boundary of the suboxic zone. H2S was first detected at 138 m water depth, marking
the upper boundary of the anoxic zone. Methane of biogenic origin (δ13C CH4
between -82.4‰ and -75.2‰) diffuses upwards from the underlying sediment into

Chapter 5 – Biomarkers for aerobic methanotrophy in the water column of the Gotland Deep
102
Water depth
Liters pumped
Corg (POC)
Total BHPs
Fatty acids
FAs PLFAs PLFA [m] [µg C l-1] [ng/l] [µg g-1 POC] [mg g-1 POC] [mg g-1 POC] [%]
10 216 327 12.1 37.1 15.8 5.6 36 48 219 39 6.6 166.4 9.3 3.3 36 80 214 43 14.8 5.7 39
100 214 28 27.8 996.5 5.5 3.8 70 108 238 40 84.4 2108.4 6.1 3.0 50 124 260 50* 38.3 765.1 135 211 64 189.0 3640.1 11.8 3.1 27
Sediment
depth g
sediment Corg
(TOC) Total BHPs
[cm] [mg C g-1 sed.] [µg g-1 TOC] 0-2 2.5 109 596.6 6-8 3.8 105 373.3
Tab. 1: General information on samples and concentrations of total BHPs, FAs, and PLFAs.
Fig. 2: Selected physicochemical parameters (Schmale et al., 2012) for the water column (a), concentration of total BHPs in lg g_1 TOC (b) and distributions of BHPs in water column and sediment (c); distributions at 100 m are from Schmale et al., 2012); due to sample loss, no data are available for 80 m. Gray shaded area is the suboxic zone. The relative amount of aminopentol in the water column is ca. 0.2% at 100 m, ca. 0.2% at 108 m, 0% at 124 m, and ca. 0.1% at 135 m, and ca. 0.1% in both sediment samples.
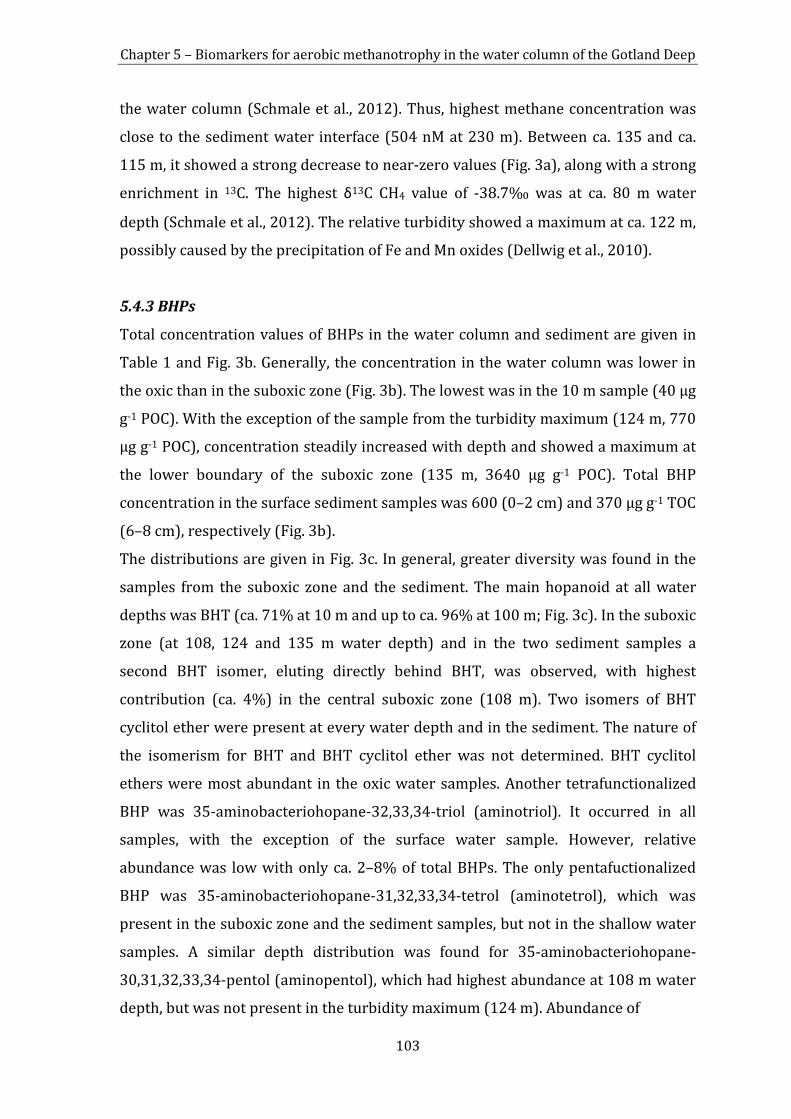
Chapter 5 – Biomarkers for aerobic methanotrophy in the water column of the Gotland Deep
103
the water column (Schmale et al., 2012). Thus, highest methane concentration was
close to the sediment water interface (504 nM at 230 m). Between ca. 135 and ca.
115 m, it showed a strong decrease to near-zero values (Fig. 3a), along with a strong
enrichment in 13C. The highest δ13C CH4 value of -38.7‰ was at ca. 80 m water
depth (Schmale et al., 2012). The relative turbidity showed a maximum at ca. 122 m,
possibly caused by the precipitation of Fe and Mn oxides (Dellwig et al., 2010).
5.4.3 BHPs
Total concentration values of BHPs in the water column and sediment are given in
Table 1 and Fig. 3b. Generally, the concentration in the water column was lower in
the oxic than in the suboxic zone (Fig. 3b). The lowest was in the 10 m sample (40 µg
g-1 POC). With the exception of the sample from the turbidity maximum (124 m, 770
µg g-1 POC), concentration steadily increased with depth and showed a maximum at
the lower boundary of the suboxic zone (135 m, 3640 µg g-1 POC). Total BHP
concentration in the surface sediment samples was 600 (0–2 cm) and 370 µg g-1 TOC
(6–8 cm), respectively (Fig. 3b).
The distributions are given in Fig. 3c. In general, greater diversity was found in the
samples from the suboxic zone and the sediment. The main hopanoid at all water
depths was BHT (ca. 71% at 10 m and up to ca. 96% at 100 m; Fig. 3c). In the suboxic
zone (at 108, 124 and 135 m water depth) and in the two sediment samples a
second BHT isomer, eluting directly behind BHT, was observed, with highest
contribution (ca. 4%) in the central suboxic zone (108 m). Two isomers of BHT
cyclitol ether were present at every water depth and in the sediment. The nature of
the isomerism for BHT and BHT cyclitol ether was not determined. BHT cyclitol
ethers were most abundant in the oxic water samples. Another tetrafunctionalized
BHP was 35-aminobacteriohopane-32,33,34-triol (aminotriol). It occurred in all
samples, with the exception of the surface water sample. However, relative
abundance was low with only ca. 2–8% of total BHPs. The only pentafuctionalized
BHP was 35-aminobacteriohopane-31,32,33,34-tetrol (aminotetrol), which was
present in the suboxic zone and the sediment samples, but not in the shallow water
samples. A similar depth distribution was found for 35-aminobacteriohopane-
30,31,32,33,34-pentol (aminopentol), which had highest abundance at 108 m water
depth, but was not present in the turbidity maximum (124 m). Abundance of
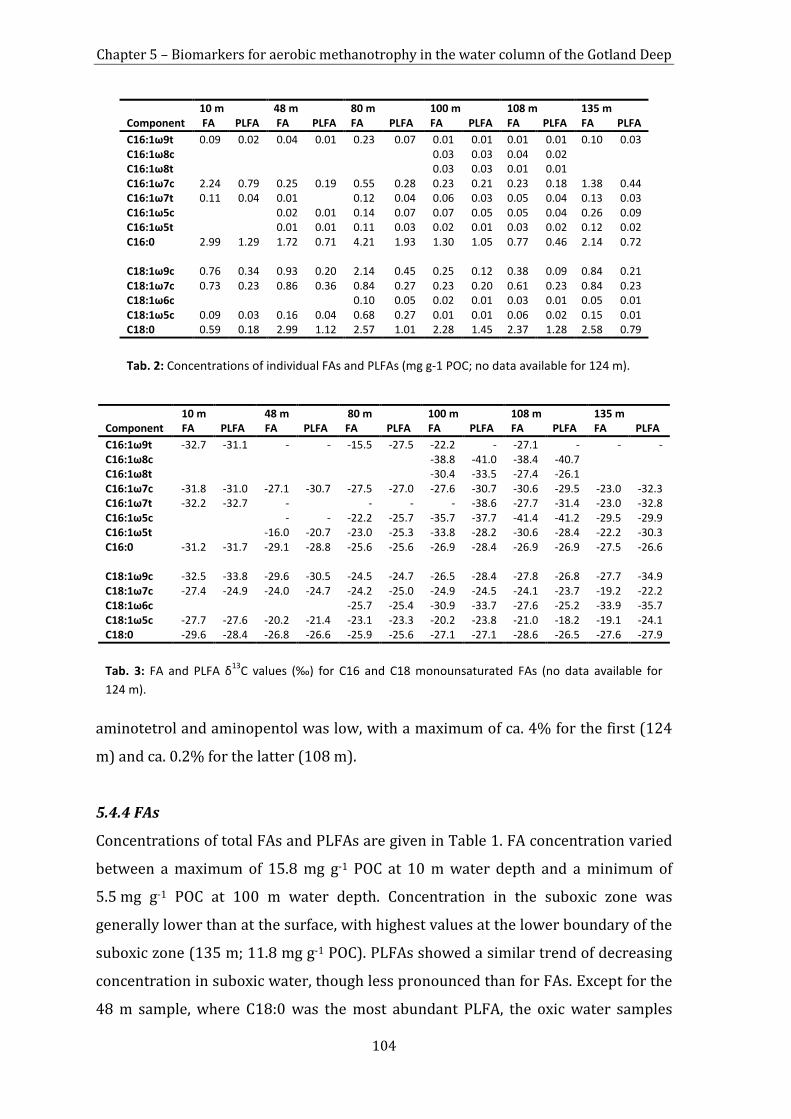
Chapter 5 – Biomarkers for aerobic methanotrophy in the water column of the Gotland Deep
104
10 m 48 m 80 m 100 m 108 m 135 m Component FA PLFA FA PLFA FA PLFA FA PLFA FA PLFA FA PLFA C16:1ω9t 0.09 0.02 0.04 0.01 0.23 0.07 0.01 0.01 0.01 0.01 0.10 0.03 C16:1ω8c 0.03 0.03 0.04 0.02 C16:1ω8t 0.03 0.03 0.01 0.01 C16:1ω7c 2.24 0.79 0.25 0.19 0.55 0.28 0.23 0.21 0.23 0.18 1.38 0.44 C16:1ω7t 0.11 0.04 0.01 0.12 0.04 0.06 0.03 0.05 0.04 0.13 0.03 C16:1ω5c 0.02 0.01 0.14 0.07 0.07 0.05 0.05 0.04 0.26 0.09 C16:1ω5t 0.01 0.01 0.11 0.03 0.02 0.01 0.03 0.02 0.12 0.02 C16:0 2.99 1.29 1.72 0.71 4.21 1.93 1.30 1.05 0.77 0.46 2.14 0.72 C18:1ω9c 0.76 0.34 0.93 0.20 2.14 0.45 0.25 0.12 0.38 0.09 0.84 0.21 C18:1ω7c 0.73 0.23 0.86 0.36 0.84 0.27 0.23 0.20 0.61 0.23 0.84 0.23 C18:1ω6c 0.10 0.05 0.02 0.01 0.03 0.01 0.05 0.01 C18:1ω5c 0.09 0.03 0.16 0.04 0.68 0.27 0.01 0.01 0.06 0.02 0.15 0.01 C18:0 0.59 0.18 2.99 1.12 2.57 1.01 2.28 1.45 2.37 1.28 2.58 0.79 Tab. 2: Concentrations of individual FAs and PLFAs (mg g-1 POC; no data available for 124 m).
10 m 48 m 80 m 100 m 108 m 135 m Component FA PLFA FA PLFA FA PLFA FA PLFA FA PLFA FA PLFA C16:1ω9t -32.7 -31.1 - - -15.5 -27.5 -22.2 - -27.1 - - - C16:1ω8c -38.8 -41.0 -38.4 -40.7 C16:1ω8t -30.4 -33.5 -27.4 -26.1 C16:1ω7c -31.8 -31.0 -27.1 -30.7 -27.5 -27.0 -27.6 -30.7 -30.6 -29.5 -23.0 -32.3 C16:1ω7t -32.2 -32.7 - - - - -38.6 -27.7 -31.4 -23.0 -32.8 C16:1ω5c - - -22.2 -25.7 -35.7 -37.7 -41.4 -41.2 -29.5 -29.9 C16:1ω5t -16.0 -20.7 -23.0 -25.3 -33.8 -28.2 -30.6 -28.4 -22.2 -30.3 C16:0 -31.2 -31.7 -29.1 -28.8 -25.6 -25.6 -26.9 -28.4 -26.9 -26.9 -27.5 -26.6 C18:1ω9c -32.5 -33.8 -29.6 -30.5 -24.5 -24.7 -26.5 -28.4 -27.8 -26.8 -27.7 -34.9 C18:1ω7c -27.4 -24.9 -24.0 -24.7 -24.2 -25.0 -24.9 -24.5 -24.1 -23.7 -19.2 -22.2 C18:1ω6c -25.7 -25.4 -30.9 -33.7 -27.6 -25.2 -33.9 -35.7 C18:1ω5c -27.7 -27.6 -20.2 -21.4 -23.1 -23.3 -20.2 -23.8 -21.0 -18.2 -19.1 -24.1 C18:0 -29.6 -28.4 -26.8 -26.6 -25.9 -25.6 -27.1 -27.1 -28.6 -26.5 -27.6 -27.9 Tab. 3: FA and PLFA δ13C values (‰) for C16 and C18 monounsaturated FAs (no data available for 124 m).
aminotetrol and aminopentol was low, with a maximum of ca. 4% for the first (124
m) and ca. 0.2% for the latter (108 m).
5.4.4 FAs
Concentrations of total FAs and PLFAs are given in Table 1. FA concentration varied
between a maximum of 15.8 mg g-1 POC at 10 m water depth and a minimum of
5.5 mg g-1 POC at 100 m water depth. Concentration in the suboxic zone was
generally lower than at the surface, with highest values at the lower boundary of the
suboxic zone (135 m; 11.8 mg g-1 POC). PLFAs showed a similar trend of decreasing
concentration in suboxic water, though less pronounced than for FAs. Except for the
48 m sample, where C18:0 was the most abundant PLFA, the oxic water samples

Chapter 5 – Biomarkers for aerobic methanotrophy in the water column of the Gotland Deep
105
were dominated by C16:0, while the suboxic water samples were dominated by
C18:0.
The concentration of individual FAs is presented in Table 2. Among the various
homologues/isomers, 16:1ω8c, 16:1ω5c and 16:1ω5t as markers for
methanotrophic bacteria (Makula, 1978; Nichols et al., 1985; Bowman et al., 1991,
1993), were confined to occur between 48 and 135 m water depth, with 16:1ω8c
only occurring at 100 m and 108 m (Fig. 4). The δ13C values of PLFAs were also
obtained (Table 3, Fig. 4). Minor depletion occurred for 16:1ω8c (-41.0‰; 100 m)
and 16:1ω5c (-41.2‰; 108 m).
Fig. 3: C16:1/C16:0 PLFA ratio and δ13C values for a non-specific (16:1ω7c) PLFA and for type I aerobic methanotroph-specific PLFAs. Gray shaded area is the suboxic zone.
5.5 Discussion
5.5.1 Redox regime in water column of Gotland Deep
Suboxic zones are important sites for microbial processes (Detmer et al., 1993;
Schubert et al., 2006; Labrenz et al., 2007). The rapid changes in the water column
Chapter 5 – Biomarkers for aerobic methanotrophy in the water column of the Gotland Deep
106
chemistry over a narrow depth interval support a number of different microbial
metabolisms, ranging from oxic respiration to sulfate reduction, methanotrophy and
methanogenesis (Teske et al., 1996; Labrenz et al., 2007). The redox regime in the
water column of the Gotland Deep during the time of sampling has been recently
described in detail (Schmale et al., 2012). Briefly, O2 concentration below the
thermocline rapidly decreases with depth, with 0.2 ml l-1 reached at ca. 90 m,
marking the upper boundary of the suboxic zone. The lower boundary is defined by
the onset of H2S, first detected at ca. 138 m. Thus, the suboxic zone at the time of
sampling was ca. 48 m thick. Methane concentration showed a strong decrease from
the anoxic zone towards the center of the suboxic zone, along with enrichment in 13C
CH4. Both features indicate methane consumption (Schmale et al., 2012). The POC
concentration was in good agreement with summer values from Brettar and
Rheinheimer (1992). Maximum values in both cases occurred above the
thermocline, corresponding to the zone of phytoplanktonic primary production in
the euphotic zone. A second maximum at 135 m was consistent with a high
abundance of microorganisms at that depth and/or organic particles accumulated at
the suboxic/anoxic boundary.
5.5.2 General biogeochemical aspects from BHP distributions
In total, eight BHPs were found, but most were rather non-specific with respect to
bacterial groups. BHT, BHT cyclitol ether and aminotriol are produced by various
bacteria such as acetic acid bacteria, cyanobacteria, purple non-sulfur bacteria,
methanotrophs, methylotrophs, and others (Rohmer et al., 1984; Neunlist and
Rohmer, 1985a,b; Talbot et al., 2003a,b, 2008; Talbot and Farrimond, 2007). These
non-specific hopanoids constituted >90% of all BHPs. Surprisingly, the lowest
concentration occurred in the samples from the euphotic zone (Table 1), where POC
concentration and abundance of eukaryotic primary producers and cyanobacteria
were highest (Detmer et al., 1993; Labrenz et al., 2007, Table 1). Some species of
cyanobacteria are capable of BHP production, including a few marine nitrogen fixing
cyanobacteria (Welander et al., 2010; Sáenz et al., 2012). Thus, cyanobacteria are
regarded as possible producers of BHPs in aquatic environments (Summons et al.,
1999, 2006). Likewise, the euphotic zone bacterioplankton was reported to be the
main source of BHPs in sediments of the Black Sea (Blumenberg et al., 2009b). The
Chapter 5 – Biomarkers for aerobic methanotrophy in the water column of the Gotland Deep
107
low abundance of BHPs in the euphotic zone of the Gotland Deep may be explained
by either the time of sampling, when cyanobacterial blooms had not yet occurred, or
by a generally low abundance of BHP producing phototrophic bacteria in the central
Baltic. The latter idea is supported by the fact that the key cyanobacteria in the
central Baltic Sea (Labrenz et al., 2007) are relatives of the Synechococcus group,
which contains only a few BHP producing strains (Talbot et al., 2008; Saenz et al.,
2012). Future studies should test whether or not cyanobacteria are a significant
source for BHPs in the central Baltic Sea.
The total concentration of BHPs strongly increased in the suboxic zone and showed
a maximum at its lower boundary. This pattern has been described for the Black Sea
(Blumenberg et al., 2007; Wakeham et al., 2007), as well as for the Arabian Sea, the
Cariaco Basin and the Peru Margin (Sáenz et al., 2011). Although the synthesis of
BHPs does not require the presence of O2 (Ourisson and Rohmer, 1982), BHPs were
long thought to be produced only by aerobic bacteria (Ourisson et al., 1987; Innes et
al., 1997). However, more recent studies have shown that BHPs also occur in an
anaerobically grown Fe(III)-reducing Geobacter sp. (Fischer et al., 2005; Härtner et
al., 2005), in bacteria capable of anaerobic NH4+ oxidation (Sinninghe Damsté et al.,
2004) and sulfate reducing bacteria (SRB; Blumenberg et al., 2006). Despite the
source for most BHPs not being clear, our data support the idea that pelagic suboxic
zones are an important habitat for BHP producing bacteria and/or zones where
BHPs are physically enriched.
The diversity of BHP structures strongly increased in the suboxic zone. A methylated
BHT occurred at 124 m. The position of the methylation was not exactly identified,
but elution characteristics suggest methylation at C-2. A 2-methyl BHT has been
described by Wakeham et al. (2007) at the suboxic/anoxic boundary and in deeper
anoxic water depths of the Black Sea. A second BHT isomer, eluting shortly after the
common 22R-17β,21β-BHT, occurred at 108 and 135 m water depth. Most likely, the
same isomer (BHT II) has also been reported for sediments underlying the Benguela
upwelling system (Watson, 2002; Blumenberg et al., 2010), the Peru margin
(Watson, 2002; Sáenz et al., 2011), the Arabian Sea and the Cariaco Basin (Sáenz et
al., 2011). The nature of the isomerism has not been elucidated, but for the Benguela
upwelling system a 22S-configuration was suggested. As in our study, BHT II has
been observed only in suboxic to anoxic environments (Sáenz et al., 2011). Thus, its

Chapter 5 – Biomarkers for aerobic methanotrophy in the water column of the Gotland Deep
108
occurrence in the suboxic zone of the Gotland Deep supports its utility as a
biomarker for marine settings with an oxic–anoxic interface (Sáenz et al., 2011). The
biological source(s) of BHT II remain(s) to be identified, but it may be produced by
bacteria living in the suboxic zone. Alternatively, its presence may be due to yet
unclear isomerization reactions of the common (22R-) BHT, or to physicochemical
accumulation reactions. With the exception of the missing 2-methyl BHT, the
diversity and the relative abundances of the compounds in the lower suboxic zone
were reflected in the two sediment samples. This contradicts findings for the Black
Sea (Blumenberg et al., 2009b), where BHPs in the sediment were related mainly to
a bacterioplankton source from the euphotic zone. Although BHPs in the sediment
reflect mainly those from the suboxic zone, a partial contribution from other
bacteria living in the sediment cannot be completely excluded. A strong increase in
bacterial numbers of SRB, including Desulfovibrio, and heterotrophic bacteria, was
observed in the bottom water and the sediments of the Gotland Deep (Gast and
Gocke, 1988; Bruns et al., 2002), and at least Desulfovibrio spp. are known BHP
producers (e.g. Blumenberg et al., 2009a). Nonetheless, the similarity in BHPs in the
suboxic zone and the underlying sediments strongly suggest that microbial
processes in the suboxic water column are an important control on the composition
and sedimentation of organic matter in the Gotland Deep.
5.5.3 Biosignatures of methanotrophic bacteria in the suboxic zone of the
Gotland Deep
Bacteriohopanepolyols specific for methanotrophic bacteria were identified in the
whole suboxic zone and the sediment samples. Aminotetrol is produced by
methanotrophic bacteria (Neunlist and Rohmer, 1985a,b; Talbot et al., 2001; Talbot
and Farrimond, 2007) and in minor amounts by SRB of the genus Desulfovibrio
(Blumenberg et al., 2006, 2009a, 2012). Aminopentol, although also found in trace
amounts in Desulfovibrio (Blumenberg et al., 2012), appears to remain an excellent
biomarker for type I methanotrophic bacteria (Neunlist and Rohmer, 1985b; Cvejic
et al., 2000; Talbot et al., 2001). C-3 methylated BHPs, although only present in a low
number of aerobic methanotrophs from the Methylococcaceae group and thus a
marker of minor significance (Welander and Summons, 2012), were not present in
the Gotland Deep suboxic zone. They were also absent from the Black Sea samples
Chapter 5 – Biomarkers for aerobic methanotrophy in the water column of the Gotland Deep
109
described by Wakeham et al. (2007), but were observed in samples from the Black
Sea suboxic zone Blumenberg et al., (2007). The presence of pelagic methanotrophic
bacteria is supported by FA biomarkers. To better distinguish between dead cell
material and cells living at the water sampling depth, PLFAs were analyzed
separately from the total FAs, as PLFAs reflect signals from living cells (Fang et al.,
2000). PLFA abundance showed a clear maximum in the central suboxic zone,
pointing out the importance of this environment for active microbial processes. The
PLFA fraction strongly decreases at the anoxic boundary, where dead cell material
seems to accumulate. This is in good agreement with the increase in POC values at
this depth (Table 1).
In particular, 16:1ω8c is regarded as a marker for type I methanotrophic bacteria of
the genus Methylomonas (type I methanotroph), although it may occur in minor
amounts in some species of Methylococcus, a type X methanotroph (Makula, 1978;
Nichols et al., 1985; Bowman et al., 1991, 1993). As indicated by the presence of
aminotetrol and aminopentol (Fig. 3), type I methanotrophic bacteria occur in the
whole suboxic zone and are not restricted to the 100 m depth from which they were
recently reported (Schmale et al., 2012). The distribution of 16:1ω8c in our samples
supports this finding, although it was only detected in the central suboxic zone (100
and 108 m) but not at the lower boundary (Fig. 4). Another FA related to type I
methanotrophic bacteria of the genus Methylomonas and Methylococcus is 16:1ω5t
(Makula, 1978; Nichols et al., 1985; Bowman et al., 1993). It was detected at 48 m
depth and below, with highest concentration at 135 and 80 m. Its concentration
decreased at 100 and 108 m, where evidence for type I methanotrophic bacteria
from other biomarkers was strongest. The 16:1/16:0 PLFA ratio (Fig. 4a) shows,
however, the strongest increase in relative abundance of 16:1ω5t – and all other
relevant compounds – at 108 m.
The δ13C CH4 values in the redoxcline during the time of sampling were -60‰
to -38‰ between 120 and 80 m depth (Schmale et al., 2012). The values for FAs
from methanotrophic bacteria should therefore also reflect depletion in 13C,
particularly if type I methanotrophs are key players (Jahnke et al., 1999; Schmale et
al., 2012). Although PLFAs were considered as best reflecting in situ microbiological
processes, trends in δ13C for FAs and PLFAs were largely identical (Table 2). Fig. 4b
shows the δ13C values of selected PLFAs; 16:1ω7c is a common compound produced

Chapter 5 – Biomarkers for aerobic methanotrophy in the water column of the Gotland Deep
110
by a number of organisms. Thus, it does not show any peculiarity in its isotopic
composition throughout the water column. In comparison, 16:1ω8c shows a minor
depletion (δ13C as low as -41‰, about 10‰ lower than for 16:1ω7c). The values for
16:1ω5t continuously decreased with depth into the suboxic zone, although being
generally higher than those of 16:1ω8c and 16:1ω5c. The latter shows considerable 13C depletion (up to 19‰) only in the central suboxic zone, vs. the sample depths
above and below. This suggests the existence of both methanotrophic and methane-
independent source organisms for this particular compound. It therefore seems that
alternative PLFA sources obscure the δ13C signals from methanotrophic bacteria.
This is feasible for 16:1ω5c, as a strong increase in the 16:1/16:0 PLFA ratio (Fig. 4)
at the suboxic boundary argues for the increasing importance of SRB (Dowling et al.,
1986; Oude Elferink et al., 1998). According to these observations, in conjunction
with the low concentration of specific BHPs and PLFAs, the contribution of type I
methanotrophic bacteria to the total bacterial biomass appears to be low. The
abundance of aerobic methanotrophs in the Gotland Deep is similarly low as in the
Black Sea, where a type I methanotrophic bacteria maximum of 4% occurred at the
suboxic/anoxic boundary (Schubert et al., 2006). Typical biomarkers for type II
methanotrophs, such as 18:1ω8c, were absent from the Gotland Deep samples, in
good agreement with molecular microbiological analysis (Schmale et al., 2012). The
virtual absence of type II methanotrophs is a notable difference from the Black Sea,
where such organisms have been observed (Gal’chenko et al., 1988; Durisch-Kaiser
et al., 2005). As for other important biogeochemical processes (Glaubitz et al., 2009;
Labrenz et al., 2010), aerobic methanotrophy at the redoxcline of the Gotland Deep
appears to be restricted to a single group of organisms. Other organisms like the
observed type I bacteria are most likely less adapted to the temporarily changing
biogeochemical situation in the central Baltic Sea.
5.6 Conclusions and outlook
Aerobic methanotrophic bacteria thrive in the suboxic zone of the Gotland Deep
water column (Baltic Sea). The methanotrophic community largely, if not
exclusively, consists of type I methanotrophs, whereas there was no evidence for the
presence of type II methanotrophs. Compound concentration and δ13C profiles of
specific marker compounds suggest additional sources and a generally low

Chapter 5 – Biomarkers for aerobic methanotrophy in the water column of the Gotland Deep
111
abundance of aerobic methanotrophs among the bacterial community. Our study
nevertheless demonstrates the utility of specific BHPs and FAs, along with
compound specific isotopes, to reflect these aerobic methane-consuming processes
in the water column. Moreover, BHPs in surface sediments mirror the distinctive
distributions in the suboxic zone, demonstrating the capability of BHPs to enter the
geological record as markers for a stratified setting.
Considering the results, a number of interesting questions remain. It is not known,
for instance, how methanotrophic bacteria are affected by seasonal alteration of the
suboxic zone by cyanobacterial blooms, or episodic salt water inflow. Moreover, the
impact of other pathways of methanotrophy, particularly the anaerobic oxidation of
methane, require further investigation. Using the potential of BHPs to reflect
redoxcline processes in the sedimentary record, it will be interesting to test the
extent to which microbial methanotrophy played a role in the Holocene history of
the central Baltic Sea.
Acknowledgments
We are grateful to the captain, crew and shipboard party of the R/V Maria S. Merian
cruises MSM08-3 and MSM16-1. We thank C. Conradt and M. Muschalla for
laboratory assistance, J. Dyckmans from the KOSI (Göttingen) for help with stable
isotope analysis, and T. Licha and C. Nödler for help with LC–MS. We thank two
anonymous reviewers for comments and suggestions, which helped improving the
manuscript. The Deutsche Forschungsgemeinschaft is thanked for financial support
(Grants BL 971/1-3 and 971/3-1).
References
Andrén, E., Andrén, T., Kunzendorf, H., 2000. Holocene history of the Baltic Sea as a
background for assessing records of human impact in the sediments of the Gotland
Basin. The Holocene 10, 687–702.
Barnes, R.O., Goldberg, E.D., 1976. Methane production and consumption in
anaerobic marine sediments. Geology 4, 297–300.

Chapter 5 – Biomarkers for aerobic methanotrophy in the water column of the Gotland Deep
112
Beal, E.J., House, C.H., Orphan, V.J., 2009. Manganese- and iron-dependent marine
methane oxidation. Science 325, 184–187.
Blumenberg, M., Krüger, M., Nauhaus, K., Talbot, H.M., Oppermann, B.I., Seifert, R.,
Pape, T., Michaelis, W., 2006. Biosynthesis of hopanoids by sulfate-reducing bacteria
(genus Desulfovibrio). Environmental Microbiology 8, 1220–1227.
Blumenberg, M., Seifert, R., Michaelis, W., 2007. Aerobic methanotrophy in the oxic–
anoxic transition zone of the Black Sea water column. Organic Geochemistry 38, 84–
91.
Blumenberg, M., Oppermann, B.I., Guyoneaud, R., Michaelis, W., 2009a. Hopanoid
production by Desulfovibrio bastinii isolated from oilfield formation water. FEMS
Microbiology Letters 293, 73–78.
Blumenberg, M., Seifert, R., Kasten, S., Bahlmann, E., Michaelis, W., 2009b. Euphotic
zone bacterioplankton sources major sedimentary bacteriohopanepolyols in the
Holocene Black Sea. Geochimica et Cosmochimica Acta 73, 750–766.
Blumenberg, M., Mollenhauer, G., Zabel, M., Reimer, A., Thiel, V., 2010. Decoupling of
bio- and geohopanoids in sediments of the Benguela Upwelling System (BUS).
Organic Geochemistry 41, 1119–1129.
Blumenberg, M., Hoppert, M., Krüger, M., Dreier, A., Thiel, V., 2012. Novel findings on
hopanoid occurrences among sulfate reducing bacteria: is there a direct link to
nitrogen fixation? Organic Geochemistry 49, 1–5.
Bodelier, P.L.E., Bär Gillisen, M.-J., Hordijk, K., Sinninghe Damsté, J.S., Rijpstra, W.I.C.,
Geenevasen, J.A.J., Dunfield, P.F., 2009. A reanalysis of phospholipid fatty acids as
ecological biomarkers for methanotrophic bacteria. The ISME Journal 3, 606– 617.
Bowman, J.P., Skeratt, J.H., Nichols, P.D., Sly, L.I., 1991. Phopsholipid fatty acid and
lipopolysaccharide fatty acid signature lipids in methane-utilizing bacteria. FEMS
Microbiology Ecology 85, 15–22.
Bowman, J.P., Sly, L.I., Nichols, P.D., Hayward, A.C., 1993. Revised taxonomy of the
methanotrophs: description of Methylobacter gen. nov., emendation of

Chapter 5 – Biomarkers for aerobic methanotrophy in the water column of the Gotland Deep
113
Methylococcus, validation of Methylosinus and Methylocystis species, and a proposal
that the family Methylococcaceae includes only the group I methanotrophs.
International Journal of Systematic Bacteriology 43, 735–753.
Brettar, I., Rheinheimer, G., 1992. Influence of carbon availability on denitrification
in the central Baltic Sea. Limnology and Oceanography 37, 1146–1163.
Bruns, A., Cypionka, H., Overmann, J., 2002. Cyclic AMP and acyl homoserine lactones
increase the cultivation efficiency of heterotrophic bacteria from the Central Baltic
Sea. Applied and Environmental Microbiology 68, 3978–3987.
Carlson, D.R., Roan, C.-S., Yost, R.A., Hector, J., 1989. Dimethyl disulfide derivatives of
long chain alkenes, alkadiens, and alkatrienes for gas chromatography/mass
spectrometry. Analytical Chemistry 61, 1564–1571.
Cvejic, J.H., Bodrossy, L., Kovács, K.L., Rohmer, M., 2000. Bacterial triterpenoids of
the hopane series from the methanotrophic bacteria Methylocaldum spp.:
phylogenetic implications and first evidence for an unsaturated
aminobacteriohopanepolyol. FEMS Microbiology Letters 182, 361–365.
Dellwig, O., Leipe, T., März, C., Glockzin, M., Pollehne, F., Schnetger, B., Yakushev, E.V.,
Böttcher, M.E., Brumsack, H.-J., 2010. A new particulate Mn–Fe–P-shuttle at the
redoxcline of anoxic basins. Geochimica et Cosmochimica Acta 74, 7100– 7115.
Detmer, A.E., Giesenhagen, H.C., Trenkel, V.M., Auf dem Venne, H., Jochem, F., 1993.
Phototrophic and hetreotrophic pico- and nanoplankton in anoxic depths of the
central Baltic Sea. Marine Ecology Progress Series 99, 197–203.
Dowling, N.J.E., Widdel, F., White, D.C., 1986. Phospholipid ester-linked fatty acid
biomarkers of acetate-oxidizing sulphate-reducers and other sulphide-forming
bacteria. Journal of General Microbiology 132, 1815–1825.
Durisch-Kaiser, E., Klauser, L., Wehrli, B., Schubert, C., 2005. Evidence of intense
archaeal and bacterial methanotrophic activity in the Black Sea water column.
Applied and Environmental Microbiology 71, 8099–8106.
Chapter 5 – Biomarkers for aerobic methanotrophy in the water column of the Gotland Deep
114
Ettwig, K.F., Butler, M.K., Le Paslier, D., Pelletier, E., Mangenot, S., Kuypers, M.M.,
Schreiber, F., Dutilh, B.E., Zedelius, J., de Beer, D., Gloerich, J., Wessels, H.J., van Alen,
T., Luesken, F., Wu, M.L., van de Pas-Schoonen, K.T., Op den Camp, H.J., Janssen-
Megens, E.M., Francoijs, K.J., Stunnenberg, H., Weissenbach, J., Jetten, M.S., Strous, M.,
2010. Nitrite-driven anaerobic methane oxidation by oxygenic bacteria. Nature 464,
543–548.
Fang, J., Barcelona, M.J., Semrau, J.D., 2000. Characterization of methanotrophic
bacteria on the basis of intact phospholipid profiles. FEMS Microbiology Letters 189,
67–72.
Fischer, W.W., Summons, R.E., Pearson, A., 2005. Targeted genomic detection of
biosynthetic pathways: anaerobic production of hopanoid biomarkers by a common
sedimentary microbe. Geobiology 3, 33–40.
Gal’chenko, V.F., Abranochkina, F.N., Bezrukova, L.V., Sokolova, E.N., Ivanov, M.V.,
1988. Species composition of aerobic methanotrophic microflora in the Black Sea.
Microbiology 57, 305–311.
Gast, V., Gocke, K., 1988. Vertical distribution of number, biomass and size-class
spectrum of bacteria in relation to oxic/anoxic conditions in the Central Baltic Sea.
Marine Ecology Progress Series 45, 179–186.
Gatellier, J.-P.L.A., de Leeuw, J.W., Sinninghe Damsté, J.S., Derenne, S., Largeau, C.,
Metzger, P., 1993. A comparative study of macromolecular substances of a
Coorongite and cell walls of the extant alga Botryococcus braunii. Geochimica et
Cosmochimica Acta 57, 2053–2068.
Glaubitz, S., Lueders, T., Abraham, W.R., Jost, G., Jurgens, K., Labrenz, M., 2009. 13C
isotope analyses reveal that chemolithoautotrophic Gamma- and
Epsilonproteobacteria feed a microbial food web in a pelagic redoxcline of the
central Baltic Sea. Environmental microbiology 11, 326–337.
Grasshoff, K., Kremling, K., Ehrhardt, M. (Eds.), 1983. Methods of Seawater Analysis.
Verlag Chemie, Weinheim, Germany.
Chapter 5 – Biomarkers for aerobic methanotrophy in the water column of the Gotland Deep
115
Harff, J., Bohling, G., Davis, J.C., Endler, R., Kunzendorf, H., Olea, R.A., Schwarzacher,
W., Voss, M., 2001. Physico-chemical stratigraphy of Gotland Basin Holocene
sediments, the Baltic Sea. Baltica 14, 58–66
Härtner, T., Straub, K.L., Kannenberg, E., 2005. Occurrence of hopanoid lipids in
anaerobic Geobacter species. FEMS Microbiology Letters 243, 59–64.
Innes, H.E., Bishop, A.N., Head, I.M., Farrimond, P., 1997. Preservation and diagenesis
of hopanoids in recent lacustrine sediments of Priest Pot, England. Organic
Geochemistry 26, 565–576.
IPCC, 2007. Changes in atmospheric constituents and in radiative forcing. In:
Solomon, S., Qin, D., Manning, M., Chen, Z., Marquis, M., Averyt, K.B., Tignor, M.,
Miller, H.L., Climate Change: The Physical Science basis. Contribution of Working
Group I to the Fourth Assessment Report of the Intergovernmental Panel on Climate
Change (Eds.). Cambridge University Press, Cambridge, United Kingdom and New
York, NY, USA, pp. 41–68.
Jahnke, L.L., Summons, R.E., Hope, J.M., Des Marais, D.J., 1999. Carbon isotopic
fractionation in lipids from methanotrophic bacteria II: The effects of physiology and
environmental parameters on the biosynthesis and isotopic signatures of
biomarkers. Geochimica et Cosmochimica Acta 63, 79–93.
Labrenz, M., Jost, G., Jürgens, K., 2007. Distribution of abundant prokaryotic
organisms in the water column of the central Baltic Sea with an oxic–anoxic
interface. Aquatic Microbial Ecology 46, 177–190.
Labrenz, M., Sintes, E., Toetzke, F., Zumsteg, A., Herndl, G.J., Seidler, M., Jürgens, K.,
2010. Relevance of a crenarchaeotal subcluster related to Candidatus Nitrosopumilus
maritimus to ammonia oxidation in the suboxic zone of the central Baltic Sea. The
ISME Journal 4, 1496–1508.
Lass, H.U., Matthäus, W., 2008. General oceanography of the Baltic Sea. In: Feistel, R.,
Nausch, G., Wasmund, N. (Eds.), State and Evolution of the Baltic Sea, 1952– 2005.
John Wiley & Sons, Inc., New Jersey, pp. 5–44.
Chapter 5 – Biomarkers for aerobic methanotrophy in the water column of the Gotland Deep
116
Makula, R.A., 1978. Phospholipid composition of methane-utilizing bacteria. Journal
of Bacteriology 134, 771–777.
Matthäus, W., Schinke, H., 1999. The influence of river runoff on deep water
conditions of the Baltic Sea. Hydrobiologia 393, 1–10.
Meier, H.E.M., Feistel, R., Piechura, J., Arneborg, L., Burchard, H., Fiekas, V., Golenko,
N., Kuzmina, N., Mohrholz, V., Nohr, C., Paka, V.T., Sellschopp, J., Stips, A., Zhurbas, V.,
2006. Ventilation of the Baltic Sea deep water: a brief review of present knowledge
from observations and models. Oceanologia 48, 133–164.
Neunlist, S., Rohmer, M., 1985a. The hopanoids of ‘Methylosinus trichosporium’:
aminobacteriohopanetriol and aminobacteriohopanetetrol. Journal of General
Microbiology 131, 1363–1367.
Neunlist, S., Rohmer, M., 1985b. Novel hopanoids from the methylotrophic bacteria
Methylococcus capsulatus and Methylomonas methanica. (22S)-35-
aminobacteriohopane-30,31,31,33,34-pentol and (22S)-35-amino-3β
methylbacteriohopane- 30,31,32,33,34-pentol. Biochemical Journal 231, 635– 639.
Nichols, P.D., Smith, G.A., Antworth, C.P., Hanson, R.S., White, D.C., 1985.
Phospholipid and lipopolysaccharide normal and hydroxy fatty acids as potential
signatures for methane-oxidizing bacteria. FEMS Microbiology Ecology, 327–335.
Oude Elferink, S.J.W.H., Boschker, H.T.S., Stams, A.J.M., 1998. Identification of sulfate
reducers and Syntrophobacter sp. in anaerobic granular sludge by fatty-acid
biomarkers and 16S rRNA probing. Geomicrobiology Journal 15, 3–17.
Ourisson, G., Rohmer, M., 1982. Prokaryotic polyterpenes: phylogenetic precursors
of sterols. In: Bronner, F., Kleinzeller, A. (Eds.), Current Topics in Membranes and
Transport. Academic Press, Inc., New York, pp. 153–182.
Ourisson, G., Rohmer, M., Poralla, K., 1987. Prokaryotic hopanoids and other
polyterpenoid sterol surrogates. Annual Review of Microbiology 41, 301–333.
Chapter 5 – Biomarkers for aerobic methanotrophy in the water column of the Gotland Deep
117
Reeburgh, W.S., 1976. Methane consumption in Cariaco Trench waters and
sediments. Earth and Planetary Science Letters 28, 337–344.
Reeburgh, W.S., 2007. Oceanic methane biogeochemistry. Chemical Reviews 107,
486–513.
Reissmann, J.H., Burchard, H., Feistel, R., Hagen, E., Lass, H.U., Mohrholz, V., Nausch,
G., Umlauf, L., Wieczorek, G., 2009. State-of-the-art review on vertical mixing in the
Baltic Sea and consequences for eutrophication. Progress in Oceanography 82, 47–
80.
Rohmer, M., Bouvier-Nave, P., Ourisson, G., 1984. Distribution of hopanoid
triterpenes in prokaryotes. Journal of General Microbiology 130, 1137–1150.
Sáenz, J.P., Wakeham, S.G., Eglinton, T.I., Summons, R.E., 2011. New constraints on
the provenance of hopanoids in the marine geologic record: bacteriohopanepolyols
in marine suboxic and anoxic environments. Organic Geochemistry 42, 1351–1362.
Sáenz, J.P., Waterbury, J.B., Eglinton, T.I., Summons, R.E., 2012. Hopanoids in marine
cyanobacteria: probing their phylogenetic distribution and biological role.
Geobiology 10, 311–319.
Schmale, O., Schneider von Deimling, J., Gülzow, W., Nausch, G., Waniek, J.J., Rehder,
G., 2010. Distribution of methane in the water column of the Baltic Sea. Geophysical
Research Letters 37, L12604.
Schmale, O., Blumenberg, M., Kießlich, K., Jakobs, G., Berndmeyer, C., Labrenz, M.,
Thiel, V., Rehder, G., 2012. Aerobic methanotrophy within the pelagic redoxzone of
the Gotland Deep (central Baltic Sea). Biogeosciences 9, 4969–4977.
Schneider, B., Nausch, G., Kubsch, H., Petersohn, I., 2002. Accumulation of total CO2
during stagnation in the Baltic Sea deep water and its relationship to nutrient and
oxygen concentrations. Marine Chemistry 77, 277–291.
Schubert, C.J., Coolen, M.J., Neretin, L.N., Schippers, A., Abbas, B., Durisch-Kaiser, E.,
Wehrli, B., Hopmans, E.C., Damste, J.S., Wakeham, S., Kuypers, M.M., 2006. Aerobic

Chapter 5 – Biomarkers for aerobic methanotrophy in the water column of the Gotland Deep
118
and anaerobic methanotrophs in the Black Sea water column. Environmental
Microbiology 8, 1844–1856.
Scranton, M.I., Crill, P., Angelis, M., Donaghay, P., Sieburth, J., 1993. The importance of
episodic events in controlling the flux of methane from an anoxic basin.
Biogeochemical Cycles 7, 491–507.
Sinninghe Damsté, J.S., Rijpstra, W.I.C., Schouten, S., Fuerst, J.A., Jetten, M.S.M., Strous,
M., 2004. The occurrence of hopanoids in planctomycetes: implications for the
sedimentary biomarker record. Organic Geochemistry 35, 561–566.
Sturt, H.F., Summons, R.E., Smith, K., Elvert, M., Hinrichs, K.U., 2004. Intact polar
membrane lipids in prokaryotes and sediments deciphered by highperformance
liquid chromatography/electrospray ionization multistage mass spectrometry – new
biomarkers for biogeochemistry and microbial ecology. Rapid Communications in
Mass Spectrometry 18, 617–628.
Summons, R.E., Jahnke, L.L., Hope, J.M., Logan, G.A., 1999. 2-Methylhopanoids as
biomarkers for cyanobacterial oxygenic biosynthesis. Nature 400, 554–557.
Summons, R.E., Bradley, A.S., Jahnke, L.L., Waldbauer, J.R., 2006. Steroids,
triterpenoids and molecular oxygen. Philosophical Transactions of the Royal Society
of London: Series B, Biological Sciences 361, 951–968.
Talbot, H.M., Farrimond, P., 2007. Bacterial populations recorded in diverse
sedimentary biohopanoid distributions. Organic Geochemistry 38, 1212–1225.
Talbot, H.M., Watson, D.F., Murrel, J.C., Carter, J.F., Farrimond, P., 2001. Analysis of
intact bacteriohopanepolyols from methanotrophic bacteria by reversed-phase high-
performance liquid chromatography–atmospheric pressure chemical ionisation
mass spectrometry. Journal of Chromatography A 921, 175–185.
Talbot, H.M., Squier, A.H., Keely, B.J., Farrimond, P., 2003a. Atmospheric pressure
chemical ionisation reversed-phase liquid chromatography/ion trap mass
spectrometry of intact bacteriohopanepolyols. Rapid Communications in Mass
Spectrometry 17, 728–737.

Chapter 5 – Biomarkers for aerobic methanotrophy in the water column of the Gotland Deep
119
Talbot, H.M., Summons, R.E., Jahnke, L.L., Farrimond, P., 2003b. Characteristic
fragmentation of bacteriohopanepolyols during atmospheric pressure chemical
ionisation liquid chromatography/ion trap mass spectrometry. Rapid
Communications in Mass Spectrometry 17, 2788–2796.
Talbot, H.M., Summons, R.E., Jahnke, L.L., Cockell, C.S., Rohmer, M., Farrimond, P.,
2008. Cyanobacterial bacteriohopanepolyol signatures from cultures and natural
environmental settings. Organic Geochemistry 39, 232–263.
Taylor, J., Parkes, J., 1983. The cellular fatty acids of the sulphate-reducing bacteria,
Desulfobacter sp., Desulfobulbus sp. and Desulfovibrio desulfuricans. Journal of
General Microbiology 129, 3303–3309.
Teske, A., Wawer, C., Muyzer, G., Ramsing, N.B., 1996. Distribution of sulfate reducing
bacteria in a stratified fjord (Mariager Fjord, Denmark) as evaluated by most-
probable-number counts and denaturing gradient gel electrophoresis of PCR-
amplified ribosomal DNA fragments. Applied and Environmental Microbiology 62,
1405–1415.
Wakeham, S.G., Hopmans, E.C., Schouten, S., Sinninghe Damsté, J.S., 2004. Archaeal
lipids and anaerobic oxidation of methane in euxinic water columns: a comparative
study of the Black Sea and Cariaco Basin. Chemical Geology 205, 427–442.
Wakeham, S.G., Amann, R., Freeman, K.H., Hopmans, E.C., Jørgensen, B.B., Putnam,
I.F., Schouten, S., Sinninghe Damsté, J.S., Talbot, H.M., Woebken, D., 2007. Microbial
ecology of the stratified water column of the Black Sea as revealed by a
comprehensive biomarker study. Organic Geochemistry 38, 2070–2097.
Watson, D.F., 2002. Environmental distribution and sedimentary fate of hopanoid
biological marker compounds. Newcastle upon Tyne, UK, University of Newcastle.
Ph.D. Thesis.
Welander, P.V., Summons, R.E., 2012. Discovery, taxonomic distribution, and
phenotypic characterization of a gene required for 3-methylhopanoid production.
Proceedings of the National Academy of Sciences of the USA 109, 12905–12910.

Chapter 5 – Biomarkers for aerobic methanotrophy in the water column of the Gotland Deep
120
Welander, P.V., Coleman, M.L., Sessions, A.L., Summons, R.E., Newman, D.K., 2010.
Identification of a methylase required for 2-methylhopanoid production and
implications for the interpretation of sedimentary hopanes. Proceedings of the
National Academy of Sciences of the USA 109, 8537–8542.

Chapter 6 – Record of water column stratification in Holocene Baltic Sea sediments
121
6
Bacteriohopanepolyols record stratification, nitrogen fixation and other biogeochemical perturbations in
Holocene sediments of the central Baltic Sea
Martin Blumenberg, Christine Berndmeyer, Matthias Moros, Melanie Muschalla, Oliver
Schmale, and Volker Thiel
Biogeosciences (2013) 10, 2725-2735.
DOI: 10.5194/bg-10-2725-2013, Open Access
6.1 Abstract
The Baltic Sea, one of the world’s largest brackish-marine basins, established after
deglaciation of Scandinavia about 17 000 to 15 000 yr ago. In the changeable history
of the Baltic Sea, the initial freshwater system was connected to the North Sea about
8000 yrs ago and the modern brackish-marine setting (Littorina Sea) was
established. Today, a relatively stable stratification has developed in the water
column of the deep basins due to salinity differences. Stratification is only
occasionally interrupted by mixing events, and it controls nutrient availability and
growth of specifically adapted microorganisms and algae. We studied
bacteriohopanepolyols (BHPs), lipids of specific bacterial groups, in a sediment core
from the central Baltic Sea (Gotland Deep) and found considerable differences
between the distinct stages of the Baltic Sea’s history. Some individual BHP
structures indicate contributions from as yet unknown redoxcline-specific bacteria
(bacteriohopanetetrol isomer), methanotrophic bacteria (35-
aminobacteriohopanetetrol), cyanobacteria (bacteriohopanetetrol cyclitol ether
isomer) and from soil bacteria (adenosylhopane) through allochthonous input after
the Littorina transgression, whereas the origin of other BHPs in the core has still to
be identified. Notably high BHP abundances were observed in the deposits of the
brackish-marine Littorina phase, particularly in laminated sediment layers. Because
these sediments record periods of stable water column stratification, bacteria
specifically adapted to these conditions may account for the high portions of BHPs.
Chapter 6 – Record of water column stratification in Holocene Baltic Sea sediments
122
An additional and/or accompanying source may be nitrogen-fixing (cyano)bacteria,
which is indicated by a positive correlation of BHP abundances with Corg and δ15N.
6.2 Introduction
The Baltic Sea had a variable geological and biogeochemical history after it
originated 17 000–15 000 yr before present (BP; see comprehensive summary in
Andrén et al., 2011). After deglaciation of Scandinavia, the closed basin of the
modern Baltic Sea was filled with melt water and a freshwater system developed
around 16 000 yr BP, the so-called Baltic Ice Lake. This oligotrophic lake setting was
terminated about 11 700 yr BP by a pulse of marine water that entered the Baltic
Sea via a passage through south-central Sweden and led to a slightly brackish
environment (Yoldia Sea). Freshwater conditions re-established about 10 700 yr BP
(Ancylus Lake), until the major marine transgression took place via the Kattegat,
resulting in the establishment of the modern Littorina Sea. The onset of the Littorina
Sea stage is still a matter of discussion (see e.g. Rößler et al., 2011). Dating based on
calcareous fossils revealed 8100–8000 yr BP in the Great Belt (e.g. Bennike et al.,
2004) and Mecklenburg Bight (Rößler et al., 2011), and 7200 yr BP in Arkona Basin
(e.g. Moros et al., 2002). Bulk sediment dates revealed older ages of 8500–8000 yr
BP for the onset in Bornholm Basin (Andrén et al., 2000a) and Gotland Basin
(Andrén et al., 2000b).
The ingression of marine North Sea waters led to the development of a stratified
water body in the deep basins of the central Baltic Sea, with more saline, denser
waters in the lower water column. Such conditions also characterize one of the
deepest basins of the modern Baltic Sea – the Gotland Deep (249 m water depth). In
this basin there exists a relatively stable oxic–anoxic transition zone (redoxcline) at
about 100 m water depth. The stratification of the Gotland Deep is only occasionally
disturbed by turbulent vertical transport processes and inflows of North Sea water
(Reissmann et al., 2009). The stratification has major consequences on the nutrient
situation of the central Baltic Sea and the composition of pelagic micro- and
macroorganisms (e.g. Labrenz et al., 2007; Schmale et al., 2012). For instance, high
nutrient input with excess phosphorus loads promotes growth of nitrogen-fixing
cyanobacteria (Nausch et al., 2009; Wasmund et al., 2012).

Chapter 6 – Record of water column stratification in Holocene Baltic Sea sediments
123
Numerous micropalaeontological and biogeochemical studies on the Holocene in the
central Baltic Sea exist, mainly reflecting the change from oligotrophic freshwater
conditions (Ancylus Lake) to a brackish-marine setting (Littorina Sea) with
widespread deep water anoxia (e.g. Sohlenius et al., 1996; Bianchi et al., 2000;
Brenner, 2001, 2005; Voss et al., 2001). As a result of the Littorina Sea transgression,
marine diatoms and dinoflagellates entered the central Baltic Sea (Brenner, 2005),
and cyanobacteria became increasingly important as indicated by pigment and
molybdenum abundances (Bianchi et al., 2000; Kunzendorf et al., 2001; Poutanen
and Nikkila, 2001; Borgendahl and Westman, 2007). Due to the lack of preservable
cell remnants, however, information about the microbial protagonists of
biogeochemical cycling in the changeful history of the central Baltic Sea is scarce. An
organic geochemical approach was made by Nytoft and Larsen (2001), who reported
changes in the composition of bacterial hopanoid hydrocarbons from the Gotland
Deep and concluded that bacteria became more prominent during the Littorina Sea
stage. Our study aims to specify these bacterial contributions to the Holocene
sediments of the Gotland Deep by using one of the most ubiquitous classes of lipids,
bacteriohopanepolyols (BHPs). BHPs are produced by many groups of bacteria and
are excellently suitable for palaeoreconstructions of contributions from
metabolically and phylogenetically distinct bacteria into lake and marine sediments
(e.g. Talbot and Farrimond, 2007; Coolen et al., 2008; Blumenberg et al., 2009;
Taylor and Harvey, 2011). So far, only one report of BHPs from surface sediments of
the central Baltic Sea exists (Berndmeyer et al., 2013). This study focused on BHPs
from methanotrophic bacteria living in the redoxcline of the Gotland Deep water
column and clearly demonstrated the utility of BHPs to reflect water column
processes. The current study is aimed at BHPs and selected other biomarkers in
deeper Holocene sediments of the Gotland Deep. Our goal is to bridge the gap
between the relatively well known record of eukaryotic remains and the much less
understood bacteria and, by that, to get a better understanding of bacterial primary
production and redoxcline-related processes in the geological history of the central
Baltic Sea.
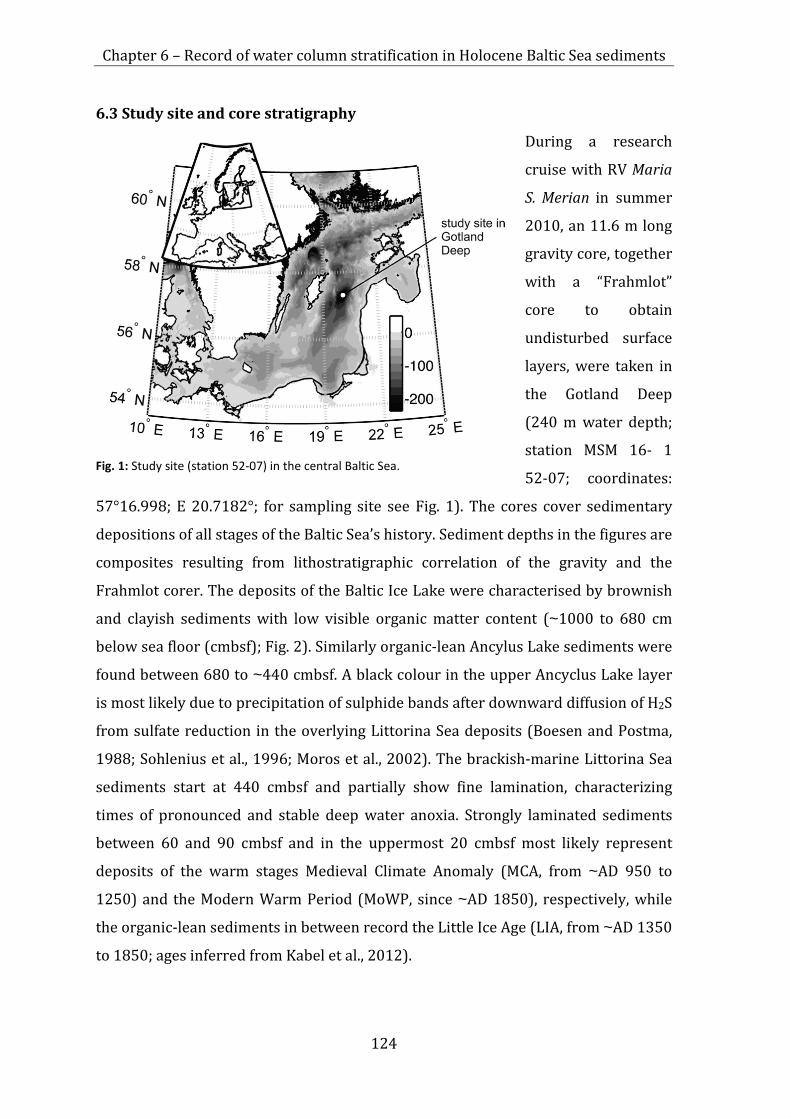
Chapter 6 – Record of water column stratification in Holocene Baltic Sea sediments
124
6.3 Study site and core stratigraphy
During a research
cruise with RV Maria
S. Merian in summer
2010, an 11.6 m long
gravity core, together
with a “Frahmlot”
core to obtain
undisturbed surface
layers, were taken in
the Gotland Deep
(240 m water depth;
station MSM 16- 1
52-07; coordinates:
57°16.998; E 20.7182°; for sampling site see Fig. 1). The cores cover sedimentary
depositions of all stages of the Baltic Sea’s history. Sediment depths in the figures are
composites resulting from lithostratigraphic correlation of the gravity and the
Frahmlot corer. The deposits of the Baltic Ice Lake were characterised by brownish
and clayish sediments with low visible organic matter content (~1000 to 680 cm
below sea floor (cmbsf); Fig. 2). Similarly organic-lean Ancylus Lake sediments were
found between 680 to ~440 cmbsf. A black colour in the upper Ancyclus Lake layer
is most likely due to precipitation of sulphide bands after downward diffusion of H2S
from sulfate reduction in the overlying Littorina Sea deposits (Boesen and Postma,
1988; Sohlenius et al., 1996; Moros et al., 2002). The brackish-marine Littorina Sea
sediments start at 440 cmbsf and partially show fine lamination, characterizing
times of pronounced and stable deep water anoxia. Strongly laminated sediments
between 60 and 90 cmbsf and in the uppermost 20 cmbsf most likely represent
deposits of the warm stages Medieval Climate Anomaly (MCA, from ~AD 950 to
1250) and the Modern Warm Period (MoWP, since ~AD 1850), respectively, while
the organic-lean sediments in between record the Little Ice Age (LIA, from ~AD 1350
to 1850; ages inferred from Kabel et al., 2012).
Fig. 1: Study site (station 52-07) in the central Baltic Sea.
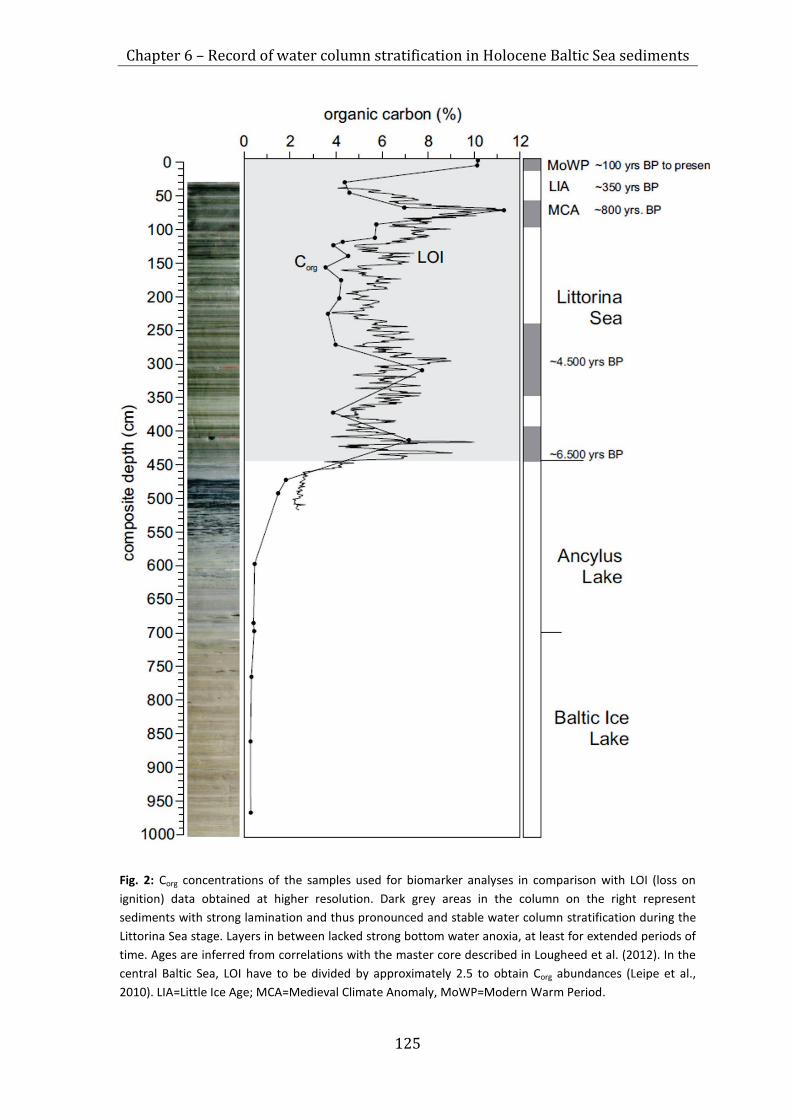
Chapter 6 – Record of water column stratification in Holocene Baltic Sea sediments
125
Fig. 2: Corg concentrations of the samples used for biomarker analyses in comparison with LOI (loss on ignition) data obtained at higher resolution. Dark grey areas in the column on the right represent sediments with strong lamination and thus pronounced and stable water column stratification during the Littorina Sea stage. Layers in between lacked strong bottom water anoxia, at least for extended periods of time. Ages are inferred from correlations with the master core described in Lougheed et al. (2012). In the central Baltic Sea, LOI have to be divided by approximately 2.5 to obtain Corg abundances (Leipe et al., 2010). LIA=Little Ice Age; MCA=Medieval Climate Anomaly, MoWP=Modern Warm Period.

Chapter 6 – Record of water column stratification in Holocene Baltic Sea sediments
126
6.4 Materials and methods
6.4.1 Sample preparation and bulk analyses (Corg, N, δ15N, LOI)
The core was stored cool on board and in the laboratory until sampling in February
2011 (samples for biomarker and bulk analyses were then stored frozen until
further analyses). The upper three samples were obtained from the accompanying
Frahmlot (MSM 16-1 52-04) and data were taken from Berndmeyer et al. (2013).
The samples were homogenized by grinding, and aliquots were taken for elemental
analyses (C /N/ S) using a Eurovector Euro EA CNS analyser. To determine the
contents of organic carbon (Corg), each sample was also analysed after
decarbonatisation with HCl. The error for C and N analyses are generally <2 and 5%,
respectively. Bulk δ15N isotope analysis was carried out in duplicate using elemental
analysis–isotope ratio mass spectrometry (EA-IRMS, Delta plus, Thermo scientific).
The lab standard deviation of this method is 0.1 ‰. The loss on ignition (LOI) was
determined in high resolution for the upper 500 cm of the gravity core by ashing
freeze-dried samples at 550 °C (3 h) and calculating the resulting mass difference
(wt.%).
6.4.2 Extraction, column chromatography and derivatisation
About 7.5 g of the sediments was extracted three times (20 min) with 40 ml of a
mixture of dichloromethane (DCM) and methanol (MeOH) (3 : 1, v/v) in a CEM Mars
5 microwave (Matthews, NC, USA) at 80 °C and 800W. An aliquot of the combined
extract was acetylated and analysed for bacteriohopanepolyols by liquid
chromatographymass spectrometry (LC-MS; see below). Acetylation was performed
using a mixture of acetic acid anhydride and pyridine (1 : 1, v/v, 50 °C for 1 h and
overnight at room temperature). The pyridine/acetic acid anhydride mixture was
then dried under vacuum. Another aliquot was separated by column
chromatography into a hydrocarbon (F1), a ketone and alcohol (F2), and a polar
fraction (F3; details are described in Blumenberg et al., 2009). Resulting alcohols in
the F2 were silylated using BSTFA (N,O-bis[trimethylsilyl]trifluoroacetamide) for
1.5 h at 80 °C.
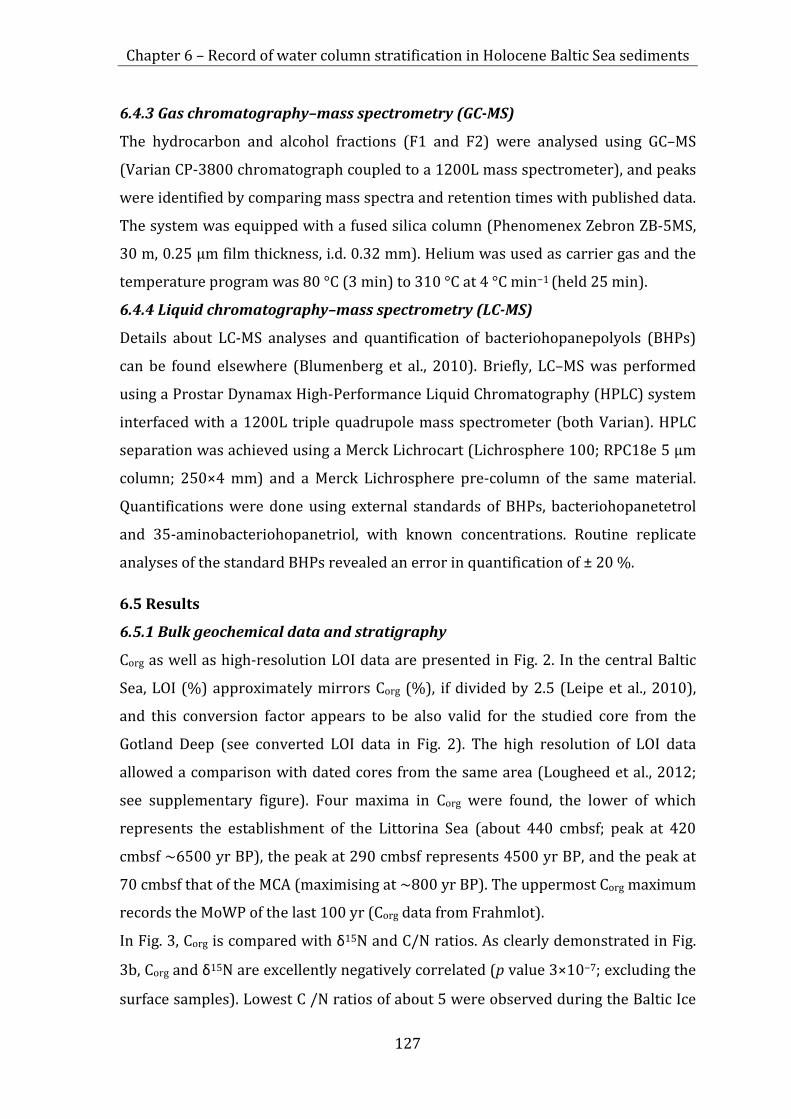
Chapter 6 – Record of water column stratification in Holocene Baltic Sea sediments
127
6.4.3 Gas chromatography–mass spectrometry (GC-MS)
The hydrocarbon and alcohol fractions (F1 and F2) were analysed using GC–MS
(Varian CP-3800 chromatograph coupled to a 1200L mass spectrometer), and peaks
were identified by comparing mass spectra and retention times with published data.
The system was equipped with a fused silica column (Phenomenex Zebron ZB-5MS,
30 m, 0.25 μm film thickness, i.d. 0.32 mm). Helium was used as carrier gas and the
temperature program was 80 °C (3 min) to 310 °C at 4 °C min−1 (held 25 min).
6.4.4 Liquid chromatography–mass spectrometry (LC-MS)
Details about LC-MS analyses and quantification of bacteriohopanepolyols (BHPs)
can be found elsewhere (Blumenberg et al., 2010). Briefly, LC–MS was performed
using a Prostar Dynamax High-Performance Liquid Chromatography (HPLC) system
interfaced with a 1200L triple quadrupole mass spectrometer (both Varian). HPLC
separation was achieved using a Merck Lichrocart (Lichrosphere 100; RPC18e 5 μm
column; 250×4 mm) and a Merck Lichrosphere pre-column of the same material.
Quantifications were done using external standards of BHPs, bacteriohopanetetrol
and 35-aminobacteriohopanetriol, with known concentrations. Routine replicate
analyses of the standard BHPs revealed an error in quantification of ± 20 %.
6.5 Results
6.5.1 Bulk geochemical data and stratigraphy
Corg as well as high-resolution LOI data are presented in Fig. 2. In the central Baltic
Sea, LOI (%) approximately mirrors Corg (%), if divided by 2.5 (Leipe et al., 2010),
and this conversion factor appears to be also valid for the studied core from the
Gotland Deep (see converted LOI data in Fig. 2). The high resolution of LOI data
allowed a comparison with dated cores from the same area (Lougheed et al., 2012;
see supplementary figure). Four maxima in Corg were found, the lower of which
represents the establishment of the Littorina Sea (about 440 cmbsf; peak at 420
cmbsf ~6500 yr BP), the peak at 290 cmbsf represents 4500 yr BP, and the peak at
70 cmbsf that of the MCA (maximising at ~800 yr BP). The uppermost Corg maximum
records the MoWP of the last 100 yr (Corg data from Frahmlot).
In Fig. 3, Corg is compared with δ15N and C/N ratios. As clearly demonstrated in Fig.
3b, Corg and δ15N are excellently negatively correlated (p value 3×10⁻⁷; excluding the
surface samples). Lowest C /N ratios of about 5 were observed during the Baltic Ice
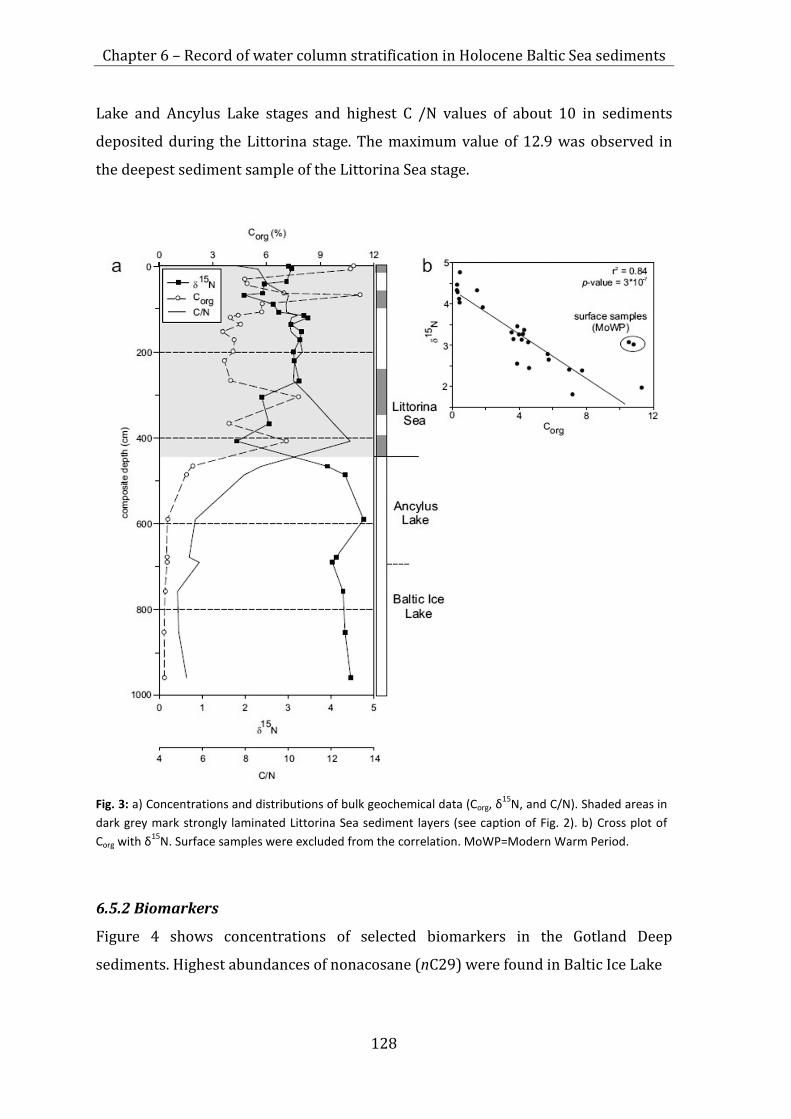
Chapter 6 – Record of water column stratification in Holocene Baltic Sea sediments
128
Lake and Ancylus Lake stages and highest C /N values of about 10 in sediments
deposited during the Littorina stage. The maximum value of 12.9 was observed in
the deepest sediment sample of the Littorina Sea stage.
Fig. 3: a) Concentrations and distributions of bulk geochemical data (Corg, δ
15N, and C/N). Shaded areas in dark grey mark strongly laminated Littorina Sea sediment layers (see caption of Fig. 2). b) Cross plot of Corg with δ15N. Surface samples were excluded from the correlation. MoWP=Modern Warm Period.
6.5.2 Biomarkers
Figure 4 shows concentrations of selected biomarkers in the Gotland Deep
sediments. Highest abundances of nonacosane (nC29) were found in Baltic Ice Lake

Chapter 6 – Record of water column stratification in Holocene Baltic Sea sediments
129
Fig. 4: Selected biomarkers in the Holocene sediments of the Gotland Deep in comparison with Corg. a) Nonacosane (nC29), representing higher plant inputs; b) dinosterol (4α,23,24-trimethyl-5α-cholest-22E-en-3β-ol), representing dinoflagellate inputs; c) total BHP, representing inputs from hopanoid-producing bacteria. Error bars show the analytical uncertainty of BHP analyses of 20 %. Shaded areas in dark grey mark strongly laminated Littorina Sea sediment layers. BHP concentrations for the surface sediment samples (0–2 and 6–8 cmbsf) were taken from Berndmeyer et al. (2013).
and Ancylus Lake samples (~600 to 1000 cmbsf; up to 150 μg g−1 Corg, Fig. 4a). All
core samples revealed a high carbon preference index (CPI) of >5, reflecting a strong
odd-over-even carbon number predominance and thus a mostly terrestrial origin of
nC29 and other long-chain n-alkanes (Bray and Evans, 1961). Above the Ancylus
Lake–Littorina Sea transition, concentrations clearly decreased to about 20 μg g−1
Corg. In the Littorina Sea sediments, concentrations of nC29 were relatively stable,
demonstrating low fluctuations of terrestrial plant input. In contrast to nC29,
abundances of dinosterol (4α,23,24-trimethyl-5α-cholest-22E-en-3β-ol), a 4-methyl
steroid prominent in dinoflagellates (Withers, 1983), is positively correlated with
total Corg (Fig. 4b).
Similar to dinosterol, the sum of bacteriohopanepolyols (BHPs) revealed highest
abundances in the Littorina Sea sediments. Within this lithological unit, particularly
high BHP amounts, maximising at about 600 μg g−1 Corg, were observed in the most

Chapter 6 – Record of water column stratification in Holocene Baltic Sea sediments
130
organic-rich layers. Whereas dinosterol increased at the establishment of the
Littorina Sea stage, BHPs had already risen during the late Ancylus Lake stage (after
the initial Littorina transgression at about 470 cmbsf). The lowest BHP
concentrations were observed in the earlier Ancylus Lake and Baltic Ice Lake
sediments. The Gotland Deep core contains eight distinct BHPs whose individual
distributions are shown in Fig. 5. Highest amounts were found for
bacteriohopanetetrol (BHT) and 32,35-anhydroBHT, with the latter showing greater
abundances with increasing depth. 35-aminobacteriohopanetriol and –tetrol were
prominent in sediments representing the beginning of the Littorina Sea stage. BHT
cyclitol ethers (two isomers; tentatively identified by co-elutions with previously
identified BHT cyclitol isomers) were first observed in sediments of the late Ancylus
Lake stage and were omnipresent, although in low abundance, in the sediments of
the Littorina Sea. In the lowermost Littorina Sea stage sample studied (at 420
cmbsf), an unknown BHT isomer was found, whose elution characteristics
correspond with a BHT isomer found in the recent Gotland Deep water column
(Berndmeyer et al., 2013).
6.6 Discussion
6.6.1 Biogeochemical changes in the Holocene as reflected by bulk geochemical
parameters
The sediments from the Gotland Deep markedly reflect the establishment of the
marine-brackish Littorina Sea in a steep increase in Corg, probably due to enhanced
preservation and/or increasing primary production, and the deposition of strongly
laminated sediments (Fig. 2; see discussion below). A peak in Corg was also observed
at about 800 yr BP, most likely reflecting high organic carbon accumulation and
sediment lamination during the MCA. The sediments deposited during the
subsequent cooler period (Little Ice Age; LIA) are characterised by low Corg and most
likely oxic conditions in the bottom waters (Sohlenius et al., 1996; Andrén et al.,
2000b; Fig. 2). Above, the MoWP and recent anthropogenic influence are reflected
by a parallel increase in δ15N and Corg (Voss et al., 2001; Struck et al., 2000). Except
for the samples from the MoWP, Corg correlates negatively with bulk δ15N (Fig. 3).
Enhanced growth of cyanobacteria capable of biological nitrogen fixation is a
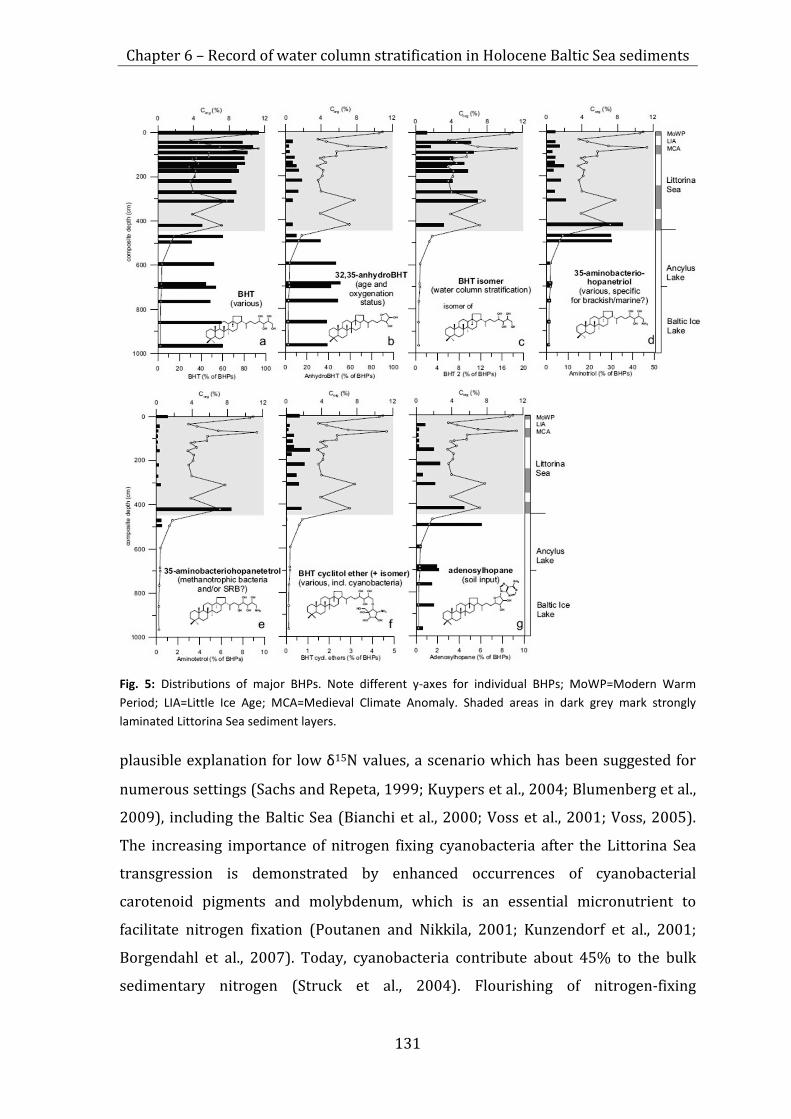
Chapter 6 – Record of water column stratification in Holocene Baltic Sea sediments
131
Fig. 5: Distributions of major BHPs. Note different y-axes for individual BHPs; MoWP=Modern Warm Period; LIA=Little Ice Age; MCA=Medieval Climate Anomaly. Shaded areas in dark grey mark strongly laminated Littorina Sea sediment layers.
plausible explanation for low δ15N values, a scenario which has been suggested for
numerous settings (Sachs and Repeta, 1999; Kuypers et al., 2004; Blumenberg et al.,
2009), including the Baltic Sea (Bianchi et al., 2000; Voss et al., 2001; Voss, 2005).
The increasing importance of nitrogen fixing cyanobacteria after the Littorina Sea
transgression is demonstrated by enhanced occurrences of cyanobacterial
carotenoid pigments and molybdenum, which is an essential micronutrient to
facilitate nitrogen fixation (Poutanen and Nikkila, 2001; Kunzendorf et al., 2001;
Borgendahl et al., 2007). Today, cyanobacteria contribute about 45% to the bulk
sedimentary nitrogen (Struck et al., 2004). Flourishing of nitrogen-fixing

Chapter 6 – Record of water column stratification in Holocene Baltic Sea sediments
132
(cyano)bacteria is commonly promoted by phosphorus excess (lowering N/P ratios)
through riverine input or release from anoxic sediments (Bianchi et al., 2000).
Consequently, the establishment of a stratified, partly anoxic water body after the
Littorina Sea transgression is a conceivable scenario for a decrease of N/P ratios and
an increase in cyanobacterial biomass. A further reduction in the N/P ratio may have
been induced by bacterial denitrification under the established anoxic conditions
(Haug et al., 1998; Struck et al., 2000). Due to the high energy costs of cleaving N2,
nitrogen-fixing cyanobacteria have only an advantage over algae in waters depleted
in bioavailable nitrogen (Karl et al., 2002). Hence, the good correlation between high
Corg and low δ15N argues for (i) a major role of nitrogen-fixing (cyano)bacteria
during the deposition of organic-rich, laminated sediments (e.g. after the Littorina
Sea transgression, and during the MCA), and for (ii) enhanced primary production
under N/P ratios lower than the Redfield Ratio (C/N/P: 106/16/1; (Redfield et al.,
1963)). At the same time, cyanobacteria are known for biomass C/N ratios higher
than that obtained from the Redfield Ratio (C/N = 6.6). For Nodularia spumigena, an
important (nitrogen-fixing) cyanobacterium in the central Baltic Sea, a C/N of 8.5
was reported (Sörensson and Sahlsten, 1987). Consequently, the observed increase
in C/N in laminated sediments after the Littorina Transgression (Fig. 3a) is well
explainable with an increasing importance of cyanobacteria among the primary-
producing community. Moreover, a direct temperature dependence of
cyanobacterial blooming in the central Baltic Sea has also currently been reported
(Kabel et al., 2012), in addition to the indirect role of high temperatures for water
column stratification, and the related shift to low N/P ratios.
6.6.2 Biomarker records of biogeochemical perturbations in the central Baltic
Sea
6.6.2.1 Baltic Ice Lake–Ancylus Lake transition (10 700 – 9800 yr BP)
The resolution of samples from these intervals was low, but among the studied
biomarkers the transition is not reflected in any changes.
5.6.2.2 Ancylus Lake–Littorina Sea transition (~8500 – 8000 yr BP)
In Ancylus Lake sediments, nonacosane (nC29) was much higher in relative
abundance than in Littorina Sea deposits (Fig. 4a). nC29 is a biomarker for higher

Chapter 6 – Record of water column stratification in Holocene Baltic Sea sediments
133
plant waxes (Eglinton et al., 1962), and the concentration in the lower core
demonstrates the high relevance of allochthonous input during the Ancylus Lake
stage. This is supported by previous findings of abundant plant-derived triterpane
biomarkers in Ancylus Lake sediments (Nytoft and Larsen, 2001). After the Littorina
Sea transgression, a substantial environmental change is reflected by a drop in nC29
abundance by an order of magnitude (Fig. 4a). At the same time, a biomarker for
dinoflagellates, dinosterol (Withers, 1983), increased (Fig. 4b). Together, both
biomarkers mirror the shift from an oligotrophic, terrestrially influenced system
towards a setting controlled by particular brackish-marine primary producers,
which fits well with micropalaeontological studies (e.g. Brenner, 2001). It must be
noted, however, that dinosterol contributions in the Gotland Deep sediments appear
to be largely due to marine dinoflagellates of the Littorina Sea stage, whereas the
high relevance of specific freshwater dinoflagellates (e.g. Gonyaulax apiculata)
reported for the Ancylus Lake stage (Brenner, 2001; Yu and Berglund, 2007) is not
reflected by this biomarker.
As a result of the Littorina Sea transgression, concentrations of BHPs increased by
almost two orders of magnitude and followed a similar trend to Corg (Fig. 4c). The
maximum BHP concentrations of up to 600 μg g−1 Corg were extraordinarily high
compared to other marine settings (e.g. four times higher than in Black Sea
sediments; Blumenberg et al., 2009). Similarly, diploptene, a hopanoid hydrocarbon
that is produced by many bacteria along with BHP, was reported to be most
abundant in the Littorina Sea stage in Gotland Deep sediments (Nytoft and Larsen,
2001). The consistently low amounts of adenosylhopane, a BHP abundant in soil
bacteria (Talbot and Farrimond, 2007; Cooke et al., 2008; Fig. 5g), argues against
variations in land-derived allochthonous BHP contributions as a major control on
BHP patterns. Likewise, the peak in adenosylhopane in the late Ancylus Lake stage
may be due to enhanced input of soil organic matter during the flooding of land
areas during the Littorina transgression (Fig. 5g).
The observed trends might be also influenced, or amplified, by enhanced lipid
preservation as result of the establishment of anoxic bottom waters and sediments.
Enhanced preservation is crucial for high BHP abundances in sediments as these
polyfunctionalised lipid structures are prone to microbial degradation. A change in
the redox environment in the course of the Littorina Sea transgression is reflected in
Chapter 6 – Record of water column stratification in Holocene Baltic Sea sediments
134
a decrease in the relative abundance of 32,35-anhydroBHT (Fig. 5b). 32,35-
anhydroBHT is a diagenetic degradation product of BHT and composite BHPs under
acidic and marine sedimentary conditions (Bednarczyk et al., 2005; Schaeffer et al.,
2008, 2010). Higher concentrations of this diagenetic product consequently suggest
a lower preservation potential in Ancylus Lake and older sediments. In turn, the
generally low amounts of 32,35-anhydroBHT in Littorina Sea deposits, with lowest
abundances recorded in the organic rich laminated sediments, may reflect a
different preservational status of BHP. Apart from that, however, it is unlikely that
total BHP concentrations, including the diagenetic product 32,35-anhydroBHT, are
controlled by redox changes in bottom waters and sediments. Studies from
comparable settings demonstrated a stability of BHPs up to an age of 100 000 yr
(Cooke et al., 2008; Coolen et al., 2008; Blumenberg et al., 2009, 2010). Providing
additional evidence for production of BHPs as key control for BHP abundances in the
studied core, Corg trends were found to be slightly delayed to BHPs (e.g. Ancylus-
Littorina transition or at the MCA; Fig. 4). This rather indicates BHPs to record
pioneer organisms of these changes.
BHPs specific for cyanobacteria were not found in the Gotland Deep sediments.
However, an isomer of the common BHT cyclitol ether was observed that was also
observed in the oxic part of the water column (Berndmeyer et al., 2013), which
suggests a bacterial source from within the euphotic zone (Fig. 5f; BHT cyclitol ether
were summed up as similar trend suggest the same origin). An isomer of the
common BHT cyclitol ether was also reported from the cyanobacterium Anacystis
montana (Herrmann et al., 1996), which has, however, not been reported from the
recent Baltic Sea water column. The contribution of cyanobacteria to the
sedimentary BHP pool in Gotland Deep sediments therefore remains ambiguous and
seemingly reflects the fact that neither all cyanobacteria produce BHPs nor that their
BHP inventory, if present, must always be specific.
6.6.2.3 Biogeochemical variations during the Littorina Sea stage as reflected by BHPs
Despite the generally higher importance of BHP producing bacteria in the Littorina
Sea stage, internal variations in this unit were also observed. 35-
aminobacteriohopanetriol is, along with BHT, a ubiquitous BHP and is produced by
diverse bacterial groups. Bacteria rich in 35-aminobacteriohopanetriol flourished

Chapter 6 – Record of water column stratification in Holocene Baltic Sea sediments
135
particularly during the transition from the Ancylus Lake to the Littorina Sea where
concentrations are about 4-fold higher than in all other samples studied (Fig. 5d).
Which group of bacteria particularly sourced 35-aminobacteriohopanetriol is
unclear, but the same maximum, at the time of the Littorina Sea transgression is
revealed by a more specific BHP, 35-aminobacteriohopanetetrol (Fig. 5e), which was
also particularly abundant in Black Sea sediments reflecting the marine ingression
after the last deglaciation (Blumenberg et al., 2009). 35-aminobacteriohopanetetrol
was reported from cultured methanotrophic bacteria (Neunlist and Rohmer, 1985;
Talbot et al., 2001) as well as from sulfate reducing bacteria (Blumenberg et al.,
2006, 2012). Indeed, both bacterial groups can plausibly explain the observed trend
in these individual BHP concentrations. First, the inflow of marine sulfate-rich
waters during the Littorina Sea transgression, and the establishment of a stratified
water column has likely strongly stimulated the activity of sulfate reducing bacteria
in the upper sediments and bottom waters. Increased microbial sulfate reduction is
also expressed by an increase in pyrite sulfur in the respective core section (data not
shown; see also black pyrite layers from downward-diffusing H2S in the uppermost
Ancylus Lake sediments; Fig. 2). However, during the Littorina stage, SRB should
have remained a stable part of the microbial community. This conflicts with the
observed decreases in 35-aminobacteriohopanetriol and –tetrol abundances after
the Littorina optimum (Fig. 5d and e). Moreover, a quantitative estimate on
sedimentary SRB in a comparable sedimentary setting (the Black Sea), clearly
argued against these bacteria as considerable contributor to the BHP pool in this
setting (Blumenberg et al., 2009). Another possible source for both BHPs are
methanotrophic bacteria, which were reported as important members of the
microbial community at the recent redoxcline of the Gotland Deep water column
(Schmale et al., 2012; Berndmeyer et al., 2013). Unfortunately, the analyses of δ13C
values to characterise the bacterial source (Hayes, 1993) and particularly to identify
methanotrophy (Freeman et al., 1990) were not possible for the Gotland Deep due to
low concentrations. Despite this, we propose that both 35-aminobacteriohopanetriol
and –tetrol are related to pioneer methanotrophic bacteria related to the
establishment of the pelagic redoxcline.
Redoxcline processes are also reflected by another abundant BHP in Gotland Deep
sediments. In the upper part of the core, we found relatively high amounts of a BHT
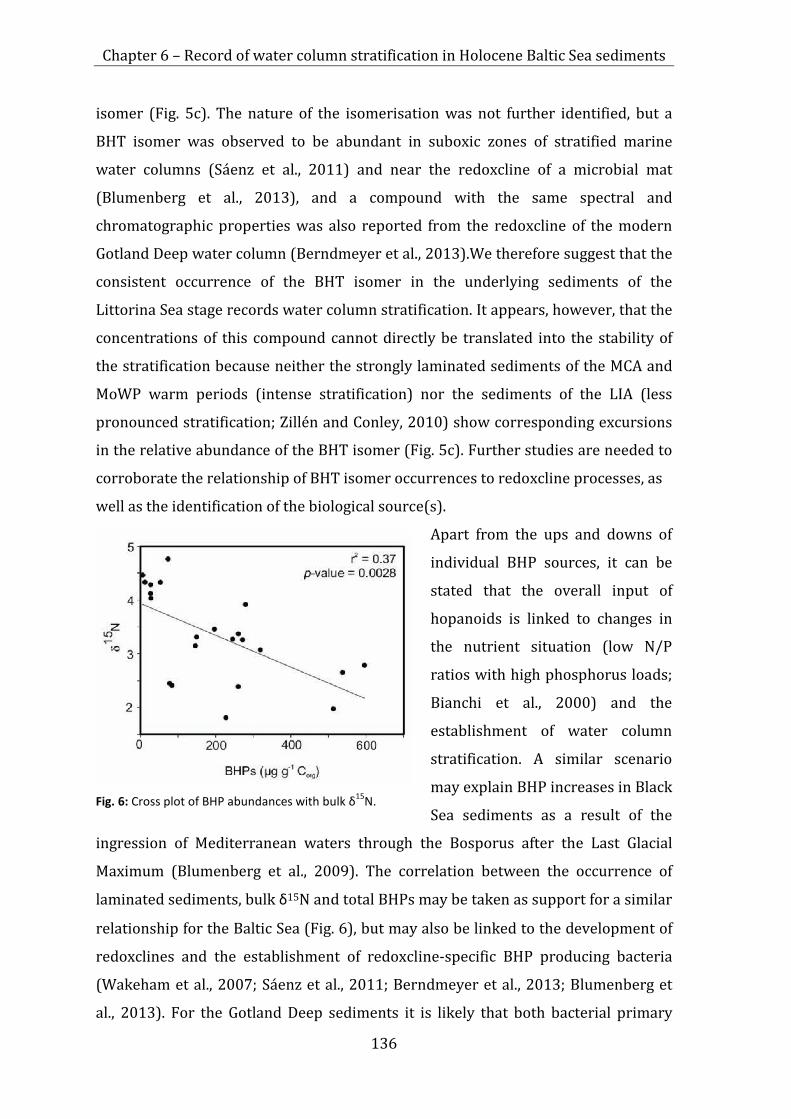
Chapter 6 – Record of water column stratification in Holocene Baltic Sea sediments
136
isomer (Fig. 5c). The nature of the isomerisation was not further identified, but a
BHT isomer was observed to be abundant in suboxic zones of stratified marine
water columns (Sáenz et al., 2011) and near the redoxcline of a microbial mat
(Blumenberg et al., 2013), and a compound with the same spectral and
chromatographic properties was also reported from the redoxcline of the modern
Gotland Deep water column (Berndmeyer et al., 2013).We therefore suggest that the
consistent occurrence of the BHT isomer in the underlying sediments of the
Littorina Sea stage records water column stratification. It appears, however, that the
concentrations of this compound cannot directly be translated into the stability of
the stratification because neither the strongly laminated sediments of the MCA and
MoWP warm periods (intense stratification) nor the sediments of the LIA (less
pronounced stratification; Zillén and Conley, 2010) show corresponding excursions
in the relative abundance of the BHT isomer (Fig. 5c). Further studies are needed to
corroborate the relationship of BHT isomer occurrences to redoxcline processes, as
well as the identification of the biological source(s).
Apart from the ups and downs of
individual BHP sources, it can be
stated that the overall input of
hopanoids is linked to changes in
the nutrient situation (low N/P
ratios with high phosphorus loads;
Bianchi et al., 2000) and the
establishment of water column
stratification. A similar scenario
may explain BHP increases in Black
Sea sediments as a result of the
ingression of Mediterranean waters through the Bosporus after the Last Glacial
Maximum (Blumenberg et al., 2009). The correlation between the occurrence of
laminated sediments, bulk δ15N and total BHPs may be taken as support for a similar
relationship for the Baltic Sea (Fig. 6), but may also be linked to the development of
redoxclines and the establishment of redoxcline-specific BHP producing bacteria
(Wakeham et al., 2007; Sáenz et al., 2011; Berndmeyer et al., 2013; Blumenberg et
al., 2013). For the Gotland Deep sediments it is likely that both bacterial primary
Fig. 6: Cross plot of BHP abundances with bulk δ15N.

Chapter 6 – Record of water column stratification in Holocene Baltic Sea sediments
137
production under low N/P ratios and the presence of a redoxcline controlled BHP
abundances, but which factor prevailed is unclear. Nevertheless, the stability of the
stratification is most likely an important factor as BHP abundances appear to be
exceedingly high during warmer times (e.g. during the MCA and the MoWP). Future
studies should focus on the identification of microbial BHP producers thriving at
these biogeochemical zones because these zones appear to be key environments for
the biosynthesis of the precursors of geohopanoids, which are ubiquitous in rocks,
oils and sediments.
6.7 Conclusions
A composite core (gravity core and Frahmlot) covering the last 9000 yr of the
central Baltic Sea history was studied for bulk geochemical parameters and selected
biomarkers, with a particular focus on bacteriohopanepolyols (BHPs). Biomarker
distributions and abundances in the Baltic Ice Lake (before 11 700 yr BP) and
Ancylus Lake (10 700 to 8500 yr BP) sediments were similar and reflect pronounced
higher plant inputs and low primary productivity. Marine dinoflagellates, as
indicated by dinosterol, and BHP producing bacteria began to flourish after the
Littorina Sea transgression 8500 to 8000 yr BP. In the Littorina Sea stage, BHP
concentrations are the highest so far reported from a marine or brackish setting.
BHPs are most abundant in laminated sediments, pointing at an important role of
hopanoid producing bacteria during times of water column stratification and
pronounced anoxia of the lower water column. Such conditions characterised, for
instance, the onset of the Littorina Sea transgression, the MCA and the MoWP.
Whereas the discrete microorganisms that sourced the BHPs in Gotland Deep
sediments still have to be identified, the structures and distributions of individual
BHPs point at contributions from methanotrophic and other bacteria specific to
redoxclines, as well as most likely cyanobacteria. A good correlation between BHPs,
Corg and δ15N highlights an involvement of BHP-producing bacteria in the fixation of
atmospheric nitrogen and, as this process is crucial for the present day Baltic Sea,
underpins their role for the entire nutrient cycle in this marginal marine basin.
Acknowledgments
We thank the officer and crew of RV Merian (MSM 16-1) for excellent collaboration
during field work. T. Leipe, R. Endler, and H. Arz (all IOW) are acknowledged for
Chapter 6 – Record of water column stratification in Holocene Baltic Sea sediments
138
helpful discussion. Two anonymous reviewers are thanked for their helpful
comments. We thank J. Dyckmans (Centre for Stable Isotope Research and Analysis,
University of Göttingen) for help with stable nitrogen isotope analysis. C. Conradt
(University of Göttingen) is kindly acknowledged for laboratory assistance. The
study was supported by the Deutsche Forschungsgemeinschaft (DFG) through
projects BL 971/1-3 and BL 971/3-1.
This Open Access Publication is funded by the University of Göttingen.
References
Andrén, E., Andrén, T., Sohlenius, G., 2000a. The Holocene history of the
southwestern Baltic Sea as reflected in a sediment core from the Bornholm Basin.
Boreas 29, 233–250.
Andrén, E., Andrén, T., Kunzendorf, H., 200b. Holocene history of the Baltic Sea as a
background for assessing records of human impact in the sediments of the Gotland
Basin. The Holocene 10, 687–702.
Andrén, T., Björck, S., Andrén, E., Conley, D., Zillén, L., Anjar, J., 2011. Late Quaternary
climate variations reflected in Baltic Sea sediments In: Harff, J., Björck, S., Hoth, P.
(Eds). The Baltic Sea Basin. Springer, 449 pp., 75–97.
Bednarczyk, A., Carillo Hernandez, T., Schaeffer, P., Adam, P., Talbot, H. M.,
Farrimond, P., Riboulleau, A., Largeau, C., Derenne, S., Rohmer, M., Albrecht, P., 2005.
32,35- Anhydrobacteriohopanetetrol: an unusual bacteriohopanepolyol widespread
in recent and past environments. Organic Geochemistry 36, 673–677.
Bennike, O., Jensen, J. B., Lemke, W., Kuijpers, A., Lomholt, S., 2004. Late- and
postglacial history of the Great Belt, Denmark, Boreas, 33, 18–33, 2004.
Berndmeyer, C., Thiel, V., Schmale, O., Blumenberg, M., 2013. Biomarkers for aerobic
methanotrophy in the water column of the stratified Gotland Deep (Baltic Sea).
Organic Geochemistry 55, 103–111, 2013.
Chapter 6 – Record of water column stratification in Holocene Baltic Sea sediments
139
Bianchi, T. S., Engelhaupt, E., Westman, P., Andr´en, T., Rolff, C., Ragnar, E., 2000.
Cyanobacterial blooms in the Baltic Sea: Natural or human-induced? Limnology
Oceanography 45, 716–726.
Blumenberg, M., Krüger, M., Nauhaus, K., Talbot, H. M., Oppermann, B., Seifert, R.,
Pape, T., Michaelis, W., 2006. Biosynthesis of hopanoids by sulfate-reducing bacteria
(genus Desulfovibrio), Environmental Microbiology 8, 1220–1227.
Blumenberg, M., Seifert, R., Kasten, S., Bahlmann, E., Michaelis, W., 2009. Euphotic
zone bacterioplankton sources major sedimentary bacteriohopanepolyols in the
Holocene Black Sea. Geochimica et Cosmochimica Acta, 73, 750–766.
Blumenberg, M., Mollenhauer, G., Zabel, M., Reimer, A., Thiel, V., 2010. Decoupling of
bio- and geohopanoids in sediments of the Benguela Upwelling System (BUS).
Organic Geochemistry 41, 1119–1129.
Blumenberg, M., Hoppert, M., Krüger, M., Dreier, A., Thiel, V., 2012. Novel findings on
hopanoid occurrences among sulfate reducing bacteria: is there a direct link to
nitrogen fixation? Organic Geochemistry 49, 1–5.
Blumenberg, M., Arp, G., Reitner, J., Schneider, D., Daniel, R., Thiel, V., 2013.
Bacteriohopanepolyols in a stratified cyanobacterial mat from Kiritimati (Christmas
Island, Kiribati), Organic Geochemistry 55, 55–62.
Boesen, C. and Postma, D., 1988. Pyrite formation in anoxic environments of the
Baltic. American Journal of Science 288, 575–603.
Borgendahl, J. and Westman, P., 2007. Cyanobacteria as a trigger for increased
primary productivity during sapropel formation in the Baltic Sea – a study of the
Ancylus/Littorina transition. Journal of Paleolimnology 38, 1–12.
Bray, E. E. and Evans, E. D., 1961. Distribution of n-paraffins as a clue to recognition
of source beds. Geochimica et Cosmochimica Acta 22, 2–15.
Brenner, W.W., 2001. Organic-walled microfossils from the central Baltic Sea,
indicators of environmental change and base for ecostratigraphic correlation. Baltica
14, 40–51.

Chapter 6 – Record of water column stratification in Holocene Baltic Sea sediments
140
Brenner, W., 2005. Holocene environmental history of the Gotland Basin (Baltic Sea)
– a micropalaeontological model. Palaeogeography Palaeoclimatology Palaeoecology
220, 227–241.
Cooke, M. P., Talbot, H. M., Wagner, T., 2008. Tracking soil organic carbon transport
to continental margin sediments using soil-specific hopanoid biomarkers: a case
study from the Congo fan (ODP site 1075). Organic Geochemistry 39, 965–971.
Coolen, M. J. L., Talbot, H. M., Abbas, B. A., Ward, C., Schouten, S., Volkman, J. K.,
Sinninghe Damsté, J. S., 2008. Sources for sedimentary bacteriohopanepolyols as
revealed by 16S rDNA stratigraphy. Environmental Microbiology 10, 1783–1803.
Eglinton, G., Hamilton, R. J., Raphael, R. A., Gonzales, A. G., 1962. Hydrocarbon
constituents of the wax coatings of plant leaves: A taxonomic study. Nature 193,
739–742.
Freeman, K. H., Hayes, J. M., Trendel, J.-M., Albrecht, P., 1990. Evidence from carbon
isotope measurements for diverse origins of sedimentary hydrocarbons. Nature 343,
254–256.
Haug, G. H., Pedersen, T. F., Sigman, D. M., Calvert, S. E., Nielsen, B., Peterson, L. C.,
1998. Glacial/interglacial variations in production and nitrogen fixation in the
Cariaco Basin during the last 580 kyr. Paleoceanography 13, 427.
Hayes, J. M., 1993. Factors controlling 13C contents of sedimentary organic
compounds: Principles and evidence. Marine Geology 113, 115–125.
Herrmann, D., Bisseret, P., Connan, J., Rohmer, M., 1996. Relative configurations of
carbapseudopentose moieties of hopanoids of the bacterium Zymomonas mobilis and
the cyanobacterium “Anacystis montana”. Tetrahedron Letters 37, 1791–1794.
Kabel, K., Moros, M., Porsche, C., Neumann, T., Adolphi, F., Andersen, T.J., Siegel, H.,
Gerth, M., Leipe, T., Jansen, E., Sinninghe Damsté, J.S., 2012. Impact of climate change
on the Baltic Sea ecosystem over the past 1000 years. Nature Climate Change 2, 871–
847.
Chapter 6 – Record of water column stratification in Holocene Baltic Sea sediments
141
Karl, D., Michaels, A., Bergman, B., Capone, D., Carpenter, E., Letelier, R., Lipschultz, F.,
Paerl, H., Sigman, D., Stal, L., 2002. Dinitrogen fixation in the world’s oceans.
Biogeochemistry 57/58, 47–98.
Kunzendorf, H., Voss, M., Brenner, W., Andrén, T., Vallius, H., 2001. Molybdenum in
sediments of the central Baltic Sea as an indicator for algal blooms. Baltica 14, 123–
130.
Kuypers, M.M.M., van Breugel, Y., Schouten, S., Erba, E., Sinninghe Damsté, J.S., 2004.
N2-fixing cyanobacteria supplied nutrient N for Cretaceous oceanic anoxic events.
Geology 32, 853–856.
Labrenz, M., Jost, G., Jürgens, K., 2007. Distribution and abundant prokaryotic
organisms in the water column of the central Baltic Sea with an oxic-anoxic
interface. Aquatic Microbial Ecology 46, 177–190.
Leipe, T., Tauber, F., Vallius, H., Virtasalo, J., Uścinowicz, S., Kowalski, N., Hille, S.,
Lindgren, S., Myllyvirta, T., 2010. Particulate organic carbon (POC) in surface
sediments of the Baltic Sea. Geo-Marine Letters 31, 175–188.
Lougheed, B.C., Snowball, I., Moros, M., Kabel, K., Muschelera, R., Virtasalo, J.J.,
Wacker, L., 2012. Using an independent geochronology based on palaeomagnetic
secular variation (PSV) and atmospheric Pb deposition to date Baltic Sea sediments
and infer 14C reservoir age. Quaternary Science Reviews 42, 43–58.
Moros, M., Lemke, W., Kuijpers, A., Endler, R., Jensen, J.B., Bennike, O., Gingele, F.,
2002. Regressions and transgressions of the Baltic basin reflected by a new high-
resolution deglacial and postglacial lithostratigraphy for Arkona Basin sediments
(western Baltic Sea). Boreas 31 151–162.
Nausch, M., Nausch, G., Lass, H. U., Mohrholz, V., Nagel, K., Siegel, H., Wasmund, N.,
2009. Phosphorus input by upwelling in the eastern Gotland Basin (Baltic Sea) in
summer and its effects on filamentous cyanobacteria. Estuarine, Coastal and Shelf
Sciences 83, 434–442, 2009.
Chapter 6 – Record of water column stratification in Holocene Baltic Sea sediments
142
Neunlist, S., and Rohmer, M., 1985. Novel hopanoids from the methylotrophic
bacteria Methylococcus capsulatus and Methylomonas methanica. Biochemical
Journal 231, 635-639.
Nytoft, H. P. and Larsen, B., 2001. Triterpenoids and other organic compounds as
markers of depositional conditions in the Baltic Sea deep basins during the
Holocene. Baltica 14, 95–107.
Poutanen, E.-L. and Nikkila, K., 2001. Carotenoid pigments as tracers of
cyanobacterial blooms in recent and postglacial sediments of the Baltic Sea. Ambio
30, 179–183.
Redfield, A. C., Ketchum, B. H., Richards, F. A., 1963. The influence of organisms on
the composition of sea-water. In: Hill, N. (Ed.). The Sea 2. Interscience, New York,
26–77.
Reissmann, J. H., Burchard, H., Feistel, R., Hagen, E., Lass, H. U., Mohrholz, V., Nausch,
G., Umlauf, L., Wieczorek, G., 2009. Vertical mixing in the Baltic Sea and
consequences for eutrophication – A review. Progress in Oceanography 82, 47–80.
Rößler, D., Moros, M., Lemke, W., 2011. The Littorina transgression in the
southwestern Baltic Sea: new insights based on proxy methods and radiocarbon
dating of sediment cores. Boreas 40, 231–241.
Sachs, J.P. and Repeta, D.J., 1999. Oligotrophy and Nitrogen Fixation During Eastern
Mediterranean Sapropel Events. Science 286, 2485–2488.
Sáenz, J. P., Wakeham, S. G., Eglinton, T. I., Summons, R. E., 2011. New constraints on
the provenance of hopanoids in the marine geologic record: Bacteriohopanepolyols
in marine suboxic and anoxic environments. Organic Geochemistry 42, 1351–1362.
Schaeffer, P., Schmitt, G., Adam, P., Rohmer, M., 2008. Acidcatalyzed formation of
32,35-anhydrobacteriohopanetetrol from bacteriohopanetetrol, Organic
Geochemistry 39, 1479–1482.

Chapter 6 – Record of water column stratification in Holocene Baltic Sea sediments
143
Schaeffer, P., Schmitt, G., Adam, P., Rohmer, M., 2010. Abiotic formation of 32,35-
anhydrobacteriohopanetetrol: A geomimetic approach. Organic Geochemistry 41,
1005–1008.
Schmale, O., Schneider von Deimling, J., Gülzow, W., Nausch, G., Waniek, J. J., Rehder,
G., 2010. Distribution of methane in the water column of the Baltic Sea. Geophysical
Research Letters 37, L12604.
Schmale, O., Blumenberg, M., Kießlich, K., Jakobs, G., Berndmeyer, C., Labrenz, M.,
Thiel, V., Rehder, G., 2012. Aerobic methanotrophy within the pelagic redox-zone of
the Gotland Deep (central Baltic Sea). Biogeosciences 9, 4969–4977.
Sohlenius, G., Sternbeck, J., Andrén, E., Westman, P., 1996. Holocene history of the
Baltic Sea as recorded in a sediment core from the Gotland Deep. Marine Geology
134, 183–201.
Sörensson, F. and Sahlsten, E., 1987. Nitrogen dynamics of a cyanobacteria bloom in
the Baltic Sea: new versus regenerated production. Marine Ecology Progress Series
37, 277–284.
Struck, U., Emeis, K. C., Voss, M., Christiansen, C., Kunzendorf, H., 2000. Records of
southern and central Baltic Sea eutrophication in δ13C and δ15N of sedimentary
organic matter. Marine Geology 164, 157–171.
Struck, U., Pollehne, F., Bauerfeind, E., v. Bodungen, B., 2004. Sources of nitrogen for
the vertical particle flux in the Gotland Sea (Baltic Proper) – results from sediment
trap studies. Journal of Marine Systems 45, 91–101.
Talbot, H. M. and Farrimond, P., 2007. Bacterial populations recorded in diverse
sedimentary biohopanoid distributions Organic Geochemistry 38, 1212–1225.
Talbot, M., Watson, D.F., Murrell, J.C., Carter, J.F., Farrimond, P., 2001. Analysis of
intact bacteriohopanepolyols from methanotrophic bacteria by reversed-phase high-
performance liquid chromatography-atmopheric pressure chemical ionisation mass
spectrometry. Journal of Chromatography A, 921, 175–185.

Chapter 6 – Record of water column stratification in Holocene Baltic Sea sediments
144
Taylor, K. A. and Harvey, R. H., 2001. Bacterial hopanoids as tracers of organic
carbon sources and processing across the western Arctic continental shelf. Organic
Geochemistry 42, 487–497.
Voss, M., 2005. Nitrogen cycle of the Baltic Sea from an isotopic perspective. Global
Biogeochemical Cycles 19, GB3001.
Voss, M., Kowalewska, G., Brenner, W., 2001. Microfossil and biogeochemical
indicators of environmental changes in the Gotland Deep during the last 10 000
years. Baltica 14, 131–140.
Wakeham, S. G., Amann, R., Freeman, K. H., Hopmans, E. C., Joergensen, B. B., Putnam,
I. F., Schouten, S., Sinninghe Damsté, J. S., Talbot, H. M., Woebken, D., 2000. Microbial
eoclogy of the stratified water column of the Black Sea as revealed by a
comprehensive biomarker study. Organic Geochemistry 38, 2070–2097.
Wasmund, N., Nausch, G., Voss, M., 2012. Upwelling events may cause cyanobacteria
blooms in the Baltic Sea. Journal of Marine Systems 90, 67–76.
Withers, N., 1983. Dinoflagellates sterols. In: Scheuer, P. J. (Ed.). Marine Natural
Products. Chemical and Biological Perspectives, Academic Press, New York, 87–130.
Yu, S.-Y. and Berglund, B. E., 2007. A dinoflagellate cyst record of Holocene climate
and hydrological changes along the southeastern Swedish Baltic coast, Quaternary
Research 67, 215–224.
Zillén, L. and Conley, D. J., 2010. Hypoxia and cyanobacteria blooms – are they really
natural features of the late Holocene history of the Baltic Sea?. Biogeosciences 7,
2567–2580.

Chapter 7 – Summary and conclusions
145
7
Summary and conclusions
The results presented in this thesis are parts of the multidisciplinary project
“Aerobic and anaerobic methane consumption in the central Baltic Sea water
column” with a focus on sources, transport, distribution, and conservation of
biomarkers. The aim of this thesis was to apply water column biomarker data in the
identification of microbial communities and microorganisms involved in
methanotrophy, and their occurrences and distribution in the water column.
Sediment samples were analyzed to assess the source and fate of biomarkers,
particularly BHPs, in the sediment.
Initially, three common methods for the extraction of BHPs were tested. This study
showed that the two phase solvent Bligh & Dyer extraction enabled a higher
recovery of BHPs with an amino group, such as aminotriol, aminotetrol,
aminopentol, or BHT cyclitol ether. Besides, the LC-MS separation and the signal of
BHT II were improved because of less non-LC amenable material in the extract. The
single phase solvent ultrasound and microwave extraction gave very similar results
for individual concentrations. All three methods had an almost equal recovery of
total BHPs supporting their general applicability for BHP extraction.
In the second study, water column samples were taken from the Landsort Deep, the
deepest part of the Baltic Sea. Samples collected in summer 2011 covered the whole
water column and were analyzed for biomarkers representing different members of
the microbial community. An oxic zone community of cyanobacteria, algae,
dinoflagellates and ciliates was identified but was restricted to the surface layer. In
contrast, the deeper but still oxic cold winter water layer showed only low
abundances of biomarkers. The suboxic zone biomarkers reflected abundant and
diverse prokaryotic and eukaryotic microorganisms and the related biogeochemical
processes such as aerobic methanotrophy, heterotrophy, sulfate reduction and the
oxidation of H2S. The anoxic zone was dominated by sulfate reducing bacteria that
were assumed to be the in situ source of BHPs in this water depth and, most likely,
methanogenic archaea.
Chapter 7 – Summary and conclusions
146
The third study described the first results of the “Aerobic and anaerobic methane
consumption in the central Baltic Sea water column” project. A multidisciplinary
methods approach in the Gotland Deep in summer 2008 combined biomarker
analysis with gas chemistry and molecular biology. 13C methane values
substantiated the microbial origin of the methane in the anoxic water column.
Enriched 13C methane values and a strong decrease in methane concentrations
indicated microbial consumption in the suboxic zone and first methane consumption
rates could be calculated. DGGE analysis and the presence of indicative biomarkers
with depleted δ13C values identified type I methanotrophic bacteria to be
responsible for the effective aerobic oxidation of methane.
The following study also used the Gotland deep dataset collected in summer 2008.
The analysis of Biomarkers was extended to cover the oxic and suboxic water
column and surface sediments as well. Type I Methanotrophic bacteria were found
to be concentrated in the central suboxic zone but biomarker concentrations
suggested a relatively low total contribution to the microbial community. No
evidence for type II methanotrophs was found. Depleted δ13C values of relevant
lipids additionally proved the process of aerobic methanotrophy. A BHT isomer that
was suggested to be a marker for oxic-anoxic interfaces in other stratified systems
was identified in the Gotland Deep water column. Its occurrence exclusively in
suboxic to anoxic samples supported its relation to stratified systems. The Gotland
Deep surface sediments reflected the BHP composition of the suboxic zone,
including the BHT isomer. Therefore, BHPs were assumed to be a possible tool for
the reconstruction of past stratified environments.
Since the BHP signal of the surface sediments mirrored the modern stratified water
column, research was expanded to include a Gotland Deep sediment core comprising
all stages of the Holocene Baltic Sea development. The analysis of sedimentary Corg
revealed low concentrations during the Baltic Ice Lake and Ancylus Lake stages, but
a strong increase with the onset of the brackish-marine Littorina phase. The
Medieval Climate Anomaly (MCA) and the Modern Warm Phase (MoWP) were
marked by peaks in Corg concentrations. BHP concentrations reflected the Corg trend.
During Baltic Ice Lake and Ancylus Lake stages, BHP concentrations were low, but
increased with the Littorina Transgression and during MCA and MoWP.
Furthermore, the BHT isomer indicative for water column stratification was absent
Chapter 7 – Summary and conclusions
147
in the early Baltic Sea stages and only occurred with onset of stratification. BHPs,
thus, were successfully used to reconstruct the onset of the water column
stratification in the Baltic Sea.
The studies presented in this thesis show that biomarkers are an important tool to
gain information on the geobiology of the stratified water column of the central
Baltic Sea. It was demonstrated that stratified water columns comprise various
ecological niches for microorganisms that were able to adapt to these special
conditions. The analysis of biomarkers in the Baltic Sea helped to identify different
microbial communities, the related biogeochemical processes, and the vertical
restriction of these ecological niches in the present and also the past environments.
However, the situation of the central Baltic Sea with lateral intrusions and larger
inflows potentially oxidizing the whole water column has been highly dynamic since
the onset of the stratification. Microorganisms were forced to not only adapt to the
stable stratification but also to its disturbances. Consequently, future geobiological
studies of these continuously changing interactions of geosphere and biosphere will
be of great interest.

148

Curriculum Vitae
149
Curriculum Vitae Personal Information
Name: Christine Berndmeyer
Date and Place of Birth: 18th September 1984, Cloppenburg, Germany
University
2011 - present Graduate student (PhD), Georg-August-University Göttingen, Germany
Topic: “Aerobic and anaerobic methane consumption in the water column of
the central Baltic Sea”. Supervisors: Prof. Dr. Volker Thiel, Dr. Martin
Blumenberg
2007 – 2011
Graduate student (MSc), Marine Geosciences, University of Bremen,
Germany
Master’s thesis: “Aspects of bacterial activity on the formation of
phosphorites in the Miocene Monterey Formation, California”. Supervisors:
Prof. Dr. Jörn Peckmann, Dr. Timothy Ferdelman
2008 – 2009 Graduate student scholarship (10 months), Ocean University of Qingdao,
China
Intensified studies of marine geology, marine biology and oceanography
2004 – 2007 Undergraduate student (BSc), University of Bremen, Germany
Bachelor’s thesis: “Terrigenious sediment input into the Eastern Tasman
Sea, 0-120ky” (written in German).
Supervisors: Prof. Dr. Ralf Tiedemann, Dr. Jürgen Pätzold
School
1997 - 2004
Gymnasium “Unserer Lieben Frau”, Cloppenburg
Abitur (University entrance qualification)
1995 – 1997 Orientierungsstufe “Don Bosco”, Cloppenburg
1990 - 1995 Grundschule “Wallschule”, Cloppenburg


