
1
GHGEmissionsAssociatedwithTwoProposedNaturalGasTransmissionLinesinVirginiai
SummaryofGHGEmissionEstimates
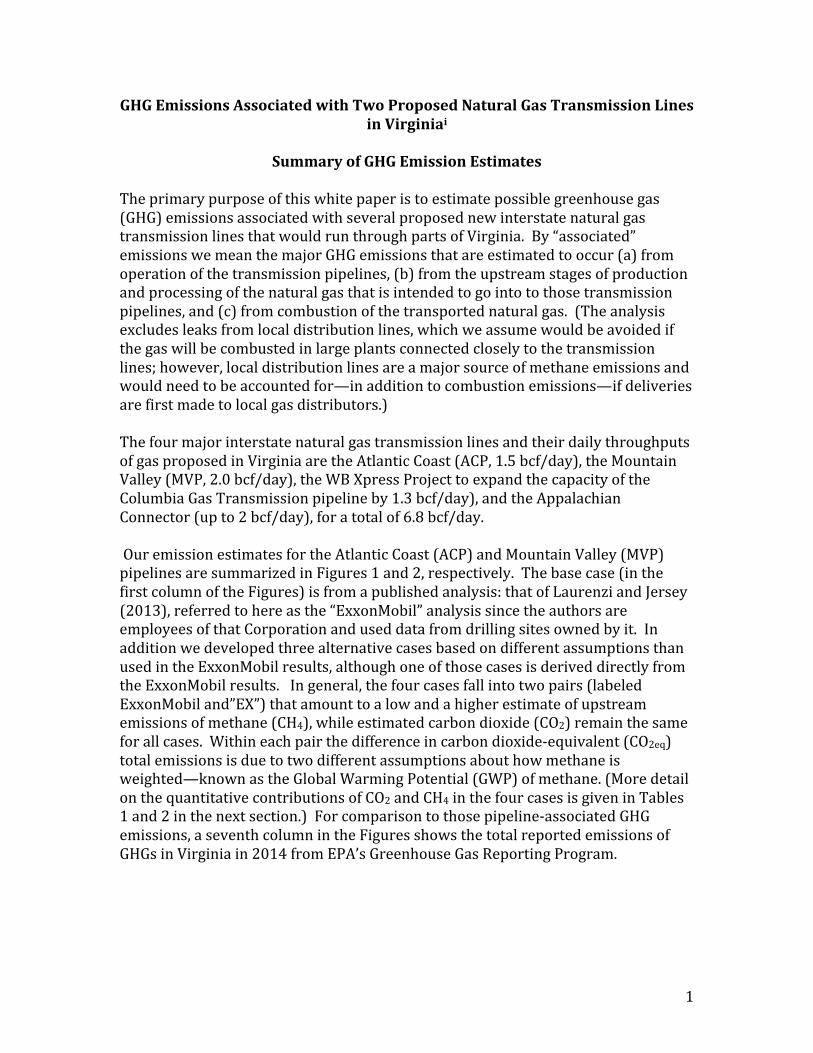
Theprimarypurposeofthiswhitepaperistoestimatepossiblegreenhousegas(GHG)emissionsassociatedwithseveralproposednewinterstatenaturalgastransmissionlinesthatwouldrunthroughpartsofVirginia.By“associated”emissionswemeanthemajorGHGemissionsthatareestimatedtooccur(a)fromoperationofthetransmissionpipelines,(b)fromtheupstreamstagesofproductionandprocessingofthenaturalgasthatisintendedtogointotothosetransmissionpipelines,and(c)fromcombustionofthetransportednaturalgas.(Theanalysisexcludesleaksfromlocaldistributionlines,whichweassumewouldbeavoidedifthegaswillbecombustedinlargeplantsconnectedcloselytothetransmissionlines;however,localdistributionlinesareamajorsourceofmethaneemissionsandwouldneedtobeaccountedfor—inadditiontocombustionemissions—ifdeliveriesarefirstmadetolocalgasdistributors.)ThefourmajorinterstatenaturalgastransmissionlinesandtheirdailythroughputsofgasproposedinVirginiaaretheAtlanticCoast(ACP,1.5bcf/day),theMountainValley(MVP,2.0bcf/day),theWBXpressProjecttoexpandthecapacityoftheColumbiaGasTransmissionpipelineby1.3bcf/day),andtheAppalachianConnector(upto2bcf/day),foratotalof6.8bcf/day.OuremissionestimatesfortheAtlanticCoast(ACP)andMountainValley(MVP)pipelinesaresummarizedinFigures1and2,respectively.Thebasecase(inthefirstcolumnoftheFigures)isfromapublishedanalysis:thatofLaurenziandJersey(2013),referredtohereasthe“ExxonMobil”analysissincetheauthorsareemployeesofthatCorporationanduseddatafromdrillingsitesownedbyit.InadditionwedevelopedthreealternativecasesbasedondifferentassumptionsthanusedintheExxonMobilresults,althoughoneofthosecasesisderiveddirectlyfromtheExxonMobilresults.Ingeneral,thefourcasesfallintotwopairs(labeledExxonMobiland”EX”)thatamounttoalowandahigherestimateofupstreamemissionsofmethane(CH4),whileestimatedcarbondioxide(CO2)remainthesameforallcases.Withineachpairthedifferenceincarbondioxide-equivalent(CO2eq)totalemissionsisduetotwodifferentassumptionsabouthowmethaneisweighted—knownastheGlobalWarmingPotential(GWP)ofmethane.(MoredetailonthequantitativecontributionsofCO2andCH4inthefourcasesisgiveninTables1and2inthenextsection.)Forcomparisontothosepipeline-associatedGHGemissions,aseventhcolumnintheFiguresshowsthetotalreportedemissionsofGHGsinVirginiain2014fromEPA’sGreenhouseGasReportingProgram.

2
0
10
20
30
40
50
60
70
80
90
100
ExxonMobilGWP25 ExxonMobilGWP84 3XGWP25 3XGWP84 VAGHGRP2014
Figure2.GHGEmissionsfromMVPforFourCasesComparedwithEPAGHGRP2014VAStaBonarySources(MMTCO2eq/year)
Sta?onarySources
Combus?onofDeliveredGas
Transmission&Storage
Produc?on&Processing

TheissueofwhichGWPtochoosecanbebypassedbycomputingthetime-dependentradiativeforcingdueseparatelytoCO2andCH4.Figure3showstheresultsofcalculationsofradiativeforcingcomputedbyasimplemodel.However,insteadofshowingradiativeforcinginconventionalunitsofwatts/meter2weshowthetotalthermalheatingeffectontheplanetofGHGemissionsfromallfourpipelineprojects,consistingoftheradiativeforcingmultipliedbythetotalsurfaceareaoftheEarthplus,forcomparison,themuchsmallergenerationofheatgeneratedbycombustionofthenaturalgasdeliveredbythepipelines.NotethatthethermaleffectofCO2persistslongafteroperationscease(weshowitfor300years),andwilllastforcenturiesafterthat.ThebasisforthisgraphisexplainedinmoredetailintheDiscussionsectionbelow.
Amoredetailedexplanationoftheresultsisgiveninthenextsection.Asubsequentsection,DiscussionofAssumptionsandResults,describestheunderlyingbasisandcomparesourresultstootherstudiesfromtherecentliterature.Followingthatsectionwepresentsomerecommendationsbasedontheresultsandlessonslearnedinanalyzingtheliteratureonemissionsfromthenaturalgasfuelcycle.
DetailedDescriptionofResultsTheExxonMobilanalysisproducedresultsbasedonemissionvaluesperunitoutputofahypotheticalnaturalgaselectricpowerplant(KgCO2eq/MWh),andwescaledtheirGHGemissionsvaluestocorrespondtothepotentialmaximumnaturalgasthroughputoftherespectivepipelines(1.5Bcf/dayforACPand2.0Bcf/dayfortheMVP).Wechosethis

4
studybecauseitwasapartialLCAanalysis(oftheproductionatthewellheadstage),provideddetailedresultsforprocessstepsseparatelyforcarbondioxide(CO2),methane(CH4)andnitrousoxide(N2O)emissions,andpertainedtoconditionsspecifictonaturalgasfromhydraulicfracturingproductionintheMarcellusshaleregion,whichisidentifiedasthesourceforthetwopipelinesinquestion,includingsomemeasurementsmadeontheCorporation’sownwelloperations.However,whiletheseExxonMobilestimatesareusefulasastartingpoint,theymaynotberepresentativeofallfrackingoperationsintheMarcellusorothershaleregions.Infact,otherestimatesofoverallemissionsfromthatregionsuggestmuchhigherfugitiveemissionsofmethane,anditisclearthatsomeoperatorsareresponsibleformuchmoreemissionsperunitofproductionthanothers.Forthatreasonwealsopresentanalternativesetofestimatesformethaneemissionsfromtheoverallproductionandprocessingstage,asdiscussedbelow.Notethatneitheroftheseestimatesappearstoconsidertheproblemofpost-productionleaks,which,asdocumentedbySchlumberger,mayemergemanyyearsafterawellhasbeencappedandtakenoutofoperations.Figure1andTable1showresultsapplicabletotheACPpipeline,whileFigure2andTable2showsimilarresultsfortheMVPpipeline.Forsimplicity,weaggregatedtheoriginalauthors’moredetailedprocesslevelresultsintothreemajorfuelcyclestages:1ProductionandProcessing(i.e.,operationsupstreamofthetransmissionline),TransmissionandStorage,andCombustionofthedeliveredpipelinegas(assumingnolocaldistribution).(CO2eqemissionsofN2OareneglectedinTables1&2asrelativelysmallcomparedtotheGHGimpactsofmethaneandCO2emissions.)WebelievethatassessingGHGemissionsfromallthreemajorfuelcyclestages,notjustthetransmissionpipelinestage,isimportantbecausethesenewpipelinesareintendedtocollecttheproducedgasesandtransportthemtoneworexpandedmarketsinVirginiaandNorthCarolina,andpossiblyeventoforeignexportterminals.Hence,thepipelineswilltendtogenerateoratleastsupportadditionalusesofnaturalgasthatarguablywillresultingreatergasproductionandcombustionandtheirassociatedemissions.Someoftheusesmayincludenewindustrialplantsownedbyforeigncompaniesthatareattractedtotheregionbytheavailabilityofcheapernaturalgassuppliesthanavailableabroad.Pipelineproponentshavebeentoutingsucheconomicdevelopmentasabenefitoftheirpipelines.Thetwoprincipleissuesinmakingmethaneleakageestimatesare:1)whatistheactualleakagerateofmethanefromvariousstagesofthenaturalgasfuelcycle?and2)whatistheappropriatechoiceofglobalwarmingpotential(GWP)(orothermethod)toapplywhencomparingemissionsofCO2tootherGHGs,especiallytomethane?Thereason1Thefuelcycleapproachmeansanalysisofoperationalimpactsofallrelevantstagesfromextractionthroughuseanddispositionofwastes;alifecycleanalysis(LCA)approachextendstheanalysistoconsiderationoftheindirectimpactsofmanufacturingandtransportingtheequipmentandtherawmaterialsthatgointothestagesandisevaluatedovertheestimatedlifetimeofthecapitalfacilities.

5
therearefourcolumnsinthetwotablesandfirsttwofiguresisbecausewemadealternativechoicesforbothofthoseissues.InTables1and2thefirstcolumnisfromthegenericestimatesgivenbyLaurenziandJersey(exceptforthescalinguptoeachpipeline).Notethatthescale-upassumesthepipelinesoperateatfullcapacity24/7/365becausewehavenoestimatesfromtheproponentsabouttheirplannedoperatingschedule.ThesecondcolumnadjuststhemethaneCO2eqemissionvalues(thefirstcolumnwasbasedonEPA’s100-yearGWPassumptionof25)tothe20-yearGWPof84fromIPCCAR5whensummingtoobtaintotalCO2eqemissionsfromeachstage.Thethirdandfourthcolumns(3X)increasethemethaneemissionsfromProductionandProcessing(butnotthetransmissionorcombustionstageemissions)bymultiplyingColumns1and2,respectively,byafactorofthreetoreflectresultstypicaloftop-downhighermethaneemissionmeasurementsintheMarcellusandothershalebasins.ThereasonforthischoiceisexplainedbelowintheDiscussionsection.ThosetwoadjustmentsincreasetheupstreamproductionandprocessingemissionsinColumn4byafactorof4.9andthetotalsystememissionbyafactorof1.7relativetocolumn1.(NotethattheCH4emissionvaluesshownintheTablesareinmillionmetrictonnes(MMT)ofmethane,notCO2eq.)TheCO2eqvaluesfromthefourcolumnsinthetalesarealsoshowngraphicallyinthebarchartsofFigures1and2.Forcomparison,Virginia’stwolargestsourcesofCO2eqGHGemissionsin2014weretheChesterfield(7.22MMT)andClover(5.67MMT)coal-firedpowerplants.TheColumn1totalinTable1fromtheACPpipeline(40.7)iscomparabletothetotalcontributionfromthe177GHGsourcesinVirginia(49.4MMTCO2eq)fromEPA’sGreenhouseGasReportingProgram(GHGRP)in2014,whilethetotalinTable2fromtheMVPpipelineconsiderablyexceedsit.2(However,onlypartoftheemissionsinTables1and2wouldoccurinVirginia.)TheseVirginiaGHGRPvaluesalsoarecomparedagainstthepipelinevaluesinFigures1and2.ObviouslythecomparabletotalsforthehighermethaneemissionsassumedinColumns3and4ofthetwotableswouldbeevenhigher,butonlyColumns1and3shouldbecomparedwithEPA’sGHGvaluessincethelatteralsoassumeaGWPof25.EmissionsfromtheothertwoproposedpipelineswouldnearlydoublethetotalemissionsfromtheACPandMVPforatotalof185MMTCO2eqataGWPof25inthebasecase,theExxonMobilrates,or3.7timestheEPAGHGRPtotalforVirginia.
2ThisisbasedonEPA’s“Flightdatabase”fromtheirGreenhouseGasReportingsystem,butthatdatabaseexcludesGHGemissionsfromonshoreoilandgasproductionatthestatelevel,henceitdoesnotincludetheemissionsfromcoalbedmethaneextractionoperationsinVirginia,forexample.Also,thelistof177largesourcesincludessomethatreportedzeroemissionsin2014comparedwithsubstantialemissionsinprioryearsandEPAgenerallyassumestheGHGRPreportedemissionsunderestimateactualtotalssomewhat.Onlylargesourcesarerequiredtoreport,andthedatabasedoesnotincludetransportationandmanysmallsources

6
TABLE 1. Generic GHG Emission Estimates for the ACP Pipeline GHG Emissions by gas and fuel cycle stage
ExxonMobil* (w/CH4 GWP=25 over 100 years)
Adjusted ExxonMobil* (w/CH4 GWP=84 over 20 years)
Top-Down Higher CH4 Leakage Estimate** (w/CH4 GWP=25)
Top-Down Higher CH4 Leakage Estimate** (w/CH4 GWP=84)
Production & Processing CO2 (MMT CO2/year) 3.60 3.60 3.60 3.60 CH4 Losses (MMT CH4/year) 0.107 0.107 0.321 0.321 Total CO2eq Emissions (MMT/year) 6.3 12.6 11.6 30.6 Transmission & Storage CO2 (MMT CO2/year) 1.27 1.27 1.27 1.27 CH4 Losses (MMT CH4/year) 0.058 0.058 0.058 0.058 Total CO2eq Emissions (MMT/year) 2.7 6.1 2.7 6.1 Combustion of Delivered Gas CO2 (MMT/year) 31.7 31.7 31.7 31.7 Grand Total GHG Emissions (MMT CO2eq /year)
40.7 50.4 46.0 68.4
* ExxonMobil means the ANALYSIS analysis of Laurenzi & Jersey (2013); note that this was a generic analysis, not specific to the ACP pipeline. The values here represent a conversion from their numbers in terms of emissions/MWh into emissions/SCF, which are multiplied times the ACP capacity of 1.5 Bcf/day to get the MMT/year values shown here. These values assume full-time operation 24/7/365. ** Assumes 3 X ExxonMobil CH4 Production & Processing emissions (see discussion)

7
TABLE 2. Generic GHG Emission Estimates for the MVP Pipeline
GHG Emissions by gas and fuel cycle stage
Exxon-Mobil* (w/CH4 GWP=25 over 100 years)
Adjusted Exxon-Mobil* (w/CH4 GWP=84 over years)
Top-Down Higher CH4 Leakage Estimate** (w/CH4 GWP=25)
Top-Down Higher CH4 Leakage Estimate** (w/CH4 GWP=84)
Production & Processing CO2 (MMT CO2/year) 4.8 4.8 4.8 4.8 CH4 Losses (MMT CH4/year) 0.143 0.143 0.428 0.428 Total CO2eq Emissions (MMT/year) 8.4 16.8 15.5 40.8 Transmission & Storage CO2 (MMT CO2/year) 1.7 1.7 1.7 1.7 CH4 Losses (MMT CH4/year) 0.077 0.077 0.077 0.077 Total CO2eq Emissions (MMT/year) 3.6 8.1 3.6 8.1 Combustion of Delivered Gas CO2 (MMT/year) 42.3 42.3 42.3 42.3
Grand Total GHG Emissions (MMT CO2eq /year)
54.3 67.2 61.3 91.2
* ExxonMobil means the ANALYSIS analysis of Laurenzi & Jersey (2013); note that this was a generic analysis, not specific to the MVP pipeline. The values here represent a conversion from their numbers in terms of emissions/MWh into emissions/SCF, which are multiplied times the MVP capacity of 2.0 Bcf/day to get the MMT/year values shown here. These values assume full-time operation 24/7/365. ** Assumes 3 X ExxonMobil CH4 Production & Processing emissions (see discussion) _____________________________________________________________________________________________
DiscussionofAssumptionsandResultsThetwoprincipleissuesinmakingtheseestimatesare:1)whatistheactualleakagerateofmethanefromvariousstagesofthenaturalgasfuelcycle,and2)whatistheappropriatechoiceofglobalwarmingpotential(GWP)(orothermethod)toapplywhencomparingemissionsofCO2tootherGHGs,especiallytomethane?Bothofthosequestionshavebeenissuesforseveraldecades.Neitheriscompletelysettledtoday.Wehaveapproacheditinourestimatesbychoosingalowerandhighervalueforeachfactor,andalsoproducedaseparateanalysisthatobviatestheGWPissue.

8
Theissueofleakageratesremainsunresolvedandaverycontroversialtopic.Thewaychosenheretorepresentarangeofopiniononleakageratesfromtheupstreamproductionandprocessingstagesistoshowalowerestimate(theso-calledExxonMobilvalues,whicharesimilartoEPA’semissionfactors)vs.ahigherestimate(the“3X”or”Top-DownHigher”valuesinColumns3&4)asexplainedfurtherbelow.ChoiceofGWP.TheGWPissueisnowquitewellunderstoodscientificallybutremainscontroversialinthepolicyandpoliticalarenas.TheissuewithaGWPselectionisthattheUNadopteda100-yearGWPaspartoftheKyotoProtocol.EPAalsoadopteditbecauseoftheneedtohaveaspecificwaytoweightvariousGHGsandvalueemissiontradeoffsandtobeconsistentwithInternationalreportingrequirements.However,forotherpurposessuchasevaluatingmitigationstrategiesandlonger-termtradeoffs,manyclimatescientistsandpolicyanalysts,includingthelatestIPCCreports,nowunderstanditslimitations.Forstrategicpurposestherearealternativesolutionsforcharacterizingtherelativeimpactsavailableintheliterature(e.g.,Alvarezetal.2012)thatrenderthatchoiceirrelevant.However,forsimplicityherewesimplycomputemethaneeffectsfortwowidelydifferentvaluesoftheGWPtoillustratetherange:EPA’svalueof25(thatwasbasedontheIPCCAR42007reportfora100-yeartimeframe)andwasusedbyLaurenziandJersey,andtheIPPCAR52013valueof84fora20-yeartimeframe.Webelievethatthelatestscientificestimatesshouldbeappliedandthatthereisnoscientificjustificationforpreferringa100-yearovera20-yearvalues,especiallysincemanyoftheGHGmitigationgoalsoftheU.S.(forexample,theU.S.pledgetotheUNFCCCprocessfor2025)willoccurovermuchshorterperiodsoftime,closertoa20-yearperiod.WealsoshowinFigure3theresultsofasimplemodelthatshowsthetemporalevolutionofplanetaryheatingduetotheemissionsofCO2andCH4(separately)plusheatingfromcombustionofthedeliveredgasesfromallfourpipelineprojects.Forthischartweusedthehighermethaneemissionrates(columns3and4inthetables).PlanetaryheatingfromtheGHGemissionsmeanstheincrementalradiativeforcingatthetopoftheatmosphereduetotheemittedgases.OursimplemodelissimilartothatdescribedbyAlvarezetal.2012,althoughweuseupdatedparametersbasedonthelatestestimatesoftotalgreenhousegasconcentrationsintheatmosphereanddisplayourresultsinabsolutetermsasplanetaryheating.Ourmodelwillbedescribedinmoredetailinasubsequentpaper.ThisapproacheliminatestheneedforusingGWPsandprovidesmoreinformation.ProductionandProcessingStages.EstimatesofGHGemissionsfromnaturalgasproduction,processingandgatheringpipelinetransportoperationsdifferwidelyandcurrentlyareverycontroversial.Briefly,thereisanunresolveddisconnectbetweentwogeneralapproachestoestimatingemissions:so-calledbottom-upmethodsthatsumupmeasurementsand/orgenericemissionfactor-basedestimatesforindividualoperationsandequipmentintheoverallprocess,versustop-downmethodsbasedonmeasuringconcentrationsofmethaneintheatmosphereforsomeregioninwhichtherearenaturalgasand/oroilproducingoperations,thentranslatingthosemeasurementsintoestimatesofemissionsassociatedwithnaturalgasandoilproduction,processingand

9
otherstages(dependingonwhatoperationsareoccurringinthestudyregion).Thosetwoapproachesleadtoestimatedemissionsthatcandifferbyasmuchasanorderofmagnitude.Figure4belowshowssomeexamplesoftop-downcomparedwithEPAbottom-upestimates.Notethatseveraltop-downestimatesshowninFigure4haveamedianvalueofabout10%leakage,comparedwiththeEPAestimatebetween1and2%.Tables1and2beginwithoneestimate(Columns1&2)ofabottom-upapproach,theExxon-Mobilstudy,whichisnearthelowerendoftherangeofsuchestimates,(althoughthereareevenlowerones).Itamountstoabout1.12%leakageofmethanefromtheupstreamproductionandprocessingstagesofMarcellusshalefracking,inparticularintheSouthwesternPennsylvaniapartofthatregion.Wealsogivehypothetical(3X)estimates(Columns3&4)(basedonmultiplyingtheExxonMobilresultsbyafactorof3)thatwebelievearerepresentativeofthemiddleofthetop-downestimatesandalsoarecomparabletothehigherendofbottomupestimates),whichisequivalenttoupstreammethaneemissionsofabout3.4%.TheExxonMobilresultsformethaneemissionappeartoberoughlyinthesamerangeassomeotherbottom-upestimatesnearthelowend,includingvaluesbasedonEPA’sGreenhouseGasEmissionInventory.Thereareanumberofgeneralissueswithmostbottom-upstudies,includingthedifficultyofassuringthatindividualmeasurementsmadetodetermineemissionfactorsarerepresentativeofthebroaderindustryoperations,andthatmostmeasurementshavebeenmadebyorincloseassociationwiththeproducingindustrythathasavestedindustryinshowinglowemissions.(Itisdifficulttomakedetailedmeasurementsatasitewithouttheoperator’scooperation,andtherealwaysisaquestionaboutwhethertheoperatormaydothingsdifferentlywhenheknowsresearchersorgovernmentinspectorsarepresent.)Theparticularhigh-endestimateformethaneleakageweusehere(3.4%)iscomparabletothetop-downresultsreportedinthestudybyPetronetal.(2014),viz.4.1±1.5%.However,thatpertainedtonaturalgasproductionfromacombinationofoilandgaswellsandsupportinginfrastructure.Thatstudyinvolvedatmosphericstudiesusingvariouscombinationsofground-basedairmonitors,aircraftmeasurements,andothermeasurementsofmethaneandVOCconcentrations.Therehavebeenrelativelylargeuncertaintyboundsontop-downmethods.(SeeboundsshowninFigure4below,butalsothenewerZavala-Araizaetal.,2015studydiscussedbelow.)Theadvantageoftop-downestimatesisthattheytendtocaptureallthemethaneemissionsinaregion,includingnaturalgasindustrysourcesthatmayhavemuchhigheremissionsthanrepresentedbyemissionfactors(andthereismuchevidencethatafewlargeleakagesourcesaccountforadisproportionatecontributiontototals).Theirresultwasnowhereneartheworst-caseleakageexampleamongtopdownstudies,someofwhichfoundvaluesofmethaneleakageontheorderof10%ormore,asshowninFigure4.Aleakagerateof3.4%isalsoconsistentwithhigherestimatesusingbottom-upmethodsfromtheliterature[forexample,seeBrandtetal.(2014)].AtmosphericmeasurementsdonotmeasureCO2emissions,soweusethesameCO2estimatesfromLaurenziandJerseyinthiscolumninTable1.AlsonotethatatmosphericmeasurementsdonotnecessarilycapturealltheindirectLCAvaluessincesomeofthosemayapplyto

10
operationsoutsidetheproducingareas,butthosetendtobethesmallerpartofthetotalemissions.AveryrecentreportbyZavala-Araizaetal.(2015)reconcilesbottom-upandtop-downestimatesintheBarnettshaleoilandgas-productionregionofTexas.Itaugmentsconventionalbottom-upinventories,accountsforhighemitters,andcomparesthemtotop-downaircraftstudiesinwhichethanemeasurementsareusedtocorrectforbiogenicsources.Theirbottom-upinventoryis1.9timesestimatedemissionsbasedontheEPAGHGIprogram,andrepresentsamethaneleakagerateof1.5%(1.2—1.9%).TheAircrafttop-downmeasurementsoffossilmethaneaveragedabout10%higherthanthebottom-upestimates,butstillwithinthetop-downuncertaintybounds.ThoseresultsfortheBarnettregionindicateasignificantlysmallerleakageratethanthePetronetal.(2014)resultsobtainedintheDenver-Julesburggasandoilproductionregion.TheZavala-Araizaresults(amethaneleakagerateof1.5%forupstreamproductionandprocessingstages)suggestamediumleakagecaseinbetweenourbaseExxonMobilvalueandthe“Higher3X”leakageestimateof3.4%incolumnsthreeandfour.Ofcourse,neitherofthoseestimatesfromotherbasinsnecessarilypertainstotheMarcellusshalegasproductionregion,sowecannotsaywhetherourassumedmediumandhighvaluesintheTablesandFiguresareconsistent.Wedonotclaimthatthevalueof3.4%usedhereisavalidupperestimatefortheMarcellusregion,butonlythatitillustratesthepotentialimpactofahigherestimatethatisslightlysmallerthanatop-downresultfromanotherregionthatinvolvedparticularlycomprehensivemeasurements.AreportbyMarcheseetal.(2015)givesestimatesofemissionsfromthegasprocessingandgatheringpipelinestages(whichstagesareincludedinourestimatesofProductionandProcessing).Generallytheyfoundthattheirmeasurementsof16gasprocessingplantswereevenlowerthanEPA’semissionfactors,butmeasurementsof114gatheringpipelinefacilitieswereoftenmuchhigherthanEPAemissionfactors.Afewofthesmallergatheringfacilitiesappeartohaveleakageratesexceeding10%ofgasthroughput,butmostweremuchlessthanthat.Marcheseetal.didconcludethat:
“WhilethereisuncertaintyindetermininggatheringfacilityemissionsfromtheEPAGHGI,theresultsofthisstudysuggestthattheGHGIsubstantiallyunderestimatesemissionsfromgatheringfacilities.
TheMarchesestudyindicatesthatemissionsfromgatheringlinesmaybeconsiderablylargerthanestimatedintheExxonMobilanalysis.However,suchincreasedmethaneemissionspresumablywouldalreadybeaccountedforinbroadregiontop-downstudiesthatarethebasisforourmediumandhighermethaneestimates,sotheredoesnotappeartobeaneedtofactorthatintoourresultsincolumnsthreethroughsix.Arecentreport,ConcernedHealthProfessionalsofNewYorkReport(2015),foundthat(p.52-57):

11
“Leakagefromfaultywellsisanissuethattheindustryhasidentifiedandforwhichithasnosolution.AccordingtoSchlumberger,oneoftheworld’slargestcompaniesspecializinginfracking,aboutfivepercentofwellsleakimmediately,50percentleakafter15years,and60percentleakafter30years.DatafromPennsylvania’sDepartmentofEnvironmentalProtection(DEP)for2000-2012showoverninepercentofshalegaswellsdrilledinthestate’snortheasterncountiesleakingwithinthefirstfiveyears.Leaksposeseriousrisksincludingpotentiallossoflifeorpropertyfromexplosionsandthemigrationofgasorotherchemicalsintodrinkingwatersupplies.
“Leaksalsoallowmethanetoescapeintotheatmosphere,whereitactsasamorepowerfulgreenhousegasthancarbondioxide.Indeed,overa20-yeartimeframe,methaneis86timesmorepotentaheataccumulatorthancarbondioxide.Thereisnoevidencetosuggestthattheproblemofcementandwellcasingimpairmentisabating.Indeed,a2014analysisofmorethan75,000compliancereportsformorethan41,000wellsinPennsylvaniafoundthatnewerwellshavehigherleakageratesandthatunconventionalshalegaswellsleakmorethanconventionalwellsdrilledwithinthesametimeperiod.Industryhasnosolutionforrectifyingthechronicproblemofwellcasing/cementleakage.”
CombustionStage.CO2emissionsfromthenaturalgas-firedcombustion(e.g.,powerplant)stagedependmainlyontheamountofgasconsumed,whichinthiscaseissimplythethroughputofthepipeline,andslightlyonthecompositionofnaturalgas(whichchangestheCO2percubicfoot).EffectivelyweusedthelatterfactorfromLaurenziandJerseysincetheybaseditontypicalpipelinenaturalgasproducedintheMarcellusshaleregion(ratherthanEPA’snominalemissionfactor).Anycombustionuseofthetransmissionlinenaturalgasthroughputwouldgivethesameresult.However,naturalgasdeliveredfurtherforusethroughlocaldistributionlineswouldhavehigheroverallCO2eqemissionsbecauseofthesubstantialextraleakageofmethaneinmanydistributionsystems.GHGemissionspublishedbyLaurenziandJerseyfromthisstagearejustfromcombustion,arenotbasedonalifecycleanalysis,anddonotaccountforanyleakageofmethaneorunburnedmethaneinthepowerplantexhaustorpre-combustionhandling.WhilewecouldnotfindadefinitiveemissionfactorfromEPAformethanespecifictoNGCCpowerplants,NETL(2010)givesthefactor8.56E-06kg/MWhforNGCCplants3.ThatwouldbenegligiblecomparedwiththeCO2emissions.TransmissionandStorage(T&S)Stage.Ourbaseestimateforthisstageisbasedonadifferenttreatment.TheExxonMobilanalysisdidnotbasetheirestimateonalife-cycleanalysisoradetailedcalculationofemissionsfrompipelinefacilities.Rather,ittakes
3Methaneemissionfactorsvarywiththetypeofcombustionprocess;methaneandN2Oemissionsfromsimplegasturbinesandotherenginesusedtopowerpipelinecompressorsarenotassmall;e.g.,EPA’sAP-42GHGemissionfactorsfornaturalgas-firedturbinesare0.003lb/MMBtuforN2Oand0.0086forCH4,whichtogetheramounttoabout1.4%oftheCO2emissionswhentheAR520-yearGWPsforthosegasesareapplied(268forN2O).

12
2009EPAestimatesoftotalT&SfugitivemethaneemissionsandtotalCO2fromcompressorstocalculatetheratiotototalnaturalgaswithdrawalsthatyear.Thatresultsinanaverageleakagerateof0.45%ofmethaneandanaverageamountofCO2emissionsof82Kg/MMScfoftransportedgas.Weonlyhavelimitedinformationaboutthetwoproposedpipelines,suchaslengths,sizes,compressorhorsepower,andmaximumgasthroughputperday.Theredonotappeartobeanyemissionfactorsavailabletoestimatepipelineemissionsbasedonlyonthoseparameters.GiventhoselimitationsandthegenericnatureofinformationfromtheLaurenziandJersey(2013)paperabouttheassumptionsanddatafortheiremissionestimatesoftheTransmissionandStoragestage,itdidnotappearfeasibletoestimatehowtheirgenericestimatesofmethaneshouldscalewithvariouspipelineparameters,otherthanadirectscalingwithpipelinethroughputcapacity.WealsonotethatGHGemissionestimatesfromthepipelineproponentsdonotyetappeartobeavailable.Thatmayespeciallybeimportantforthedirectemissionvaluesforpipelineoperations.TheanalysisofLaurenziandJersey(2013)assumesa0.45%CH4leakrateintransmissionbuttheydonotstatespecificassumptionsabouttransmissionmiles,compressorHPandotherfactors.Rather,theyassumeafractionoftotalEPAestimatesforpipelineCH4leakageandcompressorCO2emissionsin2009basedonthefractionofgrossgaswithdrawals.TheACPandMVPtransmissionpipelines,totaling554.6milesand294miles,respectively,maynotbetypicalofthelengthandleakageratesimplicitintheLaurenziandJerseyanalysis.Itwouldbedesirabletoupdatethoseestimateswhenmorespecificinformationbecomesavailable.Subramanianetal.(2015)recentlypublishedanonsitestudyofcompressorstationemissions.Itincludesmeasurementsofmethaneemissionsfrom47transmissionlinecompressorandstoragesites.Thisisclaimedtobethemostcomprehensivesetofmeasurementssincethe1996jointEPA/GasResearchInstitutestudy.However,themeasuredfugitivemethaneemissionestimatesvarybyseveralordersofmagnitudeamongstationsandthestudyfoundnocorrelationbetweenemissionsandcompressorhorsepower.Thoseresults,togetherwithresultsofotherstudies,indicatethattherearelargevariationsinemissionsamongdifferenttechnologiesusedinequipment,probablyintheamountofeffortcompaniesspendonmaintenanceofthingslikesealsoncompressors,valves,andleaks,andperhapsalsointheeffortsspentonmonitoringtodetectleaks.4Becauseofthewidevarianceintheseresultsandthelackofclearcorrelationtopipelineparameterssuchastotalhorsepowerandsizeofpipeline,wewereunabletousetheresultstoreplaceorcomparedirectlywiththoseoftheExxonMobilstudy.4AnEPAbackgroundstudy,EPA(2014),preparedforanalysisofaproposedNSPSstandard,estimatedthefollowingmethaneemissionsachievablepercompressorforeachofthethreetypesoftransmissioncompressor:27.1metrictonne/yearforreciprocating,126forcentrifugalwithwetseals,and15.9forcentrifugalwithdryseals,butthoseestimatesapparentlydonotincludealltheothercomponentsatacompressorstation,whichinpracticecancontributesubstantialemissionsduetoleakage,ventingandexhaustemissions.

13
Zimmerleetal.(2015)publishedarecentstudyoftheU.S.naturalgastransmissionlineandstoragesystem(T&S)methaneemissions.Thisstudy’sestimatedoverallUStransmissionandstoragesectoremissionsfor2012as1503Gg/yr,whichwerewithintheirstatisticaluncertaintyofEPA’sGHGIestimatedvalueof2071Gg/yr.Theyalsofoundsuperemitterstationsthatappeartobeduetoequipmentorcontrolmalfunctions.OnecancomparethoseleakageestimateswiththeU.S.totalvaluethattheExxonMobilstudyusedasthebasisfortheirgenericestimateofpipelineemissions,whichwas2,115Gg/yrfor2009,or0.45%oftotalgasproduction.Sincetotalgrosswithdrawalsin2012wereabout16.5%largerthanin2009,theZimmerlestudyvalueof1503Gg/yrcorrespondstoamethaneleakagerateofabout40%lessthantheExxonMobilstudy,orabout0.27%ofgrosswithdrawals(apparentrangeof0.23to0.39%).However,bothofthoseestimatesrefertoaveragesoveranationalmixofdifferentpipelinesofdifferentsizes,agesandcapacities,soitisquestionablewhethertheycanbeapplieddirectlytospecificnewtransmissionpipelineprojects.TheZimmerleetal.studyincludestheresultsfromSubramanianetal.(2015)atindividualcompressorstationandstoragesites,butapparentlyextendstheanalysis.Theyfitalltheirresultstoseveraldifferentmodelsinordertodrawconclusionsabouttheoverallpopulationofsites,includingtheU.S.totalT&Semissionscitedabove.However,itagainitisdifficultforustointerpretthoseresultsintermsofspecificestimatesfortheACPandMVPpipelines.

14
Fig.4.ChartfromSchneisingetal.(2014).(Figureandcaptioncopied
directlyfromFigure7oftheirreport)

15
ConclusionsandRecommendations
ThepotentialtotalGHGemissionsassociatedwiththesetwoproposednewpipelinescouldgreatlyincreaseemissionsfromthisregionfordecadesintothefuture.Hence,inanerawhereclimatechangemitigationwillrequirereducingGHGemissionssharply,decisionmakersneedtoconsiderwhetherapprovaloftheseprojectsisconsistentwithnationalandinternationalgoalsforclimatemitigation.GiventheobservedwidevariationinmethaneemissionsandtheveryhightotalpotentialGHGemissions,itisimportantthatthetransmissionpipelinecompaniesandFERCprovidecompletelife-cycleestimatesofmethaneandCO2emissionsfromtheirprojectsfortheEISfortheirproposedpipelineprojects,togetherwithdetaileddocumentationoftheirassumptionssothatthepotentialGHGemissionsandotherenvironmentalimpactsofthepipelinestagecanproperlybejudged.ItisclearthatexpandinggasusageandsupportingitwithnewpipelinesandproductionimpliessubstantiallygreatertotalGHGemissionsthanappearwhenagenciesoradvocatesfocusononlyonestageatatimeandignoretheindirectimpactsoftheimmediateproject.FERCmustrecognizethattheemergingworldcommitmenttocutGHGemissions,asevidencedbytherecentUNFCCCCOP21agreementinParis,willmeanthattheoperatinglivesofnewnaturalgasinvestmentsarelikelytobesubstantiallyshorterthanthetraditionalassumptionthatapipelinewilloperateforthirtyormoreyears.Expandinginvestmentsbasedonsuchrosyassumptionswillleadtosubstantialstrandedinvestments,inadditiontoincreasedglobalwarmingfromexcessiveGHGemissions.Theseareamplegroundsforrejectingcertificateapplicationsforexpandednaturalgaspipelinecapacity.Ataminimum,pipelineinvestorsshouldbeplacedatriskforunder-recoveryofinvestmentsasaresultofovercapacityfortransportationofnaturalgasthatcannotcontinuetobeburnedathistoric,letaloneexpanded,levelsforseveraldecadesintothefuture.Furthermore,ifFERCdecidestoalloweitheroftheproposedpipelinestoproceed,itshouldrequiredetailedmaintenanceandemissionmonitoringplansfornewandassociatedexistingpipelinesandcompressorstationsadequatetopreventleaksanddetectallreleasesofmethanetotheatmosphereinatimelyfashionsothatsubstantialleakscanquicklyberemedied,bothforpublicsafetyandtominimizetheclimateimpactsofGHGemissions.
References
Alvarezetal.(2012):Alvarez,R.A.,etal.,“Greaterfocusneededonmethaneleakagefromnaturalgasinfrastructure”,PNAS,109,6435–6440,April24,2012.
Brandtetal.(2014):Brandt,A.etal.“MethaneLeaksfromNorthAmericanNaturalGasSystems”,Science343,733(2014)DOI:10.1126/science.1247045

16
ConcernedHealthProfessionalsofNewYork,“CompendiumOfScientific,Medical,AndMediaFindingsDemonstratingRisksAndHarmsOfFracking(UnconventionalGasAndOilExtraction)”ThirdEdition(October14,2015),p.52-57.“ExxonMobilReport”LaurenziandJersey(2013):Laurenzi,J.,andG.Jersey,“LifeCycleGreenhouseGasEmissionsandFreshwaterConsumptionofMarcellusShaleGas”,Env.Sci.&Technol,dx.doi.org/10.1021/es305162w.Marcheseetal.(2015):Marchese,A.J.,etal.,“MethaneEmissionsfromUnitedStatesNaturalGasGatheringandProcessing”,DOI:10.1021/acs.est.5b02275Environ.Sci.Technol. NETL (2010): “LifeCycleAnalysis:NaturalGasCombinedCycle(NGCC)PowerPlant“,DOE/NETL-403/110509. Petronetal.(2014):Pétron,G.,etal.(2014),“AnewlookatmethaneandnonmethanehydrocarbonemissionsfromoilandnaturalgasoperationsintheColoradoDenver-JulesburgBasin”,J.Geophys.Res.Atmos.,119,6836–6852,doi:10.1002/2013JD021272.Schneisingetal.(2014):Schneising,O.,J.P.Burrows,R.R.Dickerson,M.Buchwitz,M.Reuter,andH.Bovensmann(2014),RemotesensingoffugitivemethaneemissionsfromoilandgasproductioninNorthAmericantightgeologicformations,Earth’sFuture,2,doi:10.1002/2014EF000265Subramanianetal.(2015):“MethaneEmissionsfromNaturalGasCompressorStationsintheTransmissionandStorageSector:MeasurementsandComparisonswiththeEPAGreenhouseGasReportingProgramProtocol”,DOI:10.1021/es5060258,Environ.Sci.Technol.2015,49,3252−3261 EPA (2014): EPA OAQPS, “ OilandNaturalGasSectorCompressorsReportforOilandNaturalGasSectorCompressorsReviewPanel”,April2014.
G.Vaidyanathan,“Whichoilandgascompaniesareleakingthemostmethane?”http://www.eenews.net/climatewire/2015/06/26/stories/1060020954(June26,2015).
Zavala-Araizaetal.(2015):Zavala-AraizaD.etal.,“Reconcilingdivergentestimatesofoilandgasmethaneemissions”,www.pnas.org/cgi/doi/10.1073/pnas.1522126112Zimmerleetal.(2015):“MethaneEmissionsfromtheNaturalGasTransmissionandStorageSystemintheUnitedStates”,Environ.Sci.Technol.2015,49,9374−9383.

17
iPreparedfortheVirginiaChapterSierraClubwithcontributionsbyRichardH.Ball,Ph.D.,volunteerSustainableEnergyChair,WilliamPenniman,Esq.,volunteerConservationChair,andKirkBowers,PE,PipelinesProgramManager,VirginiaChapter.


