

GIS-BASED SITE SELECTION APPROACH FOR WIND AND SOLAR ENERGY SYSTEMS: A CASE STUDY FROM WESTERN TURKEY
A THESIS SUBMITTED TO THE GRADUATE SCHOOL OF NATURAL AND APPLIED SCIENCES
OF MIDDLE EAST TECHNICAL UNIVERSITY
BY
NAZLI YONCA AYDIN
IN PARTIAL FULFILLMENT OF THE REQUIREMENTS FOR
THE DEGREE OF MASTER OF SCIENCE IN
GEODETIC AND GEOGRAPHIC INFORMATION TECHNOLOGIES
JULY 2009

Approval of the thesis:
GIS-BASED SITE SELECTION APPROACH FOR WIND AND SOLAR ENERGY SYSTEMS: A CASE STUDY FROM WESTERN TURKEY
submitted by NAZLI YONCA AYDIN in partial fulfillment of the requirements for the degree of Master of Science in Geodetic and Geographic Information Technologies Department, Middle East Technical University by,
Prof. Dr. Canan Özgen _____________________ Dean, Graduate School of Natural and Applied Sciences Prof. Dr. Mahmut Onur Karslıoğlu _____________________ Head of Department, Geodetic and Geographic Inf. Tech. Assist. Dr. Elçin Kentel _____________________ Supervisor, Civil Engineering Dept., METU Assoc. Prof. Dr. Şebnem Düzgün _____________________ Co-Supervisor, Mining Engineering Dept., METU
Examining Committee Members:
Assoc. Prof. Dr. Ayşegül Aksoy _____________________ Environmental Engineering Dept., METU Assist. Dr. Elçin Kentel _____________________ Civil Engineering Dept., METU Assoc. Prof. Dr. Şebnem Düzgün _____________________ Mining Engineering Dept., METU Assoc. Prof. Dr. Zuhal Akyürek _____________________ Civil Engineering Dept., METU Dr. Tuba Hande Ergüder _____________________ Environmental Engineering Dept., METU Date: 15/07/2009

iii
I hereby declare that all information in this document has been obtained and presented in accordance with academic rules and ethical conduct. I also declare that, as required by these rules and conduct, I have fully cited and referenced all material and results that are not original to this work.
Name, Last name: Nazlı Yonca Aydın
Signature:

iv
ABSTRACT
GIS-BASED SITE SELECTION APPROACH FOR WIND AND SOLAR ENERGY
SYSTEMS: A CASE STUDY FROM WESTERN TURKEY
Aydın, Nazlı Yonca
M.Sc., Department of Geodetic and Geographic Information Technologies
Supervisor: Assist. Prof. Elçin Kentel
Co-Supervisor: Assoc. Prof. Şebnem Düzgün
July 2009, 138 pages
Many countries around the world integrated Renewable Energy Systems (RES) in their
future energy plans in order to reduce negative impacts of fossil fuel consumption on
the environment. However, RES may as well cause various environmental problems
which are mostly related with the geographic locations of these facilities. The aim of this
thesis is to create a Geographic Information System-based methodology for evaluating
alternative locations for wind, solar and hybrid power plants by using fuzzy multi-criteria
decision making. Environmental objectives and economical feasibility criteria for wind
and solar systems are identified through Turkish legislations, previous studies, and
interviews with General Directorate of Electrical Power Resources Survey and

v
Development. Individual satisfaction degrees for each alternative location with respect
to the identified environmental objectives and economical feasibility criteria are
calculated using fuzzy set theory tools. Then these individual satisfaction degrees are
aggregated into overall performance indexes which are used to determine priority maps
for wind and solar energy generation facilities. Finally, maps of priority sites for wind
and solar energy systems are overlaid to identify suitable locations for hybrid wind-solar
energy systems. The proposed methodology is applied on a case study area composed
of Uşak, Aydın, Denizli, Muğla, and Burdur provinces.
Key words: Geographic Information System, fuzzy multi-criteria decision making, wind
energy, solar energy, hybrid systems.

vi
ÖZ
RÜZGAR VE GÜNEŞ ENERJİ SİSTEMLERİ İÇİN CBS-TABANLI YER SEÇİMİ
YAKLAŞIMI: BATI TÜRKİYE’DEN BİR ÖRNEK
Aydın, Nazlı Yonca
Yüksek Lisans, Jeodezi ve Coğrafi Bilgi Teknolojileri Bölümü
Tez Yöneticisi: Yrd. Doç. Dr. Elçin Kentel
Ortak Tez Yöneticisi: Doç. Dr. H. Şebnem Düzgün
Temmuz 2009, 138 sayfa
Dünyada bir çok ülke fosil yakıtların çevre üzerindeki olumsuz etkilerini azaltmak
amacıyla enerji planlarına Yenilenebilir Enerji Sistemlerini (YES) eklemişlerdir. Ancak
YES de çoğunlukla bu sistemlerin coğrafi konumlarından kaynaklanan bir takım
çevresel problemlere yol açabilirler. Bu çalışmanın amacı, rüzgar, güneş ve karma
enerjisi tesisleri kurulabilecek alternatif alanların değerlendirilmesi için bulanık Çok-
Kriterli Karar Verme yöntemi kullanan Coğrafi Bilgi Sistemi tabanlı bir yaklaşım
geliştirilmesidir. Rüzgar, güneş ve karma rüzgar-güneş sistemler için çevresel hedefler
ve ekonomik uygulanabilirlik kriterleri, geçmişte yapılmış araştırmalar, Türkiye‘deki
yönetmelikler ve Elektrik İşleri Etüt İdaresi ile yapılan görüşmeler sonucunda

vii
belirlenmiştir. Her bir alternatif konumun, çevresel hedefleri ve ekonomik uygulanabilirlik
kriterlerini münferit sağlama derecesi bulanık mantık yöntemleri kullanılarak
hesaplanmıştır. Daha sonra bu münferit sağlama dereceleri birleştirilerek toplam
performans indeksleri hesaplanmıştır ve bu indeksler rüzgar, güneş ve karma sistemler
için öncelikli/uygun alanların belirlenmesinde kullanılmıştır. Son olarak, rüzgar ve güneş
sistemleri için oluşturulan öncelik haritaları üst üste çakıştırılarak karma rüzgar-güneş
sistemler için uygun yerler belirlenmiştir. Önerilen yaklaşım Uşak, Aydın, Denizli, Muğla
ve Burdur illerinden oluşan bir örnek çalışma alanı üzerinde uygulanmıştır.
Anahtar kelimeler: Coğrafi Bilgi Sistemleri, bulanık çok-kriterli karar verme, rüzgar
enerjisi, güneş enerjisi, karma sistemler.

viii
To my mother,

ix
ACKNOWLEDGEMENTS
I would hereby like to express my sincere gratitude to my advisors Assist. Prof.
Elçin Kentel and Assoc. Prof. Şebnem Düzgün for their major contributions, unlimited
patience and the valuable guidance. I am thankful for their continuous supports not only
for development of this thesis, but also for my future endeavors.
I am thankful to Başarsoft Company and Funda Arıkan for providing me data for this
study. I am also thankful to Dr. Yüksel Malkoç, Bekir Turhan Çorbacıoğlu, and Mustafa
Çalışkan from General Directorate of Electrical Power Resources Survey and
Development Administration for their helpful manner. In addition, I would like to thank to
Dr. B. Teoman Meriç, Dr. Aygün Erdoğan and Ethem Akgündüz from Ministry of
Environment and Forestry.
My mother‘s understanding, patience and support were invaluable for me to finish this
thesis. There is no doubt my brother Emre Aydın was a great supporter for me. His
practical knowledge and enlightening vision had a major influence on me.
Finally, I would like to thank also to all my friends Dicle, Simge, Ceyda, and Elçin for
cheering me up when I need their existence during thesis preparation.

x
TABLE OF CONTENTS
ABSTRACT ................................................................................................................... IV
ÖZ ................................................................................................................................. VI
ACKNOWLEDGEMENTS.............................................................................................. IX
LIST OF TABLES ........................................................................................................ XIII
LIST OF FIGURES ...................................................................................................... XIV
LIST OF ABBREVIATIONS ......................................................................................... XVI
1. INTRODUCTION ......................................................................................................... 1
1.1. Overview of the Study .......................................................................................... 1
1.2. Practical Use of the Study ................................................................................... 5
1.3. Content of the Thesis ........................................................................................... 5
2. LITERATURE REVIEW ............................................................................................... 7
2.1. Sustainable Energy .............................................................................................. 7
2.2. Renewable Energy Systems ................................................................................ 8
2.3. Global Renewable Energy Status ........................................................................ 8
2.4. Renewable Energy Status in Turkey ................................................................. 10
2.5. Wind Energy ...................................................................................................... 13
2.5.1. Wind Energy in Turkey ............................................................................... 15
2.5.2. Environmental Impacts of Wind Energy ..................................................... 18
2.6. Solar Energy ...................................................................................................... 20
2.6.1. Solar Energy in Turkey ............................................................................... 22
2.6.2. Environmental Impacts of Solar Energy ..................................................... 23
2.7. Hybrid Energy Systems ..................................................................................... 26
2.8. Environmental Management and GIS ................................................................ 26
2.9. Spatial Decision Support Systems ..................................................................... 28
2.10. Multi-Criteria Decision Analysis (MCDA) ......................................................... 30

xi
3. METHODOLOGY ...................................................................................................... 35
3.1.Identification of Environmental Objectives and Economical Feasibility Criteria .. 38
3.2.Data Collection and Processing .......................................................................... 38
3.3.Representation of Environmental Objectives and Economical Feasibility Criteria
As Fuzzy Sets ........................................................................................................... 46
3.4.Multi-Criteria Decision Making (MCDM) ............................................................. 48
3.4.1. ―AND‖ Operator .......................................................................................... 48
3.4.2. ―OR‖ Operator ............................................................................................ 49
3.4.3. Ordered Weighted Averaging (OWA) ......................................................... 49
3.4.3.1. Quantifier Guided Owa Combination .................................................. 50
3.5.Site Selection ...................................................................................................... 51
4. IMPLEMENTATION .................................................................................................. 53
4.1. Case Studies ..................................................................................................... 53
4.2. Solar Energy ...................................................................................................... 57
4.2.1. Methodology ............................................................................................... 58
4.2.1.1. Identification of Environmental Objectives and Economical Feasibility
Criteria ............................................................................................................. 59
4.2.1.2. Quantification of Objectives ................................................................ 62
4.2.1.3. Data Collection and Processing ......................................................... 64
4.2.1.4. Representation of Environmental Objectives As Fuzzy Sets ............. 65
4.2.1.5. Computation of Individual Satisfaction Degrees ................................. 68
4.2.1.6. Representation of Economical Feasibility Criteria Using Fuzzy Sets . 68
4.2.1.7. Computation of Individual Satisfaction Degrees ................................. 71
4.2.1.8. Multi-Criteria Decision Making (MCDM) ............................................. 71
4.2.2. Example Application For Solar Power Plants ............................................. 73
4.3. Wind Energy ...................................................................................................... 92
4.3.1. Methodology ............................................................................................... 92
4.3.1.1. Identification of Environmental Objectives .......................................... 93
4.3.1.2. Quantification of Objectives ................................................................ 95
4.3.1.3. Data Collection and Processing ......................................................... 97
4.3.1.4. Representation of Environmental Objectives As Fuzzy Sets ............. 97
4.3.1.5. Computation of Individual Satisfaction Degrees ............................... 101
4.3.1.6. Representation of Wind Energy Potential As a Fuzzy Set ............... 101

xii
4.3.1.7. Multi-Criteria Decision Making (MCDM) ........................................... 102
4.3.1.8. Site Selection .................................................................................... 102
4.3.2. Example Application For Wind Turbines .................................................. 103
4.4. Hybrid Wind-Solar Energy Systems ................................................................ 114
5. RESULTS AND DISCUSSIONS.............................................................................. 117
6. CONCLUSIONS AND RECOMMENDATIONS ....................................................... 122
REFERENCES ............................................................................................................ 126
xiii
LIST OF TABLES
TABLES
Table 2.1 Energy production and consumption values between 2006 and 2007 in
Turkey (World Energy Council-Turkish National Committee, 2008). ............................. 11
Table 2.2 Wind Farms under Operation in 2009 in Turkey (Adopted from Web 1). ...... 16
Table 2.3 Wind Farms under Construction in 2009 in Turkey (Adopted from Web 1). .. 17
Table 2.4 Wind Farm Projects with a Turbine Supply Contract in 2009 in Turkey
(Adopted from Web 1). .................................................................................................. 17
Table 2.5 Monthly average solar energy values in Turkey (Web 6) .............................. 22
Table 3.1 Content of the required data. ......................................................................... 40
Table 3.2 Site selection rules ........................................................................................ 52
Table 4.1 Environmental objectives and associated criteria from regulations and
previous studies ............................................................................................................ 63
Table 4.2 Economical feasibility criteria and associated criteria from interviews and
previous studies ............................................................................................................ 64
Table 4.3 Site selection criteria for solar energy systems ............................................. 72
Table 4.4 Environmental Objectives and Associated Criteria from previous studies .... 96
Table 4.5 Environmental Objectives and Associated Criteria from regulations ............. 97
Table 4.6 Site selection criteria for wind energy systems ............................................ 103
xiv
LIST OF FIGURES
FIGURES
Figure 2.1 Total primary energy supply in 2007 (Web 2) .............................................. 12
Figure 2.2 Wind farm capacities in Turkey (Adopted from Web 1) ................................ 18
Figure 3.1 Methodology of the study ............................................................................. 37
Figure 3.2 Model diagram for ―Polygon to Grid‖ tool ..................................................... 41
Figure 3.3 Model diagram for ―Polyline to Grid‖ tool ...................................................... 42
Figure 3.4 Calculation of the nearest distance for a single alternative location ............. 43
Figure 3.5 Nearest distances in GIS database .............................................................. 44
Figure 3.6 Model diagram for ―Grid Calculation‖ tool ..................................................... 45
Figure 3.7 Model diagram for ―Import Data‖ tool ........................................................... 46
Figure 4.1 Wind energy potential atlas of Turkey (Web 4) ............................................ 54
Figure 4.2 Solar energy potential atlas of Turkey (Web 9) ............................................ 54
Figure 4.3 Study Area in Turkey .................................................................................... 55
Figure 4.4 Morphological features of the study area ..................................................... 56
Figure 4.5 Flowchart of site selection procedure for solar power plants ....................... 59
Figure 4.6 Fuzzy set for ―Acceptable in terms of agricultural areas‖ ............................. 66
Figure 4.7 Fuzzy set for ―Acceptable in terms of lakes and wetlands‖ .......................... 67
Figure 4.8 Fuzzy set for ―Acceptable in terms of coastline and rivers‖ .......................... 67
Figure 4.9 Fuzzy set for ―Acceptable in terms of flight security‖ .................................... 68
Figure 4.10 Fuzzy set for ―Sufficient potential for solar energy generation‖ .................. 69
Figure 4.11 Fuzzy set for ―Acceptable in terms of slope‖ .............................................. 70
Figure 4.12 Fuzzy set for ―Acceptable in terms of transmission lines‖ .......................... 70
Figure 4.13 Fuzzy set for ―Acceptable in terms of proximity to urban area‖ .................. 71
Figure 4.14 Current solar potential for the study area ................................................... 74
Figure 4.15 Suitable locations for ―Acceptable in terms of natural reserves‖ ................ 76
Figure 4.16 Suitable locations for ―Acceptable in terms of agricultural areas‖ .............. 77
Figure 4.17 Suitable locations for ―Acceptable in terms of lakes and wetlands‖ ........... 78

xv
Figure 4.18 Suitable locations for ―Acceptable in terms of coastline and rivers‖ ........... 79
Figure 4.19 Suitable locations for ―Acceptable in terms of flight security‖ ..................... 81
Figure 4.20 Suitable locations for ―Sufficient potential for solar energy generation‖ ..... 82
Figure 4.21 Suitable locations for ―Acceptable in terms of slope‖ ................................. 83
Figure 4.22 Suitable locations for ―Acceptable in terms of transmission lines‖ ............. 84
Figure 4.23 Suitable locations for ―Acceptable in terms of proximity to urban area‖ ..... 85
Figure 4.24 OEPI map for ―Satisfaction of most of the environmental objectives‖ ........ 87
Figure 4.25 OSEPI map for ―Satisfaction of most of the economical feasibility criteria‖ 88
Figure 4.26 OPI map of the study area ......................................................................... 90
Figure 4.27 Priority sites within the study area .............................................................. 91
Figure 4.28 Flowchart of site selection procedure for wind turbines ............................. 93
Figure 4.29 Fuzzy set for ―Acceptable in terms of natural reserves‖ ............................. 98
Figure 4.30 Fuzzy set for ―Acceptable in terms of safety and aesthetics for large city
centers‖ ......................................................................................................................... 99
Figure 4.31 Fuzzy set for ―Acceptable in terms of safety and aesthetics for town
centers‖ ......................................................................................................................... 99
Figure 4.32 Fuzzy set for ―Acceptable in terms of safety and aesthetics for airports‖ ... 99
Figure 4.33 Fuzzy set for ―Acceptable in terms of noise‖ ............................................ 100
Figure 4.34 Fuzzy set for ―Acceptable in terms of bird habitat‖ ................................... 100
Figure 4.35 Fuzzy set for ―Sufficient potential for wind energy generation‖ ................ 102
Figure 4.36 Current wind potential for the study area ................................................. 105
Figure 4.37 OEPI map for ―Satisfaction of most of the environmental objectives‖ ...... 106
Figure 4.38 OEPI map for ―Satisfaction of all of the environmental objectives‖ .......... 108
Figure 4.39 OEPI map for ―Satisfaction of any of the environmental objectives‖ ........ 109
Figure 4.40 OPI map ................................................................................................... 112
Figure 4.41 Priority sites .............................................................................................. 113
Figure 4.42 Priority sites for hybrid systems of wind and solar energy ....................... 115
Figure 6.1 Comparison of current wind turbine locations ............................................ 123

xvi
LIST OF ABBREVIATIONS
AHP Analytical Hierarchy Process
DSS Decision Support System
EU European Union
GIS Geographic Information System
MCDA Multi-Criteria Decision Analysis
MCDM Multi-Criteria Decision Making
MODM Multi-Objective Decision Making
OEPI Overall Environmental Performance Index
OPI Overall Performance Index
OSEPI Overall Solar Energy Performance Index
OWA Ordered Weighted Averaging
PV Photovoltaic
RES Renewable Energy Systems
RDM Regular Decreasing Monotone
RIM Regular Increasing Monotone
RUM Regular UniModal
SDSS Spatial Decision Support System

1
CHAPTER 1
INTRODUCTION
1.1. Overview of the Study
Through the human history renewable energy sources have been utilized. Ancient
Greeks were using solar energy by orienting buildings in the way that allow sun
radiation to enter inside buildings. Likewise, obtaining energy by burning wood or
animal wastes, so called biomass energy, has been the major energy resource for
mankind for centuries.
Today, the importance of renewable energy is commonly accepted not only due to
limited fossil fuel resources, but also due to major environmental concerns associated
with fossil fuel burning. Omer (2008a) states that increase in consumption of fossil fuels
induce the release of greenhouse gases. Particularly, developing and industrialized
countries must take some precautions in order to reduce their emission levels while
preserving their economic development. In addition, Elliot (2007) points out that one of
the best options is to adopt renewable energy and increase the energy efficiency in
order to decrease negative impacts of climate change.
It is a fact that conventional energy systems have detrimental effects on the
environment and Renewable Energy Systems (RES) seem like a solution to these
problems; however, it is impossible not to affect the environment while producing
energy (Tsoutsos et al., 2005). In other words, more or less, each RES has negative
effects on ecology and the environment but these effects are considerably tolerable with

2
respect to those of conventional energy systems. Therefore, renewable energy
resources have advantages over conventional energy systems in terms of
environmental acceptability. Nevertheless, before adopting RES, comprehensive
analyses should be conducted in order to identify the best locations which are
associated with highest potentials and at the same time environmentally favorable.
Decision making is an important component of investments, logistics, allocation of
resources, etc. Geographers and spatial planners are interested in decision problems
which are based on geographically defined alternatives. These alternatives are
evaluated with respect to their spatial arrangement. Many Geographic Information
System (GIS) applications provide crucial information for decision making which support
site selection procedures in various research areas such as natural resources
management, environmental pollution and hazard control, regional planning, urban
development, and utilities management. These complex problems require simultaneous
evaluation of many criteria. For this purpose, Multi-Criteria Decision Making (MCDM)
can assist decision makers in selecting the best alternative (Jankowski, 1995).
Accordingly, many spatial planning or management problems can be solved by GIS-
based Multi-Criteria Decision Analysis (MCDA) or in other words, spatial MCDA
(Malczewski, 1999).
In this thesis, a GIS-based methodology for evaluating alternative locations of wind and
solar power plant installations is developed by using MCDM. The main objective is to
produce a decision support system (DSS) which can assist authorities and decision
makers to identify priority sites for wind and solar energy generation facilities. There are
already 17 operating wind farms, 7 wind farms under construction, and 15 wind farm
projects in Turkey (Web 1); in addition, new legislation associated with solar energy
generation will be developed which can enhance the interest in solar power plant
installations in the near future (Caliskan, 2009). Moreover, wind and solar energy
investments are expected to increase in Turkey. Therefore, identification of feasible
locations for future wind and solar power plants is an important issue for Turkey. The
proposed methodology in this thesis may provide valuable guidance for decision
makers in identifying feasible locations for wind and solar power plants before assigning
licenses.

3
Most of the decision making procedures for site selection problems require
simultaneous evaluation of multiple criteria which are used to assess the suitability
degree of each alternative location. Usually it is not practical to identify a potential
location as suitable or not suitable, but rather a degree of suitability may be more
informative and realistic. Calculation of degrees of suitability for each alternative
location may be achieved by utilization of fuzzy sets. When the criteria or objectives do
not have crisp boundaries then they can be represented by fuzzy sets. The membership
function of the fuzzy set allows assignment of degrees of belongingness or degrees of
satisfaction for each alternative with respect to the fuzzy criteria. This facilitates the
process of criteria standardization by converting statements into membership values.
As a result, a set of individual satisfaction degrees are calculated for each alternative
location for each criteria or objective. Then these individual satisfaction degrees are
aggregated into an overall satisfaction degree which may be used in comparing the
alternatives. There are number of aggregator operators commonly used to combine
individual satisfaction degrees into an overall satisfaction value.
Aggregation of individual satisfaction degrees into an overall satisfaction degree will
simplify the decision process. Most commonly used aggregator operators are the ―and‖
operator (i.e. MIN), and the ―or‖ operator (i.e. MAX). The ―and‖ operator requires
satisfaction of all of the criteria while the ―or‖ operator requires satisfaction of any of the
criteria. However, in real world problems, the decision maker may require satisfaction of
―most‖ or ―at least 20%‖ or ―many‖ of the criteria. To implement such decision rules,
various other aggregators have been developed. One of these aggregators is the
Ordered Weighted Averaging (OWA) aggregator suggested by Yager (1988). OWA lies
between the MIN and the MAX operators. OWA is based on an aggregation of ordered
criteria which allows a control of trade-offs among the criteria (Eastman and Jiang,
1996). Consequently, OWA can be used to express vague preferences of the decision
makers in order to obtain an overall performance for each alternative (Malczewski,
1999). In this thesis, application of all three aggregators, ―and‖, ―or‖ and OWA is
realized at various stages of the decision making process.
The main outcome of this thesis is a GIS-based approach for site selection of wind
turbines, solar power plants and hybrid systems which are composed of wind turbines
and solar power plants together, by using MCDM. A case study area, composed of

4
Uşak, Aydın, Denizli, Muğla, and Burdur provinces is selected and application of the
proposed approach is demonstrated on this area. In the first case study, where suitable
locations for wind turbine installations are identified, for each alternative location
individual satisfaction degrees of environmental objectives are aggregated into an
overall environmental performance index (OEPI) by using the ―and‖, the ―or‖ and OWA
operators. In addition to environmental fitness, wind energy potential is of crucial
importance in selecting wind turbine locations. Therefore, a fuzzy set called ―Sufficient
potential for wind energy generation‖ is identified to evaluate suitability of each
alternative location with respect to wind energy potential. Then the satisfaction degree
of each alternative location for this fuzzy criterion is identified. Finally, the OEPI and
degree of satisfaction for ―Sufficient potential for wind energy generation‖ is aggregated
by the ―and‖ aggregator to calculate an overall performance index (OPI). Alternative
locations with an OPI of 0.5 and higher are identified as priority sites (i.e.
environmentally and potentially favorable sites) obtained.
The second case study is conducted for site selection of the solar power plant
installations. For this purpose, OEPI is calculated by the OWA operator; however in
evaluating suitability with respect to solar potential, additional criteria such as slope,
proximity to transmission lines and urban areas are used as well. These criteria which
are related with physical requirements and solar energy potential are referred to as
economical feasibility criteria and satisfaction of each alternative location with respect to
these criteria is represented by an overall solar energy performance index (OSEPI).
OPI for solar power plant installations are calculated by aggregating the OEPI and
OSEPI.
One of the main disadvantages of renewable energy sources is their discontinuity; in
other words, dependence of energy generation on weather conditions and the climate.
To overcome this drawback, hybrid systems combining more than one type of RES are
suggested. Therefore, as a final analysis, priority sites for hybrid systems (i.e. systems
that involve both wind turbines and solar power plants) is identified for the study area by
overlaying priority maps developed for wind turbines and solar power plants.

5
1.2. Practical Use of the Study
Energy Market Regulatory Authority together with General Directorate of Electrical
Power Resources Survey and Development Administration assign permits according to
renewable energy potentials. However, as mentioned before, RES may have some
adverse impacts on the environment. For example, wind turbines cause environmental
impacts associated with noise, bird collision, visual intrusion, habitat damage, and
safety (IEA, 1998). Considering increasing awareness of environmental issues around
the world, it is essential to put forward a DSS for RES that uses GIS for site selection
analysis.
In this thesis, a GIS-based methodology for site selection of wind and solar generation
plants is developed using various aggregators together with mathematical tools of fuzzy
set theory. As a case study, the proposed approach is implemented for a study area in
the western part of Turkey. The results showed that the proposed methodology can
assist authorities and decision makers as a spatial decision support tool. Energy Market
Regulatory Authority together with General Directorate of Electrical Power Resources
Survey and Development Administration can utilize the final maps where priority sites
are identified while assigning licenses for wind and solar energy generation facilities.
1.3. Content of the Thesis
This thesis is composed of five chapters. In the next chapter, literature review
associated with RES especially wind, solar and hybrid systems and MCDM is
presented. The main environmental concerns of RES, renewable energy status of
Turkey and the world are explained.
In the third chapter, methodology of the study is explained in detail. Identification and
quantification of environmental objectives, and data collection procedures are provided.
Mathematical tools such as fuzzy sets and aggregator operators used in the study are
discussed in the third chapter as well.
In the fourth chapter, implementation of the proposed methodology on a study area is
demonstrated. Site selection procedures for wind and solar energy generation facilities
are explained in more depth using the case study. In addition, GIS applications, and
data manipulations associated with the GIS-based OWA methodology are explained. In

6
the final chapter of this thesis, a brief summary, together with conclusions and
recommendations are provided. Usefulness of the results is evaluated in terms of the
current renewable energy status of Turkey.

7
CHAPTER 2
LITERATURE REVIEW
2.1. Sustainable Energy
Today, one of the main problems that the societies are facing is energy generation and
sustainable utilization. Most of the energy resources currently relied on are finite and
will be depleted because of the increasing demand. In addition, there have been
serious local air, water, and soil pollution problems as a result of the consumption of
various energy resources. It has become clear that continuing to use fossil fuels is not
wise not only due to the global impacts on climate system, but also due to both short-
term and very long-term impacts on society and the ecosystem (Elliott, 2007).
While consumption of fossil fuels are increasing regardless of their adverse impacts on
the environment; today, world‘s agenda focuses on sustainable energy systems in
terms of both reliability for economic development and benefits for the environment.
According to Tester et al. (2005), the definition of sustainable energy is the combination
of providing energy equally to all people and protecting the environment for next
generations. The RES have a common approval as a form of sustainable energy that
keeps the attention recently (Omer, 2008b). In the light of these facts, RES which
respond to the needs of current and future populations should be adapted.
Terms such as ―renewable energy‖, ―sustainable energy‖, and ―green energy‖ can be
used interchangeably. General perception towards these terms is that renewable
energy sources have environmental benefits. Although it is true that the impacts of

8
using RES are less than those of conventional energy systems, some may have
significant local impacts (Elliott, 2007).
2.2. Renewable Energy Systems
RES have been adapted by man through the history. For example, biomass has been
used for heating, cooking, and steam production for a long time. RES like wind, solar,
biomass/biogas, tidal, wave, and geothermal energies are able to supply clean and
efficient energy by using advanced technologies (Abulfotuh, 2007).
There are numerous economical and environmental benefits associated with RES.
First, they can assist the diversification of current energy markets. In addition, they can
reduce local and global atmospheric emissions and can supply specific needs for
energy services, particularly in developing countries and rural areas. Furthermore, they
can provide new employment opportunities, and enhance local manufacturing (Asif and
Muneer, 2007).
2.3. Global Renewable Energy Status
It is commonly accepted that energy is necessary in order to improve the quality of life
by providing basic needs such as heat, light, and power for entertainment devices and
labor-saving appliances (Akpinar et al., 2008). In 2000, the main energy consumption
on the earth was fossil fuels such as petroleum, natural gas, and coal with their 86%
proportion (Environment Foundation of Turkey, 2006).
Energy consumption around the world is expected to rise around 2% by 2030. While
compensating this energy rise, not only economical but also environmental issues need
to be considered (Environment Foundation of Turkey, 2006). Renewable energy is
becoming more popular around the world, because it minimizes the effect of fossil fuels,
which cause greenhouse gas emissions (Ozgur, 2008). In addition, since fossil fuel
sources are limited, human being will be forced to find ways of utilizing RES in the
future (Akpinar et al., 2008).
According to statistics in 2005, hydropower plants had the biggest proportion among
renewable energies in the world. A total of 750 GW and 66 GW power was produced
from large and small scaled hydropower plants, respectively by the end of the 2005.

9
The wind power, on the other hand, had the second place in the world with its 59 GW
power production (REN21, 2006).
Projections about 2030 indicate that the main energy source will still be petroleum and
the consumption of natural gas will rise; in contrast, nuclear energy will decrease
because of the cost and waste problems. It is expected that renewable energy
applications will be improved during this period. Therefore, the goal of European Union
(EU) countries is to produce energy from renewable resources (other than hydropower)
around 150 Mtoe by 2030 (Environment Foundation of Turkey, 2006).
Moreover, both China and India have major renewable energy programs. India has
extensive wind power projects and major photovoltaic (PV) solar, biomass and biogas
programs. The renewable capacity of India is expected to reach 10 GW by 2012. China
already has over 23 GW (th) of solar thermal capacity, and major hydro and biogas
programs. By 2020, China is planning to have 30 GW of wind capacity and 30 GW of
biomass plant. China, with 120 GW of renewable capacity overall, is aiming to meet
around 16% of its expected electricity requirement from renewable resources by 2020
(Elliott, 2007). As can be seen from these projections, renewable energy investments
are expected to expand in the future.
Increasing investments in renewable energy production is motivated by the necessity of
reducing negative impacts of the climate change around the world. International Climate
Change Commission states that CO2 concentration in the atmosphere must be kept
below 400 ppm level. Recently, the level of CO2 concentration has reached 378 ppm.
This is an alarming level and immediate precautions need to be taken. Therefore, EU
directive 2001/77/EC encourages EU countries to produce 21% of the total electricity
consumption in 2010 from renewable energy sources (Environment Foundation of
Turkey, 2006).
One of the most important elements of economic development is continuous and
reliable energy production. Development of energy policies that satisfy the demand
while protecting the environment is of major concern. As a result of this, contribution of
RES in future energy plans need to be increased considerably (Environment
Foundation of Turkey, 2006).

10
2.4. Renewable Energy Status in Turkey
Energy consumption is one of the main indicators of wealth and economic development
for countries. On the other hand, environmental degradation has become more
apparent because of several factors such as increase in the world population,
excessive consumption of resources, industrial activities, etc. Solution to environmental
problems is based on adaptation of sustainable development which has close
connection with renewable energy (Dincer, 1999).
Turkey supplies more than half of its energy requirement by importing energy from
other countries. Additionally, one of the most important environmental concerns due to
imported fossil fuel consumption is the air pollution. RES may be an efficient solution for
the environmental pollution problem. Turkey has a great advantage due to its
geographical location in terms of renewable energy resources availability. In conclusion,
Turkey has limited fossil fuel resources and major air quality problems due to fossil fuel
consumption; therefore, shifting from fossil fuels to RES might be a good alternative for
Turkey (Kaygusuz and Sari, 2003).
Primary energy consumption of Turkey depended on fossil fuels in 2006 and 2007.
Although petroleum and natural gas are imported from other countries, consumption of
petroleum increased from 2.71% from 2006 to 2007, and consumption of natural gas
increased 17.62% from 2006 to 2007. Energy production and consumption values are
given in Table 2.1 (World Energy Council-Turkish National Committee, 2008).

11
Table 2.1 Energy production and consumption values between 2006 and 2007 in
Turkey (World Energy Council-Turkish National Committee, 2008).
Energy Source Production Consumption Increase in Consumption
2006 2007 2006 2007 Percentage
Oil (Mtoe) 2.1755 2.134 31.295 32.143 2.71
Natural Gas (Mtoe) 0.907 0.893 31.187 36.682 17.62
Coal, Lignite, Asphaltite Mtoe) 64.255 75.365 83.584 98.337 17.65
Hydro and Geothermal (GWh) 44338 6007 44398 36007 -18.90
Geothermal Heat (Mtoe) 0.898 0.914 0.898 0.914 1.78
Wind (GWh) 127 355 127 355 179.53
Solar (Mtoe) 0.403 0.42 0.403 0.42 4.22
Comb. Renew. And Wastes (Mtoe)
4.984 4.85 4.984 4.85 -2.69
On the other hand, Turkey has significant amount of renewable energy potential (i.e.
hydro, wind, geothermal, solar power and biomass). Total renewable energy potential is
the second largest domestic sources after coal, which composes 10.2% of the total
primary energy sources according to 2007 statistics (Web 2). More than two third of
renewable energy supply belongs to biomass, mostly combustible renewables and
wastes. They are mainly used for heating in the residential areas. Hydropower
composes the remaining one third of the renewable energy supply. Even though wind
and solar energy have limited usage now, they are expected to increase in the near
future. Current proportion of geothermal, wind and solar energy production was only
1.6% in 2007. Total primary energy supplies in Turkey can be seen in Figure 2.1 (Web
2).

12
Figure 2.1 Total primary energy supply in 2007 (Web 2)
Various researchers have investigated RES in Turkey. One of the earliest studies was
conducted by Ediger and Kentel (1999) in order to identify renewable energy potentials
of Turkey. Particularly, biomass energy, hydro power, geothermal energy, solar and
wind energy were investigated. In conclusion, the shift from fossil fuels to RES was
considered a serious alternative for Turkey in order to lessen the environmental impacts
of current energy systems. In a more current study, Demirbas (2006) investigated the
renewable energy facilities of Turkey such as electricity generation from biomass,
hydropower, geothermal, wind and solar energy sources. In this study, biomass
cogeneration was considered as a promising method for producing bioelectricity. Yuksel
(2008) presented and overview of the reduction of greenhouse gas emission policies in
Turkey. These policies included energy pricing, promoting energy efficiency, and using
renewable energy sources. The paper concluded that supportive, realistic, and flexible
policies might aid to reduce the emissions and environmental degradation. Kaya (2006)
conducted a similar research about renewable energy policies in Turkey as well. The
renewable energy potential of Turkey, effective utilization of the potential, energy
politics, political organizations, incentive, pricing and buying mechanisms, research and
development studies, barriers for development of renewable energy were investigated
in the paper.

13
Turkey is one of the richest countries in the world in terms of geothermal potential. It is
in the first place among the European countries, and seventh in the world (Akpinar et
al., 2008). Over the past two decades, among the RES, Turkey has allocated the
highest level of funding to geothermal energy (IEA, 2006). Currently, there are 172
geothermal fields in Turkey and total capacity of these fields is 1229 MWt. Generally, it
is used for heating purposes in residential areas, and thermal facilities (Environment
Foundation of Turkey, 2006).
Currently, biomass and animal waste (67.4% of Total Primary Energy Supply) are the
main renewable sources consumed in Turkey. These are the main fuel for heating and
cooking in many urban and rural areas (Kaygusuz, 2002). However, their consumption
is expected to decline as oil, gas, coal, or electrical heating and cooking become readily
available (Evrendilek and Ertekin, 2003). The contribution of the biomass resources in
the total energy consumption dropped from 20% to 8% from 1980 to 2005 (Bilen et al.,
2008).
Even though gross water potential of Turkey is 234 km3, irregular flow condition of rivers
decreases the utilization of water resources. There are 26 hydrologic basins in Turkey.
Total economic hydroelectric potential of these hydrologic basins is identified as 127
billion KWh. On the other hand, total technical hydroelectric potential is identified as 216
billion KWh (Environment Foundation of Turkey, 2006). According to 2004 statistics %
35 of total economic hydroelectric potential (127 billion KWh) is being utilized, % 8 of
the economic potential is under construction and remaining potential is evaluated for
other projects (Web 3).
Wind and solar energy is the main topics of this thesis. Therefore these two types of
renewable energy sources, their potentials and applications in Turkey are explained in
detail in the following sections.
2.5. Wind Energy
Winds occur as a result of unequal distribution of solar heating around the world. The
speed and the direction of wind can be various according to the characteristics of
topography (Brower, 1992). Ackermann and Soder (2000) state that as other renewable
energy recourses, people have taken advantage of wind power for many centuries until
modern industrialization that caused people to deploy more reliable energy sources

14
such as fossil fuels. However, the oil crisis which occurred in the mid-1970s, made
countries to seek new energy sources in order to eliminate the dependency on fossil
fuels (IEA, 2006).
In implementing new energy sources such as wind power, reducing dependency on
fossil fuels was not the only concern of the countries. Another important contribution of
wind energy is its assistance in terms of decreasing CO2 emissions and environmental
protection (Caralis et al., 2008). Wind turbines do not release any atmospheric
emissions while generating power; nonetheless, there are also some negative impacts
on both society and ecology (IEA, 2003).
Many researchers have been working on various aspects of wind energy such as
economic benefits of wind energy, site selection procedures, environmental impacts,
etc. For example, Williams et al. (2008) applied an economic input/output analysis
together with Monte Carlo simulation in order to assess the economic benefits of
constructing and operating a wind energy system. Lothian (2008) studied the visual
impacts of wind farms in South Australia by conducting a multi participant survey.
Evaluation of wind energy systems using GIS tools became popular recently. Rodman
and Meentemeyer (2006) proposed an analytical framework by using GIS to evaluate
site suitability for wind turbines. The framework included rule-based spatial analysis
associated with different scenarios. The suitability criteria were based on physical
requirements, environmental and human impact factors. The study also included the
public perception in order to determine the acceptance level of wind farms by the public.
Another site selection study is conducted by Baban and Parry (2001). In that study, they
proposed two different approaches for the site selection of wind farms in the UK. Wind
farm location criteria were combined by using two different approaches. First, all the
layers were assumed to be equally important, therefore the equal weights were given to
all the criteria. In the second approach, the layers were grouped and graded from 0 to
10 according to their importance level. While 0 indicated the ideal locations, 10
represented unsuitable locations. The main goal of that study was to assist the decision
making process of wind farm site selection.
Wind potential of Turkey has been studied by General Directorate of Electrical Power
Resources Survey and Development Administration and wind energy atlas of Turkey is

15
developed (Web 4). Various researchers have as well worked on wind energy potential,
technological and economic aspects of wind energy. For example, Eskin et al. (2008)
evaluated wind power potential of Gökçeada Island in Turkey. Wind data were collected
and represented by Weibull probability density functions in order to produce wind speed
distribution curves. They concluded that Gökçeada Island has wind energy potential. In
a more recent study, Ucar and Balo (2009) identified the wind characteristic and wind
energy potential of the Uludag region in Turkey. First, the wind speed data were
collected. Then these data were analyzed by using Weibull and Rayleigh probability
density functions. Technical and economic assessments were conducted and finally,
three different wind turbines were selected and their electrical energy costs were
calculated.
Evaluation of different wind turbine technologies is another research topic. Durak and
Sen (2002) investigated the possibility of wind power application and wind turbine sites
for the Akhisar area of Turkey. Different wind turbine technologies associated with local
wind speed variations were evaluated. After suitable wind turbines were selected, their
locations were identified by WASP software. Ozerdem et al. (2006) worked on the
economic aspects of various characteristic wind turbines. They concluded that cost of
the electricity generation decreases as the installed capacity gets larger.
In this thesis, the aim is to combine environmental feasibility with the wind energy
potential through a MCDM process for the site selection of wind turbines. GIS and fuzzy
logic tools are used to achieve this goal and the proposed methodology for the site
selection process is applied for a study area which is composed of Uşak, Aydın, Denizli,
Muğla, and Burdur provinces in Turkey. Proposed site selection methodology which
includes combined utilization of GIS and fuzzy logic tools is a state of the art approach
and its application to the study area in the western part of Turkey demonstrated its
practical use.
2.5.1. Wind Energy in Turkey
First Wind Energy Potential Atlas was produced by Turkish State Meteorological
Service and General Directorate of Electrical Power Resources Survey and
Development Administration in 2002 (Environment Foundation of Turkey, 2006). It gives
a general idea about wind energy distribution in Turkey. According to the Wind Atlas,

16
Aegean, Marmara and the eastern parts of the Mediterranean regions of Turkey have
high wind potential at a height of 50 m. Today, it is assumed that current wind potential
of Turkey is 88000 MW and technical potential is 10000 MW (Environment Foundation
of Turkey, 2006).
First application of electricity generation from wind power was realized in 1985 in İzmir-
Çeşme (Environment Foundation of Turkey, 2006). According to 2009 data of General
Directorate of Electrical Power Resources Survey and Development Administration
(Web 1) there are 17 operational wind farms in Turkey (see Table 2.2). Most of these
wind farms are located in İzmir and İstanbul; however, the largest wind farm capacity is
120 MW and it is located in Balikesir – Samlı. In addition, there are 7 wind farms under
construction. Location and capacities of these wind farms can be seen in Table 2.3.
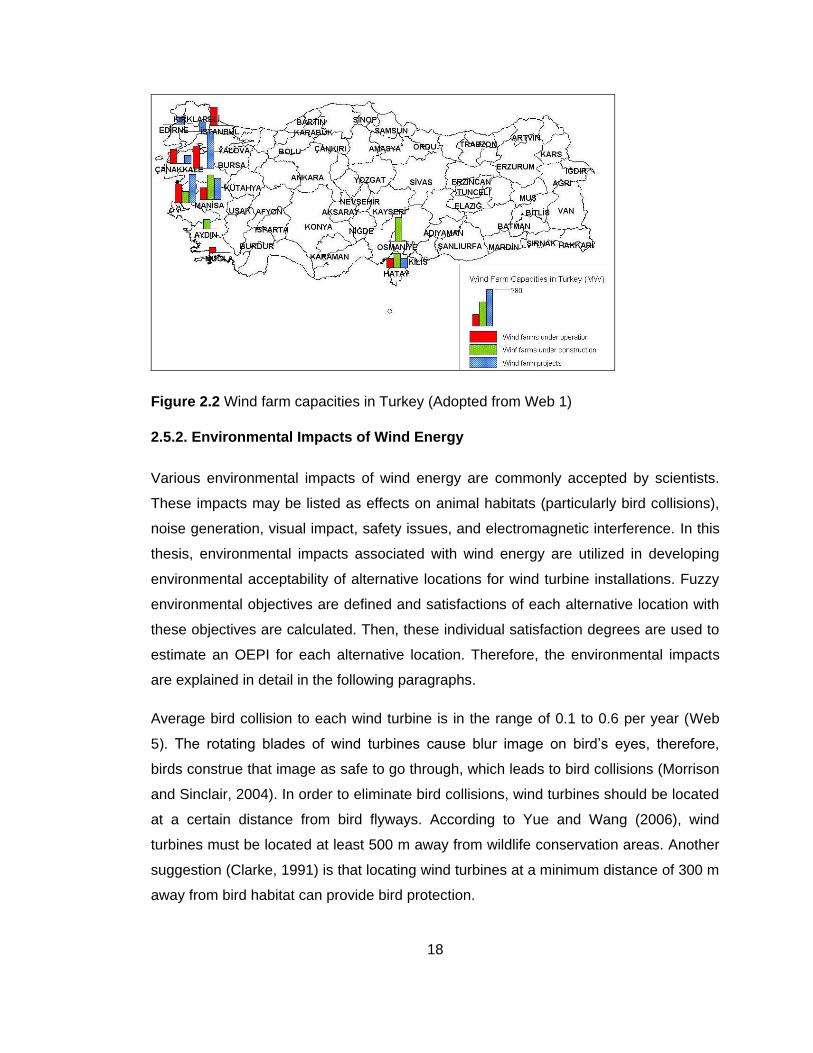
There are 15 projects with a turbine supply contract. As can be seen from Table 2.4,
most of these projects are located in Balikesir and İzmir (Web 1). Capacities of wind
farms under construction, operating wind farms and projects with a turbine supply
contract can also be seen in Figure 2.2. In addition, there are 117 new applications for
wind energy and 53 licenses were given to private companies (Web 1).
Table 2.2 Wind Farms under Operation in 2009 in Turkey (Adopted from Web 1)
Location Total Installed Capacity (MW) Number of Wind Farm
İzmir 90.4 4
Çanakkale 55.5 3
İstanbul 86.05 4
Balıkesir 120 2
Manisa 41.4 2
Hatay 30 1
Muğla 10 1
Total 433.35 17

17
Table 2.3 Wind Farms under Construction in 2009 in Turkey (Adopted from Web 1)
Location Total Installed Capacity (MW) Number of Wind Farm
Hatay 57.6 2
İzmir 37.5 2
Aydın 31.5 1
Manisa 140.8 1
Osmaniye 135 1
Total 402.4 7
Table 2.4 Wind Farm Projects with a Turbine Supply Contract in 2009 in Turkey
(Adopted from Web 1)
Location Total Installed Capacity (MW) Number of Wind Farm
Balıkesir 277.4 5
Tekirdağ 28.8 1
Çanakkale 20.8 1
Hatay 30 1
Manisa 115.6 2
Edirne 15 1
İzmir 180 4
Total 667.6 15
18
Figure 2.2 Wind farm capacities in Turkey (Adopted from Web 1)
2.5.2. Environmental Impacts of Wind Energy
Various environmental impacts of wind energy are commonly accepted by scientists.
These impacts may be listed as effects on animal habitats (particularly bird collisions),
noise generation, visual impact, safety issues, and electromagnetic interference. In this
thesis, environmental impacts associated with wind energy are utilized in developing
environmental acceptability of alternative locations for wind turbine installations. Fuzzy
environmental objectives are defined and satisfactions of each alternative location with
these objectives are calculated. Then, these individual satisfaction degrees are used to
estimate an OEPI for each alternative location. Therefore, the environmental impacts
are explained in detail in the following paragraphs.
Average bird collision to each wind turbine is in the range of 0.1 to 0.6 per year (Web
5). The rotating blades of wind turbines cause blur image on bird‘s eyes, therefore,
birds construe that image as safe to go through, which leads to bird collisions (Morrison
and Sinclair, 2004). In order to eliminate bird collisions, wind turbines should be located
at a certain distance from bird flyways. According to Yue and Wang (2006), wind
turbines must be located at least 500 m away from wildlife conservation areas. Another
suggestion (Clarke, 1991) is that locating wind turbines at a minimum distance of 300 m
away from bird habitat can provide bird protection.

19
A further impact of wind energy on habitat is noise. Although there are some regulations
in terms of acceptable noise levels which depend on perception of communities, it is not
easy to establish common noise principles (Wrixon et al., 1993). Different authorities
have different noise criteria, one of which claims that wind turbines should be located at
least 400 m away from nearest habitat (IEA, 1987). In addition, other authorities such
as Tester at al. (2005); Ramirez-Rosado et al. (2008); Yue (2006) stated that wind
turbines should be located at least 500 m away from nearest habitat.
Visual impact, another side effect of the wind turbines, varies between individuals.
According to Ramirez-Rosado et al. (2008) since the wind energy is constructing the
clean energy image, some people might enjoy seeing them; on the other hand, the
other people might consider it has adverse impacts on urban landscape. Baban and
Parry (2001) stated that wind turbines should be located 2000 m away from large
settlements because of aesthetic concerns.
Even though a number of serious accidents have occurred, the safety record of wind
energy is generally good that most of the accidents are due to poor management or
noncompliance with safety regulations (Wrixon et al., 1993). Voivontas et al. (1998)
suggested that minimum distance from towns must be 1000 m for safety reasons and
the same criteria is valid for reducing the visual impact as well. Nguyen (2007) studied
wind energy in Vietnam and concluded that a 2000 m buffer zone around city centers is
unsuitable for wind development because of safety and visibility considerations.
According to Nguyen (2007), one other restriction that needs to be taken into account
while selecting the location of wind turbines is their proximity to airport areas due to
safety and visibility reasons. Nguyen (2007) suggested that wind turbines should be at
least 2500 m away from the nearest airport area. In addition, General Directorate of
Civil Navigation in Turkey sets some restrictions about structures around airports.
Basically, these restrictions aim to protect flight security, human lives, and property. In
the first 3000 m zone there should not be any structure such as hospitals, schools or
common buildings that may cause reflection. Buildings that are less than 45 m height
are allowed with in the second 3000 m zone (General Directorate of Civil Navigation,
2007).
20
Moreover, wind turbines cause electromagnetic interference by scattering the
electromagnetic waves from navigation and telecommunication systems (IEA, 2003).
Although television and radio signals may be affected by wind turbines which are
located in a 2-3 km zone around the largest installation, today, cable networks or line-
of-sight microwave satellite transmissions are eliminating the electromagnetic
interference effect of wind energy (IEA, 1987).
2.6. Solar Energy
Solar energy is another ancient energy resource which had been used through the
history. One of the earliest developments on solar technology was made by Lavoisier
who achieved to construct a 1700˚C solar furnace in the eighteenth century (Tester et
al., 2005). Today, wide ranges of solar technologies are available such as solar thermal
heating systems, solar PV systems, and solar buildings (Brower, 1992).
Solar PV systems allow generating power via PV cells which take advantage of solar
radiation. Solar thermal heating systems, on the other hand, produce hot water and
electricity by flat plate collectors or solar thermal electric plants (IEA, 2008). Solar
buildings may have passive or active systems. Rationale of passive systems is to
design the buildings more efficiently so that the building can exploit from sunlight
(Brower, 1992). The difference between active and passive systems is that active
systems deploy the collector in order to utilize the solar energy (Tester et al., 2005).
A vast amount of research has been conducted about solar energy in recent years. The
researches emphasize mostly on, feasibility, environmental impacts and economic
aspects of solar energy systems. For example, Paoli et al. (2008) compared
conventional energy systems with thermal and PV power plants. The study stressed out
the energy efficiency of solar power technologies. Martins et al. (2008) investigated the
feasibility of the solar energy applications for electricity generation in Brazil. Solar
energy potential was evaluated by using SWERA database. The study concluded that
the grid connected PV systems can provide an important contribution to current energy
system.
Economical and environmental feasibility of solar systems are other popular research
areas. Bhuiyan et al. (2000) worked on economic feasibility of stand-alone PV power
systems in rural areas of Bangladesh. The study presented the life cycle cost of PV

21
systems for rural areas. The analyses indicated that PV systems are economically
feasible in remote areas of Bangladesh. Tsoutsos et al. (2005) presented an overview
of potential adverse impacts of solar energy systems on the environment. These
impacts were identified as noise and visual intrusion, greenhouse gas emissions during
manufacturing, water and soil contamination, energy consumption, labor accidents,
impacts on archaeological sites or on sensitive ecosystems. Carrion et al. (2008)
proposed an environmental decision support system for site selection of grid-connected
PV power plants. Multi-criteria analysis and Analytic Hierarchy Process (AHP) were
used to identify optimal sites in GIS environment.
Solar energy research in Turkey is mainly conducted by General Directorate of
Electrical Power Resources Survey and Development Administration, Turkish State
Meteorological Service, The Scientific and Technological Research Council of Turkey
(Web 6). In addition, various researchers worked on solar energy potential in Turkey,
and performance of solar energy systems. For example, Bulut and Büyükalaca (2007)
proposed a model in order to estimate the daily global radiation. This model was
expected to provide guidance for designers of energy related systems. Sozen et al.
(2004) studied the solar-energy potential in Turkey using artificial neural-networks
(ANNs). Kurklu et al. (2002) developed a new type of solar collector and tested its short
term thermal performance. In another very recent study, Muneer et al. (2008)
investigated potentials and limits of solar thermal applications in Turkish textile industry.
It was discussed that adaptation of new instruments would assist to overcome the
obstacles. In addition, detailed life cycle assessment and economic aspects of solar
water heater was presented in the study.
Site specific solar systems studies have also been carried out by various researchers in
recent years. Yumrutas and Kaska (2004) investigated the performance of experimental
solar assisted heat pump space heating system located in Gaziantep, Turkey. Ulgen
(2006) examined the tilt angle of solar collectors in order to determine optimum tilt angle
in İzmir, Turkey. Estimation of the total global solar radiation on a tilted surface was
accomplished by using a mathematical model. Celik (2006) investigated the current
status of PV energy and evaluated the techno-economic feasibility of grid-connected PV
systems in Turkey, Ankara. An hourly basis simulation was conducted to estimate the

22
performance of the PV systems. Analyses indicated that theoretically designed grid-
connected PV system is more expensive than the grid electricity.
In this thesis, different environmental acceptability and economic feasibility are
investigated for solar PV systems to identify priority sites for solar power plant
installations in the western part of Turkey. The study area is composed of Uşak, Aydın,
Denizli, Muğla, and Burdur provinces. Environmental acceptability and economic
feasibility are combined in GIS environment using fuzzy MCDM procedure.
2.6.1. Solar Energy in Turkey
Geographical location of Turkey allows utilization of solar energy. While annual average
solar radiation is 3.6 kWh/m2-day, total radiation period is approximately 2640 hours,
monthly solar energy values are given in Table 2.5. According to the solar energy
evaluations South Eastern Anatolia Region has the highest solar energy potential and
Mediterranean Region has the second highest solar energy potential in Turkey.
Table 2.5 Monthly average solar energy values in Turkey (Web 6)
Months Monthly Total Solar Energy (3,6 kWh/m
2-day)
Insolation duration (hour/day)
January 51.75 103
February 63.27 115
March 96.65 165
April 122.23 197
May 153.86 273
June 168.75 325
July 175.38 365
August 158.40 343
September 123.28 280
October 89.90 214
November 60.82 157
December 46.87 103
Total 1311 2640
Average 3.6 7.2
However, in order to ensure better solar energy potential values, General Directorate of
Electrical Power Resources Survey and Development Administration and Turkish State
Meteorological Service have been collecting the solar values since 1992. As a result of

23
ongoing measurements, actual solar energy potential in Turkey is expected to be more
than 20-25% previous values (Web 6). In addition, today, General Directorate of
Electrical Power Survey and Development Administration provides solar energy
potential atlas which enables to visualize the geographic distribution of solar energy
potential (Web 7). In spite of this high potential, solar energy generation is only realized
by flat plate solar collectors. They are mostly employed in the sunny coastal regions in
order to produce domestic hot water (Kaygusuz and Sari, 2003).
There are other solar energy devices such as PV modules and solar collectors that
enable electricity generation from solar power. Because of the high cost of these
applications, they are only used by the Ministry of Environment and Forestry for forestry
observation towers, Turkish Telecommunication Companies for transfer stations, the
Highway Board Department for emergency calling, traffic management systems,
General Directorate of Electrical Power Resources Survey and Development
Administration for demonstration applications and various research associations (most
of which are off-grid) in Turkey (Ozgur, 2008).
2.6.2. Environmental Impacts of Solar Energy
Even though solar energy systems may provide clean and safe energy to the public and
industries, similar to any other manmade project, solar energy systems have certain
impacts on the environment. Most specific environmental concerns associated with
these systems depend on dimensions (size and nature) of the projects that generally
cause loss of amenity (Tsoutsos et al., 2005).
Different solar energy systems have different kind of impacts on the environment. For
example, PV systems do not generate any noise or chemical pollutants during
utilization (Tsoutsos et al., 2005). However, other environmental concerns most of
which are related to their life-cycle exist for PV systems. These concerns are air
pollution generated during transport, manufacturing and waste management PV
modules after decommissioning. On the other hand, direct impacts of PV systems are
related to land use, and visual impact (Tsoutsos et al., 2005).
Visual impact is highly depending on the surroundings of the PV systems. If PV
modules are deployed near the area of natural beauty, visual impact on this area will be
inevitable (Tsoutsos et al., 2005). In addition, there are further restrictions which are set

24
by General Directorate of Civil Navigation in order to provide flight security. For
example, in the first 3000 m zone there should not be any structure such as hospitals,
schools or common buildings that may cause reflection. Buildings that are less than 45
m height are allowed with in the second 3000 m zone (General Directorate of Civil
Navigation, 2007).
Impact of PV systems on land use depends on the area of land covered by the PV
systems, the type of the land (cultivable land might be damaged by large scale
installations), and distance from areas of natural beauty or sensitive ecosystems, and
the biodiversity (Tsoutsos et al., 2005). In addition, agricultural lands in Turkey are
protected by Soil protection and Land Use Law (Law number: 5403). According to
Turkish Soil protection and Land Use Law, agricultural area must be protected in order
to sustain natural functions of the land. However, if there is not any alternative location
for certain facilities such as defense, oil and natural gas research, mining activities for
public interest, temporary places after emerging natural disasters, agricultural lands can
be used for development (Law number: 5403).
Carrion et al. (2008) developed an environmental decision support system for the site
selection of grid-connected PV modules. Environmental, orography, location, and
climate criteria are used to identify priority sites. These criteria are subdivided into
factors; in environmental criterion, there are two factors which are land use, and visual
impact of PV modules. Land use restrictions are based on environmental protection
laws.
According to Carrion et al. (2008) land use restrictions are based on environmental
protection laws. Mostly preferable locations for PV systems are fields without
vegetation. Environmental protection laws in Turkey are associated with forest areas,
national parks, natural protection zones, coastline and wetlands. According to the
Forest Law in Turkey, any kind of construction in forest area is forbidden. However,
Ministry of Environment and Forestry can allow constructions for defense,
infrastructure, communication, oil research, natural gas, solid waste disposal
institutions, if these activities are highly necessary to build on forest areas for public
interest (Law number: 6831).

25
Similar to forest areas, constructions at national parks are restricted by legislation in
Turkey. According to National Parks Legislation, the structures which have adverse
impacts on habitat cannot be built on national parks since these areas have to be
preserved. Only the structures for visitors, management and research are allowed
(Official journal number: 19309). In addition, national protection zones are identified
with respect to Environmental Legislation and international conservation agreements in
order to protect the natural assets and take precautions to decrease environmental
degradation. These areas are considered ecologically sensitive and only constructions
which are compatible with the nature such as restaurants, shops, maintenance and
repair facilities etc. are allowed (Official journal number: 20341).
PV systems have another adverse impact on ecosystem which is related to release of
toxic and hazardous materials. Since PV modules contain toxic and hazardous
materials, abnormal plant operations may cause the discharge of these toxic materials
into the environment. However, proper site selection by taking into account of flora and
fauna on the adjacent areas can decrease the risks (IEA, 1998). Therefore, wetlands
need to be considered for the site selection of PV systems, since they have high
ecological values and biodiversity. According to the Legislation of Wetlands, there must
be at least 2.5 km buffer zone to protect ecological and topographic features of these
areas (Official journal number: 21937).
There are further restrictions about coastal zone in Turkish Law (Law number: 3621).
According to the legislation, coastal zone is divided into two zones. The first 50 m zone
is allocated to green belts, and recreational areas. The second 50 m zone is for small
scaled touristic places, roads, open car parks, and treatment facilities (Official journal
number: 21374).
Other solar energy systems, such as solar thermal heating systems, solar thermal
electricity, have land use and visual impact considerations as well. In addition, solar
thermal systems are using coolant water in order to generate electricity. This may lead
to pollution of water resources during thermal discharges. Coolant water contains liquid
water or molten salts therefore; release of these materials might induce a health hazard
(IEA, 1998). Since PV systems are investigated in detail in this thesis, other solar
energy systems are not explained further here.

26
2.7. Hybrid Energy Systems
As energy demand is increasing around the world, RES such as solar PV systems and
wind energy had become more important (Ahmed et al., 2009). Even though RES are
attractive options for energy sectors, the main disadvantage of these systems is their
dependence on weather and climatic conditions. However, this problem can be dealt
with integration of two or more RES which is called a hybrid system. Thus, the
weakness of one system might be compensated by the strengths of the other sources
(Hongxing et al., 2009).
There are many studies in the literature providing examples of hybrid RES. For
instance, Liu and Wang (2009) discussed the current energy status in China and
presented an application of wind–solar energy hybrid generation systems in China. The
study verified that wind-solar hybrid systems can moderate the inconsistent outcome
due to the weather and climatic changes. Celik (2002) compared PV–wind hybrid
energy systems with single PV and wind systems with respect to techno-economic
conditions of these systems. The study presented that performance of an optimum
combination of the hybrid PV–wind energy system is better than either single system.
Reichling and Kulacki (2008) proposed a model for the performance of a hybrid wind-
solar power plant in Minnesota. Economic feasibility of hybrid plants were compared to
wind farms and concluded that the wind-solar hybrid plants provide financial benefits.
Ulgen and Hepbasli (2003) investigated power generation from solar-wind hybrid plants
in Izmir, Turkey. First, a model was developed to identify wind, solar and hybrid power
resources. Then, hourly, daily, and monthly analyses of solar and wind power
integration were carried out. As a result, it was concluded that hybrid systems could
contribute to more efficient utilization of these resources.
2.8. Environmental Management and GIS
Environmental research and policy-oriented environmental management are both
related to geographic framework. Clearly, high proportion of the required data for
environmental management is geographic data. Recently, significance of computational
applications in GIS has been increasing in this field. Environmental management
applications have been great contributor in the development of GIS throughout its

27
history. Moreover, GIS and geographic data are indispensible for research, teaching
and policy making in environmental disciplines (Goodchild, 2003).
Contribution of GIS to environmental management varies according to the purpose. GIS
may be used just as a provider of information or as a true analytical instrument. At the
lowest sophistication level, GIS is a tool in order to produce visual maps for decision-
makers and researchers. In a more sophisticated way, it allows to conduct fully
integrated information systems which can be a sufficient decision making tool
(Rodriguez-Bachiller and Glasson, 2004). For example, GIS applications in
environmental management have been used for environmental monitoring by using
satellite images such as the Land Cover Maps of Great Britain (Fuller and Groom,
1993) and monitoring wetland changes in East Africa (Haack, 1996). Some mapping
systems provide combination of environmental data with related information such as,
the promotion of sustainable tourism in the Mediterranean region (Giavelli and Rossi,
1999), or mapping the biomass distribution by using ecological data in Southern New
Mexico (Phinn et al., 1996).
More specifically, GIS can be linked to external models for environmental management
which is one of the most popular applications of GIS (Rodriguez-Bachiller and Glasson,
2004). Environmental modeling is an essential field of scientific research in order to
assess and predict the impacts of human activities on environment. For example large-
scale industrial, energy, construction, water resources, or agricultural projects may have
impacts on the environment. As can be seen, most of the environmental problems are
related to spatial dimensions and spatial data are the basic elements of GIS. It is
obvious that integration of these two fields of research is a promising idea (Fedra,
1993).
GIS can assist at different stages in order to construct different environmental models,
sometimes at the design stage or the estimation stage (Rodriguez-Bachiller and
Glasson, 2004). For example, Johnston et al. (1996) used GIS to model ecological
processes, Arsenau and Lowell (1992) constructed a model for monitoring the forests,
McKenney et al. (1999) standardized a model for solar radiation by using a Digital
Elevation Model. Coskun and Alparslan (2009) proposed an environmental model to
investigate the temporal changes of land use and water quality changes of Omerli
Watershed in İstanbul, Turkey. Remote sensing and GIS techniques were used to

28
analyze water quality and land use assessments as well. Brown and Affum (2002)
proposed a GIS-based environmental modeling system in order to identify the
environmental impacts of road traffic plans. It is suggested that using this model might
assist planners to test both environmental impacts associated with transportation plans
and efficiency of network plans. Store and Jokimaki (2003) developed a method to
generate integrated habitat suitability index which is based on GIS. This method
enables to produce spatial ecologic information associated with habitat requirements of
different species. Mas et al. (2004) proposed a model in order to predict the spatial
distribution of tropical deforestation. Satellite images were used to generate
deforestation risk assessment maps.
As a result, GIS is an essential tool in environmental management. Even though it is not
the only computer application associated with this field, it plays a vital role in the
development of environmental policy and environmental decision making (Goodchild,
2003). Thus GIS tools are used in this thesis to evaluate economical and environmental
feasibility of alternative locations for wind and solar energy generation systems.
2.9. Spatial Decision Support Systems
Basic problems which have specific solution methods are easily solved by using GIS
tools; however, when problems become complicated, the simple logic may not be
enough for the solution. DSSs are developed to resolve more complex situations, and
GIS is used as the DSS development platform to satisfy such needs (Rodriguez-
Bachiller and Glasson, 2004).
Spatial decision making problems do not always have to be structured or unstructured
in real world but may lie on somewhere between these two extreme cases. These
decisions are called semi-structured. Cooperation between computer-based systems
and decision makers is required in semi-structured decisions. Most of the real life
spatial decision problems are semi-structured (Malczewski, 1999). Spatial Decision
Support Systems (SDSSs) can cooperate and organize all of the activities and interests
with respect to decision maker‘s purpose. Such a system simplifies the interaction of
ideas, evaluation of results and decisions. In other words, it assists to share the
information among decision makers and consideration of the multiple criteria in a more
organized and logical way (MacDonald and Faber, 1997). The DSS developed in this

29
thesis is a semi-structured decision support system. The model which is developed in
ArcView 3.3 model builder allows some tasks to be programmed, since the processes
through the solutions are not repeated regularly and each stage of the process is
different than another. However, user input is required to accomplish the remaining
tasks.
GIS can provide a wide range of analyses and visual demonstration of the cartographic
data. Nevertheless, it does not assist the user to select the suitable functions for a
certain purpose, or to interpret the results (Seffino et al., 1999). Considering spatial
decision processes, a series of tasks are required in order to obtain results. First of all,
decision makers need to construct the database relations and models, determine the
appropriate modeling strategies, select the related data sets, and decide the analyses
flow. Finally results of analyses can be demonstrated and solutions of the problems can
be interpreted (Zhu et al., 1998). GIS can contribute to SDSS by generating different
kinds of maps associated with the choice of a given set of models and decision
procedures (Seffino et al., 1999). However, additional modeling tools for more complex
analytical methods can turn GIS into a well-developed SDSS (Silva and Eglese, 2000).
Many researchers have been trying to develop SDSS models using GIS. For example,
Dragan et al. (2003) propose a SDSS in Ethiopia. The study is based on determining
new locations of crops with respect to their capacity in order to reduce soil erosion. GIS
software IDRISI 32 is used to develop SDSS and the direct involvement of local
stakeholders is used to identify constrains and factors. Banai (2005) suggests a SDSS
prototype based on land resource sustainability for urban development. MCDA and
analytical hierarchy process are used together within GIS environment. This prototype
includes public policies and sustainability criteria in order to identify the best locations
for future sustainable urban development. Chang et al. (2008) conducted a two staged
study. First, they developed a SDSS for waste management in south Texas using GIS
functions to produce thematic maps. Then, they used fuzzy MCDM as a tool to
represent the environmental, biophysical, ecological, and socioeconomic variables.
Sikder (2009) proposed a knowledge-based decision support system in order to
indentify the adaptability of crops at a given agro-ecological zone. A flexible interface
was produced in GIS which leads to an increase in efficiency in crop management and
land use planning. In a very recent study, Lejeune and Feltz (2008) developed a

30
decision support tool in GIS to assess environmental and landscape constraints
associated with wind farms. In this study, 40 environmental and landscape criteria and
three constraint levels (exclusion, highly sensitive and sensitive) were identified in order
to obtain the overall constraints map for wind energy constructions in Belgium.
In this thesis, a spatial decision support tool was developed in GIS environment to
identify the feasible locations for future wind and solar energy development. Various
layers were created according to environmental objectives and economical feasibility
criteria. In addition, several GIS tools were produced to assist decision makers to
facilitate the decision process.
2.10. Multi-criteria Decision Analysis (MCDA)
Either individuals or a group of people faces with spatial decision making in everyday
life. Choosing a new development area, selecting a new residential area, or managing
the infrastructure system requires spatial organization. Most of the individual spatial
decisions are made by taking into account the heuristics or the past experiences.
However, more reliable and analytical methods are needed for organizations to support
spatial decision making (Jankowski et al., 2001).
The rationale of MCDM models is based evaluation of multiple criteria to find a solution
of a problem with multiple alternatives. These alternatives can be evaluated by their
performance characteristics, in other words, decision criteria (Jankowski et al., 2001).
Basically, MCDM enables the decision maker to evaluate a set of alternatives according
to conflicting and incommensurate criteria. A criterion is a generic term which may be
constituted by both attributes and objectives. Therefore, MCDM can be classified into
two groups: Multi-attribute decision making (MADM) and multi-objective decision
making (MODM) (Malczewski, 1999).
In the MADM approach, each alternative is evaluated with respect to various attributes
and final choices are made among potential alternatives. On the other hand, MODM is
based on the decision maker‘s objectives which can be a statement about the desired
state of the system. Several different attributes might represent objectives. In other
words, MODM problems deal with the objectives which require establishing specific
relationships between attributes of the alternatives (Malczewski, 1999).

31
Further classification depends on decisions under certainty and decisions under
uncertainty. If decision makers have adequate knowledge about all the variables and
parameters of the problem, the decision can be classified as decision under certainty
which is also called deterministic decision-making. However, many real world decisions
are very complex to be deterministic. Thus decision associated with a problem involving
random and uncertain variables, and vague or incomplete data are considered as
decision under uncertainty. Two types of uncertainty may exist in a decision situation:
uncertainty due to vague, incomplete or limited information or variability due to
randomness. As a result, both MADM and MODM problems can be classified further
into probabilistic and fuzzy decision making problems. Probability theory or statistics are
used to solve problems involving random variables. On the other hand, fuzzy set theory
tools are used to solve problems that involve vague and incomplete data. Presence of
incomplete information leads to results that may not be represented by crisp numbers
but rather with degrees. These types of problems are handled with fuzzy sets theory
(Zadeh, 1965).
As mentioned before, MCDM provides solutions to decision problems which have
multiple alternatives. Decision rules are used to choose the most preferred alternative
between several options. In other words, decision rule is a course of action that allows
selecting best alternative from a set of alternatives. This procedure provides overall
assessment of alternatives by integrating the data and decision maker‘s preferences
(Malczewski, 1999). Although significant numbers of decision rule approaches are
presented in the literature, there are limited applications of combined utilization of GIS
and MCDM. The weighted summation, ideal/reference point, and outranking methods
are the examples of such approaches which allow integration of MCDM and GIS
(Malczewski, 2006).
One of the widely used decision rules is AHP which can be used in two different ways in
GIS environment. In the first approach, weights are assigned to each attribute map
layer, and then weights are aggregated by using weighted additive combination
methods. This method is more practical if large numbers of alternatives are involved
(Eastman et al., 1993). In the second approach, the AHP principle is used to aggregate
the priority for all level of hierarchy structure including the level of representing
alternatives. In this case, small number of alternatives is needed (Jankowski and

32
Richard, 1994). There are many examples in the literature about AHP. For example, Hill
et al. (2005) investigate the new methods for selecting suitable sites for various land
uses in Australia. MCDA and AHP are combined and used to determine biophysical,
economic and infrastructure suitability of land use. New interfaces are produced in the
ArcInfo Grid GIS environment. In another very recent study, Ercanoglu et al. (2008)
used AHP to assess landslide vulnerability in the West Black Sea Region of Turkey.
Ying et al. (2007) used AHP with GIS in order to evaluate eco-environment information
system in Hunan Province, China. The aim of this study was to identify regional
features of eco-environment and main environmental problems of the study area.
Natural environment, disaster, environment pollution and social economy factors were
proposed as evaluation index system. As a result, the regional eco-environmental
information system database and evaluated the eco-environmental quality of Hunan
Province were established.
Another method which allows combined utilization of MCDM and GIS is the ideal point
approach. The ideal point approach is based on the set of alternatives which are
ordered with respect to their separation from an ideal point. This point corresponds to a
hypothetical alternative (decision outcome). The best alternative is the closest to the
ideal point. The ideal point approach is an attractive methodology if relationships
between attributes are complex to verify or test (Malczewski, 1999).
One of the most popular GIS-based MCDA approach is the weighted summation
method. The main reason of its popularity is that the approach is easy to understand
and apply within GIS environment, therefore, very appealing for decision makers. This
method has usually been employed together with Boolean operations. OWA approach
provides an extension and generalization of the Boolean operation and the weighted
summation procedures (Malczewski, 2006). In this study, together with ―and‖ and ―or‖
operators for aggregation of individual satisfaction degrees into an overall satisfaction
value, the OWA operator is used as well.
OWA is a general aggregator operator which includes three different types of
aggregation operators: (i) ―and‖ operator which refers to the intersection of fuzzy sets,
(ii) ―or‖ operator which refers to the union of fuzzy sets; and (iii) the averaging operator
(Tabesh, 1992; Eastman et al., 1993). Most commonly used aggregation operators are
―and‖ and ―or‖ operators and they are used to represent two extreme cases:

33
―Satisfaction of all the desired criteria‖ and ―Satisfaction of any of the desired criteria‖,
respectively (Yager, 1988). However, in some cases, decision makers may want to
perform an aggregation which lies in between these two extreme cases. For such
situations, Yager (1988) proposed the OWA function which combines ―and‖ and ―or‖
operators and refers to it as the ―orand‖ operator. The rationale of this application is to
aggregate the attributes not by classical weighted average but by ordered position of
the attributes.
OWA aggregation method has been used by researchers on various types of decision
making problems. For example, Makropoulos and Butler (2006) proposed an extended
version of OWA method, called spatial ordered weighted averaging. This method was
applied on water supply network and the problem is defined as vulnerability to leakage.
Boroushaki and Malczewski (2008) used OWA and AHP together in a hypothetical site
suitability problem in order to identify the best parcel for development. Valente and
Vettorazzi (2008) integrated OWA into GIS to identify priority sites for forest
conservation in Brazil. AHP was also used in this study to assign the importance to
each criterion. These criteria are proximity to forest patches; proximity among forest
patches with larger core area; proximity to surface water; distance from roads; distance
from urban areas; and vulnerability to erosion. It is concluded that the OWA method is
flexible and easy, in addition, it provides a better understanding of the alternative land-
use suitability patterns. Bell et al. (2007) proposed GIS-based OWA in order to analyze
spatial distributions of local health outcomes. GIS was used to construct the index, and
OWA was used to validate deprivation indices that were constructed using more
qualitative data sources. Yanar (2003) integrated fuzzy logic system into ArcGIS
software in order to allow users to include linguistic quantifiers into GIS-based spatial
analyses. The proposed system assists to approximate complex ill-defined problems in
decision-making processes.
Decision making using fuzzy set theory tools has been used in various research areas.
OWA is one of the most widely used tools of fuzzy set theory. However, combined
utilization of OWA and GIS tools does not have too many applications. In this thesis,
―and‖, ―or‖, and OWA operators are used to aggregate fuzzy environmental objectives
and economical feasibility criteria in GIS environment. The proposed approach enables

34
evaluation of both environmental and economical criteria and construct of suitability
maps according to preferences of decision makers.

35
CHAPTER 3
METHODOLOGY
In this section, methodology of the study is explained comprehensively for the site
selection procedures proposed for wind turbines and solar power plants. The flowcharts
of the proposed methodologies are given in Figure 3.1.
First, environmental objectives and economical feasibility criteria for wind and solar
energies are identified. Then, morphological features of the study area which are spatial
distribution of wind and solar energy potentials, vector data (i.e. boundaries, water
bodies, coastline, forest areas, agricultural areas, national protection zones, national
parks, airports, urban and rural areas, transmission lines, bird migration paths, etc), and
raster data (i.e. slope) are collected and processed in order to obtain spatial data
layers. The next step is representation of environmental objectives as fuzzy sets for
both solar and wind energy. Individual satisfaction degrees of each alternative location
with respect to the identified environmental objectives are computed in GIS using
membership functions of these objectives. Then, OEPI are calculated for each potential
location by aggregating individual satisfaction degrees of each environmental objective.
Spatial MCDM, specifically ―and‖, ―or‖, and OWA aggregators are used to combine
individual satisfaction degrees.
The procedures used for evaluating potentials of wind and solar energies are slightly
different. For wind energy, in addition to environmental objectives, acceptability in terms
of wind energy potential is represented as a fuzzy set. Sufficient wind energy potential
map is produced in GIS using the membership function of this fuzzy set. On the other

36
hand, for solar energy, together with solar energy potential map, various other criteria
such as slope of land, proximity to transmission lines and urban areas - all together
referred to as economical feasibility criteria - are taken into account for assessment of
suitability of each alternative location for a solar power plant. Hence, each one of the
economical feasibility criteria is represented by a fuzzy set. Then, the individual
satisfaction degrees of each economical feasibility criteria are aggregated into an
OSEPI by using spatial MCDM. Finally, for wind energy, the OEPI is combined with the
sufficient wind energy potential map to generate priority sites for wind turbine
installations while for solar energy, the OEPI is aggregated by the OSEPI and priority
sites for solar power plants are identified. After priority site maps of solar power plants
and wind turbines are obtained, these two maps are overlaid to identify suitable
locations for hybrid RES (i.e. RES composed of both wind turbines and solar power
plants).

37
Fig
ure
3.1
Meth
od
olo
gy o
f th
e s
tudy

38
3.1. Identification of Environmental Objectives and Economical Feasibility
Criteria
As the first step (see Figure 3.1), environmental objectives associated with solar and
wind energy generations are identified through a detailed review of literature and
current Turkish laws and legislations. Environmental regulations associated with
national parks, noise management, wetland protection, airports, and coastline are
investigated. Restrictions with respect to these regulations are utilized to identify
environmental objectives and these objectives are quantified with certain criteria. The
details of this process for solar and wind energies and identified environmental
objectives are provided in Section 4.2.1.1 and 4.3.1.1 of this thesis, respectively.
In addition to environmental objectives, energy potentials need to be evaluated in
determining suitable locations for RES, as well. Wind and solar potentials of alternative
locations are determined through literature review and interviews with the General
Directorate of Electrical Power Resources Survey and Development Administration.
Additional economical feasibility criteria related with solar energy generation are
identified from previous studies as well. The details of this process and economical
feasibility criteria are provided in Section 4.2.1.1 of this thesis. It should be emphasized
here that additional environmental objectives and economical feasibility criteria may be
identified in accordance with specific site conditions, energy policies, selected
technologies, specific requirements of the country, etc. New criteria can easily be
included in the analysis through the proposed methodology as long as required data
exists and is available for the analysis.
3.2. Data Collection and Processing
Since, evaluation of the identified environmental objectives and economical feasibility
criteria require various geographic data, the second step involves data collection and
processing (see Figure 3.1). Study area boundaries, wind and solar energy potentials of
the study area, settlement areas, roads, water bodies, slope, bird migration paths,
natural reserves, airports, transmission lines, are among the collected spatial data.
Solar and wind potential atlases for Turkey were developed by the General Directorate
of Electrical Power Resources Survey and Development Administration. Wind energy

39
potential atlas provides wind resources information at 50 m height. This potential map
was generated by using global atmospheric circulation model, medium-scale numerical
weather model and the micro-scale wind flow analysis model (Web 4). On the other
hand, solar potential atlas was produced according to solar radiation values which were
collected between 1985 and 2006. This model was produced by using GIS ―ESRI Solar
Radiation Model‖ (Web 7).
Data concerning natural reserves (i.e. national parks, natural protection zones, forests,
wetlands) of study area are collected from several government institutions. National
park boundaries, forest areas, and wetland protection zones are acquired from the
Ministry of Environment and Forestry. Data concerning agricultural lands within the
study area are obtained from Ministry of Agriculture and Rural Affairs. In addition,
latitude and longitude of national protection zones are declared in the official journals
(Official journal number: 20702, 26371, 24055, and 26551) are utilized. This data is
obtained in point format and converted to regions in GIS environment. Similarly latitude
and longitude of wind turbines within the study area which were declared by Energy
Market Regulatory Authority (Web 8) are converted to point data in GIS environment.
Other data, including transmission lines, settlement areas, roads, city and district
boundaries, water bodies, rivers, airports, slope, and bird migration path, were obtained
from the Basarsoft Company and previous individual studies. Detailed information about
the collected data is given in Table 3.1. As can be seen in Table 3.1 required data are
obtained in different data formats. These data are transferred into ESRI Shapefile in
order to be used in ArcGIS 9.2. which has the capabilities to conduct the required
analyses.

40
Table 3.1 Content of the required data.
Data Data format Obtained from Scale
Solar and wind potential atlases
MapInfo TAB General Directorate of Electrical Power Resources Survey and Development
Administration
Cellsize: 500 m
National park boundaries, wetland protection zones
ESRI Shapefile Ministry of Environment and Forestry
1:25 000
Forest areas Geodatabase Ministry of Environment and Forestry
1:100 000
Agricultural area ESRI Shapefile Ministry of Agriculture and Rural Affairs
1:100 000
National protection zones Latitude Longitude
Official journal number: 20702, 26371, 24055, and 26551
Latitude Longitude
Transmission lines, settlement areas, roads,
boundaries, water bodies, rivers, airports
MapInfo TAB Basarsoft company Vector data
Operating wind turbines Latitude Longitide
Energy Market Regulatory Authority
Latitude Longitude
Bird migration path ESRI Shapefile Arikan, 2009 1:250 000
Slope ESRI grid Arikan, 2009 Cellsize: 100 m
MCDM procedure allows evaluation of various alternatives with respect to a number of
criteria. Thus, alternatives need to be identified first. In this thesis, the alternative
locations are identified as follows: The whole study area is divided into 250 m by 250 m
grids and each grid represents an alternative location for the power plant installation.
The main reason for selecting this grid size is that scales of the obtained data are not
suitable for a finer grid. In other words, while distance between each grid decreases,
data accuracy decreases as well. The accuracy of the results is dependent while the
utilization of the proposed methodology is not dependent on the grid size. When finer
data becomes available a finer grid can be used. Another important parameter in
selecting the grid size is the time required for the computations. When finer grid is used
computation time increases significantly. In addition to these factors, distances required

41
by the environmental objectives and economical feasibility criteria are also considered
in selecting the grid size. If finer data is available, there are not any restrictions for the
computation time and evaluation criteria necessitates then a finer grid can be used to
conduct the analysis. In the case studies of this thesis, for the sake of demonstration a
250 m by 250 m grid is used.
250 m point grids were created for the whole study area in ArcGIS 9.2 software.
ArcView 3.3 model builder was utilized in order to facilitate the grid creation processes.
Two types of vector data which are polylines and polygons need to be converted to 250
m point grids. For this purpose, two new tools are created; ―Polygon to Grid‖ tool and
―Ployline to Grid‖ tool. One of them converts polygon data to 250 m point grids which is
called ―Polygon to Grid‖ and given in Figure 3.2. Figure 3.2 shows the model diagram
and the application process of grid creation from polygon data.
Figure 3.2 Model diagram for ―Polygon to Grid‖ tool
―Polygon to Grid‖ tool allows the user to choose either multiple layers or a single layer
to create grids. The main advantage of using model builder is that multiple steps of a
procedure can be accomplished by a single tool. Instead of selecting three different

42
tools (union operator, polygon to raster, and raster to point) the user deals with only
one. The model builder is especially useful for the procedures that need to be
conducted repeatedly.
―Polyline to Grid‖ tool is created to convert polyline data to 250 m point grids. Figure 3.3
shows the model diagram and the application process of grid creation from polygon
data. This tool is utilized in converting rivers and electricity transmission lines to point
grids which will be used to calculate nearest distances.
Figure 3.3 Model diagram for ―Polyline to Grid‖ tool
To evaluate individual satisfaction degrees of each alternative location with respect to
identified environmental objectives or economical feasibility criteria, a separate layer is
created in GIS environment. For example, since one of the environmental objectives
requires the noise generated by wind turbines not to disturb the population, in the
―Noise‖ layer, data related with housing areas is stored. In order to use these data in
generating OEPI for wind farms, layers are converted from raster data to point data.
These point grids allow us to determine the distances between the centers of each grid
to the closest housing area.

43
For example, Figure 3.4 demonstrates the calculation of the nearest distance for an
alternative location which is represented as a blue dot to the housing areas which are
represented by green stars. After all the distances from the alternative location to the
surrounding housing areas are calculated the smallest of these distances is selected
and the result is stored in a new column in the GIS database (see Figure 3.5). Then the
stored nearest distance is used to calculate the individual satisfaction degree of the
alternative location for the noise objective. As a final step, the individual satisfaction
degree is stored in a newly created column. Similar analyses are conducted for each
layer associated with the environmental objectives and economical feasibility criteria.
Then, the data is exported to excel files to apply aggregation operation to calculate
degrees of satisfactions for ―Satisfaction of the most of the environmental objectives‖,
―Satisfaction of any of the environmental objectives‖, and ―Satisfaction of all of the
environmental objectives‖. Finally, Excel data is imported back to GIS to visualize the
results.
Figure 3.4 Calculation of the nearest distance for a single alternative location
1655 m
3329 m
3189 m
1856 m
5878 m
5506 m

44
Figure 3.5 Nearest distances in GIS database
Since this process need to be repeated for each environmental objective and
economical feasibility criteria, and the sequence of applications is complex and time
consuming, new tools are developed in GIS environment to conduct the necessary
steps of the proposed approach by using model builder capability of ArcGIS 9.2
software. These new tools are called ―Grid Calculation‖ and ―Import Data‖.
―Grid calculation‖ tool can be used to calculate necessary distances for each alternative
required by the environmental objectives or economical feasibility criteria and to
calculate individual satisfaction degrees of each alternative with respect to each
objective or criteria. This new tool also allows exporting satisfaction degrees of each
environmental objective into Excel and conducting necessary calculations in Excel.
Figure 3.6 demonstrates the model diagram and the application process.
1655 m

45
Figure 3.6 Model diagram for ―Grid Calculation‖ tool
After calculations related with OWA aggregation are performed in Excel, the results
need to be imported back to ArcGIS to generate OEPI maps. Since there are many
alternatives (approximately 723950 grid points), and Excel files have limited storage
capacity (i.e. 65536 rows), 12 separate excel files are used to conduct necessary
calculations. Importing each file to ArcGIS one by one is time consuming. To save time
and simplify the procedure a tool called ―Import Data‖ is generated in the model builder
(see Figure 3.7).

46
Figure 3.7 Model diagram for ―Import Data‖ tool
These new GIS tools are generated to perform necessary operations associated with
the evaluation of environmental and economical criteria in a simple and timely manner.
They ease the implementation of the proposed procedure and allow the decision
makers to conduct the analysis easily.
3.3. Representation of Environmental Objectives and Economical Feasibility
Criteria as Fuzzy Sets
The third step (see Figure 3.1) is representation of environmental objectives and
economical feasibility criteria as fuzzy sets. Most decision making problems contain
different types of uncertainty which may be due to several reasons, such as complexity
of the problem, randomness, variability, or vagueness. The vagueness may be due to
the fuzziness inherent in our natural language or incomplete information (Ross, 2005).
Zadeh (1965) suggested that such uncertainty in decision making process can be dealt
with fuzzy sets. Fuzzy sets may be used to represent criteria or objectives which do not
have crisp boundaries usually due to availability of only incomplete information about
these criteria or objectives.

47
Fuzzy sets which include crisp (precise) sets are characterized by membership
functions. For a crisp (precise) set A , an element x in the universe X is either a
member of the set A or not. Mathematical function of this binary membership can be
represented as (Ross, 2005):
Ax
AxxXA
,0
,1)( (1)
where )(xXA indicates an explicit membership of element x in set A , and the symbol
and denote contained in and not contained in, respectively. However, for a fuzzy
set it is not possible to talk about a zero/one (i.e. not belongs to set A or belongs to
set A ) relation but rather a grade of membership. Zadeh (1965) suggested utilization of
the continuous interval between zero and one rather than a binary membership in order
to represent various ―degrees of membership‖. While zero indicates no membership,
one indicates full membership similar to that of a crisp set. Thus, the nearer the value of
membership to unity, the higher the grade of membership of x in A . The difference
between crisp and fuzzy sets is that an element x in a set of universe can be
represented by an infinite number of values between zero and one in fuzzy sets while it
can only be represented by a zero or one for the crisp sets (Ross, 2005).
Representation of complex criteria using crisp sets may not always be reasonable. For
example, Caliskan (2009) suggests that locations with a minimum solar radiation of 4.5
kWh/m2-day are suitable for solar power plants. In evaluating the suitability of an area
for a solar power plant with respect to the criteria Caliskan (2009) suggested, if a crisp
set is used then all the alternative locations having a solar radiation of 4.5 kWh/m2-day
and higher will be appropriate and the rest of the locations will be inappropriate.
However, if a degree of suitability with respect to solar radiation can be assigned, then
a location with a solar radiation of 4 kWh/m2-day may be classified as almost suitable
and a solar radiation of 6 kWh/m2-day may be classified as highly suitable for a solar
power plant. Instead of defining clear boundaries (i.e. zero/one type), membership
functions allow calculation of degrees of belongingness to fuzzy sets. In this thesis,
environmental objectives and economical feasibility criteria are represented as fuzzy
sets.

48
The degree of compatibility of each alternative location (i.e. grid point) with respect to
each environmental objective and economical feasibility criteria is determined by using
the membership functions of the fuzzy sets associated with the environmental
objectives and economical feasibility criteria. The degree of compatibility is referred to
as the individual satisfaction degree. Individual satisfaction degrees associated with
each alternative location are then aggregated into a single value, an overall satisfaction
degree by using various aggregators such as ―and‖, ―or‖ and OWA.
3.4. Multi-criteria Decision Making (MCDM)
MCDM which is used to evaluate a set of alternatives with respect to multiple criteria is
the fourth step of the procedure (see Figure 3.1). In this thesis, individual satisfaction
degrees of environmental objectives or economical feasibility criteria are aggregated
into a single satisfaction degree by using ―and‖, ―or‖, and OWA aggregation operators.
―And‖ and ―or‖ aggregation operators are the most commonly used operators and
represent ―Satisfaction of all the desired criteria‖ and ―Satisfaction of any of the desired
criteria‖ (Yager, 1988). On the other hand, in many cases decision makers‘ preferences
may not be represented by the pure ―and‖ or pure ―or‖ operators. For such cases, Yager
(1988) proposed the OWA function which corresponds to somewhere between these
two extreme cases. The rationale of this application is based on aggregation by ordered
position of attributes rather than classical weighted averaging. Three aggregator
operators, ―and‖, ―or‖ and OWA are explained in detail in the following sections.
3.4.1. “And” Operator
T-norms are a way to apply ―anding‖ operators for decision makers who desire
satisfaction of all of the criteria. T-norm operators enable implementation of fuzzy set
aggregation. It is noted by Yager (1996a) that t-norm is a way to find Pareto optimal
solution because of its monotonic properties. In other words, if one of the alternatives
has a zero satisfaction degree, evaluation of overall satisfaction degree returns zero.
For instance, if the decision maker wants to satisfy all of the n criteria, iF , ni ,...,1 ,
then this can be represented by:
nFFFD ...21 (2)

49
The bar sign on capital letters is used to represent fuzzy sets.
The following theorem expresses the important property of t-norm operator:
Considering T corresponds to the t-norm operator, then for any a and b :
),(),( baMinbaT . Implementation of ―anding‖ operators allows for no compensation
for one bad satisfaction in MCDM (Yager, 1988).
3.4.2. “OR” Operator
T-conorms are aggregation operators which correspond to the ―oring‖ operators. If
decision maker requires satisfaction of any of the criteria, t-conorms can be used. For
this purpose, union operator is used in order to connect the criteria as follows (Yager,
1996a):
nFFFD ...21 (3)
The following theorem expresses the important property of t-conorm operator:
Considering S corresponds to the t-conorm operator; then for any a and b :
),(),( baMaxbaS . Implementation of ―oring‖ operators allows for no distraction from
one good satisfaction in MCDM (Yager, 1988).
3.4.3. Ordered Weighted Averaging (OWA)
OWA aggregation concept was first suggested by Yager in 1988 (Yager, 1988). A
mapping f from IIn (where 1,0I ) is called an OWA operator of dimension n if
associated with f is a weighting vector T
nWWWW ...21 such that
1) )1,0(iW
2) i
iW 1
where
nnnSSS bWbWbWf ...),...,,( 2211,2,1, (4)
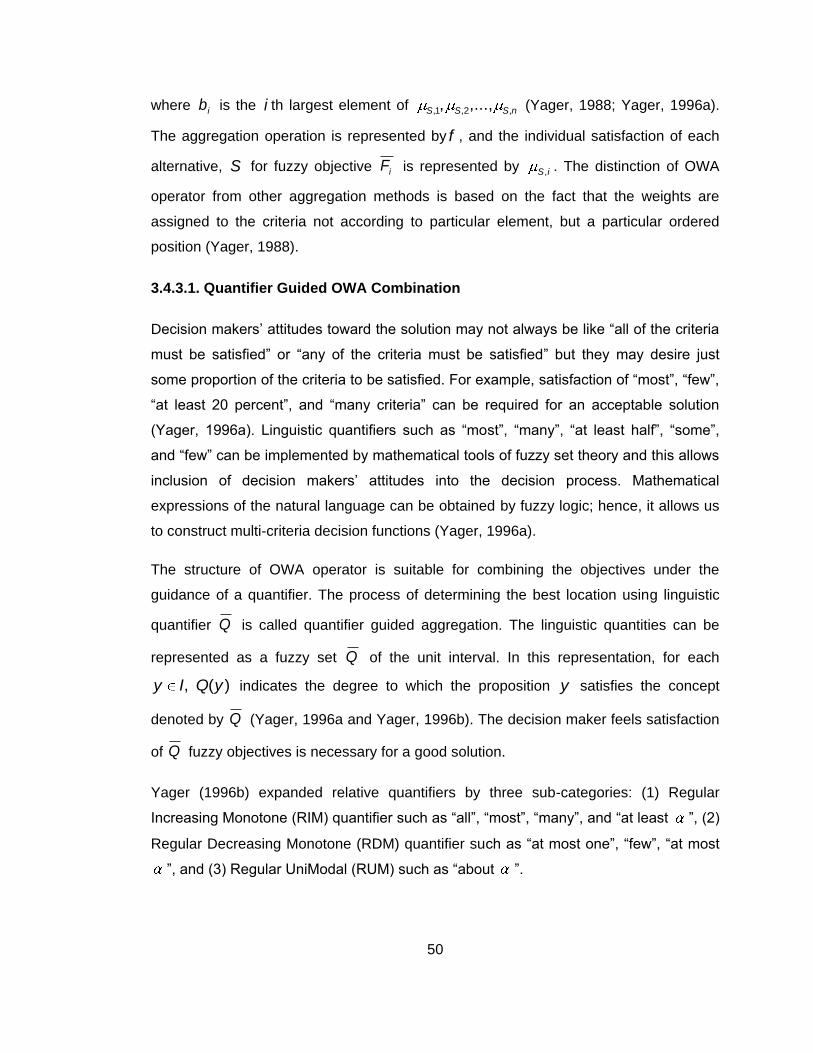
50
where ib is the i th largest element of nSSS ,2,1, ,...,, (Yager, 1988; Yager, 1996a).
The aggregation operation is represented by f , and the individual satisfaction of each
alternative, S for fuzzy objective iF is represented by iS, . The distinction of OWA
operator from other aggregation methods is based on the fact that the weights are
assigned to the criteria not according to particular element, but a particular ordered
position (Yager, 1988).
3.4.3.1. Quantifier Guided OWA Combination
Decision makers‘ attitudes toward the solution may not always be like ―all of the criteria
must be satisfied‖ or ―any of the criteria must be satisfied‖ but they may desire just
some proportion of the criteria to be satisfied. For example, satisfaction of ―most‖, ―few‖,
―at least 20 percent‖, and ―many criteria‖ can be required for an acceptable solution
(Yager, 1996a). Linguistic quantifiers such as ―most‖, ―many‖, ―at least half‖, ―some‖,
and ―few‖ can be implemented by mathematical tools of fuzzy set theory and this allows
inclusion of decision makers‘ attitudes into the decision process. Mathematical
expressions of the natural language can be obtained by fuzzy logic; hence, it allows us
to construct multi-criteria decision functions (Yager, 1996a).
The structure of OWA operator is suitable for combining the objectives under the
guidance of a quantifier. The process of determining the best location using linguistic
quantifier Q is called quantifier guided aggregation. The linguistic quantities can be
represented as a fuzzy set Q of the unit interval. In this representation, for each
)(, yQIy indicates the degree to which the proposition y satisfies the concept
denoted by Q (Yager, 1996a and Yager, 1996b). The decision maker feels satisfaction
of Q fuzzy objectives is necessary for a good solution.
Yager (1996b) expanded relative quantifiers by three sub-categories: (1) Regular
Increasing Monotone (RIM) quantifier such as ―all‖, ―most‖, ―many‖, and ―at least ‖, (2)
Regular Decreasing Monotone (RDM) quantifier such as ―at most one‖, ―few‖, ―at most
‖, and (3) Regular UniModal (RUM) such as ―about ‖.

51
In order to obtain the overall satisfaction degree of an alternative, individual satisfaction
degree with respect to each criterion need to be aggregated in a way to represent
decision makers‘ attitude. In this study, we believe that satisfying ―most” of the
environmental objectives and economical feasibility criteria (i.e. Q represents ―most‖ of
the criteria) is a reasonable expectation. Thus Q is a RIM quantifier. For this purpose
weights are generated as follows:
niforn
i
n
iQw i ,...,2,1
1 (5)
In this study, we assume that the guided quantifier ―most” is defined as 2)( rrQ
(Yager, 1996a and 1996b).
In order to obtain the overall satisfaction degree of an alternative, individual satisfaction
degree with respect to each criterion need to be aggregated in a way to represent
decision makers‘ attitude (Yager, 1996a, and Yager, 1996b). In this process, tradeoffs
lie between the worst case scenario and best case scenario. OWA operators which can
be used to state the decision makers‘ preferences, allow compensation between
evaluation criteria according to trade offs (Malczewski, 1999).
3.5. Site Selection
At the end of the MCDM process, an OEPI and an overall index for renewable energy
potential is calculated. Aggregation of these two criteria for each grid is another
decision making process and is the fifth step of the procedure (see Figure 3.1). The
proposed criteria for site selection of wind and solar energy systems are given in Table
3.2.

52
Table 3.2 Site selection rules
Degree of satisfaction for “Sufficient potential
for wind energy generation” for wind energy (or OSEPI for
solar energy)
Degree of satisfaction for “Satisfaction of
most of the environmental
objectives” (OEPI)
DECISION for the grid (i.e. alternative)
0.0-0.5 0.0-0.5 Eliminate – due to both insufficient potential and environmental concerns.
0.0-0.5 0.5-1.0 Eliminate – due to insufficient
potential.
0.5-1.0 0.0-0.5
Eliminate for now – due to environmental concerns.
Consider remedial actions and reevaluate.
0.5-1.0 0.5-1.0 Mark as priority site for wind or solar energy generation.
As can be seen from Table 3.2, according to the decision rules, an OEPI and an OSEPI
for solar energy (or degree of satisfaction for ―Sufficient potential‖ for wind energy) with
degrees of 0.5 and higher are required for a site to be identified as priority site for solar
(or wind) energy constructions. For this purpose ―and‖ operator is used to aggregate
OEPI and OSEPI for solar energy (or degree of satisfaction for ―Sufficient potential‖ for
wind energy). This aggregation results in an OPI value for each grid and grids with an
OPI of 0.5 and higher are selected as priority sites.
The final step is to identify the suitable locations where wind and solar energy
constructions can be deployed together as a hybrid system (see Figure 3.1). Therefore,
priority site maps of wind and solar energy (individual satisfaction degree values with
0.5 and higher) are overlaid in GIS environment using the ―and‖ operator. This
procedure is to identify suitable locations for hybrid systems.

53
CHAPTER 4
IMPLEMENTATION
4.1. Case Studies
Site selection procedures for solar power plants and wind turbines are developed for a
selected study area within Turkey. Then using the results of these two case studies
appropriate locations for hybrid systems (i.e. systems including solar and wind power
plants together) are identified. The details of these three case studies are provided in
this chapter.
Wind and solar potential atlases of Turkey are developed by General Directorate of
Electrical Power Resources Survey and Development and are given in Figure 4.1 and
Figure 4.2, respectively. These maps are used to identify economically feasible
locations in terms of solar and wind energy generation. As can be seen from Figures
4.1 and 4.2, western part of Turkey has high wind and solar energy potentials which
makes this location attractive for renewable energy investors. Particularly, a number of
wind farm projects have been initiated in recent years and there are already 17
operating wind farms most of which are located in the western part of Turkey (Web 1).

54
Figure 4.1 Wind energy potential atlas of Turkey (Web 4)
Figure 4.2 Solar energy potential atlas of Turkey (Web 9)
In this thesis, a region including Uşak, Aydın, Denizli, Muğla, and Burdur provinces is
selected as the study area due to the high wind and solar energy potentials of the
region. Location of the study area within Turkey can be seen in Figure 4.3. After the
study area is selected, necessary data are collected in order to identify environmentally
and economically feasible locations for wind turbines and solar power plants. Required
data are solar and wind energy potentials, forest areas, national parks, natural
protection zones, housing areas, national electricity grids, bird migration path, airports,
water bodies, wetlands, operating wind farm locations and they are shown in Figure 4.4.

55
Figure 4.3 Study Area in Turkey
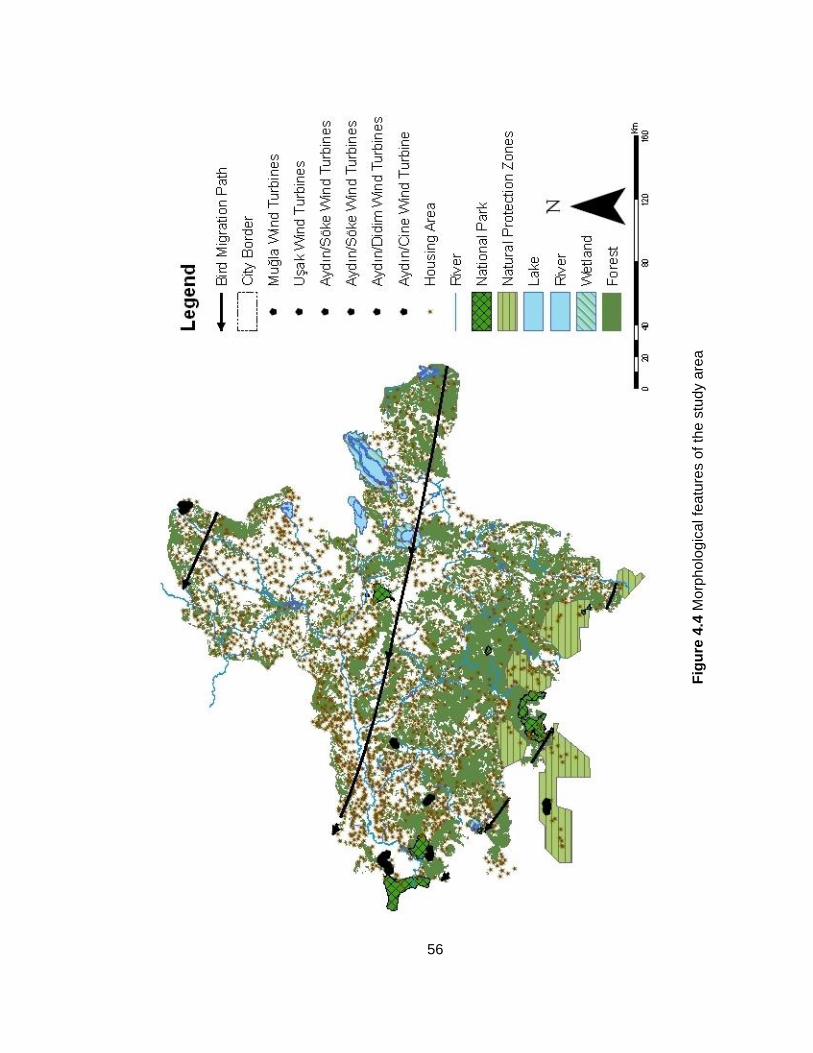
56
Fig
ure
4.4
Morp
ho
logic
al fe
atu
res o
f th
e s
tud
y a
rea

57
4.2. Solar Energy
Renewable energy resources potentials should be considered together with associated
environmental impacts in the future energy development plans. The aim of this study is
to create a spatial decision support tool for site selection of solar power plants by using
GIS tools. Indentifying the suitable locations for solar power plant installation requires
comprehensive analyses. GIS can provide guidance as a spatial decision support tool
for identifying environmentally and economically feasible locations. GIS tools enable a
wide range of analysis of geo-referenced data, and visual presentation of cartographic
maps. Each map reveals the preference of a given set of models and decision
procedures (Seffino et al., 1999). In this study, several cartographic maps such as
forest areas, wetlands, water bodies, electricity transmission lines, settlement areas etc.
are used to produce environmental fitness and economic feasibility maps.
Decision criteria are identified with respect to environmental acceptability and solar
energy potential. Environmental impacts of solar power installations are identified
studying current Turkish legislations and literature, and fuzzy objectives are generated
using the gathered information. Solar potential map of Turkey which was developed by
the General Directorate of Electrical Power Resources Survey and Development
Administration together with various other criteria such as slope of the land, proximity to
transmission lines and urban areas are utilized to evaluate economical feasibility of
potential locations in terms of solar energy generation. Proposed methodology is
applied on a study area chosen from western part of Turkey. The study area which is
composed of Uşak, Aydın, Denizli, Muğla, and Burdur provinces is divided into 250 m
by 250 m grids and each grid represents an alternative location for solar power plant
installations.
Fuzzy sets representing economical feasibility criteria and environmental objectives are
characterized by appropriate membership functions. Individual satisfaction degrees of
each environmental objective and each economical feasibility criteria for each grid are
calculated separately. Then, individual satisfactions of environmental objectives and
economical feasibility criteria are aggregated into an OEPI and an OSEPI, respectively.
OWA operator is used for the aggregation process. In the end, a map for environmental
fitness and a map for solar energy generation feasibility are developed in GIS
environment. Finally, these two maps are overlaid to identify both potentially and

58
environmentally feasible locations for solar power plant installations within the study
area.
4.2.1. Methodology
A general flowchart for the site selection process for solar power plants, wind turbines
and hybrid systems is given in Figure 3.1. The relevant parts of this flowchart for the
solar power plant site selection process are given in Figure 4.5. As can be seen from
Figure 4.5, the first step is the identification of environmental objectives and economical
feasibility criteria. In the second step, data related with environmental objectives and
economical feasibility criteria are collected and processed in GIS environment. The next
step is to identify fuzzy membership functions of environmental objectives and
economical feasibility criteria. The membership functions of these fuzzy sets are used
to compute individual satisfaction degrees of each alternative location for each
environmental objective and economical feasibility criteria. Afterwards, an OEPI and an
OSEPI are calculated by aggregating individual satisfaction degrees using spatial
MCDM. The final step is to overlay OEPI and OSEPI layers in GIS to identify suitable
locations for solar power plants.

59
Figure 4.5 Flowchart of site selection procedure for solar power plants
4.2.1.1. Identification of Environmental Objectives and Economical Feasibility
Criteria
Even though solar energy systems may provide clean and safe energy to the public and
industries, similar to many other manmade projects, solar energy systems have certain
impacts on the environment. Most specific environmental concern of these systems
depends on dimensions (size and nature) of the projects that generally cause loss of
amenity (Tsoutsos et al., 2005). Different solar energy systems have different kind of
impacts on the environment. For example, PV systems do not generate any noise or
Identification of environmental objectives &
economic feasibility criteria
Data collection & processing
Solar energy potential Study area boundaries and potential locations
(i.e. grids)
Environmental
objectives
Representation of economical feasibility criteria as fuzzy sets
Representation of environmental objectives as fuzzy sets
Computation of the individual
satisfaction degrees of fuzzy objective for each grid location
Computation of the individual satisfaction degrees of each fuzzy
objective for each grid location
Calculation of Overall Solar Energy Performance Index
Calculation of Overall Environmental Performance Index
SITE SELECTION

60
chemical pollutants during utilization (Tsoutsos et al., 2005). However, other
environmental concerns most of which are related to their life-cycle exist for PV
systems. These concerns are air pollution generated during transport and
manufacturing and waste management of PV modules after decommissioning. On the
other hand, direct impacts of PV systems are related to land use, and visual impact
(Tsoutsos et al., 2005).
Visual impact is highly dependent on the location (i.e. proximity to settlement areas,
natural reserves, etc.) of the PV systems. If PV modules are deployed near the area of
natural beauty, visual impact on this area will be inevitable (Tsoutsos et al., 2005). In
addition, General Directorate of Civil Navigation in Turkey sets some restrictions around
airports in order to protect the flight security, human lives, and property. Therefore, in
the first 3000 m zone there should not be any structure such as hospitals, schools or
common buildings that may cause reflection. Buildings that are less than 45 m height
are allowed with in the second 3000 m zone (General Directorate of Civil Navigation,
2007).
Carrion et al. (2008) proposed an environmental decision support system in order to
establish grid-connected PV modules. In this study, criteria are classified in four groups:
environmental, orography, location, and climate. These criteria are subdivided into
factors; in environmental criterion, there are two factors which are land use, and visual
impact of PV modules. Land use restrictions are based on environmental protection
laws. Mostly preferable locations for PV systems are fields without vegetation.
Environmental protection laws in Turkey are associated with forest areas, national
parks, natural protection zones, coastline and wetlands. According to the Forest Law in
Turkey, any kind of construction in forest area is forbidden. However, Ministry of Forest
and Environment can allow constructions for defense, infrastructure, communication, oil
research, natural gas, solid waste disposal institutions, if these activities are highly
necessary to build on forest areas for public interest (Law number: 6831).
Similar to forest areas, constructions at national parks are restricted by legislation in
Turkey. According to National Parks Legislation, the structures which have adverse
impacts on habitat cannot be built on national parks since these areas have to be
preserved. Only the structures for visitors, management and research are allowed
(Official journal number: 19309). In addition, national protection zones are identified

61
with respect to Environmental Legislation and international conservation agreements in
order to protect the natural assets and take precautions to decrease environmental
degradation. These areas are considered ecologically sensitive and only constructions
which are compatible with the nature such as restaurants, shops, maintenance and
repair facilities etc. are allowed (Official journal number: 20341).
Tsoutsos et al. (2005) stated that PV systems may cause pollution in once-cultivable
land and affect the soil productivity. According to Turkish Law associated with
protection of cultivable lands, agricultural area must be protected in order to sustain
natural functions of the land. However, if there is not any alternative location for certain
facilities such as defense, oil and natural gas research, mining activities for public
interest, temporary places after emerging natural disasters, agricultural lands can be
used for development (Law number: 5403).
PV systems may have negative environmental impacts on the ecosystem as well. PV
modules contain toxic and hazardous materials. As a result of abnormal plant
operations, these toxic materials may release into the environment. These impacts can
be mitigated by proper site selection. Therefore, flora and fauna on the adjacent areas
need to be considered (IEA, 1998). Wetlands as well are protected by law since they
have high ecological values and biodiversity. According to the Legislation of Wetlands,
there must be at least 2.5 km buffer zone to protect ecological and topographic features
of these areas (Official journal number: 21937).
There are further restrictions about coastal zone in Turkish Law (Law number: 3621).
According to the legislation, coastal zone is divided into two zones. The first 50 m zone
is allocated to green belts, and recreational areas. The second 50 m zone is for small
scaled touristic places, roads, open car parks, and treatment facilities (Official journal
number: 21374).
In addition to environmental restrictions, economical feasibility of solar power plants
needs to be taken into account for optimal site selection. Power plants located near
urban areas may prevent transmission losses, since the urban areas are the main
consumption points. Therefore, proximity to national electricity grid is one of the
restrictions to retain economical feasibility. Baban and Parry (2001) stated that
maximum distance from national grid should be 10 km or less in order to reduce the

62
cost. On the other hand, proximity to urban areas is required to reduce maintenance
and repair costs (Carrion et al., 2008). Therefore, Carrion et al. (2008) suggested that
minimum distance from urban areas should be 5 km, and maximum distance should be
10 km.
Site selection of solar power plants also depends on land slope. Carrion et al. (2008)
stated that milder slopes (less than 3%) are the most suitable sites to establish grid
connected PV power plants. In addition, Hang et al. (2008) investigated the site
selection factors related with solar power plants and concluded that an overall slope of
less than 1% is suitable for solar power plants, and slope percentage up to 3% is
acceptable, but 3% slope may increase the cost.
4.2.1.2. Quantification of Objectives
Environmental objectives with respect to solar energy generation are identified through
a detailed review of the literature and studying governmental laws and regulations. In
this study, Turkish legislations about natural reserves (national parks, natural protection
zones, forests, wetlands, and coastline) and airport construction are used in identifying
environmental objectives of solar energy generation. These objectives and associated
criteria are given in Table 4.1.

63
Table 4.1 Environmental objectives and associated criteria from regulations and
previous studies
Environmental objectives
Criteria Reference
Acceptable in terms of natural
reserves
Only the constructions for public interest are allowed if activities are highly necessary to build on forest areas
Law number: 6831
Only the constructions which are compatible with the nature are allowed
Official journal number: 20341
The structures which have adverse impacts on habitat cannot be built
Official journal number: 19309
Acceptable in terms of
agricultural areas
Agricultural area must be protected in order to sustain natural functions of the
land Law number: 5403
Cultivable land might be damaged by large scale installations
Tsoutsos et al., 2005
Acceptable in terms of lakes and wetlands
At least 2.5 km buffer zone to protect ecologic and topographic features
Official journal number: 21937
Acceptable in terms of coastline
Minimum distance is 100 m from the coastline
Official journal number: 21374
Acceptable in terms of flight
security
Minimum distance to airports is 3000 m and maximum distance to airports is
6000 m
General Directorate of Civil Navigation,
2007
In addition to environmental objectives various criteria to evaluate economical feasibility
of an alternative location is considered in the site selection process. Here, economical
feasibility is used to represent suitability of each alternative location for solar power
plants with respect to solar energy potential, economical and physical aspects.
Therefore, as can be seen from Table 4.2, sufficient potential for solar energy
generation, acceptable slope, acceptable proximity to transmission lines, acceptable
proximity to urban areas are identified as economical feasibility criteria. These criteria
are identified by using previous studies and interviews with the General Directorate of
Electrical Power Resources Survey and Development Administration.

64
Table 4.2 Economical feasibility criteria and associated criteria from interviews and
previous studies
Economical Feasibility Criteria
Criteria Reference
Sufficient Potential for Solar Energy Generation
Min solar radiation value is 4.5 kWh/m2-day
Caliskan, 2009
Acceptable slope
Slope up to 3%, 1% most economical Hang et al.,
2008
Less than 3% Carrion et al., 2008
Acceptable proximity to transmission lines
Not be located further than 10 km from national grid
Baban and Parry, 2000
Acceptable proximity to urban areas
Min distance to urban areas should be 5 km. Max distance to urban areas should be 10 km.
Carrion et al., 2008
Electrical production plants need to be located near urban area to avoid transmission loss
Proper site selection and design of large PV installations due to the visual impact
Tsoutsos et al., 2005
4.2.1.3. Data Collection and Processing
Data processing is done in GIS environment. To calculate individual satisfaction
degrees of environmental objectives and economical feasibility criteria for each
alternative location (i.e. grip point), several GIS map layers need to be prepared. These
layers include the boundaries of the study area, solar energy potential, settlement
areas, water bodies, natural reserves, coastal boundaries, slope, transmission lines etc.
Then, study area is divided into 250 m by 250 m grids. Each grid represents an
alternative location for installation of solar power plants. As a final step, criterion maps
with respect to each environmental objective and economical feasibility criteria are
generated. For example, for ―Acceptable in terms of lake and wetland‖ environmental
objective, nearest distances to lakes and wetlands are calculated for each alternative
location (i.e. grid point).

65
4.2.1.4. Representation of Environmental Objectives as Fuzzy Sets
Five environmental objectives considered and related criteria for these objectives are
given in Table 4.1. Solar power plants require large areas for installations. For example,
a solar power plant in Portugal which is located 200 km southeast of Lisbon has 52000
solar panels covering about 60 ha (Web 10). A PV system which is located at the
northeast of Las Vegas, USA has 72000 solar panels that covers an area of 140 acres
(approximately 57 ha) (Web 11). Thus installation of solar power plants results in
clearing of large areas. This fact makes installation of solar power plants unsuitable on
agricultural land, forest areas, natural parks or preserves.
In this study, forest areas, national parks, and natural protection zones are referred to
as natural preserves. As can be seen from Table 4.1, related Turkish laws and
legislations have restrictions about constructions at these areas. For example,
according to national parks legislation, the structures which have adverse impacts on
habitat cannot be built on national parks since these areas have to be preserved. Only
the structures for visitors, management and research are allowed (Official journal
number: 19309).
Similarly, partial or full destruction of forest areas is forbidden by law. However, Ministry
of Environment and Forestry may allow constructions related with defense,
infrastructure, communication, oil research, natural gas, solid waste disposal if these
activities are highly necessary to be build on forest areas (Law number: 6831).
Therefore, in this study natural preserves are considered to be unsuitable for solar
power plants. Since construction within these areas is forbidden by law in Turkey,
instead of a fuzzy objective a crisp one is implemented for natural preserves: ―It is not
appropriate to construct solar power plants inside natural preserves‖. In other words, a
buffer zone in which acceptability of construction increases from zero to one is not
used. One other reason for not using a fuzzy objective is the computational burden.
Since the selected study area includes many natural preserves calculating distances for
each grid point from the closest natural preserve requires a lot of time. Thus, for the
sake of simplicity natural preserves are excluded from potential areas on which solar
power plants may be constructed.
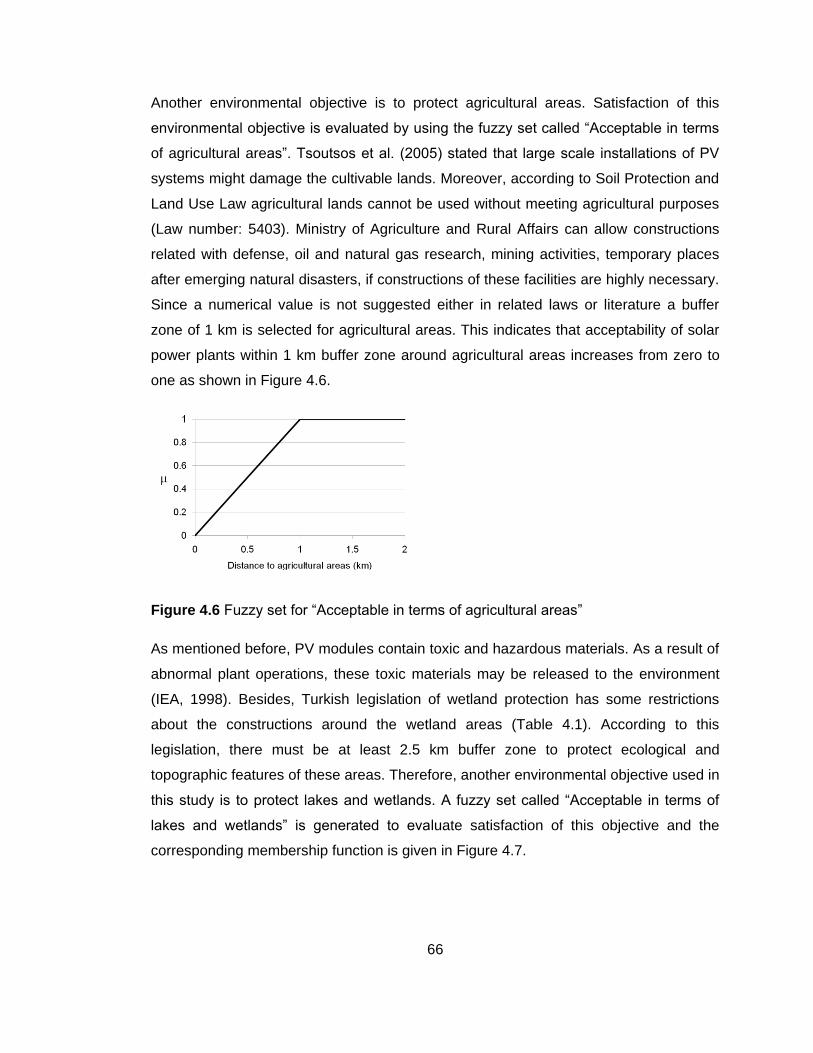
66
Another environmental objective is to protect agricultural areas. Satisfaction of this
environmental objective is evaluated by using the fuzzy set called ―Acceptable in terms
of agricultural areas‖. Tsoutsos et al. (2005) stated that large scale installations of PV
systems might damage the cultivable lands. Moreover, according to Soil Protection and
Land Use Law agricultural lands cannot be used without meeting agricultural purposes
(Law number: 5403). Ministry of Agriculture and Rural Affairs can allow constructions
related with defense, oil and natural gas research, mining activities, temporary places
after emerging natural disasters, if constructions of these facilities are highly necessary.
Since a numerical value is not suggested either in related laws or literature a buffer
zone of 1 km is selected for agricultural areas. This indicates that acceptability of solar
power plants within 1 km buffer zone around agricultural areas increases from zero to
one as shown in Figure 4.6.
Figure 4.6 Fuzzy set for ―Acceptable in terms of agricultural areas‖
As mentioned before, PV modules contain toxic and hazardous materials. As a result of
abnormal plant operations, these toxic materials may be released to the environment
(IEA, 1998). Besides, Turkish legislation of wetland protection has some restrictions
about the constructions around the wetland areas (Table 4.1). According to this
legislation, there must be at least 2.5 km buffer zone to protect ecological and
topographic features of these areas. Therefore, another environmental objective used in
this study is to protect lakes and wetlands. A fuzzy set called ―Acceptable in terms of
lakes and wetlands‖ is generated to evaluate satisfaction of this objective and the
corresponding membership function is given in Figure 4.7.

67
Figure 4.7 Fuzzy set for ―Acceptable in terms of lakes and wetlands‖
In addition to wetlands and lakes, protection of coastal zones and rivers are considered
in this study as well since energy constructions can cause water contamination, and
constructions on coastal zone are restricted by Turkish Legislation of Coastline.
According to the legislation, coastal zone is determined by governorship and divided
into two zones. The first 50 m zone is allocated as a green belt, and can be utilized for
recreational purposes only. The second 50 m zone is for small scaled touristic places,
roads, open car parks, and treatment facilities (Official journal number: 21374). A fuzzy
set referred to as ―Acceptable in terms of coastline and rivers‖ is used to evaluate
satisfaction of this environmental objective and associated membership function is
given in Figure 4.8.
Figure 4.8 Fuzzy set for ―Acceptable in terms of coastline and rivers‖
Another environmental objective is related with flight security. Since humans are a part
of the environment this objective is considered under environmental objectives rather
than economical feasibility criteria. A fuzzy set referred to as ―Acceptable in terms of
flight security‖ is formed to evaluate satisfaction of this objective. As can be seen from
Table 4.1, according to the notice of General Directorate of Civil Navigation, structures

68
which may shine are not allowed in the first 3000 m zone, while buildings which are less
than 45 m height are allowed in the second 3000 m zone (General Directorate of Civil
Navigation, 2007). According to these criteria, the membership function for the fuzzy set
―Acceptable in terms of flight security‖ is generated and given in Figure 4.9.
Figure 4.9 Fuzzy set for ―Acceptable in terms of flight security‖
4.2.1.5. Computation of Individual Satisfaction Degrees
Fuzzy membership functions associated with each environmental objective are used to
evaluate individual satisfaction degrees of each alternative location (i.e. grid point) with
respect to these objectives in GIS environment. Separate layers for each environmental
objective are created in GIS environment and related information is stored in various
databases. For example, in the layer corresponding to ―Acceptable in terms of flight
security‖, distances between each grid point and the nearest airport is stored. These
distances are used to evaluate individual satisfaction of each grid point with respect to
the environmental objective ―Acceptable in terms of flight security‖ by using the
membership function given in Figure 4.9. A similar procedure is employed to calculate
individual satisfaction degrees of each grid point for all the environmental objectives.
Then these individual satisfaction degrees are aggregated into an OEPI. At the end of
this procedure an OEPI is calculated for each grid point.
4.2.1.6. Representation of Economical Feasibility Criteria Using Fuzzy Sets
In order to perform site selection of solar energy investments, both economical
feasibility and environmental suitability need to be considered. Even though a location
has high environmental acceptability, if the solar energy potential is not sufficient, a

69
solar energy power plant will not be feasible at that location. Therefore, the next step is
to generate the OSEPI of the study area.
For this purpose several economical feasibility criteria are identified through previous
studies and personal interviews with personnel from General Directorate of Electrical
Power Resources Survey and Development Administration. Economical considerations
and associated economical feasibility criteria are given in Table 4.2.
During the interviews with the General Directorate of Electrical Power Resources
Survey and Development Administration, it became clear that economically feasible
solar radiation value for solar energy generation starts around 4.5 kWh/m2-day
(Caliskan, 2009). In addition, Environmental Protection Agency of USA conducted an
analysis about solar energy generation potential for PV systems. In this analysis, solar
radiation values between 5 – 6 kWh/m2-day are classified as ―very good‖ for energy
generation from PV systems (Web 12). Economical feasibility criteria related with solar
potential is represented by a fuzzy set called ―Sufficient potential for solar energy
generation‖ and its membership function is formed by using the criteria provided in
Table 4.2. The membership function for ―Sufficient potential for solar energy generation‖
is given in Figure 4.10.
Figure 4.10 Fuzzy set for ―Sufficient potential for solar energy generation‖
Land slope is another concern for the site selection of solar power plants. Criteria
related with suitable land slope for solar power plant installations given in Table 4.2 are
used to generate a fuzzy set called ―Acceptable in terms of slope‖ and the membership
function of this fuzzy set is given in Figure 4.11.

70
Figure 4.11 Fuzzy set for ―Acceptable in terms of slope‖
Another economical feasibility criterion has been identified as the proximity to electricity
transmission lines. According to Hang et al. (2008) since the transmission lines can
elevate the cost, easy access to transmission lines is important for site selection. On
the other hand, Baban and Parry (2001) studied the same selection problem and stated
that cost factor can be tolerated up to 10 km. A fuzzy set called ―Acceptable in terms of
transmission lines‖ is generated to represent this objective. Distances less than 10 km
are considered to be fully acceptable in terms of proximity to transmission lines as can
be seen from Figure 4.12. The maximum distance is determined specifically for the
selected study area. All the grid locations within the study area are less than
approximately 45 km to the nearest transmission line. Since all grid points need to
receive electricity, a location specific maximum distance is implemented for this fuzzy
objective.
Figure 4.12 Fuzzy set for ―Acceptable in terms of transmission lines‖
Proximity to urban areas is the last economical feasibility criteria. If the solar power
plant is located away from urban areas, that may cause higher electricity transmission
losses. Therefore power plants for electricity generation which are located near urban

71
areas are preferable. On the other hand since solar power plants require large areas for
installation in addition to various economical considerations (i.e. may be more beneficial
to use land close to the urban areas for other purposes) and visual impacts, it may be
preferable not to have these installations too close to the urban areas. A fuzzy set
called ―Acceptable in terms of proximity to urban area‖ is formed using these criteria
and the corresponding membership function is given in Figure 4.13.
Figure 4.13 Fuzzy set for ―Acceptable in terms of proximity to urban area‖
The fuzzy sets generated for the environmental objectives and the economical
feasibility criteria are used to evaluate individual satisfaction degree of each alternative
location (i.e. grid point) with respect to these objectives and criteria.
4.2.1.7. Computation of Individual Satisfaction Degrees
Membership functions associated with environmental objectives and economical
feasibility criteria are used to compute individual satisfaction degrees of each alternative
location (i.e. grid point) in GIS environment. Individual satisfaction degrees are
calculated by using the previously stored data in the related layers. These individual
satisfaction degrees are recorded in a separate column in the GIS database. The next
step is to aggregate these individual satisfaction degrees into an OEPI and OSEPI
using MCDM.
4.2.1.8. Multi-criteria Decision Making (MCDM)
MCDM allows evaluation of a set of alternatives with respect to conflicting and
incommensurate criteria. A criterion is a generic term that includes both the concepts of
attribute and objective (Malczewski, 1999). When the standardizations of criteria are

72
represented by fuzzy measures, MCDM concerns the aggregation of multiple fuzzy
measures into a single statement which corresponds to the final degree of suitability
(Jiang and Eastman, 2000). In this study, the OEPI and OSEPI are the final degrees of
suitability. The combination approach is an important decision rule. In this study the
OEPI and OSEPI are calculated by using the OWA aggregation operator for
―satisfaction of most of the objectives‖. To evaluate ―Satisfaction of most of the
objectives‖ quantifier guided aggregation is used.
4.2.1.9. Site Selection
At the end of the aggregation procedure, an OEPI representing ―Satisfaction of most of
the environmental objectives‖ and an OSEPI representing ―Satisfaction of most of the
economical feasibility criteria‖ for each alternative location (i.e. grid point) is calculated.
Suitability of each grid for solar power plant installations needs to be evaluated based
on these two criteria. Such an evaluation requires another decision making process
which combines OEPI and OSEPI into a single representative value (i.e. overall
performance index, OPI) for solar power plant installations. The proposed decision
criteria for site selection of solar energy systems are given in Table 4.3.
Table 4.3 Site selection criteria for solar energy systems
OSEPI OEPI DECISION for the grid (i.e.
alternative)
0.0-0.5 0.0-0.5
Eliminate – due to both insufficient
potential and environmental
concerns.
0.0-0.5 0.5-1.0 Eliminate – due to insufficient
potential.
0.5-1.0 0.0-0.5
Eliminate for now – due to
environmental concerns. Consider
remedial actions and reevaluate.
0.5-1.0 0.5-1.0 Mark as priority site for solar energy
generation.

73
As can be seen from Table 4.3, alternative locations which have at least 0.5 satisfaction
degrees for both OEPI and OSEPI are identified as suitable locations for solar power
plant installations. These alternative locations can be referred to as ―priority sites‖ for
solar energy generation. In order to obtain priority sites, OEPI and OSEPI are overlaid
using the ―and‖ operator in GIS environment. At the end of this procedure, OPI for solar
energy is acquired and grids with an OPI of 0.5 and higher are selected as ―priority
sites‖.
4.2.2. Example Application for Solar Power Plants
The site selection methodology for solar energy generation is applied for a study area
located in the western part of Turkey. The study area is composed of Aydın, Uşak,
Denizli, and Muğla provinces. The current solar potential map of the study area is
obtained from General Directorate of Electrical Power Resources Survey and
Development Administration and is given in Figure 4.14. Solar energy potential map
contains radiation values.

74
Fig
ure
4.1
4 C
urr
en
t sola
r p
ote
ntial fo
r th
e s
tud
y a
rea

75
First, related layers are obtained for the study area. These layers are solar energy
potential, wetlands, water bodies, natural reserves, airports, electricity transmission
lines, slope, rivers and coastline. Then whole study area is converted to 250 m point
grids in ArcGIS 9.2 software. Each point represents an alternative location for the solar
power plant installation. Individual satisfaction degrees of environmental objectives and
economical feasibility criteria for each alternative are calculated using the membership
functions generated for associated criteria as given in Figures 4.6 to 4.13.
As mentioned before, one of the environmental objectives is related with protection of
natural preserves. In this study natural preserves are considered to be unsuitable for
solar power plants. Figure 4.15 demonstrates suitable locations for ―Acceptable in terms
of natural reserves‖.
Fuzzy set for ―Acceptable in terms of agricultural areas‖ is identified (see Figure 4.6),
nearest distances between the centers of each grid point to the closest agricultural area
are calculated and stored in the database. Individual satisfaction degree of each grid
point is calculated using the nearest distances and Figure 4.6. A new column is created
to store individual satisfaction degrees. Then these points are converted to raster data
in order to demonstrate suitable locations for ―Acceptable in terms of agricultural areas‖
which is given in Figure 4.16.
Protection of lakes and wetlands is another environmental objective in this study. A
fuzzy set called ―Acceptable in terms of lakes and wetlands‖ is generated and can be
seen in Figure 4.7. Individual satisfaction degree for each grid point with respect to
―Acceptable in terms of lakes and wetlands‖ fuzzy objective is calculated in the same
way used for ―Acceptable in terms of agricultural areas‖ fuzzy objective. Suitable
locations for ―Acceptable in terms of lakes and wetlands‖ are given in Figure 4.17.
In addition, protection of coastal zones and rivers is considered as one of the
environmental objectives in this study and fuzzy set for ―Acceptable in terms of
coastline and rivers‖ is given in Figure 4.8. Figure 4.18 demonstrates the suitable
locations for ―Acceptable in terms of rivers and coastline and rivers‖ within the study
area.

76
Fig
ure
4.1
5 S
uitab
le lo
cation
s f
or
―Accepta
ble
in term
s o
f na
tura
l re
serv
es‖

77
Fig
ure
4.1
6 S
uitab
le lo
cation
s f
or
―Accepta
ble
in term
s o
f ag
ricultura
l a
reas‖

78
Fig
ure
4.1
7 S
uitab
le lo
cation
s f
or
―Accepta
ble
in term
s o
f la
kes a
nd
wetlands‖

79
Fig
ure
4.1
8 S
uitab
le lo
cation
s f
or
―Accepta
ble
in term
s o
f coastlin
e a
nd
riv
ers
‖

80
Last environmental objective is related with the flight security. The membership function
for the fuzzy set ―Acceptable in terms of flight security‖ is given in Figure 4.9. In order to
illustrate the fuzzy set ―Acceptable in terms of flight security‖, fuzzy measures of each
alternative location are converted to raster data and given in Figure 4.19.
In addition to environmental objectives, economical feasibility criteria of solar energy
generation are also considered in this study and given in Table 4.2. One of the
economical feasibility criteria is related with solar energy potential which is represented
by a fuzzy set called ―Sufficient potential for solar energy generation‖. The membership
function for ―Sufficient potential for solar energy generation‖ is given in Figure 4.10. In
addition, Figure 4.20 illustrates the result of ―Sufficient potential for solar energy
generation‖ fuzzy set.
Land slope is another economical feasibility criterion. Therefore, a fuzzy set called
―Acceptable in terms of slope‖ is identified and the membership function of this fuzzy set
is given in Figure 4.11. In addition, suitable locations for ―Acceptable in terms of slope‖
fuzzy set can be seen in Figure 4.21.
As mentioned before, proximity to electricity transmission lines is another economical
criterion which can increase the cost. Thus, a fuzzy set called ―Acceptable in terms of
transmission lines‖ is generated and the membership function of this fuzzy set is given
in Figure 4.12. In addition, Figure 4.22 demonstrates the ―Acceptable in terms of
transmission lines‖ fuzzy set within the study area. As can be seen in Figure 4.22, all of
grid values have satisfaction degree which is higher than zero. Since the maximum
distance in this fuzzy set is derived from the case study.
Proximity to urban areas is the last economical feasibility criteria. A fuzzy set called
―Acceptable in terms of proximity to urban area‖ is formed using the criteria which are
given in Table 4.2 and the corresponding membership function is given in Figure 4.13.
In addition, Figure 4.23 illustrates the result of ―Acceptable in terms of proximity to
urban area‖ fuzzy set.

81
Fig
ure
4.1
9 S
uitab
le lo
cation
s f
or
―Accepta
ble
in term
s o
f flig
ht securi
ty‖
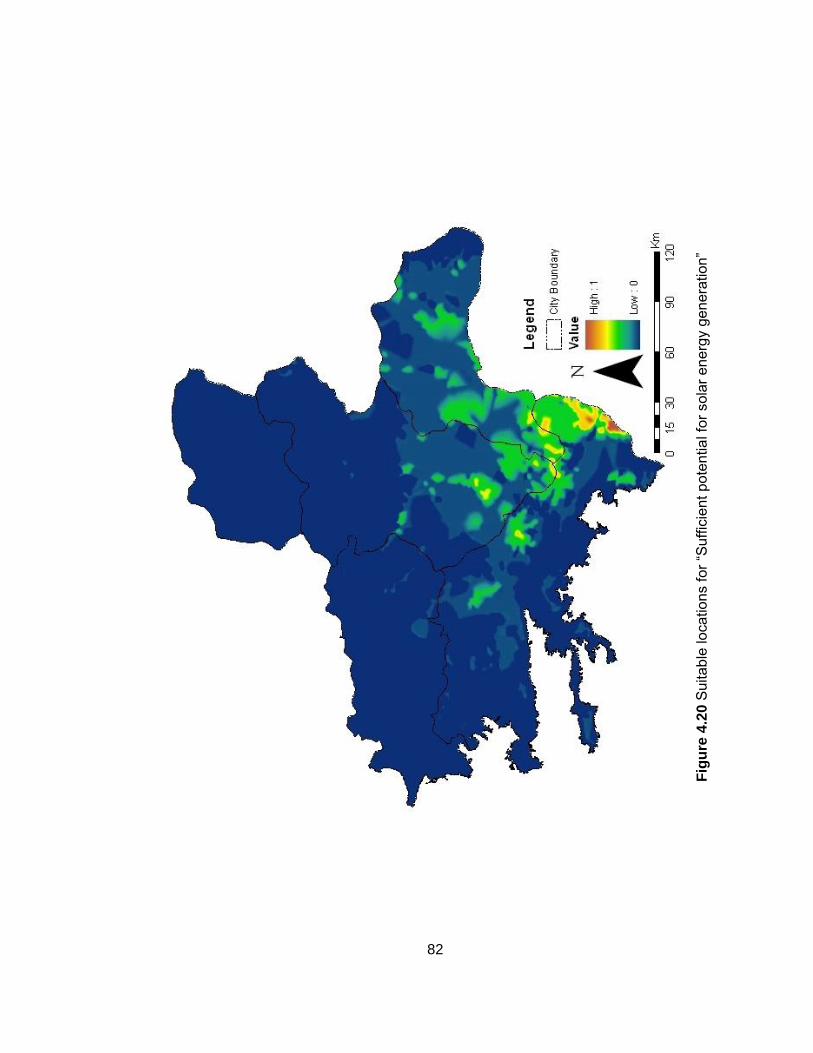
82
Fig
ure
4.2
0 S
uitab
le lo
cation
s f
or
―Suffic
ient
po
tentia
l fo
r sola
r e
nerg
y g
ene
ration‖

83
Fig
ure
4.2
1 S
uitab
le lo
cation
s f
or
―Accepta
ble
in term
s o
f slo
pe‖

84
Fig
ure
4.2
2 S
uitab
le lo
cation
s f
or
―Accepta
ble
in term
s o
f tr
ansm
issio
n lin
es‖

85
Fig
ure
4.2
3 S
uitab
le lo
cation
s f
or
―Accepta
ble
in term
s o
f pro
xim
ity to u
rban
are
a‖

86
Individual satisfaction degrees associated with environmental objectives and
economical feasibility criteria are aggregated into OEPI and OSEPI values,
respectively. OEPI and OSEPI associated with satisfaction of most of the objectives are
given in Figure 4.24 and Figure 4.25, respectively.
In Figure 4.24 and Figure 4.25 dark blue represents a membership value of zero and
red represents a membership value of one in the fuzzy sets of ―Satisfaction of most of
the environmental objectives‖ and ―Satisfaction of most of the economical feasibility
criteria‖ respectively. In other words, red areas indicate that most of the objectives are
satisfied. Blue areas generally represent the natural reserves (wetlands, water bodies,
forest areas, and agriculture areas). As can be seen from Figures 4.24 and 4.25 a big
proportion of the study area does not satisfy most of the environmental and economical
objectives. Especially in terms of economical feasibility criteria very little portion of the
study area satisfies most of the criteria (i.e. red marked areas in Figure 4.25).

87
Fig
ure
4.2
4 O
EP
I m
ap f
or
―Sa
tisfa
ction o
f m
ost
of th
e e
nviro
nm
enta
l ob
jectives‖

88
Fig
ure
4.2
5 O
SE
PI
map f
or
―Satisfa
ction
of
most
of th
e e
conom
ical fe
asib
ility
crite
ria
‖
89
After degrees of satisfaction for ―Satisfaction of most of the economical feasibility
criteria‖ and ―Satisfaction of most of the environmental objectives‖ are calculated for
each grid, these two satisfaction degrees are used to evaluate suitability of each grid
point for installation of solar energy power plants using the decision rules given in Table
4.3. As can be seen in Table 4.3, only the grids which satisfy both ―Satisfaction of most
of the economical feasibility criteria‖ and ―Satisfaction of most of the environmental
objectives‖ with a degree of at least 0.5 are identified as appropriate locations for solar
power plants. Therefore, in order to calculate OPI for each grid the ―and‖ aggregation
operator is used. Grid values of 0.5 and higher than 0.5 are considered as priority sites
for solar energy generation.
The OPI values for each grid are calculated and are provided on the map of the study
area in Figure 4.26. To show the priority sites (i.e. grids with an OPI of 0.5 or higher)
grids with OPI values lower than 0.5 are excluded from the study area and the resulting
map is provided in Figure 4.27. As can be seen in Figure 4.27, most of the yellow and
green areas are eliminated from Figure 4.26. Black areas in Figure 4.27 represent the
priority sites; in other words these areas are both economically and environmentally
feasible locations for solar power plant installations. Currently, there are not any
installed large scaled solar power plants in Turkey. However, during the interviews with
the General Directorate of Electrical Power Resources Survey and Development
Administration, it is learned that new legislation associated with power generation from
solar energy will be available in the future (Caliskan, 2009). It is believed that the
priority sites map will be useful for the site selection process of solar power plants.

90
Fig
ure
4.2
6 O
PI m
ap o
f th
e s
tud
y a
rea

91
Fig
ure
4.2
7 P
rio
rity
sites w
ithin
th
e s
tudy a
rea

92
4.3. Wind Energy
As the second case study a decision support tool for site selection of wind turbines is
developed by using GIS tools. This study contains site selection of only onshore wind
turbines due to the data unavailability for offshore installations. Wind energy potential
and environmental fitness/acceptability are used as decision criteria for the site
selection process. Potential environmental impacts of wind generation are identified in
accordance with Turkish legislations and previous studies and represented as fuzzy
objectives of the decision problem. The same study area composed of Uşak, Aydın,
Denizli, Muğla, and Burdur provinces is used to demonstrate the proposed site
selection procedure for wind turbines.
4.3.1. Methodology
The relevant parts of the general flowchart (Figure 3.1) for wind turbine site selection
process are given in Figure 4.28. As can be seen from Figure 4.28 the main difference
between the procedures for site selection of solar power plants and wind turbines is that
for wind turbines only wind energy potential is used as the economical feasibility
criteria. The rest of the procedure is the same with that of solar power plants.

93
Figure 4.28 Flowchart of site selection procedure for wind turbines
4.3.1.1. Identification of Environmental Objectives
Environmental objectives associated with energy generation with wind turbines are
identified through a literature review about wind turbine installation and government
laws and regulations. These objectives are quantified with certain criteria. A criterion is
a measurable aspect of a judgment, which makes it possible to characterize and
quantify alternatives in a decision making process (Voogd, 1983; Eastman et al., 1993).
Utilization of renewable energy resources such as wind reduces the dependency on
other countries for energy generation. Wind energy compared to fossil fuels causes less
environmental damage. One of the major contributions of wind energy to environmental
protection is through decreasing CO2 emissions (Caralis et al., 2008). Wind turbines do
Environmental objectives Wind energy potential Study area boundaries and potential ocations (i.e. grids)
Identification & quantification of environmental objectives
Representation of environmental objectives as fuzzy sets
Computation of individual satisfaction degree of each fuzzy objective for each grid location
Multi-criteria Decision Making using ―and‖, ―or‖, and OWA aggregator
operators
Calculation of overall environmental performance index (OEPI)
Representation of ―Sufficient potential for wind energy generation‖
as a fuzzy set
Computation of the satisfaction degree of ―Sufficient potential for wind energy generation‖ for each
grid location
SITE SELECTION
Data collection & processing

94
not release any atmospheric emissions while generating power; nonetheless, there are
also some negative impacts on both society and ecology (IEA, 2003). The
environmental impacts of wind energy which are commonly accepted by scientists are
generally listed as effects on animal habitats such as bird collisions, noise generation,
visual impact, safety issues, and electromagnetic interference.
Average bird collision to each wind turbine is in the range of 0.1 to 0.6 per year (Web
5). The rotating blades of wind turbines cause blur image on bird‘s eyes, therefore,
birds construe that image as safe to go through, which leads to bird collisions (Morrison
and Sinclair, 2004). In order to eliminate bird collisions, wind turbines should be located
at a certain distance from bird flyways. According to Yue and Wang (2006), wind
turbines must be located at least 500 meters away from wildlife conservation areas.
Another suggestion (Clarke, 1991) is that locating wind turbines at a minimum distance
of 300 m away from bird habitat can provide bird protection.
A further impact of wind energy on habitat is noise. Although there are some regulations
in terms of acceptable noise levels which depend on perception of communities, it is not
easy to establish common noise principles (Wrixon et al., 1993). Different authorities
have different noise criteria, one of which claims that wind turbines should be located at
least 500 m away from nearest habitat (Tester at al., 2005).
Visual impact, another side effect of the wind turbines, varies between individuals.
According to Ramirez-Rosado et al. (2008) since the wind energy is constructing the
clean energy image, some people might enjoy seeing them; on the other hand, the
other people might consider it has adverse impacts on urban landscape. Baban and
Parry (2001) state that wind turbines should be located 2000 m away from large
settlements because of aesthetic concerns.
Even though a number of serious accidents have occurred, the safety record of wind
energy is generally good that most of the accidents are due to poor management or
noncompliance with safety regulations (Wrixon et al., 1993). Voivontas et al. (1998)
suggest that minimum distance from towns must be 1000 m for safety reasons and the
same criteria is valid for reducing the visual impact as well. Nguyen (2007) studied wind
energy in Vietnam and concluded that a 2000 m buffer zone around city centers is
unsuitable for wind development because of safety and visibility considerations.

95
According to Nguyen (2007), one other restriction that needs to be taken into account
while selecting the location of wind turbines is their proximity to airport areas due to
safety and visibility reasons. Nguyen (2007) suggests that wind turbines should be at
least 2500 m away from the nearest airport area. In addition, General Directorate of
Civil Navigation in Turkey sets some restrictions about structures around airports.
Basically, these restrictions aim to protect flight security, human lives, and property. In
the first 3000 m zone there should not be any structure such as hospitals, schools or
common buildings that may cause reflection. Buildings that are less than 45 m height
are allowed with in the second 3000 m zone (General Directorate of Civil Navigation,
2007).
Moreover, wind turbines cause electromagnetic interference by scattering the
electromagnetic waves from navigation and telecommunication systems (IEA, 2003).
Although television and radio signals may be affected by wind turbines which are
located in a 2-3 km zone around the largest installation, today, cable networks or line-
of-sight microwave satellite transmissions are eliminating the electromagnetic
interference effect of wind energy (IEA, 1987).
4.3.1.2. Quantification of objectives
Although the environmental impacts of wind energy are considerably tolerable with
respect to those of conventional energy systems (Tsoutsos et al., 2005), they can be
minimized by appropriate site selections for installations of wind turbines Therefore,
before installing wind energy systems, comprehensive analyses should be conducted in
order to identify the most favorable locations. Environmental objectives and associated
criteria together with the references are given in Table 4.4.

96
Table 4.4 Environmental Objectives and Associated Criteria from previous studies
Environmental objectives Criteria Referance
Acceptable in terms of natural reserves
1000 m away from areas of ecological value (Baban and Parry, 2001)
400 m away from water bodies (Baban and Parry, 2001)
250 m away from ecologically sensitive areas (Yue and Wang, 2006)
Acceptable in terms of safety and aesthetics for large city
centers
2000 m away from large settlements (Baban and Parry, 2001)
2000 m away from cities, urban centers (Nguyen, 2007)
Acceptable in terms of safety and aesthetics for town
centers Minimum 1000 m away from
towns (Voivontas et al., 1998)
Acceptable in terms of safety and aesthetics for airports
2500 m away from airports (Nguyen, 2007)
2500 m away from airports (Voivontas et al., 1998)
Acceptable in terms of noise
500 m away from nearest habitat
(Tester et al., 2005; Ramirez-Rosado et al.,
2008; Yue, 2006)
400 m away from nearest habitat (IEA, 1987)
Acceptable in terms of bird habitat
at least 500 m away from wildlife conservation areas (Yue and Wang, 2006)
300 m from nature reserves to reduce risk to birds (Clarke, 1991)
In addition, government laws and regulations play an important role in defining the
environmental objectives. In this study, Turkish legislations associated with noise,
safety, and natural reserves are used in indentifying environmental objectives
associated with wind energy generation. These objectives and associated criteria are
given in Table 4.5. Turkish law of electricity generation from renewable energy
resources allows construction of wind energy turbines on forest areas, therefore, forest
areas are considered environmentally acceptable in this study (Law number: 5346).
According to national parks legislation, the structures which have adverse impacts on
habitat cannot be built on national parks since these areas have to be preserved. Only

97
the structures for visitors, management and research are allowed (Official Journal
Number: 19309).
Table 4.5 Environmental Objectives and Associated Criteria from regulations
Environmental Objectives
Criteria Regulation
Acceptable in terms of noise
Restriction for industrial areas: between 65dBa to 55dBa
Official journal number: 26809
Acceptable in terms of bird habitat
At least 2.5 km buffer zone to protect ecologic and topographic
features
Official Journal Number: 21937
Safe in terms of natural reserves
Structures which have adverse impacts on habitat cannot be built
Official Journal Number: 19309
Acceptable in terms of safety
Minimum distance is 3000 m and maximum distance is 6000 m
General Directorate of Civil Navigation, 2007
4.3.1.3. Data Collection and Processing
For site selection of wind turbines, different map layers need to be collected. These
layers include study area boundaries, wind energy potential, settlement areas, roads,
water bodies, natural reserves, etc. The study area is divided into regular grids with
certain size and each of these grids is considered as a potential location for installation
of wind turbines. In addition, criteria associated with each environmental objective
(Table 4.4 and 4.5) need to be represented by criterion maps. For example, a map layer
of proximity to airports for ―Acceptable in terms of safety and aesthetics for airports‖
objective is prepared by calculating each grid‘s distance to the nearest airport in the
study area. Similarly various map layers are prepared for each environmental objective
using the associated criteria given in Tables 4.4 and 4.5.
4.3.1.4. Representation of Environmental Objectives as Fuzzy Sets
Fuzzy membership functions for seven environmental objectives, as identified in Table
4.4, are generated using the associated criteria given in Tables 4.4 and 4.5 As can be
seen from Table 4.4, minimum distances of 250 m, 400 m, and 1000 m are suggested
for ecologically sensitive areas, water bodies, and areas of ecologic value, respectively

98
(Baban and Parry, 2001; Yue and Wang, 2006). All of these criteria are integrated into a
single restriction and represented with a fuzzy set named ―Acceptable in terms of
natural reserves‖. The membership function for this fuzzy environmental objective is
generated by using this criterion and is given in Figure 4.29.
Figure 4.29 Fuzzy set for ―Acceptable in terms of natural reserves‖
Another environmental objective is to maintain a power generation scheme which is
―Acceptable in terms of safety and aesthetics‖. As can be seen from Tables 4.4 and 4.5,
different criteria are set for large settlements/urban centers, towns, and airports. In
addition to these criteria, minimum and maximum buffer zones around airports are set
by the notice of General Directorate of Civil Navigation. Minimum and maximum
distances to the airports are set as 3000 m and 6000 m, respectively (General
Directorate of Civil Navigation, 2007). Structures which may shine are not allowed in
first 3000 m zone, while buildings which are less than 45 m height are allowed in the
second 3000 m zone (General Directorate of Civil Navigation, 2007). Three different
fuzzy sets, ―Acceptable in terms of safety and aesthetics for large city centers‖,
―Acceptable in terms of safety and aesthetics for town centers‖, and ―Acceptable in
terms of safety and aesthetics for airports‖ are formed using the criteria provided in
Tables 4.4 and 4.5 and are given in Figures 4.30, 4.31, and 4.32, respectively.

99
Figure 4.30 Fuzzy set for ―Acceptable in terms of safety and aesthetics for large city
centers‖
Figure 4.31 Fuzzy set for ―Acceptable in terms of safety and aesthetics for town
centers‖
Figure 4.32 Fuzzy set for ―Acceptable in terms of safety and aesthetics for airports‖
Noise is another environmental consideration that needs to be evaluated. As can be
seen from Table 4.5, even though there are dBa restrictions for industrial areas
(between 65 dBa to 55 dBa) in current noise legislation of Turkey, minimum required
distances to settlements are not set (Official journal number: 26809). The noise level of
a wind turbine which has 1 MW power is expected to be 45 dBa at the distance of 300

100
m (Environment Foundation of Turkey, 2006). In addition, as can be seen from Table
4.4, 400 m and 500 m are identified as tolerable levels in four different studies. All of
these criteria are used to define the membership function of the fuzzy set ―Acceptable in
terms of noise‖ and it is given in Figure 4.33.
Figure 4.33 Fuzzy set for ―Acceptable in terms of noise‖
Bird migration pathways and a certain buffer zone along these pathways are not
appropriate locations for wind turbines. In addition to bird migration pathways, wetlands
and protection zones are main locations of bird habitat. Wetlands and protection zones
are determined by Ministry of Environment and Forestry. According to the Turkish
legislation about wetlands (Official Journal Number: 21937) there must be at least 2.5
km buffer zone to protect ecologic and topographic features of these areas (Table 4.5).
The fuzzy membership function for ―Acceptable in terms of bird habitat‖ is formed by
using the information provided in Tables 4.4 and 4.5, and is given in Figure 4.34.
Figure 4.34 Fuzzy set for ―Acceptable in terms of bird habitat‖

101
4.3.1.5. Computation of individual satisfaction degrees
The generated membership functions are used to compute individual satisfaction
degree of each potential location (i.e. grid point) for each environmental objective in
GIS. To calculate and store all the required information for individual satisfaction
degrees of each fuzzy environmental objective, a separate layer is created in GIS. For
example, in the layer corresponding to ―Acceptable in terms of noise‖, data related with
housing areas is stored since the noise level of the wind turbines should not disturb the
population in the residential area. The individual satisfaction degree of each fuzzy
environmental objective for each grid is evaluated by using the data stored in these
layers.
Membership function of the fuzzy environmental objective is used to determine the
fulfillment degree of this objective by each potential location. These individual
satisfaction degrees are recorded in a separate column in the GIS database. The next
step is to aggregate these individual satisfaction degrees into an OEPI.
4.3.1.6. Representation of wind energy potential as a fuzzy set
Wind energy potentials at potential locations (i.e. grid points) are not included in the
OEPI calculations. However, while performing site selection, both the wind energy
potential and environmental acceptability/fitness need to be considered. A location
which does not have sufficient wind energy potential is not an appropriate location for
wind turbines no matter how high its OEPI is. Thus, the next step is to obtain the
available wind energy potential map of the study area.
During interviews with the General Directorate of Electrical Power Resources Survey
and Development Administration, it became clear that economically feasible power
values for generating wind energy in Turkey are between 300 Ṗ/A and 400 Ṗ/A.
However, in Europe satisfactory values start from 200 Ṗ/A (Çobancıoğlu, 2009; Malkoç,
2009). In order to quantitatively represent sufficient/feasible wind energy potential, a
fuzzy set named ―Sufficient potential for wind energy generation‖ is formed using this
information. The membership function of this fuzzy set is given in Figure 4.35. The wind
energy potential map of the study area is used to generate wind potential layer in GIS.
―Sufficient potential for wind energy generation‖ fuzzy set and the wind energy potential

102
layer is used together to calculate a degree of satisfaction for ―Sufficient potential for
wind energy generation‖.
Figure 4.35 Fuzzy set for ―Sufficient potential for wind energy generation‖
4.3.1.7. Multi-criteria Decision Making (MCDM)
In this case study, ―and‖, ―or‖, and OWA (for ―satisfaction of most of the objectives‖)
operators are used as MODM tools in evaluating alternatives with respect to various
fuzzy environmental objectives. Utilization of the quantifier ―most‖ is explained in detail
and provided in Section 3.4 of this thesis. Therefore, it is not provided here again.
4.3.1.8. Site Selection
At the end of the procedure given in Figure 4.28, each grid is associated with a degree
of satisfaction for ―Sufficient potential for wind energy generation‖ and ―Satisfaction of
most of the environmental objectives‖ (i.e. OEPI). Each grid point need to be evaluated
based on these two criteria. Aggregation of satisfaction degrees of these two criteria is
another decision making process. The same decision criteria used for solar power
plants is used for wind turbines as well; however for the sake of completeness it is
provided here again in Table 4.6.

103
Table 4.6 Site selection criteria for wind energy systems
Degree of satisfaction for
“Sufficient potential for wind energy
generation”
Degree of satisfaction for “Satisfaction of
most of the environmental
objectives”
DECISION for the grid (i.e. alternative)
0.0-0.5 0.0-0.5 Eliminate – due to both insufficient
potential and environmental concerns.
0.0-0.5 0.5-1.0 Eliminate – due to insufficient
potential.
0.5-1.0 0.0-0.5 Eliminate for now – due to
environmental concerns. Consider remedial actions and reevaluate.
0.5-1.0 0.5-1.0 Mark as priority site for wind energy
generation.
As can be seen from Table 4.6, only the grid points which satisfy both ―Sufficient
potential for wind energy generation‖ and ―Satisfaction of most of the environmental
objectives‖ with a degree of at least 0.5 are identified as appropriate wind turbine
locations. These grids can be referred to as ―priority sites‖ for wind energy generation.
Priority sites can be identified in GIS environment using the ―and‖ operator with the
following procedure: Degrees of satisfactions for ―Sufficient potential for wind energy
generation‖ and ―Satisfaction of most of the environmental objectives‖ are aggregated
by the ―and‖ operator to give an OPI and grids with an OPI of 0.5 and higher are
selected.
4.3.2. Example Application for Wind Turbines
To demonstrate the proposed site selection methodology for wind turbines, the same
study area used for site selection of solar power plants is used. A detailed map of the
study area and location of the study area within Turkey are given in see Figure 4.3 and
Figure 4.4. High wind power potential of the study area makes it attractive for
renewable energy investors. The current wind potential map of the study area is
obtained from General Directorate of Electrical Power Resources Survey and

104
Development Administration and is given in Figure 4.36. Wind energy potential map
contains available power values at a height of 50 m.
First, associated layers for wind energy potential, settlement areas, roads, water
bodies, natural reserves, wetlands, bird migration pathways, and airports are obtained
for the study area. As explained earlier, environmental criteria associated with wind
energy generation are identified and represented as fuzzy sets (see Figures 4.29 to
4.35). Then 250 m point grids were created for the whole study area in ArcGIS 9.2
software. Individual satisfaction degrees of each fuzzy environmental objective for each
grid location are evaluated by using GIS tools and they are aggregated into an OEPI.
The attitude of the decision maker are included in the decision making process through
utilization of different aggregation operators. In this study, ―Satisfaction of most of the
environmental objectives‖ (i.e. OWA), ―Satisfaction of all the environmental objectives‖
(i.e. ―anding‖) and ―Satisfaction of any of the environmental objectives‖ (i.e. ―oring‖) are
investigated. OEPI of wind energy associated with ―Satisfaction of most of the
environmental objectives‖ is given in Figure 4.37.
In Figure 4.37, red represents a membership value of 1 while blue represents a
membership value of 0 in the fuzzy set ―Satisfaction of most of the environmental
objectives‖. In other words, the red grids are the ones where satisfaction of most of the
environmental objectives is fully accomplished. As can be seen from Figure 4.37, a big
portion of the study area (i.e. red regions) satisfies most of the environmental
objectives. The vertical yellow band passing through the study area represents a bird
migration route. As expected the compatibility of this band with ―Satisfaction of most of
the environmental objectives‖ fuzzy set is less than one (i.e. it is marked with yellow
instead of black on the map). Similarly, areas close to lakes and other water bodies,
large city centers, natural reserves, town centers, airports are marked with different
tones of yellow and green which indicate various satisfaction degrees in between zero
and one. The tones between red to blue is governed by the proximity of the grid point to
these locations.

105
Fig
ure
4.3
6 C
urr
en
t w
ind p
ote
ntial fo
r th
e s
tudy a
rea

106
Fig
ure
4.3
7 O
EP
I m
ap f
or
―Sa
tisfa
ction o
f m
ost
of th
e e
nviro
nm
enta
l ob
jectives‖

107
Aggregation operators ―and‖ and ―or‖ are used as well to generate OEPI for
―Satisfaction of all of the environmental objectives‖ and ―Satisfaction of any of the
environmental objectives‖, respectively. The OEPI maps for ―and‖ and ―or‖ operators
are given in Figures 4.38 and 4.39, respectively. The ―and‖ operator represents the
worst case scenario. As can be seen from Figure 4.38, the bird migration route is
marked with a blue band (i.e. membership function value for ―Satisfaction of all of the
environmental objectives‖ fuzzy set is zero). Since ―Satisfaction of all of the
environmental objectives‖ is required and the bird migration route has an individual
satisfaction degree of zero for ―Acceptable in terms of bird habitat‖ fuzzy objective, the
overall satisfaction degrees for the grids located in this bird migration route band
become zero. Similarly, all water bodies, large city centers, natural reserves, town
centers, airports are marked with blue zones in Figure 4.38. Not having many yellow
and green zones in Figure 4.38, indicates that most of the grid points either satisfy all
the fuzzy objectives (i.e. overall satisfaction degree is one and consequently the grid is
marked with red) or there is at least one fuzzy objective which is not satisfied at all (i.e.
the grid has an individual satisfaction degree of zero for at least one of the fuzzy
objectives). ―Satisfaction of any of the environmental objectives‖ requirement produces
a map which is completely red (see Figure 4.39). This indicates that all the alternatives
(i.e. potential locations) fully satisfy at least one of the fuzzy objectives. Thus, OEPI for
all grids are one.
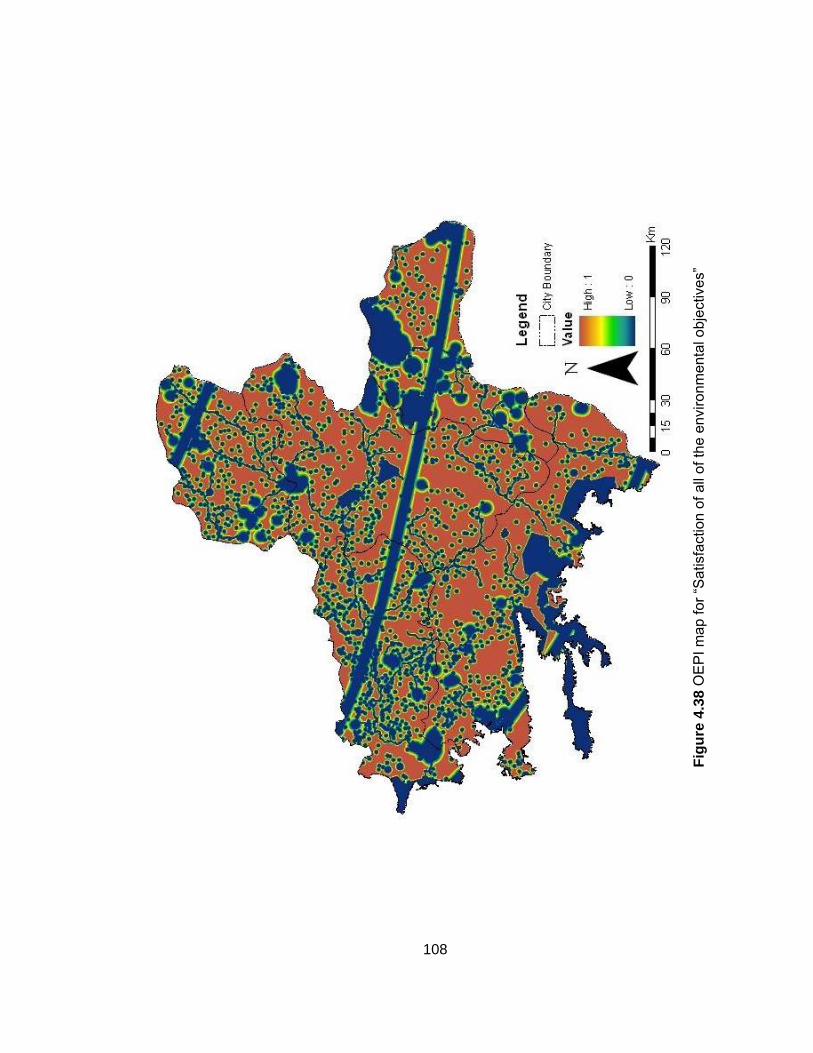
108
Fig
ure
4.3
8 O
EP
I m
ap f
or
―Sa
tisfa
ction o
f all
of th
e e
nviro
nm
enta
l o
bje
ctive
s‖

109
Fig
ure
4.3
9 O
EP
I m
ap f
or
―Sa
tisfa
ction o
f any o
f th
e e
nviro
nm
enta
l ob
jectives‖

110
Wind energy potential map of the study area (Figure 4.36) is used together with the
membership function of ―Sufficient potential for wind energy generation‖ fuzzy set and a
satisfaction degree is calculated for each grid point. The satisfaction degree is an
indication of how much each grid location belongs to ―Sufficient potential for wind
energy generation‖ fuzzy set. In other words, the fuzzy set converts wind energy
potential of each grid into a value in the range [0, 1]; 0 representing not sufficient
potential for wind energy generation and 1 representing completely sufficient potential
for wind energy generation.
Degrees of satisfaction for ―Sufficient potential for wind energy generation‖ and
―Satisfaction of most of the environmental objectives‖ (i.e. OEPI) for each grid point
together with decision criteria given in Table 4.6 are used to evaluate suitability of each
grid point for installation of wind turbines. As can be seen from Table 4.6, only the grids
which satisfy both ―Sufficient potential for wind energy generation‖ and ―Satisfaction of
most of the environmental objectives‖ with a degree of at least 0.5 are identified as
appropriate wind turbine locations. Thus an OPI is calculated for each grid point by
aggregating the satisfaction degrees of ―Sufficient potential for wind energy generation‖
and ―Satisfaction of most of the environmental objectives‖ with the ―and‖ operator. Grid
points with an OPI value of 0.5 can be referred to as priority sites for wind energy
generation.
OPI for each grid point of the study area are provided in Figure 4.40. As can be seen
from Figure 4.40, the OPI values range between 0 and 1. Grid points with 0 OPI are
locations where environmental criteria and sufficiency of wind potential completely fails,
while grid points with an OPI of 1 are the best locations for installing wind turbines.
Acceptable grid points for wind turbines are evaluated using the decision criteria
provided in Table 4.6. The grid points with an OPI of 0.5 and higher are selected as
priority sites and given in Figure 4.41. As can be seen from Figure 4.40, green areas
(i.e. grids with an OPI of 0.5 and smaller) of Figure 4.40 are eliminated from the priority
sites. However, it should be noted here that these grids may be turned into priority sites
with implementation of appropriate environmental measures. Thus, these locations
require further study and reevaluation. Already existing wind turbine locations are
marked on Figures 4.40 and 4.41. As can be seen from Figure 4.41, some of the
existing wind turbines are located on the priority sites identified in this case study. It can

111
be concluded that locations of these existing turbines are acceptable with respect to
both sufficiency of wind potential and satisfaction of environmental objectives.

112
Fig
ure
4.4
0 O
PI m
ap

113
Fig
ure
4.4
1 P
rio
rity
sites

114
4.4. Hybrid Wind-Solar Energy Systems
Feasible locations within the study area for wind turbines and solar power plants are
identified separately. However, considering advantages of hybrid systems which are
presented in the previous researches, priority sites for wind and solar energy are
combined to identify environmentally and economically suitable locations for
constructing hybrid systems composed of wind turbines and solar power plants. Priority
maps of wind and solar energy are overlaid by using ―bitwise and‖ tool in ArcGIS 9.2
software in order to identify priority sites for hybrid systems of wind and solar energy
which are provided in Figure 4.42.

115
Fig
ure
4.4
2 P
rio
rity
sites for
hybri
d s
yste
ms o
f w
ind a
nd s
ola
r en
erg
y

116
As can be seen in Figure 4.42, feasible locations for wind-solar hybrid systems are
marked with red. Black areas indicate suitable locations either for wind turbines or for
solar power plants. If a hybrid wind-solar system is constructed on one of these red
spots the energy generation efficiency will increase and discontinuities in energy
generation may be minimized.

117
CHAPTER 5
RESULTS AND DISCUSSIONS
It is well accepted that RES may assist to overcome the environmental problems
associated with conventional energy systems. Today, many countries around the world
utilize RES and integrate RES into their current energy policies. However, it became
clear that RES may have various negative environmental impacts which are mostly
related to the geographical locations of renewable energy facilities. Therefore, in this
thesis a decision support tool for site selection of wind and solar energy generation
facilities is proposed. Decision support tool that utilizes a fuzzy decision making
approach allows combined assessment of economical and environmental criteria in GIS
environment.
During the interviews with the General Directorate of Electrical Power Resources
Survey and Development Administration, it became clear that renewable energy
investments, particularly, those for wind energy are expected to increase in the near
future. However, to our knowledge, there is not any decision support system that can
provide guidance to the authorities in evaluating the RES applications. We believe that
the proposed decision support tool may provide useful guidance both for the investors
and the authorities in identifying suitable locations for RES with respect to
environmental and economical aspects.
Environmental and economical criteria related with wind and solar energy generation
facilities are identified through a detailed review of previous studies, Turkish Laws and
Legislations, and interviews with the General Directorate of Electrical Power Resources

118
Survey and Development Administration. These environmental and economical criteria
are represented by fuzzy sets and an individual satisfaction degree for each alternative
location with respect to these criteria is calculated by using the membership functions of
the identified criteria. Thus, the analysis is highly dependent on the selected
membership functions that represent the environmental and economical criteria. It
should be noted here that the membership functions are developed using the results of
previous studies, current Turkish laws and regulations, and personal judgment in this
study. The membership functions need to be revised when new information becomes
available.
As the final step, these individual satisfaction degrees are aggregated into overall
performance values for environmental and economical criteria using different
aggregator operators for wind energy and OWA for solar energy. Finally these two
overall performance values are used together to evaluate the priority sites (i.e.
environmentally and potentially favorable sites) for wind and solar energy generation
facilities. The proposed methodology is tested on a case study area. The case study
area is composed of Uşak, Aydın, Denizli, Muğla, and Burdur provinces in Turkey.
Priority sites within the study area are identified for wind turbines, solar power plants,
and hybrid systems.
In the first case study, site selection for solar power plants within the study area is
realized. The study area is divided into 250 m by 250 m grids where each grid
represents an alternative location for wind turbine installations. In this example, various
economical feasibility criteria (i.e. solar energy potential, slope, proximity to
transmission line and urban areas) together with a set of environmental objectives are
used to identify priority sites for solar power plants. First, the individual satisfaction
degrees of the identified environmental objectives are aggregated into an OEPI for each
alternative location using the OWA aggregator (see Figure 4.24). As the second step,
individual satisfaction degrees of each alternative location with respect to the
economical feasibility criteria are aggregated into an OSEPI value (see Figure 4.25).
Finally, OPI is calculated by aggregating the OEPI and OSEPI using the ―and‖
aggregator (see Figure 4.26). Priority sites are specified using the following decision
criteria: sites with an OPI of 0.5 or higher are suitable locations for solar energy
generation facilities in terms of environmental and economical criteria (see Figure 4.27).

119
It should be noted here that, each identified priority site is a 250 m by 250 m area.
Additional analysis need to be carried out to specify exact location of the power plant
within the priority site.
Currently, large scaled solar energy facilities do not exist in Turkey due to the financial
burden of solar technologies. However, as solar energy technologies become financially
affordable for the investors, it is expected to have large scale solar power plant
installations in Turkey. Therefore, results of this thesis may assist decision makers to
assign licenses for future solar energy facilities. The proposed methodology is expected
to result in more informed decisions both for investors and the governing authorities.
In the second case study, site selection for wind turbines is realized. First, individual
satisfaction degrees of each alternative location with respect to the identified
environmental objectives are calculated and then aggregated into an OEPI by using
―and‖, ―or‖ and OWA aggregators. The results show that, all of the study area is feasible
in terms of environmental objective when ―or‖ aggregator is used (see Figure 4.39)
while study area excluding all the water bodies, large city centers, natural reserves,
town centers, airports is feasible when ―and‖ aggregator is used (see Figure 4.38).
These two aggregators represent two extreme cases. However, in real world, the
decision maker usually is willing to take some risk and accept satisfaction of most of the
environmental objectives. This is accomplished by the OWA aggregator. Areas
identified as feasible by the OWA aggregator satisfy most of the environmental
objectives (see Figure 4.37). OWA aggregator is not as strict as the ―and‖ operator,
however it is not as tolerant as the ―or‖ operator. Satisfaction of each of the
environmental objective impact the decision and higher satisfaction of each objective
result in a higher overall satisfaction, but complete failure of one of the environmental
objectives does not result in a zero overall satisfaction, only decreases the degree of
overall satisfaction.
As the second step, the impact of wind potential is integrated into the evaluation
process and an OPI for wind turbines is calculated by aggregating wind potential which
is represented by a fuzzy set called ―Sufficient potential for wind energy generation‖ and
the OEPI. To aggregate the OEPI and satisfaction degree of ―sufficient potential for
wind energy generation‖ the ―and‖ operator is used (see Figure 4.40). Alternative
locations (i.e. grid points) having an OPI of 0.5 or higher are identified as priority sites

120
(see Figure 4.41). Priority sites are the sites which are suitable with respect to both
wind potential and environmental concerns.
The final analysis is to assess suitability of the locations of the existing wind turbines in
the study area. Operating wind turbines are marked on the priority sites map. The
results show that some of the operating wind turbines are not located on the priority
sites identified in this thesis. For example, all of the wind turbines in Uşak-Soke, 3 wind
turbines in Muğla-Datca, 36 wind turbines in Aydın-Soke, 7 wind turbines in Aydın-
Didim are not located on priority sites. This is because Energy Market Regulatory
Authority and the General Directorate of Electrical Power Resources Survey and
Development Administration are assigning permits considering primarily wind energy
potential and economic feasibility (Web 13). Environmental impacts are not considered
in assigning permits. The proposed approach may assist the authorities in evaluating
alternative applications in terms of both wind potential and environmental concerns.
As a final analysis priority sites within the case study area for hybrid systems (i.e. an
energy generating facility which combines wind turbines and solar power plants) are
identified. Hybrid systems increase energy generation efficiency by decreasing negative
impacts of weather and climatic conditions on a wind turbine or a solar power plant
alone. In this thesis, priority sites for hybrid systems are obtained by overlaying priority
sites maps of wind and solar energies and can be seen in Figure 4.42 of this thesis.
Locating hybrid systems at these priority sites is expected to increase the efficiency of
energy generation while minimizing negative impacts of these systems on the
environment.
To evaluate environmental and economical constraints, various analyses need to be
conducted using spatial data. GIS provides extensive tools to conduct such analyses.
Moreover, in real life representation of environmental and economical criteria using
crisp sets is not realistic. Representation of such complex phenomena can better be
achieved by using fuzzy sets. Thus, in this thesis implementation of fuzzy decision
making tools is realized in GIS environment, namely ArcGIS 9.2 which has some build-
in tools to conduct various operations such as weighted sum, weighted overlay etc.
However, it does not have the necessary tools to carry out operations required for OWA
aggregation. Thus Excel is used in combination with ArcGIS 9.2 to effectively conduct
OWA aggregation. To ease such calculations and save time a number of new GIS tools

121
are developed. These new tools assist decision makers to implement the proposed
methodology easily and in a timely manner.
122
CHAPTER 6
CONCLUSIONS AND RECOMMENDATIONS
Today, Energy Market Regulatory Authority and the General Directorate of Electrical
Power Resources Survey and Development Administration assign permits for wind
turbines according to economical and potential concerns such as dominant wind
direction, stability of the wind speed, type of wind turbines etc. (Cobancioglu, 2009;
Malkoc, 2009). However, economic feasibility needs to be considered together with
environmental fitness in order to achieve sustainable energy generation. A decision
support system to simultaneously evaluate economical feasibility and environmental
criteria in identification of suitable locations for RES is developed in this thesis. To our
knowledge there is not any decision support system in Turkey which is available for the
investors or the authorities; thus the proposed tool is of practical importance.
Application of the proposed approach for the case study for site selection of wind
turbines demonstrated that all of the wind turbines in Uşak-Soke, 3 of the wind turbines
in Muğla-Datca, 36 of the wind turbines in Aydın-Soke, and 7 of the wind turbines in
Aydın-Didim within the study area are not located on the identified priority sites (see
Figure 6.1).

123
Fig
ure
6.1
Com
pari
so
n o
f curr
ent w
ind t
urb
ine loca
tio
ns
Win
d e
ne
rgy
po
ten
tia
l a
tla
s
Pri
ori
ty S
ites f
or
win
d e
ne
rgy
Uşa
k-S
öke
Ayd
in-S
öke
Ayd
in-D
idim
Muğla
-Datç
a

124
Since, the site selection process is solely based on wind potential, operational wind
turbines pose risk of generating negative environmental impacts. As can be seen in
Figure 6.1, black represents the priority sites which satisfy most of the environmental
objectives and sufficient wind potential. Therefore, a big proportion of the southwest
region within the study area is identified as feasible locations for future wind turbine
constructions. Utilization of the proposed approach in the future may help both investors
and the governing authorities to identify both environmentally and potentially suitable
locations for wind turbines.
The application of the proposed approach for site selection of solar power plants within
the study area is conducted as well. The priority sites for solar power plants are given in
Figure 4.27. Approximately 477 km2 of the study area is identified as priority sites for
solar power plant constructions. Currently no large scale solar power plants exist in
Turkey. This is beneficial for our country because utilization of the proposed decision
support tool will give the chance to the authorities to assign permits to economically
feasible solar power plants which also have minimum negative impacts on the
environment.
Hybrid systems are not applied in Turkey yet. Thus, similar to solar power plants,
Turkey will benefit from utilization of the decision support tool for site selection of hybrid
systems. Priority sites identified using the proposed approach for hybrid systems of
wind and solar energy can be seen in Figure 4.42. Approximately 62 km2 area of the
study area is feasible to deploy hybrid wind-solar system which will have higher
chances to provide continuous and economically feasible energy and at the same time
will sustain the environment. With the identified environmental and economical criteria a
total of 477 km2, 6996 km2, and 62 km2 of the study area are identified as priority sites
for solar power plants, wind turbines and hybrid systems, respectively. This indicates
that even when environmental objectives in addition to the potentials are considered in
site selection of solar, wind and hybrid systems, reasonably large areas are identified
as suitable locations. Moreover, the proposed methodology allows inclusion of the
decision makers‘ preferences into the site selection process which brings flexibility to
the procedure.
In conclusion, the proposed decision support system is used to evaluate economic
feasibility together with environmental acceptability for future wind, solar and hybrid

125
energy facilities within the study area. However, the proposed approach is robust; it can
easily be modified for additional environmental and economical criteria, for other
regions, and other RES. Thus, the proposed decision support system presents a useful
tool for site selection of different types of RES as long as associated environmental and
economical criteria are carefully identified and necessary data is obtained.
Investigation of EU regulations and revising environmental objectives with respect to
these requirements in addition to application of the proposed methodology for other
renewable energy sources such as geothermal, hydropower, biomass, and wave are
topics for further research.

126
REFERENCES
Abulfotuh, F. (2007). ―Energy efficiency and renewable technologies: the way to
sustainable energy future.‖ Desalination, 209, 275–282.
Ackermann, T., Soder, L. (2000). ―Wind energy technology and current status: a
review.‖ Renewable and Sustainable Energy Reviews, 4, 315-374.
Ahmed, N. A., Miyatake, M., Al-Othman, A. K. (2009). ―Hybrid solar photovoltaic/wind
turbine energy generation system with voltage-based maximum power point tracking.‖
Electric Power Components and Systems, 37, 43–60.
Akpinar, A., Komurcu, M. I., Kankal, M., Ozolcer, I. H., Kaygusuz, K. (2008). ―Energy
situation and renewables in Turkey and environmental effects of energy use.‖
Renewable and Sustainable Energy Reviews, 12, 2013–2039.
Arikan, F. (2009). ―Web GIS-based animal diseases surveillance system.‖ report
presented to Middle East Technical University, at Ankara, in partial fulfillment of the
requirements for the degree of Master of Engineering.
Arsenau, G., Lowell, K. (1992). ―Elements de Gestion Pour Les Suivis de la
Planification Forestiere au Quebec a I‘Aide GIS.‖ Proc. Canadian Conference on GIS
‗92, Ottawa, 303-316.
Asif, M., Muneer T. (2007). ―Energy supply, its demand and security issues for
developed and emerging economies.‖ Renewable and Sustainable Energy Reviews,
11, 1388–1413.
Baban, S. M. J., Parry, T. (2001). ―Developing and applying a GIS-assisted approach to
locating wind farms in the UK.‖ Renewable Energy, 24, 59–71.
Banai, R. (2005). ―Land Resource Sustainability for Urban Development: Spatial
Decision Support System Prototype.‖ Environmental Management, 36 (2), 282–296.

127
Bell, N., Schuurman, N., Hayes, M. V. (2007). ―Using GIS-based methods of multi-
criteria analysis to construct socio-economic deprivation indices.‖ International Journal
of Health Geographics 2007, 6-17.
Bhuiyan, M. M. H., Asgar, M. A., Mazumder, R. K., Hussain, M. (2000). ―Economic
evaluation of a stand-alone residential photovoltaic power system in Bangladesh.‖
Renewable Energy, 21, 403-410.
Bilen, K., Ozyurt, O., Bakirci, K., Karsli, S., Erdogan, S., Yilmaz, M., Comakli, O. (2008).
―Energy production, consumption, and environmental pollution for sustainable
development: A case study in Turkey.‖ Renewable and Sustainable Energy Reviews,
12, 1529–1561.
Boroushaki, S., Malczewski, J. (2008). ―Implementing an extension of the analytical
hierarchy process using ordered weighted averaging operators with fuzzy quantifiers in
ArcGIS.‖ Computers & Geosciences, 34, 399–410.
Brower M. (1992). Cool Energy. The MIT Press, London.
Brown, A. L., Affum, J. K. (2002). ―A GIS-based environmental modeling system for
transportation planners.” Computers, Environment and Urban Systems, 26, 577–590.
Bulut, H., Buyukalaca, O. (2007). ―Simple model for the generation of daily global solar-
radiation data in Turkey.‖ Applied Energy, 84, 477–491.
Caliskan, Mustafa (2009). Personal Communication. March 31, 2009, Ankara, Turkey.
Caralis, G., Perivolaris, Y., Rados, K., Zervos, A. (2008). ―On the effect of spatial
dispersion of wind power plants on the wind energy capacity credit in Greece.”
Environmental Research Letters, 3, 3-15.
Carrion, J. A., Estrella, A. E., Dols, F. A., Toro, M. Z., Rodriguez, M., Ridao, A. R.
(2008). ―Environmental decision-support systems for evaluating the carrying capacity of
land areas: Optimal site selection for grid-connected photovoltaic power plants.”
Renewable and Sustainable Energy Reviews, 12, 2358–2380.

128
Celik, A. N., (2002). ―Optimisation and techno-economic analysis of autonomous
photovoltaic–wind hybrid energy systems in comparison to single photovoltaic and wind
systems.‖ Energy Conversion and Management, 43, 2453–2468.
Celik, A. N. (2006). ―Present status of photovoltaic energy in Turkey and life cycle
techno-economic analysis of a grid-connected photovoltaic-house.‖ Renewable and
Sustainable Energy Reviews, 10, 370–387.
Chang, N. B., Parvathinathan, G., Breeden, J. B. (2008). ―Combining GIS with fuzzy
multi-criteria decision-making for landfill siting in a fast-growing urban region.‖ Journal
of Environmental Management, 87, 139–153.
Clarke, A. (1991). ―Wind energy progress and potential.‖ Energy Policy, 19, 742-755.
Cobancioglu, Bekir Turhan (2009). Personal Communication. February 17, 2009,
Ankara, Turkey.
Coskun, H. G., Alparslan, E. (2009). ―Environmental modelling of Omerli catchment
area in Istanbul, Turkey using remote sensing and GIS techniques.‖ Environ. Monit.
Assess., 153, 323–332.
Demirbas, A. (2006). ―Turkey‘s Renewable Energy Facilities in the Near Future.‖
Energy Sources, Part A (28), 527–536.
Dincer, I. (1999). ―Environmental impacts of energy.‖ Energy Policy, 27, 845-854.
Dragan, M., Feoli, E., Fernetti, M., Zerihun, W. (2003). ―Application of a spatial decision
support system (SDSS) to reduce soil erosion in northern Ethiopia.‖ Environmental
Modeling & Software, 18, 861–868.
Durak, M., Sen, Z. (2002). ―Wind power potential in Turkey and Akhisar case study.‖
Renewable Energy, 25, 463–472.
Eastman, J. R., Jiang, H. (1996). ―Fuzzy measures in multi-criteria evaluation.‖ Proc.
2nd International Symposium on Spatial Accuracy Assessment in Natural Resources
and Environmental Studies, Fort Collins, CO, 527-534.
Eastman, J.R., Jiang, H., and Toledano, J. (1993). Multicriteria and Multiobjective
Decision Making for Land Allocation Using GIS, edited by Beinat, E., and Nijkamp, P.,

129
Multicriteria Analysis for Land-Use Management. Dordrecht: Kluwer Academic
Publishers, 227-251.
Eastman, J. R., Kyem, P. A. K., Tolendano, J., Jin, W. (1993). ―GIS and decision
making.‖ United Nations Institute for Training and Research, Geneva.
Ediger, V. S., Kentel, E. (1999). ―Renewable energy potential as an alternative to fossil
fuels in Turkey.‖ Energy Conversion & Management, 40, 743-755.
Elliot, D. (2007) Sustainable Energy: Opportunities and Limitations, Palgrave
Macmillan, Great Britain.
Environment Foundation of Turkey (2006). Renewable energy sources in Turkey. TÇV,
Ankara, Turkey.
Ercanoglu, M., Kasmer, O., Temiz, N. (2008). ―Adaptation and comparison of expert
opinion to analytical hierarchy process for landslide susceptibility mapping.‖ Bull. Eng.
Geol. Environ., 67, 565–578.
Eskin, N., Artar, H., Tolun, S. (2008). ―Wind energy potential of Gokc eada Island in
Turkey.‖ Renewable and Sustainable Energy Reviews, 12, 839–851.
Evrendilek, F., Ertekin, C. (2003). ―Assessing the potential of renewable energy sources
in Turkey.‖ Renewable Energy, 28, 2303–2315.
Fedra, K. (1993). ―GIS and environmental modeling.‖ Environmental Modeling with GIS,
M. F. Goodchild et al., eds., Oxford University Press, USA, 35-50.
Fuller, R., Groom, G. (1993). ―The land cover map of Great Britain.‖ GIS Europe, 2 (8),
25-28.
General Directorate of Civil Navigation. (2007). ―Notice of construction criteria around
the airports‖.
Giavelli, G., Rossi, O. (1999). ―The AEOLIAN project: A MAB-UNESCO investigation to
promote sustainable tourism in the Mediterranean area.‖ International Journal of
Environmental Studies, 56 (6), 833-847.

130
Goodchild, M. F. (2003). ―Geographic information science and systems for
environmental management.‖ Annu. Rev. Environ. Resour., 28, 493–519.
Haack, B. (1996). ―Monitoring wetland changes with remote sensing: an East African
example.‖ Environmental Management, 20(3), 411-419.
Hang, Q., Jun, Z., Xiao, Y., Junkui, C. (2008). ―Prospect of concentrating solar power in
China—the sustainable future.‖ Renewable and Sustainable Energy Reviews, 12,
2505–2514.
Hill, M. J., Braaten, R., Veitch, S. M., Lees, B. G., Sharma, S. (2005). ―Multi-criteria
decision analysis in spatial decision support: the ASSESS analytic hierarchy process
and the role of quantitative methods and spatially explicit analysis.‖ Environmental
Modelling & Software, 20, 955–976.
Hongxing, Y., Wei, Z., Chengzhi, L. (2009). ―Optimal design and techno-economic
analysis of a hybrid solar–wind power generation system.‖ Applied Energy, 86, 163–
169.
[IEA] International Energy Agency. 1987. ―Renewable Sources of Energy.‖ IEA, Paris,
France.
[IEA] International Energy Agency. 1998 Benign Energy? The environmental
implications of renewable, IEA, Paris, France.
[IEA] International Energy Agency. 2003. ―Renewables for power generation status and
prospects.‖ IEA, Paris, France.
[IEA] International Energy Agency. 2006. ―Renewable energy: RD&D priorities. Insights
from IEA technology programmes.‖ IEA, Paris, France.
[IEA] International Energy Agency. 2008. ―Renewables information.‖ IEA, Paris, France.
Jankowski, P., Richard, L. (1994). ―Integration of GIS-based suitability analysis and
multi-criteria evaluation in spatial decision support system for route selection.‖
Environment and Planning, 21, 326-339.

131
Jankowski , P. (1995). ―Integrating geographical information systems and multiple
criteria decision-making methods.‖ Int. J. Geographic Information Systems, 9(3), 251-
273.
Jankowski, P., Andrienko, N., Andrienko, G. (2001). ―Map-centered exploratory
approach to multiple criteria spatial decision making.‖ International Journal of
Geographic Information Science, 15 (2), 101-127.
Jiang, H., Eastman, J. R. (2000). ―Application of fuzzy measures in multi-criteria
evaluation in GIS.‖ Int. J. Geographic Information Science, 14(2), 173-184.
Johnston, C. A., Cohen, Y., Pastor, J. (1996). ―Modeling of spatially static and dynamic
ecological process.‖ GIS and Environmental Modeling, M. F. Goodchild et al., eds., Fort
Collins, 149-154.
Kaya, D. (2006). ―Renewable energy policies in Turkey.‖ Renewable and Sustainable
Energy Reviews, 10, 152–163.
Kaygusuz, K. (2002). ―Environmental impacts of energy utilization and renewable
energy policies in Turkey.‖ Energy Policy, 30, 689–698.
Kaygusuz, K., Sari, A. (2003). ―Renewable energy potential and utilization in Turkey.‖
Energy Conversion and Management, 44, 459–478.
Kurklu, A., Ozmerzi, A., Bilgin, S. (2002). ―Thermal performance of a water-phase
change material solar collector.‖ Renewable Energy, 26, 391–399.
Law number: 3621. (1990). Coastal Law (Official journal number: 20495). Turkish
Republic.
Law number: 5346. (2005). ―Law of electricity generation from renewable energy
resources‖. Turkish Republic.
Law number: 5403. (2005). Soil Protection and Land Use Law (Official journal number:
25880). Turkish Republic.
Law number: 6831. (1956). Forestry Law (Official journal number: 9402). Turkish
Republic.

132
Lejeune, P., Feltz, C. (2008). ―Development of a decision support system for setting up
a wind energy policy across the Walloon Region (southern Belgium).‖ Renewable
Energy, 33, 2416–2422.
Liu, L., Wang, Z. (2009). ―The development and application practice of wind–solar
energy hybrid generation systems in China.‖ Renewable and Sustainable Energy
Reviews, 13, 1504–1512.
Lothian, A. (2008). ―Scenic Perceptions of the Visual Effects of Wind Farms on South
Australian Landscapes Scenic Perceptions of the Visual Effects of Wind Farms on
South Australian Landscapes.‖ Geographical Research, 46(2), 196–207.
MacDonald, M. L., Faber, B. G. (1997). ―Exploring the potential of multi-criteria spatial
decision support systems: A system for sustainable land-use planning and design.‖
Spatial multi-criteria decision making and analysis, J. C. Thill, ed., Ashgate, Great
Britain, 353-377.
Makropoulos, C. K., Butler D. (2006). ―Spatial ordered weighted averaging:
incorporating spatially variable attitude towards risk in spatial multi-criteria decision-
making.‖ Environmental Modelling & Software, 21, 69-84.
Malczewski, J. (1999) GIS and multi-criteria decision anaylysis, John Wiley & Sons,
New York.
Malczewski, J. (2006). ―GIS-based multi-criteria decision analysis: a survey of the
literature.‖ International Journal of Geographic Information Science, 20 (7), 703-726.
Malkoc, Yuksel (2009). Personal Communication. February 17, 2009, Ankara, Turkey.
Mas, J. K., Puig, H., Palacio, J. L., Sosa-Lopez, A. (2004). ―Modelling deforestation
using GIS and artificial neural networks.‖ Environmental Modelling & Software, 19, 461–
471.
Martins, F. R., Ruther, R., Pereira, E. B., Abreu, S. L. (2008). ―Solar energy scenarios in
Brazil. Part two: Photovoltaics applications.‖ Energy Policy, 36, 2865– 2877.

133
McKenney, D. W., Mackey, B. G., Zavist, B. L. (1999). ―Calibration and sensitivity
analysis of a spatially distributed solar radiation model.‖ International Journal of
Geographical Information Science, 13 (1), 49-65.
Morrison, M., Sinclair, K., (2004). ―Wind energy technology, environmental impacts of.‖
Encyclopedia of Energy, 6, 435-448.
Muneer, T., Asif, M., Cizmecioglu, Z., Ozturk, H. K. (2008). ―Prospects for solar water
heating within Turkish textile industry.‖ Renewable and Sustainable Energy Reviews,
12, 807–823.
Nguyen, K. Q. (2007). ―Wind energy in Vietnam: Resource assessment, development
status and future implications.‖ Energy Policy, 35, 1405–1413.
Official journal number: 19309. (1986). Legislation of natural parks. Turkish Republic.
Official Journal number: 20341. (1989). Law decree for the establishment of
Environmental Protection Agency for Special Areas. Turkish Republic.
Official journal number: 20702. (1990). Determination of national protection zones and
application principles. Turkish Republic.
Official journal number: 21374. (1992). Legislation of coastal law implementation.
Turkish Republic.
Official journal number: 21937. (1994). Legislation of wetland protection. Turkish
Republic.
Official journal number: 24055. (2000). Coordinates of Fethiye-Gocek and Koycegiz-
Dalyan national protection zones. Turkish Republic.
Official journal number: 26371. (2006). Boundary changes of Fethiye-Gocek national
protection zone. Turkish Republic.
Official journal number: 26551. (2007). Boundary changes of Foca national protection
zone. Turkish Republic.
Official journal number: 26809. (2002). Legislation of environmental noise
evaluation/management. Turkish Republic.
134
Omer A. M. (2008a). ―Energy, environment and sustainable development.‖ Renewable
and Sustainable Energy Reviews, 12, 2265–2300
Omer, A. M. (2008b). ―Green energies and the environment.‖ Renewable and
Sustainable Energy Reviews, 12, 1789-1821.
Ozerdem, B., Ozer, S., Tosun, M. (2006). ―Feasibility study of wind farms: A case study
for Izmir, Turkey.‖ Journal of Wind Engineering and Industrial Aerodynamics, 94, 725–
743.
Ozgur, M. A. (2008). ―Review of Turkey‘s renewable energy potential.‖ Renewable
Energy, 33, 2345–2356.
Paoli, C., Vassallo, P., Fabiano, M. (2008). ―Solar power: An approach to transformity
evaluation.‖ Ecological Engineering, 34, 191–206.
Phinn, S., Franklin, J., Hope, A., Stow, D., Huenneke, L. (1996). ―Biomass distribution
mapping using airbone digital video imagery and spatial statistics in a semi-arid
environment.‖ Journal of Environmental Management, 47 (2), 139-164.
Ramirez-Rosado, I. J., Garcia-Garrido, E., Fernandez-Jimenez, L. A., Zorzano-
Santamaria, P. J., Moneteiro, C., Miranda, V. (2008). ―Promotion of new wind farms
based on a decision support system.‖ Renewable Energy, 33, 558–566.
Reichling, J. P., Kulacki, F. A. (2008). ―Utility scale hybrid wind–solar thermal electrical
generation: A case study for Minnesota.‖ Energy, 33, 626–638.
[REN21] Renewable Energy Policy Network for the 21st Century (2006). ―Renewables
Global Status Report, 2006 update.‖ REN21, Paris.
Rodman, L. C., Meentemeyer R. K. (2006). ―A geographic analysis of wind turbine
placement in Northern California.‖ Energy Policy, 34, 2137–2149.
Rodriguez-Bachiller, A., Glasson, J. (2004) Expert systems and geographic information
systems for impact assessment, Taylor & Francis, Great Britain.
Ross, T. J. (2004) Fuzzy logic with engineering applications second edition, John Wiley
& Sons, England.

135
Seffino, L. A., Medeiros, C. B., Rocha, J. V., Yi, B. (1999). ―WOODSS — a spatial
decision support system based on workflows.‖ Decision Support Systems, 27, 105–123.
Sikder, I. U. (2009). ―Knowledge-based spatial decision support systems: An
assessment of environmental adaptability of crops.‖ Expert Systems with Applications,
36, 5341–5347.
Silva, F. N., Eglese, R. W. (2000). ―Integrating simulation modelling and GIS: spatial
decision support systems for evacuation planning.‖ Journal of the Operational Research
Society, 51, 423-430.
Sozen, A., Arcaklioglu, E., Ozalp, M., Kanit, E. G. (2004). ―Use of artificial neural
networks for mapping of solar potential in Turkey.‖ Applied Energy, 77, 273–286.
Store, R., Jokimaki, J. (2003). ―A GIS-based multi-scale approach to habitat suitability
modeling.‖ Ecological Modeling, 169, 1–15.
Tabesh, E. (1992). ―Map integration model applied in site selection.‖ Use of
microcomputers in geology. H. Kurzl and S. F. Merriam, eds., Plemum Press, New
York, 241-266.
Tester, J. W., Drake, E. M., Driscoll, M. J., Golay M. W., Peters W. A. (2005).
Sustainable energy; choosing among options. The MIT Press, Cambridge, MA.
Tsoutsos, T., Franztzeskaki, N., Gekas, V. (2005). ―Environmental impacts from the
solar energy technologies.‖ Energy Policy, 33, 289–296.
Ucar, A., Balo, F. (2009). ―Investigation of wind characteristics and assessment of wind-
generation potentiality in Uludag-Bursa, Turkey.‖ Applied Energy, 86, 333–339.
Ulgen, K. (2006). ―Optimum Tilt Angle for Solar Collectors.‖ Energy Sources, Part A
(28), 1171–1180.
Ulgen, K. Hepbasli, A. (2003). ―A Study on Evaluating the Power Generation of Solar-
Wind Hybrid Systems in Izmir, Turkey.‖ Energy Sources, 25, 241–252.
Valente, R. O. A., Vettorazzi, C. A. (2008). ―Definition of priority areas for forest
conservation through the ordered weighted averaging method.‖ Forest Ecology and
Management, 256, 1408–1417.

136
Voivontas, D., Assimacopoulos, D., Mourelatos, A., Corominas, J. (1998). ―Evaluation
of renewable energy potential using a GIS decision support system.‖ Renewable
Energy, 13(3), 333-344.
Voogd, S.H. (1983). Multicriteria Evaluation for Urban and Regional Planning. London,
Pion.
Web 1, General Directorate of Electrical Power Resources Survey and Development
Administration. (2009). ―Operating wind energy stations in Turkey.‖
<http://www.eie.gov.tr/turkce/YEK/ruzgar/Turkiye_RES.html > (April. 17, 2009).
Web 2, Energy Agency. (2008). ―Energy sources.‖
<http://www.energyagency.at/enercee/tr/supplybycarrier.htm#h4> (April.17, 2008).
Web 3, General Directorate of Electrical Power Resources Survey and Development
Administration. (2009). ―Hydropower energy.‖
<http://www.eie.gov.tr/turkce/YEK/HES/index_hidrolikenerji.html > (June. 10, 2009).
Web 4, General Directorate of Electrical Power Resources Survey and Development
Administration. (2007). ―Turkish Wind Energy Potential Atlas.‖ < http://repa.eie.gov.tr>
(April. 16, 2009).
Web 5, Wind Power Works. (2008). ―Wind power and the environment.‖
<http://www.windpowerworks.net/wind_facts/wind_power_and_the_environment.html >
(Dec.30, 2008).
Web 6, General Directorate of Electrical Power Resources Survey and Development
Administration. (2009). ―Solar energy in Turkey.‖
<http://www.eie.gov.tr/turkce/YEK/gunes/tgunes.html > (June. 10, 2009).
Web 7, General Directorate of Electrical Power Resources Survey and Development
Administration. (2007). ―Turkish Wind Energy Potential Atlas.‖
<http://repa.eie.gov.tr/MyCalculator/Aciklamalar.aspx > (May. 13, 2009).
Web 8, Energy Market Regulatory Authority. (2009). ―Electricity Market License
Operations.‖ < http://www.epdk.org.tr/lisanssorgu/elektriklisanssorgu.htm> (Feb. 15,
2009).

137
Web 9, General Directorate of Electrical Power Resources Survey and Development
Administration. (2007). ―Turkish Solar Energy Potential Atlas.‖
<http://repa.eie.gov.tr/MyCalculator/Default.aspx > (May. 1, 2009).
Web 10, World Electric Power Plants Data Base. (2009). ―Solar Power Plants in
Europe.‖ <http://www.industcards.com/solar-europe.htm> (April.25, 2009).
Web 11, World Electric Power Plants Data Base. (2009). ―Solar Power Plants in Arizona
and Nevada.‖ <http://www.industcards.com/solar-usa-az-nv.htm> (April.25, 2009).
Web 12, [EPA] Environmental Protection Agency. (2009). ―EPA tracked sites with utility
scale photovoltaic (PV) solar energy generation potential.‖
<http://epa.gov/renewableenergyland/maps/pdfs/utility_pv_us.pdf> (April.26,2009).
Web 13, General Directorate of Electrical Power Resources Survey and Development
Administration. (2009). ―Renewable Energy Situation in Turkey.‖
<http://www.eie.gov.tr/turkce/YEK/ruzgar/ruzgar_yol_haritasi.html > (June. 10, 2009).
Williams, S. K., Acker, T., Goldberg, M., Greve, M. (2008). ―Estimating the Economic
Benefits of Wind Energy Projects Using Monte Carlo Simulation with Economic
Input/Output Analysis.‖ Wind Energy, 11, 397–414.
World Energy Council-Turkish National Committee (2008). ―Energy report of Turkey,
2007-2008‖ World Energy Council-Turkish National Committee, Ankara, Turkey.
Wrixon G. T., Rooney A. –M. E., Palz W. (1993) Renewable Energy-2000. Springer-
Verlag, Berlin, Germany.
Yager, R. R. (1988). ―On Ordered Weighted Averaging Aggregation Operators in Multi-
criteria decision making.‖ IEEE Transactions on Systems, Man and Cybernetics, 18 (1),
183-190.
Yager, R. R. (1996a). ―Fuzzy logic in the formulation of decision functions from linguistic
specifications.‖ Kyberbetes, 25(4), 119 – 130.
Yager, R. R. (1996a). ―Quantifier guided aggregation using OWA operators.‖ Int. J.
Intell. Syst., 11, 49-73.

138
Yanar, T. A. (2003). ―The enhancement of the cell-based GIS analyses with fuzzy
processing capabilities.‖ report presented to Middle East Technical University, at
Ankara, in partial fulfillment of the requirements for the degree of Master of Engineering.
Ying, X., Guang-Ming, Z., Gui-Qui, C., Lin, T., Ke-Lin, W., Dao-You, H. (2007).
―Combining AHP with GIS in synthetic evaluation of eco-environment quality-A case
study of Hunan Province, China.‖ Ecological Modelling, 209, 97–109.
Yue, C. D., Wang, S. S. (2006). ―GIS-based evaluation of multifarious local renewable
energy sources: a case study of the Chigu area of southwestern Taiwan.‖ Energy
Policy, 34, 730–742.
Yuksel, I. (2008). ―Energy Utilization, Renewables and Climate Change Mitigation in
Turkey.‖ Energy Exploration & Exploitation, 26 (1), 35–52.
Yumrutas, R., Kaska, O. (2004). ―Experimental investigation of thermal performance of
a solar assisted heat pump system with an energy storage.‖ International Journal of
Energy Research, 28, 163–175.
Zadeh, L. A. (1965). ―Fuzzy sets.‖ Information and Control, 8, 338-353.
Zhu, X., Healey, R. G., Aspinall, R. J. (1998). ―A Knowledge-Based Systems Approach
to Design of Spatial Decision Support Systems for Environmental Management.‖
Environmental Management, 22 (1), 35–48.


