

1
Global city clusters: theorizing spatial and non-spatial proximity in
inter-urban firm networks
Kirsten Martinus1 and Thomas Sigler2
Abstract Spatial agglomeration is well theorized within regional studies and economic geography, with firm- and industry-level advantages generally attributable to the strategic benefits derived from spatial proximity. Increasingly however, alternative proximity types have been explored to explain relationships between firms within and between industries. This paper applies social network analysis to analyze city clustering as a function of both spatial and non-spatial factors—namely economic, sociocultural, and geo-political. Based on the internal reporting structures of Australia-based firms, it employs a novel application of network analysis to explore how ‘global clusters’ of cities are a more useful means to understand industry dynamics and processes than hierarchical lists of cities of cascading importance. As territorial fixity and national embeddedness are far more important in some industries than others, this analysis demonstrates that firms and industries exhibit diversity in the degree to which their networks extend globally. This has implications for how firm and industry organization are theorized, as well as how city networks are understood as a function of regionally and globally scaled urban systems which often operate complementarily.
Key words economic geography, connectivity, proximity, clusters, world city networks, social network analysis
Introduction
Firm-level clustering has long been theorized within regional studies, economics and
geography (MARSHALL, 1890; PORTER, 1994) as the product of spatial proximity
supporting a variety of co-productive processes including industry complementarity, labor
pooling, and common economic markets and resources. More recently, however, proximity
has been hypothesized to extend beyond spatial propinquity (BOSCHMA, 2005; BROEKEL,
2015; PONDS et al., 2007) as it has been noted that the common practices, technological
diffusion, and knowledge sharing within and between firms can in fact occur across great
distances (BALLAND et al., 2015; TER WAL and BOSCHMA, 2009; TORRE and GILLY,
2000). These relationships bind cities within particular networks of information, capital and 1CentreofRegionalDevelopment,UniversityofWesternAustralia,Perth2Geography,PlanningandEnvironmentalManagement,UniversityofQueensland,Brisbane

2
other flows (CASTELLS, 1996) placing a premium on relational connectivity (DUCRUET
and BEAUGUITTE, 2014; VAN MEETEREN et al., 2016), such as those formed by firms
which manifest differently across industries to transcend discrete territorial borders or other
scalar configurations (BATHELT et al., 2004; LAGENDIJK and OINAS, 2005; PARR,
2014). Firms benefit from the various elements of competitive advantage gained from
regional ‘assets’ embedded within specific geographic configurations as well as within the
power structures of various social, cultural, economic, geopolitical and institutional
arrangements shaping local conditions (AGNEW, 2001; BATHELT et al., 2004). As such,
the inter-urban relationships formed by firm locational links are part of broader relational or
territorial networks which are continually shaped, recreated and reorganized by institutional
and organizational practices and relations (AMIN, 2002; MARTIN and SUNLEY, 2006;
SHEPPARD, 2002; THRIFT, 2000). Understanding such relationships provides critical
insight into understanding a variety of geopolitical dimensions, industry configurations and
how broader processes of globalization and uneven development transpire across space.
Despite this importance, to date there have been limited studies investigating how firm-level
proximity dimensions translate to a higher spatial scale to inform our understanding of how
cities connect across the globe. This paper addresses this gap in the research by applying a
World City Network (WCN) approach to understand how firm-level clustering and linkages
across space might shape the way cities connect at a global scale, and further whether
industry-specific links and dynamics can explain city sub-networks. The city-economy-
network nexus has been theorized from a number of significant perspectives (COE et al.,
2010; PORTER, 1994; ROZENBLAT, 2010), with WCN particularly focused on the ‘world
of cities’ vis-à-vis the inter-city connections forged by global corporations. WCN analysis
places cities as central or peripheral to global economic networks based on firm
connectedness within a world-economy (TAYLOR, 2001), as well as from the perspectives
of individual industries (e.g., KRÄTKE, 2014) or specialized cities (e.g., BASSENS et al.,
2010).
This paper explores global clusters of cities from a number of proximity dimensions to
understand network configurations between cities. In doing so, it establishes an empirical
framework for understanding city networks heterarchically—something perhaps no research
in this vein has accomplished in quite the same way. In other words, cities can play minor or
major roles within complementary economic networks, and are thus of varying importance
within industry-specific ‘global clusters’ of cities. In establishing global city clusters, this
3
paper augments the argument that being a ‘global city’, or even understanding cities as
hierarchically organized for that matter, makes little sense from the perspective of a firm or
industry (cf. SIGLER, 2016). It therefore follows that the formulation of successful urban
economic development policy is contingent upon understanding which specific vectors of
connectivity shape cities relationally. Ascending the ‘global city’ hierarchy and related
benchmarking exercises applying static datasets are of little value in this regard, and the
concept outlined can be extended to investigate migration network, social networks. cultural
networks, et cetera.
Section two briefly reviews how economic clusters are conceptualized at different scales of
industrial networks, drawing on well-established literature in regional science to explain how
various proximity dimensions might explain the corporate ties found between cities binding
together sub-network communities. Section three describes the construction of an Australian
corporate data set derived from all corporations listed on the Australian Securities Exchange
(ASX) in 2014. Using the headquarter and branch office locations of this data set as proxies
for broader industry network relations, we outline the social network analysis (SNA) cluster
detection method employed to reveal ‘global’ city industry-specific network clusters. Section
four contextualizes these clusters through a selected five proximity dimensions (cf.
BOSCHMA, 2005) as a framework for understanding a city’s ‘strategic economic assets’,
given that geographic proximity is not a sufficient explanation for emergent clustersand that
alternative interpretations of inter-urban linkages are needed. The paper concludes that
‘global clusters’ of cities are a more useful means to understand industry dynamics and global
processes than hierarchical lists of cities of cascading importance. Industry-specific clusters
are then unpacked using inductive logic to explain why firms within them form multi-scalar
networks.
Urban clusters in a world of industrial networks Seminal research on clusters focuses on firm location and embedded industry proximity at the
regional scale (cf. GRANOVETTER, 1985; PORTER, 1994; SAXENIAN, 1994) as the
localized outcome of global economic dynamics (cf. ISARD, 1960; PERROUX, 1955) given
that regional clusters are ‘outgrowths of a world economy’ (AMIN and THRIFT, 1992: 574).
This situates cities as network mediators of information flows (CASTELLS, 1996) and nodes
or basing points for global capital (FRIEDMANN, 1986; HALL and HAY, 1980) operating
in ‘a hierarchy of spatial articulations, roughly in accord with the economic power they
command[ed]’ (FRIEDMANN, 1986: 23).

4
One theoretical and methodological approach situating cities within ‘global’ economic
networks has been WCN. While the hierarchical nature of most WCN research has been
established as a deficiency, it has developed well-recognized methods to situate cities (as
opposed to firms, organizations, or processes) within trans-national networks using
empirically-driven analysis (BEAVERSTOCK et al., 2000; DERUDDER AND TAYLOR,
2005; MANS, 2014; ROBINSON, 2002; TAYLOR, 2001). WCN most commonly identifies
the rising importance of advanced producer services (APS) as a proxy for identifying
‘command and control’ structures associated with the uneven accumulation of capital and
concentration of global political and economic power (cf. FRIEDMANN, 1986; SASSEN,
1991). It assumes that information flows (as the links that spatially and temporally bind
agents between cities) move within and between firms, which creates vectors of
communication within vast industrial networks. However, WCN networks typically connect
clusters of APS via ‘global cities’, mirroring centralized and hierarchical organizational
tendencies of APS multinationals (NEAL, 2012), but leaving both more peripheral cities and
less-dominant sub-networks ‘off the map’ (ROBINSON, 2002).
Calls for less categorical and more inclusive studies of different city experiences have
resulted in studies on the different relational complexities of ‘alternate’ industries or
‘multiple’ globalizations and regional ‘heterarchical’ structures (HOYLER and WATSON,
2013; SIGLER, 2013a; WALL and VAN DER KNAAP, 2011) based on political
(HARRISON, 2013; MARTINUS and TONTS, 2015) rather than strictly geo-economic
frameworks. These advances in understanding the city-economy-networks nexus allows a
break both from the neat and relatively stable ‘nested scalar hierarchies’ of WCN and ‘for the
possibilities of a multitude of flows and connections that cut across and
reconfigure…different territories’ (COE et al., 2010: 140).
Despite this, WCN research continues to primarily focus on cities and city hierarchies rather
than the actual network properties that bind them together. Thus, whilst significantly
advancing urban and economic theory, these varied relational studies do not unpack the
specific processes associated with urban networks, particularly where a strong tendency for
certain cities to form unusually strong subnetworks is observed. For example, Hong Kong,
London and New York might commonly be referred to as ‘financial centers’ and Geneva and
Nairobi are widely recognized for their role in global governance (TAYLOR, 2001b). Yet
apart from being home to a large number of related institutions, how do network ties forged
across time and space bring various cities into subnetworks? Therefore, a deeper focus on

5
networks is required to transcend the territorial fixity associated with clusters on a regional
level. The various facets of proximity serve to explicate what are invariably complex firm-
based urban networks.
Emerging from a small group of mainly French scholars, the aim of proximity-based studies
is to incorporate space into economic theory through processes of localization, externalities
and innovation (TORRE and GILLY, 2000). Whilst these theoretical contributions have led
to great advances in how firm-level clustering is manifest, there is significant scope to better
understand how proximity dimensions play out spatially using network science (DUCRUET
and BEAUGUITTE, 2014; TER WAL and BOSCHMA, 2009), especially in connecting
cities. Indeed, many of the processes that are widely assumed to transpire between firms,
such as knowledge transfer, mutual learning, and innovation, can also occur between cities,
as research in the policy mobilities realm has documented (MCCANN, 2011).
Applying proximity concepts to firm-derived city networks raises questions regarding the
scalability (temporal, sectoral or regional) of the dynamic processes driving network
formation and organization. LAGENDIJK and OINAS (2005) contend that proximity is more
related to social, economic and political processes given that spatial scale is itself a social and
political construct. BRENNER (2001) argues for adopting pluralistic notions of scale which
avoid conceptualizing space as a definitive identifiable local/global dichotomy that does not
exist in reality. Instead, regions should be thought of as having characteristics which are
relational at different scales (BRENNER, 2001) or as nodes articulating different processes
with different spatial reaches (AMIN and THRIFT, 1992; ROZENBLAT, 2010).
The global competitive advantage of place leads to a time-space embedding process for
various flows (e.g. informational, capital, knowledge), which in turn reflect firm, institutional
or other relations driving proximity (BATHELT et al., 2004; LAGENDIJK and OINAS,
2005). BALLAND et al. (2015) argue that understanding the processes associated with
network proximity requires the adoption of a dynamic, rather than static, perspective of
networks. That is, network proximity may be part of an organization’s decision-making and
site selection process or a ‘social construct inherited from joint knowledge ties’ (p.909). They
reason that time plays a crucial role in the latter through a co-constructive process where ‘in
the short run, actors create relations; in the long run, relations create actors’ ([PADGETT and
POWELL, 2012] in BALLAND et al., 2015: 909). Organizational decisions and relations are
complex and varied, with research demonstrating both regional (e.g., between Europe and
America) and industry sectoral differences (BALLAND et al., 2015). In the case of inter-
6
urban networks, BALLAND et al. (2015) hypothesized that a combination of proximity types
would account for how cities are bound together within and between industries.
VICENTE et al. (2007) argue that firm co-location is the result of firm mimetic (or
converging herd) behaviours which lead to other forms of proximity and cluster stability.
Nonetheless, proximity is not a priori linked to geographical closeness, as demonstrated by
their findings of a lack of convergence by firms within Paris’ ‘Silicon Sentier’. They
conclude that continued and lasting firm convergence on a particular location depended on
the type of firm learning afforded by the cluster, with interactive network learning providing
a greater basis for cluster stability than observational learning. VICENTE and SUIRE (2007)
contend that firm locational convergence occurs through both individual strategic decisions
and the cumulative aggregate actions of other firms faced with the same decisions relating to
a location’s social, political, economic and institutional characteristics. Geographic proximity
then is only one factor driving actor relations, and while it is positively correlated with the
formation of cluster, it may play a lesser role in generating long term proximity than other
relational factors (BALLAND et al., 2015; GELDES et al., 2015; VICENTE et al., 2007).
From the standpoint of a firm, BOSCHMA (2005) outlines five key proximity dimensions
which we will use as our framework in considering clusters formed at the global level. Firstly,
Marshallian/Porterian notions of geographical proximity are spatially-bounded at some level
(sub-urban, city, nation, global, etc) by the physical location of ‘actors’ (firms, institutions)
involved in economic activity. These actors and their networks are implicitly concentrated in
cities as the bricks-and-mortar sites of agglomerated population and industry. They play a
pivotal role in regional (uneven) development, generating competitive advantages through the
strength of their global connections and degree of global integration (BATHELT et al., 2004;
BATHELT and GLÜCKLER, 2011).
Secondly, organizational proximity which reflects how organizations are tied to one another
through large-scale systems, for example the result of complex multinational firm structures
(e.g. joint ventures, subsidiaries, branches). Thirdly, institutional proximity which describes
how organizations are bound together through the same norms and incentives, particularly
when operating in the same country or political environment. Fourthly, social proximity
refers to the highly embedded personal and labour relationships and connections between
organizations (GRANOVETTER, 1985), which in our study mirror relationships between
firms and cities where kinship, linguistic or other social ties bind them. Finally, cognitive
proximity represents the degree of organizational mutual learning through a shared
7
knowledge base (NOOTEBOOM, 2000), which MOLINA-MORALES et al. (2015) claim are
largely beneficial to network dynamics. As they contend, cognitive proximity allows for
joint problem solving and common innovation processes, and creates a strong incentive
system for choosing the ‘right’ partners. However this can also stymie innovation by creating
cognitive path dependencies, which have been framed elsewhere in the literature as ‘lock in’
(BOSCHMA, 2005). In the case of city networks, cognitive proximity may refer to the
tendency for the circulation of policy mobilities and other discursive channels amongst select
groupings of cities.
In our study, we assume inter-urban networks generated from Australia-based firms will
mirror the broader institutional linkages formed by geo-political, economic, and socio-
cultural links shaped by the various proximity dimensions driving firm location. We contend
that the broader global processes driving these links are observable through the links between
cities and the sub-clusters of the overall network.The following section details how the firm-
based networks of our study were constructed and how city networks were derived.
Methodology
Australia is highly globalized in its trade and corporate activity, presenting a fertile research
ground for urban and regional systems analysis and globalization studies. Unlike many other
countries at a similar level of development, its wealth is built on a history of commodity and
raw materials trade (TONTS and TAYLOR, 2013). The office locational data used in this
research were sourced from a total of 1,893 corporations listed on the Australian Securities
Exchange (ASX) as of January 2014, and classified according to the ten ASX industry sectors
of the Global Industry Classification Standard (GICS): energy, materials, industrials,
financials, consumer discretionary, consumer staples, health care, information technology,
telecommunications services and utilities. The ASX is Oceania’s primary securities exchange
and within the worlds’ top fifteen by trading volume. The ASX has played a critical role in
globalizing Australia’s economy listing both domestic (the majority of listings) and
international firms wishing to access Australian capital markets (MARTINUS et al., 2015).
The world-wide strategic locations of these ASX-listed corporate headquarter and branch
office locations (total of 4,647 offices) are assumed to be a proxy to understand the strategic
advantage of cities (cf. BEAVERSTOCK et al., 2000; TAYLOR et al., 2008).
Social network analysis (SNA) was used to analyze industry networks for the corporate
offices of the ASX-listed firms. SNA has been increasingly applied in WCN to uncover

8
spatial patterns of cities in global and regional sub-networks (see DERUDDER and TAYLOR,
2005; HENNEMANN and DERUDDER, 2014; WALL and VAN DER KNAAP, 2011) and
in this case was applied to understand network dynamics between cities. Ten two-mode city
by firm matrices (nine based on GICS sectors and one complete network) of the 4,647
corporate headquarter and office locations were constructed. Each office was assigned a
service value of 0 to 5 according to its position in the firm hierarchy (HENNEMANN and
DERUDDER, 2014) of: 5 = Firm global headquarters; 4 = Regional headquarters with extra-
territorial function; 3 = National headquarter; 2 = Ordinary office with minimal function; 1 =
Ordinary office with reduced function; and, 0 = No office. Offices within 50kms of a larger
city, or in one of several large distinct cities forming a single metropolitan area, were
reassigned as part of the extended city region (see MARTINUS et al., 2015). This reduced the
final list of cities to 585.
The ten two-mode firm by city (1893x585) matrices were converted to ten one-mode directed
matrices of 585x585 a-b city-pair cells by adding individual offices values into the correct
cell, with cities in first column reporting to those across the top row. The network reporting
structure of the matrix reflects both top-down (strategic branch office locational decisions of
headquarters) and bottom-up (local decisions impact corporate operations and processes)
information flows and investment decisions of the ASX-listed firms. It employs a firm
hierarchical bottom-up matrix construction approach where lower order offices report to
higher order ones (see HENNEMANN and DERUDDER, 2014). This directionality
represented the transfer of information from smaller to progressively larger offices, taking
into account the increasingly crucial role regional or local knowledge plays in the global
operations and strategies of multinational organizations (MANS, 2014). The clustering
algorithm (Clauset-Newman-Moore) applied enabled bi-directional city flows (RODRIGUES
and LOUCA, 2009), which allowed the data to reflect assumptions that while command lines
within firms generally flow from more to less significant offices, information flowed both
ways.
The matrices were entered into the network analysis tool NodeXL to compute the strength of
ties for each network and detect the existence of sub-networks or communities, referred to
herein as city clusters. The city relationships emerging from clustering analysis often reflect a
set of mutually-shared attributes to explain why certain members of a network are connected

9
more strongly (HANSEN, 2011). For this purpose, the Clauset-Newman-Moore3 (CNM)
community detection algorithm was used to partition the network into sub-groups such that
the nodes (i.e. cities) within a group had higher internal connections than external ones with
other communities (CLAUSET et al., 2004; DING, 2011).
The CNM algorithm uses an undirected matrix as ‘any link between two [cities], regardless
of direction, [is] an indication of their similarity’ (CLAUSET et al., 2004: 4), ensuring that
both top-down and bottom-up information flows are equally weighted in the analysis. It
employs a hierarchical agglomerative method to categorize communities from the bottom-up
(CLAUSET et al., 2004; RODRIGUES and LOUCA, 2009), ‘where firstly each node is
considered a member of its own community, and then the process runs iteratively, merging
communities according to some maximal value of a quality function’ (RODRIGUES and
LOUCA, 2009: 2). As such, CNM creates a more bottom-up view of the relationships
between cities, with resulting clusters demonstrating both the existence of socially and
culturally shaped ties as well as uneven core-periphery relationships (STATE et al., 2013).
To date, there has been only limited application of community detection methods in urban
analysis, with examples of graph partitioning (ROZENBLAT, 2012), top-down hierarchical
means of determining ‘cliques’ (DERUDDER and TAYLOR, 2005) and bottom-up
hierarchical CNM (MARTINUS et al., 2015). Indeed, the application of CNM to WCN in
combination with bottom-up firm hierarchical reporting approach presents an analytical
innovation in understanding the clustering of cities. It allows non-hub city networks to be
contextualized by firm locational strategies (MANS, 2014), and for clustering to be framed
within discrete production circuits extending across the globe. This means that the spatial
patterns associated with city clusters can be interpreted in a wider geo-economic framework,
facilitating a better understanding of otherwise marginal cities (MANS, 2014; MARTINUS
and TONTS, 2015) as well as those ostensibly atop the global hierarchy.
To visualise the CMN clusters, the Fruchterman-Reingold algorithm was applied to produce
force-directed graphs locating cities next to each other according to connection strengths.
Weights assigned to each city node generated both attraction (in equilibrium formed uniform
length connections) and repulsion (pushed unconnected cities apart) forces representing the
relationships between cities. Key cities in each cluster were identified as having the highest
betweenness centrality (BC) by calculating the share of all connections between two cities 3This was deemed the most appropriate SNA community detection tool, as: 1) the Girvan-Newman lacks scalability and is therefore inappropriate for large datasets; 2) graph partitioning has assumptions regarding size and number of pre-specified groups (FORTUNATO, 2010; NEWMAN, 2004); and, 3) top-down hierarchical ‘clique’ methods are criticized for leaving out ‘members’ (NEWMAN, 2004).
10
passing through a specific city (HENNEMANN and DERUDDER, 2014). High BC cities
may not be the most connected, but act as bridges between other cities with more important
strategic connections.
Identifying Network Clusters
This study considers the complete matrix (offices of 1,839 firms from 10 GICS codes) as well
as the four disaggregated GICS matrices of energy, materials, industrials and financials. This
provided a more nuanced characterization of the drivers and geographies of Australia’s
globalization. Not only do these four reflect the largest number of individual data points, they
also capture the broadest possible range of sectors spanning from extraction to advanced
services. The energy and materials sectors are representative of Australia’s resources industry,
which is strongly linked to historic development imperatives as well as contemporary
national security policies shaping the global economic, social and political landscape
(MARTINUS et al., 2015; MARTINUS and TONTS, 2015). Industrials represents
manufacturing and technical services as the value-add, high-tech and innovative component
of production. Lastly financials, which represents the strategic advanced producer services
(APS) function of cities. For each, the CNM algorithm provides sub-network clusters
articulated by a variety of processes unpacked through in the analysis. These network clusters
are analyzed using the lens of proximity to understand how global city networks might be
shaped by factors which vary from one to the next. In each instance, the strongest cluster
emerges as C1, followed by clusters of decreasing importance (C2, C3, etc.) within the
network. Key cities in each are identified as ‘sub-network hubs’ within respective global city
clusters. As the analysis shows, some sub-networks are inherently global in scope while
others are regional, or local.
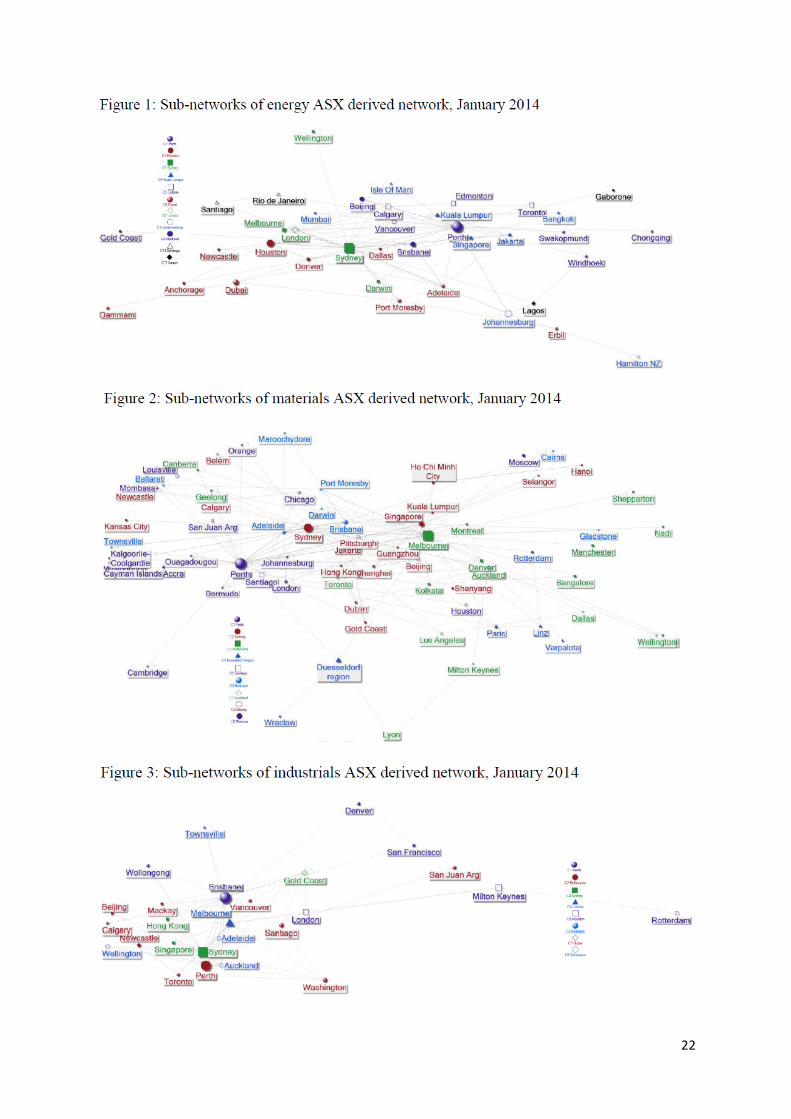
Energy Subnetwork
The large number of clusters in the energy sub-network compared to the other GICS
subnetworks (Figure 1) is indicative of the decentralized global operations of energy
corporations engaging with both producers and consumers, and driven by national energy
security agendas (CORRELJÉ and VAN DER LINDE, 2006; YERGIN, 2005). The Perth-
based cluster (C1) emerged as the strongest, and demonstrates Australia’s strong links to

11
Africa and emerging position in the oil and gas sectors. This is followed by an American
cluster (C2) with Houston at its center, then Sydney (C3) and regional energy hubs, centered
on Kuala Lumpur (C4), Calgary (C5), Dubai (C6), London (C7), Johannesburg (C8),
Brisbane (C9), Santiago (C10) and Lagos (C11).
INSERT FIGURE 1
Using betweenness centrality as a measure of cluster importance, each of the major clusters is
formulated around a specific energy source or regime. Perth is the modern hub of Australia’s
gas industry (with production based mainly in remote northwestern Australia) and Houston
commands the North American industry. Links to the headquarter locations of large national
producers is also relevant, such as Encana (Calgary) and Petronas (Kuala Lumpur). The
shared industry knowledge base, with many of the cities involved in oil, gas, and coal,
suggests cognitive proximity has played a role in cluster development.
Some energy city clusters also demonstrate network proximity through shared specialized
industry market upstream/downstream relations. For example, Beijing’s ties with Brisbane
through C9 echo the vast volumes of Queensland coal exported to China, sourced in south
and central Queensland connecting to nearby ports (e.g. Roma, Gladstone, Mackay) and coal
consumer markets in eastern China (cf. CHRISTIE et al., 2011). Perth’s connection to Tokyo
in C1 relates to Japan as one of the world’s top natural gas importers and Western Australia
as a top producer.
Other clusters also reflect geopolitical alliances under common hierarchical control or
organizational proximity alongside cognitive industry affiliations, perhaps reflecting the
strong political dimension of energy given its inherent role in national security (VIVODA,
2009). For example, most Chinese cities are situated in C9, centered on Beijing as the
political capital of a highly centralized state. London and Houston as key global energy hubs
in Europe and the Americas respectively (MARTINUS and TONTS, 2015) link producers in
the former Eastern Bloc (Atyrau, Moscow, Tashkent, Astana) and the North Sea field
(Aberdeen and Stavanger) to European consumers through C7 and US cities in C2,
respectively.
Spatial proximity matters nonetheless. Regionally articulated networks reflecting geographic
proximity emerge, with Southeast Asian cities in C4 centering on Kuala Lumpur (as the
capital of one of the world’s top ten natural gas exporters), and Edmonton and Calgary at the
center of the Canada-focused C5. As a regional ‘safe haven’ (SIGLER, 2013b), Dubai is the
12
key city in the mainly Middle East/North Africa cluster C6, involving multiple energy giants
(Saudi Arabia, Qatar, Kuwait). Furthermore, it is likely that language (e.g. Arabic) and local
practices (e.g. Islamic banking) also play a binding role in C6 pointing to the importance of
both social proximity (degree to which cities have friendly relations based on cultural or
social ties, such as the underpinning British influence of Commonwealth nations) and
institutional proximity (degree to which cities operate under the same institutions, such as the
role of state-owned, or formerly state-owned, oil companies in bringing together the energy
supply chain).
Materials Subnetwork
The materials sub-network demonstrates distinct patterns to those displayed in the energy
sector, having comparatively more Australian nodes than international ones with Perth,
Sydney and Melbourne leading three major clusters (Figure 2). As the primate city of
resource-rich Western Australia, Perth is the most central city in the most robust cluster C1,
reflecting the mainly Perth-based operations of small mining companies involved in
complementary African and Latin American mineral interests such as bauxite (Conakry), iron
ore (Johannesburg), gold (Accra), diamonds (Swakopmund) and a variety of metals
(Marabá). Sydney’s cluster C2 connects principally to Asia through its historic steel industry
in New South Wales, including cities which link to key consumption markets in Japan and
China. Düsseldorf leads the European C4 cluster, representing the German Rhine-Ruhr
industry agglomeration hub anchored historically by steel. Pittsburgh and Brasilia sit in C8
suggesting Australia’s role in a transcontinental steel-based connection (cognitive proximity)
centered on Beijing, as China, Australia, and Brazil are three of the world’s largest steel
producers and Pittsburgh has long been associated with the industry.
INSERT FIGURE 2
The city cluster centering on Melbourne (C2) is perhaps reflective of strong social proximity
pulling together mainly Anglophone cities through historic and continued Commonwealth
linkages (e.g. Delhi, Kolkata, Liverpool, Manchester). Much of this is driven by large
companies (e.g. Orica, BlueScope) and BHP Billiton which has global headquarters in both
London and Melbourne - the result of historic Commonwealth mining and commercial
connections. Regional geographic clusters reflecting geographic proximity are also present.
For example, Santiago sits at the heart of a Latin American cluster C5 (could also indicate
social proximity given Latin speaking countries), and C4 conforms almost precisely to the

13
boundaries of the European Union (could also indicate institutional proximity given various
agreements between members), including numerous cities in the former Eastern Bloc in
Poland, Czech Republic, Hungary and Romania alongside others in Italy, Germany, France,
and Spain.
Finance or regulatory frameworks appear to play a role in articulating global materials
(mining) interests between cities, suggesting that institutional proximity is also highly
important. The two major clusters C1 and C2 contain global financial and commercial hubs
(Hong Kong, Singapore, London and Tokyo) as well as a significant number of offshore
financial centers, including the British Virgin Islands (BVI), Cayman Islands, Bermuda,
Monaco, and Guernsey. This reveals the particular way in which offshore banking anoints
international materials transactions and harbors mining capital (HABERLY and WÓJCIK,
2014) and shapes connectivity in the industry. Indeed, as it is in the interests of large
globally-positioned Australian mining firms ‘to book all the loans and leasing agreements out
of a low-tax jurisdiction’ (WILKINS and BUTLER, 2013), many gold, lithium and tin
mining firms (many operating out of Africa) in this ASX network were also incorporated in
tax havens.
Industrials Subnetwork
Representative of the manufacturing sector and comprising many related services, the
industrials sub-network is highly Australia-centric (Figure 3) with clusters mediated through
each of the major Australian cities as well as international cities not normally associated with
‘top’ global rankings such as Washington and Auckland. Cluster city network alliances reveal
cities specialized in upstream/downstream markets of resource production, low-wage labor
and advanced manufacturing. This suggests the strong role of cognitive proximity in cluster
creation, where the shared knowledge base may extend to associated industries such as
materials or logistics. For example, the locus of the largest cluster (C1) of globally diverse
cities, Brisbane, is aligned with resource production in the states of New South Wales and
Queensland, industrializing regions in Asia and advanced manufacturing in Europe and North
America. The next largest cluster, centered on Perth (C2), is more nationally focused with
many cities consuming raw materials (specifically iron ore from the Pilbara in Western
Australia) given their large manufacturing bases (e.g. steel-related production of Newcastle
(UK) and Pittsburgh). The corporations underlying C2 city connections are characteristically
small firms providing specific services, knowledge or expertise on processes and techniques

14
largely related to mining. C3 contains primarily Australian, Europe and Asia manufacturing
cities and is centered on Melbourne, a long-time hub of Australian manufacturing
(WILKINSON, 2010). Milton Keynes4 heads up a European cluster of cities which includes
London, indicating the strength of manufacturing in the southern English economy.
Institutional proximity again appears to support various industrial activities through the
centralized regulation of finance with mainstream and offshore financial centers (New York,
Hong Kong, Tokyo, Singapore, Zurich, Bermuda, Chicago) all within C3 which centers on
Sydney being Australia’s contemporary financial hub.
INSERT FIGURE 3
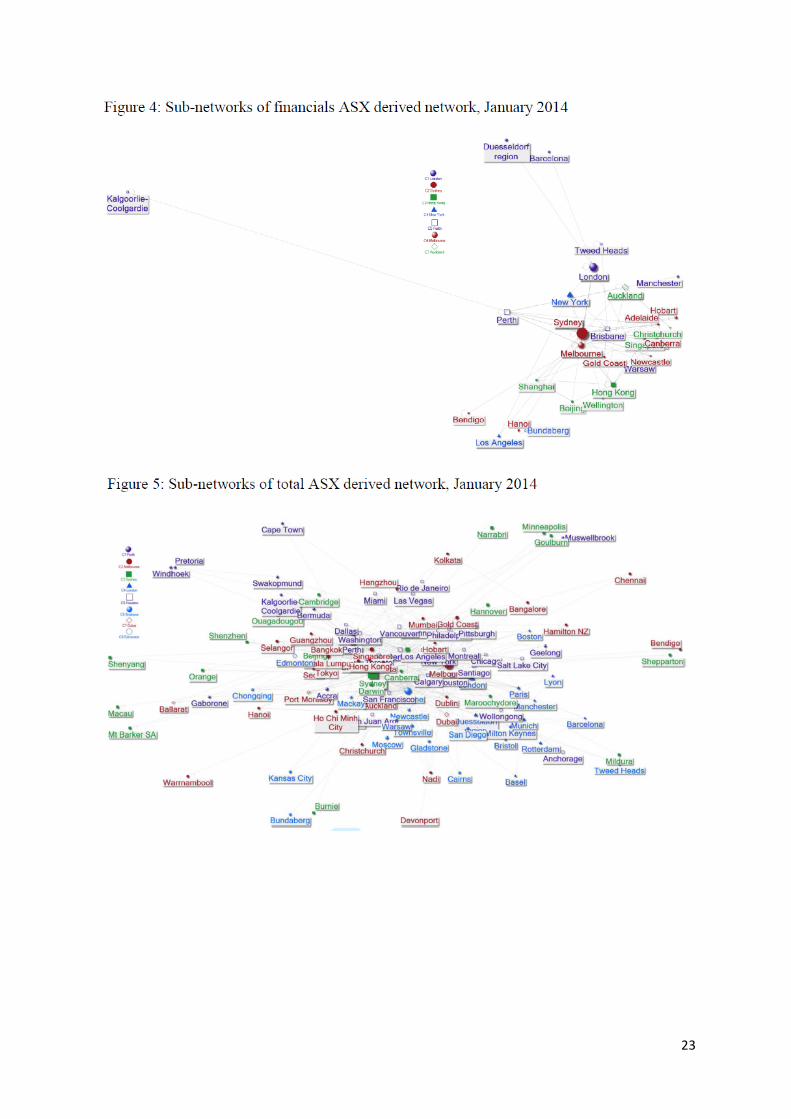
Financials Subnetwork
Of all the networks, only the financial subnetwork demonstrates the well-established ‘global
cities’ geography characterized by ‘command and control’ consolidation within relatively few
cities (SASSEN, 1991; TAYLOR, 2001a). Organizational proximity is thus a highly
significant factor in cluster generation. London (C1), Sydney (C2), Hong Kong (C3) and New
York (C4) firmly lead respective regional clusters in Europe, Oceania, Asia and Americas
(see Figure 4) primarily through the global presence of major banks and real estate
corporations, such as Brookfield, Goodman Group and Lend Lease. Precisely three European
cities located within C2 rather than C1: Jersey, Dublin, and Valletta (Malta), which are all
well-known offshore financial centers. These same clusters also demonstrate the importance
of institutional or geographic proximity insofar as C1 conforms precisely to the European
Union, suggesting that economic integration has reinforced the bloc’s invisible boundaries.
C4 includes all North American cities, with the exception of Miami (an artefact of a single
branch office location). The Western Australian-Queensland cluster (C5, centered on Perth)
ties financial circuits to Australian resource industries, while C6’s highly local Southeast
Australia concentration likely reflects Melbourne’s historic secondary and more domestic
role in finance.
INSERT FIGURE 4
Aggregate ASX Network
4 Represents the industrial corridor northwest of London in Buckinghamshire and surrounding areas - one of the most prosperous regions in Europe.
15
The overall network using all ASX-listed corporate headquarters and branches hinges on the
Australian cities of Perth, Sydney, Melbourne and Brisbane alongside regional clusters
centered on London, Houston, and Dubai (see Figure 5). The most central cities within each
cluster elucidate the key role of resources in the national economy (Perth, Brisbane, Dubai,
Houston, Edmonton) as well as the fundamental role of finance (Sydney, Melbourne,
London). These clusters point to the dominance of particular ‘global’ cities alongside cities
characterized by Australia’s own industry specializations.
INSERT FIGURE 5
The overall network displays strong cognitive proximity drivers of clustering linked to the
circuits of knowledge within and between industries. Perth’s strong alliance with Central and
West Africa can be linked to industry complementarities in mineral and energy producers for
the global market. Melbourne assumes a key position for the Asia-Pacific (including New
Zealand) as Australia’s key trading bloc; this reflects its strong industrials focus as an
Australian manufacturing hub as well as its role as a major financial center, with firms
specializing in banking and superannuation (retirement funds). Sydney’s large association
with other Australian cities and regions may indicate its specialized financial function as a
bridge or key corporate access point for Australian capital across a range of industries, or as a
gateway for multinational firms that are not considered herein. The Brisbane cluster displays
the importance of geographic proximity dimensions alongside cognitive ones, being the
commercial hub of a regional cluster including resource-rich regions in its own state of
Queensland (Cairns, Townsville) and neighboring South Pacific countries (e.g. Vanuatu,
Tonga, Solomon Islands).
There is also significant evidence of institutional proximity in how clusters are generated.
This appears to be reinforced by upstream/downstream relationships and mediated by formal
institutional frameworks (e.g. regional trading blocs; such as the European Union and
Eurasian Economic Union). This is reflected in the clustering of tax havens in the resource-
related Perth-led cluster (BVI, Cayman Islands and Guernsey) and the financial cluster
centered on Sydney (Jersey, Isle of Man and Macau), indicative of a strong role for
regulatory frameworks in linking production networks globally. In light of this, investigating
the offshore geographies inherent to corporate organization worldwide thus remains
important research.
16
These may also be the result of social proximity confirming that the world self-organizes
based on the historical socio-cultural legacies of colonization, religion, etc. (STATE et al.,
2013). Dubai’s role in the Gulf Region exposes its central position in the Arab world in
which Islamic banking is ensured through sharia compliant financial institutions (BASSENS
et al., 2010), whereas Moscow plays a strong role in the former Soviet Union in the same
cluster as Donetsk (Ukraine) and Karagandy (Kazakhstan) in materials and Almaty and
Astana (Kazakhstan) and Tashkent (Uzbekistan) in energy. Institutional and social proximity
also play out in binding cities of New Zealand, Papua New Guinea and other Pacific nations
holding economic ties to Australia through former colonial ties or contemporary geo-political
and diasporic linkages. These may underpin Australian regional partnerships (e.g. various
Trans-Tasman New Zealand-Australia arrangements) and the Pacific Agreement for Closer
Economic Relation (e.g. South Pacific links to Brisbane).
Concluding Discussion
The organization of agents within the global spatial economy is the product of historic and
contemporary economic processes connecting local markets through transnational networks
to external locations of strategic advantage. This paper seeks to identify global city clusters
by applying social network analysis (SNA) to firm networks to explain the processes
underlying the patterns of clusters and city linkages observed in the overall network. To do so,
it examines ASX firm-based industry networks through five key proximity dimensions found
to drive firm clustering behaviors, highlighting the importance of both spatial (geographic)
and non-spatial (relational) factors in shaping global city relations.
First and foremost, we find that propinquity matters. Geographical proximity plays a strong
role in shaping regional urban networks. City clusters had a strongly ‘local’ spatial proximity
rather than cultural or institutional ties, with state-based groupings apparent in all networks
and regional connections such as those found in trading blocs (e.g., European Union and
ASEAN). Second, organizational proximity between cities within the firm-based networks
reflected historic and contemporary patterns of power and influence. This may be due to
common industry practices and organizational norms which circulate via information and
knowledge flows between cities. The global hubs emerging within different industry network
structures demonstrate the importance of specialized industry knowledge transcended spatial
17
ties. In the energy network, for example, key cities in producer nations are brought together
by the commonalities within their expertise, shared labour pools, and similar structures within
related commercial networks.
Third, social proximity shaped by shared histories (e.g. colonial linkages), wealth (e.g.
economic similarities) and/or other cultural commonalities, manifesting most visibly in
networks sharing a language or a strong cultural element (e.g., Islamic rules governing
finance). For example, despite its distance, London is a key city in the Australia national
network, with corporate geographies reflecting historic and continued Commonwealth links.
Brisbane as the hub for cities in Papua New Guinea and Pacific island nations, reflecting the
organized political and resource interests of Australia as a source of funds for corporate
operations and in the way Pacific island corporate structures report to higher order offices
housed in larger Australian cities.
Fourth, institutional proximity manifests though common governance frameworks. These are
shaped over centuries of globalizing relations involving financial, customs, trade organized in
immigration or trading blocs, labor and capital flows, such as the connections between
international and offshore financial centers and geopolitical allies. Common institutions can
also be linked to other forms of proximity, as practices binding Commonwealth nations link
to social ties forged through British imperialism. Fifth and finally, cognitive proximity relates
to the industry knowledge base similarities and complementarity of cities through shared vis-
a-vis information and labor pools. Examples are found in the upstream/downstream
arrangements mediating industry complementary processes, such as the highly interdependent
activities of financial centers, or Perth’s industry-specific practices and knowledge links to
mineral-rich African regions.
The novel analytical approach of this study generates global city network clusters reflecting
geographic as well as non-spatial or relational attributes, revealing the utility of proximity in
globalization studies. It suggests further research is needed into the spatio-temporal
scalability characteristics of proximity. This has specific application in bridging many of the
obstacles to studying phenomena that are inherently geographic (e.g. migration, financial
networks) yet appear to ‘skip over’ areas in close proximity. And in contrast to many, if not
most, of the attempts at using network analysis to explore geographic phenomena, this study
focuses on defining sub-networks, each with distinct meta-geographies, rather than
positioning individual nodes at nested scales. While it is limited in its firm-based approach to

18
identifying networks, it presents a case for greater exploration into the merits of using social
network analysis to understanding how local-global processes related to strategic firm
decisions, institutionalconstraints, culture and geopolitics are embedded in particular ways
within a network through time and space.
References AGNEW J. (2001) The new global economy: time-space compression, geopolitics, and the
global uneven development, Journal of World-Systems Research 7, 133-156. AMIN A. (2002) Spatialities of globalization, Environment and Planning A 34, 385-399. AMIN A. and THRIFT N. (1992) Neo-Marshallian nodes in global networks, International
Journal of Urban and Regional Research 16, 571-587. BALLAND P., BOSCHMA R. and FRENKEN K. (2015) Proximity and innovation: from statics to dynamics, Regional Studies 49, 907-920. BASSENS D., DERUDDER B. and WITLOX F. (2010) Searching for the Mecca of finance:
Islamic financial services and the world city network, Area 42, 35-46. BATHELT H. and GLÜCKLER J. (2011) The Relational Economy: Geographies of
Knowing and Learning, Oxford University Press, Oxford. BATHELT H., MALMBERG A. and MASKELL P. (2004) Clusters and knowledge: local
buzz, global pipelines and the process of knowledge creation, Progress in Human Geography 28, 31-56.
BEAVERSTOCK J., SMITH R. and TAYLOR P. (2000) World-city network: a new metageography? Annals of the Association of American Geographers 90, 123-134.
BOSCHMA R. (2005) Proximity and innovation: a critical assessment, Regional Studies 39, 61-74.
BRENNER N. (2001) The limits to scale? Methodological reflections on scalar structuration, Progress in Human Geography 25(4), 591-614.
BROEKEL T. (2015) The co-evolution of proximities: a network level study, Regional Studies 49, 921-935.
CASTELLS M. (1996) The Rise of the Network Society: The Information Age: Economy, Society, and Culture (Vol. 1), John Wiley, New York.
CHRISTIE V., MITCHELL B., ORSMOND D. and VAN ZYL M. (2011) The iron ore, coal and gas sectors, Reserve Bank of Australia Bulletin, March.
CLAUSET A., NEWMAN M. and MOORE C. (2004) Finding community structures in very large networks, Physical Review E 70.
COE N., DICKEN P., HESS M. and YEUNG H. (2010) Making connections: Global Production Networks and World City Networks, Global Networks 10, 138-149.
CORRELJÉ A. and VAN DER LINDE C. (2006) Energy supply security and geopolitics: a European perspective, Energy Policy 34, 532-543.
DERUDDER B. and TAYLOR P. (2005) The cliquishness of world cities, Global Networks 5, 71-91.
DING Y. (2011) Community detection: topological vs. topical, Journal of Informetrics 5, 498-514.
DUCRUET C. and BEAUGUITTE L. (2014) Spatial science and network science: review and outcomes of a complex relationship, Networks and Spatial Economics 14, 297-316.
FORTUNATO S. (2010) Community detection in graphs, Physics Reports 486, 75-174. FRIEDMANN J. (1986) The world city hypothesis, Development and Change 17, 69-83.

19
GELDES, C., FELZENSZTEIN, C., TURKINA, E. and DURAND, A. (2015) How does proximity affect interfirm marketing cooperation? A study of an agribusiness cluster, Journal of Business Research 68(2), 263-272.
GRANOVETTER M. (1985) Economic action and social structure: the problem of embeddedness, American Journal of Sociology 91, 481-510.
HABERLY D. and WÓJCIK D. (2014) Regional blocks and imperial legacies: mapping the global offshore FDI network, Economic Geography 91, 251–280.
HALL P. and HAY D. (1980) Growth Centres in the European Urban System, University of California Press, California.
HANSEN D. (2011) Exploring social media relationships, On the Horizon 19, 43-51. HARRISON J. (2013) Configuring the new ‘regional world’: on being caught between
territory and networks, Regional Studies 47, 55-74. HENNEMANN S. and DERUDDER B. (2014) An alternative approach to the calculation
and analysis of connectivity in the world city network, Environment and Planning B 41, 392-412.
HOYLER M. and WATSON A. (2013) Global media cities in transnational media networks, Tijdschrift voor Economische en Sociale Geografie 104, 90-108.
ISARD W. (1960) Methods of Regional Analysis, RIPOL Classic, Moscow. KRÄTKE S. (2014) Global pharmaceutical and biotechnology firms’ linkages in the world
city network. Urban Studies 51(6), 1196-1213. LAGENDIJK A. and OINAS P. (2005) Proximity, external relations, and local economic
development, in Lagendijk A. and Oinas P. (Eds) Proximity, Distance and Diversity, Issues on Economic Interaction and Local Development, pp.3-22, Ashgate, Farmhan, UK.
MANS U. (2014) Revisiting city connectivity, Journal of Economic Geography 14, 155-177. MARSHALL A. (1890) Principles of Economics, Macmillan and Co, London. MARTIN R. and SUNLEY P. (2006) Path dependence and regional economic evolution,
Journal of Economic Geography 6, 395-437. MARTINUS K., SIGLER T., SEARLE G. and TONTS M. (2015) Regionalization through
globalizing centres and sub-network geometries: a social network analysis of multi-scalar energy networks, Geoforum 64, 78-89.
MARTINUS K. and TONTS M. (2015) Powering the world city system: energy industry networks and inter-urban connectivity, Environment and Planning A 47, 1502-1520.
MCCANN, E. (2011) Urban policy mobilities and global circuits of knowledge: toward a research agenda, Annals of the Association of American Geographers 101(1), 107-130.
MOLINA-MORALES, F., BELSO-MARTÍNEZ, J., MÁS-VERDÚ, F. and MARTÍNEZ-CHÁFER, L. (2015) Formation and dissolution of inter-firm linkages in lengthy and stable networks in clusters. Journal of Business Research 68(7), 1557-1562.
NEAL Z. (2012) Structural determinism in the interlocking world city network, Geographical Analysis 44, 162-170.
NEWMAN M. (2004) Detecting community structure in networks, The European Physical Journal B 38, 321-330.
NOOTEBOOM B. (2000) Learning and Innovation in Organizations and Economies, Oxford Scholarship Online.
PARR, J. (2014) The regional economy, spatial structure and regional urban systems, Regional Studies 48(12), 1926-1938.
PERROUX F. (1955) A note on the notion of growth pole, Applied Economy 1, 307-320. PONDS R., VAN OORT F. and FRENKEN K. (2007) The geographical and institutional
proximity of research collaboration, Papers in Regional Science 86, 423-443. PORTER M. (1994) The role of location in competition, Journal of the Economics of
Business 1, 35-40.

20
ROBINSON J. (2002) Global and world cities: a view from off the map, International Journal of Urban and Regional Research 26, 531-554.
RODRIGUES D. and LOUCA J. (2009) Mutual information to assess structural properties in dynamic networks, European Conference on Complex Systems, Warwick, UK, 21-25 September.
ROZENBLAT C. (2010) Opening the black box of agglomeration economies for measuring cities competitiveness through international affirm networks, Urban Studies 47(13), 2841-2865.
ROZENBLAT C. (2012) Cities in the regionalized world of multinational firm networks, Working Paper 3, University of Lausanne.
SASSEN S. (1991) The Global City. Princeton, NJ: Princeton University Press. SAXENIAN A. (1994) Regional Advantage: Culture and Competition in Silicon Valley and
Route 128, Harvard University Press, Cambridge, MA. SHEPPARD E. (2002) The spaces and times of globalization: place, scale, networks, and
positionality, Economic Geography 78, 307-330. SIGLER T. (2013a) Corporate clustering in Australian cities: an analysis of the geographic
distribution of ASX-listed headquarters, State of Australian Cities Conference, Sydney, November 26-29.
SIGLER T. (2013b) Relational cities: Doha, Panama City, and Dubai as 21st century entrepôts, Urban Geography 34, 612-633.
SIGLER T. (2016) After the ‘World City’ has Globalised: Four Agendas Towards a More Nuanced Framework for Global Urban Research, Geography Compass 10(9), 389-398.
STATE B., PARK P., WEBER I., MEJOVA Y. and MACY M. (2013) The mesh of civilizations and international email flows, WebSci '13, Paris, May 2-4.
TAYLOR P. (2001a) Specification of the world city network, Geographical Analysis 33, 181-194.
TAYLOR P. (2001b) New political geographies: global civil society and global governance through world city networks, Political Geography 24(6), 703-730.
TAYLOR P., EVANS D. and PAIN K. (2008) Application of the interlocking model to mega-city regions: measuring polycentricity within and beyond city-regions, Regional Studies 42, 1079-1093.
TER WAL A. and BOSCHMA R. (2009) Applying social network analysis in economic geography: framing some key analytic issues, The Annals of Regional Science 43, 736-756.
THRIFT N. (2000) Afterwords, Environment and Planning D 18, 213-255. TONTS M. and TAYLOR M. (2013) The shifting geography of corporate headquarters in
Australia: a longitudinal analysis, Regional Studies 47, 1507-1522. TORRE A. and GILLY J. (2000) On the analytical dimension of proximity dynamics,
Regional Studies 34, 169-180. TORRE A. and RALLET A. (2005) Proximity and localization, Regional Studies 39(1), 47-
59. WALL R. and VAN DER KNAAP G. (2011) Sectoral differentiation and network structure
within contemporary worldwide corporate networks, Economic Geography 87, 267-308. WILKINS G. and BUTLER B. (2013) Island Allure: the tax secrets of Australian big
business, The Sydney Morning Herald, 25 May. WILKINSON J. (2010) Sydney and Melbourne: An Economic Overview, Briefing Paper No.
7/2010, NSW Parliamentary Library Research Service, Sydney. VAN MEETEREN, M., NEAL, Z. and DERUDDER, B. (2016) Disentangling agglomeration
and network externalities: a conceptual typology. Papers in Regional Science 95(1), 61-80.

21
VICENTE, J., PRIA, Y. and SUIRE R. (2007) Informational cascades versus network externalities in locational choice: evidence of ‘ICT clusters’ formation and stability. Regional Studies 41(2), 173-184.
VICENTE, J. and SUIRE R. (2007) The ambivalent role of mimetic behavior in proximity dynamics: evidence from the French ‘Silicon Sentier’. In Suriñach, J., Moreno, R. and Vayá E. (Eds) Knowledge Externalities, Innovation Clusters and Regional Development. Edward Elgar, Cheltenham, UK.
VIVODA V. (2009) Diversification of oil import sources and energy security: a key strategy or an elusive objective?, Energy Policy 37, 4615-4623.
YERGIN D. (2005) Ensuring energy security, Foreign Affairs 85, 69-82.
22
23


