

Global hot spot monitoring with
Landsat 8 and Sentinel-2
Soushi Kato
Atsushi Oda
Ryosuke Nakamura (AIST)

Motivation for Detecting Hot Spots
Hotspot detection using satellite data
• To monitor wildfire and volcano
• 4 mm band of MODIS or VIIRS with ~1 km resolution
AIST had a ground station of Landsat 8 until March 2015
• Effective use of real-time and archival Landsat 8 data
• SWIR (2 mm) based method (Giglio et al., 2008)
• Limited to eastern Asian region
Landsat 8 archive on Amazon Web Service
• Expand our application to global scale
• Few days of delay

Landsat 8
• OLI (Operational Land Imager)
8 bands in visible – shortwave infrared (30 m)
+ Panchromatic (15 m)
• TIRS (Thermal Infrared Sensor)
2 bands in thermal infrared (100 m)
http://landsat.usgs.gov

Bands Sensitive to Hot Target
0
500
1000
1500
2000
2500
0 2 4 6 8 10 12
Ra
dia
nce
(W/m
2srm
m)
l (mm)
300K500K
700K
800K
900K
B5 B6 B7 B10 B11
NIR SWIR TIR
Planck curves

Detection Method by Giglio et al. (2008)
Fire detection by ASTER reflectance
NIR 0.81mm
SW
IR 2
.33m
m
Candidate fireObvious fire
Candidate fires are further
evaluated by comparing with
the surroundings to identify
fire.
Schroeder et al. (2016)
applied the same method to
Landsat 8 data.
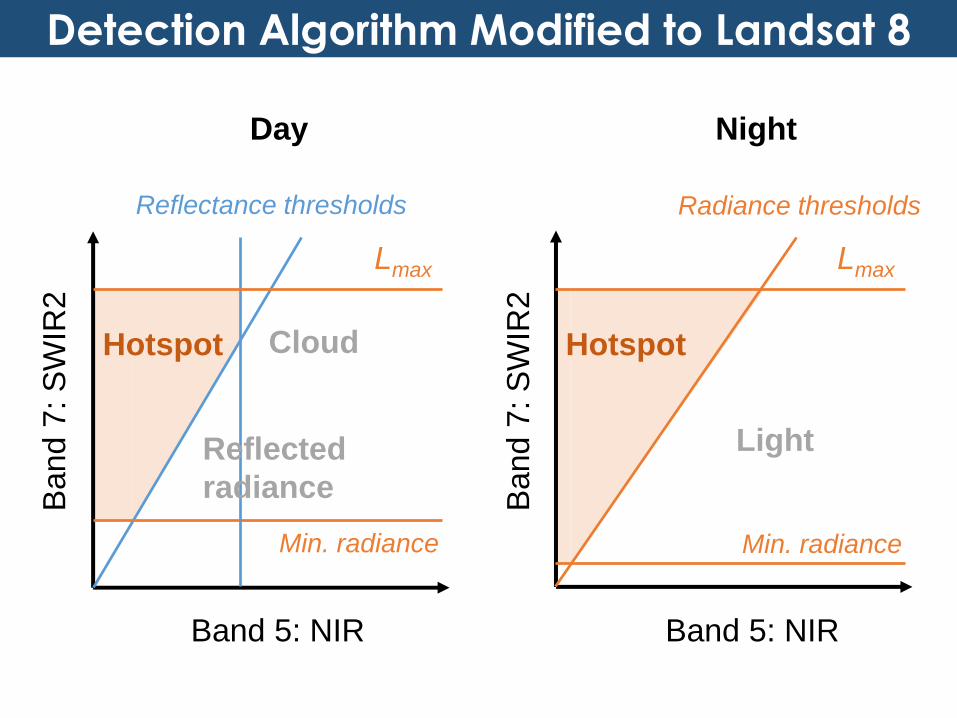
Day Night
Lmax Lmax
Band 5: NIR Band 5: NIR
Band 7
: S
WIR
2
Band 7
: S
WIR
2
Reflectance thresholds
Min. radiance
Hotspot Hotspot
Min. radiance
LightReflected
radiance
Detection Algorithm Modified to Landsat 8
Cloud
Radiance thresholds

Detected Hot Spots
Example of Detection
Natural color
1 kmNshinoshima
Volcano
Mar. 30, 2014
(erupted during
Nov., 2013 – Nov. 2015)
B7 (SWIR) B10 (TIR)
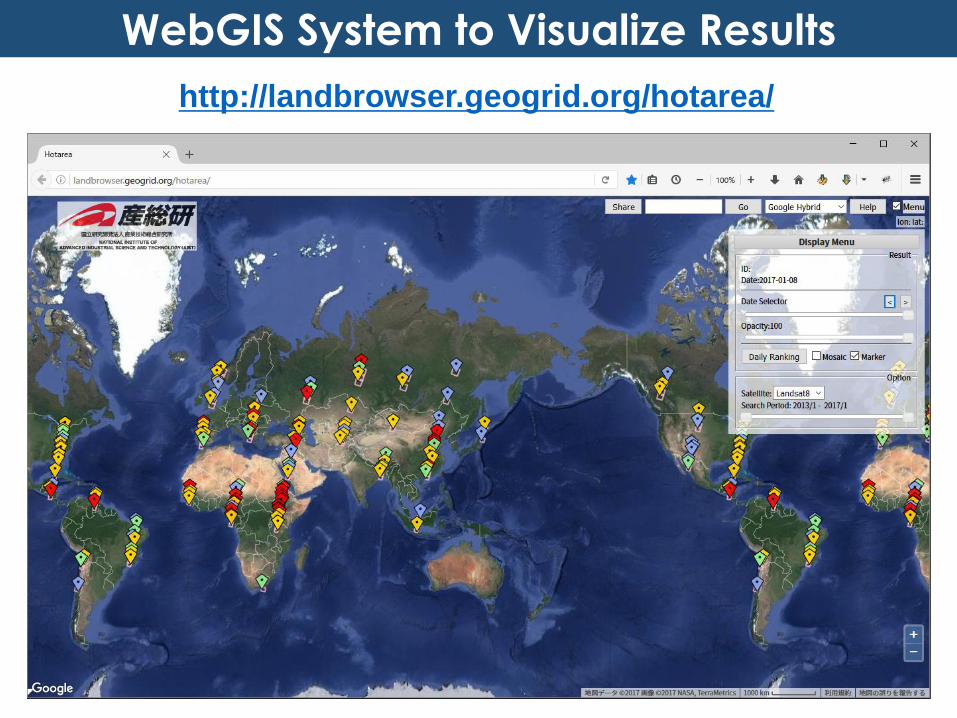
WebGIS System to Visualize Results
http://landbrowser.geogrid.org/hotarea/

Detected Example: Wildfire
Hubei, China
Jan. 23, 2014
L8 detected
VIIRS
MODIS

May 3, 2015
0.5 km 2
October 26, 2015
2km2.2 km2
Detected Example: Open Burning
Jewish Autonomous
Region, Russia
Twice a year
L8 detected
VIIRS
MODIS

Detected Example: VolcanoSatsuma-Iojima, Japan in 2014 erupted in Jun. 2013
6 cloud free images in 46 scenes during 2014 (= 13%)
Not detected
Jul. 28
Apr. 23
Jul. 21Jul. 5
Jan. 1 Mar. 22

To Solve limited Observation Opportunity
Sentinel-2A
• Comparable waveband and spatial resolution with Landsat
series
• Revisit cycle of 10 days (16 days: Landsat 8)
• Sentinel-2B (the same design) will be launched in 2017.
NASA

Apply the Same Method to Sentinel-2 Data…
Sentinel-2A Jan. 4, 2016 Landsat 8 Mar. 17, 2016
Tokyo
Too many detected results in comparison with Landsat 8
30 km
Background: true color
Tokyo

False Positives
Sentinel-2 Jan. 4, 2016
Specular reflection resulted in increased SWIR radiance.
Greenhouse
Roof and
solar panel

0.0
0.2
0.4
0.6
0.8
1.0
1.2
0.0 0.5 1.0 1.5 2.0 2.5
Re
fle
cta
nce
Wavelength (mm)
Greenhouse
Roof
Steelplant
Openburning
Distinguish Hotspot from Specular Reflection
Examples of reflectance spectra
Additional empirical criteria
R2.2mm – R0.87mm
R1.6mm – R0.87mm> rmin
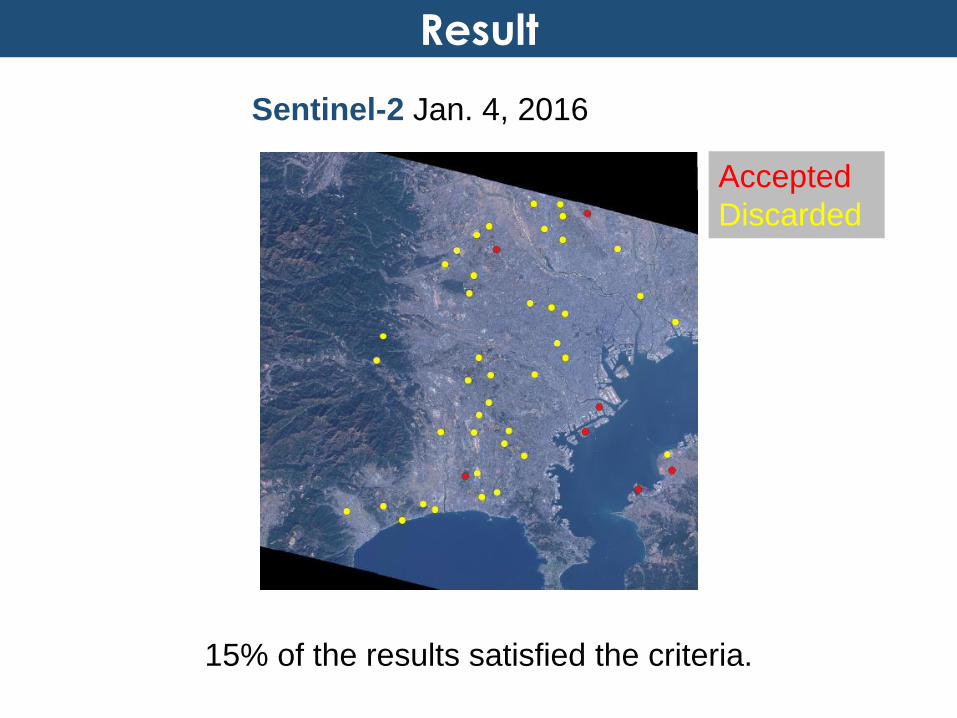
Result
Sentinel-2 Jan. 4, 2016
15% of the results satisfied the criteria.
Accepted
Discarded

Other Seasons
May 13, 2016
85 - 92 % of the results were discarded.
Accepted
DiscardedAug. 31, 2016

Inspection of Cause
Land use was identified using Google Map/street view
Land use Jan. 4 May 15 Aug. 31
Accepted result
Steel plant 2 2 2
Chimney stack 1 0 0
Farmland 3 0 0
Forest 1 0 0
Roof 0 2 3
Discarded result
Roof 22 34 20
Solar panel 18 9 5
Cloud 0 0 3
Chimney stack 0 1 0
Farmland 1 0 0

Prescribed fire
Jan. 24, 2015
Joso, Japan
Overpass time 21:30 JST
Thermocouple
Spectroradiometer
f 1.3m
Validation of Hotspot Detection

At the Overpass Time
Landsat 8 OLI
Overlayed on Open street map
NIR: B5
SWIR1: B6
SWIR2: B7
FOV of spectrometer
Spectrometer
radiance
1110 K
blackbody
0
2000
4000
6000
0 1 2 3
Wavelength (mm)
Sp
ec
tra
lra
dia
nt
inte
ns
ity
(W/s
rm
m) Landsat 8
1374 K
0.249 m2
f 20cm
Detected
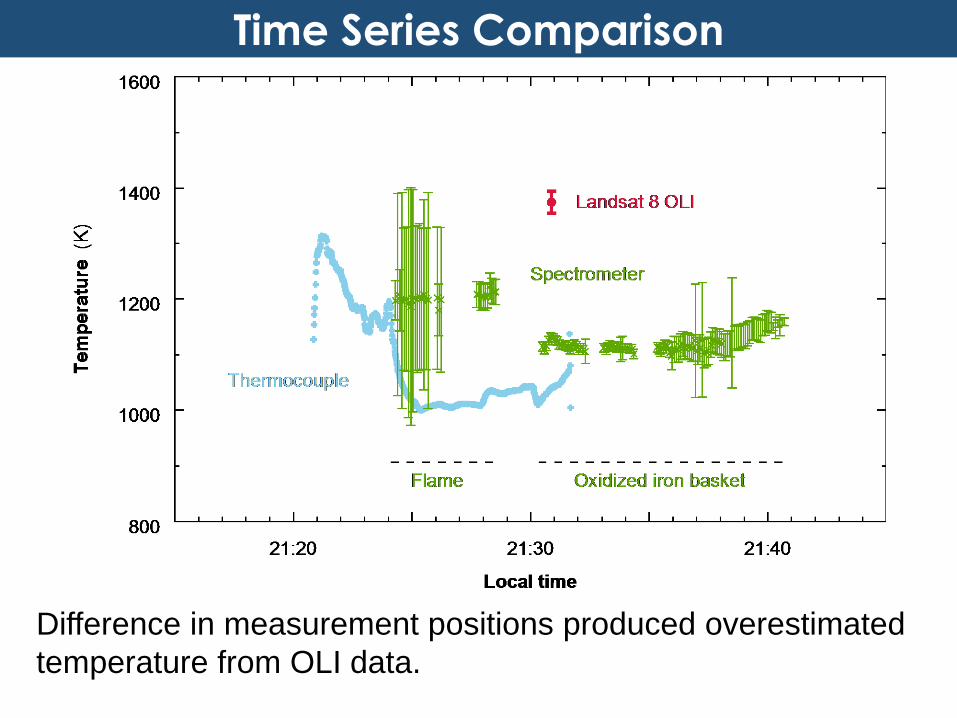
Time Series Comparison
Difference in measurement positions produced overestimated
temperature from OLI data.
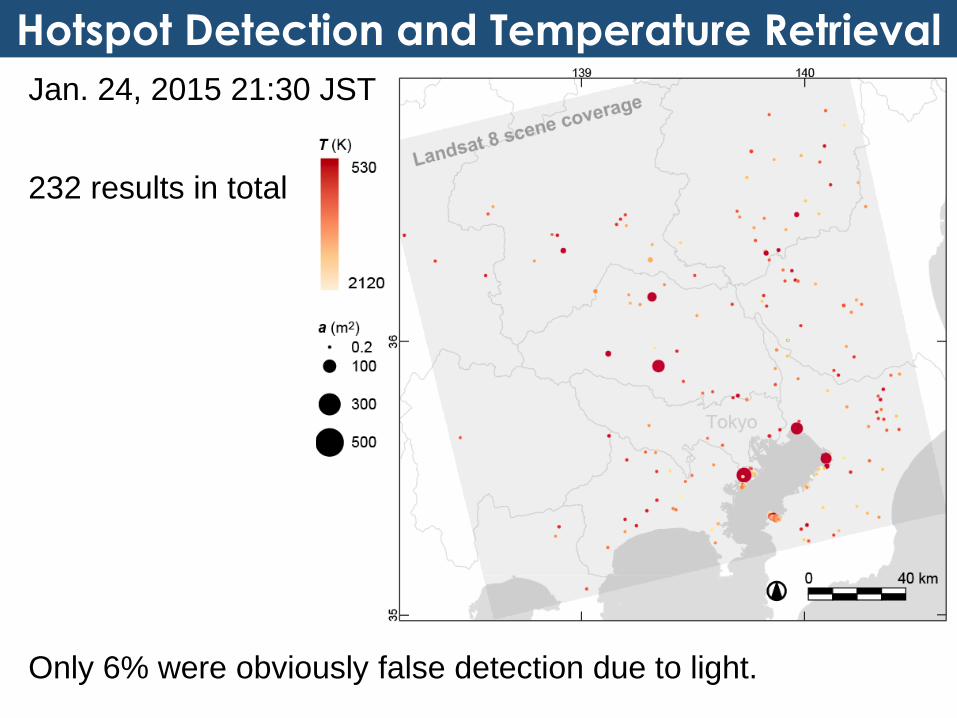
Hotspot Detection and Temperature Retrieval
Jan. 24, 2015 21:30 JST
Only 6% were obviously false detection due to light.
232 results in total

Further Study: Integration with the Other Data
Hotspot detection using TIR data
ASTER by GSJ https://gbank.gsj.jp/nyouga/all/
• Spatial resolution: 90m
• 2000~
• Criteria: TOA BT > 330K
CIRC by JAXA http://circgs.tksc.jaxa.jp/data/
• Spatial resolution: 200m (ALOS2)
130m (CALET on ISS)
• May 2014~ (ALOS2)
• Aug. 2015~ (CALET)
• Criteria: spatial anomaly
• Level 2 product compiles detected results in text file
Integrating these with our result will increase detection
opportunity.

Further Study: Hyperspectral Data
Hyperspectral sensors with spatial resolution of 30 – 60m will
be launched in few years.
• EnMap, DLR
• PRISMA, ASI
• HyspIRI, NASA
• HISUI, METI
HISUI will be onboard ISS.
Hyperspectral data will be useful to detect hotspots and
retrieve their temperature from spectra.
HISUI sensor ISS

Summary
Hotspot detection using SWIR data
• Finer spatial resolution than MODIS or VIIRS fire product
• Automated detection system was developed.
• Results are provided by web service.
• Integration of data from multiple satellite will potentially
increase data acquisition frequency.
Landsat 8, Sentinel-2A, ASTER, CIRC, …
• Temperature can be retrieved from nighttime NIR-SWIR
spectra.
• Hyperspectral data will provide suitable data to
temperature retrieval.

Thank you for your attention.

False Detection: Rooftop
Residential areaNo fire occurred
Specular reflection?
Apr. 27 Jun.30 Oct. 18
Industrial area Shangxi, China
Google map
Roof
26.5°
= roof pitch 6/12”
Roof slope 11.6° ?
0.5 1.0 1.5 2.0l (mm)
0.08
0.79TOA reflectance
Niigata,
Japan
Oct. 29


