
Global Petrochemical Market OutlookLeveraging Competitive Feedstocks Given Energy Market Uncertainty
Mark EramoGlobal Business DevelopmentIHS Chemical
Presented To:Congreso Argentino de PetroquimicaJune 14, 2016Centro Costa SalgueroBuenos Aires, Argentina
Congreso Argentino de Petroquimica, June 14, 2016
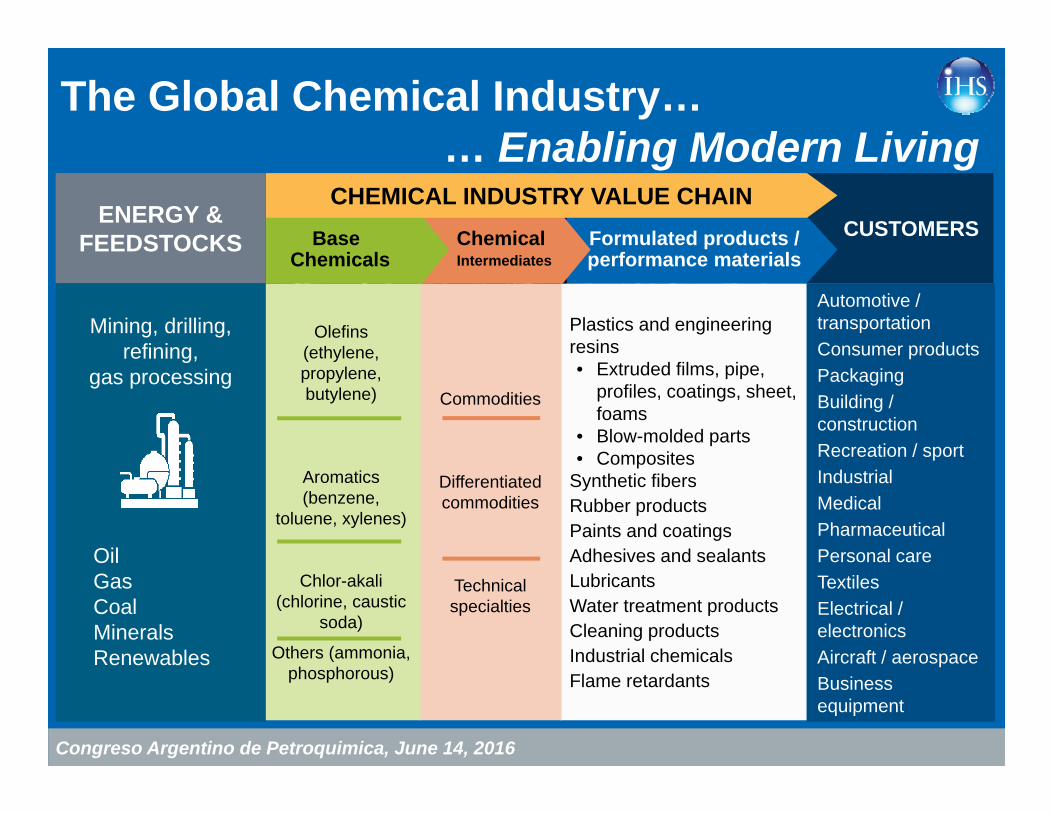
The Global Chemical Industry… … Enabling Modern Living
Automotive / transportationConsumer productsPackagingBuilding / constructionRecreation / sportIndustrialMedicalPharmaceuticalPersonal careTextilesElectrical / electronicsAircraft / aerospaceBusiness equipment
CUSTOMERSFormulated products / performance materials
Plastics and engineering resins• Extruded films, pipe,
profiles, coatings, sheet, foams
• Blow-molded parts• Composites
Synthetic fibersRubber productsPaints and coatingsAdhesives and sealantsLubricantsWater treatment productsCleaning productsIndustrial chemicalsFlame retardants
Commodities
Differentiated commodities
Technical specialties
ChemicalIntermediates
BaseChemicals
Olefins (ethylene, propylene, butylene)
Aromatics (benzene,
toluene, xylenes)
Chlor-akali(chlorine, caustic
soda)
Others (ammonia, phosphorous)
CHEMICAL INDUSTRY VALUE CHAINENERGY & FEEDSTOCKS
Mining, drilling, refining,
gas processing
OilGasCoalMineralsRenewables
ENERGY & FEEDSTOCKS
Congreso Argentino de Petroquimica, June 14, 2016
(right axis )
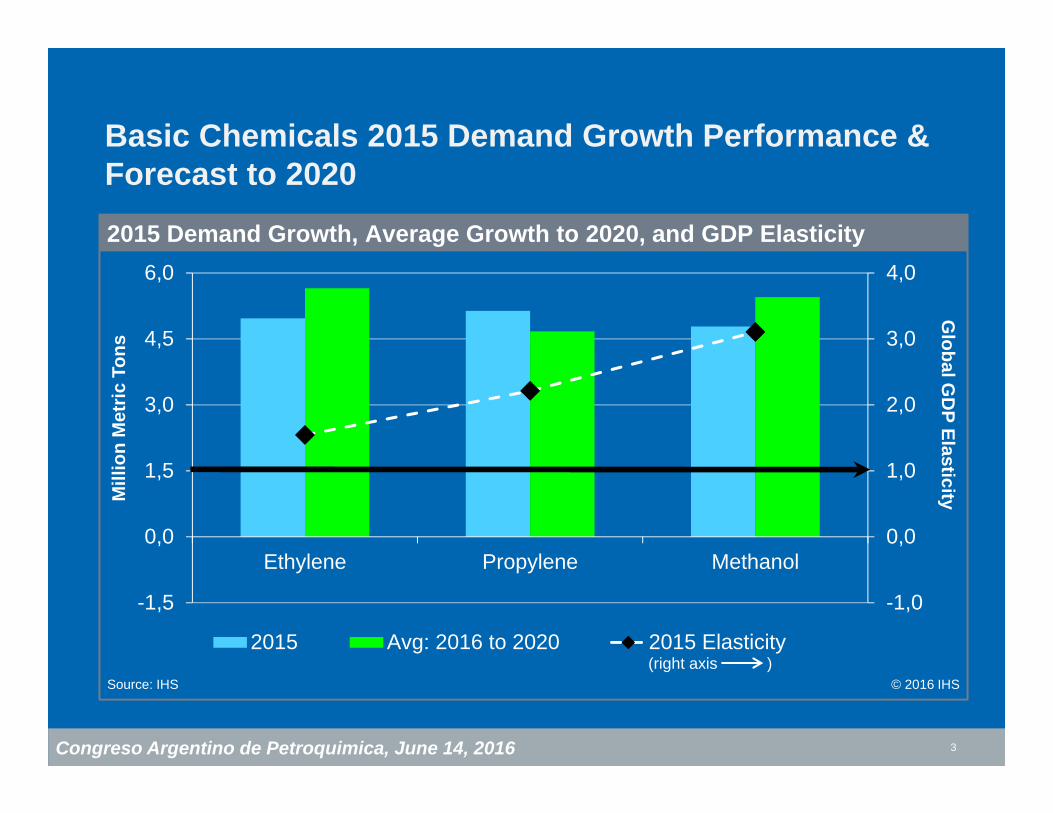
Basic Chemicals 2015 Demand Growth Performance & Forecast to 2020
3
-1,0
0,0
1,0
2,0
3,0
4,0
-1,5
0,0
1,5
3,0
4,5
6,0
Ethylene Propylene Methanol
2015 Avg: 2016 to 2020 2015 Elasticity
2015 Demand Growth, Average Growth to 2020, and GDP Elasticity
© 2016 IHS
Mill
ion
Met
ric T
ons
Source: IHS
Global G
DP Elasticity
Congreso Argentino de Petroquimica, June 14, 2016
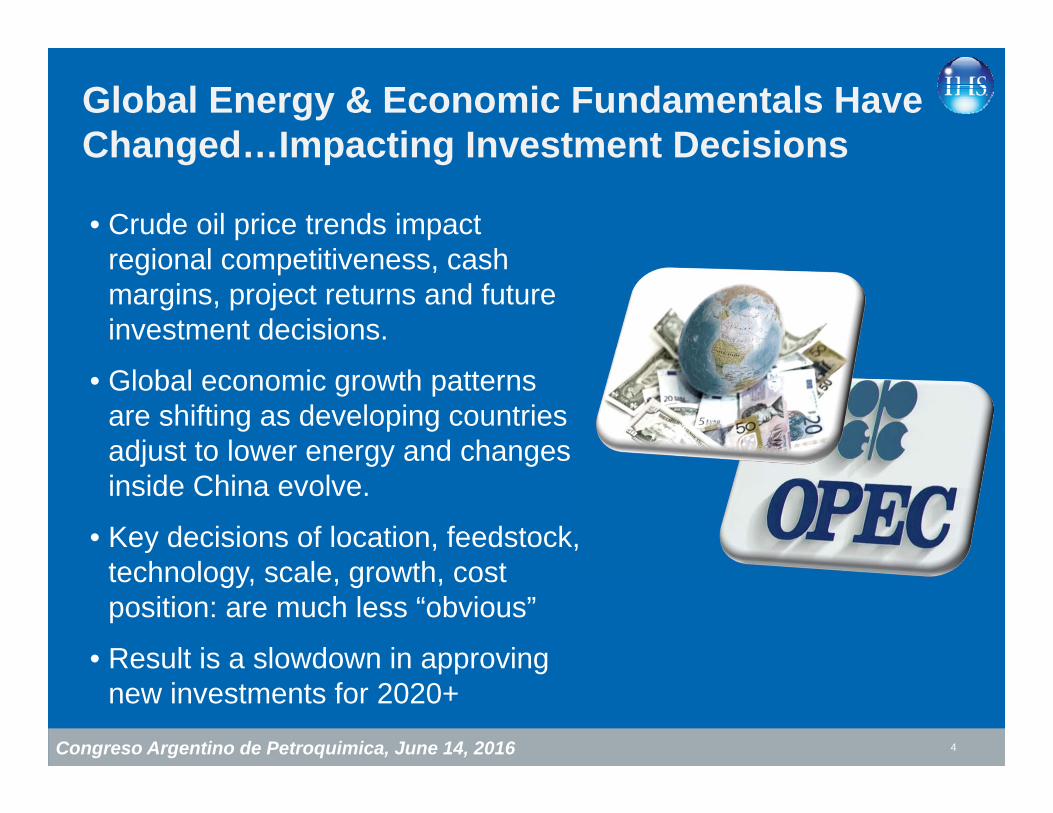
Global Energy & Economic Fundamentals Have Changed…Impacting Investment Decisions
4
• Crude oil price trends impact regional competitiveness, cash margins, project returns and future investment decisions.
• Global economic growth patterns are shifting as developing countries adjust to lower energy and changes inside China evolve.
• Key decisions of location, feedstock, technology, scale, growth, cost position: are much less “obvious”
• Result is a slowdown in approving new investments for 2020+
Congreso Argentino de Petroquimica, June 14, 2016
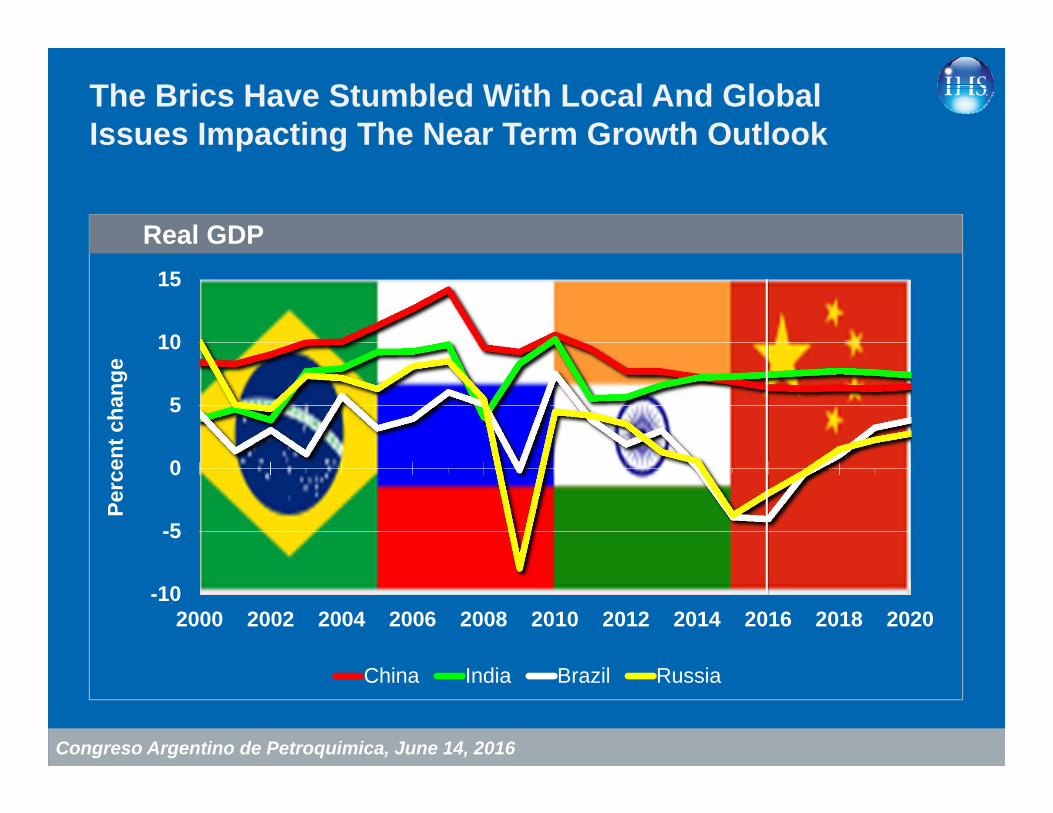
The Brics Have Stumbled With Local And Global Issues Impacting The Near Term Growth Outlook
-10
-5
0
5
10
15
2000 2002 2004 2006 2008 2010 2012 2014 2016 2018 2020
Perc
ent c
hang
e
China India Brazil Russia
Real GDP
Congreso Argentino de Petroquimica, June 14, 2016
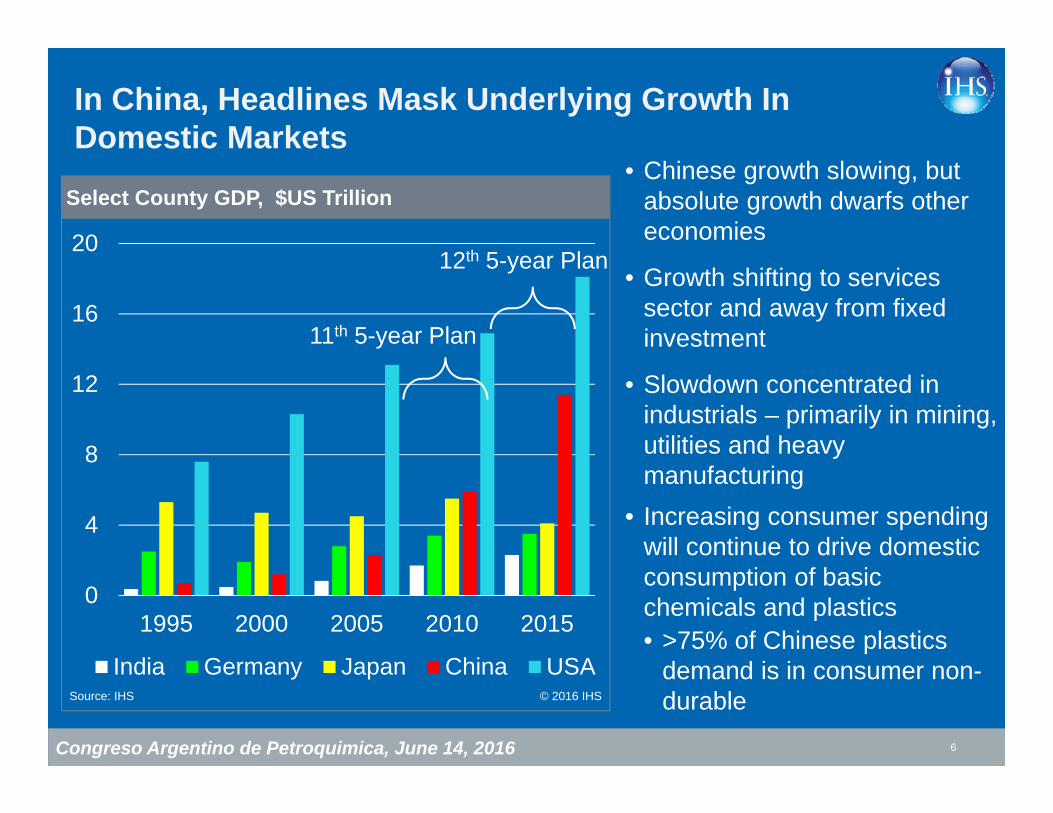
In China, Headlines Mask Underlying Growth In Domestic Markets
6
0
4
8
12
16
20
1995 2000 2005 2010 2015
India Germany Japan China USA
Select County GDP, $US Trillion
Source: IHS © 2016 IHS
• Chinese growth slowing, but absolute growth dwarfs other economies
• Growth shifting to services sector and away from fixed investment
• Slowdown concentrated in industrials – primarily in mining, utilities and heavy manufacturing
• Increasing consumer spending will continue to drive domestic consumption of basic chemicals and plastics• >75% of Chinese plastics
demand is in consumer non-durable
11th 5-year Plan
12th 5-year Plan
Congreso Argentino de Petroquimica, June 14, 2016
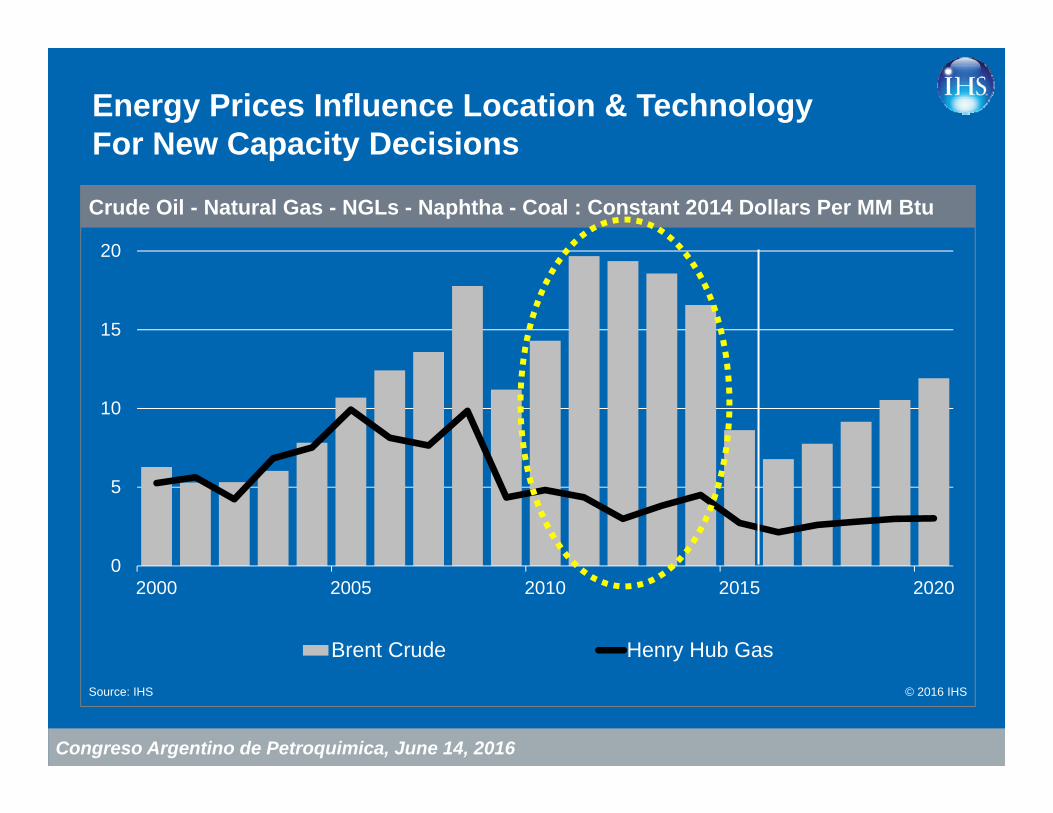
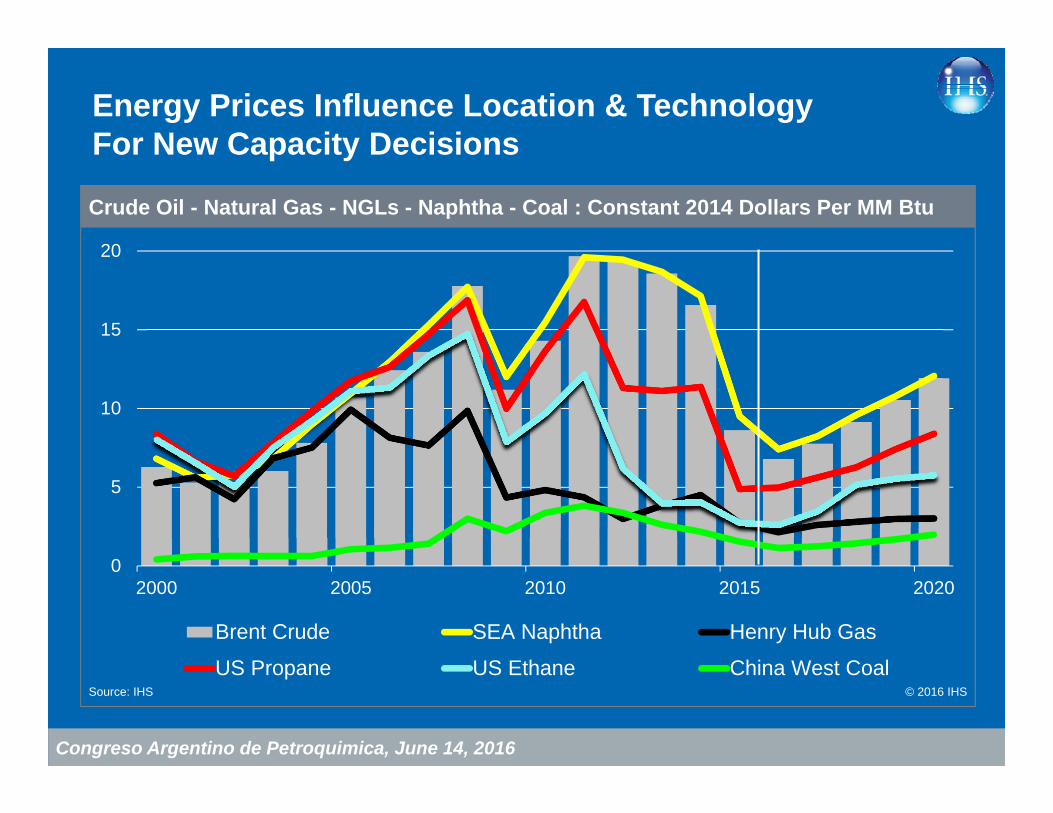
Energy Prices Influence Location & Technology For New Capacity Decisions
0
5
10
15
20
2000 2005 2010 2015 2020
Brent Crude Henry Hub Gas
Crude Oil - Natural Gas - NGLs - Naphtha - Coal : Constant 2014 Dollars Per MM Btu
Source: IHS © 2016 IHS
Congreso Argentino de Petroquimica, June 14, 2016
Energy Prices Influence Location & Technology For New Capacity Decisions
0
5
10
15
20
2000 2005 2010 2015 2020
Brent Crude SEA Naphtha Henry Hub Gas
US Propane US Ethane China West Coal
Crude Oil - Natural Gas - NGLs - Naphtha - Coal : Constant 2014 Dollars Per MM Btu
Source: IHS © 2016 IHS
Congreso Argentino de Petroquimica, June 14, 2016
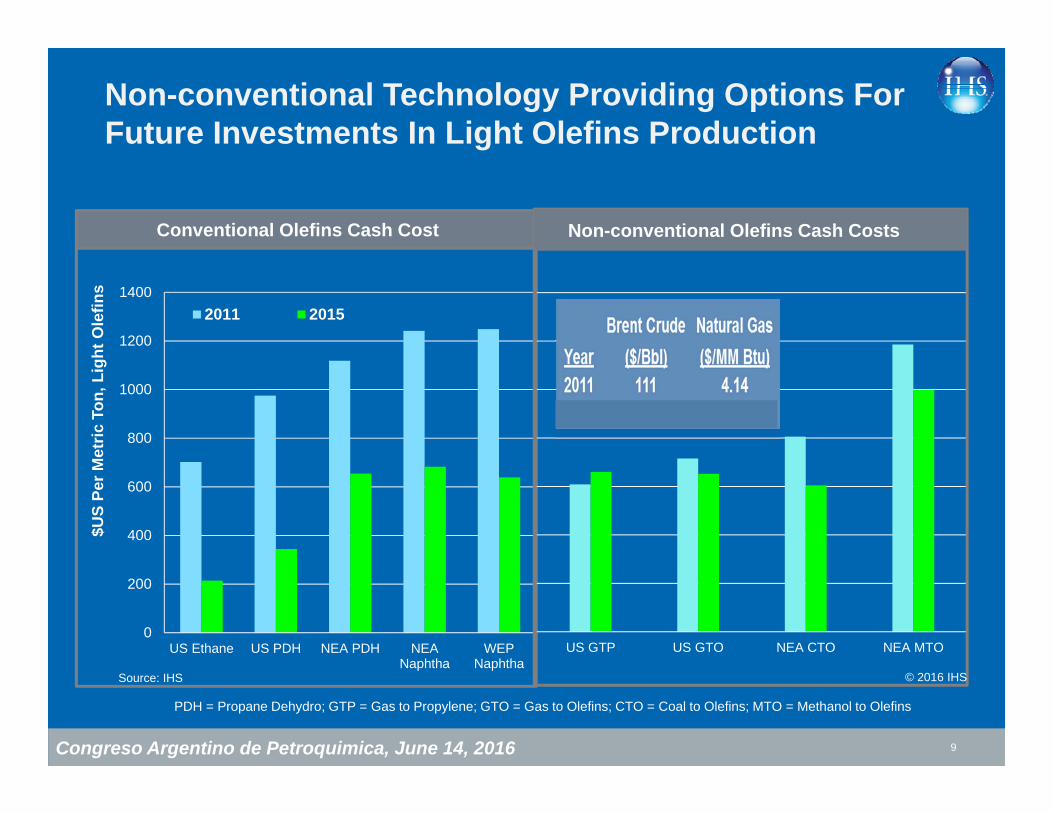
Non-conventional Technology Providing Options For Future Investments In Light Olefins Production
9
0
200
400
600
800
1000
1200
1400
US Ethane US PDH NEA PDH NEANaphtha
WEPNaphtha
2011 2015
Conventional Olefins Cash Cost
US GTP US GTO NEA CTO NEA MTO
Non-conventional Olefins Cash Costs
PDH = Propane Dehydro; GTP = Gas to Propylene; GTO = Gas to Olefins; CTO = Coal to Olefins; MTO = Methanol to Olefins
Source: IHS © 2016 IHS
$US
Per M
etric
Ton
, Lig
ht O
lefin
s
Congreso Argentino de Petroquimica, June 14, 2016
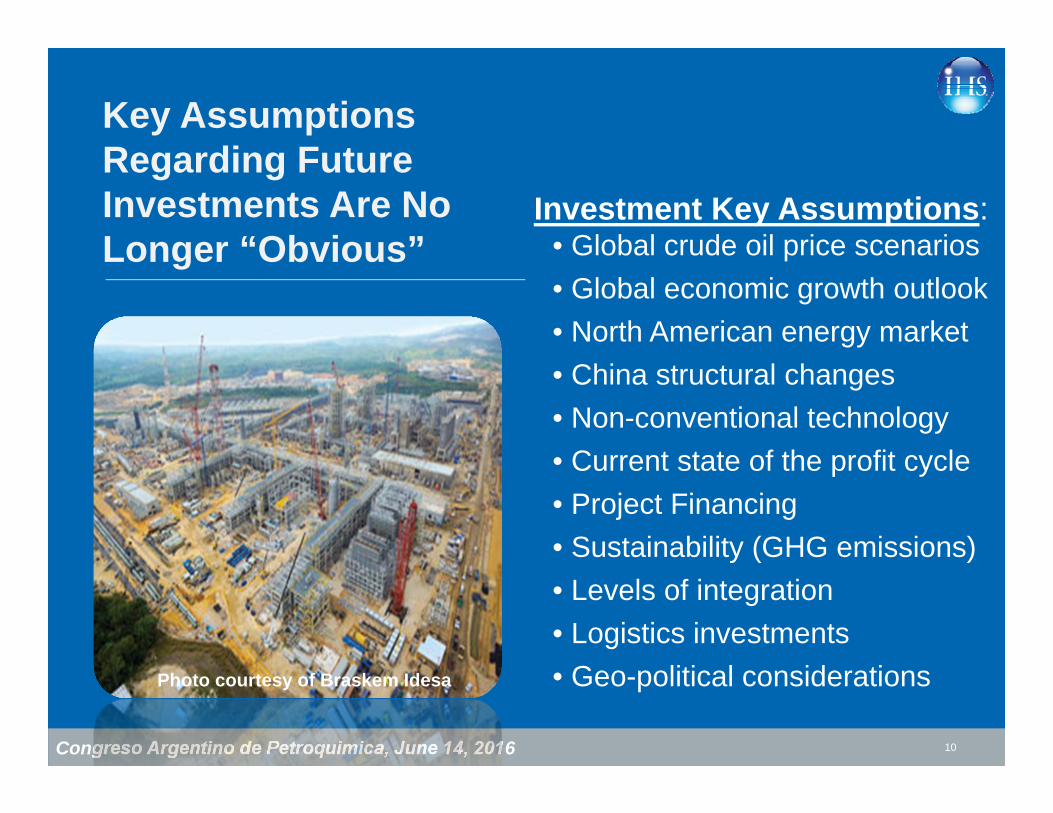
Key Assumptions Regarding Future Investments Are No Longer “Obvious”
10
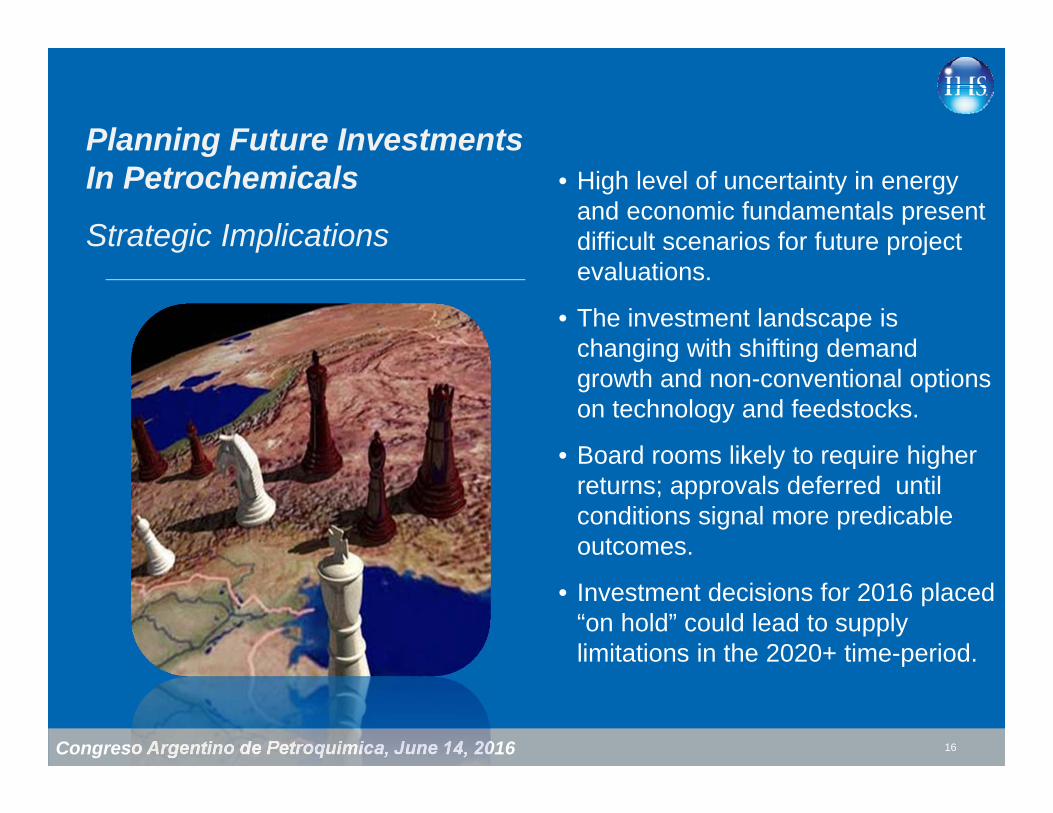
Investment Key Assumptions:• Global crude oil price scenarios• Global economic growth outlook• North American energy market• China structural changes• Non-conventional technology • Current state of the profit cycle• Project Financing• Sustainability (GHG emissions)• Levels of integration• Logistics investments• Geo-political considerationsPhoto courtesy of Braskem Idesa
Congreso Argentino de Petroquimica, June 14, 2016
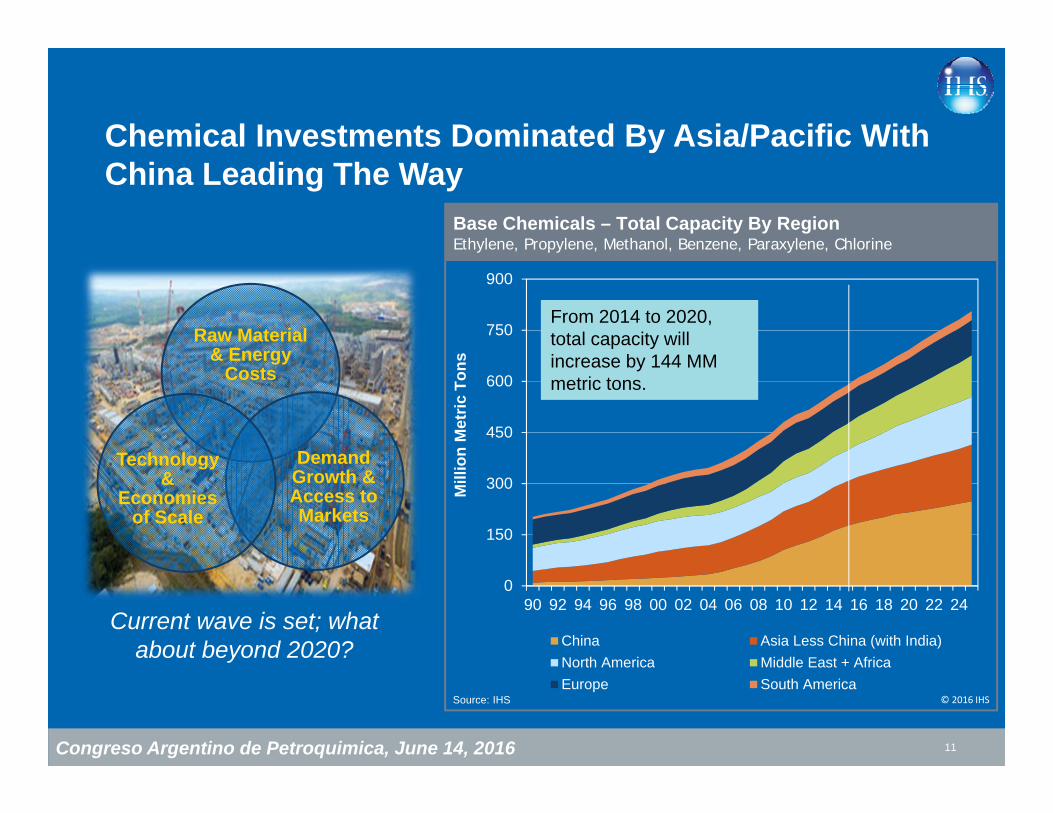
Chemical Investments Dominated By Asia/Pacific With China Leading The Way
11
Raw Material & Energy
Costs
Demand Growth & Access to Markets
Technology &
Economies of Scale
0
150
300
450
600
750
900
90 92 94 96 98 00 02 04 06 08 10 12 14 16 18 20 22 24
China Asia Less China (with India)North America Middle East + AfricaEurope South America
Base Chemicals – Total Capacity By Region Ethylene, Propylene, Methanol, Benzene, Paraxylene, Chlorine
Source: IHS © 2016 IHS
Mill
ion
Met
ric T
ons
Current wave is set; what about beyond 2020?
From 2014 to 2020, total capacity will increase by 144 MM metric tons.
Congreso Argentino de Petroquimica, June 14, 2016 12
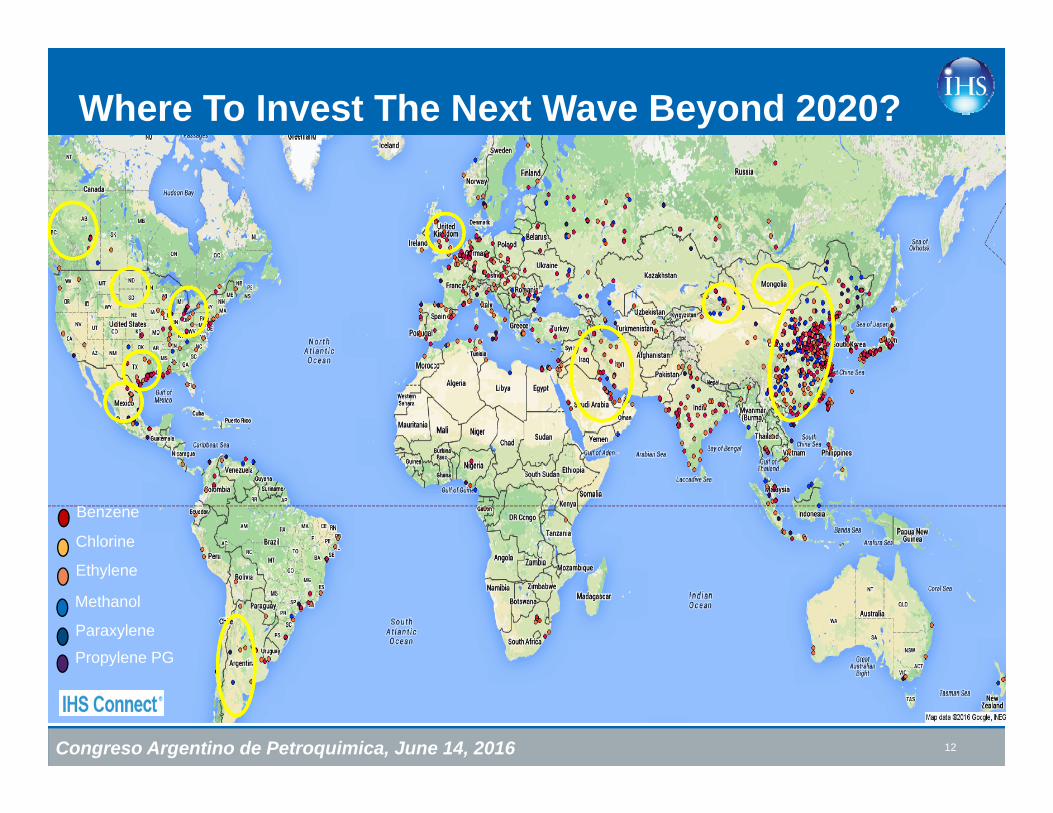
Benzene
Chlorine
Ethylene
Methanol
Paraxylene
Propylene PG
Where To Invest The Next Wave Beyond 2020?
CERI 2016 Petrochemical Conference: June 5-7, 2016Congreso Argentino de Petroquimica, June 14, 2016
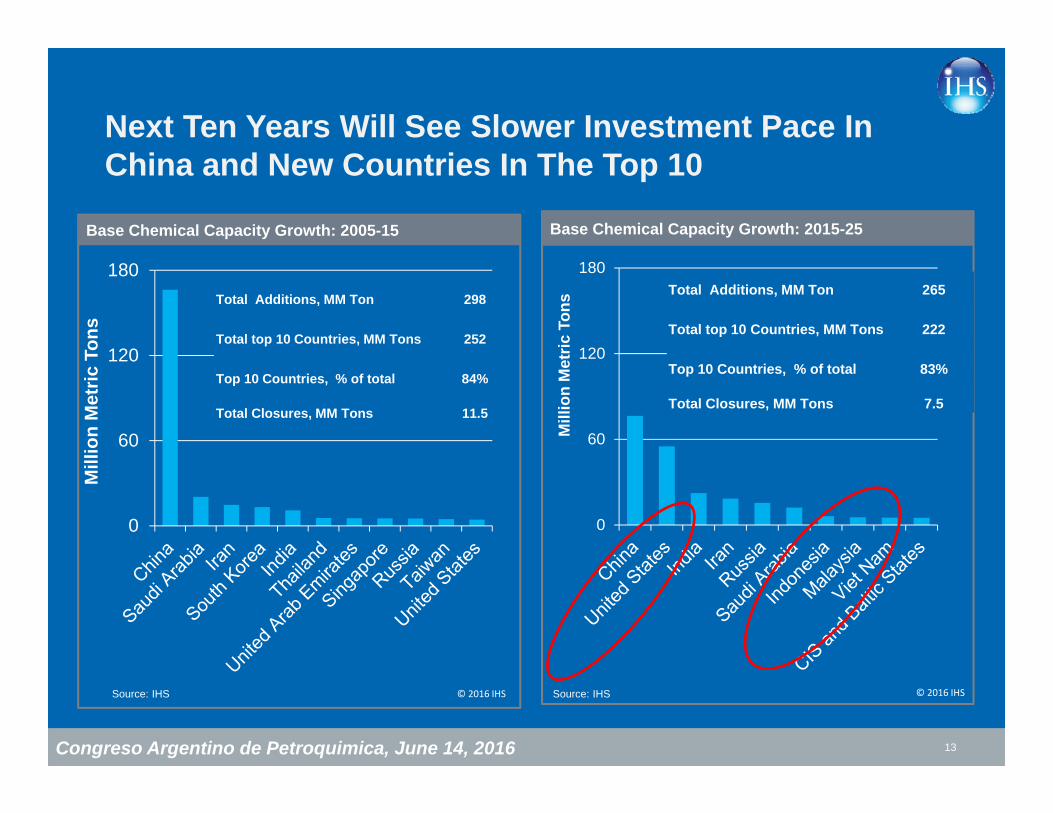
Next Ten Years Will See Slower Investment Pace In China and New Countries In The Top 10
13
0
60
120
180
Mill
ion
Met
ric T
ons
Base Chemical Capacity Growth: 2015-25
Source: IHS © 2016 IHS
0
60
120
180
Mill
ion
Met
ric T
ons
Base Chemical Capacity Growth: 2005-15
Total Additions, MM Ton 298
Total top 10 Countries, MM Tons 252
Top 10 Countries, % of total 84%
Total Closures, MM Tons 11.5
Source: IHS © 2016 IHS
Total Additions, MM Ton 265
Total top 10 Countries, MM Tons 222
Top 10 Countries, % of total 83%
Total Closures, MM Tons 7.5
CERI 2016 Petrochemical Conference: June 5-7, 2016Congreso Argentino de Petroquimica, June 14, 2016
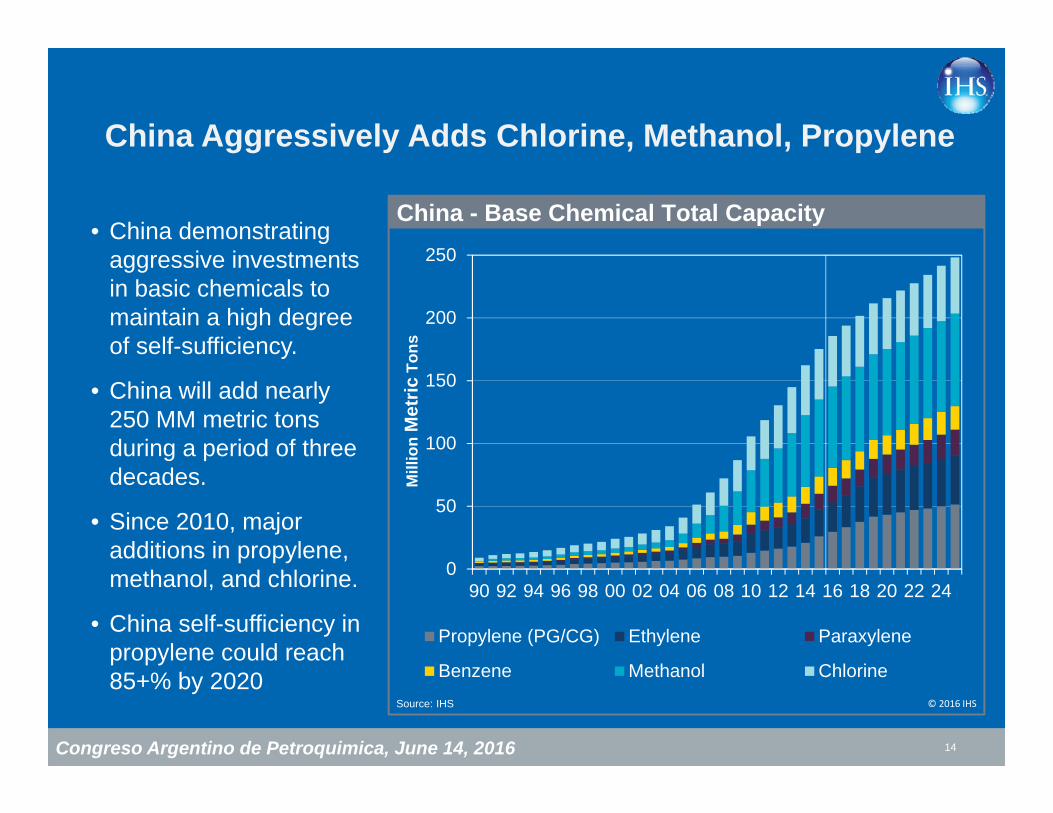
China Aggressively Adds Chlorine, Methanol, Propylene
14
0
50
100
150
200
250
90 92 94 96 98 00 02 04 06 08 10 12 14 16 18 20 22 24
Propylene (PG/CG) Ethylene Paraxylene
Benzene Methanol Chlorine
China - Base Chemical Total Capacity
Source: IHS © 2016 IHS
Mill
ion
Met
ricTo
ns
• China demonstrating aggressive investments in basic chemicals to maintain a high degree of self-sufficiency.
• China will add nearly 250 MM metric tons during a period of three decades.
• Since 2010, major additions in propylene, methanol, and chlorine.
• China self-sufficiency in propylene could reach 85+% by 2020
CERI 2016 Petrochemical Conference: June 5-7, 2016Congreso Argentino de Petroquimica, June 14, 2016
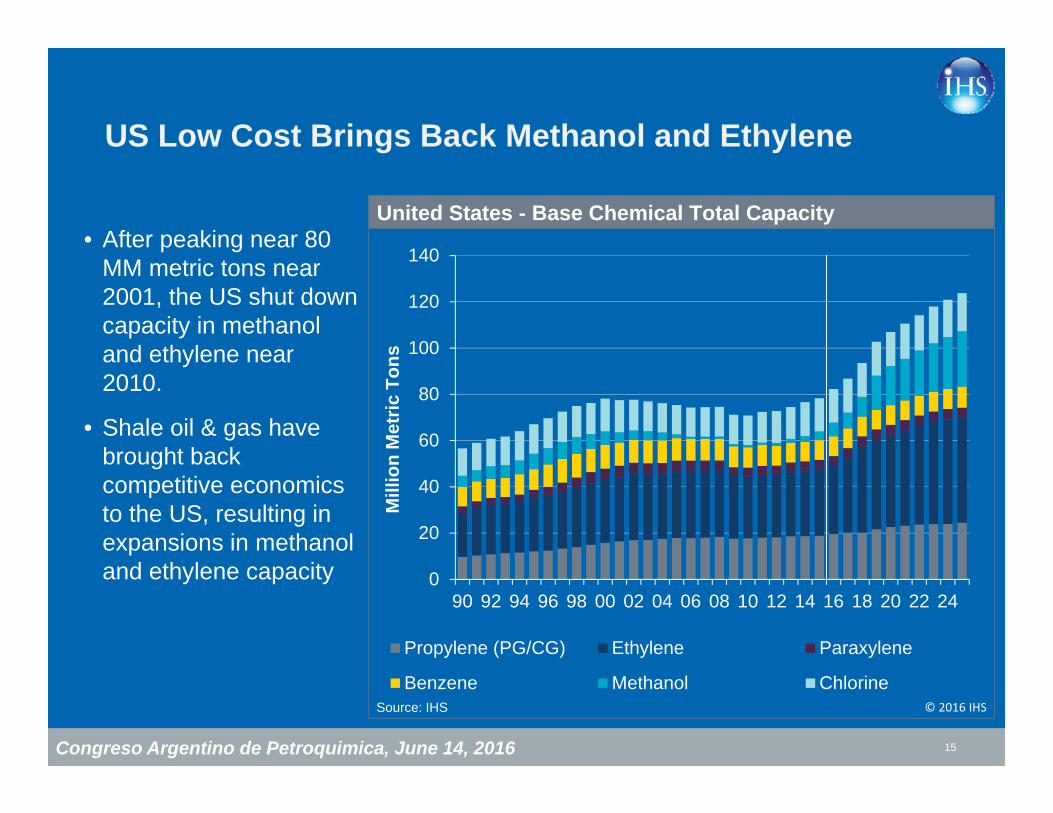
US Low Cost Brings Back Methanol and Ethylene
15
• After peaking near 80 MM metric tons near 2001, the US shut down capacity in methanol and ethylene near 2010.
• Shale oil & gas have brought back competitive economics to the US, resulting in expansions in methanol and ethylene capacity 0
20
40
60
80
100
120
140
90 92 94 96 98 00 02 04 06 08 10 12 14 16 18 20 22 24
Propylene (PG/CG) Ethylene Paraxylene
Benzene Methanol Chlorine
United States - Base Chemical Total Capacity
Source: IHS © 2016 IHS
Mill
ion
Met
ric T
ons
Congreso Argentino de Petroquimica, June 14, 2016
Planning Future Investments In Petrochemicals
Strategic Implications
16
• High level of uncertainty in energy and economic fundamentals present difficult scenarios for future project evaluations.
• The investment landscape is changing with shifting demand growth and non-conventional options on technology and feedstocks.
• Board rooms likely to require higher returns; approvals deferred until conditions signal more predicable outcomes.
• Investment decisions for 2016 placed “on hold” could lead to supply limitations in the 2020+ time-period.
Global Petrochemical Market Outlook
Thank You
Mark EramoGlobal Business DevelopmentIHS Chemical
Presented To:Congreso Argentino de PetroquimicaJune 14, 2016Centro Costa SalgueroBuenos Aires, Argentina


