

(c) AZOTH Analytics
Global Polyethylene Wax (PE Wax) Market: Analysis By
Type, By End User Industry, By Region, By Country:
Opportunities and Forecast (2017-2022)
• Global Polyethylene Wax Market By Type- High Density PE
Wax, Low Density PE Wax, Oxidized PE Wax and Others
• By Application– Plastics & Elastomers, Paint & Coating,
Textile, Printing Ink and Others
• By Region- North America, Europe, APAC and ROW
• By Country- U.S., Canada, Mexico, U.K., Germany, China,
India, Japan, Brazil and Saudi Arabia
May 2017

(c) AZOTH Analytics 2
S.No Particulars Page No.
1. Research Methodology 22
2. Executive Summary 23
3. Strategic Recommendation 24
3.1 Oxidized polyethylene wax to outperform other polyethylene wax types 25
3.2 Plastic & Elastomer industry to remain the fastest growing consumer of PE Wax 26
3.3 Asia Pacific Region to witness the fastest growth in PE Wax market 27
4. Global Wax Market Outlook 28
5. Polyethylene Wax Product Overview 30
5.1 By Type 33
5.2 By End-User Industry 34
6. Global Polyethylene Wax Market: Growth and Forecast 35
6.1 By Value (2012-2016) 36
6.2 By Value (2017-2022) 37

(c) AZOTH Analytics
S.No Particulars Page No.
7. Global Polyethylene Wax Market-By Type (HDPE Wax, LDPE Wax, Oxidized PE Wax and Others) 42
7.1 Global Polyethylene Wax Market-By Type (HDPE Wax, LDPE Wax, Oxidized PE Wax and Others)
Breakdown(%)
43
7.2 Global High Density Polyethylene Wax Market, By Value 44
7.2.1 By Value (2012-2016) 44
7.2.2 By Value (2017-2022) 44
7.3 Global Low Density Polyethylene Wax Market, By Value 45
7.3.1 By Value (2012-2016) 45
7.3.2 By Value (2017-2022) 45
7.2 Global Oxidized Polyethylene Wax Market, By Value 46
7.4.1 By Value (2012-2016) 46
7.4.2 By Value (2017-2022) 46
7.5 Global Polyethylene Wax Market, By Other Types, By Value 48
7.5.1 By Value (2012-2016) 48
7.5.2 By Value (2017-2022) 48
3

(c) AZOTH Analytics
S. No Particulars Page No.
8. Global Polyethylene Wax Market-By End-User Industry (Plastic & Elastomers, Paints & Coatings, Textiles, Printing
Inks, and Other)
49
8.1 Global Polyethylene Wax Market-By Application (Plastic & Elastomers, Paints & Coatings, Textiles, Printing
Inks, and Other) Breakdown(%)
50
8.2 Global Polyethylene Wax Market in Plastics & Elastomers Industry, By Value 51
8.2.1 By Value (2012-2016) 51
8.2.2 By Value (2017-2022) 51
8.3 Global Polyethylene Wax Market in Paint & Coating Industry, By Value 53
8.3.1 By Value (2012-2016) 53
8.3.2 By Value (2017-2022) 53
8.4 Global Polyethylene Wax Market in Textile Industry, By Value 55
8.4.1 By Value (2012-2016) 55
8.4.2 By Value (2017-2022) 55
8.5 Global Polyethylene Wax Market in Printing Ink Industry, By Value 57
8.5.1 By Value (2012-2016) 57
8.5.2 By Value (2017-2022) 57 4

(c) AZOTH Analytics
S. No Particulars Page No.
8.6 Global Polyethylene Wax Market in Other End-User Industries, By Value 59
8.6.1 By Value (2012-2016) 59
8.6.2 By Value (2017-2022) 59
9. Global Polyethylene Wax Market: Regional Analysis 60
9.1 Global Polyethylene Wax Market, By Region: Breakdown (%) 2016 61
9.2 Global Polyethylene Wax Market, By Region: Breakdown (%) 2022
62
9.3 North America Polyethylene Wax Market: An Analysis 63
9.3.1 By Value (2012-2016) 64
9.3.2 By Value (2017-2022) 65
9.4 North America Polyethylene Wax Market: By End-User Industry, By Value 67
9.4.1 North America Polyethylene Wax Market: By End-User Industry, By Value, 2012-2016 68
9.4.2 North America Polyethylene Wax Market: By End-User Industry, By Value, 2017-2022 69
5

(c) AZOTH Analytics
S. No Particulars Page No.
9.5 North America Polyethylene Wax Market: Country Analysis (U.S., Canada & Mexico) 70
9.5.1 U.S. Polyethylene Wax Market, By Value (2012-2022) 71
9.5.1.1 U.S Polyethylene Wax Market: By End-User Industry, By Value (2012-2022) 73
9.5.2 Canada Polyethylene Wax Market, By Value (2012-2022) 74
9.5.2.1 Canada Polyethylene Wax Market: By End-User Industry, By Value (2012-2022)
75
9.5.3 Mexico Polyethylene Wax Market, By Value (2012-2022) 76
9.5.3.1 Mexico Polyethylene Wax Market: By End-User Industry, By Value (2012-2022)
77
9.6 Europe Polyethylene Wax Market: An Analysis 78
9.6.1 By Value (2012-2016) 79
9.6.2 By Value (2017-2022) 80
6

(c) AZOTH Analytics
S. No Particulars Page No.
9.7 Europe Polyethylene Wax Market: By End-User Industry, By Value 82
9.7.1 Europe Polyethylene Wax Market: By End-User Industry, By Value, 2012-2016 83
9.7.2 Europe Polyethylene Wax Market: By End-User Industry, By Value, 2017-2022 84
9.8 Europe Polyethylene Wax Market: Country Analysis (Germany, U.K and Rest of Europe) 85
9.8.1 Germany Polyethylene Wax Market, By Value (2012-2022) 86
9.8.1.1 Germany Polyethylene Wax Market: By End-User Industry, By Value (2012-2022)
88
9.8.2 U.K. Polyethylene Wax Market, By Value (2012-2022) 89
9.8.2.1 U.K Polyethylene Wax Market: By End-User Industry, By Value (2012-2022) 90
9.8.3 Rest of Europe Polyethylene Wax Market, By Value (2012-2022) 91
7

(c) AZOTH Analytics
S. No Particulars Page No.
9.9 Asia Pacific Polyethylene Wax Market: An Analysis 92
9.9.1 By Value (2012-2016) 93
9.9.2 By Value (2017-2022) 94
9.10 APAC Polyethylene Wax Market: By End-User Industry, By Value 96
9.10.1 Asia Pacific Polyethylene Wax Market: By End-User Industry, By Value, 2012-2016 97
9.10.2 Asia Pacific Polyethylene Wax Market: By End-User Industry, By Value, 2017-2022 98
9.11 APAC Polyethylene Wax Market: Country Analysis (China, India, Japan, & Rest of Europe) 99
9.11.1 China Polyethylene Wax Market, By Value (2012-2022) 100
9.11.1.1 China Polyethylene Wax Market: By End-User Industry, By Value (2012-2022) 102
9.11.2 India Polyethylene Wax Market, By Value (2012-2022) 103
9.11.2.1 India Polyethylene Wax Market: By End-User Industry, By Value (2012-2022) 105
8

(c) AZOTH Analytics
S. No Particulars Page No.
9.11.3 Japan Polyethylene Wax Market, By Value (2012-2022) 106
9.11.3.1 Japan Polyethylene Wax Market: By End-User Industry, By Value (2012-2022) 107
9.11.4 Rest of Asia Pacific Polyethylene Wax Market, By Value (2012-2022) 108
9.12 Rest of the World Polyethylene Wax Market: An Analysis 109
9.12.1 By Value (2012-2016) 110
9.12.2 By Value (2017-2022) 111
9.13 Rest of the World Polyethylene Wax Market: By End-User Industry , By Value 114
9.13.1 Rest of the World Polyethylene Wax Market: By End-User Industry , By Value (2012-2016) 115
9.13.2 Rest of the World Polyethylene Wax Market: By End-User Industry , By Value (2017-2022) 116
9.14 Rest of the World Polyethylene Wax Market: Country Analysis (Brazil and Saudi Arabia) 117
9.14.1 Brazil Polyethylene Wax Market, By Value (2012-2022) 118
9.14.1.1 Brazil Polyethylene Wax Market: By End-User Industry , By Value (2012-2022)
119
9

(c) AZOTH Analytics
S. No Particulars Page No.
9.14.2 Saudi Arabia Polyethylene Wax Market, By Value (2012-2022) 120
9.14.2.1 Saudi Arabia Polyethylene Wax Market: By End-User Industry, By Value (2012-2022)
121
10. Market Dynamics 122
10.1 Drivers 123
10.2 Restraints 128
11. Market Trends 130
12. Porter’s Five Forces Analysis – Polyethylene Wax Market
135
13. SWOT Analysis –Polyethylene Wax Market 137
14. Supply Chain Analysis 139
15. Policy and Regulatory Landscape
141
10

(c) AZOTH Analytics
16. Company Profiling 146
16.1 BASF SE 147
16.2 Clariant AG 150
16.3 Mitsui Chemicals Inc. 152
16.4 Innospec Inc. 154
16.5 The Lubrizol Corporation 156
16.6 SCG Chemicals Co., Ltd. 157
16.7 WIWAX 158
16.8 Trecora Chemical 159
16.9 Euroceras 160
16.10 Cosmic Petrochem 161
17. About Us 162
11

(c) AZOTH Analytics
List of Figures
Figure No. Figure Title Page No.
Figure 1: Global Polyethylene Wax Market Size, By Value, 2012-2016 (USD Million) 36
Figure 2: Global Polyethylene Wax Market Size, By Value, Forecast, 2017-2022(USD Million) 37
Figure 3: Global Crude Oil Production, 2012-2016 (Million Barrels Per day) 38
Figure 4: Global Coatings Sales, By Region, By Value (%) 39
Figure 5: Global Plastics Industry Growth (USD Billion) 39
Figure 6: Global PVC Demand, By Region (%) 40
Figure 7: Global PVC Demand, By Application (%) 40
Figure 8: World Man-Made Fibers Production, 2012-2016 (Thousand Tons) 41
Figure 9: Global Polyethylene Wax Market Size, By Type, 2016 (%) 43
Figure 10: Global Polyethylene Wax Market Size, By Type, 2022 (%) 43
Figure 11: Global High Density Polyethylene Wax Market Size, By Value, 2012-2016 (USD Million) 44
Figure 12: Global High Density Polyethylene Wax Market Size, By Value, Forecast, 2017-2022 (USD Million) 44
Figure 13: Global Low Density Polyethylene Wax Market Size, By Value, 2012-2016 (USD Million) 45
Figure 14: Global Low Density Polyethylene Wax Market Size, By Value, Forecast, 2017-2022 (USD Million) 45
Figure 15: Global Oxidized Density Polyethylene Wax Market Size, By Value, 2012-2016 (USD Million) 46
12

(c) AZOTH Analytics
List of Figures
Figure No. Figure Title Page No.
Figure 16: Global Oxidized Polyethylene Wax Market Size, By Value, Forecast, 2017-2022 (USD Million) 46
Figure 17: Global Polyethylene Wax Market Size, By Other Types, By Value, 2012-2016 (USD Million) 48
Figure 18: Global Polyethylene Wax Market Size, By Other Types, By Value, Forecast, 2017-2022 (USD Million) 48
Figure 19: Global Polyethylene Wax Market Size, By End-User Industry, 2016 (%) 50
Figure 20: Global Polyethylene Wax Market Size, By End-User Industry, 2022 (%) 50
Figure 21: Global Polyethylene Wax Market in Plastics & Elastomers Industry, By Value, 2012-2016 (USD Million) 51
Figure 22: Global Polyethylene Wax Market in Plastics & Elastomers Industry, By Value, Forecast, 2017-2022 (USD Million)
51
Figure 23: Global Plastic Production, 2012-2016(Million Metric Tons) 52
Figure 24: Global Plastic Material Production, By Region, (%) 52
Figure 25: Global Polyethylene Wax Market in Paint & Coating Industry, By Value, 2012-2016 (USD Million) 53
Figure 26: Global Polyethylene Wax Market in Paint & Coating Industry, By Value, Forecast, 2017-2022 (USD Million) 53
Figure 27: Consumption of Coating, By Segment (%) 54
Figure 28: Global Polyethylene Wax Market in Textile Industry, By Value, 2012-2016 (USD Million) 55
Figure 29: Global Polyethylene Wax Market in Textile Industry, By Value, Forecast, 2017-2022 (USD Million) 55
Figure 30: Global Synthetic Fibre Production, By Volume, 2012-2016 (Thousand Metric Tonnes) 56
13

(c) AZOTH Analytics
List of Figures
Figure No. Figure Title Page No.
Figure 31: Fiber Consumption Make up, 2015 (%) 56
Figure 32: Global Polyethylene Wax Market in Printing Ink Industry, By Value, 2012-2016 (USD Million) 57
Figure 33: Global Polyethylene Wax Market in Printing Ink Industry, By Value, Forecast, 2017-2022 (USD Million) 57
Figure 34: World Print Market, By Region (%) 58
Figure 35: World Print Market, By Type (%) 58
Figure 36: Global Polyethylene Wax Market in Other End-User Industries, By Value, 2012-2016 (USD Million) 59
Figure 37: Global Polyethylene Wax Market in Other End-User Industries, By Value, Forecast, 2017-2022 (USD Million) 59
Figure 38: Global Polyethylene Wax Market Size, By Region, 2016 (%) 61
Figure 39: Global Polyethylene Wax Market Size, By Region, 2022 (%) 62
Figure 40: North America Polyethylene Wax Market, By Value, 2012-2016 (USD Million) 64
Figure 41: North America Polyethylene Wax Market, By Value, Forecast, 2017-2022 (USD Million) 65
Figure 42: U.S Shale Gas Production 2010-2014 (Trillion Cubic Feet) 66
Figure 43: North America Polyethylene Wax Market: By End-User Industry, By Value, 2012-2016 (USD Million) 68
Figure 44: North America Polyethylene Wax Market: By End-User Industry, By Value, 2017-2022 (USD Million) 69
Figure 45: U.S. Polyethylene Wax Market, By Value, 2012-2016 (USD Million) 71
14

(c) AZOTH Analytics
List of Figures
Figure No. Figure Title Page No.
Figure 46: U.S. Polyethylene Wax Market, By Value, Forecast, 2017-2022 (USD Million) 71
Figure 47: U.S Plastic Consumption, By Sector (%) 72
Figure 48: U.S Printing Market Shipment, 2012-2016 (USD Million) 72
Figure 49: U.S. Polyethylene Wax Market: By End-User Industry, By Value, 2012-2022 (USD Million) 73
Figure 50: Canada Polyethylene Wax Market, By Value, 2012-2016 (USD Million) 74
Figure 51: Canada Polyethylene Wax Market, By Value, Forecast, 2017-2022 (USD Million) 74
Figure 52: Canada Polyethylene Wax Market: By End-User Industry, By Value, 2012-2022 (USD Million) 75
Figure 53: Mexico Polyethylene Wax Market, By Value, 2012-2016 (USD Million) 76
Figure 54: Mexico Polyethylene Wax Market, By Value, Forecast, 2017-2022 (USD Million) 76
Figure 55: Mexico Polyethylene Wax Market: By End-User Industry, By Value, 2012-2022 (USD Million) 77
Figure 56: Europe Polyethylene Wax Market, By Value, 2012-2016 (USD Million) 79
Figure 57: Europe Polyethylene Wax Market, By Value, Forecast, 2017-2022 (USD Million) 80
Figure 58: Plastic Use in Europe, By Sectors (%) 81
Figure 59: European Plastic Demand, By Main Field of Application (%) 81
Figure 60: Europe Polyethylene Wax Market: By End-User Industry, By Value, 2012-2016 (USD Million)\ 83
15

(c) AZOTH Analytics
List of Figures
Figure No. Figure Title Page No.
Figure 61: Europe Polyethylene Wax Market: By End-User Industry, By Value, 2017-2022 (USD Million) 84
Figure 62: Germany Polyethylene Wax Market, By Value, 2012-2016 (USD Million) 86
Figure 63: Germany Polyethylene Wax Market, By Value, Forecast, 2017-2022 (USD Million) 86
Figure 64: Plastic Demand in Europe, By Country (%) 87
Figure 65: Plastic Consumption in Germany, By Segment (%) 87
Figure 66: Germany Polyethylene Wax Market: By End-User Industry, By Value, 2012-2022 (USD Million) 88
Figure 67: U.K. Polyethylene Wax Market, By Value, 2012-2016 (USD Million) 89
Figure 68: U.K. Polyethylene Wax Market, By Value, Forecast, 2017-2022 (USD Million) 89
Figure 69: Polyethylene Wax Market: By End-User Industry, By Value, 2012-2022 (USD Million) 90
Figure 70: Rest of Europe Polyethylene Wax Market, By Value, 2012-2016 (USD Million) 91
Figure 71: Rest of Europe Polyethylene Wax Market, By Value, Forecast, 2017-2022 (USD Million) 91
Figure 72: Asia Pacific Polyethylene Wax Market, By Value, 2012-2016 (USD Million) 93
Figure 73: Asia Pacific Polyethylene Wax Market, By Value, Forecast, 2017-2022 (USD Million) 94
Figure 74: Global Production of Plastics, 2016(%) 95
Figure 75: Global Coating Sales, By Region 2016 (%) 95
16

(c) AZOTH Analytics
List of Figure
Figure No. Figure Title Page No.
Figure 76: Asia Pacific Polyethylene Wax Market: By End-User Industry, By Value, 2012-2016 (USD Million) 97
Figure 77: Asia Pacific Polyethylene Wax Market: By End-User Industry, By Value, 2017-2022 (USD Million) 98
Figure 78: China Polyethylene Wax Market, By Value, 2012-2016 (USD Million) 100
Figure 79: China Polyethylene Wax Market, By Value, 2012-2016 (USD Million) 100
Figure 80: China Plastic Production, 2012-2016 (Million Tonnes) 101
Figure 81: China Polyethylene Wax Market: By End-User Industry, By Value, 2012-2022 (USD Million) 102
Figure 82: India Polyethylene Wax Market, By Value, 2012-2016 (USD Million) 103
Figure 83: India Polyethylene Wax Market, By Value, Forecast, 2017-2022 (USD Million) 103
Figure 84: India’s Plastic Consumption, By Application (%) 104
Figure 85: 85: India’s PVC Demand, By Application (%) 104
Figure 86: India Polyethylene Wax Market: By End-User Industry, By Value, 2012-2022 (USD Million) 105
Figure 87: Japan Polyethylene Wax Market, By Value, 2012-2016 (USD Million) 106
Figure 88: Japan Polyethylene Wax Market, By Value, Forecast, 2017-2022 (USD Million) 106
Figure 89: Japan Polyethylene Wax Market: By End-User Industry, By Value, 2012-2022 (USD Million) 107
Figure 90: Rest of Asia Pacific Polyethylene Wax Market, By Value, 2012-2016 (USD Million) 108
17

(c) AZOTH Analytics
List of Figure
Figure No. Figure Title Page No.
Figure 91: Rest of Asia Pacific Polyethylene Wax Market, By Value, Forecast, 2017-2022 (USD Million) 108
Figure 92: Rest of the World Polyethylene Wax Market, By Value, 2012-2016 (USD Million) 110
Figure 93: Rest of the World Polyethylene Wax Market, By Value, Forecast, 2017-2022 (USD Million) 111
Figure 94: Middle East and Africa Crude Oil Production 2011-15 (Million Barrels per day) 112
Figure 95: Latin America Crude Oil Production 2011-15 (Million Barrels per day) 112
Figure 96: GCC Polymers Consumption, By Country (%) 113
Figure 97: GCC Polymers Consumption, By End User Industry (%) 113
Figure 98: RoW Polyethylene Wax Market: By End-User Industry, By Value, 2012-2016 (USD Million) 115
Figure 99: RoW Polyethylene Wax Market: By End-User Industry, By Value, 2017-2022 (USD Million) 116
Figure 100: Brazil Polyethylene Wax Market, By Value, 2012-2016 (USD Million) 118
Figure 101: Brazil Polyethylene Wax Market, By Value, Forecast, 2017-2022 (USD Million) 118
Figure 102: Brazil Polyethylene Wax Market: By End-User Industry, By Value, 2012-2022 (USD Million) 119
Figure 103: Saudi Arabia Polyethylene Wax Market, By Value, 2012-2016 (USD Million) 120
Figure 104: Saudi Arabia Polyethylene Wax Market, By Value, Forecast, 2017-2022 (USD Million) 120
Figure 105: Saudi Arabia Polyethylene Wax Market: By End-User Industry, By Value, 2012-2022 (USD Million) 121
18

(c) AZOTH Analytics
List of Figures
Figure No. Figure Title Page No.
Figure 106: BASF SE Sales, 2012-2016 (USD Billion) 148
Figure 107: BASF SE Sales, By Business Segment, 2016 (%) 148
Figure 108: BASF SE Sales, By Region, 2016 (%) 148
Figure 109: BASF SE Performance Product Segment Sales, By Business Unit, 2016 (%) 149
Figure 110: BASF SE Dispersion & Pigments Product Segment Sales, By Region, 2016 (%) 149
Figure 111: Clariant Sales, 2012-2016 (USD Billion) 151
Figure 112: Clariant Sales, By Business Segment, 2016 (%) 151
Figure 113: Clariant Sales, By Region, 2016 (%) 151
Figure 114: Mitsui Chemicals Inc. Sales, 2012-03-2016 -03 (USD Billion) 153
Figure 115: Mitsui Chemicals Inc. Sales, By Business Group,2016 (%) 153
Figure 116: Mitsui Chemicals Inc. Sales, By Region, 2016 (%) 153
Figure 117: Innospec Inc. Sales, 2012-2016 (USD Billion) 155
Figure 118: Innospec Inc. Sales, By Business Group, 2016 (%) 155
Figure 119: Innospec Inc. Sales, By Region, 2016 (%) 155
19

(c) AZOTH Analytics
List of Table
Table No. Table Title Page No.
Table A: Parameters of a Polyethylene Wax 32
Table B: Polyethylene Wax Outlook, By Type 33
20
(c) AZOTH Analytics
Global PE Wax Market –By Value
(2012-16)
Global PE Wax Market – By Value
(2017-22)
Breakdown-By Type, By Value
High Density PE Wax
Low Density PE Wax
Oxidized PE Wax
Others
Breakdown- By End User Industry, By
Value
Plastics & Elastomers
Paint & Coating,
Textile
Printing Ink
Others
Global Coverage Regional Coverage
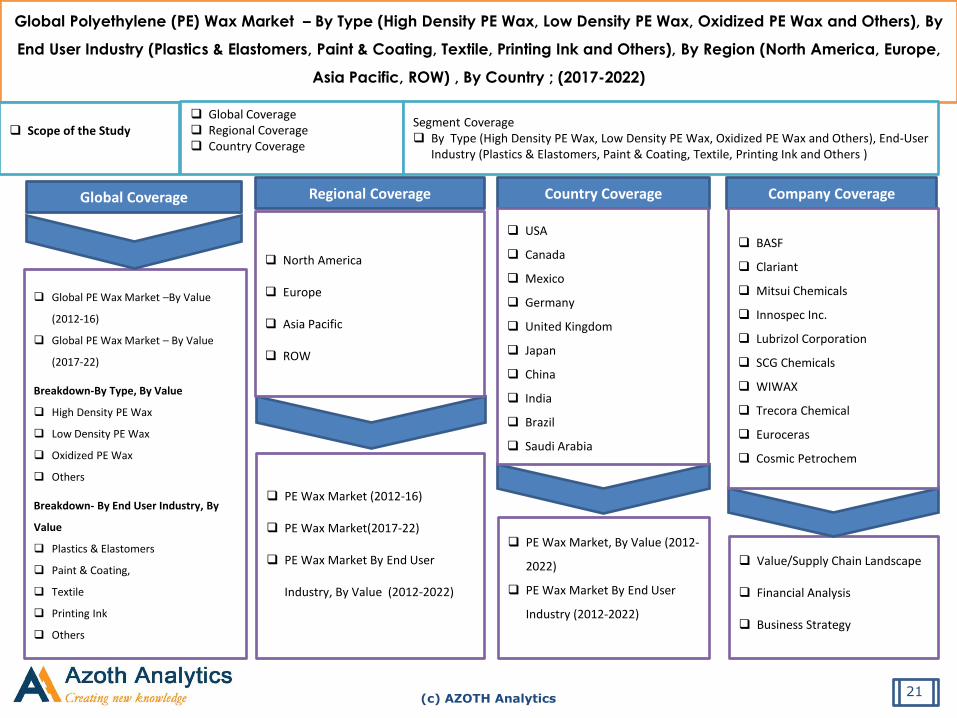
Global Polyethylene (PE) Wax Market – By Type (High Density PE Wax, Low Density PE Wax, Oxidized PE Wax and Others), By
End User Industry (Plastics & Elastomers, Paint & Coating, Textile, Printing Ink and Others), By Region (North America, Europe,
Asia Pacific, ROW) , By Country ; (2017-2022)
PE Wax Market (2012-16)
PE Wax Market(2017-22)
PE Wax Market By End User
Industry, By Value (2012-2022)
North America
Europe
Asia Pacific
ROW
Country Coverage
PE Wax Market, By Value (2012-
2022)
PE Wax Market By End User
Industry (2012-2022)
USA
Canada
Mexico
Germany
United Kingdom
Japan
China
India
Brazil
Saudi Arabia
Company Coverage
Value/Supply Chain Landscape
Financial Analysis
Business Strategy
BASF
Clariant
Mitsui Chemicals
Innospec Inc.
Lubrizol Corporation
SCG Chemicals
WIWAX
Trecora Chemical
Euroceras
Cosmic Petrochem
Global Coverage Regional Coverage Country Coverage
Scope of the Study
Segment Coverage By Type (High Density PE Wax, Low Density PE Wax, Oxidized PE Wax and Others), End-User
Industry (Plastics & Elastomers, Paint & Coating, Textile, Printing Ink and Others )
21

(c) AZOTH Analytics
Research Methodology
Research Definition
• The Global Polyethylene (PE) Wax Market Report comprises of the study of various aspects of Polyethylene Wax
Market and forecast until 2022. Global Polyethylene Wax Market has been segmented on basis of Type (High
Density PE Wax, Low Density PE Wax, Oxidized PE Wax and Others), By End User Industry (Plastics &
Elastomers, Paint & Coating, Textile, Printing Ink and Others ), By Region (North America, Europe, APAC, ROW)
and By Country (U.S., Canada, Mexico U.K., Germany, China, India, Japan, Indonesia, Brazil and Saudi Arabia)
Data Analysis and Interpretation
• Our historic market trend has been figured out by various paid databases which was further triangulated with
inputs and insights from industry experts, companies and stakeholders, through primary research
(manufacturers, marketing managers, others). Back-of-the-Envelope calculation for the market estimation has
been made through proper understanding of the market as well as future business strategies of the companies
operating in the market.
Azoth Analytics has conducted quantitative as well as qualitative research to gather market insights such as market sizing, market
segmentation, recent trends and developments and competitive landscape. Our team has conducted extensive primary surveys by
reaching out industry experts across the value chain of the Polyethylene Wax market.
For Forecasting purpose we have accessed some of the paid databases such as Bloomberg, Reuters, Factiva, Hoovers etc.
Companies Contacted: BASF (India)
22

(c) AZOTH Analytics
Product Overview
Polyethylene Wax Consumption in Different End-User Industries
Paint & Coating Plastics Textile
Printing Ink Rubber Processing Paper & Packaging
23

(c) AZOTH Analytics
Global Polyethylene Wax Market
Source: Azoth Analytics Estimates
Xx
Xx
Xx
Xx
xx
Global polyethylene wax market experienced a steady growth during last five years, denoted by a CAGR of
3.31%, attaining a value of USD 510.70 million in 2016.
2012 2013 2014 2015 2016
Figure 1: Global Polyethylene Wax Market Size, By Value, 2012-2016 (USD Million)
CAGR 2012-2016
x%
24
(c) AZOTH Analytics
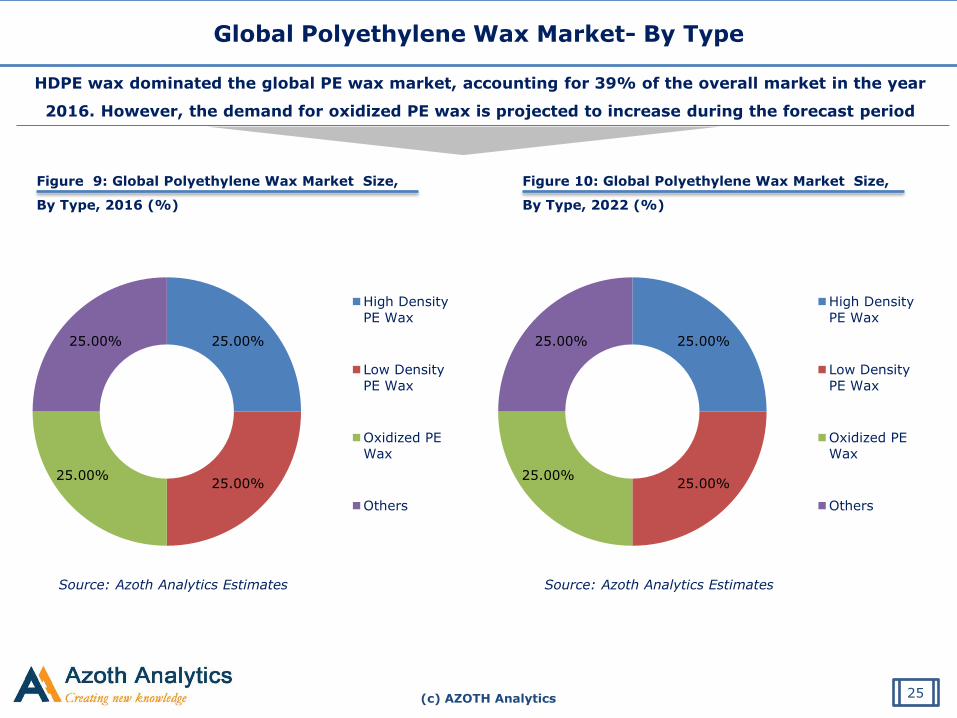
Global Polyethylene Wax Market- By Type
Figure 9: Global Polyethylene Wax Market Size,
By Type, 2016 (%)
HDPE wax dominated the global PE wax market, accounting for 39% of the overall market in the year
2016. However, the demand for oxidized PE wax is projected to increase during the forecast period
Source: Azoth Analytics Estimates
25
25.00%
25.00% 25.00%
25.00%
High Density
PE Wax
Low DensityPE Wax
Oxidized PE
Wax
Others
Figure 10: Global Polyethylene Wax Market Size,
By Type, 2022 (%)
Source: Azoth Analytics Estimates
25.00%
25.00% 25.00%
25.00%
High Density
PE Wax
Low DensityPE Wax
Oxidized PE
Wax
Others

(c) AZOTH Analytics
Global High Density Polyethylene Wax Market, By Value
Xx
Xx
Xx
Xx
xx
2012 2013 2014 2015 2016 2017 2018 2019 2020 2021 2022
Source: Azoth Analytics Estimates
CAGR 2017-2022
xx%
Figure 12: Global High Density Polyethylene Wax Market
Size, By Value, Forecast, 2017-2022 (USD Million)
Figure 11: Global High Density Polyethylene Wax
Market Size, By Value, 2012-2016 (USD Million)
CAGR 2012-2016
x%
26

(c) AZOTH Analytics
Global Polyethylene Wax Market- By Region
Figure 38: Global Polyethylene Wax Market Size,
By Region, 2016 (%)
Source: Azoth Analytics Estimates
xx
xx
xx
Key Drivers
20.00%
20.00% 20.00%
20.00%
North
America
Europe
Asia Pacific
ROW
27
(c) AZOTH Analytics
North America Polyethylene Wax Market, By Value
Source: Azoth Analytics Estimates
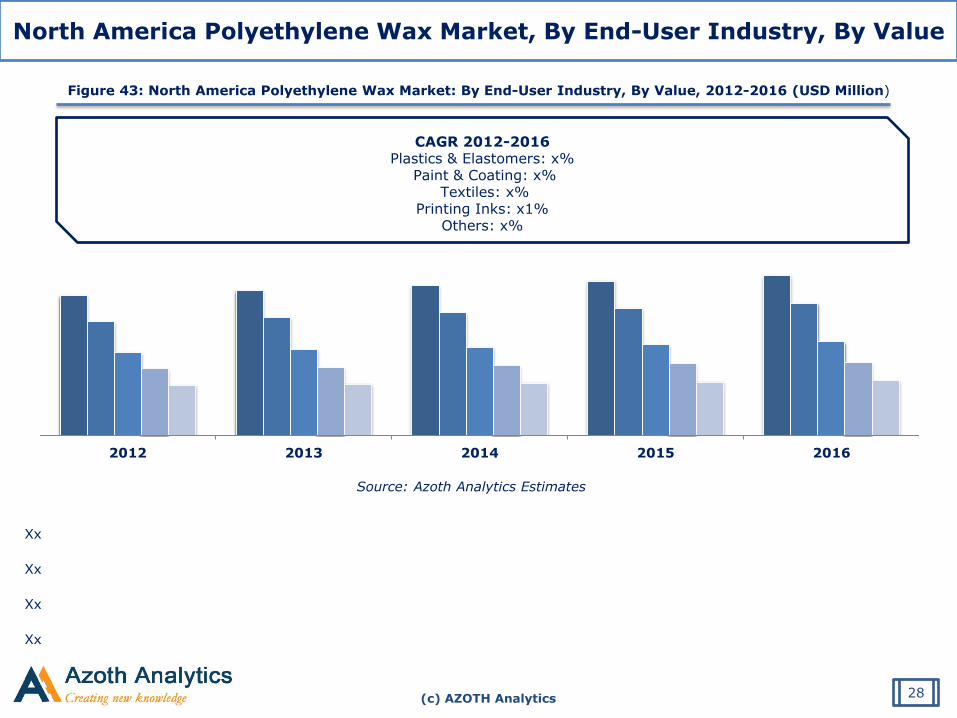
North America Polyethylene Wax Market, By End-User Industry, By Value
Figure 43: North America Polyethylene Wax Market: By End-User Industry, By Value, 2012-2016 (USD Million)
CAGR 2012-2016 Plastics & Elastomers: x%
Paint & Coating: x% Textiles: x%
Printing Inks: x1% Others: x%
2012 2013 2014 2015 2016
Xx
Xx
Xx
Xx
28

(c) AZOTH Analytics
North America Polyethylene Wax Market, By Value
Source: Azoth Analytics Estimates
U.S. Polyethylene Wax Market, By End-User Industry, By Value
Figure 49: U.S. Polyethylene Wax Market: By End-User Industry, By Value, 2012-2022 (USD Million)
CAGR 2012-2016
Plastics & Elastomers: x%, Paint & Coating: x%, Textiles:
x%, Printing Inks: x%, Others: x%
2012 2013 2014 2015 2016 2017 2018 2019 2020 2021 2022
2012 2013 2014 2015 2016 2017 2018 2019 2020 2021 2022
Plastics & Elastomers
Paint & Coating
Textiles
Printing Ink
Others
CAGR 2017-2022
Plastics & Elastomers: x%, Paint & Coating: x%, Textiles:
x%, Printing Inks: x%, Others: x%
29

(c) AZOTH Analytics
About Azoth Analytics Pvt Ltd.
Azoth Analytics creates in-depth research reports by recording, interpreting and analyzing information through primary and secondary
research. Our strategic market sizing and data dredging techniques include secondary research, interviews with key market players and
industry experts and use of industry specific statistical tools which helps in designing and planning effective research for our global and
local clients. We provide customized market research reports revealing the hidden truths on different verticals like pharmaceutical, oil and
gas, retail, telecommunications, real estate, logistics, energy, healthcare, technology, FMCG, food & beverages and media sectors .
Related Reports:
1. Global Chemical Catalyst Market: Trends, Opportunities and Forecasts (2017-2022)
(By Type: Homogeneous, Heterogeneous, Enzymatic; By Raw Material: Zeolites, Metals, Chemical Compound; By Application:
Environmental Air De-polluting Catalyst, Refinery Catalyst, Polymer Catalyst and Chemical Process Catalyst; By Region: N. America, S.
America, Middle-East & Africa, Europe and APAC
2. Global Carbon Blacks Market: Trends, Opportunities and Forecasts (2017-2022)
(By Type (Commodity Carbon Black and Specialty Carbon Black); By Process (Furnace, Thermal, Acetylene and Lampblack); By
Application (Tire and Industrial Rubber Products, Plastics and Textiles, Paints and Coatings, Toner and Printing Ink); By Region-APAC,
North America, Europe, RoW)
Disclaimer: Azoth Analytics report information is based mainly on interviews and therefore, is subject to fluctuation. Azoth Analytics
therefore, takes no responsibility for any incorrect information supplied to us by industry experts, manufacturers or users. Azoth does
not warranty the completeness of the information and data. Also, analysis provided in the report are meant for customers’ internal use
only and not for general publication or disclosure to third parties.
30


