

Globalization of Science & Technology: Impacts on and Lessons Learned
from the Semiconductor Industry
Celia Merzbacher
VP for Innovative Partnerships
Semiconductor Research Corporation
GSTOC Committee National Academies February 13, 2013

U.S. semiconductor companies: Provide 250,000 direct US jobs; more than one
million more that are indirect
Made $153 billion in sales in 2011; over half the worldwide market
Enable America’s $1.1 trillion electronics industry
Are one of the largest US exporters
SIA members represent 80% of US semiconductor production.

Moore’s Law: # transistors/chip doubles every 24 months
3

4
80Gb cost $9,000,000 !!!
in 1982 dollars
1982: Best available storage technology was the IBM 3350
iPod(5G)
80GB
2012
126 IBM 3350’s =
storage in
1 iPod
80Gb cost <$100
in 2012 dollars
Each unit:
635 MB
$70,000
Moore’s Law Enable Unforeseen Applications

In 1982… Aug 17—the first compact disc goes on sale
5
Oct 1—Sony launches the first compact disc player

In 1982…
Time magazine’s Man of the Year was…
6
The Computer
7
But in 1982 the U.S. semiconductor industry saw threats on the horizon.

US semiconductor market share was dropping…
Federal funding for academic research on silicon was declining…
The pipeline of talent was drying up.
Semiconductor Market Share
0 %
20 %
40 %
60 %
80 %
1975
1976
1977
1978
1979
1980
1981
1982
1983
US
Japan

In 1982…
9 Robert Noyce Jack Kilby Erich Bloch
The Semiconductor Research Corporation (SRC) was launched with the support of visionary industry leaders.
Objectives:
Define relevant research directions
Explore potentially important new technologies
Generate a pool of experienced faculty &
relevantly educated students

Essential SRC Features Industry-driven (originally US), consensus-based goals embodied
in:
• Moore’s Law
• ITRS (International Technology Roadmap for Semiconductors)
Focus on pre-competitive university research (>5 yr time horizon)
Members have rights to resulting IP
Involves the current industry experts (provide input/ feedback/ oversight, mentoring, and tech transfer)
Managed by an independent entity (facilitates interactions among members and with universities & government agencies)
Nimble and adaptable (does not fund “bricks & mortar”; ~1/3 of projects turn over annually)
Accountable; value-driven; efficient; effective
Attracts world-class researchers (faculty & students) 10

Semiconductor Research Corporation
A Family of Distinct, Related Program Entities
Updated January 2013
Each entity has a distinct set of member companies and Government partners. For more information go to www.src.org
Global
Research
Collaboration
Ensuring vitality
of current
industry
Focus Center Research
Program Phase VI
STARnet
Early research engagement of
key long horizon semiconductor
challenges
Energy
Research
Initiative
Emphasis on
efficient/clean
energy generation, storage and
distribution
Education
Alliance
Attracting and
educating the
next generation
of innovators
and technology
leaders
Nanoelectronics
Research
Initiative
Beyond CMOS –
the next switch
and associated
architectures

SRC created an industry-guided global university research ecosystem
Since 1982… Over $1.6B invested by SRC participants
10,000+ students
2,000+ faculty members
250+ universities worldwide
1500 students
500 faculty
120 universities worldwide
In 2012…
20X increase over 1982
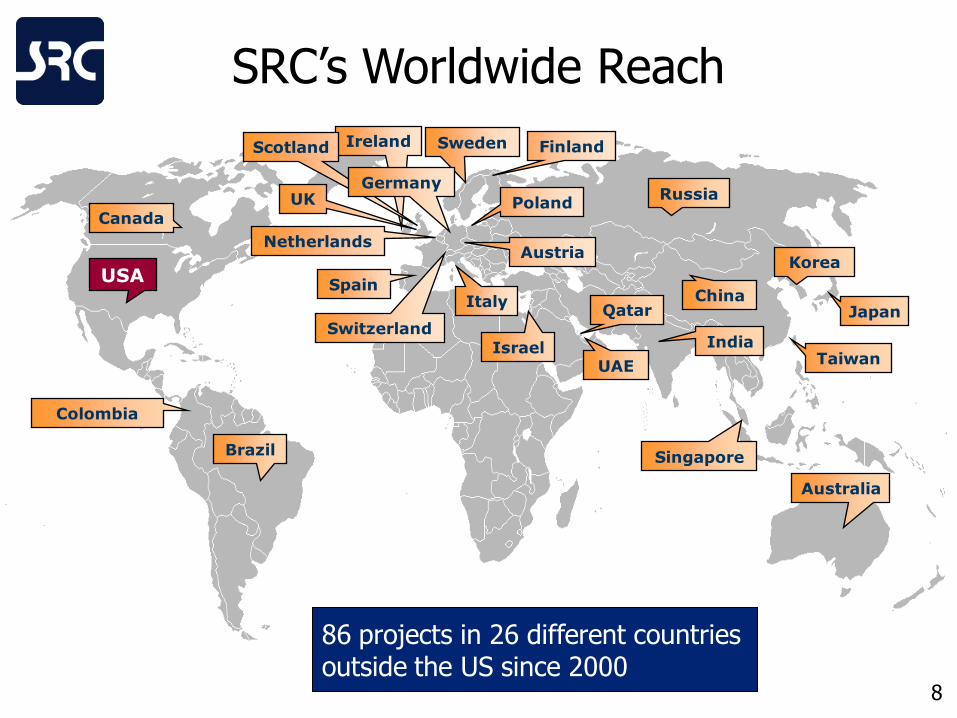
SRC’s Worldwide Reach
USA
Canada
Sweden
Japan
Netherlands
India
Poland
China
Singapore
Italy Qatar
Taiwan Israel
Switzerland
Colombia
Finland
Russia
Austria
Spain
Australia
Brazil
86 projects in 26 different countries outside the US since 2000
Ireland
Korea
UAE
Scotland
UK Germany
8
304 343 341 291 180
1247
1626
2430
0
1,000
2,000
3,000
1981 1991 2001 2009
No. of Publications
SRC Member Companies
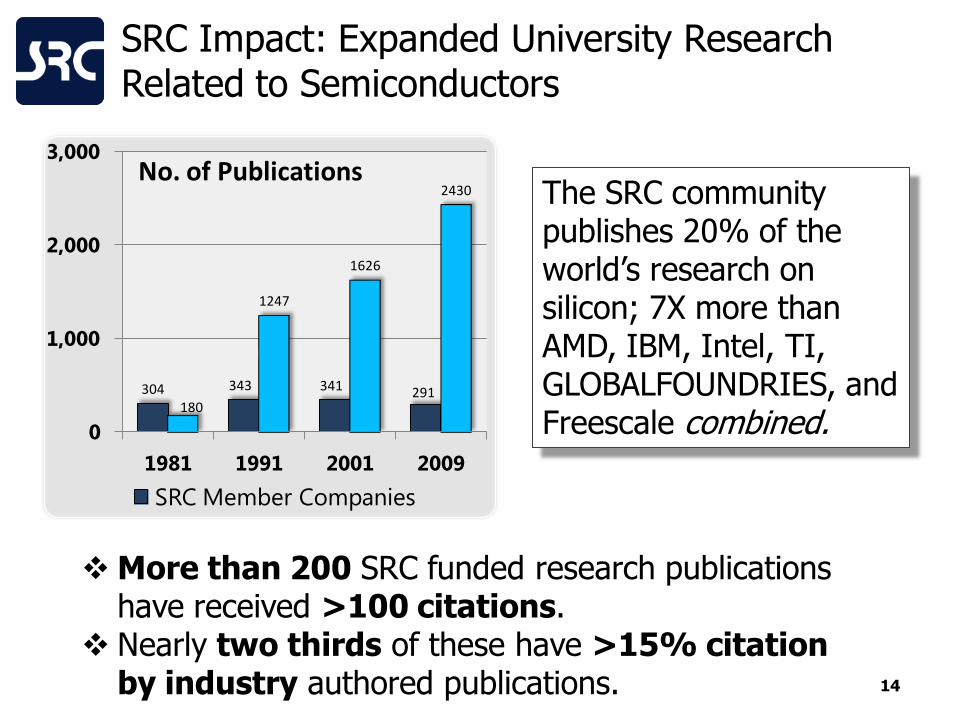
SRC Impact: Expanded University Research Related to Semiconductors
14
The SRC community publishes 20% of the world’s research on silicon; 7X more than AMD, IBM, Intel, TI, GLOBALFOUNDRIES, and Freescale combined.
More than 200 SRC funded research publications have received >100 citations.
Nearly two thirds of these have >15% citation by industry authored publications.

1
15
7 Liaisons 8 SRC Graduated Students
4 TAB Advisors December 2010 54.5% SRC Participants

16
SRC Graduates Stay in the Field
Information reflects over 4200 graduates with known first hire data

17
SRC Creates Value Through Partnerships: Leveraging Strengths of Each Sector
• Maximizes technological progress
• Leverages investments
• Utilizes the strengths of each sector
• Expands and replenishes the professional community
Tactical Perspective,
“Can-Do” Attitude,
FUNDING
Industry
Strategic Perspective,
National Needs,
Credibility, FUNDING
Government Universities
Creativity,
Faculty Expertise,
Student Resources

18
SRC is a Win-Win-Win-Win
Benefits to academic researchers
• Insight on industry needs; opportunity to address “real world”, albeit long-term problems
• Input and feedback from industry at periodic reviews and via Liaisons
• E-seminars and e-workshops facilitate near real-time sharing of research results and tech transfer
• Interactions and opportunities for personnel exchanges among universities and industry

19
SRC is a Win-Win-Win-Win
Benefits to students
• Understand the motivation for the research is based on real world problems
• Industry liaisons & mentors engage with students
• Participation in TECHCON, SRC’s annual technical conference at which students present research and network with industry representatives.
• Opportunities for student internships, co-ops and employment at SRC member companies.

20
SRC is a Win-Win-Win-Win
Benefits to Government
• Managers get insight on industry needs
• Facilitates technology transfer
• Leverages research investment (various mechanisms used)
• Consortium provides broad industry engagement
Benefits to industry
• Leveraged research investment
• Early access to research
• Access to students
• Interaction with competitors/customers/suppliers

Consortia Support Competitiveness
Semiconductor Industry Market Share
0%
20%
40%
60%
1980 1985 1990 1995 2000 2005Source: SIA
US
ROW
Japan
Federal funding for SEMATECH
ended
20
GLOBALIZATION

Globalization…
External factors
• Location of customers/markets
• Location of universities/skilled workforce
• Location of supply chain components
Internal decisions
• Location of manufacturing
• Location of design
• Location of R&D
22

23
Global Consumer Electronics Revenue (2008)

24
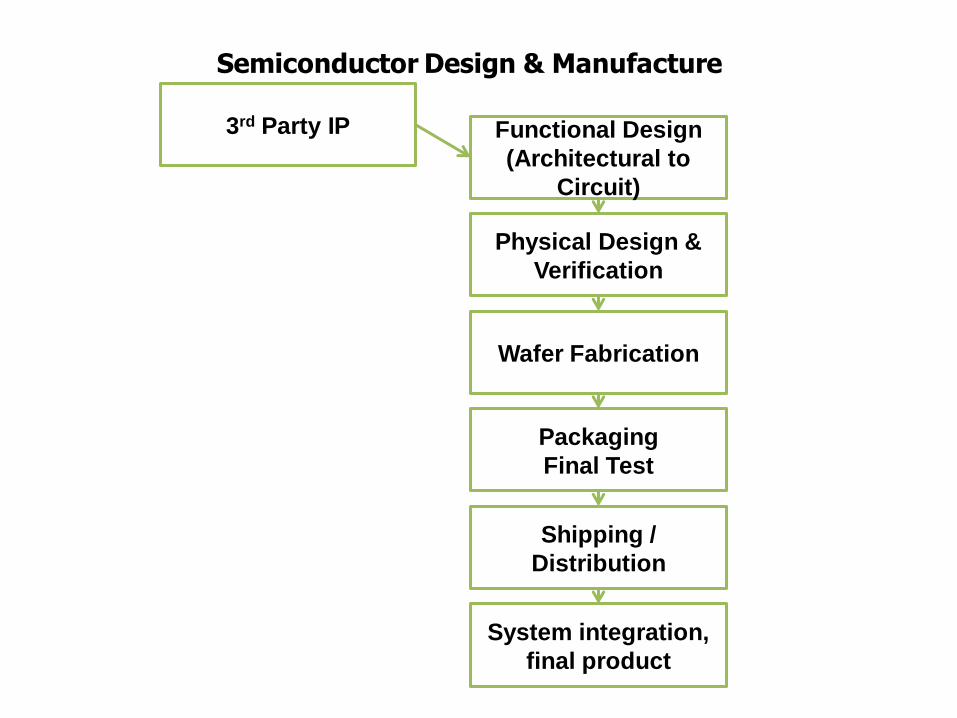
3rd Party IP Functional Design
(Architectural to
Circuit)
Physical Design &
Verification
Wafer Fabrication
Packaging
Final Test
Shipping /
Distribution
System integration,
final product
Semiconductor Design & Manufacture

26
Semiconductor Production is a Global Process
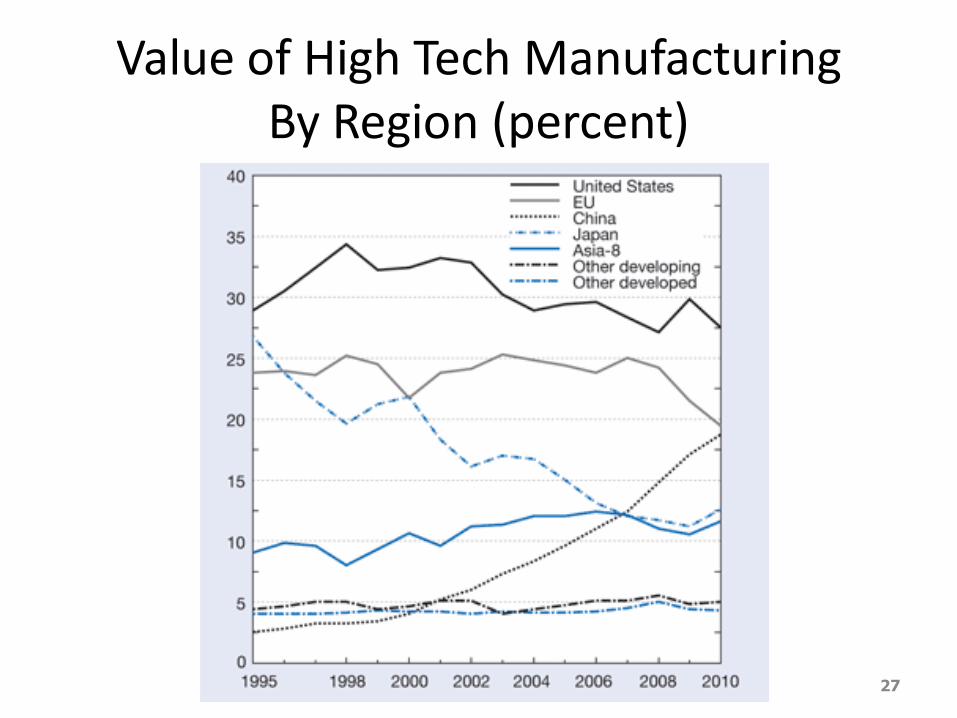
Value of High Tech Manufacturing By Region (percent)
27

Global S&T Workforce Education: China R&D and Education are Growing Faster
28 Source: NSF, S&E Indicators (2010) Source: NSF, S&E Indicators (2012)
China China

Globalization of Semiconductor Research: 2012 Winners of IEEE ICCAD Design Contest
Challenge #1
• 1st : Xing Wei, Yi Diao & Tak-Kei Lam – The Chinese University of Hong Kong
• 2nd : Kuang-Hung Chang, Hui-Ling Ting & Hui-Min Yang – National Tsing Hua University
• 3rd : Ling-Ya Ni, Chien-Yu Lai, Kuan-Chang Wang & Chen-Kai Chu – National Taiwan University
Challenge #2
• 1st : Myung-Chul Kim & Jin Hu – University of Michigan
• 2nd : Xu He, Tao Huang, Wing-Kai Chow & Ka-Chun Lam –The Chinese University of Hong Kong
• 3rd : Yi-Fang Chen and Chau-Chin Huang – National Taiwan University
Challenge #3
• 1st : Geng-He Lin & Yen-Ting Yu – National Chiao Tung University
• 2nd : Bei Yu & Jhih-Rong Gao –The University of Texas at Austin
• 3rd : Chi-Yuan Liu, Sheng-Yen Chen & Iou-Jen Liu – National Taiwan University 29
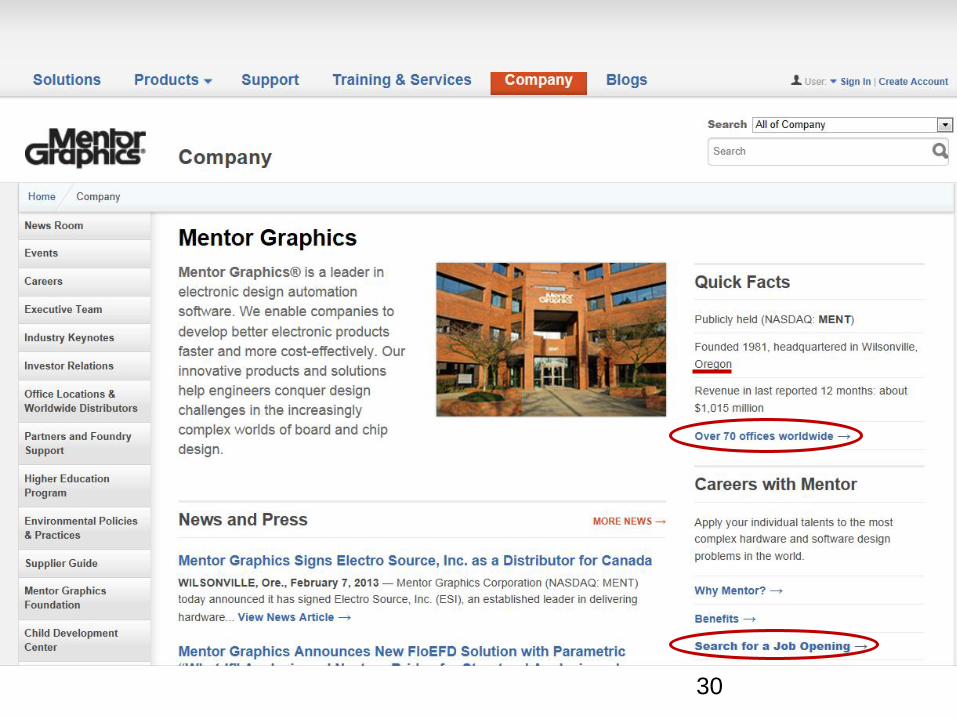
30

31

32

33

Globalization of Semiconductors and Research
Individual companies have international corporate research activities (e.g. Intel, IBM)
SEMATECH added international subsidiary in 1995
ITRS became international in 1998
SRC became global in 2000
Non-US R&D centers
34

Globalization of SRC Research: Looking Ahead
• SRC helps members to build capacity worldwide
• Developing an academic center of excellence in Abu Dhabi in partnership with ATIC and GLOBALFOUNDRIES
• Approached by Skolkovo Institute of Science and Technology
SRC manages world-class research that addresses members/partners needs.
35

Other Trends in S&T Globalization Impacting DoD and US Competitiveness
• MOOC’s
• Wireless/mobile + cloud-based services
• Advances that lower barriers to entry
– E.g., additive manufacturing
36

Some thoughts on how to maintain DoD S&T competitiveness
• Invest in people; encourage participation and leadership in professional organizations
• Provide opportunities for interaction among DoD S&E’s, academia, and industry—worldwide
– A Liaison program for DoD S&E’s to interact with DoD supported students and researchers
– On-line communities for sharing research info
37

Characteristics of a Strategy* Desirable characteristic Brief description
Purpose, scope, and methodology
Addresses why the strategy was produced, the scope of its coverage, and the process by which it was developed.
Problem definition and risk assessment
Addresses the particular national problems and threats the strategy is directed toward.
Goals, subordinate objectives, activities, and performance measures
Addresses what the strategy is trying to achieve; steps to achieve those results; as well as the priorities, milestones, and performance measures to gauge results.
Resources, investments, and risk management
Addresses what the strategy will cost, the sources and types of resources and investments needed, and where resources and investments should be targeted by balancing risk reductions and costs.
Organizational roles, responsibilities, and coordination
Addresses who will be implementing the strategy, what their roles will be compared to others, and mechanisms for them to coordinate their efforts.
Integration and implementation
Addresses how a national strategy relates to other strategies’ goals, objectives, and activities—and to subordinate levels of government and their plans to implement the strategy.
38 * Government Accounting Office. 2012. NANOTECHNOLOGY: Improved Performance Information Needed for Environmental, Health, and Safety Research. Available at http://www.gao.gov/assets/600/591007.pdf.
39
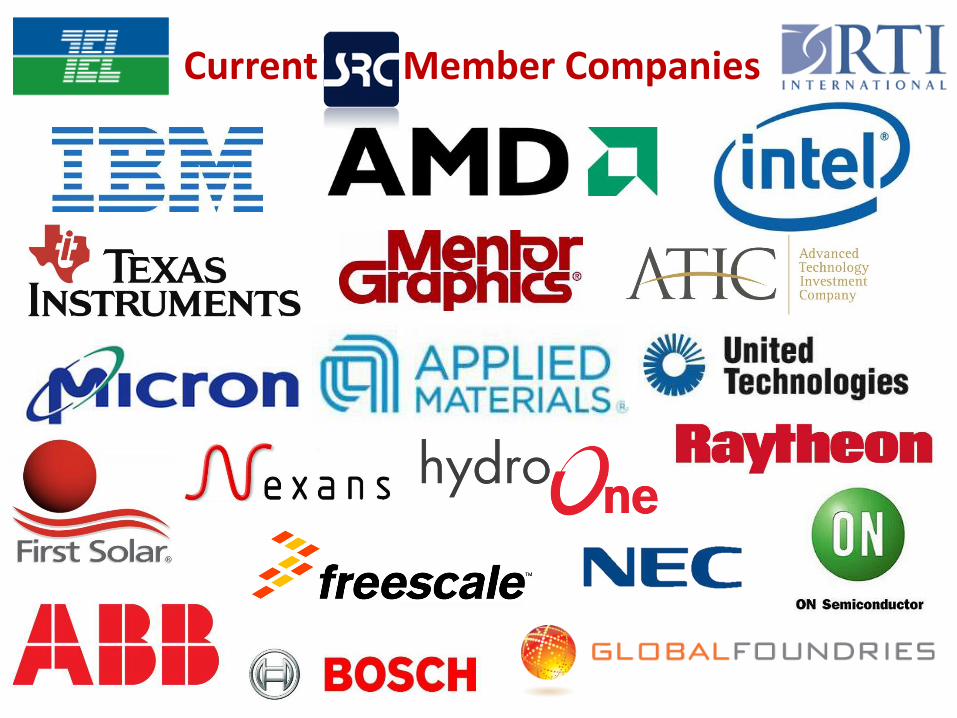
Current SRC Member Companies

40

Criteria for Successful Roadmapping*
1. Restricted scope and figures of merit
2. Consensus on trends/targets (e.g. Moore’s Law)
3. Sufficient market assuring wide acceptance
4. Willingness to share information
5. Existence of a community of participants
41 * For details see SEMATECH White Paper “More than Moore”.

Identify the key problem(s)
Agree upon the vision and mission
Get leadership support, including resources, from a critical mass of companies
Create a roadmap
Agree upon (minimum) IP rights
Addressing long-term challenges together is easier.
Lessons for Creating a Successful Consortium
42

Sources: WSTS/ Gartner/Canalys/IDC/DisplaySearch Note: Military is <1% and is included in Industrial.
Semiconductor Demand Drivers: 2011 Growth
PC/Computer 38%
Consumer 16%
Automotive 9%
Communications 26%
Smartphone Shipments
+63% (units)
Smartphone shipments overtook PC shipments in 2011
PC Shipments +0.5% (Units)
Consumer shift away from traditional concept storage devices
Industrial/Gov't11%
2011 Total Global Semiconductor Market
$300B LCD TV +7% (Units) 10% of LCD TV panels were 3D Capable in 2011
Tablets +254% (Units)
2010: 19.4M Units 2011: 68.7M Units
Percent of Semiconductor $ Demand

Management by an independent third party facilitates interactions among members and with universities and government agencies.
Allow everyone to have a voice.
Provide value.
It helps if industry organizes itself and then partners with government.
Be patient.
44
Lessons for Creating a Successful Consortium

Est. Research
Start Research/Influential Article Researchers
# of citations Commercial Application
Total By
Industry Technology Year
Company Products
1984 “BSIM - Berkeley Short-Channel IGFET Model for MOS-Transistors”, IEEE J. S-State Cir 22 (1987) 558
Sheu et al UC/Berkeley
200 55 (28%) Compact Modeling
Tools; Formal Verification Tools; Logic Synthesis
Tools; Simulation
Tools
1992
Synopsis;
Cadence
1983 “Graph-based algorithms for Boolean function manipulation”, IEEE Trans on Comput 35 (1986) 677
Bryant CMU
1754 321 (18%)
1987 “Asymptotic wave-form evaluation for timing analysis”, IEEE Trans Computer-Aided Design 9 (1990) 352
Pillage and Rohrer UT/Austin & CMU
762 206 (27%)
1990 “Threshold voltage model for deep-submicrometer MOSFET’s”, IEEE Trans Electron Dev 40 (1993) 86
Liu, Hu et al. UC/Berkeley
209 73 (35%)
1994 “Multilevel interconnections for ULSI and GSI era”, Mat Sci & Engn R-Reports 19 (1997) 87
Murarka, RPI
258 54 (21%)
Cu, low-K, &multilevel
interconnects 2000
IBM; TI; Freescale;
Connexant; LSI; Flip-Chip Tech
1998 “The future of wires”, Proc IEEE 89 (2001) 490 Ho, Mai et al. Stanford U
429 89 (21%)
2000 “Recent advances on electromigration in very-large-scale-integration of interconnects”, JAP 94 (2003) 5451
Tu, UCLA
369 99 (27%)
1986 “Point-Defects and Dopant Diffusion in Silicon”, Rev Mod Phys 61 (1989) 289
Fahey, Plummer Stanford U
847 261 (31%) Sub-100 nm MPU and Flash
2001
Intel; AMD; GF; Freescale;
TI; NORTEL; IBM; Digital EquIp. Corp
1994 “Making silicon nitride film a viable gate dielectric”, IEEE Trans on Electron Dev 45 (1998) 680
Ma, Yale U
220 56 (25%)
2000 “Tin-lead (SnPb) solder reaction in flip chip technology”, Mat Sci &Engn R-Reports 34 (2001) 1
Tu, Zeng, UCLA
293 45 (15%) Flip chip ‘Green’ (lead-
free) IC products
2005
IBM; Connexant; TI; Flip Chip Tech;
Intel; Freescale
2000 “Six cases of reliability study of Pb-free solder joints in electronic packaging technology”, Mat Sci & Engn R-Reports 38 (2002) 55
Zeng, Tu UCLA
578 99 (17%)
45
Technology Transfer Indicators
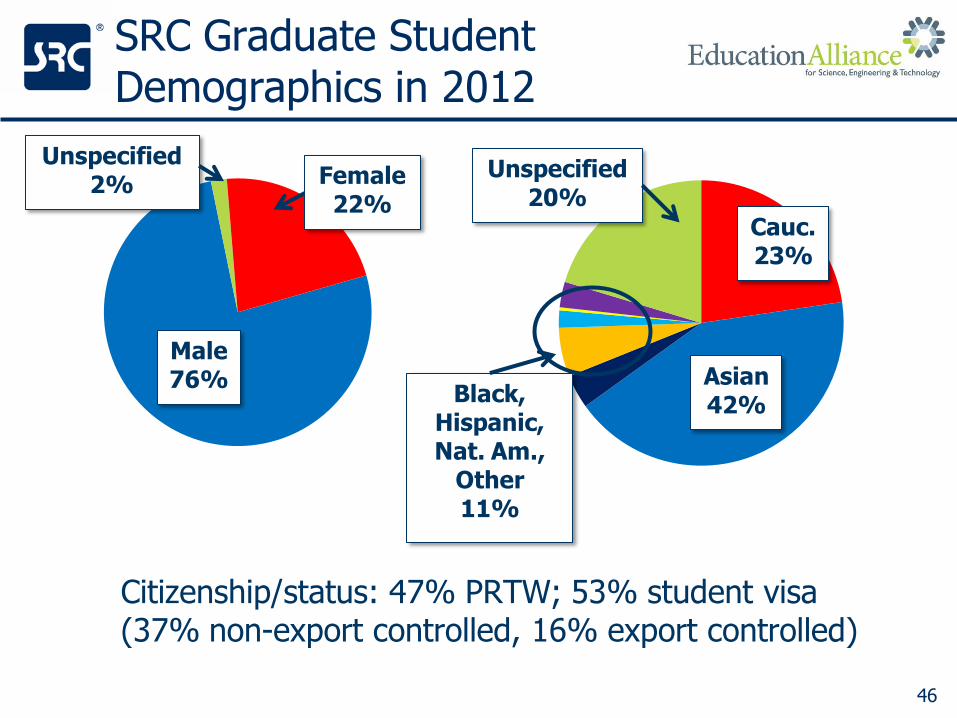
SRC Graduate Student Demographics in 2012
Citizenship/status: 47% PRTW; 53% student visa (37% non-export controlled, 16% export controlled)
46
Female 22%
Male 76%
Unspecified 2%
Cauc. 23%
Asian 42%
Unspecified 20%
Black, Hispanic, Nat. Am.,
Other 11%

SRC Undergraduate Students 2009-2013 Demographics
597 undergraduates at 14 universities
41% Female and 59% Male undergraduates
3.5 Average GPA
97% Retained in STEM
47% progress to graduate school and increasing
305 Faculty involved with undergraduate research 47
Caucasian 34%
Asian 19%
Hispanic 16%
African American
13%
Other 4%
Unspecified 14%


