
(Results-Framework Document)for
R F D
Department of Agriculture and Cooperation
(2013-2014)
Government of India
06/01/2014 11.45 AMGenerated on

Section 1:Vision, Mission, Objectives and Functions
Results-Framework Document (RFD) for Department of Agriculture and Cooperation-(2013-2014)
To enhance productivity and production of agricultural commodities to ensure the food nutritional and livelihood securityof the nation and also to make agriculture a sustainable and viable vocation for livelihood support by 2020.
Mission
To achieve 4 percent growth rate for agriculture sector during the 12th Plan, with the help of various State Governments
and other Departments concerned in the Government of India by enhancing agriculture production & productivity and
improving income level of all farmers by successful implementation of various new initiatives and agriculture
missions/schemes such as National Food Security Mission, National Horticulture Mission, National Mission on Oil Seeds
and Oil Palm, National Mission for Sustainable Agriculture, and National Mission on Agricultural Extension & Technology,
Integrated Scheme for Farmers Income Security, Integrated Scheme on Agriculture Marketing, etc. to thus ensure food,
nutritional and livelihood security.
Objectives
1 Increasing Crop production and Productivity thereby ensuring food security and enhanced income level to farmers
2 Incentivizing states to enhance public investment in Agriculture & allied sectors to sustain and maintain capital formation and agriculture
infrastructure
3 Diversification in Agriculture for increased income generation
4 Ensuring supply of agricultural inputs for enhanced production and productivity
5 Facilitate Plant Protection, Quarantine and Residue Management
6 Dissemination of technology / information to farmers
7 Enhancing Soil health and promotion of resource conservation technology for sustainable agriculture
8 Improving credit flow, market infrastructure, and risk mitigation
9 Maintaining Agricultural statistics to aid policy development
10 Drought Preparedness and Grant of relief under State Disaster Response Fund (SDRF) /National Disaster Response Fund (NDRF)
11 Encouraging private investment in Agriculture through PPP mode
Functions
Endeavoring to ensure adequate and timely supply of inputs and services such as agricultural credit, fertilizers, pesticides, seeds and
implements to farmers.
1
Vision
06/01/2014 11.45 AMGenerated on
Page : 2 of 39

Section 1:Vision, Mission, Objectives and Functions
Results-Framework Document (RFD) for Department of Agriculture and Cooperation-(2013-2014)
Administering the National Agriculture Insurance Scheme (NAIS) and other Crop insurance schemes to provide relief to farmers in the
event of crop failure.
2
Laying down Minimum Support Prices (MSPs) for select key agricultural commodities to ensure food security and remunerative prices for
farmers.
3
Developing suitable strategies for rainfed fariming through people's participation for a holistic and integrated development of potential
watersheds, and promotion of a farming system approach for augmenting the income and nutritional level of farming Communities.
4
Assisting the States in the management of drought and undertaking scarcity relief measures.5
Endeavoring to bring about the integrated development of markets for agricultural produce to safeguard the economic interests of the
farming community.
6
Assisting the State Governments to improve agricultural extension services by adopting new institutional arrangements through the
involvement of NGOs, farmers, organizations and agricultural universities.
7
Promoting plant protection measures and practices through dissemination of appropriate information and technology.8
Working towards promoting measures for production of quality seeds and distribution of improved plant varieties.9
Strengthening the cooperative movement through appropriate policy measures and also through organizations such as the National
Cooperative Development Cooperation (NCDC), National Agricultural Cooperative Marketing Federation of India Limited (NAFED) and
National Cooperative Union of India (NCUI).
10
Phyto – sanitary responsibilities, statutory and mandatory functions like international negotiations.11
06/01/2014 11.45 AMGenerated on
Page : 3 of 39
Section 2:Inter se Priorities among Key Objectives, Success indicators and Targets
Results-Framework Document (RFD) for Department of Agriculture and Cooperation -(2013-2014)
Objective Weight Action Unit
Target / Criteria Value
Weight
80%100% 70% 60%90%
Very Good Fair PoorExcellent GoodSuccessIndicator
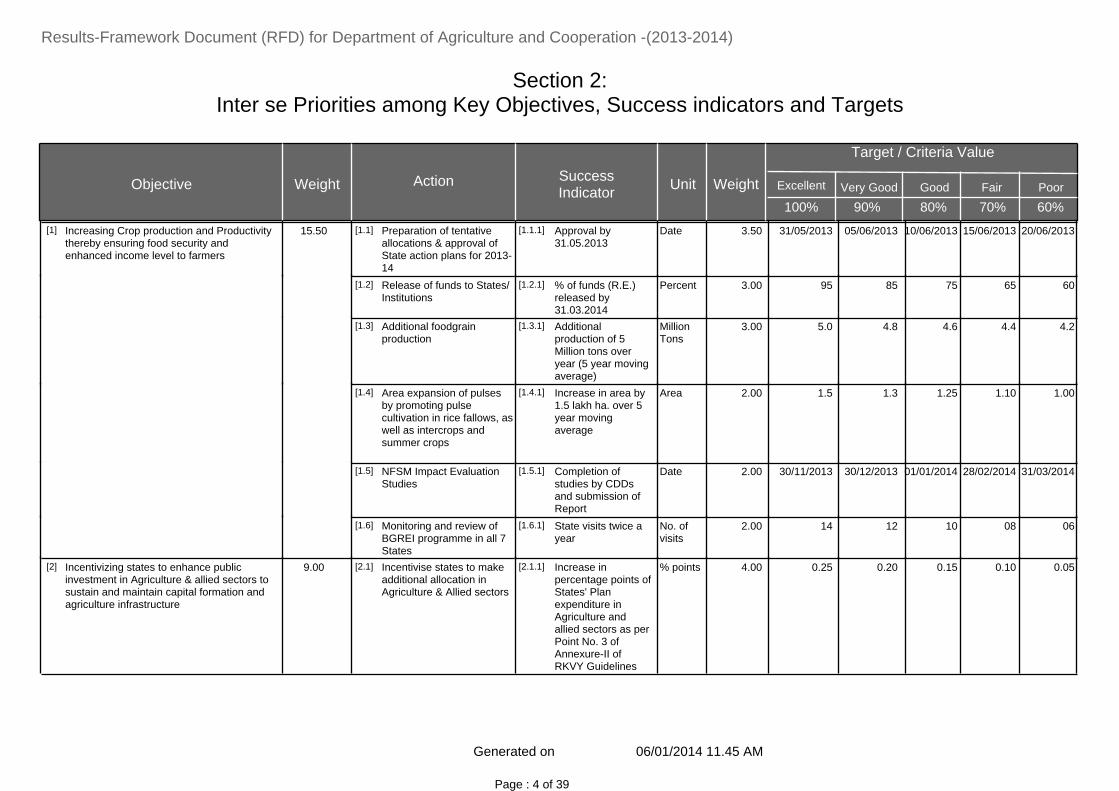
Increasing Crop production and Productivitythereby ensuring food security andenhanced income level to farmers
15.50 Preparation of tentativeallocations & approval ofState action plans for 2013-14
Approval by31.05.2013
Date 05/06/2013 15/06/2013 20/06/201310/06/201331/05/20133.50[1] [1.1] [1.1.1]
Release of funds to States/Institutions
% of funds (R.E.)released by31.03.2014
Percent 85 65 6075953.00[1.2] [1.2.1]
Additional foodgrainproduction
Additionalproduction of 5Million tons overyear (5 year movingaverage)
MillionTons
4.8 4.4 4.24.65.03.00[1.3] [1.3.1]
Area expansion of pulsesby promoting pulsecultivation in rice fallows, aswell as intercrops andsummer crops
Increase in area by1.5 lakh ha. over 5year movingaverage
Area 1.3 1.10 1.001.251.52.00[1.4] [1.4.1]
NFSM Impact EvaluationStudies
Completion ofstudies by CDDsand submission ofReport
Date 30/12/2013 28/02/2014 31/03/201401/01/201430/11/20132.00[1.5] [1.5.1]
Monitoring and review ofBGREI programme in all 7States
State visits twice ayear
No. ofvisits
12 08 0610142.00[1.6] [1.6.1]
Incentivizing states to enhance publicinvestment in Agriculture & allied sectors tosustain and maintain capital formation andagriculture infrastructure
9.00 Incentivise states to makeadditional allocation inAgriculture & Allied sectors
Increase inpercentage points ofStates' Planexpenditure inAgriculture andallied sectors as perPoint No. 3 ofAnnexure-II ofRKVY Guidelines
% points 0.20 0.10 0.050.150.254.00[2] [2.1] [2.1.1]
06/01/2014 11.45 AMGenerated on
Page : 4 of 39

Section 2:Inter se Priorities among Key Objectives, Success indicators and Targets
Results-Framework Document (RFD) for Department of Agriculture and Cooperation -(2013-2014)
Objective Weight Action Unit
Target / Criteria Value
Weight
80%100% 70% 60%90%
Very Good Fair PoorExcellent GoodSuccessIndicator
Release of Stream 1 funds Average value ofnumber of days forall States afterreceipt of SLSCmeeting minutes
Numberof Days
40 55 6050302.00[2.2] [2.2.1]
Monitoring performance ofStates
Performance ofStates reviewed byvisits to the Statesand throughensuring projectsdata entry in webbased RKVY MIS byStates
Numberof Visits
23 18 1620263.00[2.3] [2.3.1]
Diversification in Agriculture for increasedincome generation
13.00 Utilisation/Release of fundsallocated under ISOPOM
% of funds (R.E.)released by31.03.2014
Percent 80 65 6070900.50[3] [3.1] [3.1.1]
Enhancing production ofoilseeds for increasedavailability of edible oils
production of nine oilseeds
Lakhtones
300 280 2702903051.00[3.2] [3.2.1]
Monitoring and Evaluationof ISOPOM
Organize meetings /field visits
Number 23 19 1721251.00[3.3] [3.3.1]
Area expansion underhorticultural crops andrejuvenation of senilegardens
Additional areacovered
LakhHectares
1.75 1.36 1.171.561.952.00[3.4] [3.4.1]
Additional Horticulturalproduction
Additionalproduction of 3Million tons overyear (5 yearsmoving average)
MillionMetrictons
2.7 2.1 1.82.43.02.00[3.5] [3.5.1]
Establishment of nurseriesand their accreditation
Total number ofnurseriesestablished
Number 360 280 2403204001.00[3.6] [3.6.1]
06/01/2014 11.45 AMGenerated on
Page : 5 of 39

Section 2:Inter se Priorities among Key Objectives, Success indicators and Targets
Results-Framework Document (RFD) for Department of Agriculture and Cooperation -(2013-2014)
Objective Weight Action Unit
Target / Criteria Value
Weight
80%100% 70% 60%90%
Very Good Fair PoorExcellent GoodSuccessIndicator
Total number ofnurseries accredited
Number 72 56 4864801.00[3.6.2]
Sanction of projects forPHM / Market / Others
Number of projectssanctioned
Number 450 350 3004005001.00[3.7] [3.7.1]
Area to be covered underdrip irrigation
Area covered LakhHectares
3.25 2.7 2.233.451.50[3.8] [3.8.1]
Area expansion undersprinkler irrigation
Area covered LakhHectares
2.29 1.78 1.532.042.551.50[3.9] [3.9.1]
Monitoring and Evaluation Number of fieldVisits by the JointInspection Team
Number 18 14 1216200.50[3.10] [3.10.1]
Ensuring supply of agricultural inputs forenhanced production and productivity
8.00 Distribution of certified andquality seed
Quantity of Certifiedand quality seeddistributed
LakhQuintals
270 210 1802403003.00[4] [4.1] [4.1.1]
Organize trainingprogrammes for farmers,technicians, trainers,entrepreneurs,manufacturers and officialsfrom State Governments atFMTTIs
Number of personstrained
Number 5400 4200 3600480060002.50[4.2] [4.2.1]
Testing of tractors, powertillers, combine harvestersand other agriculturalmachines /implements forperformance evaluationand quality up-gradation atFMTTIs
Number of machinestested
Number 165 145 1351551752.50[4.3] [4.3.1]
06/01/2014 11.45 AMGenerated on
Page : 6 of 39

Section 2:Inter se Priorities among Key Objectives, Success indicators and Targets
Results-Framework Document (RFD) for Department of Agriculture and Cooperation -(2013-2014)
Objective Weight Action Unit
Target / Criteria Value
Weight
80%100% 70% 60%90%
Very Good Fair PoorExcellent GoodSuccessIndicator
Facilitate Plant Protection, Quarantine andResidue Management
7.50 Conducting regular pestsurveillance and monitoringto assess pest / diseasesituation and timely adviceof IPM measures
Area covered LakhHectares
8.07 6.28 5.387.188.972.00[5] [5.1] [5.1.1]
Popularising IPM approachunder Farmers Field School(FFS) on IPM
Number of FFSconducted
Number 693 539 4626167701.00[5.2] [5.2.1]
Monitor pesticide residuesin agricultural commoditiesand focus IPM efforts inidentified areas
% of samples testedagainst target
Percent 81 63 5472901.00[5.3] [5.3.1]
Computerization of PQStations
Issue of PSC/IP as% of onlineapplicationsreceived
Percent 85.5 66.5 57.076.095.02.00[5.4] [5.4.1]
Computerization of CentralInsecticides Board andRegistration Committee(CIB and RC)
Time taken forDisposal of onlineapplications ofregistration ofinsecticides underSection 9(4), 9(3)
Numberof Days
135 165 1801501201.50[5.5] [5.5.1]
Dissemination of technology / information tofarmers
9.00 Training of Farmers Number of farmerstrained throughATMA
LakhMandays
13.5 10.5 9.012.015.01.25[6] [6.1] [6.1.1]
Farmers’ trainingunder Farm Schools(Farmer to FarmerExtension)
No. ofFarmSchoolsorganised
12150 9450 810010800135001.00[6.1.2]
06/01/2014 11.45 AMGenerated on
Page : 7 of 39

Section 2:Inter se Priorities among Key Objectives, Success indicators and Targets
Results-Framework Document (RFD) for Department of Agriculture and Cooperation -(2013-2014)
Objective Weight Action Unit
Target / Criteria Value
Weight
80%100% 70% 60%90%
Very Good Fair PoorExcellent GoodSuccessIndicator
Evaluatin Study Number of Stateswhere evaluationstudy, includingquality of training, tobe conducted
Numberofreports
3 1 0240.25[6.2] [6.2.1]
Training of ExtensionPersonnel in PGDAEM byMANAGE (one year)
Training for one year No. ofsuccessfultrainees
1426 1109 951126815852.00[6.3] [6.3.1]
Training of AgricultureGraduates/ setting up ofagri-ventures
Training ofcandidates
No. oftrainees
3600 2800 2400320040001.00[6.4] [6.4.1]
Ventures set up bythe candidates
No. ofventuresset up
1377 1071 918122415301.00[6.4.2]
National e-GovernancePlan –Agriculture (NeGPA)
Launching of CentralAgriculture Portalsand StateAgriculture Portals
NumberofPortals
6 4 3572.50[6.5] [6.5.1]
Enhancing Soil health and promotion ofresource conservation technology forsustainable agriculture
4.00 Establishment andStrengthening of SoilTesting laboratories
Number of static /mobile labssanctioned andupgradationapproved
Number 40 30 2535502.50[7] [7.1] [7.1.1]
Quality control of OrganicManure, Bio-Fertilizers andfertilizers
Number of Samplestested
Number 7650 5950 5100680085001.50[7.2] [7.2.1]
Improving credit flow, market infrastructure,and risk mitigation
9.00 Flow of credit for agriculture Amount of creditflow as % of target
Percent 90 80 7585952.50[8] [8.1] [8.1.1]
Implementation of NAIS,MNAIS and WBCIS
Timely issuance ofAdministrative
Date 07/04/2013 22/04/2013 30/04/201315/04/201301/04/20132.50[8.2] [8.2.1]
06/01/2014 11.45 AMGenerated on
Page : 8 of 39

Section 2:Inter se Priorities among Key Objectives, Success indicators and Targets
Results-Framework Document (RFD) for Department of Agriculture and Cooperation -(2013-2014)
Objective Weight Action Unit
Target / Criteria Value
Weight
80%100% 70% 60%90%
Very Good Fair PoorExcellent GoodSuccessIndicator
during 2013-14 approval of schemes
Construction & Renovationof Rural Godowns (RuralGodown Scheme)
Capacity created Lakh MT 36 24 2030402.50[8.3] [8.3.1]
Implementation of AMIGSscheme
Projects cleared Number 370 300 2503404001.50[8.4] [8.4.1]
Maintaining Agricultural statistics to aidpolicy development
5.00 Preparation of 3rd AdvanceEstimates of foodgrainproduction for anagricultural year
Timely Completion Date 15/05/2013 14/06/2013 29/06/201330/05/201330/04/20131.00[9] [9.1] [9.1.1]
Preparation of 4th AdvanceEstimates of foodgrainproduction for anagricultural year
Timely Completion Date 05/08/2013 04/09/2013 19/09/201320/08/201320/07/20131.00[9.2] [9.2.1]
Preparation of 1st AdvanceEstimates of foodgrainproduction for anagricultural year
Timely Completion Date 15/10/2013 14/11/2013 29/11/201330/10/201330/09/20131.00[9.3] [9.3.1]
Preparation of 2ndAdvance Estimates for anagricultural year and FinalEstimates of foodgrainproduction for the previousagricultural year
Timely Completion Date 25/02/2014 15/03/2014 25/03/201405/03/201415/02/20141.00[9.4] [9.4.1]
Dissemination ofinformation on agriculturalstatistics
Bringing out‘Handbook onAgriculturalStatistics’ along withrelated database forthe web
Date 15/02/2014 24/02/2014 28/02/201420/02/201407/02/20141.00[9.5] [9.5.1]
06/01/2014 11.45 AMGenerated on
Page : 9 of 39

Section 2:Inter se Priorities among Key Objectives, Success indicators and Targets
Results-Framework Document (RFD) for Department of Agriculture and Cooperation -(2013-2014)
Objective Weight Action Unit
Target / Criteria Value
Weight
80%100% 70% 60%90%
Very Good Fair PoorExcellent GoodSuccessIndicator
Efficient Functioning of the RFD System 3.00 Timely submission of Draft RFD2014-15 for Approval
On-time submission Date 06/03/2014 08/03/2014 11/03/201407/03/201405/03/20142.0*
Timely submission of Results for2012-13
On-time submission Date 02/05/2013 06/05/2013 07/05/201303/05/201301/05/20131.0
Transparency/Service deliveryMinistry/Department
3.00 Independent Audit ofimplementation ofCitizens’/Clients’ Charter (CCC)
% of implementation % 95 85 80901002.0*
Independent Audit ofimplementation of Public
% of implementation % 95 85 80901001.0
* Mandatory Objective(s)
Drought Preparedness and Grant of reliefunder State Disaster Response Fund(SDRF) /National Disaster Response Fund(NDRF)
2.50 Review of CrisisManagement Plan (CMP)for Drought & Review andrelease of ContingencyAction Plans by respectiveDepartments
Annual Review inthe month of Marchfor release ofupdated CMP andmodel ContingencyAction Plans foragriculture, drinkingwater, alternativeemployment etc.
Date 12/03/2014 25/03/2014 31/03/201418/03/201405/03/20141.50[10] [10.1] [10.1.1]
Visit of Central team andsubmission of Reports forAssessment by Inter-ministerial Group
Completion of actionwithin 60 days fromsubmission ofMemorandum
Numberof Days
70 90 10080601.00[10.2] [10.2.1]
Encouraging private investment inAgriculture through PPP mode
2.50 Creation of additional coldstorage capacity
Additional coldstorage capacitycreated
LakhMetricTonnes(MT)
4.5 3.5 3.04.05.01.50[11] [11.1] [11.1.1]
Formation of FarmerProducer Organization(FPO)
FPOs established Number 144 112 961281601.00[11.2] [11.2.1]
06/01/2014 11.45 AMGenerated on
Page : 10 of 39

Section 2:Inter se Priorities among Key Objectives, Success indicators and Targets
Results-Framework Document (RFD) for Department of Agriculture and Cooperation -(2013-2014)
Objective Weight Action Unit
Target / Criteria Value
Weight
80%100% 70% 60%90%
Very Good Fair PoorExcellent GoodSuccessIndicator
Grievance Redressal System
Administrative Reforms 6.00 Implement mitigating strategiesfor reducing potential risk ofcorruption
% of implementation % 95 85 80901001.0*
Implement ISO 9001 as per theapproved action plan
% of implementation % 95 85 80901002.0
Implement Innovation ActionPlan (IAP)
% of milestones achieved % 95 85 80901002.0
Identification of core and non-core activities of theMinistry/Department as per 2ndARC recommendations
Timely submission Date 28/01/2014 30/01/2014 31/01/201429/01/201427/01/20141.0
Improving InternalEfficiency/Responsiveness.
2.00 Update departmental strategy toalign with 12th Plan priorities
Timely updation of thestrategy
Date 17/09/2013 01/10/2013 08/10/201324/09/201310/09/20132.0*
Ensuring compliance to the FinancialAccountability Framework
1.00 Timely submission of ATNs onAudit paras of C&AG
Percentage of ATNssubmitted within due date (4months) from date ofpresentation of Report toParliament by CAG .duringthe year.
% 90 70 60801000.25*
Timely submission of ATRs tothe PAC Sectt. on PAC Reports.
Percentage of ATRSsubmitted within due date (6 months) from date ofpresentation of Report toParliament by PAC .duringthe year.
% 90 70 60801000.25
Early disposal of pending ATNson Audit Paras of C&AG Reportspresented to Parliament before31.3.2012.
Percentage of outstandingATNs disposed off duringthe year.
% 90 70 60801000.25
* Mandatory Objective(s)
06/01/2014 11.45 AMGenerated on
Page : 11 of 39

Section 2:Inter se Priorities among Key Objectives, Success indicators and Targets
Results-Framework Document (RFD) for Department of Agriculture and Cooperation -(2013-2014)
Objective Weight Action Unit
Target / Criteria Value
Weight
80%100% 70% 60%90%
Very Good Fair PoorExcellent GoodSuccessIndicator
Early disposal of pending ATRson PAC Reports presented toParliament before 31.3.2012
Percentage of outstandingATRS disposed off duringthe year.
% 90 70 60801000.25
* Mandatory Objective(s)
06/01/2014 11.45 AMGenerated on
Page : 12 of 39

Section 3:Trend Values of the Success Indicators
Results-Framework Document (RFD) for Department of Agriculture and Cooperation -(2013-2014)
Target Valuefor
ProjectedValue for
Objective ProjectedValue for
Action Success Indicator
FY 11/12
Unit
FY 13/14FY 12/13 FY 14/15
Actual Valuefor
Actual Valuefor
FY 15/16
31/05/2011 31/05/2013DateApproval by31.05.2013
Increasing Crop production andProductivity thereby ensuring foodsecurity and enhanced income levelto farmers
Preparation of tentativeallocations & approval ofState action plans for2013-14
31/05/2014 31/05/201518/05/2012[1] [1.1] [1.1.1]
98 90Percent% of funds (R.E.)released by31.03.2014
Release of funds toStates/ Institutions
90 90 --[1.2] [1.2.1]
-- 5.0MillionTons
Additional productionof 5 Million tons overyear (5 year movingaverage)
Additional foodgrainproduction
5.2 5.412.59[1.3] [1.3.1]
-- 1.5AreaIncrease in area by 1.5lakh ha. over 5 yearmoving average
Area expansion of pulsesby promoting pulsecultivation in rice fallows,as well as intercrops andsummer crops
1.75 2.00 --[1.4] [1.4.1]
-- 30/11/2013DateCompletion of studiesby CDDs andsubmission of Report
NFSM Impact EvaluationStudies
-- -- --[1.5] [1.5.1]
10 14No. ofvisits
State visits twice ayear
Monitoring and review ofBGREI programme in all7 States
14 1512[1.6] [1.6.1]
0.9 0.25% pointsIncrease in percentagepoints of States' Planexpenditure inAgriculture and alliedsectors as per PointNo. 3 of
Incentivizing states to enhance publicinvestment in Agriculture & alliedsectors to sustain and maintaincapital formation and agricultureinfrastructure
Incentivise states tomake additionalallocation in Agriculture &Allied sectors
0.25 0.25 --[2] [2.1] [2.1.1]
06/01/2014 11.45 AMGenerated on
Page : 13 of 39

Section 3:Trend Values of the Success Indicators
Results-Framework Document (RFD) for Department of Agriculture and Cooperation -(2013-2014)
Target Valuefor
ProjectedValue for
Objective ProjectedValue for
Action Success Indicator
FY 11/12
Unit
FY 13/14FY 12/13 FY 14/15
Actual Valuefor
Actual Valuefor
FY 15/16
Annexure-II of RKVYGuidelines
21 30Number ofDays
Average value ofnumber of days for allStates after receipt ofSLSC meeting minutes
Release of Stream 1funds
30 30 --[2.2] [2.2.1]
28 26Number ofVisits
Performance of Statesreviewed by visits tothe States and throughensuring projects dataentry in web basedRKVY MIS by States
Monitoring performanceof States
27 27 --[2.3] [2.3.1]
99 90Percent% of funds (R.E.)released by31.03.2014
Diversification in Agriculture forincreased income generation
Utilisation/Release offunds allocated underISOPOM
90 90 --[3] [3.1] [3.1.1]
-- 305Lakhtones
production of nine oilseeds
Enhancing production ofoilseeds for increasedavailability of edible oils
305 305 --[3.2] [3.2.1]
34 25NumberOrganize meetings /field visits
Monitoring andEvaluation of ISOPOM
25 2528[3.3] [3.3.1]
2.46 1.75LakhHectares
Additional areacovered
Area expansion underhorticultural crops andrejuvenation of senilegardens
1.75 1.751.71[3.4] [3.4.1]
-- 2.70MillionMetrictons
Additional productionof 3 Million tons overyear (5 years movingaverage)
Additional Horticulturalproduction
-- --10.90[3.5] [3.5.1]
06/01/2014 11.45 AMGenerated on
Page : 14 of 39

Section 3:Trend Values of the Success Indicators
Results-Framework Document (RFD) for Department of Agriculture and Cooperation -(2013-2014)
Target Valuefor
ProjectedValue for
Objective ProjectedValue for
Action Success Indicator
FY 11/12
Unit
FY 13/14FY 12/13 FY 14/15
Actual Valuefor
Actual Valuefor
FY 15/16
117 360NumberTotal number ofnurseries established
Establishment ofnurseries and theiraccreditation
360 360290[3.6] [3.6.1]
-- 80NumberTotal number ofnurseries accredited
100 10095[3.6.2]
567 450NumberNumber of projectssanctioned
Sanction of projects forPHM / Market / Others
500 500818[3.7] [3.7.1]
3.4 5.4LakhHectares
Area coveredArea to be covered underdrip irrigation
5.5 6.0 --[3.8] [3.8.1]
2.95 2.29LakhHectares
Area coveredArea expansion undersprinkler irrigation
2.5 3.0 --[3.9] [3.9.1]
17 18NumberNumber of field Visitsby the Joint InspectionTeam
Monitoring andEvaluation
19 2020.00[3.10] [3.10.1]
283.8 300LakhQuintals
Quantity of Certifiedand quality seeddistributed
Ensuring supply of agricultural inputsfor enhanced production andproductivity
Distribution of certifiedand quality seed
300 300300[4] [4.1] [4.1.1]
6422 5400NumberNumber of personstrained
Organize trainingprogrammes for farmers,technicians, trainers,entrepreneurs,manufacturers andofficials from StateGovernments at FMTTIs
6000 60006445[4.2] [4.2.1]
191 165NumberNumber of machinestested
Testing of tractors, powertillers, combine
170 175199[4.3] [4.3.1]
06/01/2014 11.45 AMGenerated on
Page : 15 of 39
Section 3:Trend Values of the Success Indicators
Results-Framework Document (RFD) for Department of Agriculture and Cooperation -(2013-2014)
Target Valuefor
ProjectedValue for
Objective ProjectedValue for
Action Success Indicator
FY 11/12
Unit
FY 13/14FY 12/13 FY 14/15
Actual Valuefor
Actual Valuefor
FY 15/16
harvesters and otheragricultural machines/implements forperformance evaluationand quality up-gradationat FMTTIs
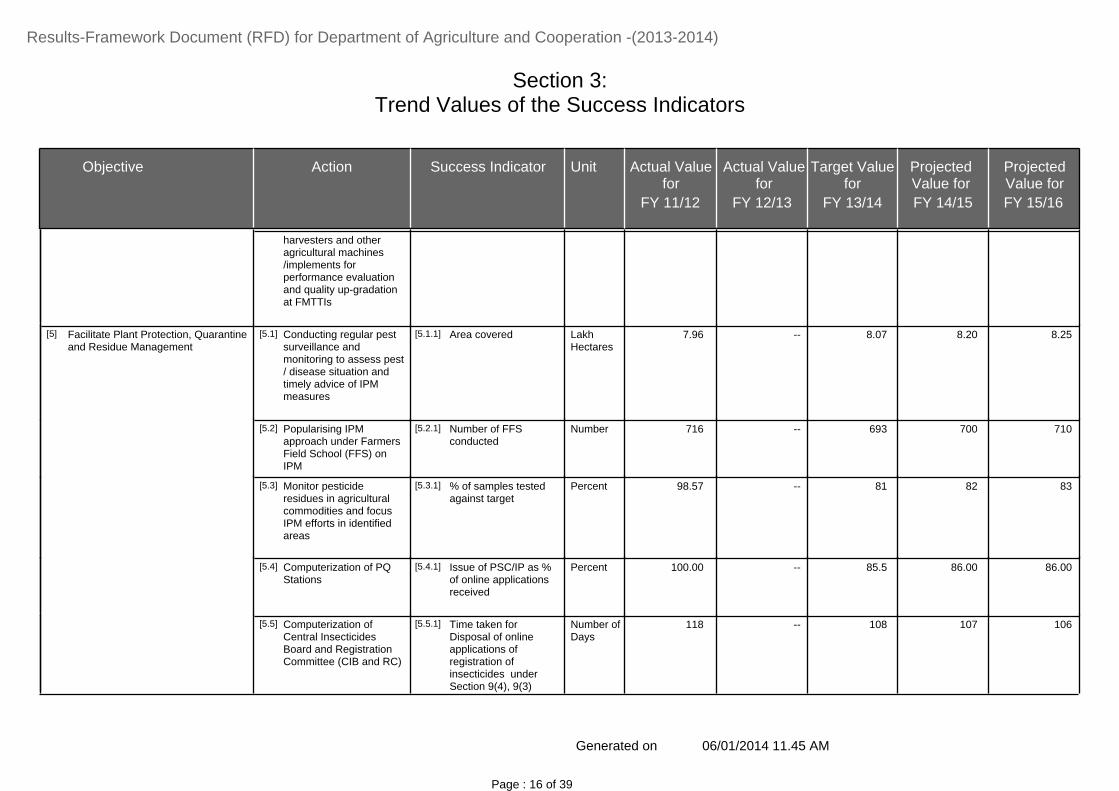
7.96 8.07LakhHectares
Area coveredFacilitate Plant Protection, Quarantineand Residue Management
Conducting regular pestsurveillance andmonitoring to assess pest/ disease situation andtimely advice of IPMmeasures
8.20 8.25 --[5] [5.1] [5.1.1]
716 693NumberNumber of FFSconducted
Popularising IPMapproach under FarmersField School (FFS) onIPM
700 710 --[5.2] [5.2.1]
98.57 81Percent% of samples testedagainst target
Monitor pesticideresidues in agriculturalcommodities and focusIPM efforts in identifiedareas
82 83 --[5.3] [5.3.1]
100.00 85.5PercentIssue of PSC/IP as %of online applicationsreceived
Computerization of PQStations
86.00 86.00 --[5.4] [5.4.1]
118 108Number ofDays
Time taken forDisposal of onlineapplications ofregistration ofinsecticides underSection 9(4), 9(3)
Computerization ofCentral InsecticidesBoard and RegistrationCommittee (CIB and RC)
107 106 --[5.5] [5.5.1]
06/01/2014 11.45 AMGenerated on
Page : 16 of 39
Section 3:Trend Values of the Success Indicators
Results-Framework Document (RFD) for Department of Agriculture and Cooperation -(2013-2014)
Target Valuefor
ProjectedValue for
Objective ProjectedValue for
Action Success Indicator
FY 11/12
Unit
FY 13/14FY 12/13 FY 14/15
Actual Valuefor
Actual Valuefor
FY 15/16
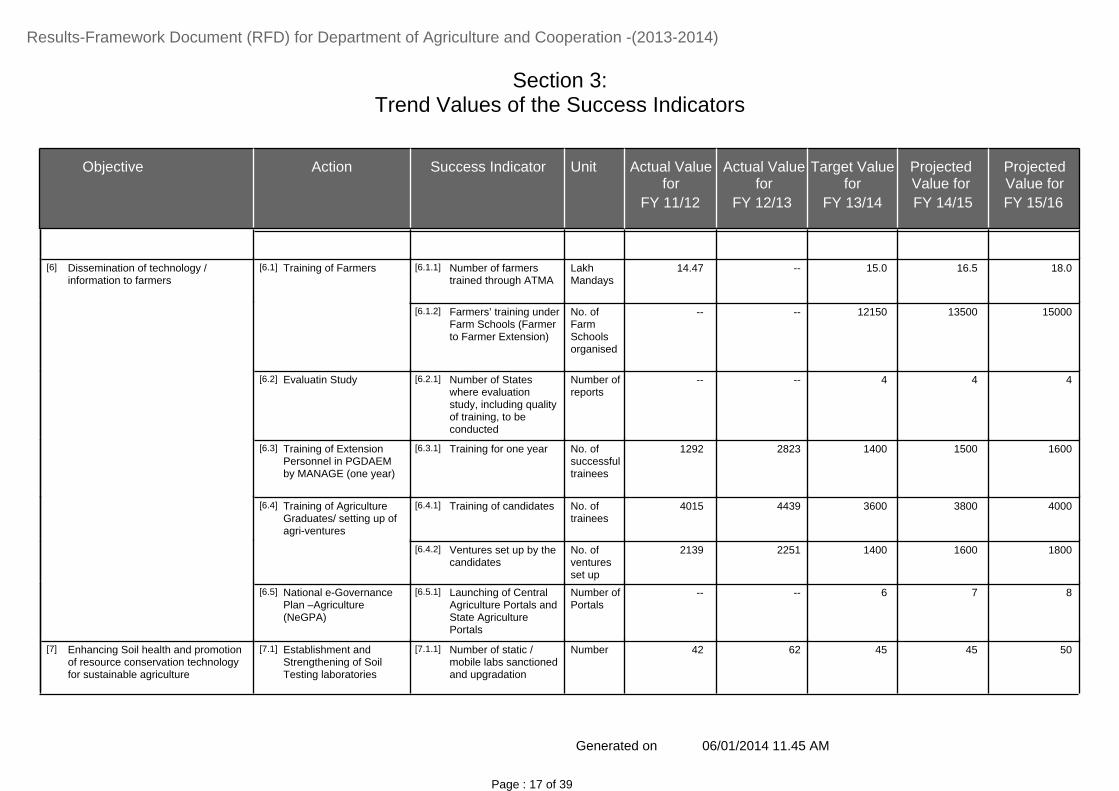
14.47 15.0LakhMandays
Number of farmerstrained through ATMA
Dissemination of technology /information to farmers
Training of Farmers 16.5 18.0 --[6] [6.1] [6.1.1]
-- 12150No. ofFarmSchoolsorganised
Farmers’ training underFarm Schools (Farmerto Farmer Extension)
13500 15000 --[6.1.2]
-- 4Number ofreports
Number of Stateswhere evaluationstudy, including qualityof training, to beconducted
Evaluatin Study 4 4 --[6.2] [6.2.1]
1292 1400No. ofsuccessfultrainees
Training for one yearTraining of ExtensionPersonnel in PGDAEMby MANAGE (one year)
1500 16002823[6.3] [6.3.1]
4015 3600No. oftrainees
Training of candidatesTraining of AgricultureGraduates/ setting up ofagri-ventures
3800 40004439[6.4] [6.4.1]
2139 1400No. ofventuresset up
Ventures set up by thecandidates
1600 18002251[6.4.2]
-- 6Number ofPortals
Launching of CentralAgriculture Portals andState AgriculturePortals
National e-GovernancePlan –Agriculture(NeGPA)
7 8 --[6.5] [6.5.1]
42 45NumberNumber of static /mobile labs sanctionedand upgradation
Enhancing Soil health and promotionof resource conservation technologyfor sustainable agriculture
Establishment andStrengthening of SoilTesting laboratories
45 5062[7] [7.1] [7.1.1]
06/01/2014 11.45 AMGenerated on
Page : 17 of 39

Section 3:Trend Values of the Success Indicators
Results-Framework Document (RFD) for Department of Agriculture and Cooperation -(2013-2014)
Target Valuefor
ProjectedValue for
Objective ProjectedValue for
Action Success Indicator
FY 11/12
Unit
FY 13/14FY 12/13 FY 14/15
Actual Valuefor
Actual Valuefor
FY 15/16
approved
13859 8000NumberNumber of Samplestested
Quality control of OrganicManure, Bio-Fertilizersand fertilizers
8500 90009332[7.2] [7.2.1]
107.6 90PercentAmount of credit flowas % of target
Improving credit flow, marketinfrastructure, and risk mitigation
Flow of credit foragriculture
90 9066[8] [8.1] [8.1.1]
10/04/2011 07/04/2013DateTimely issuance ofAdministrativeapproval of schemes
Implementation of NAIS,MNAIS and WBCISduring 2013-14
10/04/2014 10/04/201507/03/2012[8.2] [8.2.1]
16.35 36Lakh MTCapacity createdConstruction &Renovation of RuralGodowns (Rural GodownScheme)
38 4073.98[8.3] [8.3.1]
-- 370NumberProjects clearedImplementation ofAMIGS scheme
380 390731[8.4] [8.4.1]
06/04/2011 30/04/2013DateTimely CompletionMaintaining Agricultural statistics toaid policy development
Preparation of 3rdAdvance Estimates offoodgrain production foran agricultural year
30/04/2014 30/04/201530/04/2012[9] [9.1] [9.1.1]
19/07/2011 20/07/2013DateTimely CompletionPreparation of 4thAdvance Estimates offoodgrain production foran agricultural year
20/07/2014 20/07/201516/07/2012[9.2] [9.2.1]
14/09/2011 30/09/2013DateTimely CompletionPreparation of 1stAdvance Estimates offoodgrain production
30/09/2014 30/09/201524/09/2012[9.3] [9.3.1]
06/01/2014 11.45 AMGenerated on
Page : 18 of 39

Section 3:Trend Values of the Success Indicators
Results-Framework Document (RFD) for Department of Agriculture and Cooperation -(2013-2014)
Target Valuefor
ProjectedValue for
Objective ProjectedValue for
Action Success Indicator
FY 11/12
Unit
FY 13/14FY 12/13 FY 14/15
Actual Valuefor
Actual Valuefor
FY 15/16
for an agricultural year
03/02/2012 15/02/2014DateTimely CompletionPreparation of 2ndAdvance Estimates foran agricultural year andFinal Estimates offoodgrain production forthe previous agriculturalyear
15/02/2015 15/02/201608/02/2013[9.4] [9.4.1]
23/01/2012 07/02/2014DateBringing out‘Handbook onAgricultural Statistics’along with relateddatabase for the web
Dissemination ofinformation onagricultural statistics
07/02/2015 07/02/201606/02/2013[9.5] [9.5.1]
21/02/2012 25/03/2014DateAnnual Review in themonth of March forrelease of updatedCMP and modelContingency ActionPlans for agriculture,drinking water,alternative employmentetc.
Drought Preparedness and Grant ofrelief under State Disaster ResponseFund (SDRF) /National DisasterResponse Fund (NDRF)
Review of CrisisManagement Plan (CMP)for Drought & Reviewand release ofContingency ActionPlans by respectiveDepartments
25/03/2015 25/03/201620/03/2013[10] [10.1] [10.1.1]
57 60Number ofDays
Completion of actionwithin 60 days fromsubmission ofMemorandum
Visit of Central team andsubmission of Reports forAssessment by Inter-ministerial Group
60 6057[10.2] [10.2.1]
-- 5.0LakhMetricTonnes(MT)
Additional cold storagecapacity created
Encouraging private investment inAgriculture through PPP mode
Creation of additionalcold storage capacity
5.5 6.04.80[11] [11.1] [11.1.1]
06/01/2014 11.45 AMGenerated on
Page : 19 of 39

Section 3:Trend Values of the Success Indicators
Results-Framework Document (RFD) for Department of Agriculture and Cooperation -(2013-2014)
Target Valuefor
ProjectedValue for
Objective ProjectedValue for
Action Success Indicator
FY 11/12
Unit
FY 13/14FY 12/13 FY 14/15
Actual Valuefor
Actual Valuefor
FY 15/16
07/03/2011 04/03/2013DateOn-time submissionEfficient Functioning of the RFDSystem
Timely submission of DraftRFD 2014-15 for Approval
-- --05/03/2012*
01/05/2012 01/05/2014DateOn-time submissionTimely submission of Resultsfor 2012-13
-- --30/04/2013
-- 95%% of implementationTransparency/Service deliveryMinistry/Department
Independent Audit ofimplementation ofCitizens’/Clients’ Charter
95 95 --*
-- 95%% of implementationIndependent Audit ofimplementation of PublicGrievance Redressal System
95 9560.5
-- 95%% of implementationAdministrative Reforms Implement mitigating strategiesfor reducing potential risk ofcorruption
95 95 --*
-- 95%% of implementationImplement ISO 9001 as perthe approved action plan
95 95 --
-- 95%% of milestones achievedImplement Innovation ActionPlan (IAP)
95 95 --
-- 15/10/2013DateTimely submissionIdentification of core and non-core activities of theMinistry/Department as per2nd ARC recommendations
-- -- --
* Mandatory Objective(s)
-- 160NumberFPOs establishedFormation of FarmerProducer Organization(FPO)
168 43 --[11.2] [11.2.1]
06/01/2014 11.45 AMGenerated on
Page : 20 of 39

Section 3:Trend Values of the Success Indicators
Results-Framework Document (RFD) for Department of Agriculture and Cooperation -(2013-2014)
Target Valuefor
ProjectedValue for
Objective ProjectedValue for
Action Success Indicator
FY 11/12
Unit
FY 13/14FY 12/13 FY 14/15
Actual Valuefor
Actual Valuefor
FY 15/16
-- 90%Percentage of ATNssubmitted within due date (4months) from date ofpresentation of Report toParliament by CAG .duringthe year.
Ensuring compliance to the FinancialAccountability Framework
Timely submission of ATNs onAudit paras of C&AG
-- -- --*
-- 90%Percentage of ATRSsubmitted within due date ( 6months) from date ofpresentation of Report toParliament by PAC .during theyear.
Timely submission of ATRs tothe PAC Sectt. on PACReports.
-- -- --
-- 90%Percentage of outstandingATNs disposed off during theyear.
Early disposal of pendingATNs on Audit Paras of C&AGReports presented toParliament before 31.3.2012.
-- -- --
-- 90%Percentage of outstandingATRS disposed off during theyear.
Early disposal of pendingATRs on PAC Reportspresented to Parliament before31.3.2012
-- -- --
* Mandatory Objective(s)
06/01/2014 11.45 AMGenerated on
Page : 21 of 39

Section 4:Acronym
Results-Framework Document (RFD) for Department of Agriculture and Cooperation -(2013-2014)
AcronymSI.No Description
Agricultural Marketing Infrastructure, Grading & Standardization1 AMIGS
Agricultural Technology Management Agency2 ATMA
Crop Development Directorates3 CDDs
Department of Agriculture & Cooperation4 DAC
Farm Machinery Training & Testing Institutes5 FMTTIs
Import Permit6 IP
Page : 22 of 39

Section 4:Acronym
Results-Framework Document (RFD) for Department of Agriculture and Cooperation -(2013-2014)
AcronymSI.No Description
Integrated Scheme of Oilseeds, Pulses, Oilpalm and Maize7 ISOPOM
National Institute of Agricultural Extension Management8 MANAGE
Managment Informatin System9 MIS
Modified National Agricultural Insurance Scheme10 MNAIS
Not Available11 NA
National Agricultural Insurance Scheme12 NAIS
Page : 23 of 39
Section 4:Acronym
Results-Framework Document (RFD) for Department of Agriculture and Cooperation -(2013-2014)
AcronymSI.No Description
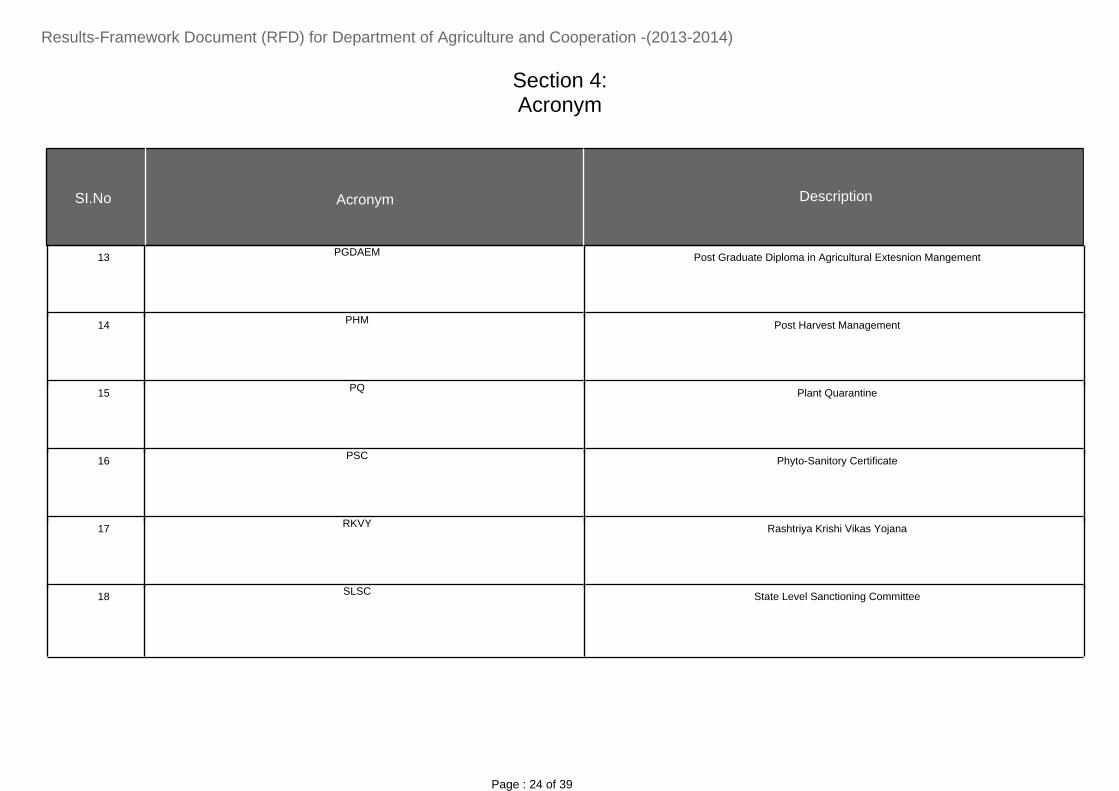
Post Graduate Diploma in Agricultural Extesnion Mangement13 PGDAEM
Post Harvest Management14 PHM
Plant Quarantine15 PQ
Phyto-Sanitory Certificate16 PSC
Rashtriya Krishi Vikas Yojana17 RKVY
State Level Sanctioning Committee18 SLSC
Page : 24 of 39
Section 4:Acronym
Results-Framework Document (RFD) for Department of Agriculture and Cooperation -(2013-2014)
AcronymSI.No Description
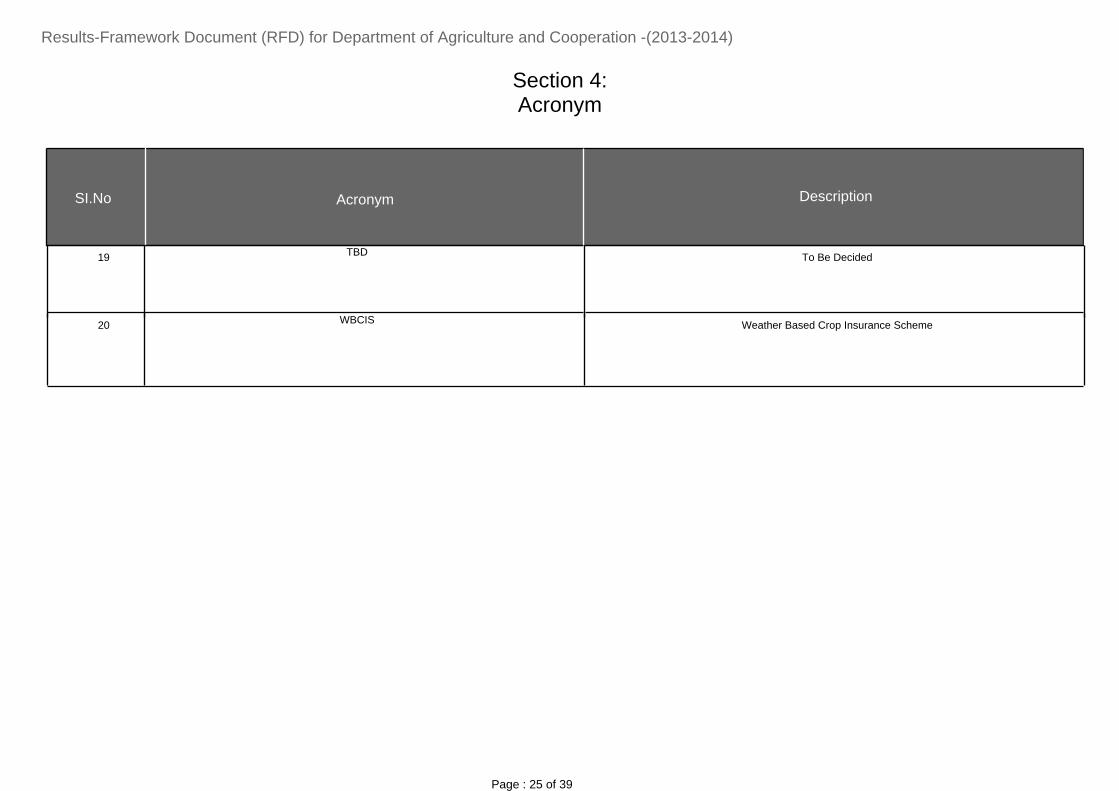
To Be Decided19 TBD
Weather Based Crop Insurance Scheme20 WBCIS
Page : 25 of 39

Section 4:Description and Definition of Success Indicators and Proposed Measurement Methodology
Results-Framework Document (RFD) for Department of Agriculture and Cooperation -(2013-2014)
Success indicator Description Definition MeasurementSI.No General Comments
The world Food Summit,defined food security as
follows: ‘Food security existswhen all people, at all times,have physical and economicaccess to sufficient, safe andnutritious food to meet their
dietary needs and foodpreferences for an active andhealthy lifestyle.’ The samedefinition has been adopted
in this RFD.
The target of additional production of5 million tons is on the assumption ofnormal monsoon. The target will belower by 1 million tons on deficiencyof every 1.5% in rainfall as compared
to Long Period Average (LPA).Achievement of additional production
target will be calculated based onmoving average of last 5 years.
1 [1.3.1] Additional production of 5 Million tons overyear (5 year moving average)
In only one of the SIs i.e. [6.3.2]"ventures set up by the candidates',the targets/criteria values have beenrevised downwards as compared to
previous year’s targets. There isupward revision in some of the SIs.
The reason for the downward revisionis as follows:
The ACABC (Agri-Clinics & Agri-Business Centres) scheme is not
under primary lending category of theBanks and the amount involved formsonly a miniscule portion of the Banks’lending. Therefore, the success ratehas dropped down in recent years
2 [6.4.2] Ventures set up by the candidates
06/01/2014 11.45 AMGenerated on
Page : 26 of 39

Section 4:Description and Definition of Success Indicators and Proposed Measurement Methodology
Results-Framework Document (RFD) for Department of Agriculture and Cooperation -(2013-2014)
Success indicator Description Definition MeasurementSI.No General Comments
and Banks are being persuaded togive importance to this scheme also.
2 [6.4.2] Ventures set up by the candidates
Page : 27 of 39

Section 5 :Specific Performance Requirements from other Departments
Results-Framework Document (RFD) for Department of Agriculture and Cooperation -(2013-2014)
Organisation TypeRelevant Success
Indicator
What is yourrequirement fromthis organisation
Justification for thisrequirement
LocationType
Please quantify yourrequirement fromthis Organisation
What happens ifyour requirement is
not met.State Organisation Name
The production getsaffected
Ensure timely supply offertilisers in therequired quantities
[1.3.1] Additionalproduction of 5 Milliontons over year (5 yearmoving average)
CentralGovernment
Department Of FertilizersDepartments
[3.5.1] Additionalproduction of 3 Milliontons over year (5 yearsmoving average)
The area coverage andnumber of projects taken
up get affected andultimately the production
and other targets getaffected
Ensure adequate flowof agricultural credit
[1.3.1] Additionalproduction of 5 Milliontons over year (5 yearmoving average)
Department of FinancialServices
[3.4.1] Additional areacovered
[3.5.1] Additionalproduction of 3 Milliontons over year (5 yearsmoving average)
[3.7.1] Number ofprojects sanctioned
[3.8.1] Area covered
[3.9.1] Area covered
[8.1.1] Amount of creditflow as % of
06/01/2014 11.45 AMGenerated on
Page : 28 of 39
Section 5 :Specific Performance Requirements from other Departments
Results-Framework Document (RFD) for Department of Agriculture and Cooperation -(2013-2014)
Organisation TypeRelevant Success
Indicator
What is yourrequirement fromthis organisation
Justification for thisrequirement
LocationType
Please quantify yourrequirement fromthis Organisation
What happens ifyour requirement is
not met.State Organisation Name
target
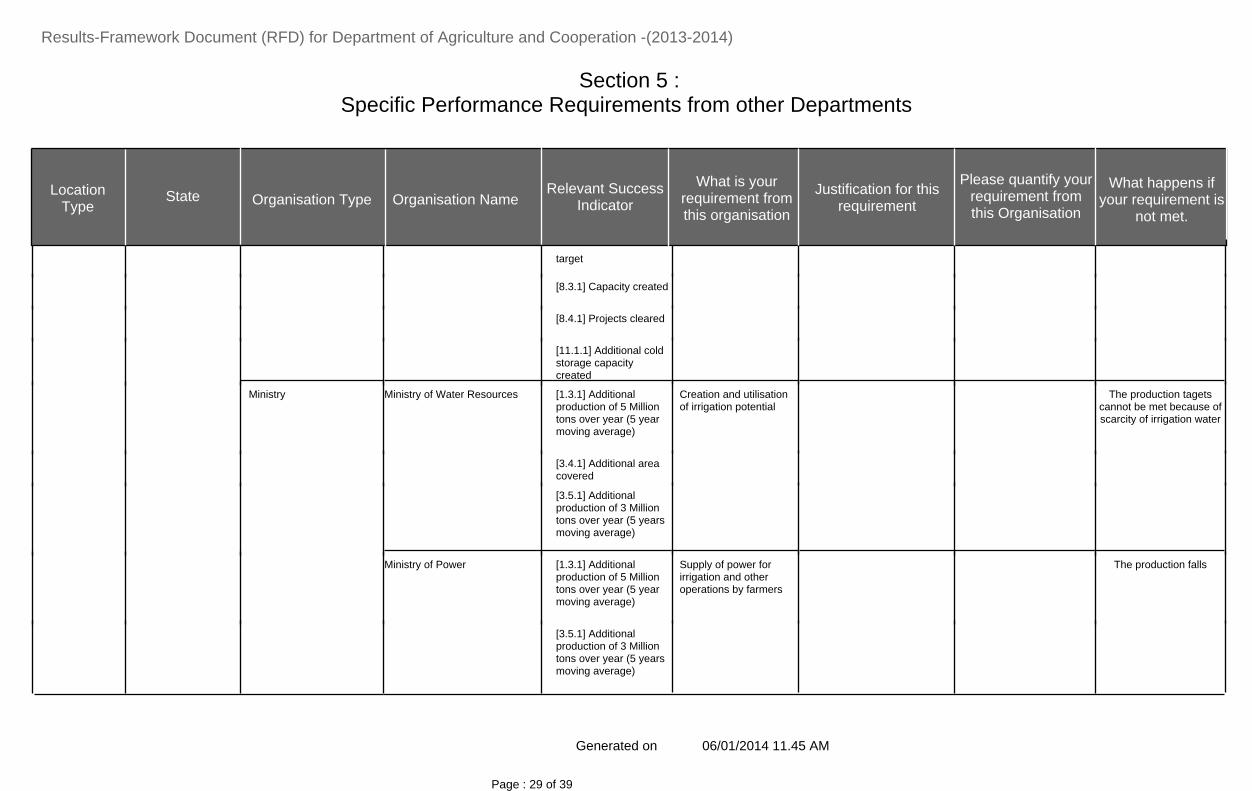
[8.3.1] Capacity created
[8.4.1] Projects cleared
[11.1.1] Additional coldstorage capacitycreated
The production tagetscannot be met because ofscarcity of irrigation water
Creation and utilisationof irrigation potential
[1.3.1] Additionalproduction of 5 Milliontons over year (5 yearmoving average)
Ministry of Water ResourcesMinistry
[3.4.1] Additional areacovered
[3.5.1] Additionalproduction of 3 Milliontons over year (5 yearsmoving average)
The production fallsSupply of power forirrigation and otheroperations by farmers
[1.3.1] Additionalproduction of 5 Milliontons over year (5 yearmoving average)
Ministry of Power
[3.5.1] Additionalproduction of 3 Milliontons over year (5 yearsmoving average)
06/01/2014 11.45 AMGenerated on
Page : 29 of 39

Section 5 :Specific Performance Requirements from other Departments
Results-Framework Document (RFD) for Department of Agriculture and Cooperation -(2013-2014)
Organisation TypeRelevant Success
Indicator
What is yourrequirement fromthis organisation
Justification for thisrequirement
LocationType
Please quantify yourrequirement fromthis Organisation
What happens ifyour requirement is
not met.State Organisation Name
[11.1.1] Additional coldstorage capacitycreated
The targets cannot beachieved because of
shortage of funds
Approval for allocationof required funds
[1.1.1] Approval by31.05.2013
As per the Plan proposalsof DAC
Ministry of Planning
[1.3.1] Additionalproduction of 5 Milliontons over year (5 yearmoving average)
[2.1.1] Increase inpercentage points ofStates' Plan expenditurein Agriculture and alliedsectors as per Point No.3 of Annexure-II ofRKVY Guidelines
[3.5.1] Additionalproduction of 3 Milliontons over year (5 yearsmoving average)
[3.6.1] Total number ofnurseries established
[3.6.2] Total number ofnurseries accredited
06/01/2014 11.45 AMGenerated on
Page : 30 of 39

Section 5 :Specific Performance Requirements from other Departments
Results-Framework Document (RFD) for Department of Agriculture and Cooperation -(2013-2014)
Organisation TypeRelevant Success
Indicator
What is yourrequirement fromthis organisation
Justification for thisrequirement
LocationType
Please quantify yourrequirement fromthis Organisation
What happens ifyour requirement is
not met.State Organisation Name
[3.7.1] Number ofprojects sanctioned
[3.8.1] Area covered
[3.9.1] Area covered
[4.1.1] Quantity ofCertified and qualityseed distributed
[4.2.1] Number ofpersons trained
[4.3.1] Number ofmachines tested
Area covered
Number of FFSconducted
[6.1.1] Number offarmers trained throughATMA
[6.1.2] Farmers’ trainingunder Farm Schools(Farmer to FarmerExtension)
[6.5.1] Launching ofCentral AgriculturePortals and StateAgriculture Portals
[7.1.1] Number of static/ mobile labs
06/01/2014 11.45 AMGenerated on
Page : 31 of 39
Section 5 :Specific Performance Requirements from other Departments
Results-Framework Document (RFD) for Department of Agriculture and Cooperation -(2013-2014)
Organisation TypeRelevant Success
Indicator
What is yourrequirement fromthis organisation
Justification for thisrequirement
LocationType
Please quantify yourrequirement fromthis Organisation
What happens ifyour requirement is
not met.State Organisation Name
sanctioned andupgradation approved
[8.3.1] Capacity created
[8.4.1] Projects cleared
[11.1.1] Additional coldstorage capacitycreated
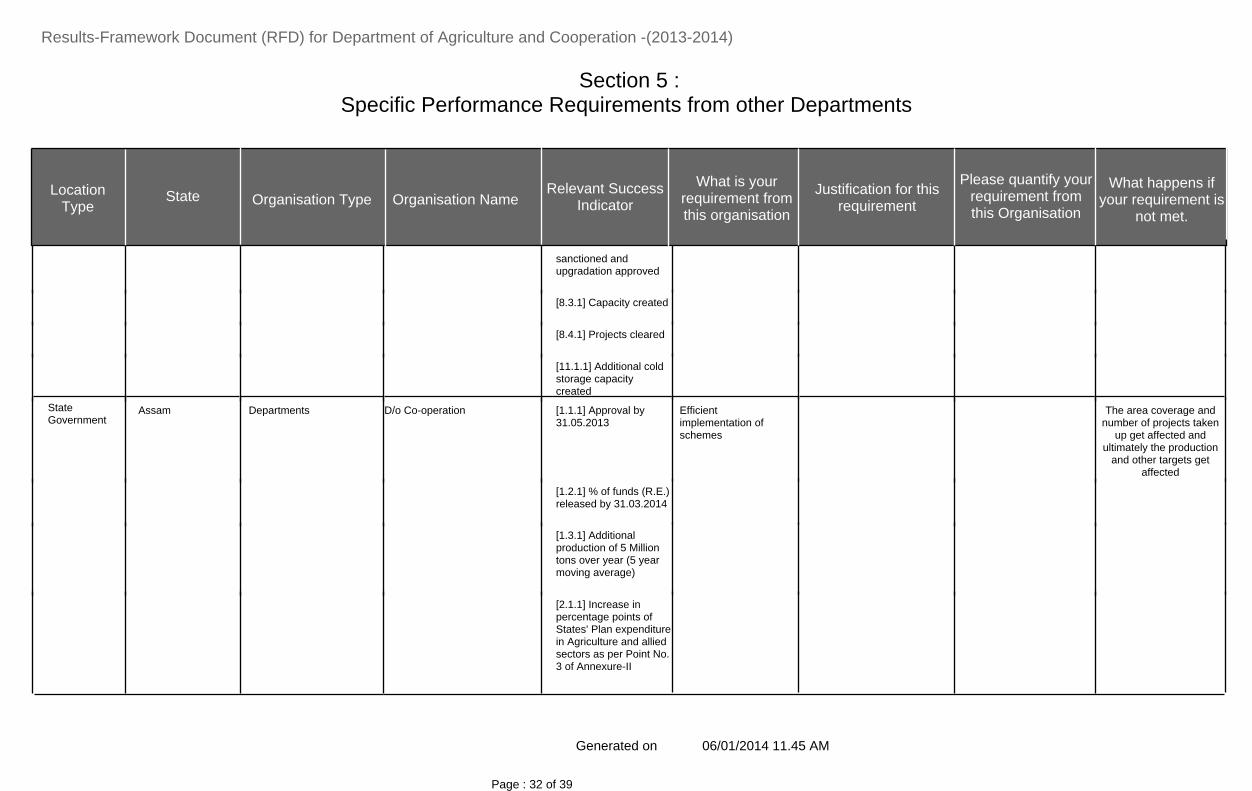
The area coverage andnumber of projects taken
up get affected andultimately the production
and other targets getaffected
Efficientimplementation ofschemes
[1.1.1] Approval by31.05.2013
AssamStateGovernment
D/o Co-operationDepartments
[1.2.1] % of funds (R.E.)released by 31.03.2014
[1.3.1] Additionalproduction of 5 Milliontons over year (5 yearmoving average)
[2.1.1] Increase inpercentage points ofStates' Plan expenditurein Agriculture and alliedsectors as per Point No.3 of Annexure-II
06/01/2014 11.45 AMGenerated on
Page : 32 of 39

Section 5 :Specific Performance Requirements from other Departments
Results-Framework Document (RFD) for Department of Agriculture and Cooperation -(2013-2014)
Organisation TypeRelevant Success
Indicator
What is yourrequirement fromthis organisation
Justification for thisrequirement
LocationType
Please quantify yourrequirement fromthis Organisation
What happens ifyour requirement is
not met.State Organisation Name
of RKVY Guidelines
[3.1.1] % of funds (R.E.)released by 31.03.2014
[3.4.1] Additional areacovered
[3.5.1] Additionalproduction of 3 Milliontons over year (5 yearsmoving average)
[3.6.1] Total number ofnurseries established
[3.7.1] Number ofprojects sanctioned
[3.8.1] Area covered
[3.9.1] Area covered
[4.1.1] Quantity ofCertified and qualityseed distributed
[6.1.1] Number offarmers trained throughATMA
[6.1.2] Farmers’ trainingunder Farm Schools(Farmer to
06/01/2014 11.45 AMGenerated on
Page : 33 of 39

Section 5 :Specific Performance Requirements from other Departments
Results-Framework Document (RFD) for Department of Agriculture and Cooperation -(2013-2014)
Organisation TypeRelevant Success
Indicator
What is yourrequirement fromthis organisation
Justification for thisrequirement
LocationType
Please quantify yourrequirement fromthis Organisation
What happens ifyour requirement is
not met.State Organisation Name
Farmer Extension)
[6.5.1] Launching ofCentral AgriculturePortals and StateAgriculture Portals
[8.3.1] Capacity created
[8.4.1] Projects cleared
[11.1.1] Additional coldstorage capacitycreated
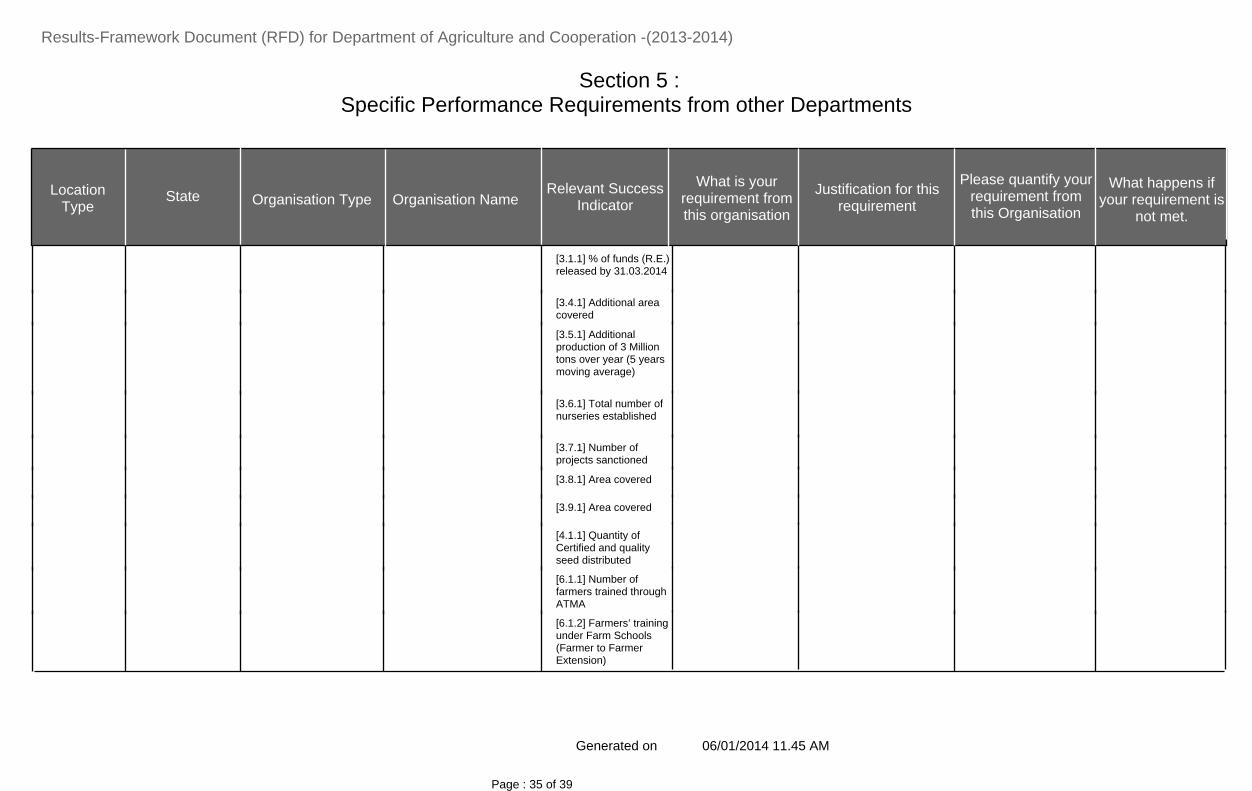
[1.1.1] Approval by31.05.2013
State Departments
[1.2.1] % of funds (R.E.)released by 31.03.2014
[1.3.1] Additionalproduction of 5 Milliontons over year (5 yearmoving average)
[2.1.1] Increase inpercentage points ofStates' Plan expenditurein Agriculture and alliedsectors as per Point No.3 of Annexure-II ofRKVY Guidelines
06/01/2014 11.45 AMGenerated on
Page : 34 of 39
Section 5 :Specific Performance Requirements from other Departments
Results-Framework Document (RFD) for Department of Agriculture and Cooperation -(2013-2014)
Organisation TypeRelevant Success
Indicator
What is yourrequirement fromthis organisation
Justification for thisrequirement
LocationType
Please quantify yourrequirement fromthis Organisation
What happens ifyour requirement is
not met.State Organisation Name
[3.1.1] % of funds (R.E.)released by 31.03.2014
[3.4.1] Additional areacovered
[3.5.1] Additionalproduction of 3 Milliontons over year (5 yearsmoving average)
[3.6.1] Total number ofnurseries established
[3.7.1] Number ofprojects sanctioned
[3.8.1] Area covered
[3.9.1] Area covered
[4.1.1] Quantity ofCertified and qualityseed distributed
[6.1.1] Number offarmers trained throughATMA
[6.1.2] Farmers’ trainingunder Farm Schools(Farmer to FarmerExtension)
06/01/2014 11.45 AMGenerated on
Page : 35 of 39

Section 5 :Specific Performance Requirements from other Departments
Results-Framework Document (RFD) for Department of Agriculture and Cooperation -(2013-2014)
Organisation TypeRelevant Success
Indicator
What is yourrequirement fromthis organisation
Justification for thisrequirement
LocationType
Please quantify yourrequirement fromthis Organisation
What happens ifyour requirement is
not met.State Organisation Name
[6.5.1] Launching ofCentral AgriculturePortals and StateAgriculture Portals
[8.3.1] Capacity created
[8.4.1] Projects cleared
[11.1.1] Additional coldstorage capacitycreated
[1.1.1] Approval by31.05.2013
D/o Agriculture
[1.2.1] % of funds (R.E.)released by 31.03.2014
[1.3.1] Additionalproduction of 5 Milliontons over year (5 yearmoving average)
[2.1.1] Increase inpercentage points ofStates' Plan expenditurein Agriculture and alliedsectors as per Point No.3 of Annexure-II ofRKVY Guidelines
[3.1.1] % of funds (R.E.)released by
06/01/2014 11.45 AMGenerated on
Page : 36 of 39

Section 5 :Specific Performance Requirements from other Departments
Results-Framework Document (RFD) for Department of Agriculture and Cooperation -(2013-2014)
Organisation TypeRelevant Success
Indicator
What is yourrequirement fromthis organisation
Justification for thisrequirement
LocationType
Please quantify yourrequirement fromthis Organisation
What happens ifyour requirement is
not met.State Organisation Name
31.03.2014
[3.4.1] Additional areacovered
[3.5.1] Additionalproduction of 3 Milliontons over year (5 yearsmoving average)
[3.6.1] Total number ofnurseries established
[3.7.1] Number ofprojects sanctioned
[3.8.1] Area covered
[3.9.1] Area covered
[4.1.1] Quantity ofCertified and qualityseed distributed
[6.1.1] Number offarmers trained throughATMA
[6.1.2] Farmers’ trainingunder Farm Schools(Farmer to FarmerExtension)
[6.5.1] Launching ofCentral Agriculture
06/01/2014 11.45 AMGenerated on
Page : 37 of 39

Section 5 :Specific Performance Requirements from other Departments
Results-Framework Document (RFD) for Department of Agriculture and Cooperation -(2013-2014)
Organisation TypeRelevant Success
Indicator
What is yourrequirement fromthis organisation
Justification for thisrequirement
LocationType
Please quantify yourrequirement fromthis Organisation
What happens ifyour requirement is
not met.State Organisation Name
Portals and StateAgriculture Portals
[8.3.1] Capacity created
[8.4.1] Projects cleared
[11.1.1] Additional coldstorage capacitycreated
Page : 38 of 39

Section 6:Outcome/Impact of Department/Ministry
Results-Framework Document (RFD) for Department of Agriculture and Cooperation -(2013-2014)
Outcome/Impact ofDepartment/Ministry
Jointly responsible forinfluencing this outcome /impact with the following
department (s) / ministry(ies)
SuccessIndicator
FY 11/12 FY 13/14FY 12/13 FY 14/15 FY 15/16Unit
6.07 4.0Increase in foodgrainproduction
Increased agriculturalproduction
Planning Commission, Ministries/Depts.ofFinance, Power, Water resources,Fertilizers, Financial Services etc., StateGovernments and RCs under DAC
TBD TBD(-) 3.541 Percent
6.94 6.0Increase in horticultureproduction
Increased horticultureproduction
Planning Commission, MinistryMinistries/Depts. ofFinance, Power, Water resources,Fertilizers, Financial Services etc , StateGovernments and RCs under DAC
TBD TBDNA2 Percent
11.7 NAIncrease in investment i.e.GCF in Agriculture
Enhanced investment inAgriculture
Ministries/Depts. ofFinance, Power, Water resources,Fertilizers, Financial Services etc, StatesGovernments and RCs under DAC
TBD TBDNA3 Percent
3.6 4.0Growth in GDP for agriculturesector
Improved growth ofAgriculture sector
Ministries/Depts. ofFinance, Power, Water resources,Fertilizers, Financial Services etc, StatesGovernments and RCs under DAC
TBD TBD1.84 Percent
NAIncrease in Farmers' IncomeImproved Economic Well-being of Farmers andReduction in rural poverty
Ministries/Depts. ofFinance, Power, Water resources,Fertilizers, Financial Services etc, StatesGovernments and RCs under DAC
TBD TBDNA5 Percent
NAReduction in rural poverty TBD TBDNAPercent
06/01/2014 11.45 AMGenerated on
Page : 39 of 39


