
Graph-Drawing Contest Report
Peter Eades1, Joe Marks2, Petra Mutzel3, and Stephen North4
1 Department of Computer Science, University of NewcastleUniversity Drive – Callaghan, NSW 2308, Australia
[email protected] MERL–A Mitsubishi Electric Research Laboratory
201 Broadway, Cambridge, MA 02139, [email protected]
3 Max-Planck-Institut fur InformatikIm Stadtwald, 66123 Saarbrucken, Germany
[email protected] AT&T Research
180 Park Ave., Bldg. 103, Florham Park, NJ 07932-0971, [email protected]
Abstract. This report describes the Fifth Annual Graph Drawing Con-test, held in conjunction with the 1998 Graph Drawing Symposium inMontreal, Canada. The purpose of the contest is to monitor and chal-lenge the current state of the art in graph-drawing technology [4, 5, 6, 7].
1 Introduction
Text descriptions of the four categories for the 1998 contest are available viathe World Wide Web (WWW) [8]. Approximately 17 submissions were received,including two videos and two live demonstrations. The winners for Categories A–C were selected by a committee of experts (whose names are listed in the ac-knowledgements). The winner for Category D was selected by vote of all thesymposium attendees. Conflicts of interest were avoided on an honor basis. Thewinning entries are described below.
2 Winning Submissions
2.1 Category A
The theme for Category A was incremental/dynamic graph drawing. The dataconsisted of addition and deletion operations that specify how a graph depictinga fragment of the WWW changes over time.
The judging committee did not award a first place in this category. However,two submissions were awarded “Honorable Mention” and split the prize fund.Although the contest rules did not specify a submission format for this category,the two top submissions were both recorded animations.
S.H. Whitesides (Ed.): GD’98, LNCS 1547, pp. 423–435, 1998.c© Springer-Verlag Berlin Heidelberg 1998
424 Peter Eades et al.
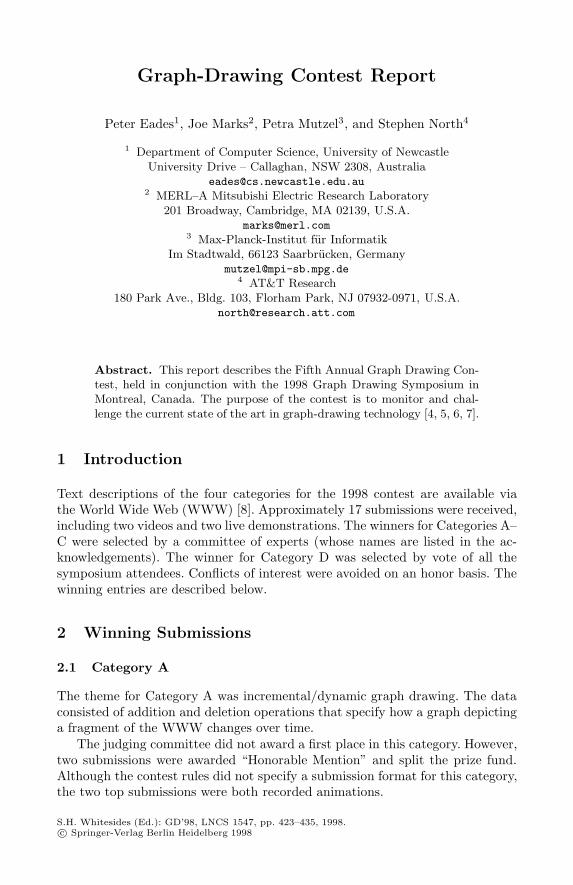
Figure 1 shows a single frame from the submission of U. Brandes ([email protected]), V. Kaab, A. Loh, D. Wagner, and T. Willhalm,University of Konstanz, Germany. They use an energy-based layout algorithmthat produces a straight-line 3D drawing. It favors downward-pointing edgesand penalizes excessive movement between consecutive layouts. In addition, theviewpoint is updated automatically to keep the whole graph in view, to minimizethe change in viewer position, and to avoid occlusions. The actual Web pagesare texture-mapped onto the sides of the cubic nodes, and can be read when theviewer zooms in.
Fig. 1. Honorable mention, Category A (original in color).
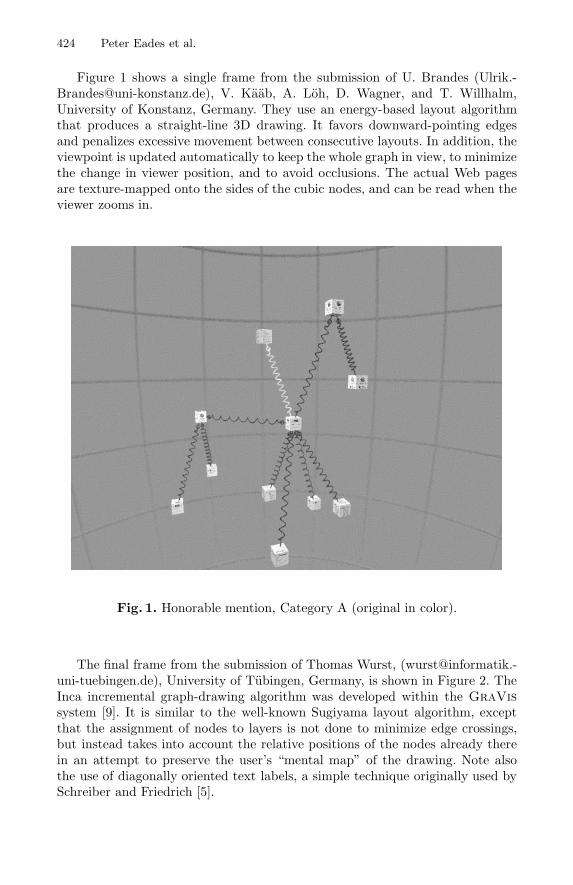
The final frame from the submission of Thomas Wurst, ([email protected]), University of Tubingen, Germany, is shown in Figure 2. TheInca incremental graph-drawing algorithm was developed within the GraVissystem [9]. It is similar to the well-known Sugiyama layout algorithm, exceptthat the assignment of nodes to layers is not done to minimize edge crossings,but instead takes into account the relative positions of the nodes already therein an attempt to preserve the user’s “mental map” of the drawing. Note alsothe use of diagonally oriented text labels, a simple technique originally used bySchreiber and Friedrich [5].
Graph-Drawing Contest Report 425
www.att.com/catalog/consumer
www.att.com
www.att.com/att
www.att.com/write www.att.com/worldnet
www.att.com/terms.html
www.att.com/cgi-bin/ppps.cgi
www.att.com/catalog/small_business
www.att.com/whatsnew
www.att.com/cgi-bin/bmd_cart.cgi
www.att.com/cmd/jump
www.att.com/textindex.html
www.att.com/worldnet/wmis
search.att.com
www.att.com/bmd/jump
www.att.com/features
www.att.com/rock
www.att.com/services
www.att.com/net
www.att.com/bmd/products
www.att.com/news
www.att.com/worldnet/intranet
www.att.com/bmd/custcare
www.att.com/cgi-bin/cart.cgi
www.att.com/cmd
www.att.com/cmd/products
www.att.com/speecheswww.att.com/speeches/index96.html
www.att.com/international
www.att.co.uk
www.att.com/business
www.catalog.att.com/cmd/jump
Fig. 2. Honorable mention, Category A (original in color).
2.2 Category B
The graph for this category was provided by Siemens AG, and is typical of graphsthat arise in the context of computer-integrated manufacturing. The verticesrepresent various states of a manufacturing machine, and the relations betweenthem represent the possible state transitions. Each state transition is modeled asa path of length two with a vertex (smaller than the main vertices) in between.There are also text labels or tags assigned to some of the vertices (main orsubvertices).1 The original hand drawing looked very confusing; approximatelytwo weeks of laborious manual editing were needed to refine it. The refined handdrawing is shown in Figure 3.
The winning drawing is shown in Figure 4. It was produced by VladimirBatagelj and Andrej Mrvar ([Vladimir.Batagelj, Andrej.Mrvar]@uni-lj.si) fromthe University of Ljubljana, Slovenia, using the “Pajek” system [10]. Becausesymmetries in the graph (with some exceptions) were very noticeable, they de-cided to obtain an initial layout using a Fruchterman-Reingold spring embedder.Then they used manual editing (which took three hours) to maximize symme-tries and made some adjustments to take into account the different sizes andshapes of nodes.
1 Meaningless labels were substituted for the actual text to preserve confidentiality.

426 Peter Eades et al.
Fig. 3. Manual drawing of subject graph, Category B.

Graph-Drawing Contest Report 427
1
2 3
4
5
6
7
89
10
11
12
13
14F
152
1
1
1
1
1
2
1
1
1
1
1
12
3 11
2A
2A
3H
1A
3H
2
1
1A
2A 4H
1A
4H
3
0
Tag 1
Tag 2 Tag 3
Tag 4
Tag 5
Tag 6
Tag 7
Tag 8
Tag 9
Tag 10
Tag 11
Tag 12
Tag 13
Tag 14
Tag 15
Tag 16
Tag 17
Tag 18
Tag 19
Tag 20
Tag 21
Tag 22
Tag 23
Tag 24
Tag 25
Tag 26
Tag 27
Tag 28
Tag 29
Tag 30
Tag 31
Tag 32
Tag 33
Tag 34Tag 35
Tag 36
Tag 37Tag 38
Tag 39
Tag 40 Tag 41
Tag 42
Tag 43
Tag 44
Tag 45
Tag 46Tag 47
Tag 48
Tag 49
Tag 50 Tag 51
Tag 52
Tag 53
Tag 54
Tag 55
Tag 56
Tag 57
Tag 58
Tag 59
Tag 60
Tag 61 Tag 62
Tag 63
Tag 64Tag 65
Tag 66
Tag 67
Tag 68
Tag 69Tag 70
Tag 71
Tag 72
Tag 73
Tag 74
Tag 75
Fig. 4. First prize, Category B.
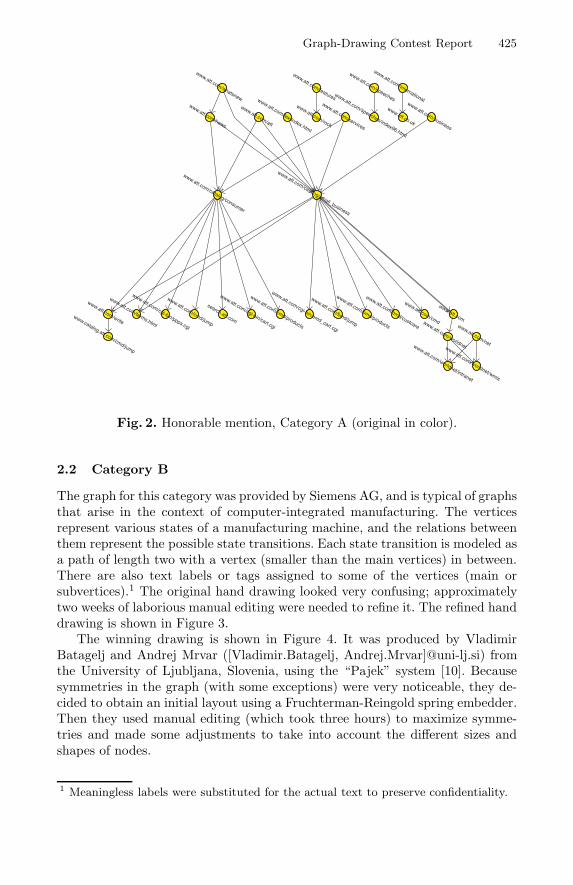
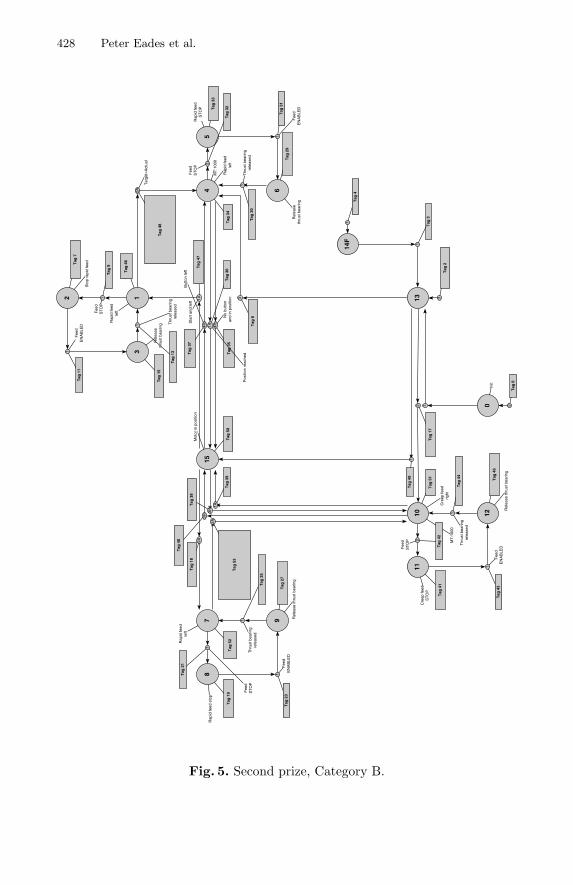
The second-place drawing for Category B is shown in Figure 5. It was submit-ted by Michael Wissen ([email protected]) from the Max-Planck-Institutefor Computer Science, Saarbrucken, Germany. He used a new graph-drawing al-gorithm that is particularly suited to small graphs. The vertex-placement step ofthe algorithm is based on so-called region trees and aims at placing the verticesso that they split some region (see [12]). The labelling step uses a simple greedyalgorithm. The drawing was generated fully automatically.
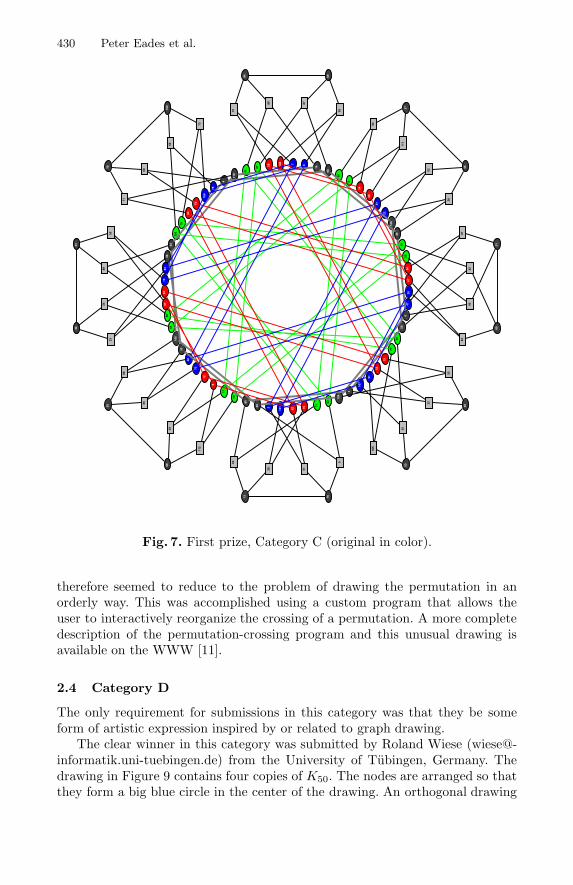
2.3 Category C
The only information given out for Category C was that it involved an elegantgraph of theoretical significance. In fact, the graph has girth 11 (i.e., no cycles oflength less than 11), degree 3, and 112 vertices. A graph with a minimum numberof vertices for a given degree and given girth is a cage. It has been shown recentlythat there are no graphs of girth 11 and degree 3 with fewer vertices. A manualdrawing [1, 2] is shown in Figure 6.
Several researchers reported that they found it very difficult to make senseof this graph using standard graph-layout algorithms. The top two drawingsboth took novel approaches to the analysis and subsequent layout of the graph.First prize was awarded to Petrus Abri Santoso ([email protected]) and Andi
428 Peter Eades et al.
15
Mot
or in
pos
ition
Tag
50
4M
T:1
000
Rap
id fe
edle
ftT
ag 3
4
10
MT
:100
0
Cre
ep fe
edrig
ht
Tag
51
13
7
Rap
id fe
edle
ft
Tag
52
2
Sto
p ra
pid
feedT
ag 7
12
Rel
ease
thru
st b
earin
g
Tag
45
8R
apid
feed
sto
p
Tag
19
14F
11C
reep
feed
ST
OP
Tag
41
3
Rel
ease
thru
st b
earin
gT
ag 1
5
6
Rel
ease
thru
st b
earin
g
Tag
29
1
Rap
id fe
edle
ft
Tag
46
9 Rel
ease
thru
st b
earin
g
Tag
27
5
Rap
id fe
edS
TO
P Tag
33
0In
it
1
Tag
3
2A
Tag
18
4H
No
butto
nan
d in
pos
ition
Tag
35
3H
Tag
40
2A
Tar
get=
Act
ual
Tag
48
4H
But
ton
left
Tag
37
1A
Sta
rt a
nd le
ft
Tag
47
1T
ag 4
9
3H
Tag
38
1A
Pos
ition
rea
ched
Tag
36
2
Tag
17
3
Tag
6
1
Fee
dE
NA
BLE
DT
ag 2
3
1
Fee
dS
TO
P
Tag
9
1
Fee
dE
NA
BLE
DT
ag 4
3
2
Fee
dS
TO
P
Tag
42
1T
hrus
t bea
ring
rele
ased
Tag
30
1
Thr
ust b
earin
gre
leas
ed
Tag
44
2
Fee
dS
TO
P
Tag
32
1
Fee
dE
NA
BLE
D
Tag
31
1
Thr
ust b
earin
gre
leas
ed
Tag
25
1A
Tag
39
1
2A
Tag
53
1
Fee
dE
NA
BLE
DT
ag 1
1
1
Fee
dS
TO
P
Tag
21
1 Thr
ust b
earin
gre
leas
edT
ag 1
3
3
Tag
2
1
Tag
4
2T
ag 0
Fig. 5. Second prize, Category B.

Graph-Drawing Contest Report 429
Fig. 6. Manual drawing of subject graph, Category C.
Surjanto ([email protected]) from the Bina Nusantara University,Jakarta, Indonesia, for the drawing in Figure 7. They began by dividing thegraph nodes according to their eccentricity. Nodes of common eccentricity werepositioned on their own circle. The arrangement and coloring of nodes in eachcircle were then refined to emphasize the symmetry in the graph.
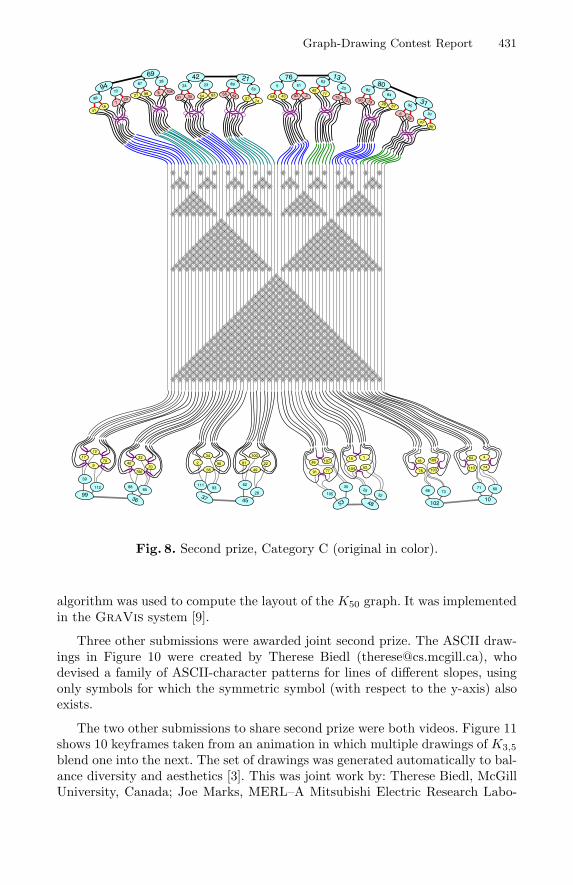
Second prize was awarded to Egon Pasztor ([email protected]), from MERL–A Mitsubishi Electric Research Laboratory, Cambridge, Massachusetts, U.S.A.,and Doris Tsao ([email protected]), from Harvard University, Cambridge,Massachusetts, U.S.A. They began with an analysis of the sums of successivepowers of the graph’s adjacency matrix, which revealed eight exceptional pairsof nodes that were separated by a longer shortest path than all others. By manu-ally separating these nodes and gathering their neighbors, the graph was seen tobe two sets of eight, trilevel binary trees. The leaves of these trees are connectedby 64 edges, which represent an awkward permutation. Drawing the graph well
430 Peter Eades et al.
41
27
29 108 7 8
16
98
90
2
34
56
81
22
100
49
1959
9667
2647
650
46
77
15
52
91
107
1
104
43
11
7592101368
85
79
17
9
12
70
40
33
106
6158
5754
1483
3044
103
18
64
74
109
78
4
110
72
86 87
38
93
111
62
28
97
8295
84
25
32
35
105
5
5120
63
112
39
65
88
23
2489
55
71
60
66
73
94 69
37
45
3180
48
53
7613
99
36
4221
10
102
Fig. 7. First prize, Category C (original in color).
therefore seemed to reduce to the problem of drawing the permutation in anorderly way. This was accomplished using a custom program that allows theuser to interactively reorganize the crossing of a permutation. A more completedescription of the permutation-crossing program and this unusual drawing isavailable on the WWW [11].
2.4 Category D
The only requirement for submissions in this category was that they be someform of artistic expression inspired by or related to graph drawing.
The clear winner in this category was submitted by Roland Wiese ([email protected]) from the University of Tubingen, Germany. Thedrawing in Figure 9 contains four copies of K50. The nodes are arranged so thatthey form a big blue circle in the center of the drawing. An orthogonal drawing
Graph-Drawing Contest Report 431
2650 19
67
8284
80
86
7294
729
4116
5 51
76
5461 30 83
24 23
42
92 368 43
62
28
45
11193
37
2 90
56
81 22
49
34 100
47
659
96
95
97
31
87 38
69
8108
27 9857
58 4414
8955
21 63
20
13
75 101
8511
39
1217
79 9
3340
70106
112 8865
9936
25
53
62
46 107
91 77 104
15
52
1
35
105 32
48
71 60
10
18 109
78 103 110
64 4
74
66 73
102
Fig. 8. Second prize, Category C (original in color).
algorithm was used to compute the layout of the K50 graph. It was implementedin the GraVis system [9].
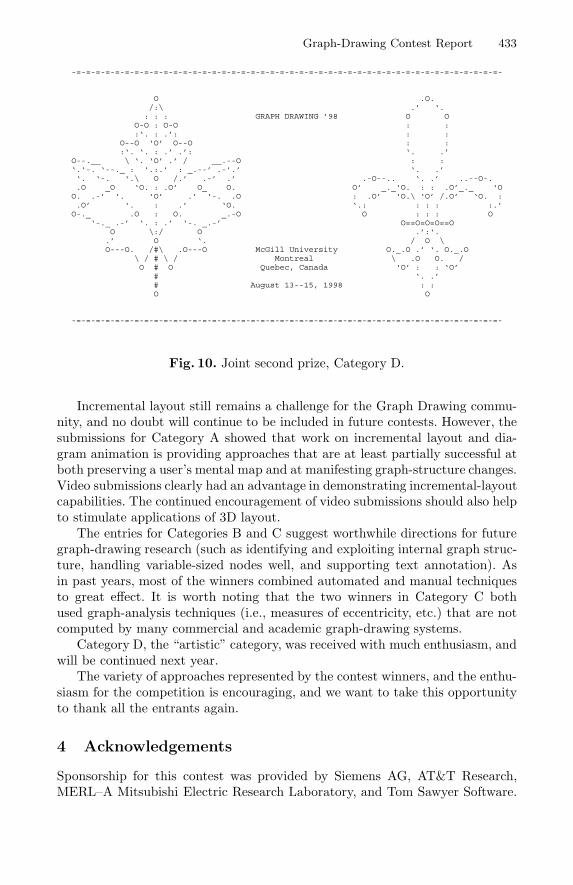
Three other submissions were awarded joint second prize. The ASCII draw-ings in Figure 10 were created by Therese Biedl ([email protected]), whodevised a family of ASCII-character patterns for lines of different slopes, usingonly symbols for which the symmetric symbol (with respect to the y-axis) alsoexists.
The two other submissions to share second prize were both videos. Figure 11shows 10 keyframes taken from an animation in which multiple drawings of K3,5
blend one into the next. The set of drawings was generated automatically to bal-ance diversity and aesthetics [3]. This was joint work by: Therese Biedl, McGillUniversity, Canada; Joe Marks, MERL–A Mitsubishi Electric Research Labo-

432 Peter Eades et al.
ratory, U.S.A. ([email protected]); Kathy Ryall, University of Virginia, U.S.A.;and Sue Whitesides, McGill University, Canada.
Fig. 9. First prize, Category D (original in color).
Figure 12 shows a still from a video depicting a WWW site using an inter-active 3D graph-drawing system called IN3DNET. It was submitted by MarcoSbarrini ([email protected]) and Valerio Violi from the Third University ofRome, Italy.
3 Observations and Conclusions
The exceptionally high quality and originality of this year’s contest submissionsdemonstrates how far the field has progressed in the last few years.
Graph-Drawing Contest Report 433
-=-=-=-=-=-=-=-=-=-=-=-=-=-=-=-=-=-=-=-=-=-=-=-=-=-=-=-=-=-=-=-=-=-=-=-=-=-=-=-=-=-=-=-=-
O .O./:\ .’ ‘.
: : : GRAPH DRAWING ’98 O OO-O : O-O : ::‘. : .’: : :
O--O ‘O’ O--O : ::‘. ‘. : .’ .’: ‘. .’
O--.__ \ ‘. ‘O’ .’ / __.--O : :‘.‘-. ‘--._ : ‘.:.’ : _.--’ .-’.’ ‘. .’‘. ‘-. ‘.\ O /.’ .-’ .’ .-O--.. ‘. .’ ..--O-..O _O ‘O. : .O’ O_ O. O’ _._‘O. : : .O’_._ ‘O
O. .-’ ‘. ‘O’ .’ ‘-. .O : .O’ ‘O.\ ‘O’ /.O’ ‘O. :.O’ ‘. : .’ ‘O. ‘.: : : : :.’
O-._ .O : O. _.-O O : : : O‘-._ .-’ ‘. : .’ ‘-. _.-’ O==O=O=O==O
O \:/ O .’:‘..’ O ‘. / O \O---O. /#\ .O---O McGill University O._.O .’ ‘. O._.O
\ / # \ / Montreal \ .O O. /O # O Quebec, Canada ‘O’ : : ‘O’
# ‘. .’# August 13--15, 1998 : :O O
-=-=-=-=-=-=-=-=-=-=-=-=-=-=-=-=-=-=-=-=-=-=-=-=-=-=-=-=-=-=-=-=-=-=-=-=-=-=-=-=-=-=-=-=-
Fig. 10. Joint second prize, Category D.
Incremental layout still remains a challenge for the Graph Drawing commu-nity, and no doubt will continue to be included in future contests. However, thesubmissions for Category A showed that work on incremental layout and dia-gram animation is providing approaches that are at least partially successful atboth preserving a user’s mental map and at manifesting graph-structure changes.Video submissions clearly had an advantage in demonstrating incremental-layoutcapabilities. The continued encouragement of video submissions should also helpto stimulate applications of 3D layout.
The entries for Categories B and C suggest worthwhile directions for futuregraph-drawing research (such as identifying and exploiting internal graph struc-ture, handling variable-sized nodes well, and supporting text annotation). Asin past years, most of the winners combined automated and manual techniquesto great effect. It is worth noting that the two winners in Category C bothused graph-analysis techniques (i.e., measures of eccentricity, etc.) that are notcomputed by many commercial and academic graph-drawing systems.
Category D, the “artistic” category, was received with much enthusiasm, andwill be continued next year.
The variety of approaches represented by the contest winners, and the enthu-siasm for the competition is encouraging, and we want to take this opportunityto thank all the entrants again.
4 Acknowledgements
Sponsorship for this contest was provided by Siemens AG, AT&T Research,MERL–A Mitsubishi Electric Research Laboratory, and Tom Sawyer Software.

434 Peter Eades et al.
Fig. 11. Joint second prize, Category D.
Fig. 12. Joint second prize, Category D (original in color).
Robin Chen, Henry Kulzer, Brendan McKay, and Gordon Royle contributedgraph data for the contest. Peter Eades, Michael Junger, Joe Marks, PetraMutzel, and Stephen North served on the judging committee. Jan Kratochvilacted as arbiter and auditor.
References
[1] A. T. Balaban. Trivalent graphs of girth nine and eleven and relationships betweencages. Rev. Roum. Math. Pures Appl., 18:1033–1043, 1973.
[2] A. T. Balaban. Solved and unsolved problems in chemical graph theory. In J. Gim-bel, J. Kennedy, and L. Quintas, editors, Quo Vadis, Graph Theory? (Annals ofDiscrete Mathematics, Vol. 55), pages 109–126. 1993.
[3] T. Biedl, J. Marks, K. Ryall, and S. Whitesides. Graph multidrawing: Findingnice drawings without defining nice. In this volume.
Graph-Drawing Contest Report 435
[4] P. Eades and J. Marks. Graph-drawing contest report. In R. Tamassia andI. G. Tollis, editors, Lecture Notes in Computer Science: 894 (Proceedings of theDIMACS International Workshop on Graph Drawing ’94), pages 143–146, Berlin,October 1994. Springer.
[5] P. Eades and J. Marks. Graph-drawing contest report. In F. J. Brandenburg,editor, Lecture Notes in Computer Science: 1027 (Proceedings of the Symposiumon Graph Drawing GD ’95), pages 224–233, Berlin, September 1995. Springer.
[6] P. Eades, J. Marks, and S. North. Graph-drawing contest report. In S. North,editor, Lecture Notes in Computer Science: 1190 (Proceedings of the Symposiumon Graph Drawing GD ’96), pages 129–138, Berlin, September 1996. Springer.
[7] P. Eades, J. Marks, and S. North. Graph-drawing contest report. In G. DiBattista,editor, Lecture Notes in Computer Science: 1353 (Proceedings of the Symposiumon Graph Drawing GD ’97), pages 438–445, Berlin, September 1997. Springer.
[8] http://gd98.cs.mcgill.ca/contest/.[9] http://www-pr.informatik.uni-tuebingen.de/Gravis/Gravis.html.
[10] http://vlado.fmf.uni-lj.si/pub/networks/pajek/.[11] http://www.merl.com/people/pasztor/graphContest.[12] M. Wissen. Automatisches Zeichnen von Zustandsdiagrammen. Master’s thesis,
Diplomarbeit, Fachbereich Informatik, Universitat des Saarlandes, 1998.


