

Green and Sustainable Remediation in
the Navy’s Environmental Restoration
Program
Tanwir Chaudhry, Karla Harre, Issis Rivadineyra
Naval Facilities Engineering Service Center
Russell Sirabian
Battelle Memorial Institute
Environment, Energy Security, & Sustainability Symposium
Denver, CO
June 14-17, 2010

Report Documentation Page Form ApprovedOMB No. 0704-0188
Public reporting burden for the collection of information is estimated to average 1 hour per response, including the time for reviewing instructions, searching existing data sources, gathering andmaintaining the data needed, and completing and reviewing the collection of information. Send comments regarding this burden estimate or any other aspect of this collection of information,including suggestions for reducing this burden, to Washington Headquarters Services, Directorate for Information Operations and Reports, 1215 Jefferson Davis Highway, Suite 1204, ArlingtonVA 22202-4302. Respondents should be aware that notwithstanding any other provision of law, no person shall be subject to a penalty for failing to comply with a collection of information if itdoes not display a currently valid OMB control number.
1. REPORT DATE JUN 2010 2. REPORT TYPE
3. DATES COVERED 00-00-2010 to 00-00-2010
4. TITLE AND SUBTITLE Green and Sustainable Remediation in the Navy’s EnvironmentalRestoration Program
5a. CONTRACT NUMBER
5b. GRANT NUMBER
5c. PROGRAM ELEMENT NUMBER
6. AUTHOR(S) 5d. PROJECT NUMBER
5e. TASK NUMBER
5f. WORK UNIT NUMBER
7. PERFORMING ORGANIZATION NAME(S) AND ADDRESS(ES) Naval Facilities Engineering Service Center,1100 23rd Street,Port Hueneme,CA,93043
8. PERFORMING ORGANIZATIONREPORT NUMBER
9. SPONSORING/MONITORING AGENCY NAME(S) AND ADDRESS(ES) 10. SPONSOR/MONITOR’S ACRONYM(S)
11. SPONSOR/MONITOR’S REPORT NUMBER(S)
12. DISTRIBUTION/AVAILABILITY STATEMENT Approved for public release; distribution unlimited
13. SUPPLEMENTARY NOTES Presented at the NDIA Environment, Energy Security & Sustainability (E2S2) Symposium & Exhibitionheld 14-17 June 2010 in Denver, CO.
14. ABSTRACT
15. SUBJECT TERMS
16. SECURITY CLASSIFICATION OF: 17. LIMITATION OF ABSTRACT Same as
Report (SAR)
18. NUMBEROF PAGES
24
19a. NAME OFRESPONSIBLE PERSON
a. REPORT unclassified
b. ABSTRACT unclassified
c. THIS PAGE unclassified
Standard Form 298 (Rev. 8-98) Prescribed by ANSI Std Z39-18

2
New Executive Order and DoD Guidance
• EO 13514 – October 5, 2009 Federal Leadership in
Environmental, Energy, and Economic Performance
– GSR related major elements: Improve energy efficiency;
reduce GHG emissions, water consumption, & waste
generation; promote renewable energy, recycling, &
community enhancements
• DoD Memorandum August 10, 2009 - Consideration of
Green and Sustainable Remediation (GSR) practices in
the Defense Environmental Restoration Program
– Evaluate opportunities for GSR during all phases of
remediation
– Implement these opportunities when and where these make sense
– Track and report progress

3
What is GSR?
GSR employs strategies for cleanups that:
Use natural resources and energy efficiently
Reduce negative impacts on the environment
Minimize or eliminate pollution at its source
Protect and benefit the community at large
Reduce waste to the greatest extent possible
GSR minimizes the environmental “footprint” of cleanup actions
Environmental footprint refers to the impacts on environmental
media and society

4
Green and Sustainable RemediationDON Programmatic Approach
•DON remains focused on conducting cleanups in accordance with
CERCLA and the NCP
–GSR considerations bring a more holistic approach to site cleanup
while remaining endpoint focused
–Environmental, social, and economic impacts considered during
remedy selection are rolled into existing NCP criteria
• Implementing GSR as part of the DON’s existing optimization
program
–Optimization reviews (required by DON policy) are opportune times
to evaluate green/sustainable methods
–Consider GSR throughout the cleanup process: Key points include
Remedy Selection, Remedial Design, and System Operation
–Consider sustainability when developing performance objectives and
exit strategies

5
Green and Sustainable RemediationDON Programmatic Approach
•DON Optimization Workgroup tasked to develop and promote
GSR approach, implementation, and information
•Emphasized in NAVFAC Technology Transfer Plan for
Environmental Restoration 2010 – 2014
–“Incorporating Optimization and Sustainable Environmental
Remediation Practices” is one of the top 8 technical
challenges
•Communicating efforts with other Federal partners, state
regulators, and industry through FRTR, ITRC, SuRF, & ASTM

6
Where does a Sustainability Evaluation Fit in
the CERCLA Process?
• Nine criteria for detailed analysis of remedial
alternatives
– Overall protection of human health and the
environment
– Compliance with ARARs
– Long-term effectiveness and permanence
– Reduction of toxicity, mobility or volume through
treatment
– Short-term effectiveness
– Implementability
– Cost
– State acceptance
– Community acceptance
• Adverse impacts that may
be posed to workers, the
community, and the
environment during
construction and
operation of the remedy
• Time for remedy
implementation

7
• Minimize environmental footprint of site cleanups
• Most effective stages to apply GSR is during remedy selection and
implementation of exit strategies
• Avoid operating remedial
systems beyond point of
diminishing returns as this
increases environmental
footprint with little remedial
benefit
Incorporating GSR into the Cleanup Process

8
GSR Evaluation Metrics
•DON Optimization Workgroup decided on the following metrics:
–Energy Consumption
–GHG Emissions
–Criteria Pollutant Emissions
–Water Usage
–Worker Safety
–Resource Consumption
• Waste Generation
–Ecological Impacts
–Community Impacts
•For operating remedies, include Kwh used and GHG emission per lb contaminant removed
–Could also include other relevant
metrics
Materials
& WasteEnergy
Core
ElementsAir
Water
Land &
Ecosystems

9
Navy GSR Evaluation Case Studies
•Case studies for lessons learned - 6 completed, 1 in
progress
–Former Naval Air Station (NAS) Alameda, CA (two OUs)
–NAS Meridian, MS
–Marine Corps (MC) Recruit Training Center, Parris Island, SC
–MC Logistics Base, Albany, GA
–Naval Aviation Depot, Norfolk, VA
–Yorktown Fuel Depot, Yorktown, VA (in progress)
•Two case studies in remedial action operation phase
•Five case studies in remedy selection phase

10
Project Approach
1. Determine which sustainability metrics should be considered
for the site;
2. Establish and apply a methodology to quantify or
characterize each metric;
3. Obtain consensus regarding how metrics are weighed
against each other and against traditional criteria in
selecting the remedial approach;
4. Identify methods to reduce environmental footprint of
remedy components; and
5. Prioritize, select, and document what footprint reduction
methods should be implemented with consideration of the
overall net environmental benefit and available funding.

11
Observations from Case Studies - GHG
Emissions
•All case studies
included GHG
emissions - CO2,
CH4, and N20
•Reported as CO2e
•Mostly related to
energy consumption
•For commonly used
in situ remedies
(active), In situ bio
tends to have low
GHG emissions
117 143 205
4036
526
0
500
1000
1500
2000
2500
3000
3500
4000
4500
Enhanced
Bio.
ISCO ISCR ERH Excavation
GH
G (
To
ns)

12
ISCO - GHG Emissions from Various Activities
0.4%
21.9%
2.7%
0.8%
3.1%
71.2%
Well Installation Chem. Production Chem. Injection
Construction & Ops Monitoring LTM
Production of chemicals / supplies used at remediation
sites could have significant contribution for GHG footprint
Two case studies did not include GHG emissions from
production of chemicals / supplies

13
What is Included in GHG Calculation for each
Activity?
•Consumables
•Transportation Personnel
•Transportation Equipment / Materials
•Equipment Use - earthwork, pumps, compressors
•Residual Handling - soil, water, sludge
Well Installation Chem. Production Chem. Injection
Construction & Ops Monitoring LTM

14
850733440
19343
2139
0
5000
10000
15000
20000
25000
Enhanced
Bio.
ISCO ISCR ERH Excavation
En
erg
y (
MW
h)
0
0.05
0.1
0.15
0.2
0.25
0.3
Enhanced Bio. ISCO ISCR ERH Excavation
0
1
2
3
4
5
6
Enhanced Bio. ISCO ISCR ERH Excavation
NO
X (t
on
s)
0.0E+00
5.0E+05
1.0E+06
1.5E+06
2.0E+06
2.5E+06
3.0E+06
3.5E+06
4.0E+06
4.5E+06
Enhanced
Bio.
ISCO ISCR ERH Excavation
Wa
ter
Us
e (
ga
l)
Other Metrics from Case Studies
Energy
InjuryWater Usage
Air Pollutants

15
Typical High Footprint Activities
Activity Metrics Most Impacted
Transportation for materials and waste
as well as personnel during RA-O &
LTMgt
Emissions of GHGs, criteria pollutants,
consumption of energy, accident risk
(particularly death)
Operation of mechanical equipment
(e.g. pumps, blowers, compressors)
Emissions of GHGs, criteria pollutants,
consumption of energy
Drilling/Well installation Emissions of GHGs, criteria pollutants,
consumption of energy, accident risk
(particularly injury)
Consumption of chemicals or other
materials (e.g. oxidants, ZVI,
biostimulants, GAC)
Emissions of GHGs, consumption of
energy

16
SiteWiseTM
•SiteWiseTM Tool - released May 2010
•Collaborative effort between Army, Navy, and Battelle
•Calculates the environmental footprint of remedial alternatives
•MS Excel-based
•Metrics evaluated:
–Greenhouse gases
–Air quality parameters
–Energy consumption
–Water consumption
–Worker accident risk
•No cost for use
•Available to the public at
http://www.ert2.org/t2gsrportal
0
50
100
150
200
250
Alternative 1:
AS/SVE with Biosparging
Alternative 2:
Excavation and AS/SVE
with Biosparging
Alternative 3:
Excavation with MNA
GH
G F
oo
tpri
nt
(Metr
ic t
on
CO
2e) Excavation Equipment Use
AS/SVE Equipment Use
Transportation
Well Installation
Excavation Equipment Use
AS/SVE Equipment Use
Transportation
Well Installation
GHG Footprint of the Remedial Alternatives
Considered at NAS Meridian

17
SiteWiseTM Data Input Sheet
Yellow cells
MATERIAL PRODUCTION p For inputting data for other options in Material Production, please check this box.
WELL MATERIALS Input number of wells Input depth of wells (ft) Choose well diameter (in) from drop down menu Choose material Wpe from drop down menu Choose s ific material schedule from dro down menu
Well Type 1 Welllype2
1/2 1/2 Steel Steel
Schedule 40 Steel Schedule 40 Steel
Treatme1rt 1 Treatme1rt 2

18
SiteWiseTM Calculation
PUMP OPERATION - For each pump, select only one of the three methods to calculate energy and GHG emissions
Enter "0" for all user input values for unused pumps or unused methods
USER INPUT Pump 1 Pump 2 Pump 3 Pump 4
Method 1 - IF NAME PLATE SPECIFICATIONS ARE KNOWN
USER INPUT Input Pump horsepower (hp) 0 0 1 5
USER INPUT Input Number of pumps operating 1 0 2 6
USER INPUT Input Operating Time for each pump (hrs) 10 0 3 7
Input Pump Load 0.8 0.8 0.8 0.8
Input Pump Motor Efficiency 0.9 0.9 0.9 0.9
Method 2 - IF PUMP HEAD IS KNOWN
USER INPUT Input flow rate (gpm) 0 0 0 0
USER INPUT Input total head (ft) 0 25 0 0
USER INPUT Input Number of pumps operating 0 1 0 0
USER INPUT Input Operating Time for each pump (hrs) 0 4 0 0
Input pump Efficiency 0.6 0.6 0.6 0.6
Input specific gravity 1 1 1 1
Pump horsepower (hp) 0.00 0.00 0.00 0.00
Method 3 - IF ELECTRICAL USAGE IS KNOWN
USER INPUT Input Pump Electrical Usage (KWh) 1000 0 0 0
Select Region
USER INPUT Choose Region from Figure 1 AKGD AKMS AZNM CAMX
CO2 emission factor (lb/MWH) 1232 499 1311 724
CH4 emission factor (lb/MWH) 0.0256 0.02075 0.01745 0.03024
N2O emission factor (lb/MWH) 0.00651 0.00408 0.01794 0.00808
NOx emission factor (lb/MWH) 2.480 6.791 2.111 0.618
SOx emission factor (lb/MWH) 1.214 0.526 1.081 0.531
ENERGY OUTPUT
Energy Usage (KWh) 1.0E+03 0.0E+00 4.0E+00 1.4E+02
Energy Usage (MWH) 1.0E+00 0.0E+00 4.0E-03 1.4E-01
Energy Usage (BTU) 8.5E+06 0.0E+00 3.4E+04 1.2E+06
CO2 OUTPUT
CO2 emission (metric ton) 5.6E-01 0.0E+00 2.4E-03 4.6E-02
N2O emission (metric ton CO2 e) 9.2E-04 0.0E+00 1.0E-05 1.6E-04
CH4 emission (metric ton CO2 e) 2.4E-04 0.0E+00 6.6E-07 4.0E-05
NOx and SOx OUTPUT
NOx emission (metric ton) 1.1E-03 0.0E+00 3.8E-06 3.9E-05
SOx emission (metric ton) 5.5E-04 0.0E+00 2.0E-06 3.4E-05
TOTAL FROM PUMP OPERATION
CO2 Emission (metric ton) 6.1E-01
Energy Used (MWh) 1.1E+00
Energy Used (MMBTU) 9.8E+00
Water Usage (gal) 5.8E+02
NOx Emission (metric ton) 1.2E-03
SOx Emission (metric ton) 5.9E-04
19
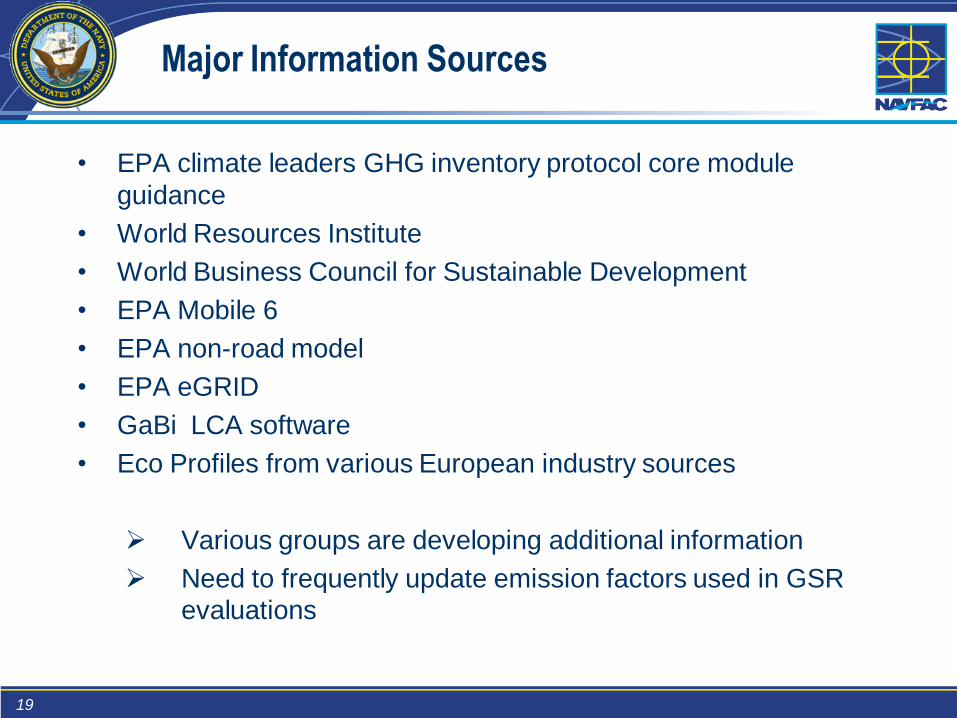
Major Information Sources
• EPA climate leaders GHG inventory protocol core module
guidance
• World Resources Institute
• World Business Council for Sustainable Development
• EPA Mobile 6
• EPA non-road model
• EPA eGRID
• GaBi LCA software
• Eco Profiles from various European industry sources
Various groups are developing additional information
Need to frequently update emission factors used in GSR
evaluations

20
DON GSR Web Portal
Available at www.ert2.org
HOME · WEB TOOL · FACT SHEET · CASE STUDIES · DRIVERS · RESOURCES · TOOLS · CONTACT
Welcome to the tlavy's Web site on green and sustainable remediation. This Web site provides useful links on available information, case studies, and Web tools on sustainable practices for remediation.
Web Tool: A Web-based mult1-media tool on green and suslamable remediation thai discusses sustamab11ily, sustamable remed1at10n, and regulatory drivers for considering green and suslamable remediation. The Web tool available alth1s location also discusses sustainable remed1at1on metrics, tools, and enwonmental footpnnt reduction methodologies
Fact Sheet: In August 2009. the NAVFAC OptimiZation Workgroup 1ssued a fad sheet on sustamable enVIronmental remed1at1on. The fad sheet summanzes the need for considenng sustainable practices by Navy Remedial Project Managers (RPI,Is) and lays out the metncs of green and sustamable remed1at1on as per the Workgroup. The fad sheet also discusses methodologies to conduct baseline environmental footpnnt of remedial technologies and ways to reduce the footprint
Case Studies: NAVFAC has applied sustamabH1ty concepts on several ex1stmg and planned remedial systems The case studies on this Web page proVIde a few examples
Drivers: There are several regulations and mcenbves that are driVIng the Industry towards green and sustamable remediation. This Web page discusses some of the regulations and execut1ve orders that mandate federal agenoes to conserve energy and to be more sustainable
Resources: There are guidance documents. case studies and standards available on green and sustamable remed1at1on on several federal, state, and other orgamzations This Web page conta1ns lmks to many of these informational sites
Tools: There are several tools available m the public domain for condudmg a baseline enVIronmental footpnnt of a remedial technology S1teW1se"" being developed JOintly by the Navy. Army Corps, and Battelle IS one of such tools and Will be available on th1s s1te soon
HOME WEB TOOL fACT SHEET CASE STUDIES DRIVERS RESOURCES TOOLS CONTACT

21
Green and Sustainable Remediation Fact
Sheet and Web Training Tool
Issued August 2009 by the DON Optimization Workgroup
Fact sheet available from:
http://www.ert2.org/t2gsrportal
Sustainability metrics
Footprint assessment methods
Incorporating GSR into the
Environmental Restoration Process
Footprint reduction methods
22
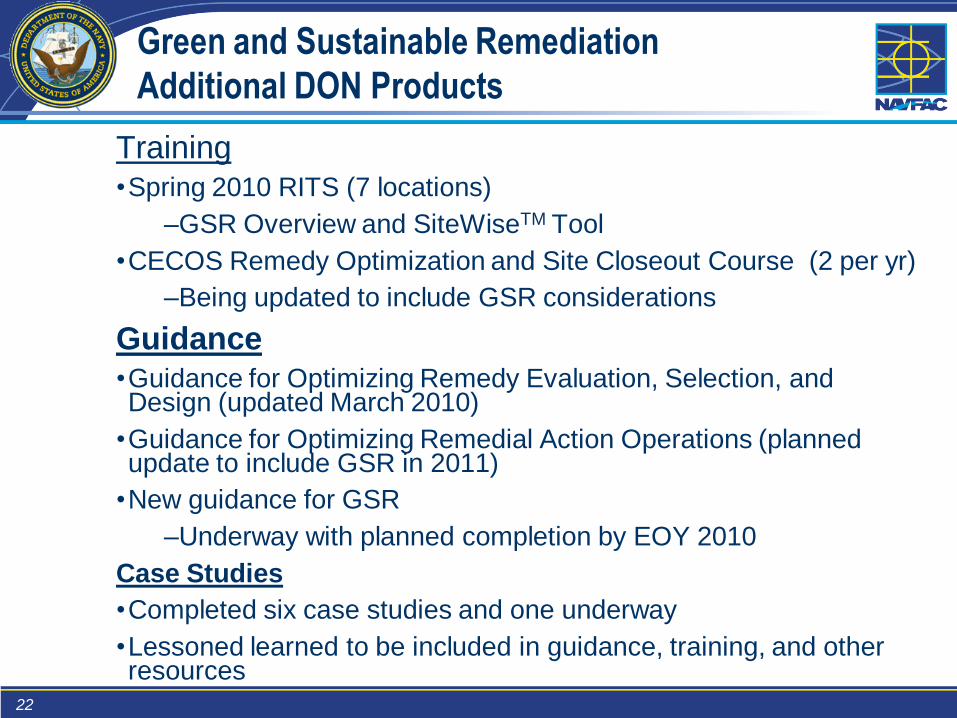
Green and Sustainable Remediation
Additional DON Products
Training
•Spring 2010 RITS (7 locations)
–GSR Overview and SiteWiseTM Tool
•CECOS Remedy Optimization and Site Closeout Course (2 per yr)
–Being updated to include GSR considerations
Guidance
•Guidance for Optimizing Remedy Evaluation, Selection, and Design (updated March 2010)
•Guidance for Optimizing Remedial Action Operations (planned update to include GSR in 2011)
•New guidance for GSR
–Underway with planned completion by EOY 2010
Case Studies
•Completed six case studies and one underway
•Lessoned learned to be included in guidance, training, and other resources

23
Summary
•DON aggressively taking actions to integrate green and
sustainable practices within all phases of remediation
•DON Optimization workgroup developing resources
•SiteWiseTM is a valuable tool for quantifying the environmental
footprint of remedial alternatives
•DON metrics include GHG emissions, energy usage, criteria air
pollutants, ecological impacts, water usage, resource
consumption, worker safety, and community impacts
•DON working with other agencies for sharing lessons learned
and developing consistent approaches
•DON developing a guidance for evaluating and implementing
GSR

24


