
Page 1 of 25
Greenhouse Gas (GHG) Emissions Inventory
Fiscal Year 2010
Prepared by the Office of Sustainability for the
Environmental Advisory Council
Page 2 of 25
Environmental Advisory Council Members
Kyle Altmann Associate Professor, Physics Robert Buchholz Director of Physical Plant Brian Collins Associate Director of Residence Life for Community Building and Residential Education Elaine Durr Sustainability Coordinator Andrew Fischer Student Representative, Class of 2014 Michele Kleckner Senior Lecturer, Computing Sciences Brad Moore Associate Director of Planning, Design and Construction Management Alison Morrison-Shetlar Dean, Elon College, the College of Arts and Sciences and Professor of Biology Gary Palin Senior Lecturer in Entrepreneurship and Executive Director of the Doherty Center for Entrepreneurial Leadership Lindsay Spiers Student Representative, Class of 2013 Gerald Whittington, Chair Senior Vice President for Business, Finance and Technology
Page 3 of 25
Acknowledgments
Elon University’s third annual greenhouse gas inventory was completed with the assistance of Benjamin
Stanley, sustainability intern for summer 2010, who collected and analyzed the data. In addition, the
inventory could not have been completed without the cooperation and assistance of those who
provided the necessary data, guidance throughout the process and assistance with data collection and
analysis. Listed alphabetically, they are:
Erin Andrews
Jeff Baisley
Kristin Barrier
Kim Bradsher
Kathryn Bennett
Loura Burnette
David Cooper
Keith Dimont
Cindy Duke
Jeanne Duvall
Andrea Edwards
Kelly Elliston
Christina Esters
Peter Felten
Tom Flood
Mary Gowan
Barbara Guy
Jeff Hendricks
Steven House
Paul Holt
Smith Jackson
Denard Jones
Taylor Jones
Ryan Kirk
Susan Klopman
Deirdre Lea
Susan Lindley
Michelle Martin
Ron Morgan
Alison Morrison-Shetlar
Louise Newton
Paul Parsons
Tim Peeples
Phyllis Phillips
Jim Piatt
Larry Rhodes
Celeste Richards
Elizabeth Rogers
Jan Schneider
Rob Springer
Benjamin Stanley
Paige Vignali
Kim Werr
Carolyn Whitley
Gerald Whittington
Kyle Wills
Mary Wise
Dave Worden
Greg Zaiser
Amanda Zamzes
Thank you for your assistance and support.
Page 4 of 25
Table of Contents
Executive Summary ........................................................................................... 5
Background ........................................................................................................ 9
Methodology ..................................................................................................... 9
Data and Analysis .............................................................................................. 10
GHG Emissions ................................................................................................... 15
Inventory Comparison ....................................................................................... 17
Summary ........................................................................................................... 20
Appendix
A. Comparison between 2008 and 2010 Commuter Habit Survey Results .... 23
Page 5 of 25
Executive Summary
The overarching goal of Elon University’s Sustainability Master Plan (2006-2007) is “to minimize our
impact on the global environment by establishing a carbon neutral university.” Calculating the
university’s greenhouse gas (GHG) emissions or carbon footprint is one of the essential steps in
establishing a carbon neutral university. Elon’s first GHG inventory was conducted for fiscal year (FY)
2008 and serves as Elon’s baseline from which to measure reductions in emissions. A yearly GHG
inventory is needed to monitor progress toward Elon’s emission reduction goals.
The current version (Version 6.6) of the Clean Air-Cool Planet (CA-CP) Campus Carbon Calculator was
used to calculate Elon’s emissions for FY 2010. This Calculator includes updated constants and emission
factors. As with previous versions of the Calculator, it includes all of the primary components of a GHG
inventory: Scope 1, 2 and 3 emissions as well as offsets. The data collection process for FY 2010 was
conducted in the same way as the FY 2009 inventory.
Elon’s total GHG emissions for 2010 were 40,057 metric tons of carbon dioxide equivalents (MTCDE)
(Figure 1). The net GHG emissions for 2010 were 39,961 MTCDE due to an offset of 96 MTCDE for yard
waste composting. Elon’s net GHG emissions per full-time equivalent (FTE) student were 7.2
MTCDE/student and per building square foot (ft2) were 0.02 MTCDE/ft2 or 20.6 kg of carbon dioxide
equivalents (eCO2) per ft2.
To facilitate a comparison across the three years a GHG inventory has been conducted, the FY 2008 and
FY 2009 inventories were updated using the v6.6 Calculator. See Figure 2 for the category breakdown by
metric tons of eCO2 for all three years. The primary differences between the updated FY 2008 and FY
2009 inventories and the emissions previously reported using the v6.4 Calculator are in Directly
Financed Travel, which primarily includes faculty and staff business travel, and Student Commuting.
These changes are the result of updating the methodology for data analysis used for these categories to
be more reflective of activity during the fiscal year.
Elon’s GHG emissions decreased 4.60% from FY 2008 to FY 2010 primarily from a decrease in energy
consumption and student commuting and fewer students studying abroad through Elon Programs. From
FY 2009 to FY 2010, emissions decreased slightly, 0.29%. Student Commuting decreased; however,
Directly Financed Travel increased.
Page 6 of 25
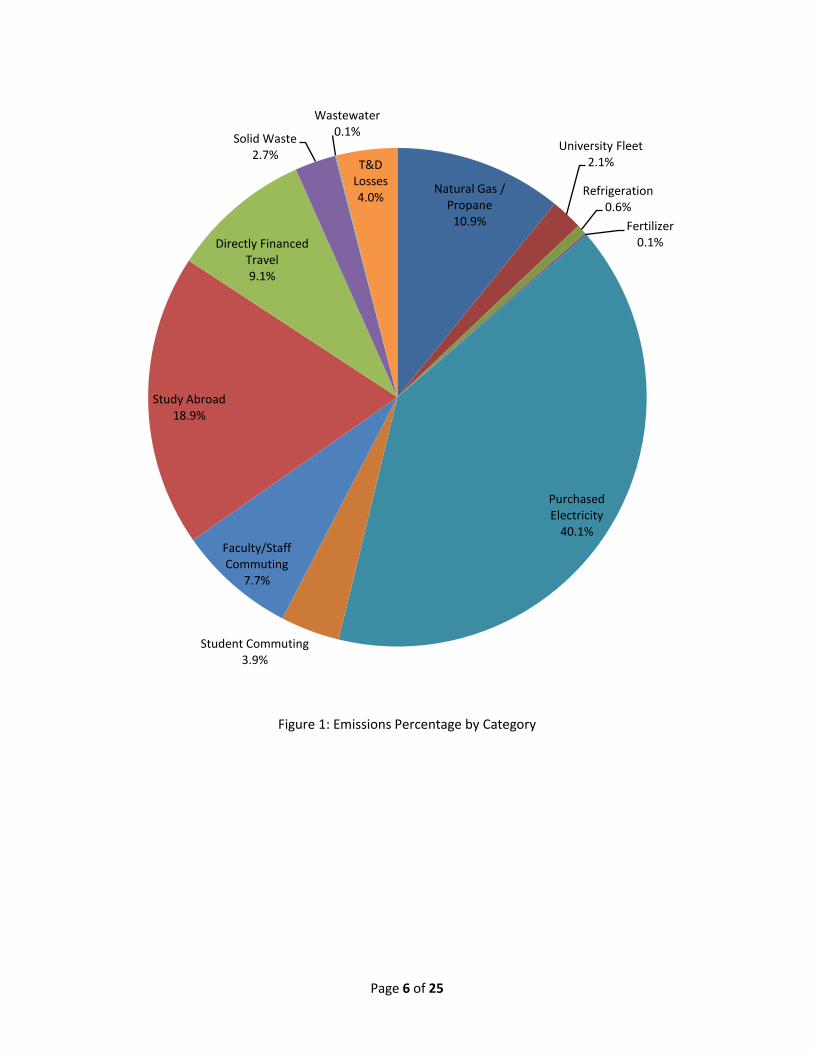
Figure 1: Emissions Percentage by Category
Natural Gas / Propane
10.9%
University Fleet2.1%
Refrigeration0.6%
Fertilizer0.1%
Purchased Electricity
40.1%
Student Commuting3.9%
Faculty/Staff Commuting
7.7%
Study Abroad18.9%
Directly Financed Travel9.1%
Solid Waste2.7%
Wastewater0.1%
T&D Losses4.0%
Page 7 of 25
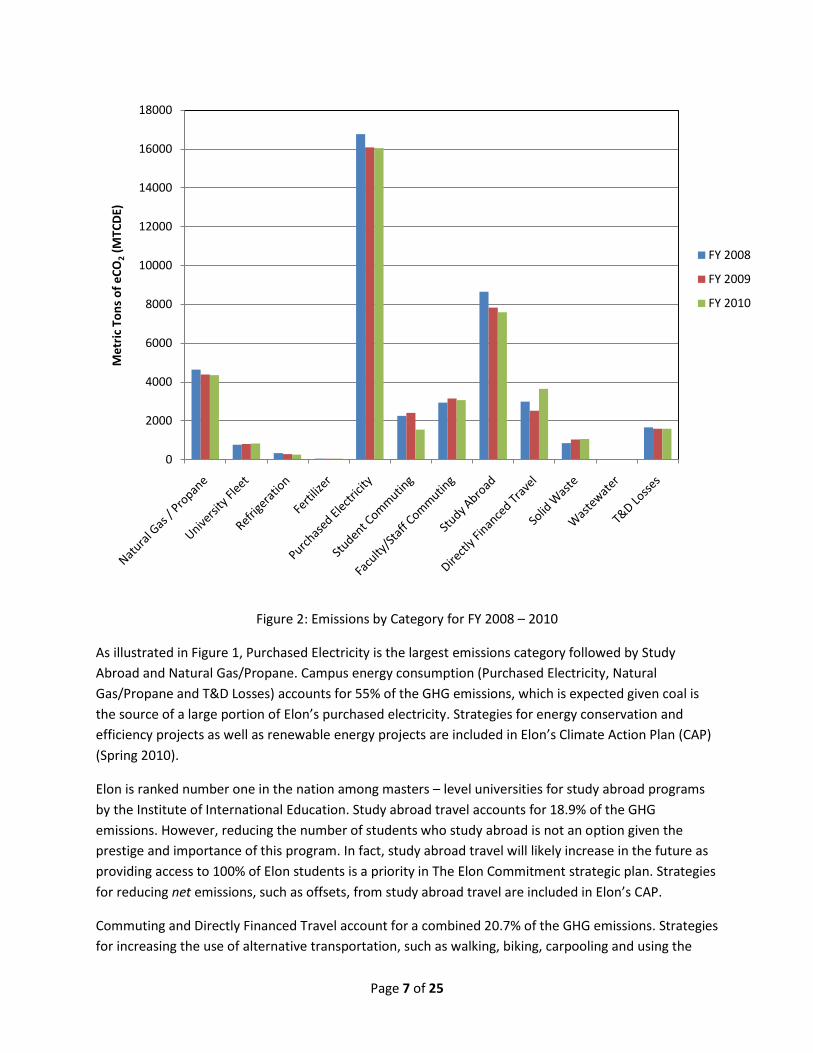
Figure 2: Emissions by Category for FY 2008 – 2010
As illustrated in Figure 1, Purchased Electricity is the largest emissions category followed by Study
Abroad and Natural Gas/Propane. Campus energy consumption (Purchased Electricity, Natural
Gas/Propane and T&D Losses) accounts for 55% of the GHG emissions, which is expected given coal is
the source of a large portion of Elon’s purchased electricity. Strategies for energy conservation and
efficiency projects as well as renewable energy projects are included in Elon’s Climate Action Plan (CAP)
(Spring 2010).
Elon is ranked number one in the nation among masters – level universities for study abroad programs
by the Institute of International Education. Study abroad travel accounts for 18.9% of the GHG
emissions. However, reducing the number of students who study abroad is not an option given the
prestige and importance of this program. In fact, study abroad travel will likely increase in the future as
providing access to 100% of Elon students is a priority in The Elon Commitment strategic plan. Strategies
for reducing net emissions, such as offsets, from study abroad travel are included in Elon’s CAP.
Commuting and Directly Financed Travel account for a combined 20.7% of the GHG emissions. Strategies
for increasing the use of alternative transportation, such as walking, biking, carpooling and using the
0
2000
4000
6000
8000
10000
12000
14000
16000
18000M
etr
ic T
on
s o
f e
CO
2(M
TCD
E)
FY 2008
FY 2009
FY 2010
Page 8 of 25
Elon Bio-buses are included in the CAP. Web-conferencing and combining trips through scheduling could
also help reduce emissions from faculty and staff business travel
In addition to projects and programs that can be implemented to affect campus operations and
behavior, other strategies, mainly offsets, will also need to be considered to reach carbon neutrality. An
offset is a reduction of carbon dioxide or removal of carbon dioxide equivalent (eCO2) GHG emissions
that is used to counterbalance or compensate for (“offset”) emissions from other activities. There are
different options for investing in offsets such as purchasing offset credits (retail or wholesale) from
third-party providers with varying project types, investing in projects directly (without a third-party
provider) and developing projects independently. Offset options that seem more likely are purchasing
retail offset credits and investing in projects directly. However, utilizing offsets for all of Elon’s net GHG
emissions would not be an effective use of financial resources. The intention is to utilize offsets only
after reducing emissions on campus as much as possible.
The FY 2010 GHG inventory indicates progress toward the University’s goal of carbon neutrality as
identified in the Sustainability Master Plan. However, as noted in the CAP, the University’s planned
growth will prove challenging for continued emission reductions. Therefore, it is critical to continue
implementation of the strategies identified in the CAP to reduce emissions in the coming years. The CAP
will be revised as necessary to take new technologies, incentives and developments into consideration.
A GHG inventory will continue to be conducted yearly to monitor progress toward Elon’s emission
reduction goals.
Page 9 of 25
Background
The overarching goal of Elon University’s Sustainability Master Plan completed in the spring of 2007 is
“to minimize our impact on the global environment by establishing a carbon neutral university.” This
goal requires the elimination of net carbon emissions or greenhouse gas (GHG) emissions. The
recommended timeframe for this goal is within the next 30 years from 2007, so by 2037. As a primary
step toward this goal, Elon’s first GHG inventory was conducted for fiscal year (FY) 2008. FY 2008 serves
as Elon’s baseline from which to measure reductions in emissions. This initial inventory guided the
creation of Elon’s Climate Action Plan (CAP) (Spring 2010) or roadmap for carrying out projects to reduce
emissions. To monitor progress toward Elon’s emission reduction goals, a GHG inventory is conducted
yearly.
What follows is an explanation of the methodology used to conduct the FY 2010 GHG inventory, the
calculated amount of emissions from each source, a comparison between the FY 2008, FY 2009 and FY
2010 inventories and a summary of Elon’s GHG emissions for FY 2010.
Methodology
As with the previous GHG inventories, the Clean Air-Cool Planet (CA-CP) Campus Carbon Calculator was
used to calculate Elon’s GHG emissions. The current version of the Calculator was used, Version 6.6. Like
the previous versions of the Calculator, the Clean Air-Cool Planet v6.6 Calculator analyzes the
university’s GHG emissions including Scope 1, 2 and 3 emissions as well as offsets and provides the total
amount of carbon dioxide equivalent emissions (eCO2).
Scope 1 is direct emissions, such as production of electricity on campus and university vehicles.
Scope 2 emissions come from imported sources of energy, i.e., purchased electricity or steam.
Scope 3 is all other indirect sources of emissions, such as business travel, commuter travel and
solid waste generation.
An offset is a reduction of carbon dioxide or removal of carbon dioxide equivalent (eCO2) GHG
emissions that is used to counterbalance or compensate for (“offset”) emissions from other
activities.
The v6.6 Calculator includes updated constants and emission factors based on the most current data
available when the Calculator was developed. As with previous inventories, the boundaries for Elon’s FY
2010 GHG inventory are all directly financed emissions and directly encouraged emissions such as study
abroad. Scope 3 upstream emissions, such as paper purchasing, are not included at this time.
The data collection process for the FY 2010 inventory was conducted in the same way as the FY 2009
inventory. The list of contact people created as a result of the FY 2008 and FY 2009 inventories was
used. Each person was contacted via email and asked to provide the relevant information. Overall, this
process went well because the contact people knew what to expect based on previous years. A few
personnel changes occurred, which resulted in a new contact person for some categories. The
methodology used for FY 2009 was replicated for FY 2010 with a few changes in methodology for data
analysis as noted below.
Page 10 of 25
The methodology for two categories – Directly Financed Travel and Commuter Travel – was slightly
modified in an effort to be more reflective of activity during the fiscal year. Directly Financed Travel
includes faculty and staff business travel and athletic team travel; however, faculty and staff business
travel makes up the majority of the emissions in this category. The methodology used to determine
flight miles from dollars spent on flights was revised. In previous inventories $0.25 per mile was used as
recommended by the Implementation Guide of the American College and University Presidents Climate
Commitment. This factor was revised based on the most recent calendar year data on flight costs from
the U.S. Department of Transportation and the Security and Exchange Commission. The methodology
used to determine gallons of gasoline from dollars spent on gasoline was revised. In previous inventories
the average annual price for unleaded fuel for used to determine the fiscal year average. This was
revised to be more reflective of fuel prices throughout the fiscal year by using the monthly average price
for all grades of fuel and calculating an average based on the months in the fiscal year. These revised
methodologies were applied to the previous year’s inventories to enable more accurate year to year
comparisons.
Commuter Travel includes faculty, staff and student commuting travel to and from campus. For FY 2010,
a new commuter habit survey was conducted and another Geographic Information Systems (GIS)
analysis was done to identify changes in commuter habits and travel distances. The commuter habit
survey was created and distributed with the assistance of Institutional Research. The questions and
format were modified from the survey conducted in 2008. The primary change was that only off campus
students answered questions about regular commuting to and from campus. (To allow comparisons, the
data inputs from the 2008 survey were revised to only include off campus students.) Questions
answered by on campus students provide valuable information regarding transportation habits and use
of alternative transportation and inform program development. The results of the commuter habit
survey were used to determine the average mileage traveled, number of trips per week and what
percentage travel by various methods (car, bus and carpool).
A Geographic Information Systems (GIS) analysis was done by an Elon student and faculty member using
faculty and staff anonymous addresses to generate an average one-way travel mileage (for faculty and
staff) for the Elon campus, the Law School campus and the campuses combined. In 2008, the Elon
campus was used as the travel destination for all faculty and staff combined.
Data and Analysis
The following is a summary of the data:
Institutional Information o Operating and energy budget o Student enrollment o Square footage o Faculty and staff population
Scope 1 o Natural gas purchase records (therms)
o Propane purchase records (gallons)
Page 11 of 25
o Gasoline purchase records for university tanks (gallons)
o Fuelman card gasoline purchase records (gallons)
o Off-road diesel purchase records (gallons)
o Biodiesel purchase records (gallons)
o Fertilizer application records (pounds)
o Refrigerant usage records (pounds)
Scope 2 o Electricity purchase records (kilowatt hours)
Scope 3 o Athletic team charter bus and air travel records (destinations) o Solid waste records (tons)
o Wastewater records (gallons)
o Study abroad records (number of students in each program, flight information)
o Faculty and staff travel
Destinations and/or mileage from some departments/divisions
Procurement card records for gasoline purchases (dollars)
Procurement card records for airfare purchases (dollars)
Airfare object code report (dollars)
o Commuter travel GIS analysis of faculty and staff anonymous addresses to determine an average
mileage Commuter habit survey results
o Transmission and distribution (T&D) losses of purchased electricity Determined in the Calculator from the amount of electricity purchased
Offset o Yard waste composting (tons)
Most of this data was provided in the form needed to enter it into the CA-CP Campus Carbon Calculator. A few categories required a unit conversion or other analysis to arrive at the correct unit or information needed. They are as follows:
Natural gas purchase records – therms were converted to MMBtu.
Procurement card records for gasoline purchases – dollars spent were converted to gallons using an average price for all grades of gasoline in conventional areas of $2.67 derived from the Energy Information Association’s national averages for the months during FY 2010. For faculty and staff travel, miles traveled was the input required for the Calculator, so the estimated usage in gallons was converted to miles using the average fuel efficiency referenced in the Calculator, 22.10 miles per gallon.
Study abroad records – the air miles for each Elon program were determined using an online air mileage calculator tool, www.milecalc.com. The Raleigh-Durham International Airport (RDU) was used as the origination airport when more specific information was not available. The number of air miles for each program was multiplied by the number of students in each program. The air miles for all programs were totaled by term (fall, winter, spring and summer).
Athletic team travel and faculty and staff travel – when destinations were provided, www.milecalc.com was used to determine air miles and Google Maps or www.mapquest.com was used to determine vehicle miles as appropriate.
Page 12 of 25
Procurement card records for airfare purchases – dollars spent were converted to air miles using $0.1158 per mile based on flight cost data for 2009 from the U.S. Department of Transportation and the Security and Exchange Commission.
Airfare object code report – dollars spent were converted to air miles using $0.1158 per mile. This information was only used when information was not available through departmental travel records and/or procurement card purchase records.
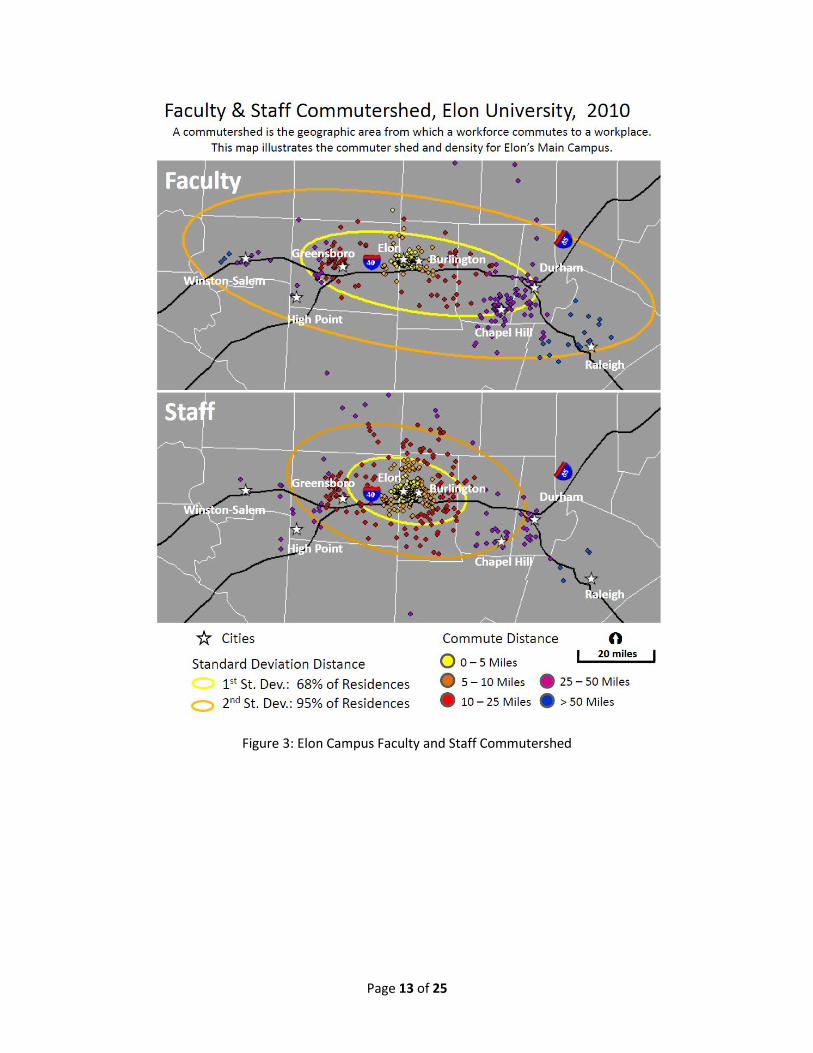
The GIS analysis used for the commuter travel category was more involved. It was conducted by an Elon
student, Taylor Jones (Public Administration Major, GIS Minor), and an Elon faculty member, Ryan Kirk
(Geography and Environmental Studies), in the fall of 2010. Anonymous faculty and staff addresses as of
September 2, 2010 (October 21, 2010 for Law School faculty and staff) were provided by Deirdre Lea in
Human Resources. For the GIS analysis, commuting distances were calculated as the shortest travel
route from the nearest road for each residence to the edge of the Elon campus property or as the
shortest road distance to the intersection nearest the Law School campus as appropriate. Given this, all
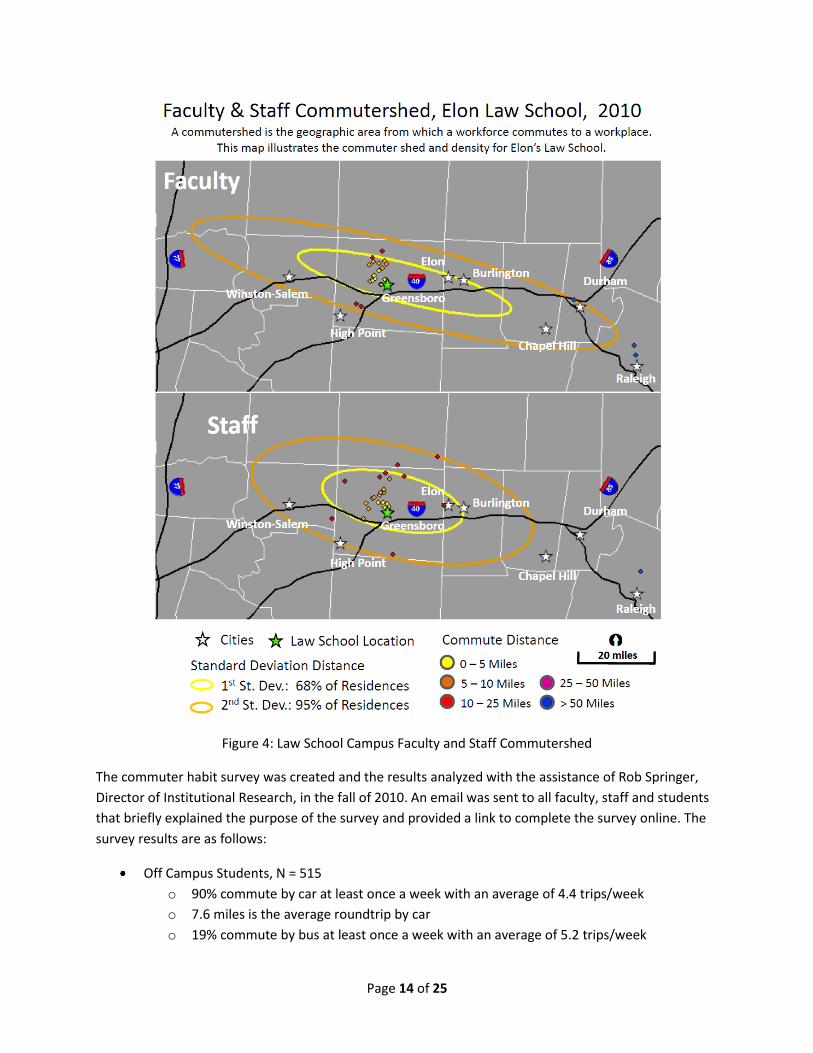
campus addresses were given a distance of zero. The mean travel distance to the Elon campus is 13.3
miles, and the median distance is 8.0 miles (Figure 3). The mean travel distance to the Law School
campus is 11.0 miles, and the median distance is 6.0 miles (Figure 4). For both campuses, 40.4% of
faculty and staff live within 5 miles, 59.4% within 10 miles, 82.1% within 25 miles and 97.8% within 50
miles. For comparison purposes, the GIS analysis conducted in 2008 indicated a mean travel distance of
12.6 miles and median distance of 6.7 miles. It showed that 42% of faculty and staff lived within 5 miles,
58% within 10 miles, 83% within 25 miles and 98% within 50 miles. The 2008 analysis used the Elon
campus as the destination for all addresses.
Page 13 of 25
Figure 3: Elon Campus Faculty and Staff Commutershed
Page 14 of 25
Figure 4: Law School Campus Faculty and Staff Commutershed
The commuter habit survey was created and the results analyzed with the assistance of Rob Springer,
Director of Institutional Research, in the fall of 2010. An email was sent to all faculty, staff and students
that briefly explained the purpose of the survey and provided a link to complete the survey online. The
survey results are as follows:
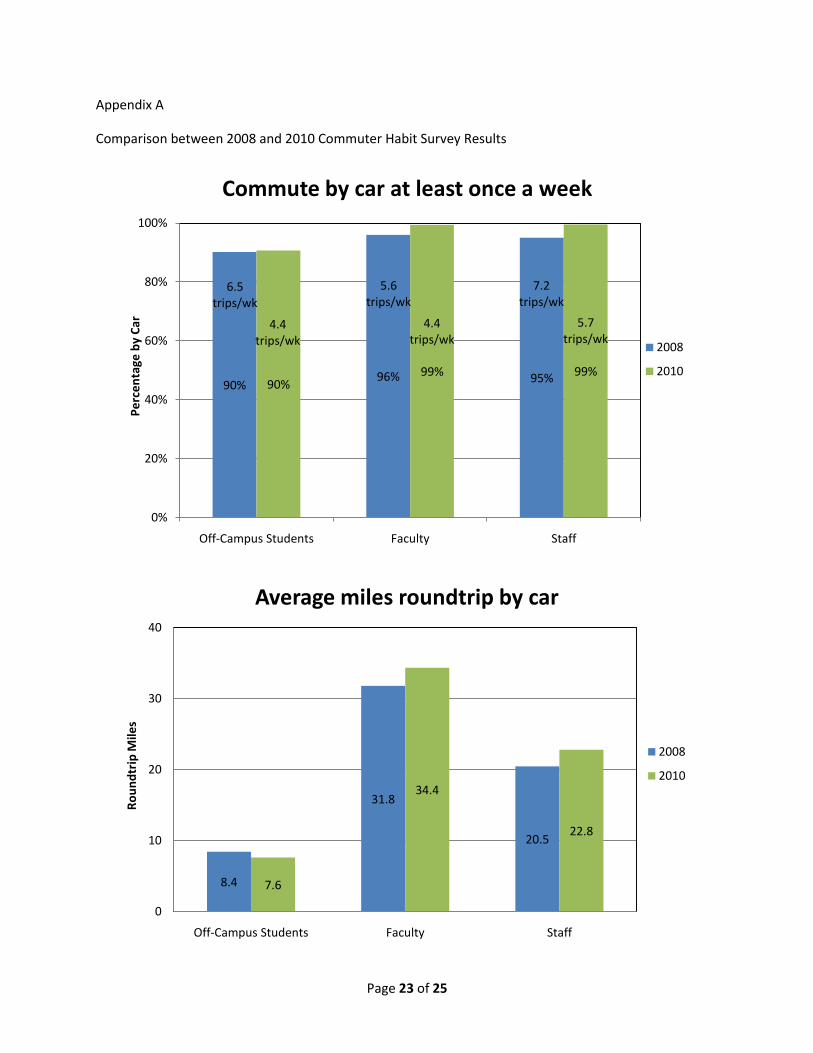
Off Campus Students, N = 515
o 90% commute by car at least once a week with an average of 4.4 trips/week
o 7.6 miles is the average roundtrip by car
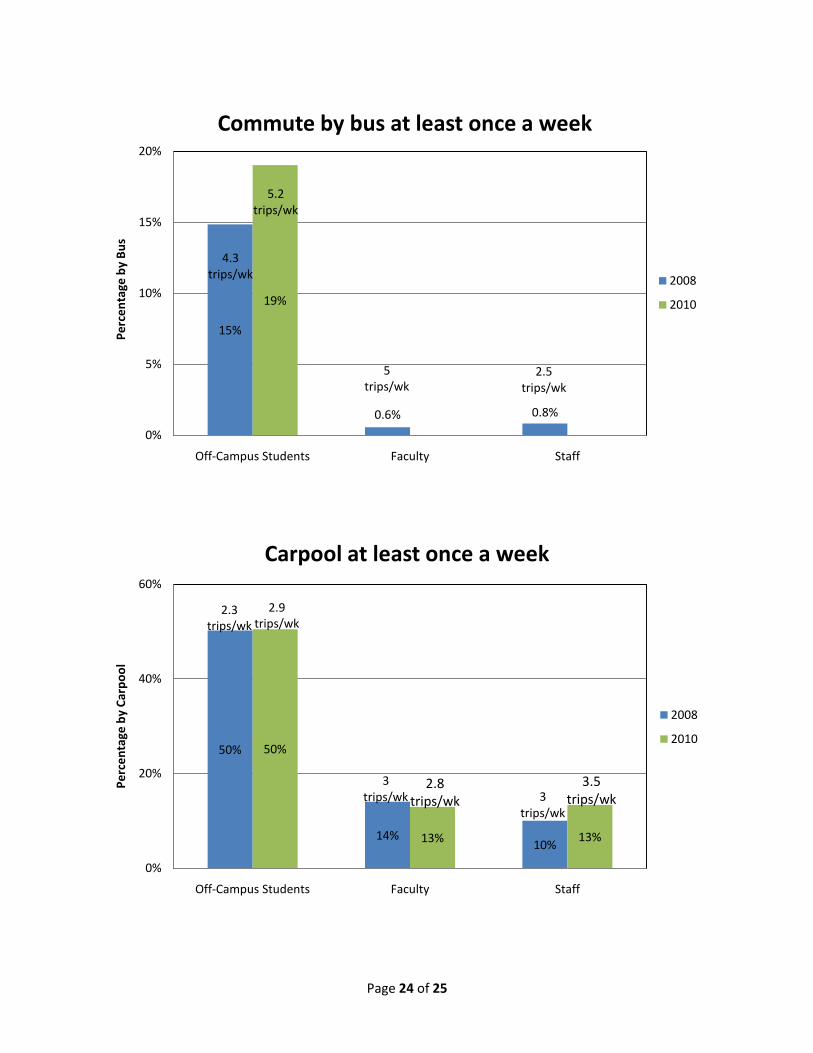
o 19% commute by bus at least once a week with an average of 5.2 trips/week
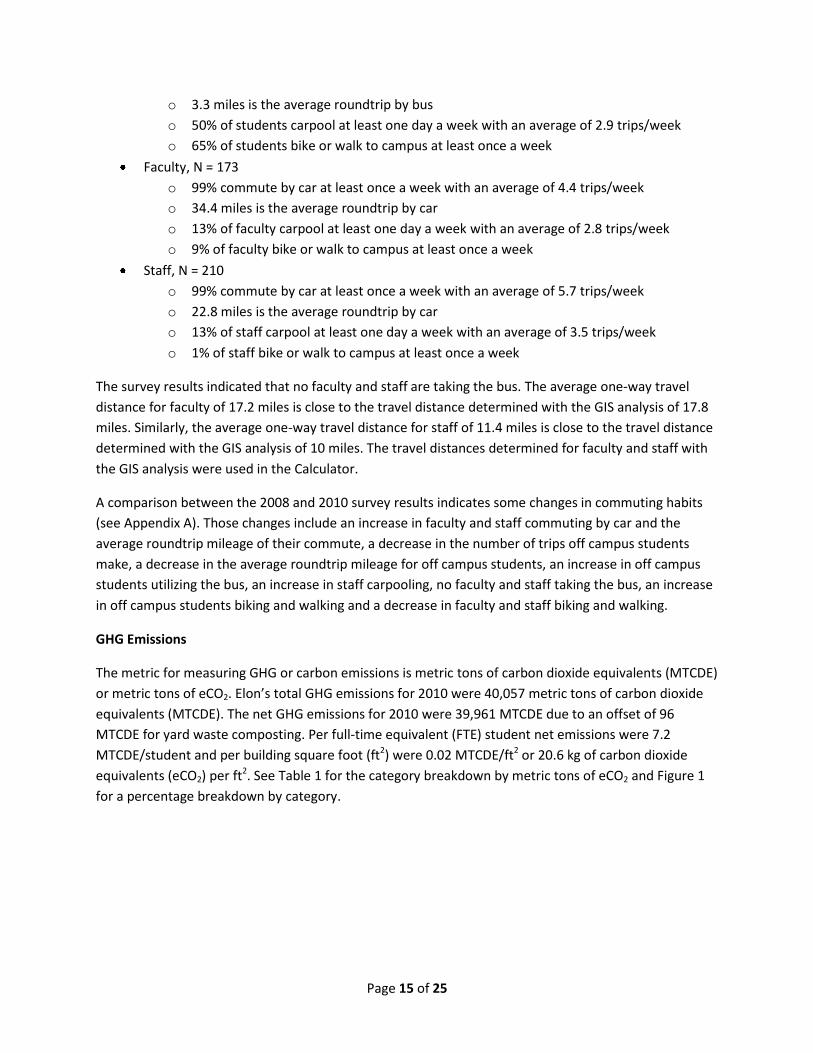
Page 15 of 25
o 3.3 miles is the average roundtrip by bus
o 50% of students carpool at least one day a week with an average of 2.9 trips/week
o 65% of students bike or walk to campus at least once a week
Faculty, N = 173
o 99% commute by car at least once a week with an average of 4.4 trips/week
o 34.4 miles is the average roundtrip by car
o 13% of faculty carpool at least one day a week with an average of 2.8 trips/week
o 9% of faculty bike or walk to campus at least once a week
Staff, N = 210
o 99% commute by car at least once a week with an average of 5.7 trips/week
o 22.8 miles is the average roundtrip by car
o 13% of staff carpool at least one day a week with an average of 3.5 trips/week
o 1% of staff bike or walk to campus at least once a week
The survey results indicated that no faculty and staff are taking the bus. The average one-way travel
distance for faculty of 17.2 miles is close to the travel distance determined with the GIS analysis of 17.8
miles. Similarly, the average one-way travel distance for staff of 11.4 miles is close to the travel distance
determined with the GIS analysis of 10 miles. The travel distances determined for faculty and staff with
the GIS analysis were used in the Calculator.
A comparison between the 2008 and 2010 survey results indicates some changes in commuting habits
(see Appendix A). Those changes include an increase in faculty and staff commuting by car and the
average roundtrip mileage of their commute, a decrease in the number of trips off campus students
make, a decrease in the average roundtrip mileage for off campus students, an increase in off campus
students utilizing the bus, an increase in staff carpooling, no faculty and staff taking the bus, an increase
in off campus students biking and walking and a decrease in faculty and staff biking and walking.
GHG Emissions
The metric for measuring GHG or carbon emissions is metric tons of carbon dioxide equivalents (MTCDE)
or metric tons of eCO2. Elon’s total GHG emissions for 2010 were 40,057 metric tons of carbon dioxide
equivalents (MTCDE). The net GHG emissions for 2010 were 39,961 MTCDE due to an offset of 96
MTCDE for yard waste composting. Per full-time equivalent (FTE) student net emissions were 7.2
MTCDE/student and per building square foot (ft2) were 0.02 MTCDE/ft2 or 20.6 kg of carbon dioxide
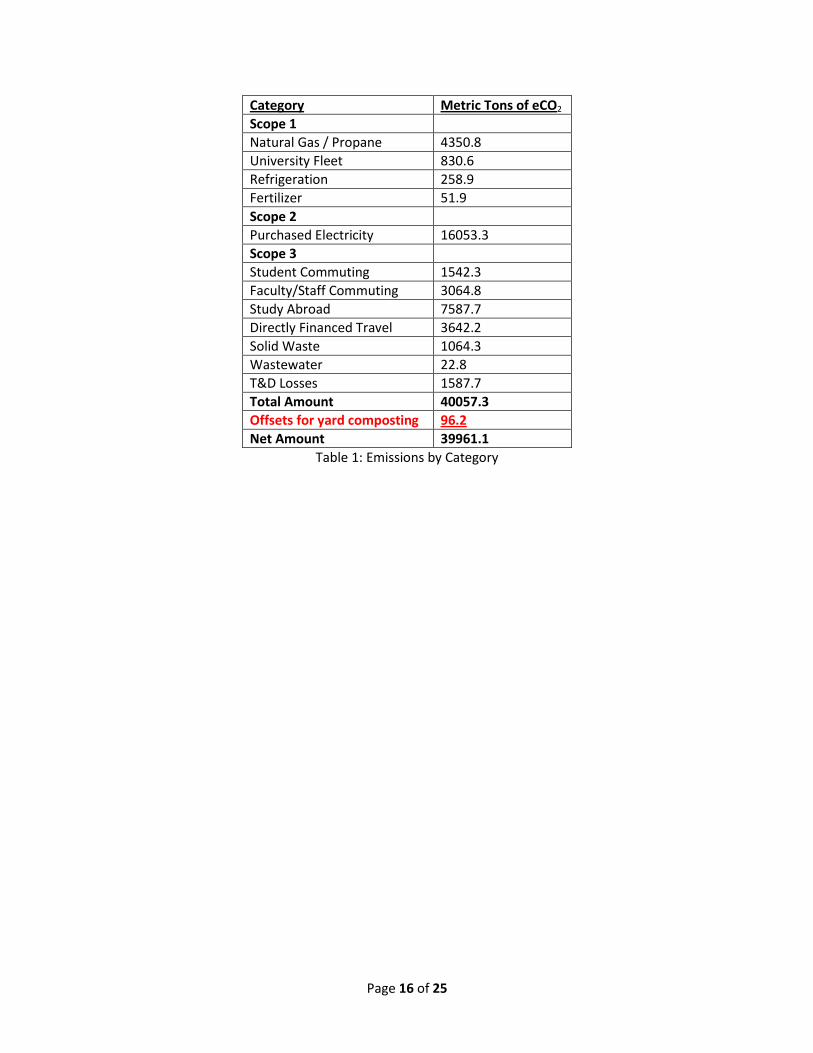
equivalents (eCO2) per ft2. See Table 1 for the category breakdown by metric tons of eCO2 and Figure 1
for a percentage breakdown by category.
Page 16 of 25
Category Metric Tons of eCO2
Scope 1
Natural Gas / Propane 4350.8
University Fleet 830.6
Refrigeration 258.9
Fertilizer 51.9
Scope 2
Purchased Electricity 16053.3
Scope 3
Student Commuting 1542.3
Faculty/Staff Commuting 3064.8
Study Abroad 7587.7
Directly Financed Travel 3642.2
Solid Waste 1064.3
Wastewater 22.8
T&D Losses 1587.7
Total Amount 40057.3
Offsets for yard composting 96.2
Net Amount 39961.1
Table 1: Emissions by Category
Page 17 of 25
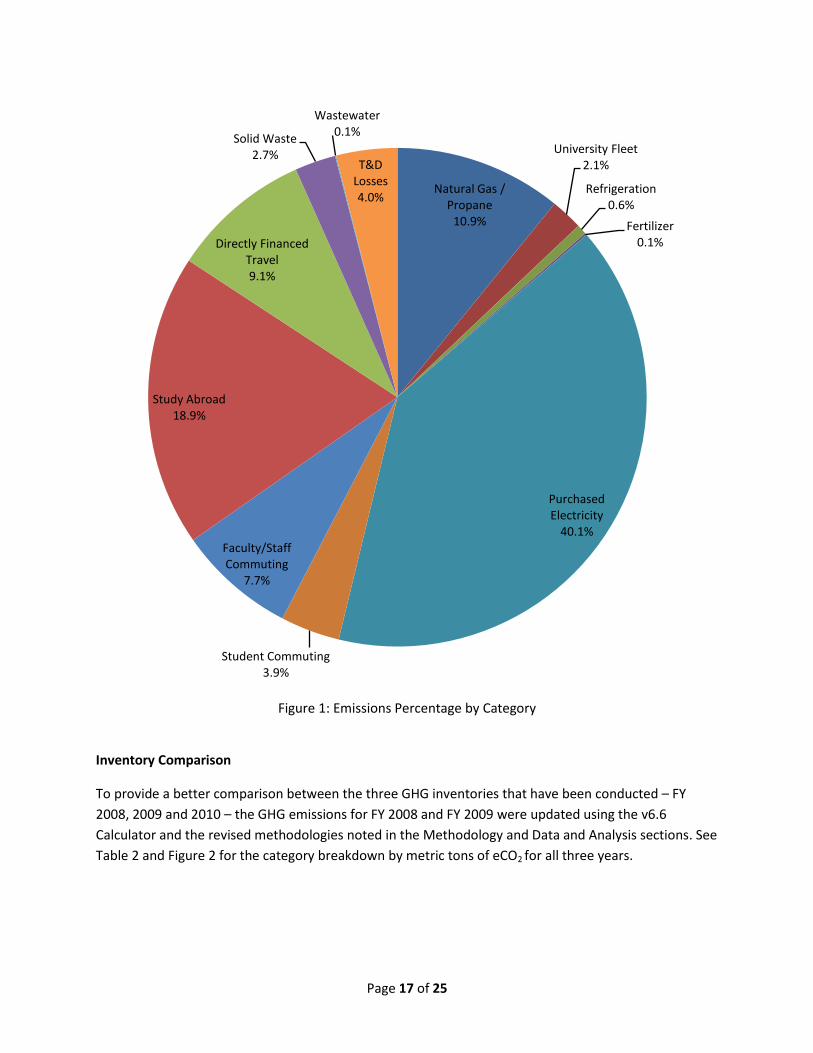
Figure 1: Emissions Percentage by Category
Inventory Comparison
To provide a better comparison between the three GHG inventories that have been conducted – FY
2008, 2009 and 2010 – the GHG emissions for FY 2008 and FY 2009 were updated using the v6.6
Calculator and the revised methodologies noted in the Methodology and Data and Analysis sections. See
Table 2 and Figure 2 for the category breakdown by metric tons of eCO2 for all three years.
Natural Gas / Propane
10.9%
University Fleet2.1%
Refrigeration0.6%
Fertilizer0.1%
Purchased Electricity
40.1%
Student Commuting3.9%
Faculty/Staff Commuting
7.7%
Study Abroad18.9%
Directly Financed Travel9.1%
Solid Waste2.7%
Wastewater0.1%
T&D Losses4.0%
Page 18 of 25
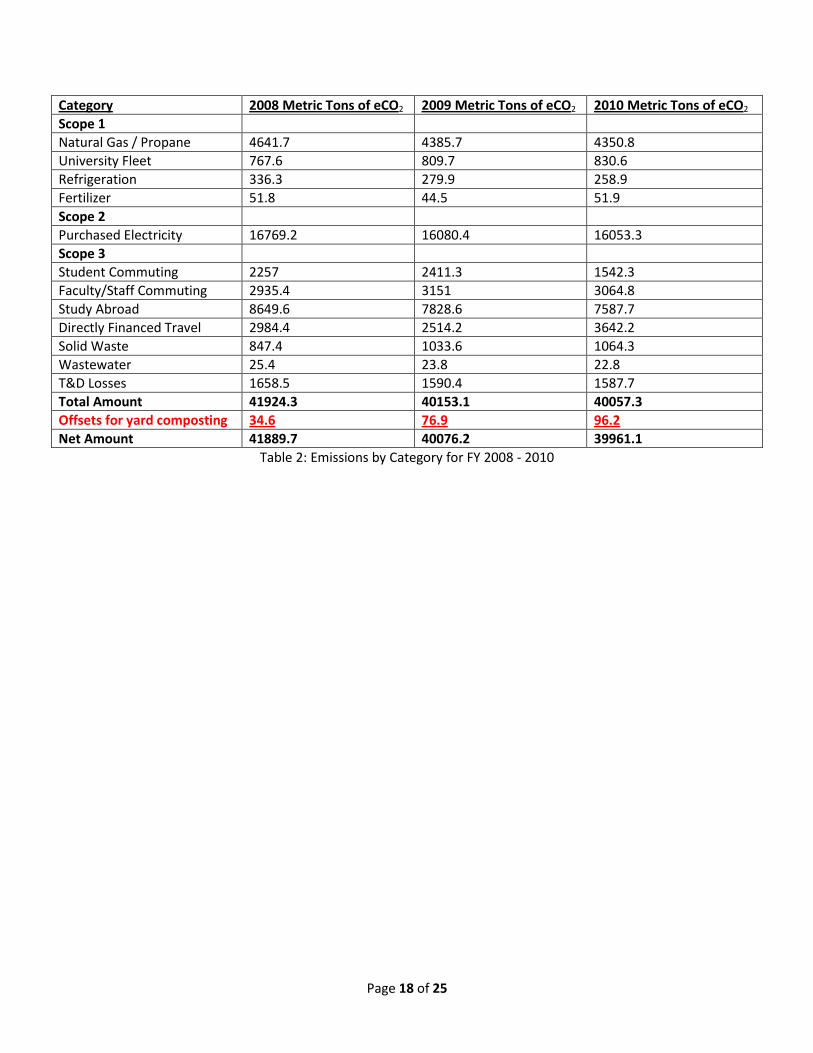
Category 2008 Metric Tons of eCO2 2009 Metric Tons of eCO2 2010 Metric Tons of eCO2
Scope 1
Natural Gas / Propane 4641.7 4385.7 4350.8
University Fleet 767.6 809.7 830.6
Refrigeration 336.3 279.9 258.9
Fertilizer 51.8 44.5 51.9
Scope 2
Purchased Electricity 16769.2 16080.4 16053.3
Scope 3
Student Commuting 2257 2411.3 1542.3
Faculty/Staff Commuting 2935.4 3151 3064.8
Study Abroad 8649.6 7828.6 7587.7
Directly Financed Travel 2984.4 2514.2 3642.2
Solid Waste 847.4 1033.6 1064.3
Wastewater 25.4 23.8 22.8
T&D Losses 1658.5 1590.4 1587.7
Total Amount 41924.3 40153.1 40057.3
Offsets for yard composting 34.6 76.9 96.2
Net Amount 41889.7 40076.2 39961.1
Table 2: Emissions by Category for FY 2008 - 2010
Page 19 of 25
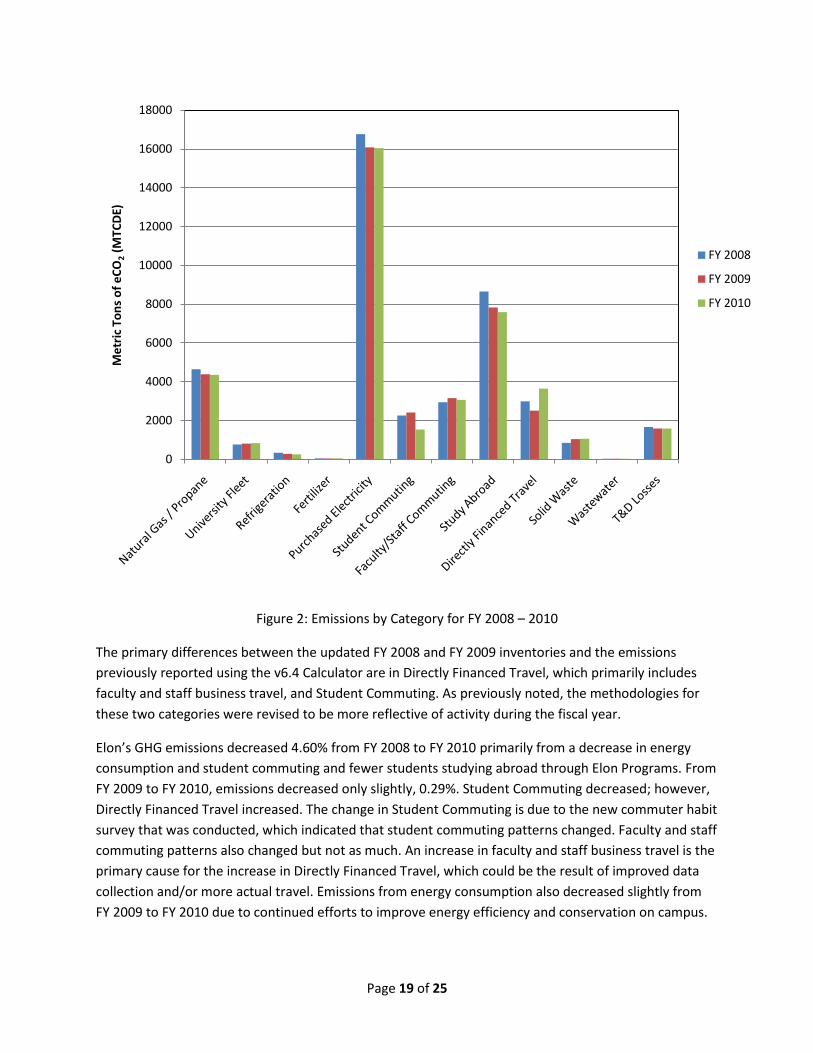
Figure 2: Emissions by Category for FY 2008 – 2010
The primary differences between the updated FY 2008 and FY 2009 inventories and the emissions
previously reported using the v6.4 Calculator are in Directly Financed Travel, which primarily includes
faculty and staff business travel, and Student Commuting. As previously noted, the methodologies for
these two categories were revised to be more reflective of activity during the fiscal year.
Elon’s GHG emissions decreased 4.60% from FY 2008 to FY 2010 primarily from a decrease in energy
consumption and student commuting and fewer students studying abroad through Elon Programs. From
FY 2009 to FY 2010, emissions decreased only slightly, 0.29%. Student Commuting decreased; however,
Directly Financed Travel increased. The change in Student Commuting is due to the new commuter habit
survey that was conducted, which indicated that student commuting patterns changed. Faculty and staff
commuting patterns also changed but not as much. An increase in faculty and staff business travel is the
primary cause for the increase in Directly Financed Travel, which could be the result of improved data
collection and/or more actual travel. Emissions from energy consumption also decreased slightly from
FY 2009 to FY 2010 due to continued efforts to improve energy efficiency and conservation on campus.
0
2000
4000
6000
8000
10000
12000
14000
16000
18000M
etr
ic T
on
s o
f e
CO
2(M
TCD
E)
FY 2008
FY 2009
FY 2010
Page 20 of 25
Summary
As illustrated in Figure 1, Purchased Electricity is the largest emissions category followed by Study
Abroad and Natural Gas/Propane. Campus energy consumption (Purchased Electricity, Natural
Gas/Propane and T&D losses) accounts for 55% of the GHG emissions, which is expected given coal is
the source of a large portion of Elon’s purchased electricity. Elon used slightly over 31 million kWh of
electricity in FY 2010, more than 800,000 therms of natural gas and 1,550 gallons of propane. Natural
gas and propane are used for heating and burn cleaner than coal. Reductions in direct emissions from
energy consumption will likely come from continued campus energy conservation and efficiency
projects as identified in the CAP. Installations of renewable energy such as solar thermal and geothermal
will also contribute to reductions in emissions from energy consumption. A geothermal system is
currently being installed to provide the primary source of heating and cooling for three new residence
halls and two existing residence halls. Grant funding was also awarded for solar thermal installations to
provide domestic hot water to a dining hall and at least two residence halls. Construction will begin in
2011. Additional renewable energy installations, including solar photovoltaic panels, will be considered
as appropriate and applicable as retrofits to existing facilities and/or a part of new facilities.
Elon is ranked number one in the nation among masters – level universities for study abroad programs
by the Institute of International Education. About 71% of Elon students study abroad at least once
during their time at the university. In FY 2010, 973 students studied abroad with an Elon sponsored
program. This was down from 1,056 in FY 2009. Study abroad travel accounts for 18.9% of Elon’s FY
2010 GHG emissions. Reducing the number of students who study abroad is not an option given the
prestige and importance of this program. In fact, the number of students studying abroad will likely
increase in the future as providing access to study abroad to 100% of Elon students is a priority in The
Elon Commitment strategic plan. Strategies for reducing net emissions, such as offsets, from study
abroad travel are included in Elon’s CAP.
Faculty/Staff Commuting and Student Commuting account for 11.6% of Elon’s GHG emissions. Based on
the survey results (see Appendix A), 90% of students commute by car at least once a week, 50% carpool
at least one day a week and 19% commute by bus at least once a week for a total of approximately
3,930,015 commute miles in FY 2010. Faculty and staff commuted approximately 7,585,678 miles in FY
2010 based on no bus use and 99% of faculty and staff commuting by car at least once a week with 13%
of faculty and staff carpooling at least one day a week. Options to decrease these emissions involve
carpooling, walking, riding a bike and utilizing the Elon Bio-buses. Programs and/or incentives for
increasing the use of these alternative methods of transportation are included in the CAP.
The GHG emissions from Directly Financed Travel amount to 9.1% of the total and include faculty and
staff business travel and athletic team travel. This may also be a difficult number to reduce in that travel
is a necessary part of many university employees’ jobs and essential to Elon’s athletic teams. Potential
ways to decrease net GHG emissions from travel include continuing and increasing the use of hybrid and
other alternative fueled vehicles; encouraging carpooling, web conferencing and taking the Amtrak train
when appropriate; and utilizing travel offsets. Combining trips through scheduling is another option to
reduce travel emissions. All of these strategies are included in the CAP.
Page 21 of 25
Categories that contribute a small amount (2.7% or less) to the total GHG emissions include Solid Waste,
the University Fleet, Refrigeration, Fertilizer and Wastewater. The recycling program at Elon has
expanded in recent years and yard and food waste composting programs have been put in-place. These
efforts will continue along with efforts to decrease the amount of disposable materials used on campus
and increase material reuse. These strategies should continue to keep Solid Waste a small portion of
Elon’s GHG emissions. Approximately 903 tons of solid waste were sent to a landfill in FY 2010.
University Fleet vehicles and equipment used 74,235 gallons of gasoline, 2,766 gallons of diesel and
17,616 gallons of biodiesel (B20) in FY 2010. Elon’s fleet is not large and includes several hybrid vehicles
as well as biodiesel and electric vehicles all of which emit fewer GHG emissions than traditional gasoline
or diesel fueled vehicles. The electric vehicles’ emissions are included in the purchased electricity
category. The use of alternative fuel vehicles will continue and increase.
Refrigeration emissions are less than 1% of the total emissions and result from unintentional leaks from
malfunctioning chillers. In FY 2010, 388 pounds of refrigerant had to be replaced due to leaks. These
leaks do not have a large impact on the university’s GHG emissions; however, they are detrimental to
the environment. The systems in place to identify and fix these leaks will continue and expand as
appropriate with the ultimate goal of no unintentional leaks.
Fertilizer and Wastewater are the smallest categories, both with 0.1% of the total emissions. Fertilizer
application is carefully monitored to ensure that only what is needed is applied. This will continue along
with an increase in organic fertilizer (where practical) to keep the fertilizer category a small portion of
Elon’s GHG emissions. Several steps have already been taken to conserve water on campus. These
initiatives will continue and should keep Wastewater a small contributor to Elon’s GHG emissions.
In addition to the projects and programs that can take place on campus, additional strategies, mainly
offsets, will need to be considered to reduce Elon’s net GHG emissions. Elon already has some offsets
(96 MTCDE) in the form of yard waste composting. Approximately 250 tons of yard waste were
composted in FY 2010.
Additional offsets will need to be explored to reach the goal of carbon neutrality. There are different
options for investing in offsets such as purchasing offset credits (retail or wholesale) from third-party
providers, investing in projects directly (without a third-party provider) and developing projects
independently. There are also several types of offset projects: fossil fuel reduction, carbon
sequestration, methane capture for combustion or energy production and industrial gas destruction.
Offset options that seem more likely are purchasing retail offset credits and investing in projects
directly. However, utilizing offsets for all of Elon’s net GHG emissions would not be an effective use of
financial resources. The intention is to utilize offsets only after reducing emissions on campus as much
as possible.
The FY 2010 GHG inventory indicates progress toward the goal of carbon neutrality as identified in the
Sustainability Master Plan and the near-term interim emission reduction targets for net emissions
identified in the CAP. The first target is a 5% reduction from FY 2008 by 2015. Thus far, the reduction
from FY 2008 is 4.60%. However, as noted in the CAP, the University’s planned growth will prove
Page 22 of 25
challenging for continued emission reductions. Therefore, it is critical to continue implementation of the
strategies identified in the CAP to reduce emissions in the coming years. The CAP is a living, flexible
document that will be revised as technology, research and incentives develop. A GHG inventory will
continue to be conducted yearly to monitor progress toward Elon’s interim reduction goals and
overarching goal of carbon neutrality.
Page 23 of 25
Appendix A
Comparison between 2008 and 2010 Commuter Habit Survey Results
90%96% 95%90%
99% 99%
0%
20%
40%
60%
80%
100%
Off-Campus Students Faculty Staff
Pe
rce
nta
ge b
y C
ar
Commute by car at least once a week
2008
2010
8.4
31.8
20.5
7.6
34.4
22.8
0
10
20
30
40
Off-Campus Students Faculty Staff
Ro
un
dtr
ip M
iles
Average miles roundtrip by car
2008
2010
5.7 trips/wk
4.4 trips/wk
4.4 trips/wk
6.5 trips/wk
5.6 trips/wk
7.2 trips/wk
Page 24 of 25
15%
0.6% 0.8%
19%
0%
5%
10%
15%
20%
Off-Campus Students Faculty Staff
Pe
rce
nta
ge b
y B
us
Commute by bus at least once a week
2008
2010
50%
14%10%
50%
13% 13%
0%
20%
40%
60%
Off-Campus Students Faculty Staff
Pe
rce
nta
ge b
y C
arp
oo
l
Carpool at least once a week
2008
2010
2.9 trips/wk
2.8 trips/wk
3.5 trips/wk
5.2 trips/wk
4.3 trips/wk
2.3 trips/wk
3 trips/wk 3
trips/wk
5 trips/wk
2.5 trips/wk
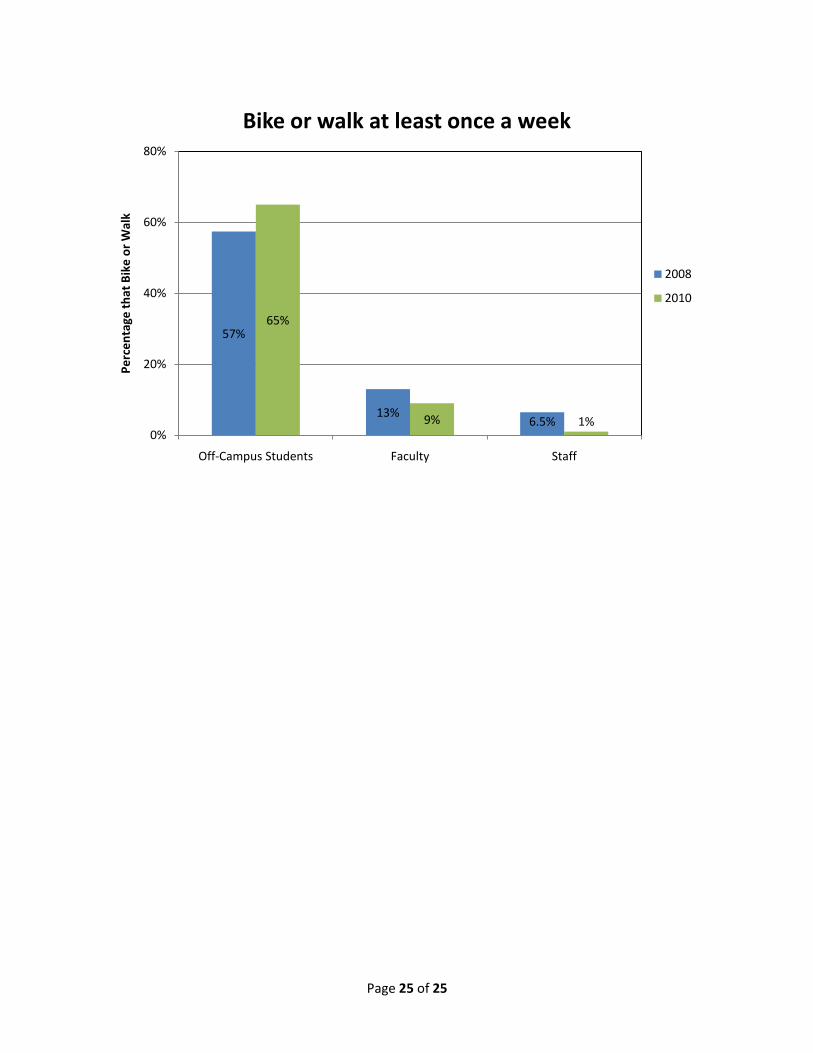
Page 25 of 25
57%
13%6.5%
65%
9% 1%0%
20%
40%
60%
80%
Off-Campus Students Faculty Staff
Pe
rce
nta
ge t
hat
Bik
e o
r W
alk
Bike or walk at least once a week
2008
2010


