


GGrroooott LLeettaabbaa RRiivveerr WWaatteerr DDeevveellooppmmeenntt PPrroojjeecctt ((GGLLeeWWaaPP)) i
Technical Study Module : Bulk Water Distribution Infrastructure : Volume 8 May 2010
LIST OF STUDY REPORTS IN GROOT LETABA RIVER WATER D EVELOPMENT PROJECT
(BRIDGING STUDIES)
This report forms part of the series of reports, done for the bridging studies phase of the GLeWaP.
All reports for the GLeWaP are listed below.
REPORT NUMBER REPORT TITLE
P WMA 02/B810/00/0508 Project Coordination and Management Team
P WMA 02/B810/00/0508/1 Project Coordination and Management Team: Executive Summary Report: Vol 1
P WMA 02/B810/00/0508/2 Project Coordination and Management Team: Main Report: Vol 2
P WMA 02/B810/00/0508/3 Project Coordination and Management Team: Register of Decisions: Vol 3
P WMA 02/B810/00/0508/4 Project Coordination and Management Team
P WMA 02/B810/00/0508/5 Project Coordination and Management Team
P WMA 02/B810/00/0608 Technical Study Module
P WMA 02/B810/00/0608/1 Technical Study Module: Main Report: Vol 1
P WMA 02/B810/00/0608/2 Technical Study Module: Review of Water Requirements: Vol 2
P WMA 02/B810/00/0608/3 Technical Study Module: Groundwater: Vol 3
P WMA 02/B810/00/0608/4 Technical Study Module: Hydrology: Vol 4
P WMA 02/B810/00/0608/5 Technical Study Module: Water Resource Analysis: Vol 5
P WMA 02/B810/00/0608/6 Technical Study Module: Preliminary Design of Nwamitwa Dam: Vol 6
P WMA 02/B810/00/1110/1 Technical Study Module: Preliminary Design of Nwamitwa Dam: Vol 6 - Annexure 1: Appendices
P WMA 02/B810/00/1110/2 Technical Study Module: Preliminary Design of Nwamitwa Dam: Vol 6 - Annexure 2: Appendix B (Part 1): Geotechnical Investigations
P WMA 02/B810/00/1110/3 Technical Study Module: Preliminary Design of Nwamitwa Dam: Vol 6 - Annexure 3: Appendix B (Part 2): Geotechnical Investigations
P WMA 02/B810/00/1110/4 Technical Study Module: Preliminary Design of Nwamitwa Dam: Vol 6 - Annexure 4: Appendix H: Drawings
P WMA 02/B810/00/0608/7 Technical Study Module: Preliminary Design of the Raising of Tzaneen Dam: Vol 7
P WMA 02/B810/00/0608/8 Technical Study Module: Bulk Water Distribution Infrastructure: Vol 8
P WMA 02/B810/00/1110/5 Technical Study Module: Bulk Water Distribution Infrastructure: Vol 8 - Annexure 1 : Appendices
P WMA 02/B810/00/0708 Environmental Management Module
P WMA 02/B810/00/0708/1 Environmental Management Module: Scoping Report: Vol 1
P WMA 02/B810/00/0708/2 Environmental Management Module: Environmental Impact Assessment Report: Vol 2
P WMA 02/B810/00/0708/3 Environmental Management Module: Environmental Management Programme for Borrow Area 1 on the Farm Laborie 515: Vol 3
P WMA 02/B810/00/0708/4 Environmental Management Module: Environmental Management Programme for Borrow Area 2 on the Farm La Parisa 729 (Gubits Farm): Vol 4
P WMA 02/B810/00/0708/5 Environmental Management Module: Environmental Management Programme for Borrow Area 3 on the Farm Letaba Drift 727: Vol 5
P WMA 02/B810/00/0708/6 Environmental Management Module
P WMA 02/B810/00/0708/7 Environmental Management Module
P WMA 02/B810/00/0708/8 Environmental Management Module
P WMA 02/B810/00/0708/9 Environmental Management Module
P WMA 02/B810/00/0708/10 Environmental Management Module
P WMA 02/B810/00/0808 Public Involvement Program
P WMA 02/B810/00/0808/1 Public Involvement Program: Main Report: Vol 1
P WMA 02/B810/00/0808/2 Public Involvement Program
P WMA 02/B810/00/0808/3 Public Involvement Program
P WMA 02/B810/00/0808/4 Public Involvement Program
P WMA 02/B810/00/0808/5 Public Involvement Program

GGrroooott LLeettaabbaa RRiivveerr WWaatteerr DDeevveellooppmmeenntt PPrroojjeecctt ((GGLLeeWWaaPP)) ii
Technical Study Module : Bulk Water Distribution Infrastructure : Volume 8 May 2010

GGrroooott LLeettaabbaa RRiivveerr WWaatteerr DDeevveellooppmmeenntt PPrroojjeecctt ((GGLLeeWWaaPP)) iii
Technical Study Module : Bulk Water Distribution Infrastructure : Volume 8 May 2010
EXECUTIVE SUMMARY
1. INTRODUCTION
1.1 BACKGROUND TO PROJECT
The catchment of the Groot Letaba River has many and varied land uses with their
associated water requirements, for example commercial irrigation, commercial
afforestation, tourism, as well as primary demands by the population in the
catchment. The water resources available in the catchment are limited, and
considerable pressure has been put on these resources in the past. This situation
has been investigated at various levels by the Department of Water Affairs and
Forestry (DWAF).
The first major study undertaken for this area was the Letaba River Basin Study in
1985 (DWAF, 1990), which comprised the collection and analysis of all available data
on water availability and use, as well as future water requirements and potential
future water resource developments. This was followed by a Pre-feasibility Study
(DWAF, 1994), which was completed in 1994. The focus of the Pre-feasibility Study
was the complete updating of the hydrology of the Basin. The next study undertaken
was the Feasibility Study of the Development and Management Options (DWAF,
1998), which was completed in 1998.
The Feasibility Study proposed several options for augmenting water supply from the
Groot Letaba River. These included some management interventions, as well as the
construction of a dam at Nwamitwa and the possible raising of Tzaneen Dam. These
options would enable additional water to be allocated to the primary water users,
would allow the ecological Reserve to be implemented and could also improve the
assurance of supply to the agricultural sector.
This Bridging Study was initiated by (then) DWAF in 2006 (now the Department of
Water Affairs (DWA)) in order to re-assess the recommendations arising from the
Feasibility Study in the light of developments that have taken place in the intervening
10 years.
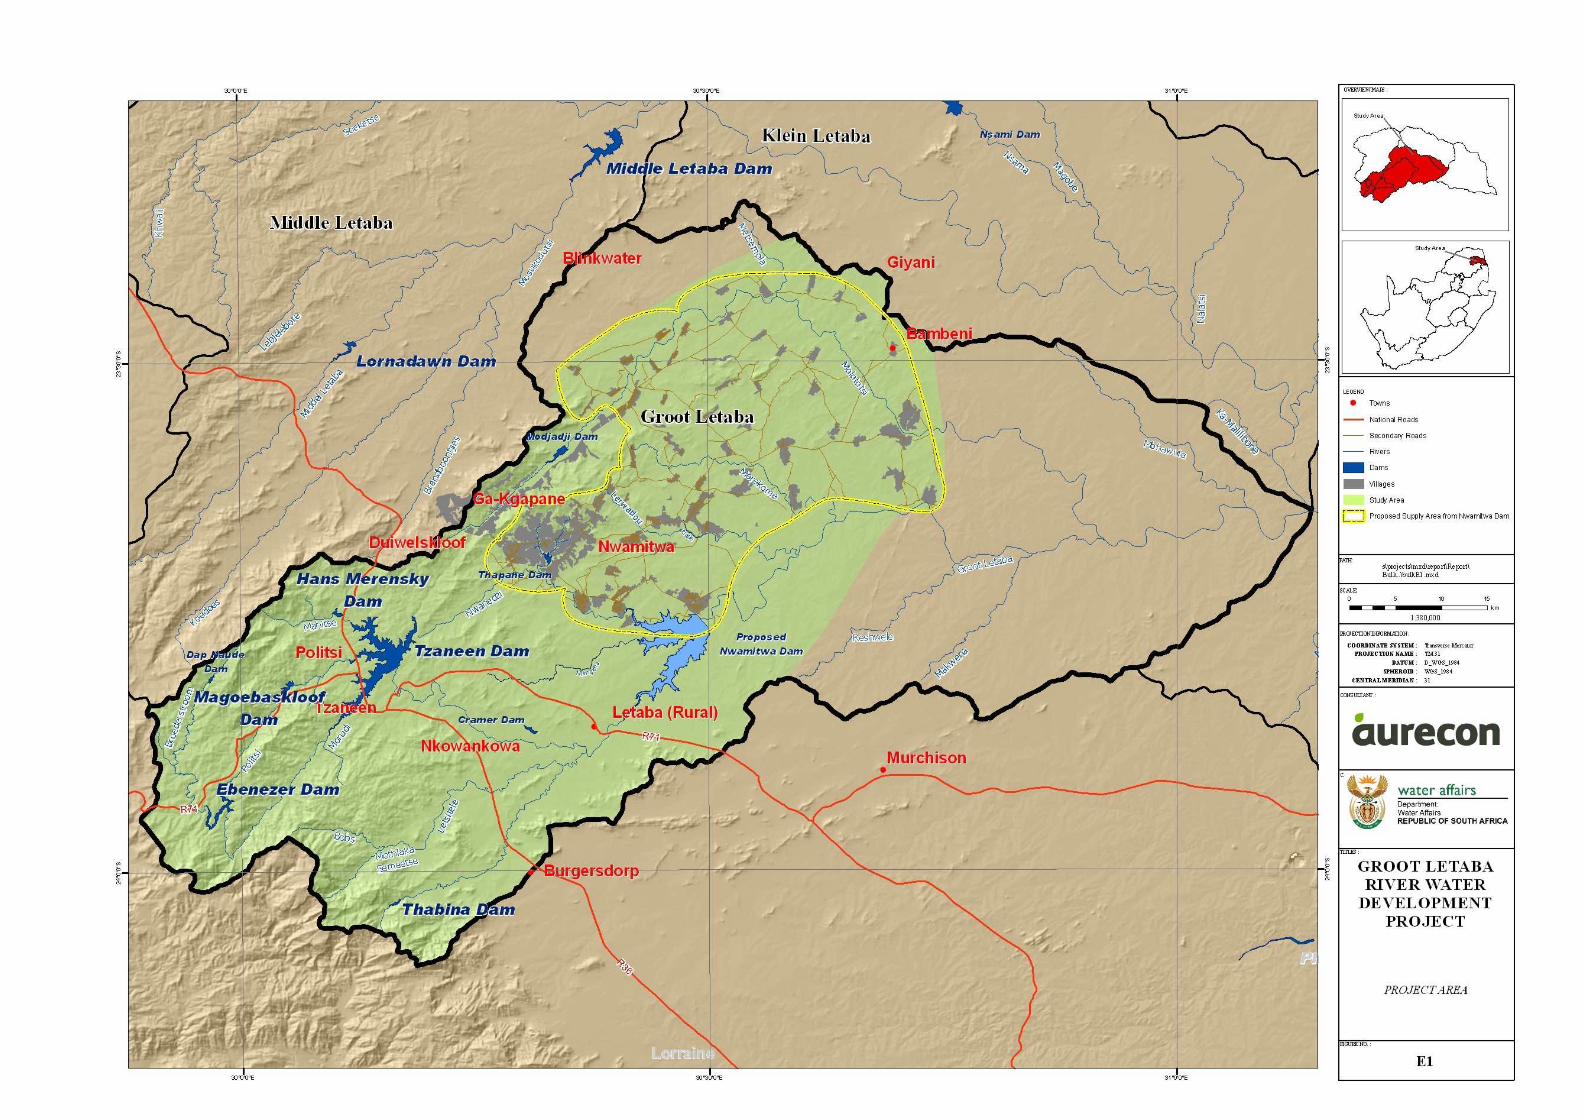
The study area, shown in Figure E1, consists of the catchment of the Groot Letaba
River, upstream of its confluence with the Klein Letaba River. The catchment falls
within the Mopani District Municipality, which is made up of six local municipalities.
The four Local Municipalities, parts or all of which are within the catchment area, are
Greater Tzaneen, Greater Letaba, Ba Phalaborwa and Greater Giyane. The major

GGrroooott LLeettaabbaa RRiivveerr WWaatteerr DDeevveellooppmmeenntt PPrroojjeecctt ((GGLLeeWWaaPP)) iv
Technical Study Module : Bulk Water Distribution Infrastructure : Volume 8 May 2010
town in the study area is Tzaneen, with Polokwane the provincial capital city of
Limpopo located just outside of the catchment to the West.
The site of the proposed Nwamitwa Dam is also shown on Figure E1. The focus of
the Feasibility Study was the Groot Letaba catchment, with the catchments of the
other rivers being included to check that environmental flow requirements into the
Kruger National Park were met, and international agreements regarding flow entering
Moçambique were met. This focus was kept for this Bridging Study.
1.2 SCOPE AND ORGANISATION OF PROJECT
The Department’s Directorate: Options Analysis (OA), appointed Ninham Shand in
Association with a number of sub consultants to undertake this study. In March 2009,
Ninham Shand, Africon and Connell Wagner merged to become Aurecon.
The Bridging Study comprises a number of modules. This Report focuses on part of
the scope of work for the Technical Study Module (TSM). The tasks comprising the
TSM are: Water Requirements, Water Resource Evaluation, Preliminary Design of
Nwamitwa Dam, Raising of Tzaneen Dam, Bulk Water Distribution Infrastructure,
Implementation Programme and Water Quality.
This report describes Task 5 : Bulk Water Distribution Infrastructure.
GGrroooott LLeettaabbaa RRiivveerr WWaatteerr DDeevveellooppmmeenntt PPrroojjeecctt ((GGLLeeWWaaPP)) vi
Technical Study Module : Bulk Water Distribution Infrastructure : Volume 8 May 2010
2. SITUATION ASSESSMENT
2.1 EXISTING SUPPLY SCHEMES
The primary source of information pertaining to existing infrastructure was DWAF’s,
Limpopo Province, Mopani District Development Plan: DWAF Project LP 182, Book of
Plans with Descriptive Details. This source of information was supplemented by a
number of site visits and discussions with the operators of the existing infrastructure.
The following existing systems are located in close proximity to the proposed
Nwamitwa Dam and could therefore be potentially supplied from the proposed Dam:
• the Letaba Ritavi System
• the Thapane System
• the Modjadji System
• the Worcester/Mothobeki System
• the Lower Molototsi System
For the purposes of this report, the Worcester/Mothobeki and Lower Molototsi
systems are described as one System and is referred to in the documentation as the
Worcester/Molototsi System
Figure E1 shows the location of the four systems referred to above. The existing bulk
water supply infrastructure is shown in Figure E2. Discussions were held with the
owners and operators of each of the systems in order to get a good understanding of
the operation of the existing infrastructure. From the discussions with the operators of
the various systems it is evident that critical shortages of treated potable water exist
in the Letaba, Thapane and Worcester/Molototsi systems. These water shortages
can be attributed to insufficient water resources, the lack of bulk water infrastructure
and incorrect pump type selection.
2.2 EXISTING WATER TREATMENT WORKS
Surface water is currently pumped from a weir on the Letaba River, just downstream
of the proposed Nwamitwa Dam. The raw water is treated at the Nkambako Water
Treatment Works (WTW). The water treatment works comprises a single module with
a capacity of 6 Mℓ/d. An identical second module is under construction, but has not
yet been commissioned. After completion of the second module the plant will have a
total capacity of 12 Mℓ/d.


GGrroooott LLeettaabbaa RRiivveerr WWaatteerr DDeevveellooppmmeenntt PPrroojjeecctt ((GGLLeeWWaaPP)) viii
Technical Study Module : Bulk Water Distribution Infrastructure : Volume 8 May 2010
The treatment process at the WTW comprises of flocculation, sedimentation and
filtration. Perusal of the plant records showed that treated water quality failed to meet
SANS Class I requirements (the South African Bureau of Standards (SABS) sets out
recommendations with respect to potable water in SANS 241-2006) and generally
complies with the Class II requirements. With improved rapid mix of chemicals into
the raw water, adequate sludge removal and repair of the filter backwash plant, the
treatment works should be capable of producing a treated water in compliance with
Class I requirements.
2.3 EXISTING GROUNDWATER USE
A desktop study (based on information in the GRIP database) was undertaken to
ascertain the present use of groundwater in the study area as well as potential supply
from groundwater. The census of groundwater infrastructure indicates that many of
the regions which are not connected to the existing bulk water supply network, have
access to enough groundwater to satisfy only the current basic survival demand of 16
litres/capita/day. The Thapane system and most of the Letaba system has access to
bulk supplies from surface sources, augmented from groundwater. High yielding
boreholes are not homogeneously distributed throughout the study area and are not
always located close to villages with a high demand.
Another important consideration is that of borehole water quality. The DWAF water
quality guidelines were used as a basis for determining the water quality
requirements for different users. Most of the good quality groundwater is found in the
relatively wetter western part of the study area. The north-eastern part of the region,
namely the villages in the Worcester/Molototsi system rely on boreholes yielding
Class III and IV water, which is unsuitable for potable use. Elevated concentrations
of calcium and magnesium are in most cases responsible for the poor water quality.
There are also boreholes which are sited in villages and are consequently
contaminated with nitrates from nearby pit latrines. These nitrate contaminated
boreholes can be rehabilitated with a sanitary seal, but the elevated levels of calcium
and magnesium (caused by geological structures) will need water treatment.
The boreholes situated outside the villages have dedicated pipelines supplying
central storage tanks. These boreholes were installed to target geological shear or
fault zones and, as such, are more reliable, both in terms of yield and water quality.

GGrroooott LLeettaabbaa RRiivveerr WWaatteerr DDeevveellooppmmeenntt PPrroojjeecctt ((GGLLeeWWaaPP)) ix
Technical Study Module : Bulk Water Distribution Infrastructure : Volume 8 May 2010
3. INFRASTRUCTURE NEEDS
3.1 WATER REQUIREMENTS
The future water requirements for all the rural settlements in the Study Area were
supplied to the Study Team by EVN Africa. EVN Africa were appointed by the
Department of Water Affairs (study entitled: Nwamitwa RWS: LPR 006) to assess the
water requirements of the area taking into account inter alia service levels, socio
economic development, water losses and the type of development. The estimated
water requirements were derived from the population data within each settlement and
a water requirement in litres/capita/day related to the level of service delivered.
Information on the population projections and future water requirement projections
per settlement per service level is given in Appendix A of this Report. A summary of
the anticipated water requirements for the Study area is given in Table E1. The total
water requirement from the proposed Nwamitwa Dam is estimated to be 11.2 Mm3/a
in 2027 when a higher level of service should be provided.
Table E1 Future water requirements in the study area
Water Requirements for different Service Levels (Mm 3/a)
Survival Standard Higher
2007 2012 2027 2007 2012 2027 2007 2012 2027
Letaba Ritavi 1.6 1.8 2.1 2.7 3.2 3.9 3.7 4.3 5.2
Thapane 0.9 1.0 1.3 1.6 1.9 2.4 2.1 2.6 3.3
Less Thapane Source 1.5 1.5 1.5 1.5 1.5 1.5 1.5 1.5 1.5
Thapane * 0.1 0.4 0.9 0.6 1.1 1.8
Worcester +Lower Molototsi 0.6 0.7 0.8 1.1 1.2 1.4 1.5 1.6 1.9
Greater Giyani 0.5 0.6 0.9 0.9 1.0 1.7 1.2 1.4 2.3
TOTAL 2.7 3.0 3.7 4.7 5.8 7.9 7.0 8.4 11.2
Note : Excludes the 1.5 Mm3/a demand already supplied from Thapane Dam
Table E2 below shows the expected shortfall in the Modjadji system.
Table E2 Supply to the Modjadji System
Water Requirements for different Service Levels (Mm 3/a)
Survival Standard Higher 2007 2012 2027 2007 2012 2027 2007 2012 2027
Modjadji water requirements 1.4 1.7 2.4 2.6 3.2 4.8 3.5 4.3 6.4
Supply available from Modjadji Dam 4.3 4.3 4.3 4.3 4.3 4.3 4.3 4.3 4.3
Modjadji shortfall -- -- -- -- -- 0.5 -- -- 2.1

GGrroooott LLeettaabbaa RRiivveerr WWaatteerr DDeevveellooppmmeenntt PPrroojjeecctt ((GGLLeeWWaaPP)) x
Technical Study Module : Bulk Water Distribution Infrastructure : Volume 8 May 2010
The total requirement from the proposed Nwamitwa Dam could be increased by
2.1 million m3/a to 13.3 million m3/a if the potential shortfall in the Mojadji system were
to be supplied from Nwamitwa Dam in 2027.
3.2 LOGICAL SUPPLY AREA
In order to determine the logical area for the proposed Nwamitwa Dam the water
requirements in the areas immediately surrounding the proposed dam were analysed
and then compared to the anticipated yield from the proposed Nwamitwa Dam. The
water resource analysis (DWA, 2010a) indicates that 13 Mm3/a could safely be
supplied from Nwamitwa Dam at a 98% level of assurance for domestic use. The
anticipated 2027 domestic water requirement in the Letaba/Ritavi, Thapane and
Worcester/Molototsi (including part of Giyani) supply areas is 11.2 Mm3/a. This can
be supplied from the yield of 13 Mm3/a which was determined for a dam with a Full
Supply Level of 479.5 masl. It is proposed that water ultimately intended for use in
the Worcester/Molototsi System be used in the interim to supplement any future
shortfalls in the Modjadji system prior to the full high water requirement being
required in the Worcester/Molototsi system.
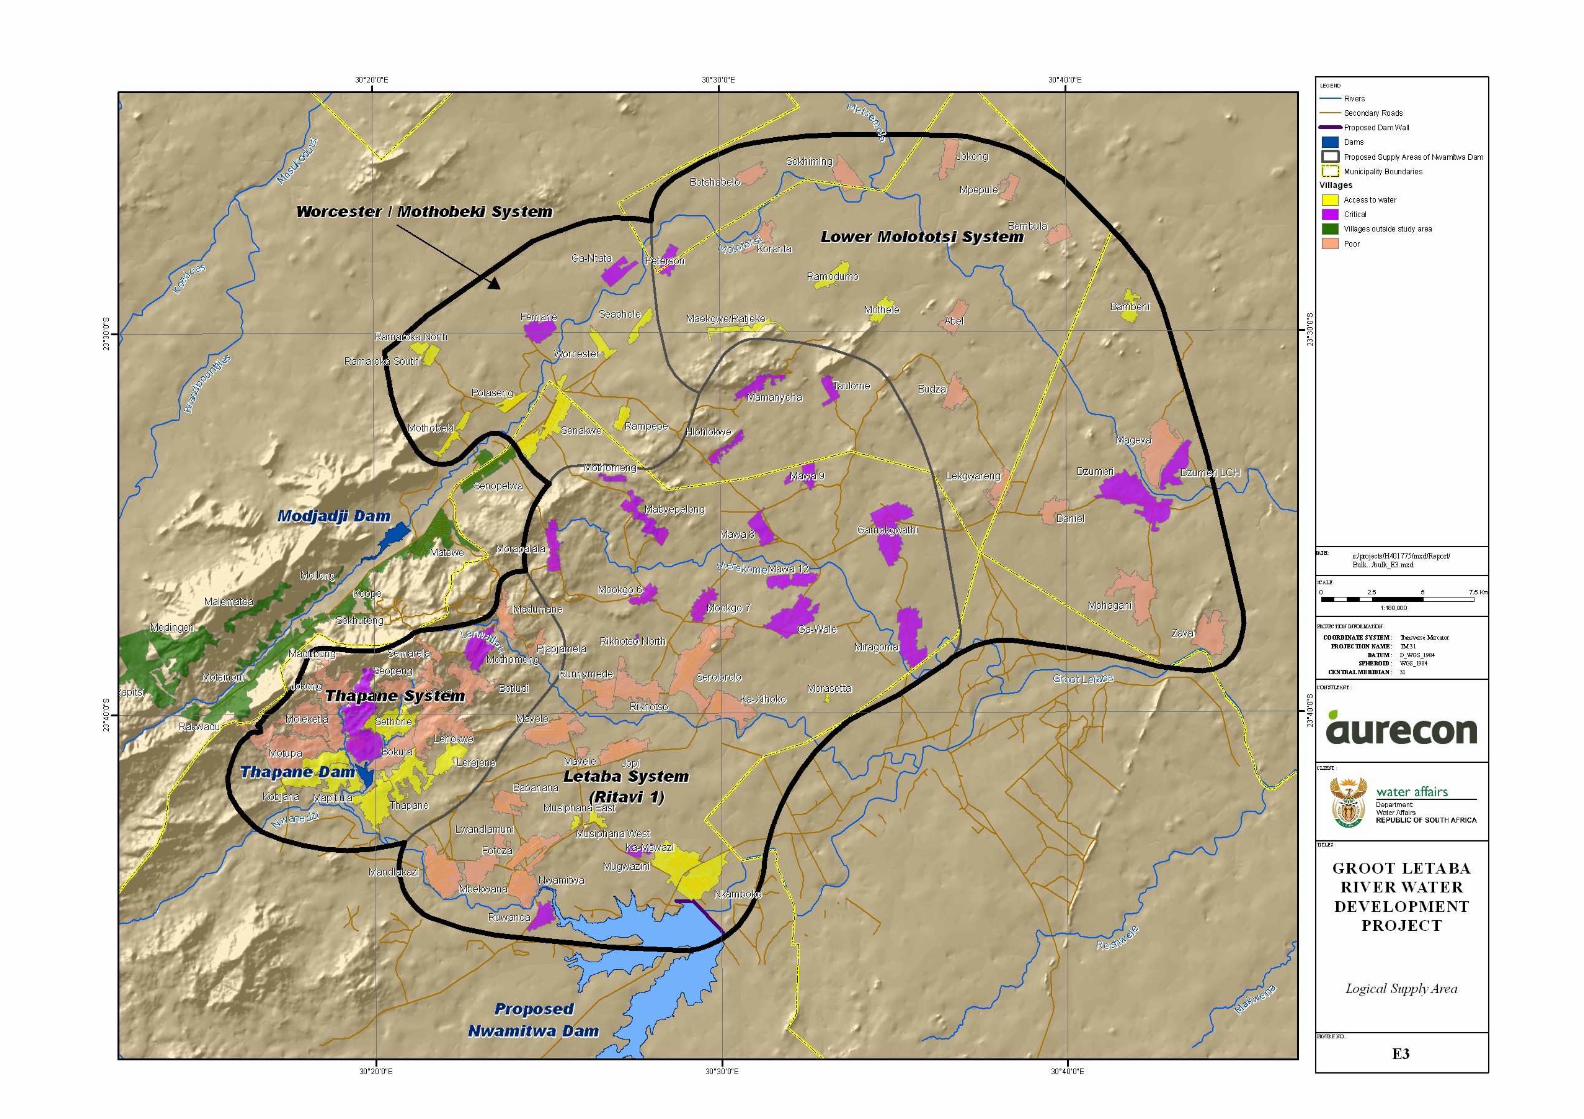
The villages Daniel, Dzumeri, Nogeva, Mphagani and Zava which should be supplied
by the Giyani sub-system are included in the logical supply area, as these villages
currently receive no potable water because of infrastructure capacity constraints and
inadequate supplies. These villages currently rely solely upon groundwater.
Figure E.3 shows the logical supply area to be served from Nwamitwa Dam and the
current water availability in each settlement. The settlements identified as “water
critical” have limited or poor groundwater supply and either no bulk water supply
infrastructure or bulk supply infrastructure which is not utilised. The settlements
identified as “water poor” have limited or poor groundwater supply and limited or
rationed access to potable water.
GGrroooott LLeettaabbaa RRiivveerr WWaatteerr DDeevveellooppmmeenntt PPrroojjeecctt ((GGLLeeWWaaPP)) xii
Technical Study Module : Bulk Water Distribution Infrastructure : Volume 8 May 2010
4. INFRASTRUCTURE MASTER PLAN
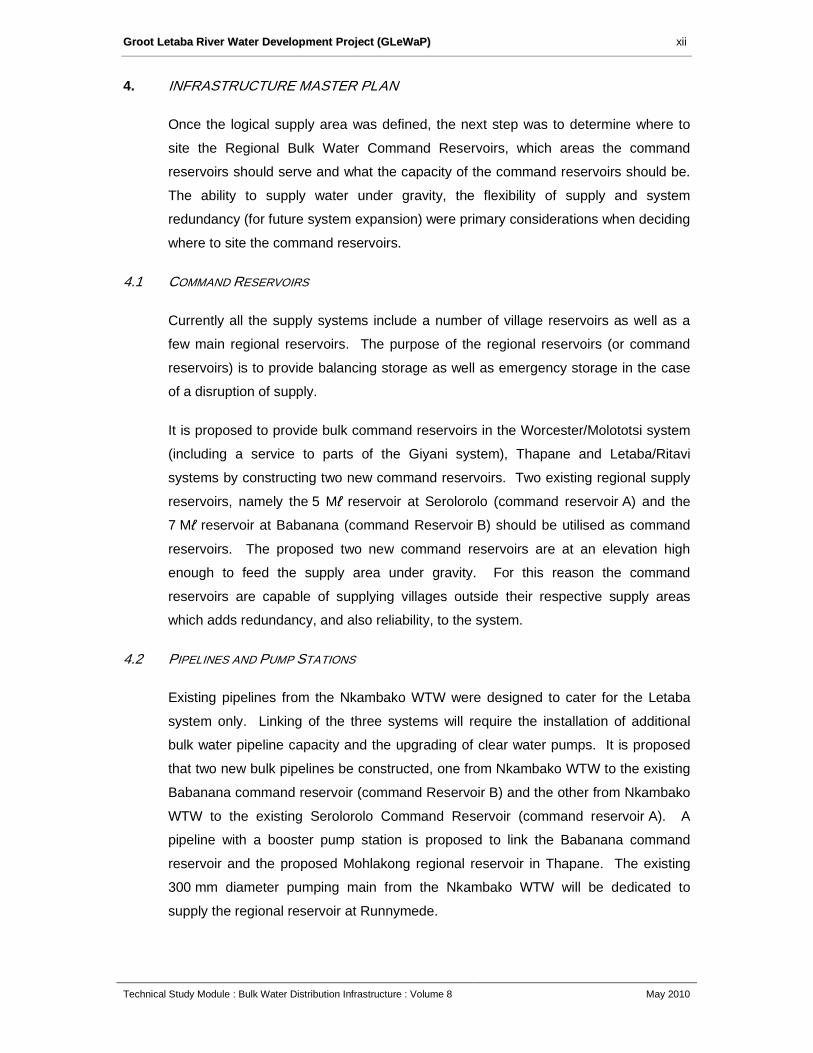
Once the logical supply area was defined, the next step was to determine where to
site the Regional Bulk Water Command Reservoirs, which areas the command
reservoirs should serve and what the capacity of the command reservoirs should be.
The ability to supply water under gravity, the flexibility of supply and system
redundancy (for future system expansion) were primary considerations when deciding
where to site the command reservoirs.
4.1 COMMAND RESERVOIRS
Currently all the supply systems include a number of village reservoirs as well as a
few main regional reservoirs. The purpose of the regional reservoirs (or command
reservoirs) is to provide balancing storage as well as emergency storage in the case
of a disruption of supply.
It is proposed to provide bulk command reservoirs in the Worcester/Molototsi system
(including a service to parts of the Giyani system), Thapane and Letaba/Ritavi
systems by constructing two new command reservoirs. Two existing regional supply
reservoirs, namely the 5 Mℓ reservoir at Serolorolo (command reservoir A) and the
7 Mℓ reservoir at Babanana (command Reservoir B) should be utilised as command
reservoirs. The proposed two new command reservoirs are at an elevation high
enough to feed the supply area under gravity. For this reason the command
reservoirs are capable of supplying villages outside their respective supply areas
which adds redundancy, and also reliability, to the system.
4.2 PIPELINES AND PUMP STATIONS
Existing pipelines from the Nkambako WTW were designed to cater for the Letaba
system only. Linking of the three systems will require the installation of additional
bulk water pipeline capacity and the upgrading of clear water pumps. It is proposed
that two new bulk pipelines be constructed, one from Nkambako WTW to the existing
Babanana command reservoir (command Reservoir B) and the other from Nkambako
WTW to the existing Serolorolo Command Reservoir (command reservoir A). A
pipeline with a booster pump station is proposed to link the Babanana command
reservoir and the proposed Mohlakong regional reservoir in Thapane. The existing
300 mm diameter pumping main from the Nkambako WTW will be dedicated to
supply the regional reservoir at Runnymede.
GGrroooott LLeettaabbaa RRiivveerr WWaatteerr DDeevveellooppmmeenntt PPrroojjeecctt ((GGLLeeWWaaPP)) xiii
Technical Study Module : Bulk Water Distribution Infrastructure : Volume 8 May 2010
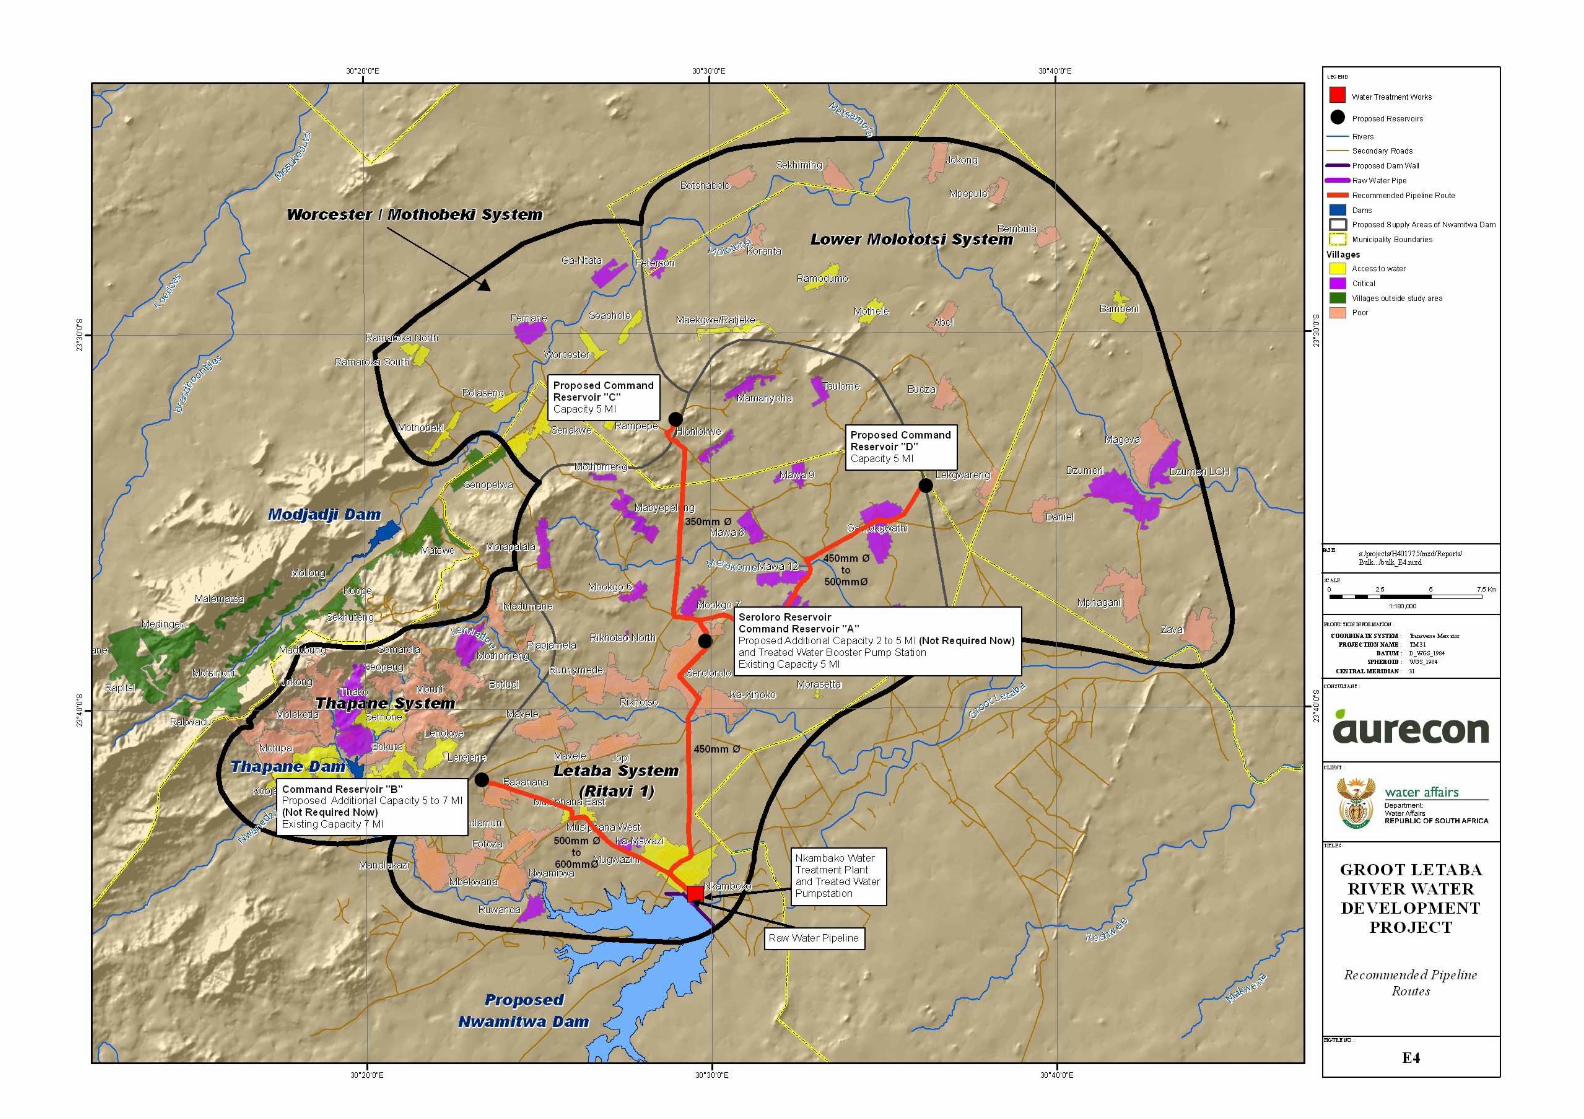
The Worcester/Molototsi system (including parts of the Giyani supply area) has to be
linked by new pipelines from Serolorolo command reservoir to the proposed
command reservoirs, C and D. These reservoirs will then feed into Worcester/-
olototsi through the Worcester/Mothobeki and the Giyani supply systems.
The existing clear water pumps at Nkambako WTW cannot supply the combined
system and it is therefore proposed that new pumping capacity be provided to serve
the Babanana command reservoir and another for the Serolorolo command reservoir,
and that the existing pumps be used to serve the Runnymede regional reservoir.
There is also a need for a rising main with pump station to supply the proposed
command reservoir C north-west of the village of Hlohlokwe from the command
reservoir at Serolorolo. Command reservoir D, situated to the north-east of
Gamokgwathi, can be fed by the bulk water gravity main from the existing command
reservoir at Serolorolo.
4.3 WATER TREATMENT WORKS
In order to satisfy the anticipated growth in future peak week water requirements, the
Nkambako WTW will ultimately have to be expanded to a capacity of approximately
45 Mℓ/d. This will enable the WTW to meet the peak week water demand in 2027. It
is important for Mopani District Municipality to meter and monitor the actual water
usage to enable them to plan for the timely expansion of the Nkambako WTW in a
modular fashion.
5. PRELIMINARY DESIGN OF BULK INFRASTRUCTURE
The analysis of the existing networks was done with reference to the current DWAF
guidelines entitled “Technical guidelines for planning and design in the development
of water and sanitation services” (DWAF, 2004). The DWAF technical guidelines
were also checked against the recommendations made in the definitive publication on
urban planning and infrastructure standards, Guidelines for human settlement
planning and design (Department of Housing, 2000).
5.1 COMMAND RESERVOIRS
An analysis was undertaken to determine the available storage in hours, based on
the standard and high water requirement for 2007 and 2027. It is proposed that the
two new command reservoirs C and D be sized at 5 Mℓ. This would ensure
compliance with the requirement to provide approximately 48 hours of storage in the
reticulation system in the case of a pumped supply with one source and
approximately 36 hours of storage in the reticulation system in the case of a pumped
GGrroooott LLeettaabbaa RRiivveerr WWaatteerr DDeevveellooppmmeenntt PPrroojjeecctt ((GGLLeeWWaaPP)) xiv
Technical Study Module : Bulk Water Distribution Infrastructure : Volume 8 May 2010
supply with two sources. This capacity is also comparable to the existing 5 Ml
Reservoir at Serolorolo and the existing 7 Mℓ Reservoir at Babanana.
5.2 PIPELINES AND PUMP STATIONS
Various pipeline routes to each of the command reservoirs were identified and
evaluated to determine the most economical options, taking factors such as capital
costs (mainly a function of pipeline length), operating costs (influenced by pumping
head and pipe friction), maintenance costs, and operational aspects (e.g. access to
pipeline route) into account.
Peak week factors of 1,5 and 2,0 were applied to the AADD for the bulk water rising
and gravity mains respectively. The peak week factor of 1,5 used for the rising mains
includes provision for pumping 20 hours per day.
Pumping systems were optimised on the basis of the present value of capital,
operating and maintenance costs of each pipeline for different pipeline diameters for
the 2027 demand scenarios.
A preferred pipeline route was selected to each of the command reservoirs, based on
the optimisation for the 2027 demand scenario. The optimisation process was then
repeated for the 2008 demand scenario to determine the optimum pipeline diameter
required in the short-term. This was used as a basis for evaluating the possibility of
phasing the construction of infrastructure. The cost functions used for calculating the
capital cost of the pumps and associated mechanical and electrical equipment were
based on multi-stage centrifugal pumps.
The preliminary design of new works takes account of, the capacity of existing
infrastructure, such as pumps and pipelines. Based on the good working condition of
existing pumps, it is preferable to utilise the existing infrastructure as far as possible.
The proposed pipeline routes are shown in Figure E4.

GGrroooott LLeettaabbaa RRiivveerr WWaatteerr DDeevveellooppmmeenntt PPrroojjeecctt ((GGLLeeWWaaPP)) xvi
Technical Study Module : Bulk Water Distribution Infrastructure : Volume 8 May 2010
5.3 WATER TREATMENT WORKS
The Nkambako WTW has a capacity of 12 Ml/d (including the recently constructed
6 Mℓ/d extension). In view of the uncertainty associated with the current and future
water requirements it is proposed that any future upgrading be undertaken in
increments of 12 Mℓ/d. The High Level Service water requirement scenario indicates
that the capacity of the WTW (based on peak week water requirements) should be
45 Mℓ/d in 2027. This water requirement assumes that all the settlements in the
logical supply area of the proposed Nwamitwa Dam have installed reticulation
networks down to village level.
The treated water must comply with the SANS Class I specification. It is noted that
some limited urban development exists within the catchment of the proposed dam
and is close to the high water mark. It can therefore be expected that raw water
quality will decline over time, particularly as regards to orthophosphate and nitrate,
and that a degree of eutrophication may occur in the future. It is recommended that
adequate sanitation be provided by the Water Services Authority in order to limit the
danger of bacteriological contamination of the water source.
The following long-term water quality changes may occur in the proposed Nwamitwa
Dam: slightly lower pH, increase in dissolved metals, (Fe and Mn in bottom water),
increase in organic carbon associated with algae, possible increase in turbidity and
TDS, and possible increase in e-coli. It is therefore important that the water treatment
process be designed for the possible long term water quality that can be expected.
5.4 RAW WATER PIPELINE AND PUMP STATION
The existing raw water balancing dam at the WTW has a full supply level of
approximately 474 m, whereas the operating level in the Nwamitwa Dam is likely to
fluctuate from 470 m (i.e. 15% full) to 479,5 m (i.e. full supply level). It is therefore
necessary to design the system to allow the filling of the balancing dam under gravity
when the water level in the Nwamitwa Dam is high enough. Pumping is necessary
when the water level in Nwamitwa Dam is lower than that in the balancing dam.
It would not be possible to locate the pump station at the Nwamitwa Dam, as the
fluctuating water level makes it impossible to cover the complete operating range in
flows (even when equipping the pumps with variable speed drives). The control of
the switching from gravity to pumping mode, and vice versa, would also be
complicated.

GGrroooott LLeettaabbaa RRiivveerr WWaatteerr DDeevveellooppmmeenntt PPrroojjeecctt ((GGLLeeWWaaPP)) xvii
Technical Study Module : Bulk Water Distribution Infrastructure : Volume 8 May 2010
The preferred method of operation would be a hydraulically controlled system
whereby the existing balancing dam would be filled under gravity when the water
level in the Nwamitwa Dam is above 474 m, and a new balancing dam with a full
supply level at 465 m to 467 m is filled when the water level in Nwamitwa Dam drops
below 474 m. Water would then be pumped from the lower balancing dam to the
existing balancing dam against a fixed head. This option would be suitable for fixed
speed motors and would simplify the stopping and starting of the pumps, which would
be regulated by the water level in the existing balancing dam.
The main criterion for selecting a suitable pipeline route is that the invert level of the
pipeline must remain below a level of 464 m to enable flow to gravitate to the
proposed second balancing dam.
It is recommended that a 600 mm diameter pipeline be installed from the Nwamitwa
Dam to the existing and the proposed balancing dams.
It is proposed that the new balancing dam be sized for 2 hours balancing capacity to
prevent frequent stopping and starting of the pumps. A balancing capacity of
3 780 m3 would thus be required for a peak demand of 525 ℓ/s. Based on a depth of
2 m, the surface area would be approximately 45 m x 45 m.
5.5 GROUNDWATER USE
A large number of villages in the supply area are reliant on groundwater. Many of the
boreholes, however, deliver water of poor quality and require treatment before use.
Blending poor quality borehole water with good quality water from surface water
sources to dilute the high concentrations of solutes is one method of utilising the
existing groundwater supply which was investigated.
The following groundwater use scenarios were investigated:
• Utilisation of existing groundwater supply by means of blending
• Utilisation of all existing groundwater supply by means of treatment
• Utilisation of all Class 1 existing groundwater supply
• Utilisation of future groundwater supply by means of blending
• Full groundwater utilisation
GGrroooott LLeettaabbaa RRiivveerr WWaatteerr DDeevveellooppmmeenntt PPrroojjeecctt ((GGLLeeWWaaPP)) xviii
Technical Study Module : Bulk Water Distribution Infrastructure : Volume 8 May 2010
6. NWAMITWA RWS: CONCEPTUAL MASTER PLAN
In parallel with the GLeWaP Bridging Study, DWA appointed EVN Africa (EVN) to
undertake a bulk water supply planning assignment for the area surrounding the
proposed Nwamitwa Dam. In order to ensure integration between the two studies,
EVN utilised the services of Aurecon to develop a conceptual master plan for the bulk
distribution system. The conceptual master plan integrated the planning of the
GLeWaP Regional Bulk Water Supply Infrastructure with the planning of the
"Connector" Bulk Water Supply Infrastructure. The “connector” bulk water supply
infrastructure links the command reservoirs identified in the GLeWaP Study with the
water reticulation infrastructure in each settlement area. The Nwamitwa RWS
Conceptual Master Plan Report is presented in Appendix J of this Report.
7. TIMING AND PHASING OF PROPOSED INFRASTRUCTURE
It is evident that all three water supply systems in the area currently receive an
inadequate supply of water. All the proposed infrastructure components will be
required to satisfy the specified level of service at the planning horizon of 2027.
Because of the lack of usage metering and effective water conservation and demand
management, there is uncertainty regarding current and projected future water
requirements. Therefore the implementation of the bulk connector infrastructure
should proceed with caution. It is believed that there is an immediate need to
implement certain components of new bulk regional infrastructure as proposed in this
report.
The proposed timing and phasing of the bulk water supply infrastructure (both
Regional and Connector Infrastructure) is based on the following considerations:
1) The need to utilise existing unutilised bulk water supply infrastructure
2) The need to provide reliable water services to areas which currently receive
no potable water
3) The need to augment water supplies to areas which currently experience
water shortages and water rationing
4) The need to expand the water reticulation network to all settlements and
villages.
A number of logical schemes have been conceptualized and are shown in Figure E5.


GGrroooott LLeettaabbaa RRiivveerr WWaatteerr DDeevveellooppmmeenntt PPrroojjeecctt ((GGLLeeWWaaPP)) xx
Technical Study Module : Bulk Water Distribution Infrastructure : Volume 8 May 2010
It is estimated at the total cost to implement the proposed Regional Bulk Water
Supply Infrastructure is approximately R313 million in 2009 terms.
8. CONCLUSIONS
The study confirmed that critical shortages of treated potable water exist in the
Letaba, Thapane and Worcester/Molototsi systems. These water shortages can be
attributed to insufficient water resources, the lack of bulk water infrastructure and
incorrect pump type selection. In order to alleviate these shortages, it is imperative
that the regional bulk water supply infrastructure as proposed in the
recommendations of this report be implemented. It is important that the design of the
regional bulk water supply infrastructure be integrated with the design of the bulk
connector infrastructure in order to avoid unnecessary redundancies in the water
supply system and to ensure that the most optimal design is obtained. There is
uncertainty regarding the actual current and expected future water requirements in
the area of supply of the proposed Nwamitwa Dam. It is therefore imperative that
Mopani District Municipality ensure the metering and monitoring of all the proposed
bulk water supply schemes. The expansion of the Nkambako WTW could be
undertaken modularly as the water requirement increases in the future.
It is important to ensure that the recently constructed 355 mm Xihoko rising main is
able to deliver water to the command reservoir at Serolorolo and that the Nkambako
WTW is functioning at 12 Ml/d. Proposed modifications to this rising main have been
made in this report and should be implemented as soon as possible. This will ensure
that the existing bulk water infrastructure is fully utilised and certain villages that have
not received potable water before will now be able to receive potable water.
Most of the good quality groundwater is found in the relatively wetter western part of
the study area. The north-eastern part of the region, namely the villages in the
Worcester/Molototsi system are being supplied from boreholes with Class III and IV
water, which is unacceptable for potable use. Groundwater could potentially supply a
significant portion of the future water requirements in the logical supply area of the
proposed Nwamitwa Dam, either through blending with potable supplies or by onsite
treatment prior to conveying it to the regional bulk water supply reservoirs. More
detailed investigative studies are necessary in order to determine the full potential of
and develop the groundwater in the area.
GGrroooott LLeettaabbaa RRiivveerr WWaatteerr DDeevveellooppmmeenntt PPrroojjeecctt ((GGLLeeWWaaPP)) xxi
Technical Study Module : Bulk Water Distribution Infrastructure : Volume 8 May 2010
9. RECOMMENDATIONS
9.1 REGIONAL BULK WATER SUPPLY INFRASTRUCTURE
The following recommendations are made regarding the implementation of the
regional bulk water supply infrastructure:
i) The Regional Bulk Water Supply Infrastructure as proposed should be
implemented.
ii) The proposed timing and phasing of the bulk water supply infrastructure (both
Regional and Connector Infrastructure) be based on the following
considerations:
1) The need to utilise existing bulk water supply infrastructure to maximum
capacity
2) The need to augment water supplies to areas which currently receive
little or no potable water
3) The need to augment water supplies to areas which currently experience
water shortages and water rationing
4) The need to expand the water reticulation network to all settlements and
villages.
iii) The Nkambako WTW shall be designed to cater for the expected changes in
the raw water quality in the long term.
iv) The following upgrades are recommended for the existing 355 mm Xihoko
rising main:
• Replace approximately 1 200 m of Class 6 PVC-U pipes with Class 9
pipes;
• Install two new pumps (i.e. one duty, one standby) at the WTW to feed
the 355 mm rising main (i.e. the existing pumps are not suited for the
required duty).
• Construct a sump at the suction side of the booster pump station or
install a pressure relief valve.
v) The Mopani District Municipality should implement a metering and monitoring
system in order to ascertain the actual water consumption for domestic
purposes and to establish how the requirement changes with the

GGrroooott LLeettaabbaa RRiivveerr WWaatteerr DDeevveellooppmmeenntt PPrroojjeecctt ((GGLLeeWWaaPP)) xxii
Technical Study Module : Bulk Water Distribution Infrastructure : Volume 8 May 2010
implementation of the regional bulk water supply and connector bulk
infrastructure.
vi) The capacity of the Babanana Reservoir (command reservoir B) and the
Serolorolo Reservoir (command reservoir A) should be increased when the
future water requirements reach the stage that there is insufficient emergency
and balancing storage in the respective supply areas.
vii) Provision should be made for including water from a future regional
groundwater supply system in the bulk infrastructure which stores and
distributes treated water from surface sources.
viii) It is proposed that the regional bulk water supply infrastructure supplying the
Worcester/Molototsi System be used to supplement the water requirement
shortfall in the Modjadji system during off peak periods should it be required.
GGrroooott LLeettaabbaa RRiivveerr WWaatteerr DDeevveellooppmmeenntt PPrroojjeecctt ((GGLLeeWWaaPP)) xxiii
Technical Study Module : Bulk Water Distribution Infrastructure : Volume 8 May 2010
TABLE OF CONTENTS
Page
1. STUDY INTRODUCTION ............................................................................................... 1
1.1 BACKGROUND TO PROJECT .............................................................................................. 1
1.2 SCOPE AND ORGANISATION OF PROJECT ........................................................................... 2
1.3 SCOPE OF THIS REPORT .................................................................................................... 5
2. SITUATION ASSESSMENT .............................. ............................................................. 6
2.1 EXISTING INFORMATION AND STUDIES ............................................................................... 6
2.2 CURRENT SUPPLY AREAS .................................................................................................. 7
2.2.1 Letaba/Ritavi System .................................................................................... 8
2.2.2 Thapane System ......................................................................................... 12
2.2.3 Worcester/Molototsi Scheme ...................................................................... 14
2.2.4 Giyani System............................................................................................. 15
2.3 EXISTING WATER TREATMENT WORKS AT NKAMBAKO ........................................................ 15
2.3.1 Raw Water Source and Quality ................................................................... 15
2.3.2 Required Treated Water Quality ................................................................. 16
2.3.3 Description and Performance of the Existing Treatment Works .................. 17
2.4 EXISTING GROUNDWATER USE ......................................................................................... 18
3. INFRASTRUCTURE NEEDS ........................................................................................ 21
3.1 WATER REQUIREMENTS ................................................................................................... 21
3.2 LOGICAL SUPPLY AREA .................................................................................................. 22
4. INFRASTRUCTURE MASTER PLAN ........................ .................................................. 25
4.1 REGIONAL BULK INFRASTRUCTURE ................................................................................. 25
4.1.1 Command Reservoirs ................................................................................. 25
4.1.2 Pipelines and pump stations ....................................................................... 26
4.1.3 Water Treatment Works .............................................................................. 28
4.2 GROUNDWATER USE ....................................................................................................... 29
4.2.1 Water Quality .............................................................................................. 30
5. COMMAND RESERVOIRS ........................................................................................... 32
5.1 DESIGN CRITERIA ........................................................................................................... 32
5.2 COMMAND RESERVOIRS ................................................................................................. 32
6. PIPELINES AND PUMP STATIONS ....................... ..................................................... 34
6.1 DESIGN CRITERIA AND METHODOLOGY ............................................................................ 34
6.1.1 Identification of potential pipeline routes ..................................................... 34
6.1.2 Water demands .......................................................................................... 34
6.1.3 Criteria for optimisation of pumping schemes ............................................. 35
6.1.4 Criteria for pump selection .......................................................................... 36
GGrroooott LLeettaabbaa RRiivveerr WWaatteerr DDeevveellooppmmeenntt PPrroojjeecctt ((GGLLeeWWaaPP)) xxiv
Technical Study Module : Bulk Water Distribution Infrastructure : Volume 8 May 2010
6.2 UTILISATION OF EXISTING INFRASTRUCTURE .................................................................... 36
6.3 OPTIMISATION OF RISING AND GRAVITY MAINS ................................................................ 39
6.3.1 Pipe material selection ................................................................................ 39
6.3.2 WTW to Command Reservoir A : new infrastructure ................................... 39
6.3.3 WTW to Command Reservoir A : Utilising the existing Xihoko Pipeline ....................................................................................................... 43
6.3.4 WTW to Command Reservoir B .................................................................. 47
6.3.5 Command Reservoir A to Command Reservoir C ....................................... 51
6.3.6 Command Reservoir A to Command Reservoir D ....................................... 56
6.4 FINAL PIPELINE ROUTE SELECTION .................................................................................. 59
6.5 PUMP SIZING AND SELECTION ......................................................................................... 59
6.5.1 Pump duties ................................................................................................ 59
6.5.2 Pump type selection ................................................................................... 61
6.5.3 Characteristic curves and pump selection ................................................... 61
6.5.4 Preliminary pump station layouts ................................................................ 64
7. WATER TREATMENT WORKS ............................. ...................................................... 65
7.1 DESIGN CRITERIA ........................................................................................................... 65
7.2 CAPACITY ...................................................................................................................... 65
7.3 REQUIRED QUALITY OF TREATED WATER ........................................................................ 65
7.4 FUTURE RAW WATER QUALITY ....................................................................................... 66
7.5 PRELIMINARY PROCESS .................................................................................................. 66
7.5.1 Chemical dosing ......................................................................................... 66
7.5.2 Flocculation ................................................................................................ 67
7.5.3 Liquid solids separation .............................................................................. 67
7.5.4 Filtration ...................................................................................................... 67
7.5.5 Stabilisation ................................................................................................ 67
7.5.6 Disinfection ................................................................................................. 68
7.5.7 Process control ........................................................................................... 68
7.6 PRELIMINARY LAYOUT .................................................................................................... 68
8. RAW WATER PIPELINE AND PUMP STATION ............... ........................................... 69
8.1 DESIGN CRITERIA AND METHODOLOGY ........................................................................... 69
8.1.1 Operation of the raw water supply system .................................................. 69
8.1.2 Identification of potential pipeline routes and location of proposed balancing dam ............................................................................................ 71
8.1.3 Water demand ............................................................................................ 71
8.2 OPTIMISATION OF INFRASTRUCTURE COMPONENTS .......................................................... 71
8.2.1 Pipeline diameters ...................................................................................... 71
8.2.2 Balancing dam ............................................................................................ 72
8.2.3 Pump sizing ................................................................................................ 72
8.3 PRELIMINARY PUMP STATION LAYOUT ............................................................................. 73
GGrroooott LLeettaabbaa RRiivveerr WWaatteerr DDeevveellooppmmeenntt PPrroojjeecctt ((GGLLeeWWaaPP)) xxv
Technical Study Module : Bulk Water Distribution Infrastructure : Volume 8 May 2010
9. GROUNDWATER UTILISATION ........................... ....................................................... 74
9.1 FULL UTILISATION OF EXISTING GROUNDWATER SUPPLY BY M EANS OF BLENDING .............. 74
9.2 UTILISATION OF ALL EXISTING GROUNDWATER SUPPLY BY MEANS OF TREATMENT ........... 75
9.3 UTILISATION OF ALL CLASS 1 EXISTING GROUNDWATER SUPPLY ...................................... 76
9.4 UTILISATION OF FUTURE GROUNDWATER SUPPLY BY MEANS OF BLENDING ....................... 77
9.5 FULL GROUNDWATER UTILISATION .................................................................................. 79
9.6 INTEGRATION OF FUTURE GROUNDWATER SUPPLIES INTO PRO POSED REGIONAL BULK WATER SUPPLY INFRASTRUCTURE .............................................................................................. 80
10. NWAMITWA RWS: CONCEPTUAL MASTER PLAN .............. ..................................... 81
11. COST ESTIMATE ......................................................................................................... 83
12. TIMING AND PHASING OF PROPOSED INFRASTRUCTURE ..... .............................. 84
12.1 SCHEME 1: SUPPLY TO THE EXISTING 5 Mℓ SEROLOROLO RESERVOIR .............................. 84
12.2 SCHEME 2: SUPPLY TO GIYANI ........................................................................................ 87
12.3 SCHEME 3: SUPPLY TO THAPANE .................................................................................... 88
12.4 SCHEME 4: SUPPLY TO THE WORCESTER/MOTHOBEKI AND LOWER MOLOTOTSI SYSTEM . 89
12.5 SCHEME 5: UPGRADING OF NKAMBAKO WTW ................................................................. 90
12.6 SCHEME 6: BULK CONNECTOR INFRASTRUCTURE ............................................................ 90
13. CONCLUSIONS ........................................................................................................... 93
14. RECOMMENDATIONS ................................................................................................. 94
14.1 REGIONAL BULK WATER SUPPLY INFRASTRUCTURE .......................................................... 94
15. REFERENCES ............................................................................................................. 96

GGrroooott LLeettaabbaa RRiivveerr WWaatteerr DDeevveellooppmmeenntt PPrroojjeecctt ((GGLLeeWWaaPP)) xxvi
Technical Study Module : Bulk Water Distribution Infrastructure : Volume 8 May 2010
TABLES
Table 2.1 Raw water quality................................................................................................. 16
Table 2.2 SANS 241 – 2006 water quality ........................................................................... 16
Table 2.3 Existing groundwater resources in the supply area .............................................. 19
Table 2.4 DWAF domestic water quality classes ................................................................. 19
Table 3.1 Future water requirements in the study area ........................................................ 21
Table 3.2 Supply to the Modjadji System ............................................................................. 22
Table 4.1 DWAF Domestic Water Quality Classes .............................................................. 30
Table 5.1 Summary of design criteria .................................................................................. 32
Table 6.1 Demands at reservoirs ......................................................................................... 34
Table 6.2 Route A1 net present values for a flow of 293 ℓ/s ................................................. 41
Table 6.3 Route A2 net present values for a flow of 293 ℓ/s ................................................. 41
Table 6.4 Comparison between Routes A1 and A2 for a flow of 293 ℓ/s .............................. 42
Table 6.5 Route A1 net present values for a flow of 199 ℓ/s ................................................. 42
Table 6.6 Estimated capital costs to upgrade the existing Xihoko pipeline ........................... 45
Table 6.7 Route A1 net present values for a flow of 109 ℓ/s ................................................. 46
Table 6.8 Route A1 net present values for a flow of 203 ℓ/s ................................................. 46
Table 6.9 Route B1 net present values for a flow of 172 ℓ/s ................................................. 47
Table 6.10 Route B2 net present values for a flow of 172 ℓ/s ................................................. 49
Table 6.11 Comparison between Routes B1 and B2 for a flow of 172 ℓ/s .............................. 49
Table 6.12 Route B1 net present values for a flow of 90 ℓ/s ................................................... 50
Table 6.13 Route C1 net present values for a flow of 99 ℓ/s ................................................... 53
Table 6.14 Route C2 net present values for a flow of 99 ℓ/s ................................................... 53
Table 6.15 Route C3 net present values for a flow of 92 ℓ/s ................................................... 53
Table 6.16 Comparison between Routes C1 and C2 for a flow of 99 ℓ/s and Route C3
for a flow of 92 ℓ/s ................................................................................................ 54
Table 6.17 Routes C1 net present values for a flow of 77 ℓ/s ................................................. 54
Table 6.18 Residual head at command reservoir D ............................................................... 58
Table 6.19 Pump duties of clear water pump stations ............................................................ 59
Table 6.20 Operating range of different pump types .............................................................. 61
Table 8.1 Hydraulic capacity under gravity conditions ......................................................... 71
Table 9.1 Dam demand decrease by blending with groundwater ......................................... 75
Table 9.2 Dam demand decrease by treating all poor groundwater ..................................... 76
Table 9.3 Dam demand decrease by excluding all poor groundwater .................................. 77
Table 9.4 Dam demand decrease by proposing future wellfields ......................................... 78
Table 9.5 Dam demand decrease by KLM recommendations .............................................. 79
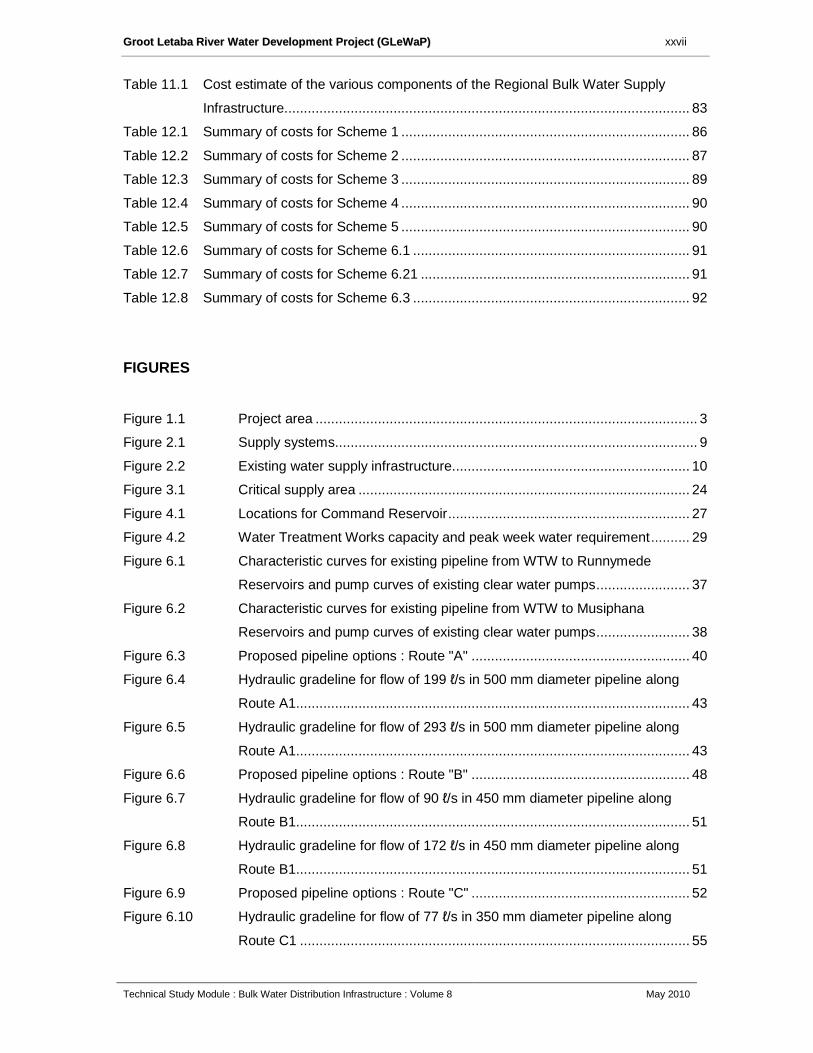
GGrroooott LLeettaabbaa RRiivveerr WWaatteerr DDeevveellooppmmeenntt PPrroojjeecctt ((GGLLeeWWaaPP)) xxvii
Technical Study Module : Bulk Water Distribution Infrastructure : Volume 8 May 2010
Table 11.1 Cost estimate of the various components of the Regional Bulk Water Supply
Infrastructure ........................................................................................................ 83
Table 12.1 Summary of costs for Scheme 1 .......................................................................... 86
Table 12.2 Summary of costs for Scheme 2 .......................................................................... 87
Table 12.3 Summary of costs for Scheme 3 .......................................................................... 89
Table 12.4 Summary of costs for Scheme 4 .......................................................................... 90
Table 12.5 Summary of costs for Scheme 5 .......................................................................... 90
Table 12.6 Summary of costs for Scheme 6.1 ....................................................................... 91
Table 12.7 Summary of costs for Scheme 6.21 ..................................................................... 91
Table 12.8 Summary of costs for Scheme 6.3 ....................................................................... 92
FIGURES
Figure 1.1 Project area .................................................................................................. 3
Figure 2.1 Supply systems ............................................................................................. 9
Figure 2.2 Existing water supply infrastructure ............................................................. 10
Figure 3.1 Critical supply area ..................................................................................... 24
Figure 4.1 Locations for Command Reservoir .............................................................. 27
Figure 4.2 Water Treatment Works capacity and peak week water requirement .......... 29
Figure 6.1 Characteristic curves for existing pipeline from WTW to Runnymede
Reservoirs and pump curves of existing clear water pumps ........................ 37
Figure 6.2 Characteristic curves for existing pipeline from WTW to Musiphana
Reservoirs and pump curves of existing clear water pumps ........................ 38
Figure 6.3 Proposed pipeline options : Route "A" ........................................................ 40
Figure 6.4 Hydraulic gradeline for flow of 199 ℓ/s in 500 mm diameter pipeline along
Route A1 ..................................................................................................... 43
Figure 6.5 Hydraulic gradeline for flow of 293 ℓ/s in 500 mm diameter pipeline along
Route A1 ..................................................................................................... 43
Figure 6.6 Proposed pipeline options : Route "B" ........................................................ 48
Figure 6.7 Hydraulic gradeline for flow of 90 ℓ/s in 450 mm diameter pipeline along
Route B1 ..................................................................................................... 51
Figure 6.8 Hydraulic gradeline for flow of 172 ℓ/s in 450 mm diameter pipeline along
Route B1 ..................................................................................................... 51
Figure 6.9 Proposed pipeline options : Route "C" ........................................................ 52
Figure 6.10 Hydraulic gradeline for flow of 77 ℓ/s in 350 mm diameter pipeline along
Route C1 .................................................................................................... 55

GGrroooott LLeettaabbaa RRiivveerr WWaatteerr DDeevveellooppmmeenntt PPrroojjeecctt ((GGLLeeWWaaPP)) xxviii
Technical Study Module : Bulk Water Distribution Infrastructure : Volume 8 May 2010
Figure 6.11 Hydraulic gradeline for flow of 99 ℓ/s in 350 mm diameter pipeline along
Route C1 .................................................................................................... 56
Figure 6.12 Proposed pipeline options : Route "D" ........................................................ 57
Figure 6.13 Hydraulic gradeline for flow of 146 ℓ/s in 450 mm diameter pipeline along
Route D1 .................................................................................................... 58
Figure 6.14 Final pipeline routes .................................................................................... 60
Figure 6.15 Characteristic curves for 500 mm pipeline to Command Reservoir A with
KSB WKLn150/5 pump curves (340 mm impeller) ...................................... 62
Figure 6.16 Characteristic curves for 500 mm pipeline to Command Reservoir A with
KSB WKLn150/5 pump curves (360 mm impeller) ...................................... 63
Figure 6.17 Characteristic curves for 450 mm pipeline to Command Reservoir B with
KSB WKLn150/5 pump curves (340 mm impeller) ...................................... 63
Figure 6.18 Characteristic curves for 350 mm pipeline from Command Reservoir A to
Command Reservoir C with KSB WKLn100/5 pump curves (265 mm
impeller) ...................................................................................................... 64
Figure 8.1 Raw water pipeline route and balancing dam .............................................. 70
Figure 8.2 Characteristic curves for 600 mm pipeline with KSB ETA 250-29 pump
curves (290 mm impeller) ........................................................................... 73
Figure 12.1 Regional water supply infrastructure : proposed scheme ............................ 85
APPENDICES (Separate volume : Volume 8 – Annexur e 1 : Appendices)
APPENDIX A : GLEWAP 2027 High Service Level Scenario Water Requirement
APPENDIX B : Supply zones and available water requirements
APPENDIX C : Storage requirements
APPENDIX D : Location and preliminary layout drawings of proposed Command Reservoir
APPENDIX E : Xihoko Rising Main Surge Analysis Graphs
APPENDIX F : Preliminary long sections of proposed pipeline routes
APPENDIX G : Pump station preliminary layout
APPENDIX H : Proposed Water Treatment Works preliminary layout and process flow
diagram
APPENDIX I : Groundwater
APPENDIX J : Master plan for the Ritavi/Letaba, Thapane and Worcester / Molototsi
Systems, Mopani District Municipality
APPENDIX K : Geotechnical Investigations
Aurecon Electronic Reference: I:\HYDRO\401775 Groot Letaba\Reports\Vol 8 Bulk Infrastructure\Vol 8 Bulk Infrastructure.doc
GGrroooott LLeettaabbaa RRiivveerr WWaatteerr DDeevveellooppmmeenntt PPrroojjeecctt ((GGLLeeWWaaPP)) xxix
Technical Study Module : Bulk Water Distribution Infrastructure : Volume 8 May 2010
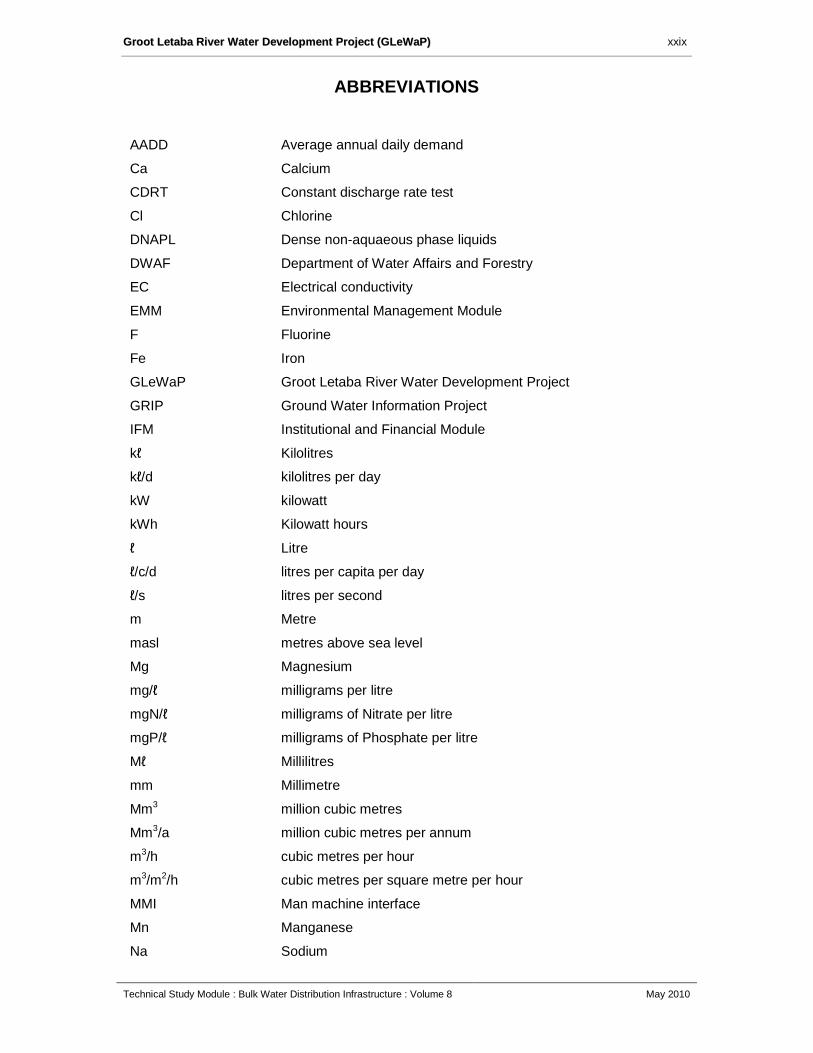
ABBREVIATIONS
AADD Average annual daily demand
Ca Calcium
CDRT Constant discharge rate test
Cl Chlorine
DNAPL Dense non-aquaeous phase liquids
DWAF Department of Water Affairs and Forestry
EC Electrical conductivity
EMM Environmental Management Module
F Fluorine
Fe Iron
GLeWaP Groot Letaba River Water Development Project
GRIP Ground Water Information Project
IFM Institutional and Financial Module
kℓ Kilolitres
kℓ/d kilolitres per day
kW kilowatt
kWh Kilowatt hours
ℓ Litre
ℓ/c/d litres per capita per day
ℓ/s litres per second
m Metre
masl metres above sea level
Mg Magnesium
mg/ℓ milligrams per litre
mgN/ℓ milligrams of Nitrate per litre
mgP/ℓ milligrams of Phosphate per litre
Mℓ Millilitres
mm Millimetre
Mm3 million cubic metres
Mm3/a million cubic metres per annum
m3/h cubic metres per hour
m3/m2/h cubic metres per square metre per hour
MMI Man machine interface
Mn Manganese
Na Sodium
GGrroooott LLeettaabbaa RRiivveerr WWaatteerr DDeevveellooppmmeenntt PPrroojjeecctt ((GGLLeeWWaaPP)) xxx
Technical Study Module : Bulk Water Distribution Infrastructure : Volume 8 May 2010
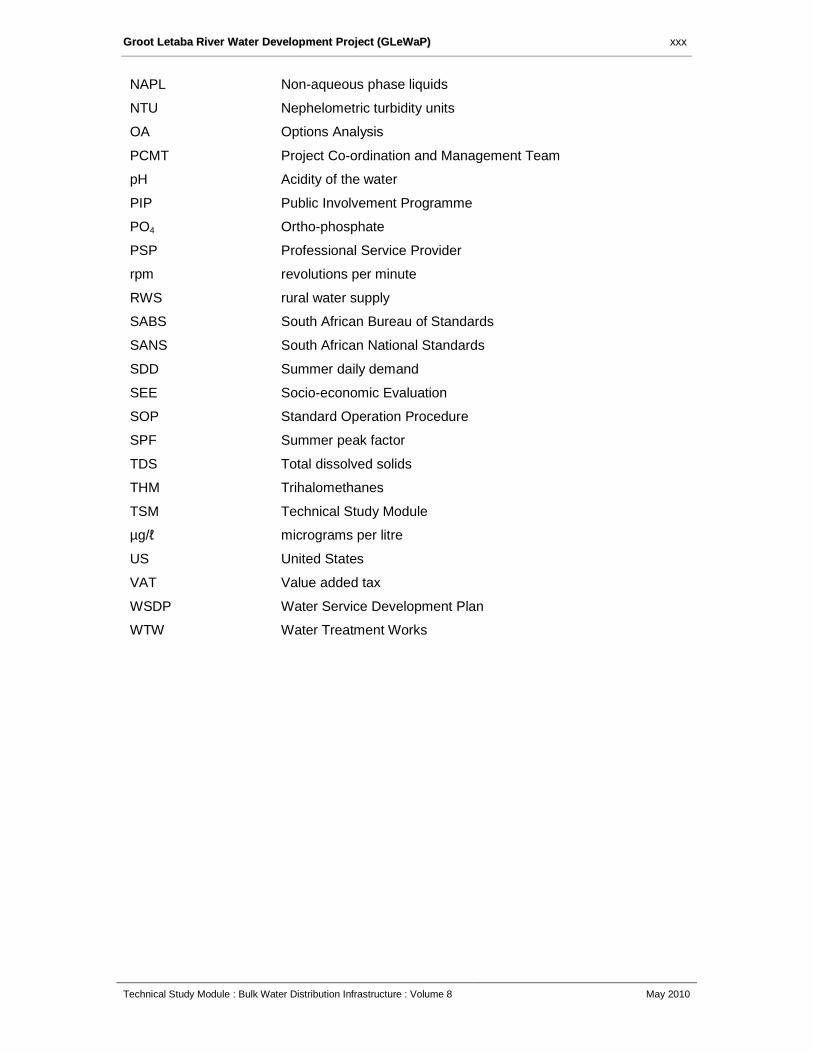
NAPL Non-aqueous phase liquids
NTU Nephelometric turbidity units
OA Options Analysis
PCMT Project Co-ordination and Management Team
pH Acidity of the water
PIP Public Involvement Programme
PO4 Ortho-phosphate
PSP Professional Service Provider
rpm revolutions per minute
RWS rural water supply
SABS South African Bureau of Standards
SANS South African National Standards
SDD Summer daily demand
SEE Socio-economic Evaluation
SOP Standard Operation Procedure
SPF Summer peak factor
TDS Total dissolved solids
THM Trihalomethanes
TSM Technical Study Module
µg/ℓ micrograms per litre
US United States
VAT Value added tax
WSDP Water Service Development Plan
WTW Water Treatment Works

GGrroooott LLeettaabbaa RRiivveerr WWaatteerr DDeevveellooppmmeenntt PPrroojjeecctt ((GGLLeeWWaaPP)) 1
Technical Study Module : Bulk Water Distribution Infrastructure : Volume 8 May 2010
1. STUDY INTRODUCTION
1.1 BACKGROUND TO PROJECT
The catchment of the Groot Letaba River has many and varied land uses with their
associated water requirements. These include significant use by agriculture in the
form of irrigated crops, commercial afforestation, tourism (particularly linked to the
Kruger National Park, which lies partially within the catchment), as well as primary
demands by the population in the catchment. The water resources available in the
catchment are limited, and considerable pressure has been put on these resources in
the past, with periods of severe and protracted water restrictions occurring over the
past 25 years. This situation has been investigated at various levels of detail by the
Department of Water Affairs (DWA).
The first major study undertaken for this area was the Letaba River Basin Study in
1985 (DWAF, 1990), which comprised the collection and analysis of all available data
on water availability and use, as well as future water requirements and potential
future water resource developments. This was followed by a Pre-feasibility Study
(DWAF 1994), which was completed in 1994. The focus of the Pre-feasibility Study
was the complete updating of the hydrology of the Basin. The next study undertaken
was the Feasibility Study of the Development and Management Options (DWAF,
1998), which was completed in 1998.
The Feasibility Study proposed several options for augmenting the water supply from
the Groot Letaba River. These included some management interventions, as well as
the construction of a dam at Nwamitwa and the possible raising of Tzaneen Dam.
These options would enable additional water to be allocated to the primary water
users, would allow the ecological Reserve to be implemented and could also improve
the assurance of supply to the agricultural sector.
This Bridging Study was initiated by (then) Department of Water Affairs and Forestry
in 2006 (now the DWA) in order to re-assess the recommendations arising from the
Feasibility Study in the light of developments that have taken place in the intervening
10 years. Other contributing factors to the DWA’s decision to undertake Bridging
Studies were the promulgation of the Water Services Act and the National Water Act
in 1997 and 1998 respectively, and the recently completed Reserve determined for
the Letaba River.
GGrroooott LLeettaabbaa RRiivveerr WWaatteerr DDeevveellooppmmeenntt PPrroojjeecctt ((GGLLeeWWaaPP)) 2
Technical Study Module : Bulk Water Distribution Infrastructure : Volume 8 May 2010
The study area is shown in Figure 1.1 , consisting of the catchment of the Groot
Letaba River, upstream of its confluence with the Klein Letaba River. The catchment
falls within the Mopani District Municipality, which is made up of six Local
Municipalities. The four Local Municipalities, parts or all of which are within the
catchment area are Greater Tzaneen, Greater Letaba, Ba Phalaborwa and Greater
Giyani. The major town in the study area is Tzaneen, with Polokwane the provincial
capital city of Limpopo located just outside of the catchment to the west.
The site of the proposed Nwamitwa Dam is also shown in Figure 1.1 . The focus of
the Feasibility Study was the Groot Letaba catchment, with the catchments of the
other rivers being included to check that environmental flow requirements into the
Kruger National Park were met, and international agreements regarding flow entering
Moçambique were met. This focus was kept for this Bridging Study.
1.2 SCOPE AND ORGANISATION OF PROJECT
The Department’s Directorate: Options Analysis (OA), appointed Ninham Shand in
Association with a number of sub consultants (listed below) to undertake this study.
In March 2009, Ninham Shand, Africon and Connell Wagner merged to become
Aurecon. The official title of the study is: "The Groot Letaba Water Development
Project: Bridging Studies: Technical Study Module".
An association exists between the following consultants for the purposes of this
study:
• Aurecon
• Semenya Furumele Consulting
• KLM Consulting Services
• Urban-Econ Developmental Economists
• Schoeman & Vennote

Figure 1.1 Project area
GGrroooott LLeettaabbaa RRiivveerr WWaatteerr DDeevveellooppmmeenntt PPrroojjeecctt ((GGLLeeWWaaPP)) 4
Technical Study Module : Bulk Water Distribution Infrastructure : Volume 8 May 2010
The Bridging Study comprises a number of modules, namely: an Environmental
Management Module (EMM), a Public Involvement Programme (PIP), and a
Technical Study Module (TSM). This Report focuses on part of the scope of work for
the Technical Study Module (TSM).
The tasks comprising the TSM are summarised below:
TASK 1: WATER REQUIREMENTS
The objective of this Task is to:
• review the current estimates of future water requirements in all user sectors
• establish present levels of water use in these sectors
• assess the availability of ground water in the project area
TASK 2: WATER RESOURCE EVALUATION
The objective of this Task is to:
• Assess the present availability of surface water from the Groot Letaba River
System
• Assess the increase in yield of the proposed new developments, taking account
of the flow regime required to maintain the ecological Reserve
TASK 3: PRELIMINARY DESIGN OF NWAMITWA DAM
The objective of this Task is to:
• Determine the most suited dam type and position for the proposed Nwamitwa
Dam
• Optimise the proposed development proposal
• Provide an updated estimate of the costs of implementing Nwamitwa Dam
TASK 4: RAISING OF TZANEEN DAM
The objective of this Task is to:
• Determine the benefits from raising Tzaneen Dam, in terms of water availability
and security of supply
• Determine the optimum method of raising Tzaneen Dam
• Optimise the proposed development proposal
• Provide an updated estimate of the costs of raising Tzaneen Dam

GGrroooott LLeettaabbaa RRiivveerr WWaatteerr DDeevveellooppmmeenntt PPrroojjeecctt ((GGLLeeWWaaPP)) 5
Technical Study Module : Bulk Water Distribution Infrastructure : Volume 8 May 2010
TASK 5: BULK WATER DISTRIBUTION INFRASTRUCTURE
The objective of this Task is to:
• Assess infrastructure currently available to make bulk water supplies available
to the rural areas
• Undertake conceptual planning for the areas to be supplied from Nwamitwa
Dam
• Undertake a preliminary design and cost estimate for the proposed new bulk
water distribution infrastructure
TASK 6: IMPLEMENTING PROGRAMME
The objective of this Task is to determine a realistic programme for the
implementation of the proposed developments
TASK 7: WATER QUALITY
The objective of this Task is to undertake an in-lake water quality analysis of the
proposed Nwamitwa Dam, to inform the design of the outlet structure of the dam
1.3 SCOPE OF THIS REPORT
This report describes Task 5 : Bulk Water Distribution Infrastructure. The content of
the task is described in more detail below.
Sub Task: Situation Assessment
Sub Task: Infrastructure Needs
Sub Task: Conceptual Planning
Sub Task: Preliminary Design
Sub Task: Cost Estimates
The outcome of these sub tasks will assist the DWA in making a decision of which
infrastructure components should be implemented as part of the GLeWaP and which
infrastructure projects should be the responsibility of the Water Service Authority for
the region to implement.

GGrroooott LLeettaabbaa RRiivveerr WWaatteerr DDeevveellooppmmeenntt PPrroojjeecctt ((GGLLeeWWaaPP)) 6
Technical Study Module : Bulk Water Distribution Infrastructure : Volume 8 May 2010
2. SITUATION ASSESSMENT
2.1 EXISTING INFORMATION AND STUDIES
Following discussions with representatives from the DWA, Mopani District
Municipality and consultants employed by both the DWA and Mopani District
Municipality, the following relevant sources of information were identified:
1. DWAF, Limpopo Province, Mopani District Development Plan: DWAF Project
LP 182, Book of Plans with Descriptive Details (2003 -10-15)
2. Mopani District Municipality, DWAF, Directorate Water Services Macro Planning
and Information Systems, Water Services Planning Reference Framework,
Draft 2, March 2006.
3. EVN Database of Water Requirements
4. DWAF’s Ground Water Information Project (GRIP)
5. Mopani District Municipality Water Services Development Plan 2007
6. Design Report for Letaba RWS, Xihoko Rising Main (July 2004)
A brief description of the three primary sources of information utilised to develop the
conceptual masterplan as required under this study is given below:
DWAF, Limpopo Province, Mopani District Development Plan: DWAF Project LP
182, Book of Plans with Descriptive Details
This document contained schematic plans of the bulk pipelines and settlements
served by the bulk infrastructure in the Mojadji / Letaba Rural Water Supply (RWS)
Service Area. The schematic plans gave a conceptual layout of the proposed
infrastructure required to extend the existing bulk reticulation infrastructure to all the
settlements in the supply area. In addition to schematic layout plans, a brief write-up
of each system within the Mojadji / Letaba RWS Service Area was also provided. The
write-up contained summary information such as service level profile, water resource
profile, Water Conservation and Demand Management, Water Services
Infrastructure, Water Balance, Water Services Institutional Arrangements, Customer
Services, Financial Information and a Project List. The Book of Plans was prepared
for the Department of Water Affairs and Forestry by EVN Africa Consulting Services.
GGrroooott LLeettaabbaa RRiivveerr WWaatteerr DDeevveellooppmmeenntt PPrroojjeecctt ((GGLLeeWWaaPP)) 7
Technical Study Module : Bulk Water Distribution Infrastructure : Volume 8 May 2010
Mopani District Municipality, DWAF, Directorate Wat er Services Macro Planning
and Information Systems, Water Services Planning Re ference Framework,
Draft 2, March 2006.
The Water Services Planning Reference Framework was developed by DWAF by
utilising the Directorate Macro Planning and Information Systems GIS data to compile
base maps to address specific topics. The Reference Framework was developed
primarily to evaluate the Water Service Development Plans (WSDP) of Water Service
Authorities. The Reference Framework Documents is also used to provide strategic
support and information to Local Government and Water Service Providers and to
assist these water service institutions in strategic planning and daily operations.
The Reference Frameworks contains information of the socio economic development,
Service Level Development, Water Resource Development, Water Conservation and
Demand Management, Water Services Infrastructure, Water Services Authority
Institutional Arrangement, Customer Services, Financial Profile and Project
Development.
The bulk water planning contained in the Reference Framework Document was
based on the Book of Descriptive Plans developed for DWAF, as described above.
EVN Database of Water Requirements
EVN Africa (consultants appointed by the DWAF Limpopo Region) provided a
database of water requirements for each settlement located within the area of supply
of the proposed Nwamitwa Dam. The water requirements were categorised into
different service levels, namely: basic, standard and high.
2.2 CURRENT SUPPLY AREAS
The following bulk water supply systems are operated within close proximity to the
proposed Nwamitwa Dam and could therefore be potentially supplied from the Dam:
• the Letaba Ritavi System
• the Thapane System
• the Modjadji System
• the Worcester/Mothobeki System
• the Lower Molototsi System

GGrroooott LLeettaabbaa RRiivveerr WWaatteerr DDeevveellooppmmeenntt PPrroojjeecctt ((GGLLeeWWaaPP)) 8
Technical Study Module : Bulk Water Distribution Infrastructure : Volume 8 May 2010
For the purposes of this report, the Worcester/Mothobeki and Lower Molototsi
systems are described as one System and is referred to in the documentation as the
Worcester/Molototsi System
Figure 2.1 shows the location of the four systems referred to above. The existing bulk
water supply infrastructure is shown in Figre 2.2 . Discussions were held with the
owners and operators of each of the systems in order to be able to get a good
understanding of the operation of the existing infrastructure. From the discussions
with the operators of the various systems it is evident that critical shortages of treated
potable water exist in the Letaba, Thapane and Worcester/Molototsi System. These
water shortages can be attributed to insufficient water resources, the lack of bulk
water infrastructure and incorrect pump type selection. A description of the system, its
current mode of operation and the problems being experienced in each of the
systems is described in detail below.
2.2.1 Letaba/Ritavi System
The Letaba system is bound by the Thapane system in the south-west, the lower
Worcester/Molototsi system in the north and the Greater Giyani system in the east.
The Letaba system currently draws its water from a weir in the Great Letaba River.
Raw water is pumped through a 300 mm diameter pipe to a raw water storage dam at
Nkambako Water Treatment Works (WTW).
The system was first constructed in the period pre-1994, where after a significant
number of upgrading and extension works have been undertaken to the system. The
most recent of the extension works was the construction of a 5 Mℓ command reservoir
at Serolorolo and a 315 mm diameter rising main from Nkambako WTW to Serolorolo
command reservoir. The 5 Mℓ reservoir has, however, not been operational since
construction due to inadequate upstream pipeline and pump station capacity.
The Letaba System is currently operated as outlined below:
• Raw water is treated at Nkambako WTW which has a capacity of 6 Mℓ/day.

Figure 2.1 Supply systems

Figre 2.2 Existing water supply infrastructure

GGrroooott LLeettaabbaa RRiivveerr WWaatteerr DDeevveellooppmmeenntt PPrroojjeecctt ((GGLLeeWWaaPP)) 11
Technical Study Module : Bulk Water Distribution Infrastructure : Volume 8 May 2010
• Clear water is pumped to command reservoirs at Musiphana, Runnymede,
Babanana and Serolorolo.
• Musiphana command reservoirs supply: Musiphana East, Musiphana West,
Fofoza, Nwamitwa, Ruwanda, Mugwazini, Ka-Mswazi and Nkambako.
• Babanana command reservoir supplies Babanana, Lwandlamuni, Mbekwana
and Mandlakazi.
• Runnymede command reservoir supplies Runnymede.
• The pipeline that supplies Serolorolo reservoir serves Jopi and Ka-Xihoko
reservoirs as well.
• The pipeline to Runnymede command reservoir also serves Mavele service
reservoir.
• There is a 350 mm diameter pipe which supplies Serolorolo command reservoir,
but it is not yet commissioned.
Based on the discussion with the operators of this system, a number of problems
were identified. These are listed below:
• Water rationing is currently being experienced in the area. To convey water to
one particular command reservoir, the supplies to other command reservoirs
have to be isolated. This results in villagers going for days without water. It is
believed that the primary cause of this is incorrect pump-type selection and
operation problems at the WTW.
• There are many illegal connections on the bulk mains causing a lot of
inefficiencies in the supply system. This is mainly attributed to the desire by
consumers to have uninterrupted supply.
• Currently there is no water in Mookgo 7, Ga-Wale, Mawa 12, Mawa 8, Mawa 9,
Mawa 12, Gamokgwathi and Miragoma despite having supply pipelines. This is
because the 5 Mℓ command reservoir at Serolorolo is currently not operational.
• Mookgo 6, Morapalala, Mabyepelong, Hlohlokwe. Mamanyoha and Taulome
villages are not connected to the bulk supply network.

GGrroooott LLeettaabbaa RRiivveerr WWaatteerr DDeevveellooppmmeenntt PPrroojjeecctt ((GGLLeeWWaaPP)) 12
Technical Study Module : Bulk Water Distribution Infrastructure : Volume 8 May 2010
2.2.2 Thapane System
The Thapane system is bound by the Lower Modjadji system in the north and the
Letaba/Ritavi system in the east. The system serves villages which are in relatively
close proximity to each other with the exception of Madumane and Pfapfamela.
The scheme is currently under the jurisdiction of Greater Tzaneen Municipality. The
scheme is supplied by Thapane Dam, which has a reported yield of 1.5 Mm3/a. Raw
water is pumped to Thapane WTW using two submersible pumps with a total capacity
of 50 l/s. Thapane WTW has a capacity to supply 4 100 kℓ /d; this requires the raw
water pumps to both run continuously.
Supply Direction 1
• The old clear water pump station consists of two KSB pumps type WKLn 80/3,
where one is a standby. The pump delivers 34 l/s through a 200 mm diameter
pipe to Marironi command reservoir with a storage capacity of 600 kℓ.
• Marironi command reservoir provides water directly to Mapitlula, Kubjana and
Marironi villages.
• There is a 200 mm gravity main from Marironi command reservoir that supplies
Mopye and Kgwekgwe booster pump stations. Currently either Mopye or
Kgwekgwe booster pump station is supplied with water for a period of three
days, with the supply to the other pump station being isolated for that period of
time. Every three days the supply is switched to the other booster pump station.
• Mopye booster pump station consists of two pump sets of type WKLn 80/8 (one
is a standby). The pump station feeds two service reservoirs; one at Motupa
and the other at Mopye. The operation is such that they pump to one reservoir
at a time. The reservoir at Mopye is supplied until it is half-filled and then the
supply is switched to Motupa reservoir. This ensures that both reservoirs get a
supply of water per day. When half-filled, it takes about six hours for the
reservoir to empty.
• Kgwekgwe booster pump station consists of two pump sets of type WKLn 40/5,
impeller diameter 172 mm, with a rating of Q = 3 ℓ/s and H = 187 m. The pump
supplies a service reservoir at Kelekeshe schools in Moleketla. The service
reservoir supplies Moleketla, Jokong and Thako.
GGrroooott LLeettaabbaa RRiivveerr WWaatteerr DDeevveellooppmmeenntt PPrroojjeecctt ((GGLLeeWWaaPP)) 13
Technical Study Module : Bulk Water Distribution Infrastructure : Volume 8 May 2010
Supply Direction 2
• The new pump station at the WTW consists of two pump sets of type WKLn
80/11 where one is a standby. The pump delivers 19 l/s through a 200 mm
diameter to 1.5 Mℓ Mohlakong command reservoir.
• There is a 200 mm gravity main from Mohlakong command reservoir to Morutji
booster pump station.
• Morutji booster pump station consists of two pumps of type WKLn 65/3, impeller
diameter 175 mm, rating Q = 15 ℓ/s, H = 106 m. It pumps to a 1.0 Mℓ command
reservoir at Morutsi Primary School.
• There is a package plant at Semarela. Treated water is pumped to a 200 kℓ
reservoir using two pump sets of type WKLn 65/6, impeller diameter 192 mm.
Water then gravitates to the 1.0 Mℓ reservoir at Morutsi Primary School, as well
as supplying standpipes in the surrounding villages in Seopeng.
• The 1.0 Mℓ reservoir at Morutsi Primary School gravity feeds Leokwe, Moruji
villages and a 167 kℓ reservoir in Mohlakong. This service reservoir in
Mohlakong supplies Bokuta, Fobeni, Thapane, Lerejene and Relela villages.
• There is a 200 mm gravity main supplying Botludi booster pump station from the
1.0 Mℓ reservoir at Morutsi Primary School.
• Botludi booster pump station consists of two pumps of type WKLn 50/4, rating
Q = 7.4 ℓ/s, H = 142 m. It pumps to Botludi and Madumane service reservoirs.
Problems
Based on the discussion with the operators of this system, a number of problems
were identified. These are listed below:
• Villagers do not receive a continuous supply of water throughout the day. Some
villages go for three days without running water. This is as a result of
inadequate water resources and inadequate infrastructure.
• The clear water pumps at Semarela package plant cannot operate continuously
as their output is limited by the capacity of the package plant. The operators
have to wait for a number of hours for clear water tanks to fill up.
GGrroooott LLeettaabbaa RRiivveerr WWaatteerr DDeevveellooppmmeenntt PPrroojjeecctt ((GGLLeeWWaaPP)) 14
Technical Study Module : Bulk Water Distribution Infrastructure : Volume 8 May 2010
• Major parts of Relela and Jokong do not have water supply, primarily due to
lack of infrastructure. Mothomeng experiences inadequate pressure.
• There are many illegal connections on the bulk lines causing inefficiencies.
• There is a shortage of reticulation infrastructure and stand pipes have been
vandalised.
2.2.3 Worcester/Molototsi Scheme
Background
The Worcester/Molototsi system is under the jurisdiction of Mopani District
Municipality. The villages in this system are widely spaced and not all of them are
connected to the existing bulk water supply infrastructure. The primary source of
water is the Modjadji Dam, however, this supply is insufficient and the
Worcester/Molototsi system is supplemented by groundwater supplies.
Current Operation
The system currently operates as outlined below
• Water is pumped from Modjadji WTW to a 1.5 Mℓ regional reservoir in
Senopelwa, and then gravitates to Senakwe. In Senakwe there is a 200 mm
diameter branch line which supplies the Mothobeki system. Between Senakwe
and a 1.0 Mℓ regional reservoir in Rampepe, there is a booster pump station.
• There are three boreholes which also feed the 1.0 Mℓ regional reservoir in
Rampepe.
• Water gravitates from Rampepe to a 2.5 Mℓ regional reservoir in Maekgwe.
• The 2.5 Mℓ regional reservoir gravity feeds the Lower Molototsi sub-system,
which consists of Ramodumo, Mothele, Abel, Budza and Mpepule.
Problems
Based on the discussion with the operators of this system, a number of problems
were identified. These are listed below:
• Supply from Modjadji WTW to Worcester/Molototsi system is erratic as focus of
supply is mainly to Lower Modjadji sub-sytem.
GGrroooott LLeettaabbaa RRiivveerr WWaatteerr DDeevveellooppmmeenntt PPrroojjeecctt ((GGLLeeWWaaPP)) 15
Technical Study Module : Bulk Water Distribution Infrastructure : Volume 8 May 2010
• Peterson, Ga-Ntata, Koranta, Botshabelo, Sekhiming, Jokong and Bembula are
currently not linked to the bulk supply system and are supplied by boreholes.
• Water from the boreholes is of poor quality and there have been reported cases
of calcium deposition in pipes causing blockages.
2.2.4 Giyani System
Background
The Greater Giyani system is situated to the east of the Letaba system. The scheme
is fed from Giyani WTW which draws raw water from Middle Letaba and Nsami
Dams, and from a weir near Zava on the Groot Letaba River.
Current Operation
Greater Giyani is fed by gravity from a 5.7 Mℓ regional reservoir at Kremertart, where
a 400 mm diameter gravity main supplies up to a 600 Kℓ regional reservoir near
Bembula. There is a 300 mm diameter pipe gravity feeding from this regional
reservoir up to Mamphata south and then reduces to a 250 mm diameter pipe up to
Mageva. After Mageva, a 200 mm diameter pipe gravity feeds up to another 600 Kℓ
regional reservoir before Mphageni. There is a 250 mm diameter pipe from this
regional reservoir which gravity feeds Mphageni and Zava. There is a package plant
in Zava which has the capacity of producing 444 Kℓ /day, and this feeds the system
from the bottom end.
Problems
Due to all the connections and high water requirements on the bulk reticulation supply
line from Kremertart, the lower areas beyond Dzumeri do not receive any water
reticulation from a water treatment plant. Most of the settlements downstream of
Dzumeri are now relying on groundwater supply.
2.3 EXISTING WATER TREATMENT WORKS AT NKAMBAKO
2.3.1 Raw Water Source and Quality
Surface water is currently pumped from a weir on the Groot Letaba River, just
downstream of the proposed Nwamitwa Dam. The raw water is treated at the
Nkambako Water Treatment Works (WTW).
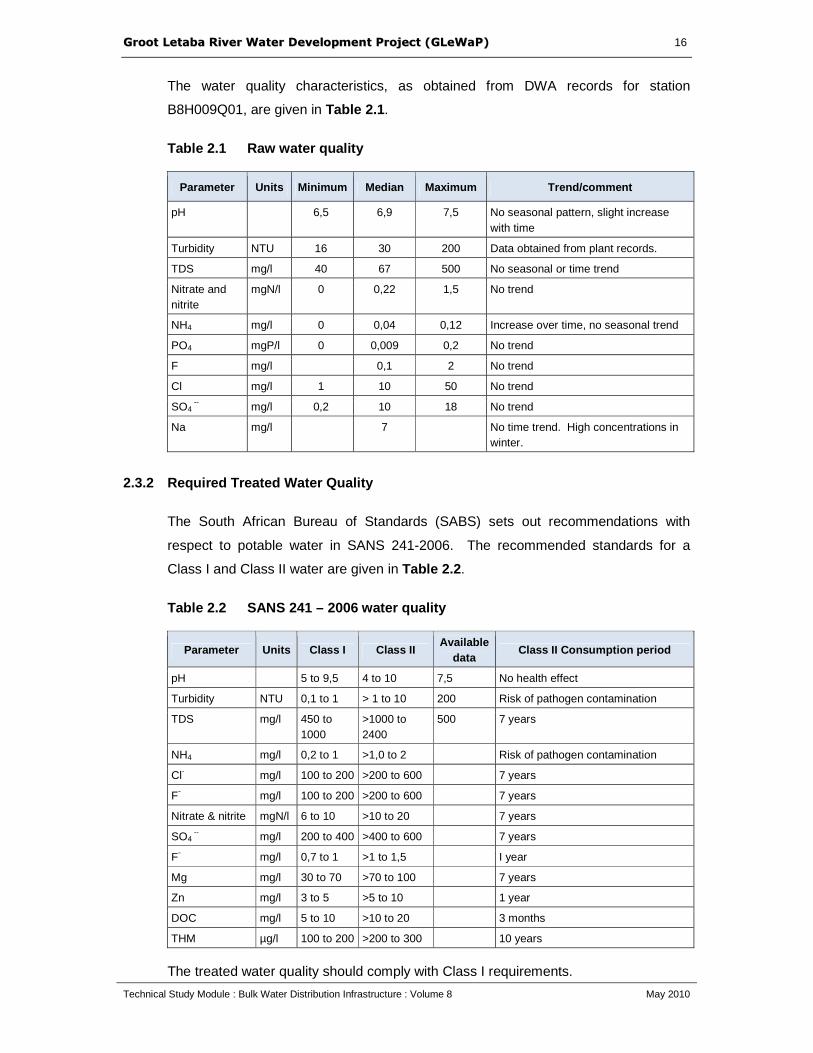
GGrroooott LLeettaabbaa RRiivveerr WWaatteerr DDeevveellooppmmeenntt PPrroojjeecctt ((GGLLeeWWaaPP)) 16
Technical Study Module : Bulk Water Distribution Infrastructure : Volume 8 May 2010
The water quality characteristics, as obtained from DWA records for station
B8H009Q01, are given in Table 2.1 .
Table 2.1 Raw water quality
Parameter Units Minimum Median Maximum Trend/comment
pH 6,5 6,9 7,5 No seasonal pattern, slight increase with time
Turbidity NTU 16 30 200 Data obtained from plant records.
TDS mg/l 40 67 500 No seasonal or time trend
Nitrate and nitrite
mgN/l 0 0,22 1,5 No trend
NH4 mg/l 0 0,04 0,12 Increase over time, no seasonal trend
PO4 mgP/l 0 0,009 0,2 No trend
F mg/l 0,1 2 No trend
Cl mg/l 1 10 50 No trend
SO4 -- mg/l 0,2 10 18 No trend
Na mg/l 7 No time trend. High concentrations in winter.
2.3.2 Required Treated Water Quality
The South African Bureau of Standards (SABS) sets out recommendations with
respect to potable water in SANS 241-2006. The recommended standards for a
Class I and Class II water are given in Table 2.2 .
Table 2.2 SANS 241 – 2006 water quality
Parameter Units Class I Class II Available
data Class II Consumption period
pH 5 to 9,5 4 to 10 7,5 No health effect
Turbidity NTU 0,1 to 1 > 1 to 10 200 Risk of pathogen contamination
TDS mg/l 450 to 1000
>1000 to 2400
500 7 years
NH4 mg/l 0,2 to 1 >1,0 to 2 Risk of pathogen contamination
Cl- mg/l 100 to 200 >200 to 600 7 years
F- mg/l 100 to 200 >200 to 600 7 years
Nitrate & nitrite mgN/l 6 to 10 >10 to 20 7 years
SO4 -- mg/l 200 to 400 >400 to 600 7 years
F- mg/l 0,7 to 1 >1 to 1,5 I year
Mg mg/l 30 to 70 >70 to 100 7 years
Zn mg/l 3 to 5 >5 to 10 1 year
DOC mg/l 5 to 10 >10 to 20 3 months
THM µg/l 100 to 200 >200 to 300 10 years
The treated water quality should comply with Class I requirements.

GGrroooott LLeettaabbaa RRiivveerr WWaatteerr DDeevveellooppmmeenntt PPrroojjeecctt ((GGLLeeWWaaPP)) 17
Technical Study Module : Bulk Water Distribution Infrastructure : Volume 8 May 2010
A comparison of the available data on water quality and the SANS Class II
requirements reveals that the primary function of the treatment works is the removal
of turbidity and disinfection of the treated water.
2.3.3 Description and Performance of the Existing T reatment Works
Raw water is withdrawn from the Groot Letaba River and pumped to a raw water
storage reservoir. From there it flows under gravity into the treatment works.
The works comprises a single module with a capacity of 6 Mℓ/d. An identical second
module is under construction, but has not yet been commissioned. After completion
of the second module the plant will have a total capacity of 12 Mℓ/d.
The plant configuration and loading parameters are as follows:
1) Chemical dosing
Coagulant chemicals and lime for pH adjustment are dosed into the inlet
channel at a point of turbulence.
2) Flocculation
Flocculation occurs in an hydraulically mixed flocculation channel having the
following characteristics:
(i) Retention : 26 minutes at design flow
(ii) Flocculation shear : Stepped 23 to 7 s-1
(iii) Primary particle reduction : 98%
3) Sedimentation (2 No tanks per module)
(i) Surface loading : 0,9 m3/m2/h
(ii) Retention time : 3,2 hours
4) Filters (3 No per module):
(i) Surface loading : 6,7 m3/m2/h

GGrroooott LLeettaabbaa RRiivveerr WWaatteerr DDeevveellooppmmeenntt PPrroojjeecctt ((GGLLeeWWaaPP)) 18
Technical Study Module : Bulk Water Distribution Infrastructure : Volume 8 May 2010
During an inspection of the works the following shortcomings were noted:
• Insufficient mixing of the chemicals into the raw water.
• Only a single sludge withdrawal pipe was provided for each of the
sedimentation tanks resulting in inadequate sludge removal. Retention
time is short.
• Backwash pumps had been removed for repair.
Perusal of the plant records showed that treated water quality failed to meet
SANS Class I requirements (the South African Bureau of Standards (SABS)
sets out recommendations with respect to potable water in SANS 241-2006)
and was generally within the Class II requirements.
With improved rapid mix of chemicals into the raw water, adequate sludge
removal and repair of the filter backwash plant, the treatment works should be
capable of producing a treated water in compliance with Class I requirements.
2.4 EXISTING GROUNDWATER USE
A desktop study (based on the information in the GRIP database) was undertaken to
ascertain the present use of groundwater in the study area as well as potential supply
from groundwater. The census of groundwater infrastructure indicates that many of
the regions which are not connected to the existing bulk water supply network, have
access to enough groundwater to satisfy the current basic survival demand of
16 litres/capita/day. The Thapane system and most of the Letaba system has access
to bulk supplies from surface sources, augmented from groundwater.
Table 2.3 shows the extent of the current groundwater use in each supply region. It
must be noted, however, that despite the existing groundwater yield exceeding the
total survival requirements, this does not necessarily mean that there is enough water
to meet this demand in every village. High yielding boreholes are not homogeneously
distributed throughout the study area and are not always located close to villages with
a high demand.

GGrroooott LLeettaabbaa RRiivveerr WWaatteerr DDeevveellooppmmeenntt PPrroojjeecctt ((GGLLeeWWaaPP)) 19
Technical Study Module : Bulk Water Distribution Infrastructure : Volume 8 May 2010
Table 2.3 Existing groundwater resources in the sup ply area
Village Region
2007 Demand (k ℓ/d aadd) Existing
Groundwater Yield (k ℓ/d)
Overall Borehole
Water Quality Class
Survival (16 ℓ/c/d)
Standard (25 ℓ/c/d)
High
(35 ℓ/c/d)
Letaba / Ritavi System 4 297 7 462 10 158 3 341 Class II
Thapane System 2 467 4 366 5 933 689 Class I
Lower Molototsi and Worcester/Mothobeki System
1 741 2 814 3 846 4 047 Class III
Giyani System 1 349 2 500 3 395 3 254 Class III
TOTAL 9 854 17 142 23 332 11 330
Another important consideration is that of borehole water quality. The DWAF water
quality guidelines were used as a basis for determining the water quality requirements
for different users. The classifications for domestic use are divided into five classes
and are given in Table 2.4 .
Table 2.4 DWAF domestic water quality classes
Most of the good quality groundwater is found in the relatively wetter western part of
the study area. The north-eastern part of the region, namely the villages in the
Worcester/Molototsi system rely on boreholes yielding Class III and IV water, which is
unsuitable for potable use. Elevated concentrations of calcium and magnesium are in
most cases responsible for the poor water quality. There are also boreholes which
are sited in the villages and are consequently being contaminated with nitrates from
nearby pit latrines. These nitrate contaminated boreholes can be rehabilitated with a
sanitary seal, but the elevated levels of calcium and magnesium (caused by
geological structures) will need ongoing treatment.
DWAF Classification Description Percentage of Study Area
Class 0 Water of an ideal quality 21
Class I A good quality water 15
Class II Water which is safe for short term use 38
Class III An unacceptable quality of water 18
Class IV Poor quality water 8

GGrroooott LLeettaabbaa RRiivveerr WWaatteerr DDeevveellooppmmeenntt PPrroojjeecctt ((GGLLeeWWaaPP)) 20
Technical Study Module : Bulk Water Distribution Infrastructure : Volume 8 May 2010
The boreholes situated outside the villages have dedicated pipelines supplying
central storage tanks. These boreholes were installed to target geological shear or
fault zones and, as such, are more reliable, both in terms of yield and water quality.

GGrroooott LLeettaabbaa RRiivveerr WWaatteerr DDeevveellooppmmeenntt PPrroojjeecctt ((GGLLeeWWaaPP)) 21
Technical Study Module : Bulk Water Distribution Infrastructure : Volume 8 May 2010
3. INFRASTRUCTURE NEEDS
3.1 WATER REQUIREMENTS
The future water requirements for all the settlements in the Study Area were supplied
to the Study Team by EVN Africa. EVN Africa were appointed by the DWA (study
entitled: Nwamitwa RWS: LPR 006) to assess the water requirements of the area
taking into account inter alia service levels, socio economic development, water
losses and the type of development. The estimated water requirements were derived
from the population data within each settlement and a water requirement in
litres/capita/day related to the level of service delivered. Three service levels were
considered, namely basic (35 l/c/d), standard (120 l/c/d) and high (200 l/c/d).
Information on the population projections and future water requirement projections
per settlement per service level is given in Appendix A of this Report. A summary of
the anticipated water requirements for the Study area is given in Table 3.1 . The total
water requirement from the proposed Nwamitwa Dam is estimated to be 11.2 Mm3/a
in 2027 when a higher level of service should be provided.
Table 3.1 Future water requirements in the study ar ea
Water Requirements for different Service Levels (Mm 3/a)
Survival Standard Higher
2007 2012 2027 2007 2012 2027 2007 2012 2027
Letaba Ritavi 1.6 1.8 2.1 2.7 3.2 3.9 3.7 4.3 5.2
Thapane 0.9 1.0 1.3 1.6 1.9 2.4 2.1 2.6 3.3
Less Thapane Source 1.5 1.5 1.5 1.5 1.5 1.5 1.5 1.5 1.5
Thapane * 0.1 0.4 0.9 0.6 1.1 1.8
Worcester +Lower Molototsi 0.6 0.7 0.8 1.1 1.2 1.4 1.5 1.6 1.9
Greater Giyani 0.5 0.6 0.9 0.9 1.0 1.7 1.2 1.4 2.3
TOTAL 2.7 3.0 3.7 4.7 5.8 7.9 7.0 8.4 11.2
Note : Excludes the 1.5 Mm3/a demand already supplied from Thapane Dam

GGrroooott LLeettaabbaa RRiivveerr WWaatteerr DDeevveellooppmmeenntt PPrroojjeecctt ((GGLLeeWWaaPP)) 22
Technical Study Module : Bulk Water Distribution Infrastructure : Volume 8 May 2010
Table 3.2 below shows the expected shortfall in the Modjadji system.
Table 3.2 Supply to the Modjadji System
Water Requirements for different Service Levels (Mm 3/a)
Survival Standard Higher
2007 2012 2027 2007 2012 2027 2007 2012 2027
Modjadji water requirements 1.4 1.7 2.4 2.6 3.2 4.8 3.5 4.3 6.4
Supply available from Modjadji Dam
4.3 4.3 4.3 4.3 4.3 4.3 4.3 4.3 4.3
Modjadji shortfall -- -- -- -- -- 0.5 -- -- 2.1
The total requirement from the proposed Nwamita Dam could be increased to by
2.1 million m3/a to 13.3 Mm3/a if the potential shortfall in the Mojadji system were to
be supplied from Nwamitwa Dam in 2027.
3.2 LOGICAL SUPPLY AREA
In order to determine the logical area for the proposed Nwamitwa Dam the water
requirements in the areas immediately surrounding the proposed dam were analysed
and then compared to the anticipated yield from the proposed Nwamitwa Dam. The
Water Resource Analysis (DWA, 2010a) indicates that 13 Mm3/a could safely be
supplied from Nwamitwa Dam at a 98% level of assurance for domestic use. The
anticipated 2027 water requirement for the Letaba/Ritavi, Thapane and
Worcester/Molototsi (including part of Giyani) supply areas is 11.2 Mm3/a. This can be
supplied from the yield of 13 Mm3/a which was determined for a dam with a Full
Supply Level of 479.5 masl.
The Modjadji Sub system currently supplies the Worcester/Molototsi system with
water. It is proposed that the current supply area for the Modjadji system be reduced
to serve only the area in the vicinity of Modjadji Dam and not the Worcester/Molototsi
system as well. This approach will make the Modjadji system self reliant (on the
Modjadji Dam), with a potential shortfall to the Modjadji system only occurring under
the high water requirement service level beyond 2012. The shortfall in the Mojadji
system excludes the existing groundwater source and any future groundwater
availability. As the Modjadji system has a high groundwater potential it is
recommended that this resource be investigated prior to investing in expensive
infrastructure to convey water from the proposed Nwamitwa Dam to the Modjadji
area.

GGrroooott LLeettaabbaa RRiivveerr WWaatteerr DDeevveellooppmmeenntt PPrroojjeecctt ((GGLLeeWWaaPP)) 23
Technical Study Module : Bulk Water Distribution Infrastructure : Volume 8 May 2010
It would also be uneconomical to lay bulk infrastructure from the proposed Nwamitwa
Dam to meet the peak week water requirement in the Modjadji system. The existing
capacity in the regional bulk infrastructure to the Worcester/Molototsi system which is
designed to meet the peak week water requirements for the area could also be used
to supply additional water to the Modjadji system during off peak periods and
additional storage capacity could be built in the Modjadji system to meet the peak
week water requirement. Providing additional potable water storage in the Modjadji
area would also increase the security of supply in the Modjadji area in case of a
disruption of supply from the proposed Nwamitwa Dam.
It is proposed that the bulk water supply to the Worcester/Molototsi System be used
to supplement the shortfall to the Modjadji system, if it is required, prior to the full high
water requirement being utilised in the Worcester/Molototsi system.
The villages of Daniel, Dzumeri, Nogeva, Mphagani and Zava which should be
supplied by the Giyani sub-system are included in the logical supply area, as these
villages currently receive no potable water because of infrastructure capacity
constraints and inadequate supplies. These villages currently rely solely upon
groundwater.
Figure 3.1 shows the logical supply area to be served from Nwamitwa Dam and the
current water availability in each settlement. The settlements identified as “water
critical” have limited or poor groundwater supply and either no bulk water supply
infrastructure or bulk water supply infrastructure which is not used. The settlements
identified as “water poor” have limited or poor groundwater supply and limited or
rationed access to potable water.
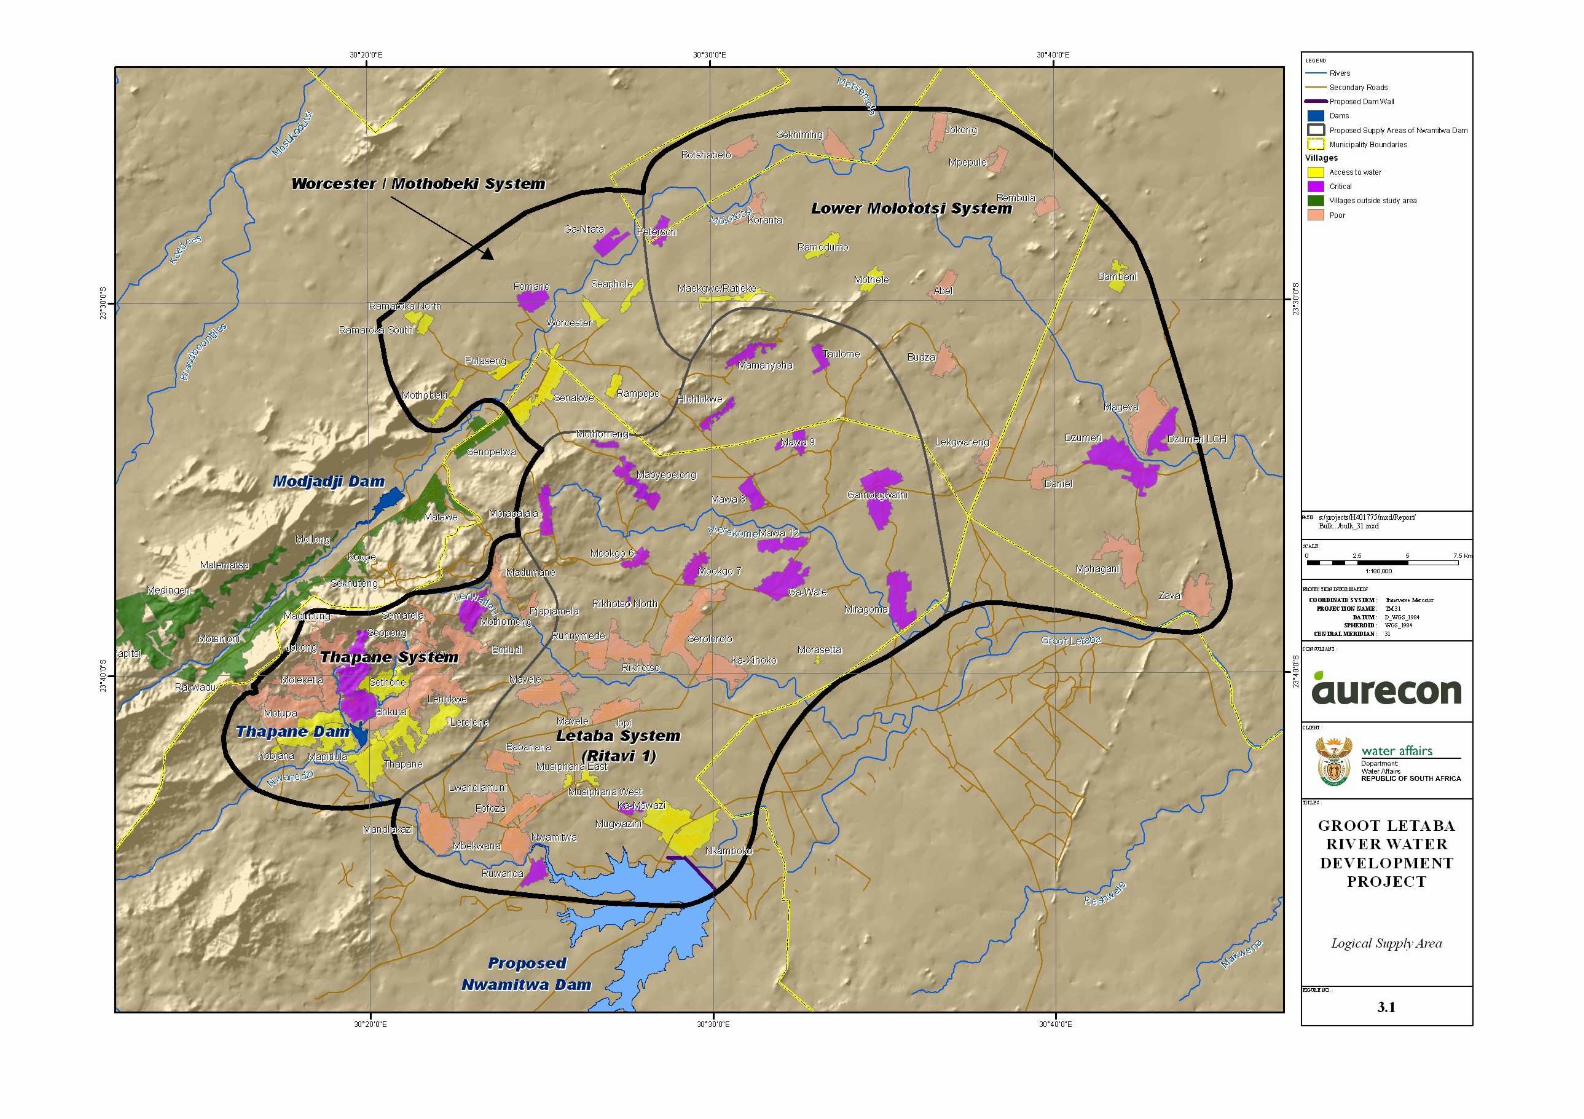
Figure 3.1 Critical supply area

GGrroooott LLeettaabbaa RRiivveerr WWaatteerr DDeevveellooppmmeenntt PPrroojjeecctt ((GGLLeeWWaaPP)) 25
Technical Study Module : Bulk Water Distribution Infrastructure : Volume 8 May 2010
4. INFRASTRUCTURE MASTER PLAN
4.1 REGIONAL BULK INFRASTRUCTURE
Once the logical supply area were defined, the next step was to determine where to
site the Regional Bulk Water Command Reservoirs, which areas the command
reservoirs should serve and what the capacity of the command reservoirs should be.
The following criteria were used in determining where to site the proposed command
reservoirs:
• The command reservoirs should be at an elevation high enough to feed the
supply area under gravity.
• The command reservoirs should be situated in order to facilitate maximum
system flexibility, provide redundancy and be able to serve more than one
system in the case of emergency.
• The command reservoirs should be able to integrate with any proposed future
groundwater supply schemes.
• The siting of the command reservoirs should be able to provide flexibility in
order to enable future expansion of the supply area if required.
4.1.1 Command Reservoirs
Currently all the supply systems include a number of village reservoirs as well as a
few main regional reservoirs. The purpose of the regional reservoirs (or command
reservoirs) is to provide balancing storage as well as emergency storage in the case
of a disruption to supply.
It is proposed to provide bulk command reservoirs in the Worcester/Molototsi system
(including a service to parts of the Giyani system), Thapane and Letaba/Ritavi
systems by constructing two new command reservoirs (command reservoir C and D).
Two existing regional supply reservoirs, namely the 5 Mℓ reservoir at Serolorolo
(command reservoir A) and the 7 Mℓ reservoir at Babanana (command Reservoir B)
should be utilised as command reservoirs. One new command reservoir (command
Reservoir C) will be located on a ridge to the north-west of the Letaba/Ritavi system
to supply the Worcester/Molototsi system. The location of this reservoir will also
enable backfeed into the Letaba/Ritavi system in case of emergency. The second
command reservoir (command Reservoir D) will be located on a hill north-east of
Gamokgwathi to supply the Giyani villages. The location of this reservoir will also
enable backfeed into the Letaba/Ritavi system in case of emergency. These two

GGrroooott LLeettaabbaa RRiivveerr WWaatteerr DDeevveellooppmmeenntt PPrroojjeecctt ((GGLLeeWWaaPP)) 26
Technical Study Module : Bulk Water Distribution Infrastructure : Volume 8 May 2010
proposed command reservoirs would be fed from the existing 5 Mℓ Serolorolo
command reservoir (command Reservoir A), which also supplies the Letaba system.
The 7 Mℓ reservoir at Babanana (command reservoir B), which also supplies the
villages near Babanana and Musiphana, will be utilised to transfer water from the
Letaba system through to the Thapane system.
There are two existing reservoirs at Serolorolo, a 600 Kℓ reservoir and a 5 Mℓ
reservoir (command Rservoir A).
The proposed two new command reservoirs are situated at an elevation high enough
to feed the supply area under gravity. For this reason the command reservoirs are
capable of supplying villages outside their respective supply areas, which adds
redundancy, and also reliability, to the system. Figure 4.1 shows the proposed
location of the command reservoirs as well as the possible supply directions of the
proposed command reservoirs. The relief in Figure 4.1 has been exaggerated to
illustrate the reasoning behind the siting of the reservoirs in terms of elevation and
location.
Appendix B shows the proposed supply zones of the command reservoirs as well as
existing bulk water supply reservoirs, and also the anticipated water requirements in
each supply zone.
4.1.2 Pipelines and pump stations
Existing pipelines from Nkambako WTW were designed to cater for the Letaba
system only. Linking of the three systems will require the installation of additional
bulk water pipeline capacity and the upgrading of clear water pumps. It is proposed
that two new bulk pipelines be constructed, one from Nkambako WTW to the existing
Babanana command reservoir (command reservoir B) and the other from Nkambako
WTW to the existing Serolorolo command reservoir (command reservoir A). A
pipeline with a booster pump station is proposed to link Babanana command reservoir
and the proposed Mohlakong regional reservoir in Thapane. The existing 300 mm
diameter pumping main from the Nkambako WTW will be dedicated to supply the
regional reservoir at Runnymede. There is concern that the pipe material chosen for
certain sections of the 350 mm diameter pipeline, recently constructed between the
Nkambako WTW and the 5 Mℓ reservoir at Serolorolo, is incorrect for the current
application. This aspect is discussed in more detail in Section 6 of this Report.

Figure 4.1 Locations for Command Reservoir
GGrroooott LLeettaabbaa RRiivveerr WWaatteerr DDeevveellooppmmeenntt PPrroojjeecctt ((GGLLeeWWaaPP)) 28
Technical Study Module : Bulk Water Distribution Infrastructure : Volume 8 May 2010
The Worcester/Molototsi system (including parts of the Giyani supply area) has to be
linked by new pipelines from Serolorolo command reservoir to the proposed
command reservoirs, C and D. These reservoirs will then feed into
Worcester/Molototsi through the Worcester/Mothobeki and the Giyani systems.
The existing clear water pumps at Nkambako WTW cannot supply the combined
system and it is therefore proposed that new pumping capacity be provided to serve
the Babanana command reservoir and another for the Serolorolo command reservoir,
and that the existing pumps be used to serve the Runnymede regional reservoir.
Mohlakong regional reservoir is at an elevation of 72 m above Babanana command
reservoir and a booster pump station will therefore be required to pump the water
destined for the Thapane system to the proposed new regional reservoir at
Mohlakong. There is also a need for a rising main with pump station to supply the
proposed command reservoir C north-west of the village of Hlohlokwe from the
command reservoir at Serolorolo. Command Reservoir D, situated to the north-east
of Gamokgwathi, can be fed by the bulk water gravity main from the existing
command reservoir at Serolorolo.
4.1.3 Water Treatment Works
In order to satisfy the anticipated growth in future peak week water requirements, the
Nkambako WTW will ultimately have to be expanded to a capacity of approximately
45 Mℓ/d. This will enable the WTW to meet the peak week water demand in 2027
(i.e. 1.5* (2027) AADD kℓ/d). Figure 4.2 shows the anticipated growth in peak week
demand (PWD) from 2007 through to 2027.
Figure 4.2 illustrates the theoretical peak week water requirement should all the
regional and connector bulk water supply infrastructure as well as the reticulation
infrastructure be implemented and fully operational for the basic, standard and high
level of service. A WTW capacity in increments of 12 Mℓ/d is shown on the Y axis.
It is important for Mopani District Municipality to meter and monitor the actual water
usage to enable them to plan for the timely expansion of the Nkambako WTW in a
modular fashion.

GGrroooott LLeettaabbaa RRiivveerr WWaatteerr DDeevveellooppmmeenntt PPrroojjeecctt ((GGLLeeWWaaPP)) 29
Technical Study Module : Bulk Water Distribution Infrastructure : Volume 8 May 2010
WTP Capacity and Peak Week Water Requirement
0
12
24
36
48
2005 2007 2009 2011 2013 2015 2017 2019 2021 2023 2025 2027
Year
Ml/d
High - PWD Standard - PWD Survival - PWD
Figure 4.2 Water Treatment Works capacity and peak week water requirement
4.2 GROUNDWATER USE
As outlined in Section 2.4 ,
A large number of villages in the region are being supplied by groundwater to meet
their daily needs. Many of the boreholes, however, deliver water of poor quality and
as such, require treatment before use. Blending poor borehole water with treated
surface water to dilute the high concentrations of solutes is one method of utilising the
existing groundwater supply which was investigated.
The following groundwater use scenarios were investigated:
• Utilisation of existing groundwater supply by means of blending
• Utilisation of all existing groundwater supply by means of treatment
• Utilisation of all Class 1 existing groundwater supply
• Utilisation of future groundwater supply by means of blending
• Full groundwater utilisation
In terms of the methodology that was followed, each village was analysed as a
separate entity. The GRIPP database allowed each village’s current borehole yield,
together with the quality of this water, to be determined. Using this information, it was
possible to calculate how much potable water treated at Nkambako WTW would be
required to blend any poor quality water to an acceptable potable standard, using the
blending ratios as described in the next section.

GGrroooott LLeettaabbaa RRiivveerr WWaatteerr DDeevveellooppmmeenntt PPrroojjeecctt ((GGLLeeWWaaPP)) 30
Technical Study Module : Bulk Water Distribution Infrastructure : Volume 8 May 2010
Should the amount of water required from the Nkambako WTW for blending exceed
the current or future demand, it was further calculated what percentage of the poor
quality groundwater (together with the blending water) could be used in order to
satisfy the demand. If the resultant groundwater and blend-water volume was
insufficient to supply the entire demand, the shortfall was met from the Dam.
The following assumptions were made in the analysis:
• If a borehole was contaminated by pit latrines (i.e. nitrates were present in the
water sample) it was completely excluded from this analysis.
• Only treated water from the WTW was used as blending water. In other words,
if clean, good quality groundwater was available, it was not used to blend with
other poor quality groundwater.
4.2.1 Water Quality
The boreholes used in the study area were chemically analysed and each borehole
was assigned a quality class. It was found that most of the borehole water being
used is of good quality, and that there are also a high percentage of boreholes that
can be used on a short-term basis. Groundwater of unacceptable quality amounts to
26%. Most of these boreholes are located in the eastern part of the study area,
furthest from the proposed Nwamitwa Dam and its WTW. Due to the fact that the
constituents of the groundwater are of a soluble nature and that potable water is
available, blending can be used to "treat" poor quality water. This basically involves
the blending of poor quality water with good quality water at defined ratios such that
the concentrations of the resulting volume place it in a Domestic Water Quality Class
0 or Class I. The DWAF Domestic Water Quality Classes are in part defined by the
concentrations given in Table 4.1 . This by no means an exhaustive list, but it does
define the main water quality problems in this region.
Table 4.1 DWAF Domestic Water Quality Classes
Class pH Chlorine (Cl)
Total Dissolved Solids (TDS)
Conductivity (EC)
Calcium (Ca)
Magnesium (Mg)
Sodium (Na)
Class 0 6-9 0-100 0-450 0-70 0-10 0-30 0-100
Class I 5-6 / 9-9.5 100-200 450-1000 70-150 10-32 30-70 100-200
Class II 4-5 / 9.5-10 200-600 1000-2000 150-370 32-80 70-100 200-400
Class III <4 / >10 >600 >2000 >370 >80 >100 >400
Using the above concentration parameters, it was determined what volume of clean
treated water (Class 0) would be required per volume of poor quality water for each
quality class, in order to obtain a resultant Class I:

GGrroooott LLeettaabbaa RRiivveerr WWaatteerr DDeevveellooppmmeenntt PPrroojjeecctt ((GGLLeeWWaaPP)) 31
Technical Study Module : Bulk Water Distribution Infrastructure : Volume 8 May 2010
• Water in Class II can form up to 25% of the final volume
• Water in Class III can form up to 15% of the final volume
• Water in Class IV can form up to 8% of the final volume
It must be noted however, that in order for the groundwater to be blended with treated
water, poor quality groundwater must be collected in a central village storage tank
and subsequently mixed with treated water in a village storage reservoir before it is
supplied to users.

GGrroooott LLeettaabbaa RRiivveerr WWaatteerr DDeevveellooppmmeenntt PPrroojjeecctt ((GGLLeeWWaaPP)) 32
Technical Study Module : Bulk Water Distribution Infrastructure : Volume 8 May 2010
5. COMMAND RESERVOIRS
5.1 DESIGN CRITERIA
The analysis of the existing networks was done with reference to the DWAF
guidelines entitled Technical guidelines for planning and design in the development of
water and sanitation services (DWAF, 2004). The DWAF technical guidelines were
also checked against the recommendations made in the definitive publication on
urban planning and infrastructure standards, Guidelines for human settlement
planning and design (Department of Housing, 2000).
Table 5.1 shows the general summary of the design criteria used in the analysis.
Table 5.1 Summary of design criteria
1.0 Peak factors Summer peak factor (SPF) = 1.5
2.0 Design flow (bulk supply
pipelines) Summer daily demand (SDD) = SPF * AADD
3.0 Design peak factor (for
reticulation) 3
4.0 Velocities 2.5 m/s for gravity mains and 2.0 m/s for pumping
mains
5.0 Storage reservoirs (sizing)
48hrs * AADD (pumped from one source)
36hrs * AADD (pumped from two sources)
24hrs * AADD (gravity source)
5.2 COMMAND RESERVOIRS
In determining the size of a reservoir the following factors must be taken into
consideration:
1) Reservoirs must allow for short-term balancing capacity to cater for the
difference in the demands from the reservoir and the supply into the reservoir.
Correctly sizing village reservoirs will reduce the capital expenditure required in
upstream infrastructure (pipelines and pump stations), as the reservoirs will
provide the balancing storage required during peak day demands as opposed to
the peak day demands being conveyed by the bulk infrastructure supplying the
reservoirs.

GGrroooott LLeettaabbaa RRiivveerr WWaatteerr DDeevveellooppmmeenntt PPrroojjeecctt ((GGLLeeWWaaPP)) 33
Technical Study Module : Bulk Water Distribution Infrastructure : Volume 8 May 2010
2) Reservoirs must have sufficient storage capacity in order to be able to supply
downstream consumers in the event of disruptions to the bulk water supply to
the reservoirs.
An analysis was undertaken to determine the available storage in hours, based on the
standard and high water requirement for 2007 and 2027. It is proposed that the two
new command reservoirs C and D be sized at 5 Mℓ. This would ensure compliance
with the requirement to provide approximately 48 hours of storage in the reticulation
system in the case of a pumped supply with one source and approximately 36 hours
of storage in the reticulation system in the case of a pumped supply with two sources.
This capacity is also comparable to the existing 5 Mℓ Reservoir at Serolorolo and the
existing 7 Mℓ Reservoir at Babanana. The available storage, in terms of hours of
supply, for the area of supply is shown in Appendix C of this Report.
A further motivation for this sizing was based on the following considerations:
• To prevent the bulk connector infrastructure from draining during a peak week
water demand should there be disruptions to the bulk water supply during this
period
• To assist with pump operation
• To provide emergency storage at the end of a two rising mains
The geographical location of the proposed Command Reservoirs on a 1:10 000
background, as well as the proposed preliminary layout drawings of a 5 Mℓ command
reservoir is shown in Appendix D of this Report.

GGrroooott LLeettaabbaa RRiivveerr WWaatteerr DDeevveellooppmmeenntt PPrroojjeecctt ((GGLLeeWWaaPP)) 34
Technical Study Module : Bulk Water Distribution Infrastructure : Volume 8 May 2010
6. PIPELINES AND PUMP STATIONS
6.1 DESIGN CRITERIA AND METHODOLOGY
This section deals with the preliminary optimisation of the treated water pipelines and
pump stations that would supply treated water to the various command reservoirs
within the bulk supply system.
6.1.1 Identification of potential pipeline routes
Various pipeline routes to each of the command reservoirs were identified and
evaluated to determine the most economical options, taking factors such as capital
costs (mainly a function of pipeline length), operating costs (influenced by pumping
head and pipe friction), maintenance costs, and operational aspects (e.g. access to
pipeline route) into account.
A description of the identified alternative pipeline routes to and from each Command
Reservoir is described in Section 6.3 of this Report.
6.1.2 Water demands
The average annual daily demands (AADD) and peak week water demands for the
2008 and 2027 scenarios are shown in Table 6.1 for each of the command
reservoirs, as well as for the Musiphana Reservoirs and the Runnymede Reservoirs.
Peak week factors of 1,5 and 2,0 were applied to the AADD for the bulk water rising
and gravity mains, respectively. The peak week factor of 1,5 used for the rising
mains includes provision for pumping 20 hours per day.
Appendix B contains a graphical illustration of the extent of the supply zones for
each bulk water supply reservoir.
Table 6.1 Demands at reservoirs
Reservoir Demand
scenario AADD (k ℓ/d) AADD (ℓ/s)
Peak week
factor
Peak week
demand
(ℓ/s)
Command Reservoir A 2008 11 466 133 1,5 199
2027 16 889 195 1,5 293

GGrroooott LLeettaabbaa RRiivveerr WWaatteerr DDeevveellooppmmeenntt PPrroojjeecctt ((GGLLeeWWaaPP)) 35
Technical Study Module : Bulk Water Distribution Infrastructure : Volume 8 May 2010
Reservoir Demand
scenario AADD (k ℓ/d) AADD (ℓ/s)
Peak week
factor
Peak week
demand
(ℓ/s)
Command Reservoir B 2008 5 154 60 1,5 90
2027 9 914 115 1,5 172
Command Reservoir C 2008 4 454 52 1,5 77
2027 5 675 66 1,5 99
Command Reservoir C
(alternative)
2008 4 189 48 1,5 73
2027 5 327 62 1,5 92
Command Reservoir D 2008 3 247 38 2,0 75
2027 6 299 73 2,0 146
Musiphana Reservoir 2008 1 166 13 1,5 20
2027 1 625 19 1,5 28
Runnymede Reservoir 2008 1 547 18 1,5 27
2027 2 132 25 1,5 37
6.1.3 Criteria for optimisation of pumping schemes
Pumping systems were optimised on the basis of the present value of capital,
operating and maintenance costs for each pipeline for different pipeline diameters for
the 2027 demand scenarios.
A preferred pipeline route was selected to each of the command reservoirs, based on
the optimisation for the 2027 demand scenario. The optimisation process was then
repeated for the 2008 demand scenario to determine the optimum pipeline diameter
required in the short-term. This was used as a basis for evaluating the possibility of
phasing the construction of infrastructure.
The net present value calculations were based on the following parameters:
• Discount period = 25 years
• Discount rate = 6%
• Electricity cost = 25 c/kWh (including voltage and transmission costs)
• Mechanical and electrical maintenance costs = 4% per annum of mechanical
and electrical costs

GGrroooott LLeettaabbaa RRiivveerr WWaatteerr DDeevveellooppmmeenntt PPrroojjeecctt ((GGLLeeWWaaPP)) 36
Technical Study Module : Bulk Water Distribution Infrastructure : Volume 8 May 2010
• Civil maintenance costs = 0,5% per annum of civil costs
The construction cost estimates were based on recent tendered rates for projects
similar in size and nature.
The choice of pipe material, the impact of waterhammer pressures, etc. are discussed
in more detail in Section 6.3 .
6.1.4 Criteria for pump selection
The cost functions applied for calculating the capital cost of the pumps and
associated mechanical and electrical equipment were based on using multi-stage
centrifugal pumps. Section 6.4 expands on the pump selection and preliminary
pump station layouts based on the pump duties determined for the optimum rising
main sizes.
6.2 UTILISATION OF EXISTING INFRASTRUCTURE
The clear water pump station at the existing WTW comprises three KSB WKLn 80/4
pumps, fitted with 220 mm impellers. The motor sizes are 110 kW, operating at
2 900 rpm. Two of the pumpsets were installed in January 2005 and are still in good
working condition. It should further be noted that the space inside the clear well
pump station is limited and it would therefore be unlikely that larger pumps could be
installed in the existing space.
The existing rising main from the WTW is a 300 mm diameter pipeline to a point
downstream of the Musiphana Reservoirs, where it changes to a 200 mm diameter
pipeline to the Runnymede Reservoirs.
Based on the good working condition of the existing pumps, it would be preferable to
utilise the existing infrastructure as far as possible.
The pumping capacity of the existing pumps is reported to be approximately 70 ℓ/s
with two pumps operating in parallel. This corresponds roughly with the combined
2027 demands at the Musiphana and Runnymede Reservoirs.
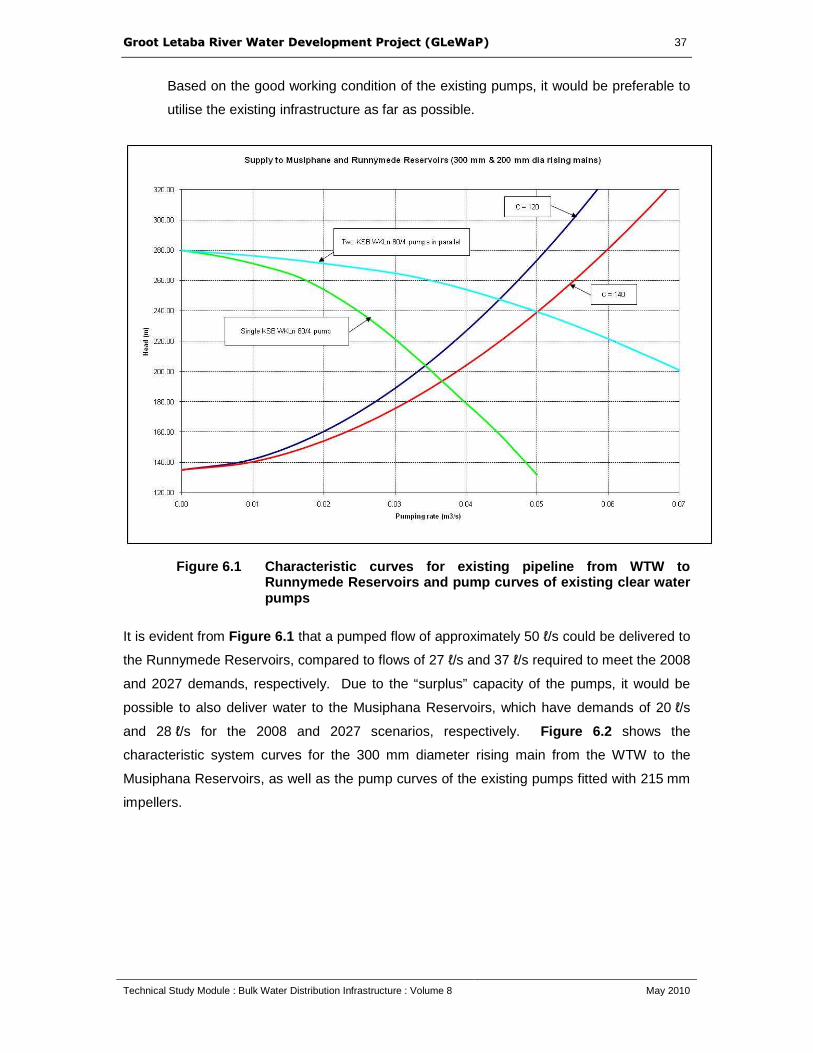
GGrroooott LLeettaabbaa RRiivveerr WWaatteerr DDeevveellooppmmeenntt PPrroojjeecctt ((GGLLeeWWaaPP)) 37
Technical Study Module : Bulk Water Distribution Infrastructure : Volume 8 May 2010
Based on the good working condition of the existing pumps, it would be preferable to
utilise the existing infrastructure as far as possible.
Figure 6.1 Characteristic curves for existing pipel ine from WTW to Runnymede Reservoirs and pump curves of existing cl ear water pumps
It is evident from Figure 6.1 that a pumped flow of approximately 50 ℓ/s could be delivered to
the Runnymede Reservoirs, compared to flows of 27 ℓ/s and 37 ℓ/s required to meet the 2008
and 2027 demands, respectively. Due to the “surplus” capacity of the pumps, it would be
possible to also deliver water to the Musiphana Reservoirs, which have demands of 20 ℓ/s
and 28 ℓ/s for the 2008 and 2027 scenarios, respectively. Figure 6.2 shows the
characteristic system curves for the 300 mm diameter rising main from the WTW to the
Musiphana Reservoirs, as well as the pump curves of the existing pumps fitted with 215 mm
impellers.

GGrroooott LLeettaabbaa RRiivveerr WWaatteerr DDeevveellooppmmeenntt PPrroojjeecctt ((GGLLeeWWaaPP)) 38
Technical Study Module : Bulk Water Distribution Infrastructure : Volume 8 May 2010
Figure 6.2 Characteristic curves for existing pipel ine from WTW to Musiphana Reservoirs and pump curves of existing cl ear water pumps
It is evident from Figure 6.2 that a pumped flow of more than 80 ℓ/s would be
achieved with two pumps operating in parallel when pumping only to the Musiphana
Reservoirs.
It can therefore be concluded that the existing clear water pumps should be used in
conjunction with the existing 200 and 300 mm diameter rising mains from the WTW to
the Musiphana and Runnymede Reservoirs to meet the demands at these reservoirs.
The 110 kW motors are also adequate to perform the above duties, but the existing
220 mm impellers need to be trimmed to 215 mm to limit the power requirements to
less than 110 kW when only one pump supplies water to the Musiphana Reservoirs.

GGrroooott LLeettaabbaa RRiivveerr WWaatteerr DDeevveellooppmmeenntt PPrroojjeecctt ((GGLLeeWWaaPP)) 39
Technical Study Module : Bulk Water Distribution Infrastructure : Volume 8 May 2010
6.3 OPTIMISATION OF RISING AND GRAVITY MAINS
6.3.1 Pipe material selection
The following assumptions were made regarding pipe materials as part of the
optimisation process:
• Pipelines with diameters smaller than 300 mm would be manufactured from
PVC-U; and
• Pipelines with diameters 300 mm and larger would be manufactured from GRP.
A Hazen-Williams friction coefficient of 130 was assumed for the pipeline
optimisation.
No detailed waterhammer analyses were undertaken (with the exception of the
existing Xihoko rising main), but it is anticipated that negative surge pressures could
be experienced on all the rising mains. The various pipe manufacturers recommend
the following to deal with negative surge pressures :
• Class 9 as a minimum on PVC-U pipes
• Class 16 as a minimum on PVC-M pipes
• A stiffness of SN 5000 on GRP pipes
The above recommendations were taken into account when determining pressure
classes due to working pressures.
6.3.2 WTW to Command Reservoir A : new infrastructu re
Figure 6.3 shows the two possible routes, i.e. Route A1 and A2, that were identified
between the WTW and Command Reservoir A.
Table 6.2 shows the net present values calculated for Route A1 for different pipeline
diameters, based on a flow of 293 ℓ/s.
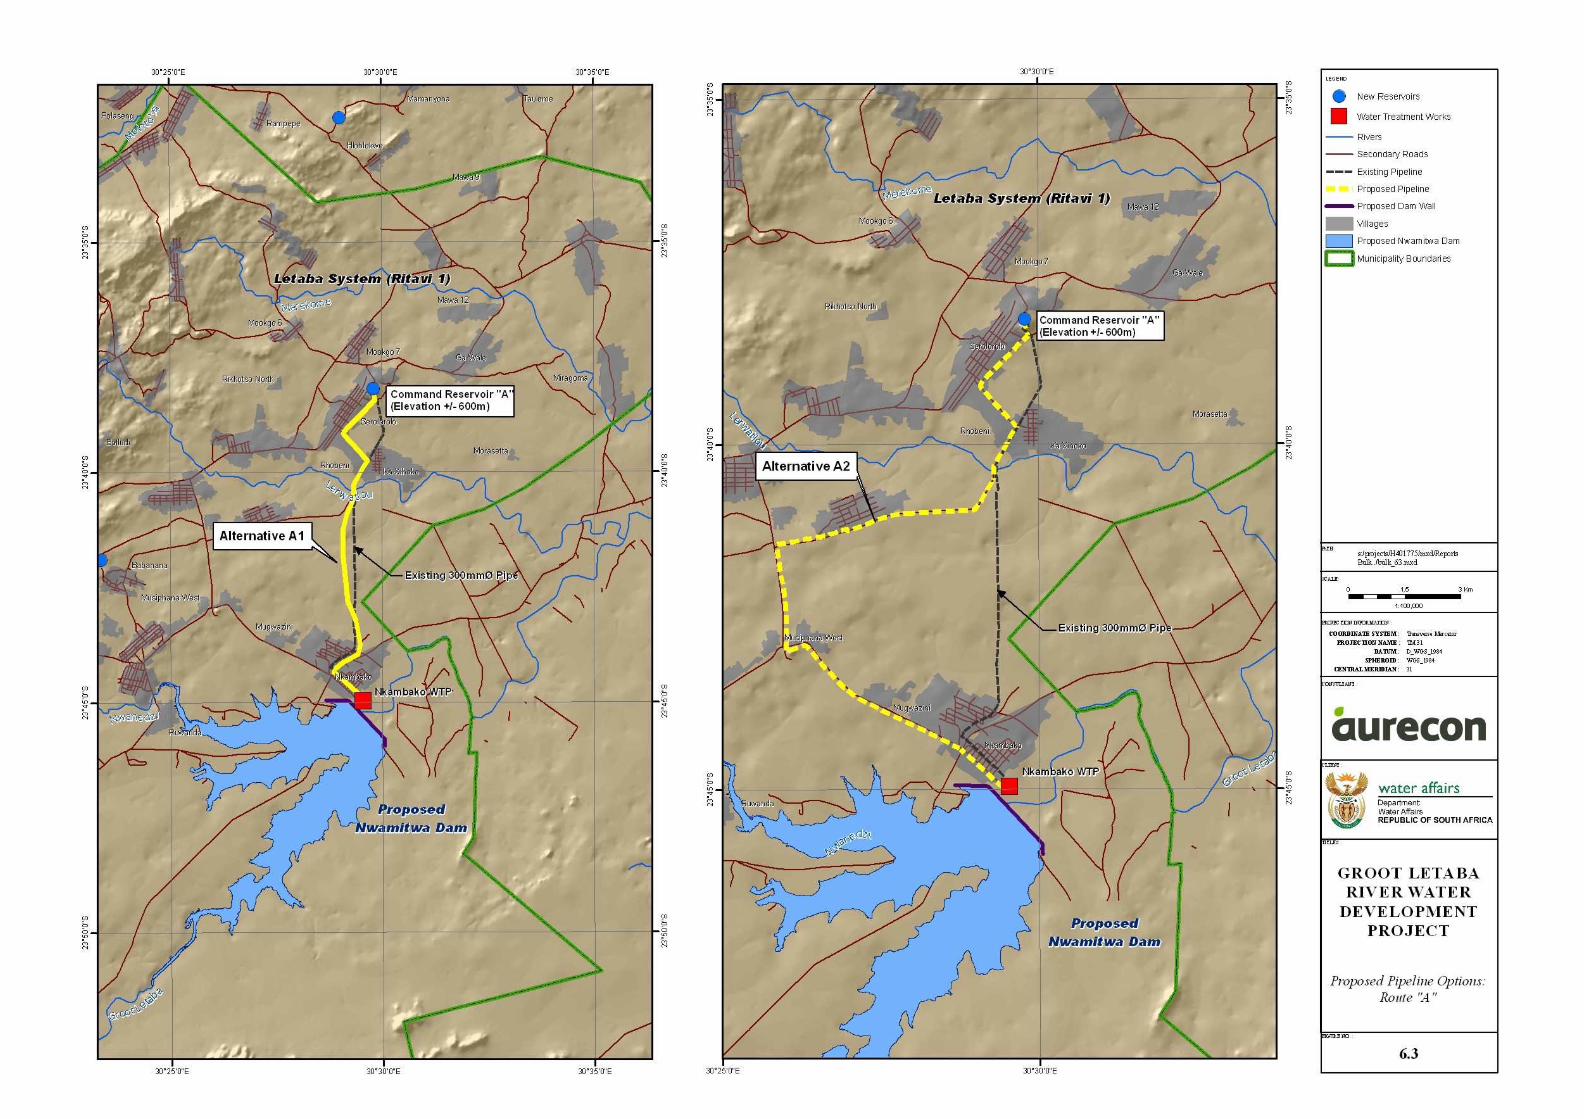
Figure 6.3 Proposed pipeline options : Route "A"

GGrroooott LLeettaabbaa RRiivveerr WWaatteerr DDeevveellooppmmeenntt PPrroojjeecctt ((GGLLeeWWaaPP)) 41
Technical Study Module : Bulk Water Distribution Infrastructure : Volume 8 May 2010
Table 6.2 Route A1 net present values for a flow of 293 ℓ/s
Pipe diameter (mm) Net present value (4%)
Net present value (6%)
Net present value (8%)
350 R 114,7 m R 102,8 m R 94,0 m
400 R 84,2 m R 76,1 m R 70,1 m
450 R 71,6 m R 65,3 m R 60,6 m
500 R 66,3 m R 60,9 m R 56,9 m
600 R 66,6 m R 61,9 m R 58,9 m
700 R 73,3 m R 68,7 m R 65,2 m
It is evident from Table 6.2 that the optimum pipeline diameter for Route A1 and a
flow of 293 ℓ/s, is 500 mm.
Table 6.2 shows the net present values calculated for Route A2 for different pipeline
diameters, based on a flow of 293 ℓ/s.
Table 6.3 Route A2 net present values for a flow of 293 ℓ/s
Pipe diameter (mm) Net present value
(4%)
Net present value
(6%)
Net present value
(8%)
350 R 161,2 m R 144,9 m R 132,8 m
400 R 115,2 m R 104,7 m R 96,8 m
450 R 95,7 m R 87,8 m R 81,9 m
500 R 87,6 m R 81,1 m R 76,2 m
600 R 87,6 m R 82,1 m R 78,0 m
700 R 96,8 m R 91,4 m R 87,4 m
It is evident from Table 6.3 that the optimum pipeline diameter for Route A2 and a
flow of 293 ℓ/s, is 500 mm.
Table 6.4 provides a comparison between the two pipeline routes for the optimum
pipeline diameter.
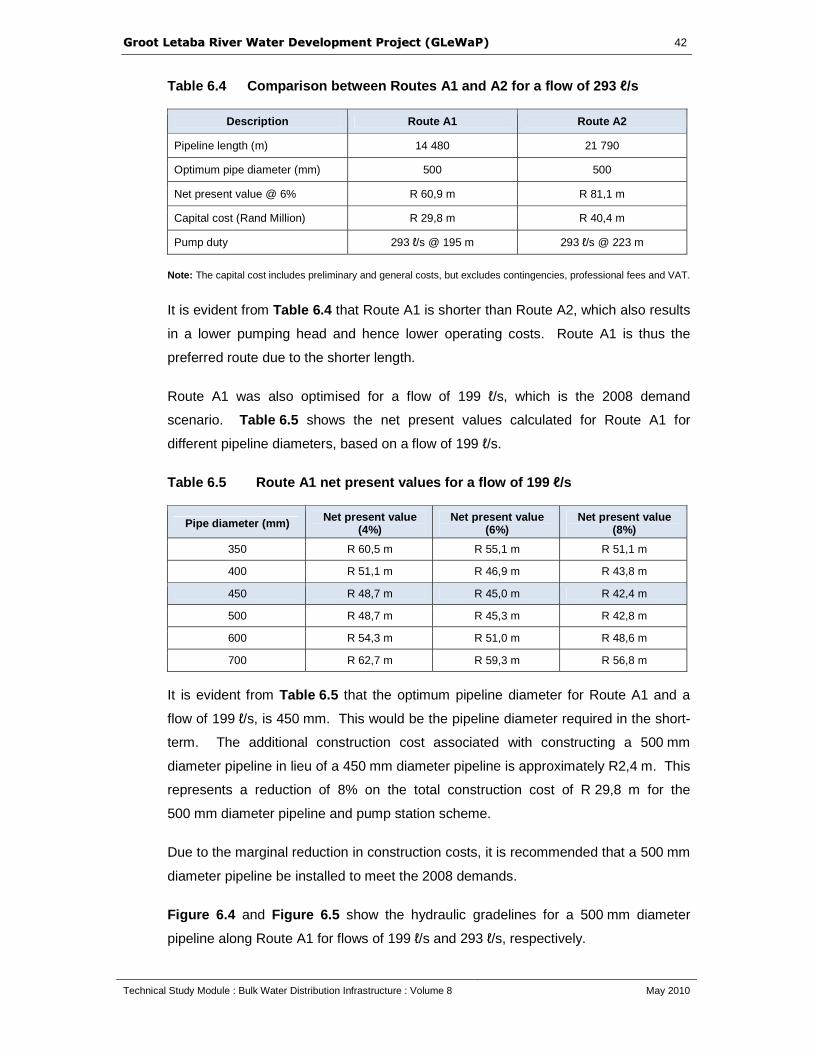
GGrroooott LLeettaabbaa RRiivveerr WWaatteerr DDeevveellooppmmeenntt PPrroojjeecctt ((GGLLeeWWaaPP)) 42
Technical Study Module : Bulk Water Distribution Infrastructure : Volume 8 May 2010
Table 6.4 Comparison between Routes A1 and A2 for a flow of 293 ℓ/s
Description Route A1 Route A2
Pipeline length (m) 14 480 21 790
Optimum pipe diameter (mm) 500 500
Net present value @ 6% R 60,9 m R 81,1 m
Capital cost (Rand Million) R 29,8 m R 40,4 m
Pump duty 293 ℓ/s @ 195 m 293 ℓ/s @ 223 m
Note: The capital cost includes preliminary and general costs, but excludes contingencies, professional fees and VAT.
It is evident from Table 6.4 that Route A1 is shorter than Route A2, which also results
in a lower pumping head and hence lower operating costs. Route A1 is thus the
preferred route due to the shorter length.
Route A1 was also optimised for a flow of 199 ℓ/s, which is the 2008 demand
scenario. Table 6.5 shows the net present values calculated for Route A1 for
different pipeline diameters, based on a flow of 199 ℓ/s.
Table 6.5 Route A1 net present values for a flow of 199 ℓ/s
Pipe diameter (mm) Net present value (4%)
Net present value (6%)
Net present value (8%)
350 R 60,5 m R 55,1 m R 51,1 m
400 R 51,1 m R 46,9 m R 43,8 m
450 R 48,7 m R 45,0 m R 42,4 m
500 R 48,7 m R 45,3 m R 42,8 m
600 R 54,3 m R 51,0 m R 48,6 m
700 R 62,7 m R 59,3 m R 56,8 m
It is evident from Table 6.5 that the optimum pipeline diameter for Route A1 and a
flow of 199 ℓ/s, is 450 mm. This would be the pipeline diameter required in the short-
term. The additional construction cost associated with constructing a 500 mm
diameter pipeline in lieu of a 450 mm diameter pipeline is approximately R2,4 m. This
represents a reduction of 8% on the total construction cost of R 29,8 m for the
500 mm diameter pipeline and pump station scheme.
Due to the marginal reduction in construction costs, it is recommended that a 500 mm
diameter pipeline be installed to meet the 2008 demands.
Figure 6.4 and Figure 6.5 show the hydraulic gradelines for a 500 mm diameter
pipeline along Route A1 for flows of 199 ℓ/s and 293 ℓ/s, respectively.

GGrroooott LLeettaabbaa RRiivveerr WWaatteerr DDeevveellooppmmeenntt PPrroojjeecctt ((GGLLeeWWaaPP)) 43
Technical Study Module : Bulk Water Distribution Infrastructure : Volume 8 May 2010
Figure 6.4 Hydraulic gradeline for flow of 199 ℓ/s in 500 mm diameter pipeline
along Route A1
Figure 6.5 Hydraulic gradeline for flow of 293 ℓ/s in 500 mm diameter pipeline along Route A1
6.3.3 WTW to Command Reservoir A : Utilising the ex isting Xihoko Pipeline
Figure 6.3 shows the existing Xihoko 300 mm diameter pipeline from the existing
WTW to Command Reservoir A, which follows approximately the alignment of Route
A2. Following a site visit a concern was raised about the suitability of the pipe
material used for this rising main. In order to assess whether or not this existing
pipeline could be used, a waterhammer analysis was undertaken. The input data for
the waterhammer analysis was obtained from the report entitled Design Report for
WTP to Command Reservoir A (Route A1): Hydraulic gradeline
for flow of 199 l/s (500 mm diameter pipeline)
400
450
500
550
600
650
0 1500 3000 4500 6000 7500 9000 10500 12000 13500 15000
Chainage (m)
Ele
vati
on (
m)
Pipe inver t level
Hydr aul i c gr adel ine
WTP to Command Reservoir A (Route A1): Hydraulic gradeline
for flow of 293 l/s (500 mm diameter pipeline)
400
450
500
550
600
650
700
0 1500 3000 4500 6000 7500 9000 10500 12000 13500 15000
Chainage (m)
Ele
vati
on (
m)
Pipe inver t level
Hydr aul i c gr adel ine
GGrroooott LLeettaabbaa RRiivveerr WWaatteerr DDeevveellooppmmeenntt PPrroojjeecctt ((GGLLeeWWaaPP)) 44
Technical Study Module : Bulk Water Distribution Infrastructure : Volume 8 May 2010
Letaba RWS Xihoko Rising Main, prepared by Endecon for Department of Water
Affairs and Forestry (DWAF Project Number LP056).
The waterhammer analysis was based on a pumped flow rate of 90 ℓ/s.
The results of the waterhammer analysis are contained in Appendix D of this report.
The following analyses were undertaken:
• Steady state pressures, as well as the maximum allowable working pressures
for the respective pipe classes (Figure 1 in Appendix D )
• The maximum surge pressures for a pump trip condition, as well as the
maximum allowable surge pressures (Figure 2 in Appendix D )
• The minimum surge pressures for a pump trip condition (Figure 3 in
Appendix D ), and
• The maximum surge pressures for a pump start condition, as well as the
maximum allowable surge pressures (Figure 4 of Appendix D )
The following conclusions can be drawn from the waterhammer analysis:
• The Class 6 and 9 PVC-U pipes are adequate to withstand the steady state
pressures
• The maximum allowable surge pressures for the Class 6 and 9 PVC-U pipes
are not exceeded during the pump trip condition.
• Negative surge pressures would be experienced along certain section of the
pipeline during pump trip conditions. The manufacturers of PVC-U pipes
recommend that a minimum of Class 9 be installed where negative pressures
are experienced. The section downstream of stake value (SV) 8 580 m is
Class 6 PVC-U pipes. Negative surge pressures are experienced from SV 7
700 m to SV 8 600 m, SV 10 900 m to SV 11 300 m, and SV 12 000 m to SV
12 580 m. This would therefore require replacing approximately 1 000 m of
Class 6 pipe with Class 9 pipe.
• The maximum surge pressures for a pump start condition almost exceed the
maximum allowable surge pressure at SV 9 280 m.
The following recommendation is made based on the surge analysis:
• Replace approximately 1 200 m of Class 6 PVC-U pipes with Class 9 PVC-U
pipes.
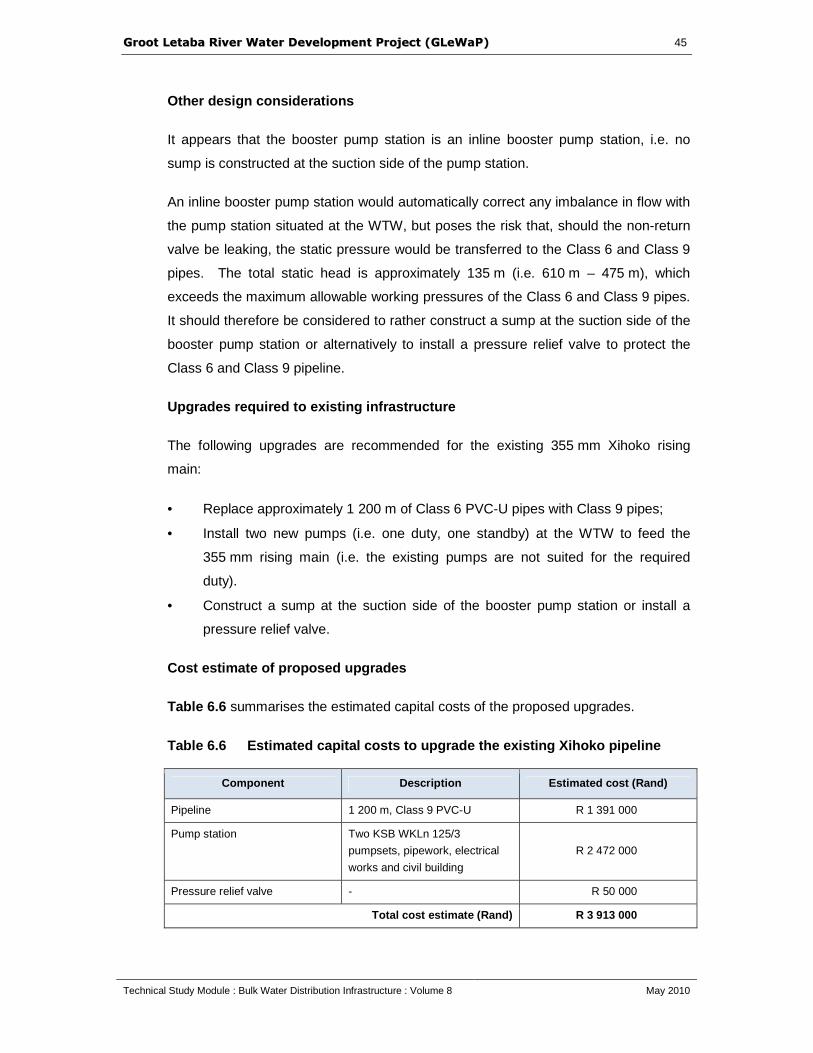
GGrroooott LLeettaabbaa RRiivveerr WWaatteerr DDeevveellooppmmeenntt PPrroojjeecctt ((GGLLeeWWaaPP)) 45
Technical Study Module : Bulk Water Distribution Infrastructure : Volume 8 May 2010
Other design considerations
It appears that the booster pump station is an inline booster pump station, i.e. no
sump is constructed at the suction side of the pump station.
An inline booster pump station would automatically correct any imbalance in flow with
the pump station situated at the WTW, but poses the risk that, should the non-return
valve be leaking, the static pressure would be transferred to the Class 6 and Class 9
pipes. The total static head is approximately 135 m (i.e. 610 m – 475 m), which
exceeds the maximum allowable working pressures of the Class 6 and Class 9 pipes.
It should therefore be considered to rather construct a sump at the suction side of the
booster pump station or alternatively to install a pressure relief valve to protect the
Class 6 and Class 9 pipeline.
Upgrades required to existing infrastructure
The following upgrades are recommended for the existing 355 mm Xihoko rising
main:
• Replace approximately 1 200 m of Class 6 PVC-U pipes with Class 9 pipes;
• Install two new pumps (i.e. one duty, one standby) at the WTW to feed the
355 mm rising main (i.e. the existing pumps are not suited for the required
duty).
• Construct a sump at the suction side of the booster pump station or install a
pressure relief valve.
Cost estimate of proposed upgrades
Table 6.6 summarises the estimated capital costs of the proposed upgrades.
Table 6.6 Estimated capital costs to upgrade the ex isting Xihoko pipeline
Component Description Estimated cost (Rand)
Pipeline 1 200 m, Class 9 PVC-U R 1 391 000
Pump station Two KSB WKLn 125/3
pumpsets, pipework, electrical
works and civil building
R 2 472 000
Pressure relief valve - R 50 000
Total cost estimate (Rand) R 3 913 000

GGrroooott LLeettaabbaa RRiivveerr WWaatteerr DDeevveellooppmmeenntt PPrroojjeecctt ((GGLLeeWWaaPP)) 46
Technical Study Module : Bulk Water Distribution Infrastructure : Volume 8 May 2010
The above amounts include preliminary and general costs but excludes
contingencies, professional fees and VAT.
Impact on proposed future infrastructure
Assuming that the existing 355 mm rising main could deliver 90 ℓ/s to the Xihoko
Reservoir, the flows that need to be handled in the proposed future rising mains
would reduce to 109 ℓ/s and 203 ℓ/s for the 2007 and 2027 scenarios, respectively.
Route A1 was optimised for a flow of 109 ℓ/s (i.e. 199 ℓ/s – 90 ℓ/s), which is the 2008
demand scenario. Table 6.7 shows the net present values calculated for Route A1
for different pipeline diameters, based on a flow of 109 ℓ/s.
Table 6.7 Route A1 net present values for a flow of 109 ℓ/s
Pipe diameter (mm)
Net present value (4%)
Net present value (6%)
Net present value (8%)
300 R35,2 m R 32,6 m R30868 m
350 R 33,0 m R 30,9 m R 29,2 m
400 R 32,4 m R 30,4 m R 29,0 m
450 R 34,5 m R 32,5 m R 31,1 m
500 R 36,8 m R 34,9 m R 33,5 m
600 R 44,4 m R 42,3 m R 40,8 m
It is evident from Table 6.7 that the optimum pipeline diameter for Route A1 and a
flow of 109 ℓ/s, is 400 mm. This would be the pipeline diameter required in the short-
term in addition to the existing 355 mm PVC-U pipe. The construction cost
associated with constructing a 400 mm diameter pipeline, including that of a pump
station and the associated mechanical and electrical equipment, is R17,4 m.
Route A1 was optimised for a flow of 203 ℓ/s (i.e. 293 ℓ/s – 90 ℓ/s), which represents
the 2027 demand scenario. Table 6.8 shows the net present values calculated for
Route A1 for different pipeline diameters, based on a flow of 203 ℓ/s.
Table 6.8 Route A1 net present values for a flow of 203 ℓ/s
Pipe diameter (mm)
Net present value (4%)
Net present value (6%)
Net present value (8%)
350 R 62,2 m R 56,6 m R 52,5 m
400 R 52,1 m R 47,9 m R 44,7 m
450 R 49,4 m R 45,7 m R 43,0 m
500 R 49,3 m R 45,8 m R 43,3 m
600 R 54,8 m R 51,4 m R 49,0 m
700 R 63,1 m R 59,7 m R 57,2 m
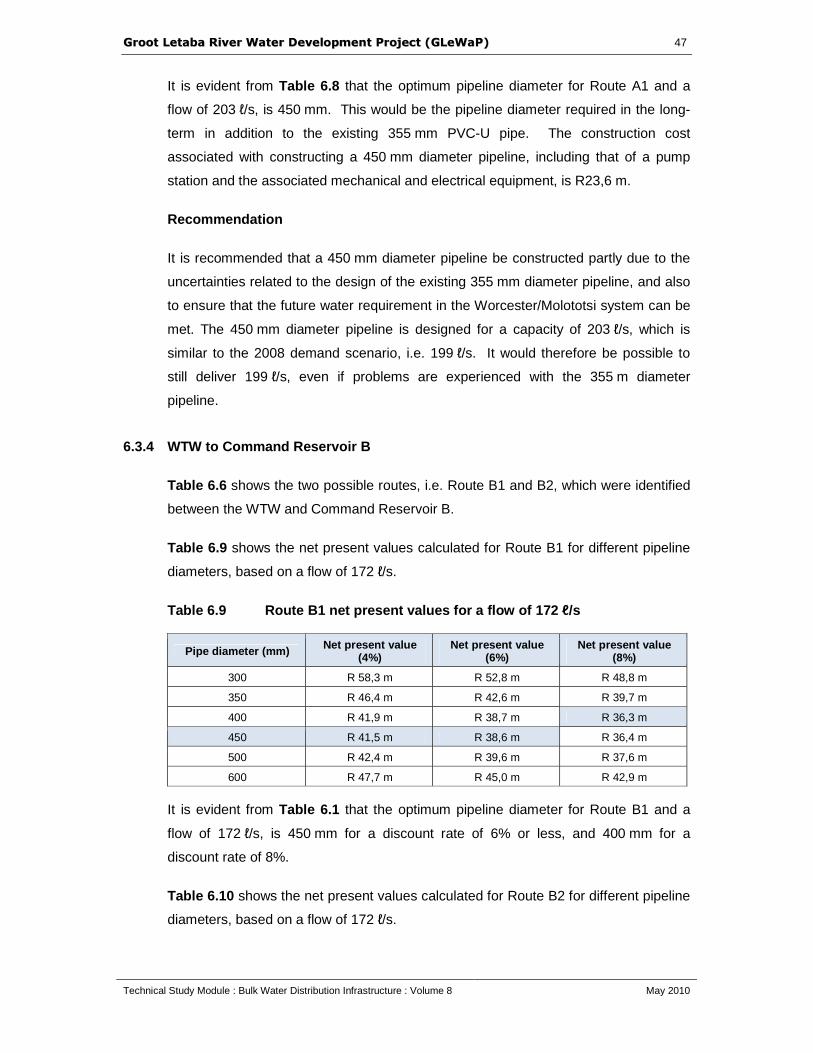
GGrroooott LLeettaabbaa RRiivveerr WWaatteerr DDeevveellooppmmeenntt PPrroojjeecctt ((GGLLeeWWaaPP)) 47
Technical Study Module : Bulk Water Distribution Infrastructure : Volume 8 May 2010
It is evident from Table 6.8 that the optimum pipeline diameter for Route A1 and a
flow of 203 ℓ/s, is 450 mm. This would be the pipeline diameter required in the long-
term in addition to the existing 355 mm PVC-U pipe. The construction cost
associated with constructing a 450 mm diameter pipeline, including that of a pump
station and the associated mechanical and electrical equipment, is R23,6 m.
Recommendation
It is recommended that a 450 mm diameter pipeline be constructed partly due to the
uncertainties related to the design of the existing 355 mm diameter pipeline, and also
to ensure that the future water requirement in the Worcester/Molototsi system can be
met. The 450 mm diameter pipeline is designed for a capacity of 203 ℓ/s, which is
similar to the 2008 demand scenario, i.e. 199 ℓ/s. It would therefore be possible to
still deliver 199 ℓ/s, even if problems are experienced with the 355 m diameter
pipeline.
6.3.4 WTW to Command Reservoir B
Table 6.6 shows the two possible routes, i.e. Route B1 and B2, which were identified
between the WTW and Command Reservoir B.
Table 6.9 shows the net present values calculated for Route B1 for different pipeline
diameters, based on a flow of 172 ℓ/s.
Table 6.9 Route B1 net present values for a flow of 172 ℓ/s
Pipe diameter (mm) Net present value (4%)
Net present value (6%)
Net present value (8%)
300 R 58,3 m R 52,8 m R 48,8 m
350 R 46,4 m R 42,6 m R 39,7 m
400 R 41,9 m R 38,7 m R 36,3 m
450 R 41,5 m R 38,6 m R 36,4 m
500 R 42,4 m R 39,6 m R 37,6 m
600 R 47,7 m R 45,0 m R 42,9 m
It is evident from Table 6.1 that the optimum pipeline diameter for Route B1 and a
flow of 172 ℓ/s, is 450 mm for a discount rate of 6% or less, and 400 mm for a
discount rate of 8%.
Table 6.10 shows the net present values calculated for Route B2 for different pipeline
diameters, based on a flow of 172 ℓ/s.
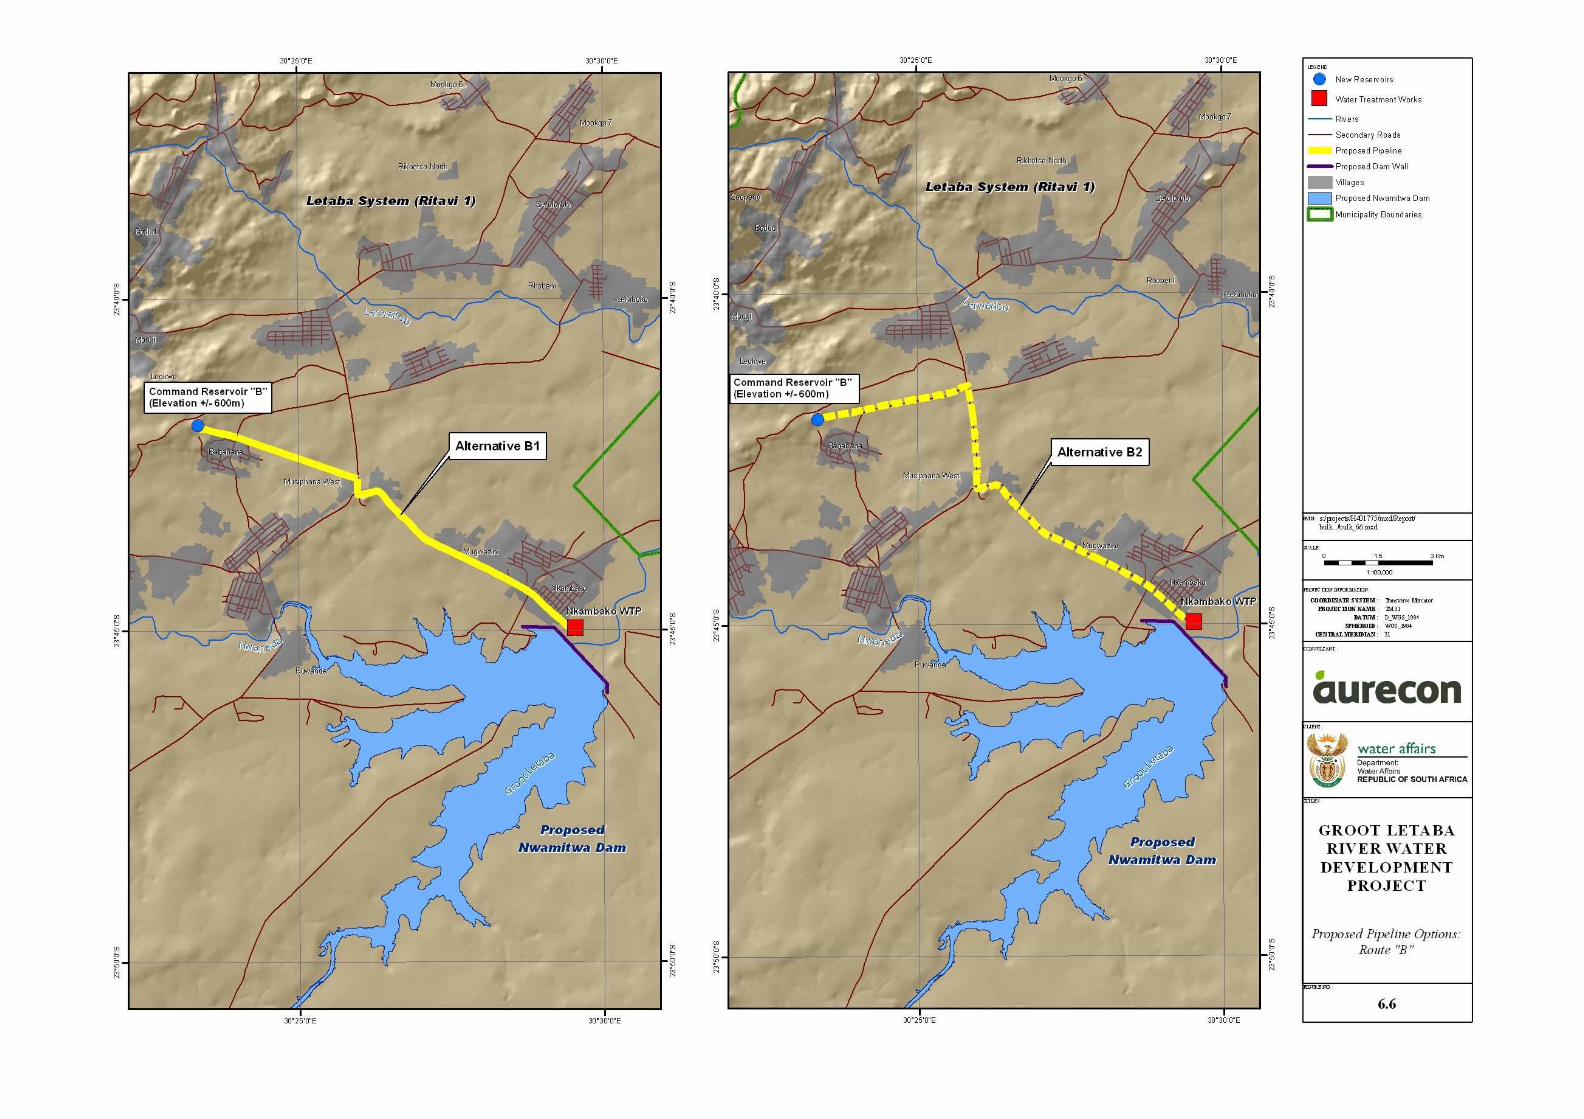
Figure 6.6 Proposed pipeline options : Route "B"
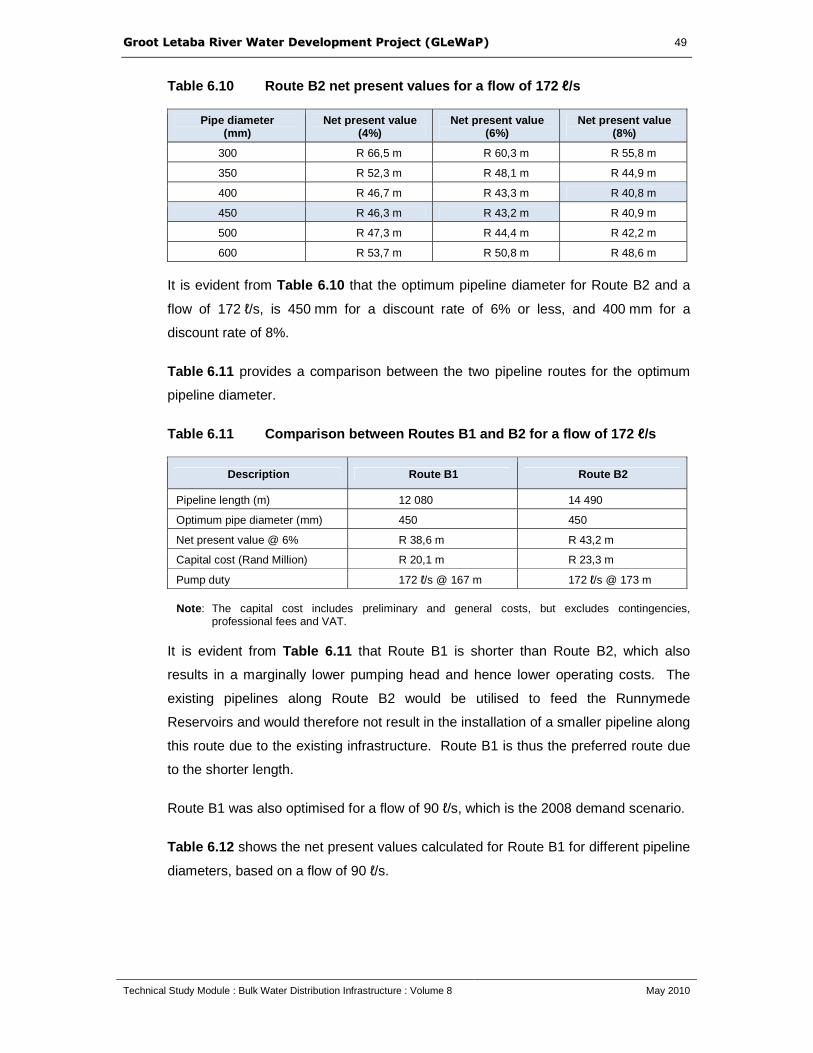
GGrroooott LLeettaabbaa RRiivveerr WWaatteerr DDeevveellooppmmeenntt PPrroojjeecctt ((GGLLeeWWaaPP)) 49
Technical Study Module : Bulk Water Distribution Infrastructure : Volume 8 May 2010
Table 6.10 Route B2 net present values for a flow o f 172 ℓ/s
Pipe diameter (mm)
Net present value (4%)
Net present value (6%)
Net present value (8%)
300 R 66,5 m R 60,3 m R 55,8 m
350 R 52,3 m R 48,1 m R 44,9 m
400 R 46,7 m R 43,3 m R 40,8 m
450 R 46,3 m R 43,2 m R 40,9 m
500 R 47,3 m R 44,4 m R 42,2 m
600 R 53,7 m R 50,8 m R 48,6 m
It is evident from Table 6.10 that the optimum pipeline diameter for Route B2 and a
flow of 172 ℓ/s, is 450 mm for a discount rate of 6% or less, and 400 mm for a
discount rate of 8%.
Table 6.11 provides a comparison between the two pipeline routes for the optimum
pipeline diameter.
Table 6.11 Comparison between Routes B1 and B2 for a flow of 1 72 ℓ/s
Description Route B1 Route B2
Pipeline length (m) 12 080 14 490
Optimum pipe diameter (mm) 450 450
Net present value @ 6% R 38,6 m R 43,2 m
Capital cost (Rand Million) R 20,1 m R 23,3 m
Pump duty 172 ℓ/s @ 167 m 172 ℓ/s @ 173 m Note : The capital cost includes preliminary and general costs, but excludes contingencies,
professional fees and VAT.
It is evident from Table 6.11 that Route B1 is shorter than Route B2, which also
results in a marginally lower pumping head and hence lower operating costs. The
existing pipelines along Route B2 would be utilised to feed the Runnymede
Reservoirs and would therefore not result in the installation of a smaller pipeline along
this route due to the existing infrastructure. Route B1 is thus the preferred route due
to the shorter length.
Route B1 was also optimised for a flow of 90 ℓ/s, which is the 2008 demand scenario.
Table 6.12 shows the net present values calculated for Route B1 for different pipeline
diameters, based on a flow of 90 ℓ/s.
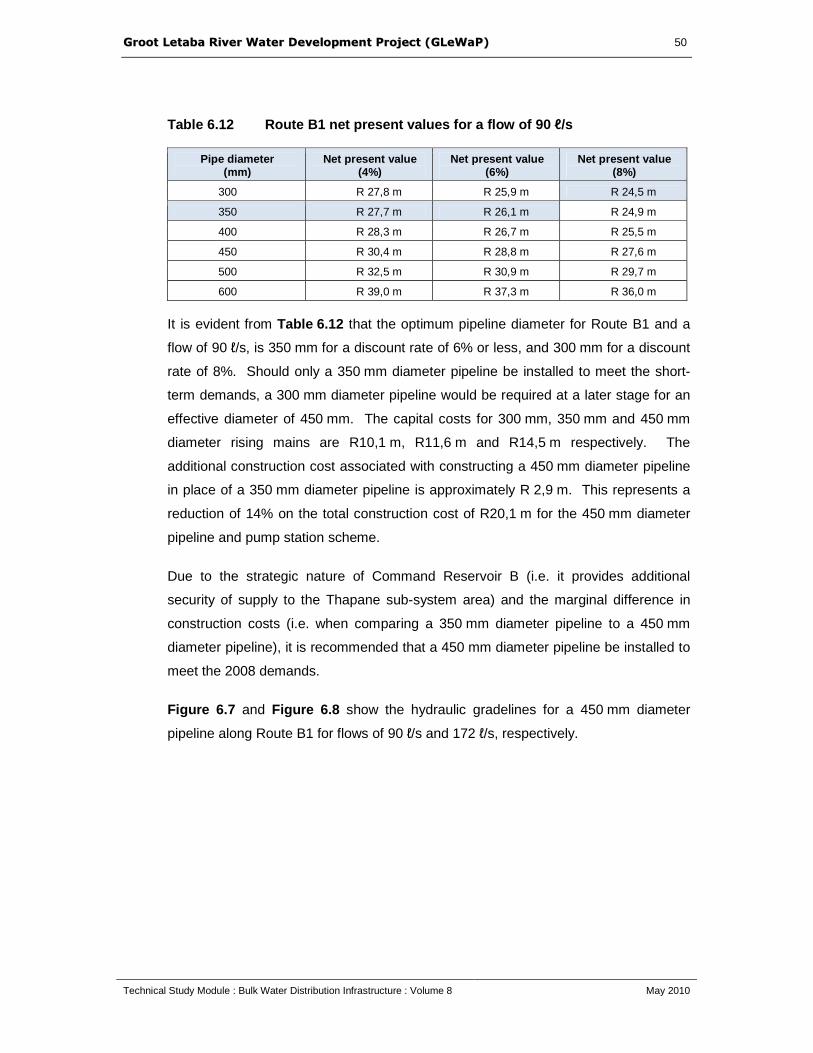
GGrroooott LLeettaabbaa RRiivveerr WWaatteerr DDeevveellooppmmeenntt PPrroojjeecctt ((GGLLeeWWaaPP)) 50
Technical Study Module : Bulk Water Distribution Infrastructure : Volume 8 May 2010
Table 6.12 Route B1 net present values for a flow of 90 ℓ/s
Pipe diameter (mm)
Net present value (4%)
Net present value (6%)
Net present value (8%)
300 R 27,8 m R 25,9 m R 24,5 m
350 R 27,7 m R 26,1 m R 24,9 m
400 R 28,3 m R 26,7 m R 25,5 m
450 R 30,4 m R 28,8 m R 27,6 m
500 R 32,5 m R 30,9 m R 29,7 m
600 R 39,0 m R 37,3 m R 36,0 m
It is evident from Table 6.12 that the optimum pipeline diameter for Route B1 and a
flow of 90 ℓ/s, is 350 mm for a discount rate of 6% or less, and 300 mm for a discount
rate of 8%. Should only a 350 mm diameter pipeline be installed to meet the short-
term demands, a 300 mm diameter pipeline would be required at a later stage for an
effective diameter of 450 mm. The capital costs for 300 mm, 350 mm and 450 mm
diameter rising mains are R10,1 m, R11,6 m and R14,5 m respectively. The
additional construction cost associated with constructing a 450 mm diameter pipeline
in place of a 350 mm diameter pipeline is approximately R 2,9 m. This represents a
reduction of 14% on the total construction cost of R20,1 m for the 450 mm diameter
pipeline and pump station scheme.
Due to the strategic nature of Command Reservoir B (i.e. it provides additional
security of supply to the Thapane sub-system area) and the marginal difference in
construction costs (i.e. when comparing a 350 mm diameter pipeline to a 450 mm
diameter pipeline), it is recommended that a 450 mm diameter pipeline be installed to
meet the 2008 demands.
Figure 6.7 and Figure 6.8 show the hydraulic gradelines for a 450 mm diameter
pipeline along Route B1 for flows of 90 ℓ/s and 172 ℓ/s, respectively.
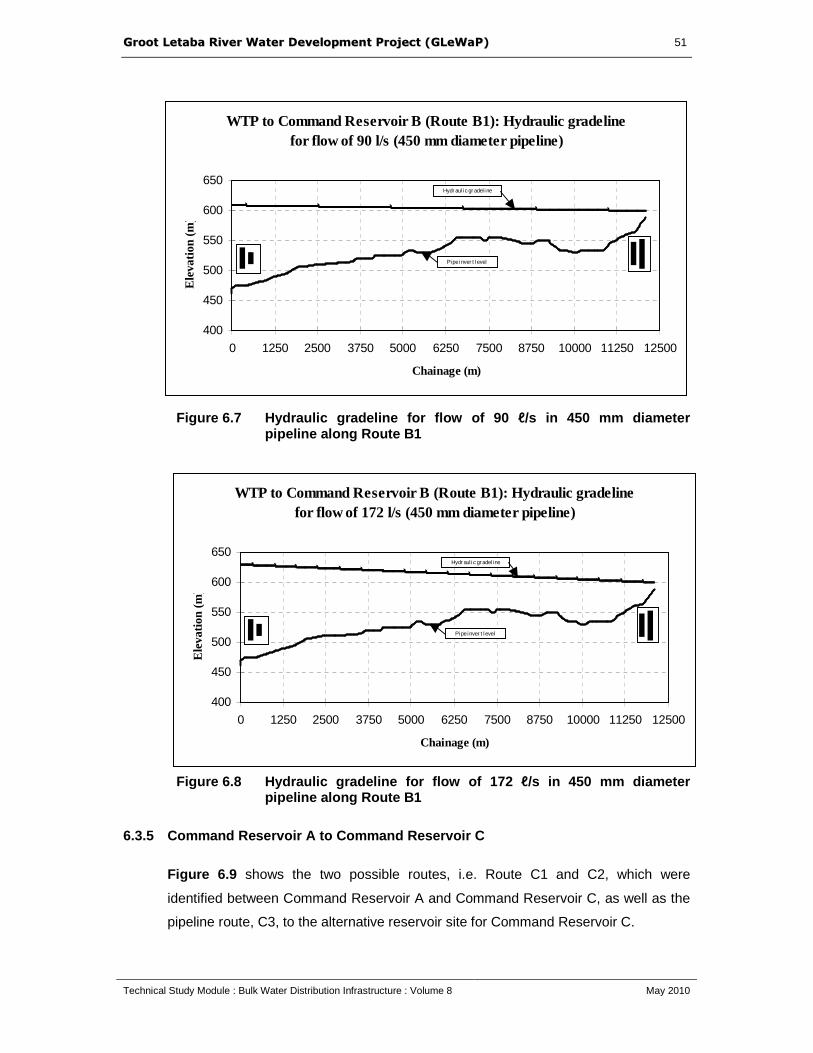
GGrroooott LLeettaabbaa RRiivveerr WWaatteerr DDeevveellooppmmeenntt PPrroojjeecctt ((GGLLeeWWaaPP)) 51
Technical Study Module : Bulk Water Distribution Infrastructure : Volume 8 May 2010
Figure 6.7 Hydraulic gradeline for flow of 90 ℓ/s in 450 mm diameter pipeline along Route B1
Figure 6.8 Hydraulic gradeline for flow of 172 ℓ/s in 450 mm diameter pipeline along Route B1
6.3.5 Command Reservoir A to Command Reservoir C
Figure 6.9 shows the two possible routes, i.e. Route C1 and C2, which were
identified between Command Reservoir A and Command Reservoir C, as well as the
pipeline route, C3, to the alternative reservoir site for Command Reservoir C.
WTP to Command Reservoir B (Route B1): Hydraulic gradeline
for flow of 90 l/s (450 mm diameter pipeline)
400
450
500
550
600
650
0 1250 2500 3750 5000 6250 7500 8750 10000 11250 12500
Chainage (m)
Ele
vati
on (m
)
Pipe inver t level
Hydr aul ic gr adel ine
WTP to Command Reservoir B (Route B1): Hydraulic gradeline
for flow of 172 l/s (450 mm diameter pipeline)
400
450
500
550
600
650
0 1250 2500 3750 5000 6250 7500 8750 10000 11250 12500
Chainage (m)
Ele
vati
on (m
)
Pipe inver t level
Hydr aul ic gr adel ine

Figure 6.9 Proposed pipeline options : Route "C"

GGrroooott LLeettaabbaa RRiivveerr WWaatteerr DDeevveellooppmmeenntt PPrroojjeecctt ((GGLLeeWWaaPP)) 53
Technical Study Module : Bulk Water Distribution Infrastructure : Volume 8 May 2010
Table 6.3 shows the net present values calculated for Route C1 for different pipeline
diameters, based on a flow of 99 ℓ/s.
Table 6.13 Route C1 net present values for a flow o f 99 ℓ/s
Pipe diameter (mm)
Net present value (4%)
Net present value (6%)
Net present value (8%)
250 R 32,3 m R 30,0 m R 28,3 m
300 R 22,6 m R 21,3 m R 20,4 m
350 R 21,5 m R 20,6 m R 19,8 m
400 R 21,7 m R 20,8 m R 20,2 m
450 R 23,6 m R 22,8 m R 22,2 m
500 R 25,7 m R 24,9 m R 24,2 m
It is evident from Table 6.13 that the optimum pipeline diameter for Route C1 and a
flow of 99 ℓ/s, is 350 mm.
Table 6.14 shows the net present values calculated for Route C2 for different pipeline
diameters, based on a flow of 99 ℓ/s.
Table 6.14 Route C2 net present values for a flow o f 99 ℓ/s
Pipe diameter (mm)
Net present value (4%)
Net present value (6%)
Net present value (8%)
250 R 40,0 m R 37,3 m R 35,2 m
300 R 27,0 m R 25,5 m R 24,4 m
350 R 25,8 m R 24,7 m R 23,9 m
400 R 25,9 m R 25,0 m R 24,2 m
450 R 28,4 m R 27,4 m R 26,7 m
500 R 31,0 m R 30,0 m R 29,3 m
It is evident from Table 6.14 that the optimum pipeline diameter for Route C2 and a
flow of 99 ℓ/s, is 350 mm.
Table 6.15 Route C3 net present values for a flow o f 92 ℓ/s
Pipe diameter (mm)
Net present value (4%)
Net present value (6%)
Net present value (8%)
250 R 34,5 m R 31,9 m R 29,9 m
300 R 26,5 m R 24,7 m R 23,4 m
350 R 26,0 m R 24,5 m R 23,3 m
400 R 26,4 m R 25,0 m R 23,9 m
450 R 28,5 m R 27,0 m R 25,9 m
500 R 30,6 m R 29,2 m R 28,1 m
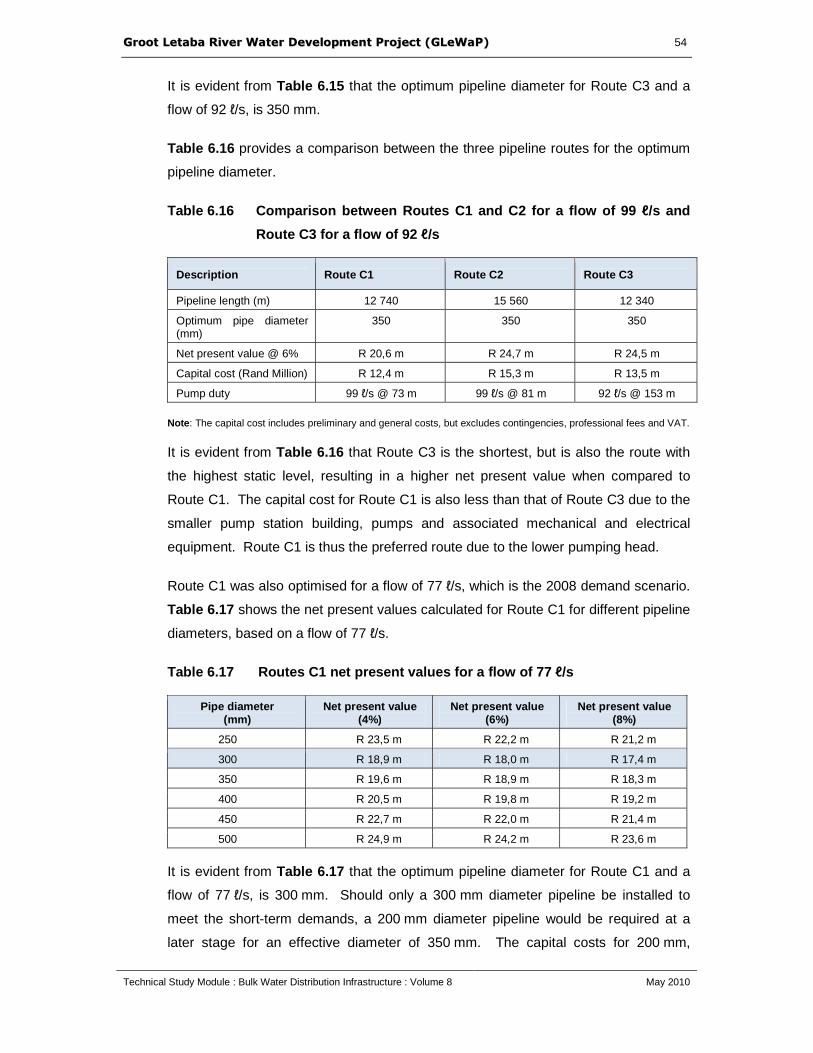
GGrroooott LLeettaabbaa RRiivveerr WWaatteerr DDeevveellooppmmeenntt PPrroojjeecctt ((GGLLeeWWaaPP)) 54
Technical Study Module : Bulk Water Distribution Infrastructure : Volume 8 May 2010
It is evident from Table 6.15 that the optimum pipeline diameter for Route C3 and a
flow of 92 ℓ/s, is 350 mm.
Table 6.16 provides a comparison between the three pipeline routes for the optimum
pipeline diameter.
Table 6.16 Comparison between Routes C1 and C2 for a flow of 99 ℓ/s and
Route C3 for a flow of 92 ℓ/s
Description Route C1 Route C2 Route C3
Pipeline length (m) 12 740 15 560 12 340
Optimum pipe diameter (mm)
350 350 350
Net present value @ 6% R 20,6 m R 24,7 m R 24,5 m
Capital cost (Rand Million) R 12,4 m R 15,3 m R 13,5 m
Pump duty 99 ℓ/s @ 73 m 99 ℓ/s @ 81 m 92 ℓ/s @ 153 m
Note : The capital cost includes preliminary and general costs, but excludes contingencies, professional fees and VAT.
It is evident from Table 6.16 that Route C3 is the shortest, but is also the route with
the highest static level, resulting in a higher net present value when compared to
Route C1. The capital cost for Route C1 is also less than that of Route C3 due to the
smaller pump station building, pumps and associated mechanical and electrical
equipment. Route C1 is thus the preferred route due to the lower pumping head.
Route C1 was also optimised for a flow of 77 ℓ/s, which is the 2008 demand scenario.
Table 6.17 shows the net present values calculated for Route C1 for different pipeline
diameters, based on a flow of 77 ℓ/s.
Table 6.17 Routes C1 net present values for a flow of 77 ℓ/s
Pipe diameter (mm)
Net present value (4%)
Net present value (6%)
Net present value (8%)
250 R 23,5 m R 22,2 m R 21,2 m
300 R 18,9 m R 18,0 m R 17,4 m
350 R 19,6 m R 18,9 m R 18,3 m
400 R 20,5 m R 19,8 m R 19,2 m
450 R 22,7 m R 22,0 m R 21,4 m
500 R 24,9 m R 24,2 m R 23,6 m
It is evident from Table 6.17 that the optimum pipeline diameter for Route C1 and a
flow of 77 ℓ/s, is 300 mm. Should only a 300 mm diameter pipeline be installed to
meet the short-term demands, a 200 mm diameter pipeline would be required at a
later stage for an effective diameter of 350 mm. The capital costs for 200 mm,

GGrroooott LLeettaabbaa RRiivveerr WWaatteerr DDeevveellooppmmeenntt PPrroojjeecctt ((GGLLeeWWaaPP)) 55
Technical Study Module : Bulk Water Distribution Infrastructure : Volume 8 May 2010
300 mm and 350 mm diameter rising mains are R7,2 m, R9,4 m and R11,0 m
respectively. The additional construction cost associated with constructing a 350 mm
diameter pipeline in place of a 300 mm diameter pipeline is approximately R1,6 m.
This represents a reduction of 13% on the total construction cost of R12,4 m for the
350 mm diameter pipeline and pump station scheme.
Due to the marginal difference in construction costs (i.e. when comparing a 300 mm
diameter pipeline to a 350 mm diameter pipeline), it is recommended that a 350 mm
diameter pipeline be installed to meet the 2008 demands. The 350 mm diameter
pipeline would also result in lower operating costs due to the lower pumping head,
which would offset part of the higher initial capital costs.
Figure 6.10 and Figure 6.11 show the hydraulic gradelines for a 350 mm diameter
pipeline along Route C1 for flows of 77 ℓ/s and 99 ℓ/s, respectively.
Figure 6.10 Hydraulic gradeline for flow of 77 ℓ/s in 350 mm diameter pipeline along Route C1
Command Reservoir A to Command Reservoir C (Route C1):
Hydraulic gradeline for flow of 77 l/s (350 mm diameter pipeline)
450
500
550
600
650
700
0 1000 2000 3000 4000 5000 6000 7000 8000 9000 10000 11000 12000 13000
Chainage (m)
Ele
vati
on (
m)
Pipe inver t level
Hydr aul i c gr adel ine

GGrroooott LLeettaabbaa RRiivveerr WWaatteerr DDeevveellooppmmeenntt PPrroojjeecctt ((GGLLeeWWaaPP)) 56
Technical Study Module : Bulk Water Distribution Infrastructure : Volume 8 May 2010
Figure 6.11 Hydraulic gradeline for flow of 99 ℓ/s in 350 mm diameter pipeline along Route C1
6.3.6 Command Reservoir A to Command Reservoir D
Figure 6.12 shows the proposed pipeline route, i.e. Route D1, between command
reservoir A and D.
Command Reservoir A to Command Reservoir C (Route C1):
Hydraulic gradeline for flow of 99 l/s (350 mm diameter pipeline)
450
500
550
600
650
700
0 1000 2000 3000 4000 5000 6000 7000 8000 9000 10000 11000 12000 13000
Chainage (m)
Ele
vati
on (
m)
Pipe invert level
Hydraulic gradeline

Figure 6.12 Proposed pipeline options : Route "D"

GGrroooott LLeettaabbaa RRiivveerr WWaatteerr DDeevveellooppmmeenntt PPrroojjeecctt ((GGLLeeWWaaPP)) 58
Technical Study Module : Bulk Water Distribution Infrastructure : Volume 8 May 2010
A top water level of 555 m was assumed at command reservoir D, meaning that water
could gravitate from command reservoir A, which has a top water level of 600 m.
Table 6.18 summarises the residual head at command reservoir D for the 2008 and
2027 demand scenarios for different pipeline diameters.
Table 6.18 Residual head at command reservoir D
Diameter (mm)
Residual head for 2008 demand scenario (75 ℓ/s)
Residual head for 2027 demand scenario (146 ℓ/s)
300 - 17 - 165
350 16 -54
400 30 -7
450 36 16
500 40 28
It is evident from Table 6.18 that in order to meet the 2008 and 2027 demands under
gravity, 350 mm and 450 mm diameter pipelines would be required, respectively.
The total length of the pipeline is approximately 16 080 m. The estimated
construction costs for the 350 mm and 450 mm diameter pipelines are R13,8 m and
R17,5 m, respectively (Note: The costs include preliminary and general costs, but
excludes contingencies, professional fees and VAT).
Figure 6.13 shows the hydraulic gradeline for a 450 mm diameter pipeline long
Route D1 for a flow of 146 ℓ/s.
Figure 6.13 Hydraulic gradeline for flow of 146 ℓ/s in 450 mm diameter pipeline along Route D1
Command Reservoir A to Command Reservoir D (Route D1):
Hydraulic gradeline for flow of 146 l/s (450 mm diameter pipeline)
400425450475500525550575600625650
0 1500 3000 4500 6000 7500 9000 10500 12000 13500 15000 16500
Chainage (m)
Ele
vati
on (
m)
Pipe inver t level
Hydr aul i c gr adel ine

GGrroooott LLeettaabbaa RRiivveerr WWaatteerr DDeevveellooppmmeenntt PPrroojjeecctt ((GGLLeeWWaaPP)) 59
Technical Study Module : Bulk Water Distribution Infrastructure : Volume 8 May 2010
6.4 FINAL PIPELINE ROUTE SELECTION
The final pipeline routes from Nkambako WTW to all of the identified command
reservoirs are contained in Figure 6.14 . These optimised pipeline routes are based
on lifecycle costing and take into account initial capital as well as ongoing operating
costs.
The preliminary long sections for each of the final routes selected are contained in
Appendix F of this Report.
6.5 PUMP SIZING AND SELECTION
6.5.1 Pump duties
Table 6.19 provides a summary of the pump duties of the various clear water pump
stations that would feed the command reservoirs.
Table 6.19 Pump duties of clear water pump stations
Location of pump
station Pumping to
Rising main
diameter (mm)
2008 demand
duty
2027 demand
duty
WTW Command
Reservoir A
500 199 ℓ/s @ 164 m 293 ℓ/s @ 195 m
WTW Command
Reservoir B
450 90 ℓ/s @ 144 m 172 ℓ/s @ 167 m
Command
Reservoir A
Command
Reservoir C
350 77 ℓ/s @ 60 m 99 ℓ/s @ 73 m
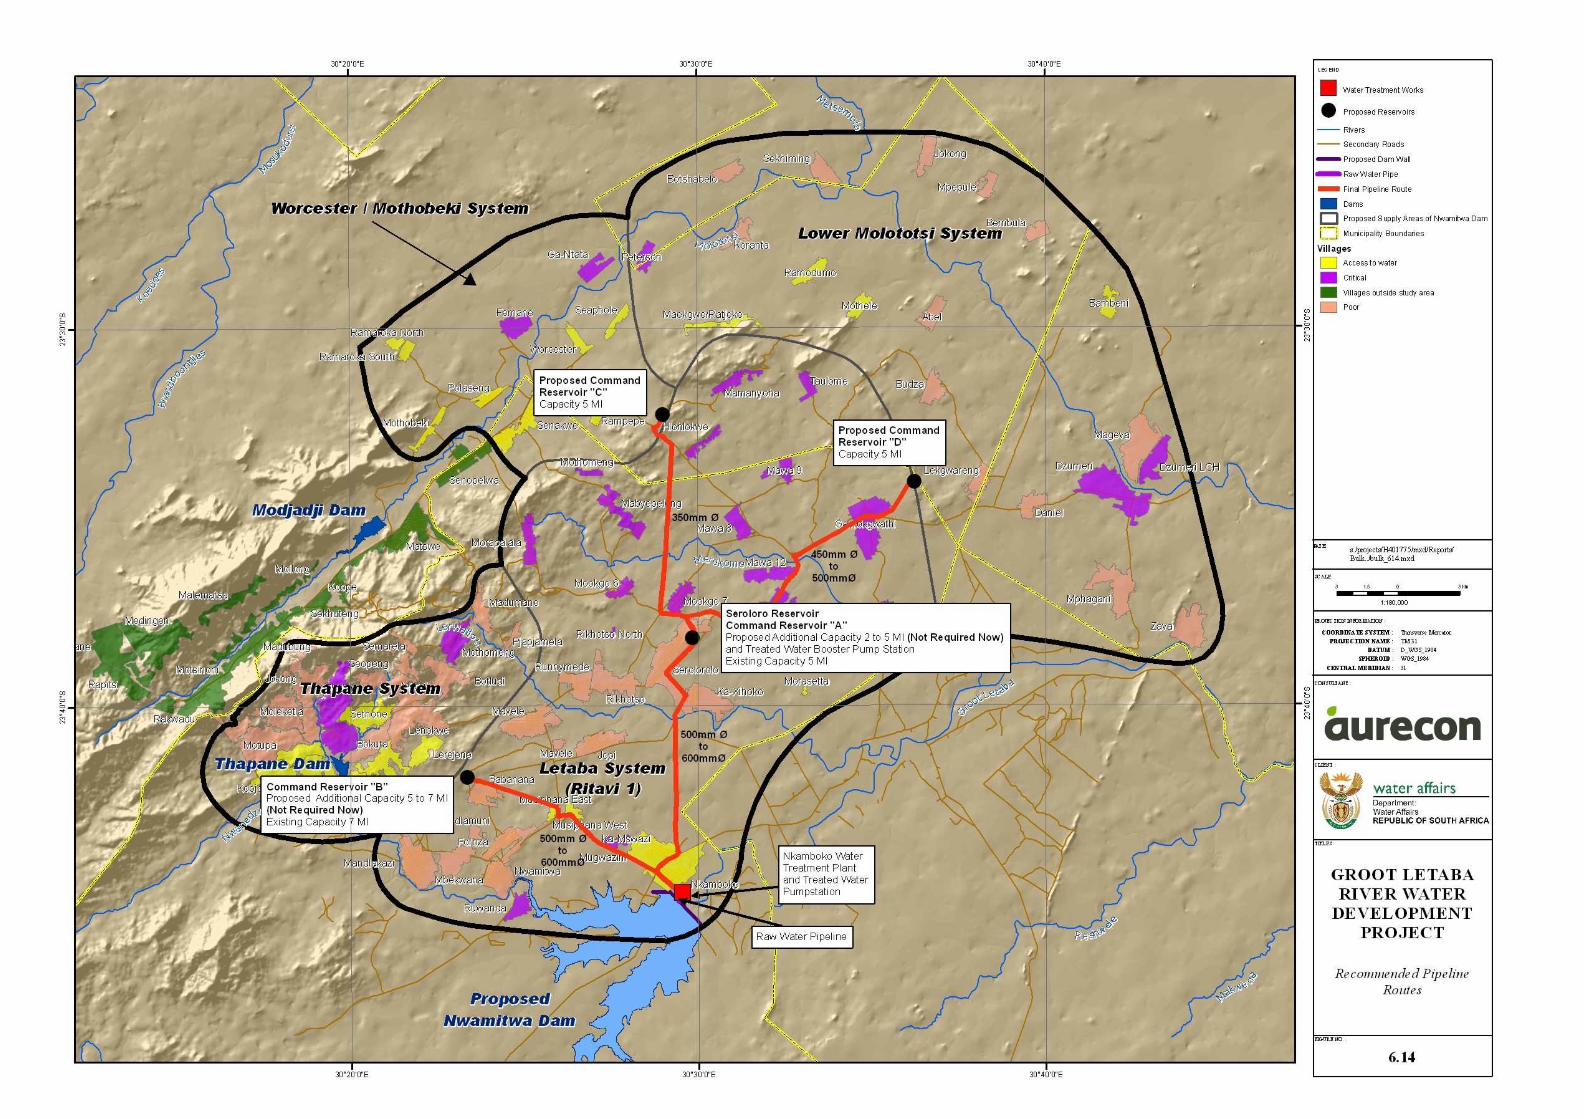
Figure 6.14 Final pipeline routes
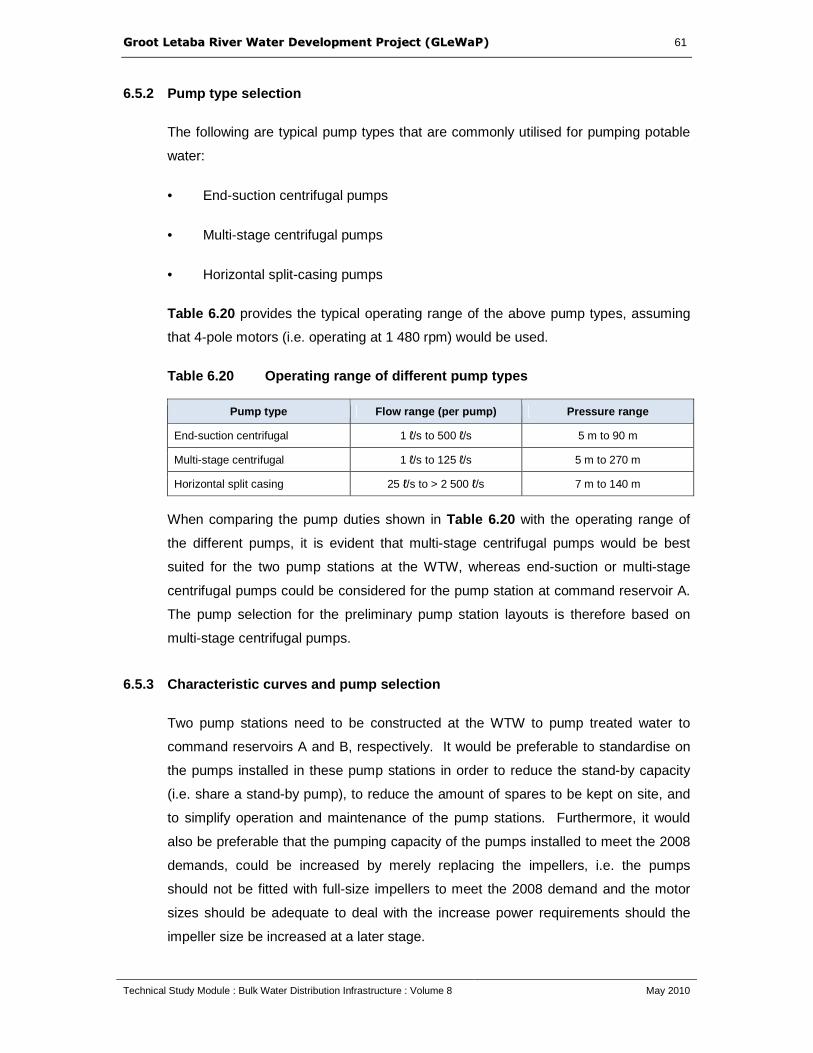
GGrroooott LLeettaabbaa RRiivveerr WWaatteerr DDeevveellooppmmeenntt PPrroojjeecctt ((GGLLeeWWaaPP)) 61
Technical Study Module : Bulk Water Distribution Infrastructure : Volume 8 May 2010
6.5.2 Pump type selection
The following are typical pump types that are commonly utilised for pumping potable
water:
• End-suction centrifugal pumps
• Multi-stage centrifugal pumps
• Horizontal split-casing pumps
Table 6.20 provides the typical operating range of the above pump types, assuming
that 4-pole motors (i.e. operating at 1 480 rpm) would be used.
Table 6.20 Operating range of different pump types
Pump type Flow range (per pump) Pressure range
End-suction centrifugal 1 ℓ/s to 500 ℓ/s 5 m to 90 m
Multi-stage centrifugal 1 ℓ/s to 125 ℓ/s 5 m to 270 m
Horizontal split casing 25 ℓ/s to > 2 500 ℓ/s 7 m to 140 m
When comparing the pump duties shown in Table 6.20 with the operating range of
the different pumps, it is evident that multi-stage centrifugal pumps would be best
suited for the two pump stations at the WTW, whereas end-suction or multi-stage
centrifugal pumps could be considered for the pump station at command reservoir A.
The pump selection for the preliminary pump station layouts is therefore based on
multi-stage centrifugal pumps.
6.5.3 Characteristic curves and pump selection
Two pump stations need to be constructed at the WTW to pump treated water to
command reservoirs A and B, respectively. It would be preferable to standardise on
the pumps installed in these pump stations in order to reduce the stand-by capacity
(i.e. share a stand-by pump), to reduce the amount of spares to be kept on site, and
to simplify operation and maintenance of the pump stations. Furthermore, it would
also be preferable that the pumping capacity of the pumps installed to meet the 2008
demands, could be increased by merely replacing the impellers, i.e. the pumps
should not be fitted with full-size impellers to meet the 2008 demand and the motor
sizes should be adequate to deal with the increase power requirements should the
impeller size be increased at a later stage.

GGrroooott LLeettaabbaa RRiivveerr WWaatteerr DDeevveellooppmmeenntt PPrroojjeecctt ((GGLLeeWWaaPP)) 62
Technical Study Module : Bulk Water Distribution Infrastructure : Volume 8 May 2010
Figure 6.15 shows the characteristic curves for the 500 mm diameter rising main to
Command Reservoir A, based on Hazen-Williams coefficients of 120 and 140, as well
as the pump curves of a KSB WKLn 150/5 pump fitted with 340 mm impellers, and
operating at 1 480 rpm.
Figure 6.15 Characteristic curves for 500 mm pipeli ne to Command Reservoir A with KSB WKLn150/5 pump curves (340 mm impeller)
It is evident from Figure 6.15 that two pumps in parallel would be able to deliver a
flow of 199 ℓ/s, whereas three pumps in parallel would deliver approximately 260 ℓ/s.
Four pumps in parallel would be able to deliver the 2027 demand of 293 ℓ/s.
However, it would also be possible to achieve a flow of 293 ℓ/s with three pumps in
parallel, provided that the impeller size is changed to 360 mm, as shown in
Figure 6.16.
Supply to Command Reservoir A (500 mm dia rising
main)
130.00
150.00
170.00
190.00
210.00
230.00
250.00
0.00 0.05 0.10 0.15 0.20 0.25 0.30
Pumping rate (m3/s)
Hea
d (m
)
2027 demand
293 l/ s
2012 demand
226 l/ s
2008 demand
199 l/ s
(340 i mpel l er )
C = 120
C = 140
KSB WK Ln 150/ 5 1450 RPM 5 stage
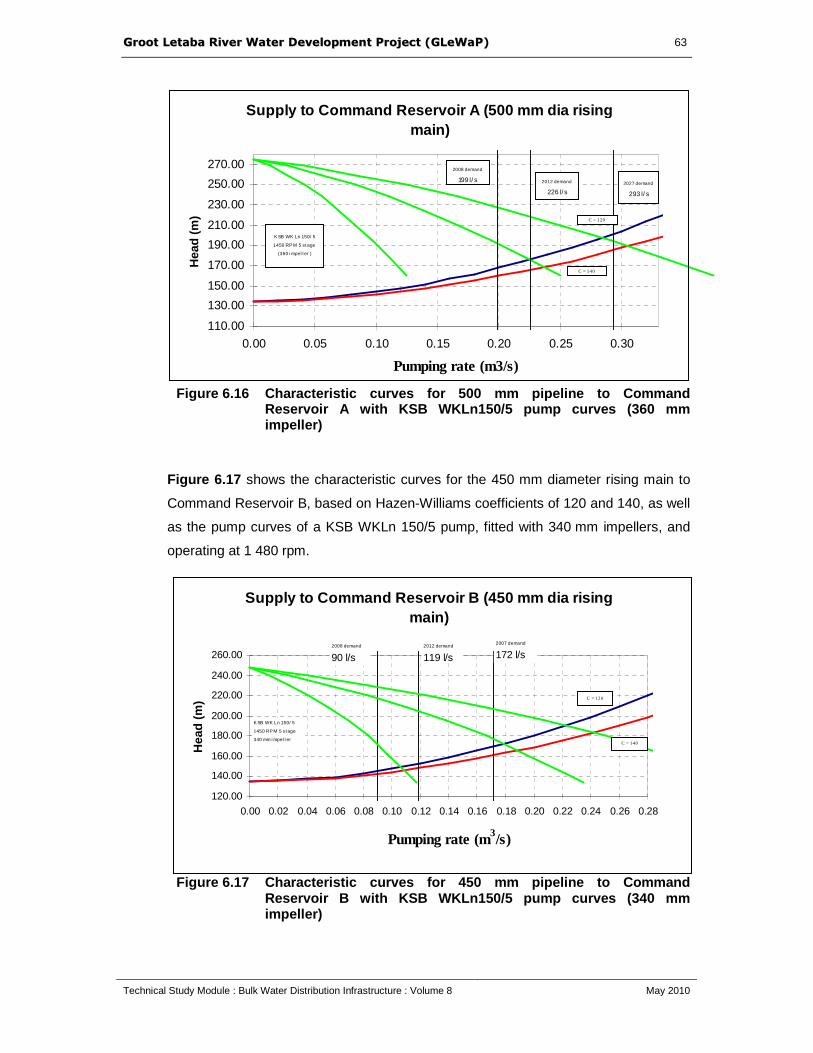
GGrroooott LLeettaabbaa RRiivveerr WWaatteerr DDeevveellooppmmeenntt PPrroojjeecctt ((GGLLeeWWaaPP)) 63
Technical Study Module : Bulk Water Distribution Infrastructure : Volume 8 May 2010
Figure 6.16 Characteristic curves for 500 mm pipeli ne to Command Reservoir A with KSB WKLn150/5 pump curves (360 mm impeller)
Figure 6.17 shows the characteristic curves for the 450 mm diameter rising main to
Command Reservoir B, based on Hazen-Williams coefficients of 120 and 140, as well
as the pump curves of a KSB WKLn 150/5 pump, fitted with 340 mm impellers, and
operating at 1 480 rpm.
Figure 6.17 Characteristic curves for 450 mm pipeli ne to Command Reservoir B with KSB WKLn150/5 pump curves (340 mm impeller)
Supply to Command Reservoir A (500 mm dia rising
main)
110.00
130.00
150.00
170.00
190.00
210.00
230.00
250.00
270.00
0.00 0.05 0.10 0.15 0.20 0.25 0.30
Pumping rate (m3/s)
Hea
d (m
)2027 demand
293 l/ s
K SB WK Ln 150/ 5
1450 RP M 5 stage
(360 i mpel l er )
2012 demand
226 l/ s
2008 demand
199 l/ s
C = 140
C = 120
Supply to Command Reservoir B (450 mm dia rising
main)
120.00
140.00
160.00
180.00
200.00
220.00
240.00
260.00
0.00 0.02 0.04 0.06 0.08 0.10 0.12 0.14 0.16 0.18 0.20 0.22 0.24 0.26 0.28
Pumping rate (m3/s)
Hea
d (m
)
2008 demand
90 l/s
2007 demand
172 l/s
K SB WK Ln 150/ 5
1450 RP M 5 s tage
340 mm i mpel l er
2012 demand
119 l/s
C = 120
C = 140
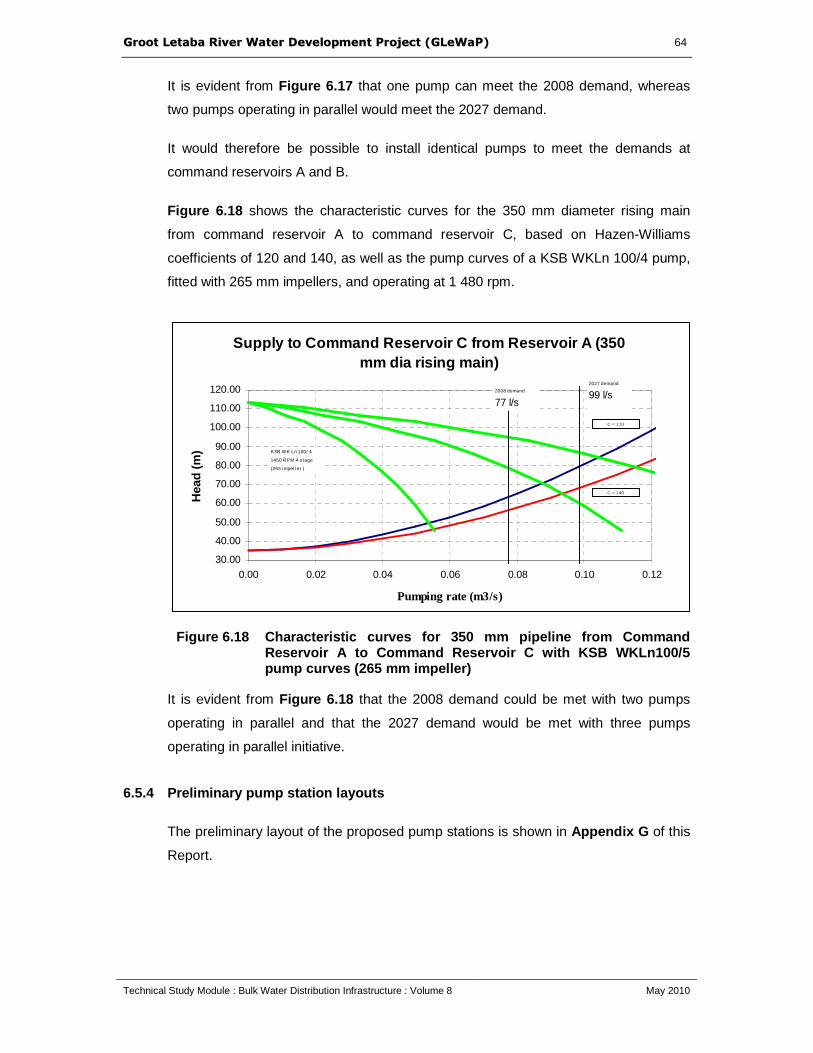
GGrroooott LLeettaabbaa RRiivveerr WWaatteerr DDeevveellooppmmeenntt PPrroojjeecctt ((GGLLeeWWaaPP)) 64
Technical Study Module : Bulk Water Distribution Infrastructure : Volume 8 May 2010
It is evident from Figure 6.17 that one pump can meet the 2008 demand, whereas
two pumps operating in parallel would meet the 2027 demand.
It would therefore be possible to install identical pumps to meet the demands at
command reservoirs A and B.
Figure 6.18 shows the characteristic curves for the 350 mm diameter rising main
from command reservoir A to command reservoir C, based on Hazen-Williams
coefficients of 120 and 140, as well as the pump curves of a KSB WKLn 100/4 pump,
fitted with 265 mm impellers, and operating at 1 480 rpm.
Figure 6.18 Characteristic curves for 350 mm pipeli ne from Command
Reservoir A to Command Reservoir C with KSB WKLn100 /5 pump curves (265 mm impeller)
It is evident from Figure 6.18 that the 2008 demand could be met with two pumps
operating in parallel and that the 2027 demand would be met with three pumps
operating in parallel initiative.
6.5.4 Preliminary pump station layouts
The preliminary layout of the proposed pump stations is shown in Appendix G of this
Report.
Supply to Command Reservoir C from Reservoir A (350
mm dia rising main)
30.00
40.00
50.00
60.00
70.00
80.00
90.00
100.00
110.00
120.00
0.00 0.02 0.04 0.06 0.08 0.10 0.12
Pumping rate (m3/s)
Hea
d (m
)
2008 demand
77 l/s
2027 demand
99 l/s
KSB WK Ln 100/ 4
1450 RPM 4 s tage
(265 i mpel l er )
C = 120
C = 140
GGrroooott LLeettaabbaa RRiivveerr WWaatteerr DDeevveellooppmmeenntt PPrroojjeecctt ((GGLLeeWWaaPP)) 65
Technical Study Module : Bulk Water Distribution Infrastructure : Volume 8 May 2010
7. WATER TREATMENT WORKS
7.1 DESIGN CRITERIA
The following design criteria will apply:
Treated water quality: SANS 241:2006 Class 1.
Maximum velocity in pipelines:
Gravity: 1,5 m/s
Pump suction: 1,5 m/s
Pump delivery: 2,5 m/s
Rapid mix shear : 750 to 1 000 s-1
Flocculation shear and retention : In accordance with laboratory tests.
Sedimentation loading (horizontal flow) : Depends on flocc tests (1 m/h)
Filtration rate : 5 to 7 m3/m2/h
Disinfection : Ct for disinfection of bacteria and viruses
7.2 CAPACITY
The Nkambako WTW has a capacity of 12 Mℓ/d (including the recently constructed
6 Mℓ/d addition). In view of the uncertainty associated with the current and future
water requirements it is proposed that any future upgrading be undertaken in
increments of 12 Mℓ/d. The High Level Service water requirement scenario indicates
that the capacity of the WTW (based on peak week water requirements) should be
45 Mℓ/d in 2027. This water requirement assumes that all the settlements in the
logical supply area of the proposed Nwamitwa Dam have installed reticulation down
to village level. The preliminary design is therefore based on the provision of 12 Mℓ/d
modules.
7.3 REQUIRED QUALITY OF TREATED WATER
The treated water must comply with the requirements of SANS Class I specification.
GGrroooott LLeettaabbaa RRiivveerr WWaatteerr DDeevveellooppmmeenntt PPrroojjeecctt ((GGLLeeWWaaPP)) 66
Technical Study Module : Bulk Water Distribution Infrastructure : Volume 8 May 2010
7.4 FUTURE RAW WATER QUALITY
It is noted that some limited urban development exists within the catchment of the
proposed dam and in fact is close to the high water mark. It can therefore be
expected that raw water quality will decline over time, particularly as regards to
orthophosphate and nitrate, and that a degree of eutrophication may occur in the
future. It is recommended that adequate sanitation be provided by the Water Service
Authority in order to limit the danger of bacteriological contamination of the water
source.
The following long-term changes may occur:
• Slightly lower pH
• Increase in dissolved metals, Fe and Mn, in bottom water
• Increase in organic carbon associated with algae
• Possible increase in turbidity and TDS
• Possible increase in e-coli
It is therefore important that the water treatment process be designed for the possible
long term water quality that can be expected.
7.5 PRELIMINARY PROCESS
The following preliminary process is based on the limited water quality data available.
The proposed process is shown on the Water Treatment Works Flow Diagram (see
Appendix H ) and is described below.
7.5.1 Chemical dosing
1. Dosing of lime for pH correction for optimum flocculation and to attain a final
water with a positive calcium carbonate precipitation potential.
Dosing of a coagulation chemical, as determined in laboratory testing, probably
a poly-aluminium chloride or a polyelectrolyte.
2. Rapid mixing of chemicals into raw water
It is proposed that the chemicals will be mixed into the raw water at a
constriction in the raw water inlet pipe. Research has indicated that this is the
most efficient mixing device for turbid waters.
GGrroooott LLeettaabbaa RRiivveerr WWaatteerr DDeevveellooppmmeenntt PPrroojjeecctt ((GGLLeeWWaaPP)) 67
Technical Study Module : Bulk Water Distribution Infrastructure : Volume 8 May 2010
Provision will be made in the design for the future addition of an oxidant to
oxidise divalent iron and manganese prior to sedimentation.
7.5.2 Flocculation
Flocculation will take place either in a hydraulically mixed flocculation channel or in a
series of three mechanically mixed tanks. A final decision as to the units to be used
will be taken at detailed design tests after laboratory determination of the flocculation
constants.
The retention time and mixing intensity will be determined by laboratory tests at
detailed design stage. Retention time is expected to be of the order to 20 minutes.
7.5.3 Liquid solids separation
Deep bed direct filtration will be suitable for the low and median turbidity levels
recorded in Table 2.1 . Filtration will however not be suitable for the peak levels of
turbidity shown. In view of the fact that the turbidity may well increase in the future it
is proposed to use horizontal flow sedimentation tanks as the liquid solids separation
unit.
As mentioned above, it is probable that algae concentrations will increase in the
future. It is therefore proposed to design the plant layout so that flotation units can be
inserted at the head of the works to cope with this eventuality.
7.5.4 Filtration
Filtration will be by means of rapid gravity sand filters. The design load will be of the
order of 5 to 7 m3/m2/h. A minimum of four declining rate filters is proposed.
It is proposed that filters having a false floor system shall be used and outlet control
shall be by means of an outlet siphon and partialisation box.
Backwash shall be by means of a reverse flow of water, followed by a combined flow
of air and reduced water wash and a final rinse of a full water wash.
To accommodate the water wash rates required it is proposed that three half duty
pumps be provided, two duty and one standby.
7.5.5 Stabilisation
As mentioned in Item 1 above, the initial lime dose will be set to produce a final water
that is neither corrosive nor aggressive, i.e. a water with a positive calcium carbonate
precipitation potential.

GGrroooott LLeettaabbaa RRiivveerr WWaatteerr DDeevveellooppmmeenntt PPrroojjeecctt ((GGLLeeWWaaPP)) 68
Technical Study Module : Bulk Water Distribution Infrastructure : Volume 8 May 2010
7.5.6 Disinfection
Disinfection will be by means of chlorine addition. The chlorine dose and retention
time will be calculated based on modern theory to ensure that a kill of bacteria and
viruses is achieved. An additional chlorinator will be installed to dose chlorine to the
new Module 3.
The clearwell will be fitted with a level meter.
7.5.7 Process control
It is proposed that the following functions shall be automated:
• Adjustment of pH by the addition of lime. A pH meter should be installed at the
head of the flocculation channel and the lime feeder should be automatically
adjusted to attain a stable pH with respect to calcium carbonate precipitation
potential.
• Filter backwash sequence. The filter wash sequence should be initiated by the
plant operator. Thereafter the sequence shall be automatically executed. To
this end all filter valves will be fitted with actuators.
• Shut down of chlorine drums in the event of a leak. A chlorine leak detector
should be installed in the chlorine drum store. An air supply plant should be
provided which will automatically close the chlorine drum valves when a leak is
detected and an alarm should be sounded. The chlorine drums must be
manually opened once the accumulated gas has been cleared.
• Operator's station. A man machine interface (MMI) should be provided at the
operator's station which will indicate all the parameters and from which the
operator should be able to initiate filter wash.
7.6 PRELIMINARY LAYOUT
The preliminary layout of the proposed extension to the Nkambako WTW is contained
in Appendix H of this report.

GGrroooott LLeettaabbaa RRiivveerr WWaatteerr DDeevveellooppmmeenntt PPrroojjeecctt ((GGLLeeWWaaPP)) 69
Technical Study Module : Bulk Water Distribution Infrastructure : Volume 8 May 2010
8. RAW WATER PIPELINE AND PUMP STATION
8.1 DESIGN CRITERIA AND METHODOLOGY
This section deals with the preliminary optimisation of the raw water supply from the
proposed Nwamitwa Dam to the WTW.
8.1.1 Operation of the raw water supply system
The existing raw water balancing dam at the WTW has a full supply level of
approximately 474 m, whereas the operating level in the Nwamitwa Dam is likely to
fluctuate from 470 m (i.e. 15% full) to 479,5 m (i.e. full supply level). It is therefore
necessary to design the system to allow the filling of the balancing dam under gravity
when the water level in the Nwamitwa Dam is high enough. Pumping is necessary
when the water level in Nwamitwa Dam is lower than that in the balancing dam.
It would not be possible to locate the pump station at the Nwamitwa Dam, as the
fluctuating water level makes it impossible to cover the complete operating range in
flows (even when equipping the pumps with variable speed drives). The control of
the switching from gravity to pumping mode, and vice versa, would also be
complicated.
The preferred method of operation would be a hydraulically controlled system
whereby the existing balancing dam would be filled under gravity when the water level
in the Nwamitwa Dam is above 474 m, and a new balancing dam with a full supply
level of 465 m to 467 m is filled when the water level in Nwamitwa Dam drops below
474 m. Water would then be pumped from the lower balancing dam to the existing
balancing dam against a fixed head. This option would be suitable for fixed speed
motors and would simplify the stopping and starting of the pumps, which would be
regulated by the water level in the existing balancing dam.
Figure 8.1 shows the location of the WTW, the existing balancing dam, the dam wall
of the proposed Nwamitwa Dam, the proposed pipeline routes and the proposed
balancing dam.

Figure 8.1 Raw water pipeline route and balancing d am
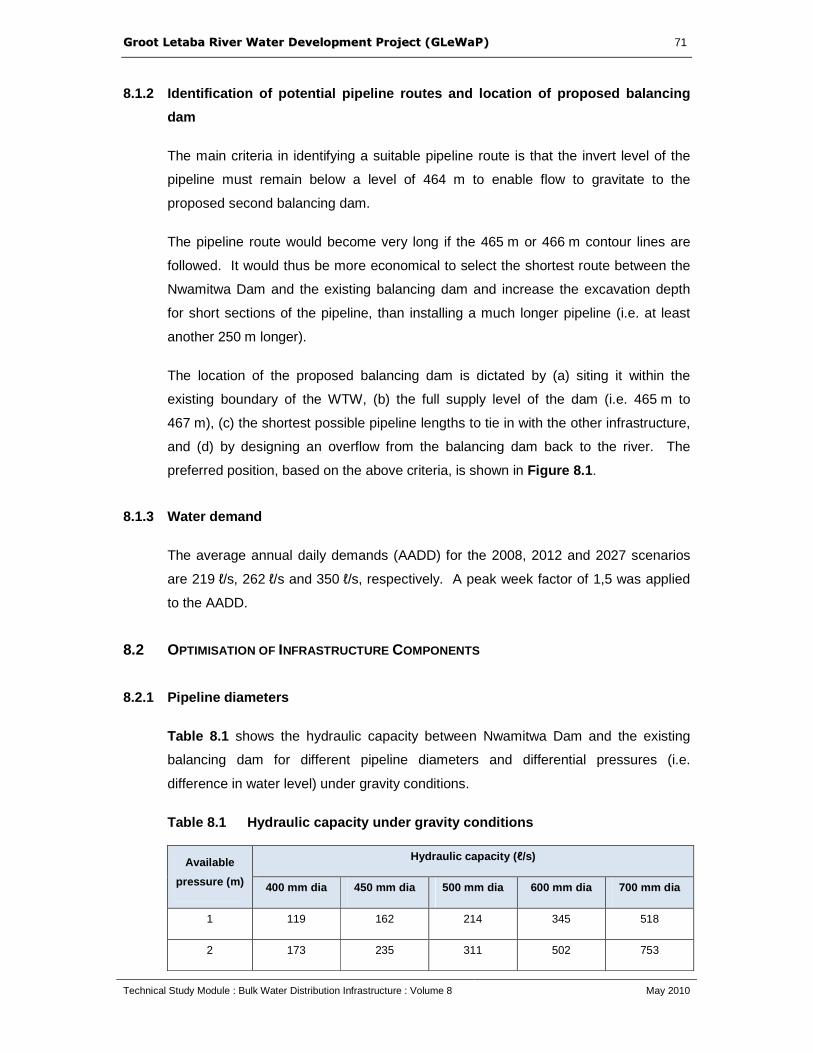
GGrroooott LLeettaabbaa RRiivveerr WWaatteerr DDeevveellooppmmeenntt PPrroojjeecctt ((GGLLeeWWaaPP)) 71
Technical Study Module : Bulk Water Distribution Infrastructure : Volume 8 May 2010
8.1.2 Identification of potential pipeline routes a nd location of proposed balancing
dam
The main criteria in identifying a suitable pipeline route is that the invert level of the
pipeline must remain below a level of 464 m to enable flow to gravitate to the
proposed second balancing dam.
The pipeline route would become very long if the 465 m or 466 m contour lines are
followed. It would thus be more economical to select the shortest route between the
Nwamitwa Dam and the existing balancing dam and increase the excavation depth
for short sections of the pipeline, than installing a much longer pipeline (i.e. at least
another 250 m longer).
The location of the proposed balancing dam is dictated by (a) siting it within the
existing boundary of the WTW, (b) the full supply level of the dam (i.e. 465 m to
467 m), (c) the shortest possible pipeline lengths to tie in with the other infrastructure,
and (d) by designing an overflow from the balancing dam back to the river. The
preferred position, based on the above criteria, is shown in Figure 8.1 .
8.1.3 Water demand
The average annual daily demands (AADD) for the 2008, 2012 and 2027 scenarios
are 219 ℓ/s, 262 ℓ/s and 350 ℓ/s, respectively. A peak week factor of 1,5 was applied
to the AADD.
8.2 OPTIMISATION OF INFRASTRUCTURE COMPONENTS
8.2.1 Pipeline diameters
Table 8.1 shows the hydraulic capacity between Nwamitwa Dam and the existing
balancing dam for different pipeline diameters and differential pressures (i.e.
difference in water level) under gravity conditions.
Table 8.1 Hydraulic capacity under gravity conditio ns
Available
pressure (m)
Hydraulic capacity ( ℓ/s)
400 mm dia 450 mm dia 500 mm dia 600 mm dia 700 mm dia
1 119 162 214 345 518
2 173 235 311 502 753

GGrroooott LLeettaabbaa RRiivveerr WWaatteerr DDeevveellooppmmeenntt PPrroojjeecctt ((GGLLeeWWaaPP)) 72
Technical Study Module : Bulk Water Distribution Infrastructure : Volume 8 May 2010
Available
pressure (m)
Hydraulic capacity ( ℓ/s)
400 mm dia 450 mm dia 500 mm dia 600 mm dia 700 mm dia
3 215 293 387 625 937
4 251 342 452 730 1095
5 283 386 510 823 1235
The 2008 and 2027 peak week demands are 328 ℓ/s and 525 ℓ/s, respectively. It is
evident from Table 8.1 that a 450 mm diameter pipeline would be able to meet the
2008 demand only when the Nwamitwa Dam is at a level of 478 m or higher. A
600 mm diameter pipeline would be able to meet the 2008 demand with 1 m available
pressure and would supply the 2027 demand with 2,2 m available pressure.
It is recommended that a 600 mm diameter pipeline be installed from the Nwamitwa
Dam to the existing and proposed balancing dams. Water would be fed under gravity
conditions to the proposed balancing dam when the water level in Nwamitwa Dam
drops to below 474 m. The hydraulic capacity to the proposed balancing dam would
be similar to that shown in Table 8.1 , as the pipeline lengths are similar, as well as
the available pressure.
The rising main between the proposed balancing dam and the existing balancing dam
is only 200 m and pipe friction, even at high velocities, would not be significant. If a
pumping velocity of 2,0 m/s is accepted, a 600 mm diameter rising main would be
required to pump the 2027 demand of 525 ℓ/s. The pipe friction loss would be
approximately 1 m, based on a Hazen-Williams friction coefficient of 130. The total
manometric pumping head would thus be 10 m.
8.2.2 Balancing dam
It is proposed that the balancing dam be sized for 2 hours balancing capacity to
prevent frequent stopping and starting of the pumps. A balancing capacity of
3 780 m3 would thus be required for a peak demand of 525 ℓ/s. Based on a depth of
2 m, the surface area would be approximately 45 m x 45 m.
8.2.3 Pump sizing
It was noted in Section 8.2.1 that the pump duty would be 525 ℓ/s at a total head of
10 m, based on a 600 mm diameter rising main. The initial pump duty would be
328 ℓ/s at a total head of 9,4 m.

GGrroooott LLeettaabbaa RRiivveerr WWaatteerr DDeevveellooppmmeenntt PPrroojjeecctt ((GGLLeeWWaaPP)) 73
Technical Study Module : Bulk Water Distribution Infrastructure : Volume 8 May 2010
Figure 8.2 shows the characteristic curve for a 600 mm diameter rising main, based
on a Hazen-Williams coefficient of 130, as well as pump curves of a KSB ETA 250-29
pump, fitted with 290 mm impellers, and operating at 1 450 rpm.
Rising main between proposed and existing balancing dam
0.0
2.5
5.0
7.5
10.0
12.5
15.0
17.5
20.0
22.5
25.0
27.5
0 0.05 0.1 0.15 0.2 0.25 0.3 0.35 0.4 0.45 0.5 0.55 0.6 0.65 0.7 0.75 0.8
F lo w ( m3 / s)
C = 130
KSB ETA 250-29 (2 pumps in parallel)
KSB ETA 250-29 (1 pump)
Figure 8.2 Characteristic curves for 600 mm pipelin e with KSB ETA 250-29 pump curves (290 mm impeller)
It is evident from Figure 8.2 that one pump would be able to deliver 310 ℓ/s, thereby
almost meeting the 2008 demand of 328 ℓ/s. Two pumps in parallel would deliver
595 ℓ/s, which would meet the 2027 demand of 525 ℓ/s. It would therefore be
possible to initially install two pumps (one duty, one standby) and later install a third
pump (i.e. two duty, one standby) to meet the increase in demand.
8.3 PRELIMINARY PUMP STATION LAYOUT
The preliminary layout of the proposed raw water pump station is contained in
Appendix G of this Report.

GGrroooott LLeettaabbaa RRiivveerr WWaatteerr DDeevveellooppmmeenntt PPrroojjeecctt ((GGLLeeWWaaPP)) 74
Technical Study Module : Bulk Water Distribution Infrastructure : Volume 8 May 2010
9. GROUNDWATER UTILISATION
A large number of villages in the supply area are reliant on groundwater. Many of the
boreholes, however, deliver water of poor quality and require treatment before use.
Blending poor borehole water with good quality water from surface water sources to
dilute the high concentrations of solutes is one method of utilising the existing
groundwater supply which was investigated.
The following groundwater use scenarios were investigated:
• Utilisation of existing groundwater supply by means of blending
• Utilisation of all existing groundwater supply by means of treatment
• Utilisation of all Class 1 existing groundwater supply
• Utilisation of future groundwater supply by means of blending
• Full groundwater utilisation
9.1 FULL UTILISATION OF EXISTING GROUNDWATER SUPPLY BY M EANS OF BLENDING
This scenario involves the use of all available groundwater in each village. Blending
with treated water from the dam was used where groundwater was of insufficient
quality to be used on its own.
As can be seen from Table 9.1 , in 2027 the total demand from the proposed
Nwamitwa Dam can be decreased by 16%. The largest decrease can be realised in
the Giyani and Lower Molototsi and Worcester/Mothobeki regions, since the majority
of these regions are currently reliant on groundwater resources.

GGrroooott LLeettaabbaa RRiivveerr WWaatteerr DDeevveellooppmmeenntt PPrroojjeecctt ((GGLLeeWWaaPP)) 75
Technical Study Module : Bulk Water Distribution Infrastructure : Volume 8 May 2010
Table 9.1 Dam demand decrease by blending with grou ndwater
Full Water Demand
(kℓ/d AADD)
Groundwater used (kℓ/d)
Demand from Dam
(kℓ/d AADD)
Decrease in Demand
from Dam (%)
2007
Letaba / Ritavi System 10 158 2 131 8 027 21%
Thapane System 5 933 592 5 341 10%
Lower Molototsi and Worcester/Mothobeki System 3 846 845 3 001 22%
Giyani System 3 395 827 2 568 24%
TOTAL 23 332 4 396 18 936 19%
2012
Letaba / Ritavi System 11 751 2 231 9 520 19%
Thapane System 7 078 593 6 485 8%
Lower Molototsi and Worcester/Mothobeki System 4 259 918 3 341 22%
Giyani System 4 016 970 3 046 24%
TOTAL 27 104 4 713 22 391 17%
2027
Letaba / Ritavi System 14 256 2 329 11 927 16%
Thapane System 9 007 595 8 412 7%
Lower Molototsi and Worcester/Mothobeki System 4 908 1 036 3 872 21%
Giyani System 6 491 1 547 4 944 24%
TOTAL 34 662 5 508 29 154 16%
9.2 UTILISATION OF ALL EXISTING GROUNDWATER SUPPLY BY MEANS OF TREATMENT
This scenario involves the assumption that all poor quality groundwater is chemically
treated to produce a minimum of a Class I. All nitrate contaminated boreholes are
also rehabilitated and fitted with sanitary seals. In other words, no blending water
from the dam was required. This scenario gives an idea of the quantity of
groundwater that is available regardless of quality, and so presents the most
favourable situation from a water resources point of view. Note that no estimates
regarding the cost of this chemical treatment are made.
Table 9.2 shows in 2027, 28% of the municipal water demand can be met from
groundwater resources. In the outer reaches of the system up to 55% of the demand
can be met from current boreholes.
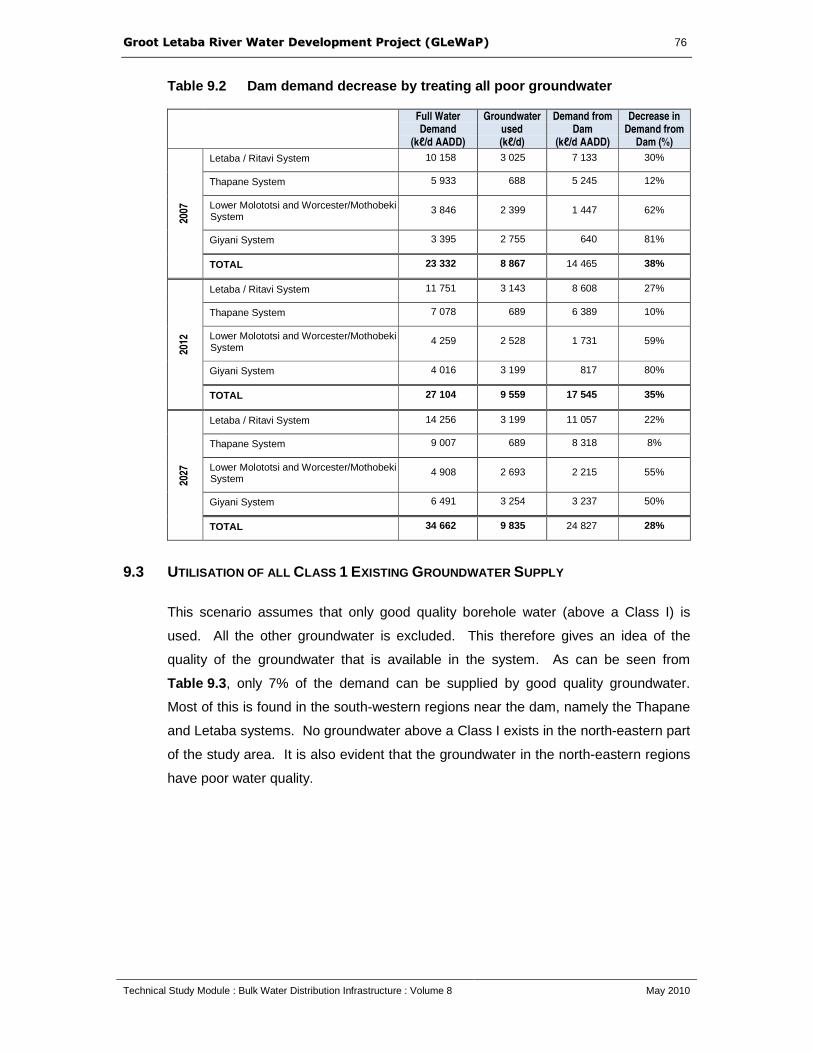
GGrroooott LLeettaabbaa RRiivveerr WWaatteerr DDeevveellooppmmeenntt PPrroojjeecctt ((GGLLeeWWaaPP)) 76
Technical Study Module : Bulk Water Distribution Infrastructure : Volume 8 May 2010
Table 9.2 Dam demand decrease by treating all poor groundwater
Full Water Demand
(kℓ/d AADD)
Groundwater used (kℓ/d)
Demand from Dam
(kℓ/d AADD)
Decrease in Demand from
Dam (%)
2007
Letaba / Ritavi System 10 158 3 025 7 133 30%
Thapane System 5 933 688 5 245 12%
Lower Molototsi and Worcester/Mothobeki System
3 846 2 399 1 447 62%
Giyani System 3 395 2 755 640 81%
TOTAL 23 332 8 867 14 465 38%
2012
Letaba / Ritavi System 11 751 3 143 8 608 27%
Thapane System 7 078 689 6 389 10%
Lower Molototsi and Worcester/Mothobeki System
4 259 2 528 1 731 59%
Giyani System 4 016 3 199 817 80%
TOTAL 27 104 9 559 17 545 35%
2027
Letaba / Ritavi System 14 256 3 199 11 057 22%
Thapane System 9 007 689 8 318 8%
Lower Molototsi and Worcester/Mothobeki System
4 908 2 693 2 215 55%
Giyani System 6 491 3 254 3 237 50%
TOTAL 34 662 9 835 24 827 28%
9.3 UTILISATION OF ALL CLASS 1 EXISTING GROUNDWATER SUPPLY
This scenario assumes that only good quality borehole water (above a Class I) is
used. All the other groundwater is excluded. This therefore gives an idea of the
quality of the groundwater that is available in the system. As can be seen from
Table 9.3 , only 7% of the demand can be supplied by good quality groundwater.
Most of this is found in the south-western regions near the dam, namely the Thapane
and Letaba systems. No groundwater above a Class I exists in the north-eastern part
of the study area. It is also evident that the groundwater in the north-eastern regions
have poor water quality.

GGrroooott LLeettaabbaa RRiivveerr WWaatteerr DDeevveellooppmmeenntt PPrroojjeecctt ((GGLLeeWWaaPP)) 77
Technical Study Module : Bulk Water Distribution Infrastructure : Volume 8 May 2010
Table 9.3 Dam demand decrease by excluding all poor groundwater
Full Water Demand
(kℓ/d AADD)
Groundwater used (kℓ/d)
Demand from Dam
(kℓ/d AADD)
Decrease in Demand from
Dam (%) 20
07
Letaba / Ritavi System 10 158 1 638 8 520 16%
Thapane System 5 933 580 5 353 10%
Lower Molototsi and Worcester/Mothobeki System 3 846 243 3 603 6%
Giyani System 3 395 0 3 395 0%
TOTAL 23 332 2 462 20 870 11%
2012
Letaba / Ritavi System 11 751 1 678 10 073 14%
Thapane System 7 078 580 6 498 8%
Lower Molototsi and Worcester/Mothobeki System 4 259 256 4 003 6%
Giyani System 4 016 0 4 016 0%
TOTAL 27 104 2 514 24 590 9%
2027
Letaba / Ritavi System 14 256 1 678 12 578 12%
Thapane System 9 007 580 8 427 6%
Lower Molototsi and Worcester/Mothobeki System 4 908 281 4 627 6%
Giyani System 6 491 0 6 491 0%
TOTAL 34 662 2 539 32 123 7%
9.4 UTILISATION OF FUTURE GROUNDWATER SUPPLY BY MEANS OF BLENDING
The groundwater assessment (DWA, 2010b), undertaken for the GLeWaP Study,
presented a list of possible locations where each individual village could look for
future groundwater wellfields. These locations were selected over shear zones or
other geological groundwater features but the overriding influence in their siting was
that they had to be close to the village they were meant to supply. Because of this,
the possible future wellfields were often located in low groundwater potential areas, in
terms of yield, quality and recharge. Any new proposed wellfield in a low potential
zone was excluded and only high and moderate potential zones were considered.
The desktop groundwater report for the logical supply area is contained in Appendix I
of this report.
In order to further the analysis, a quality class for each new wellfield had to be
assumed. This was done by observing the quality of nearby existing boreholes and
choosing a representative quality class for the new boreholes. Each village was then
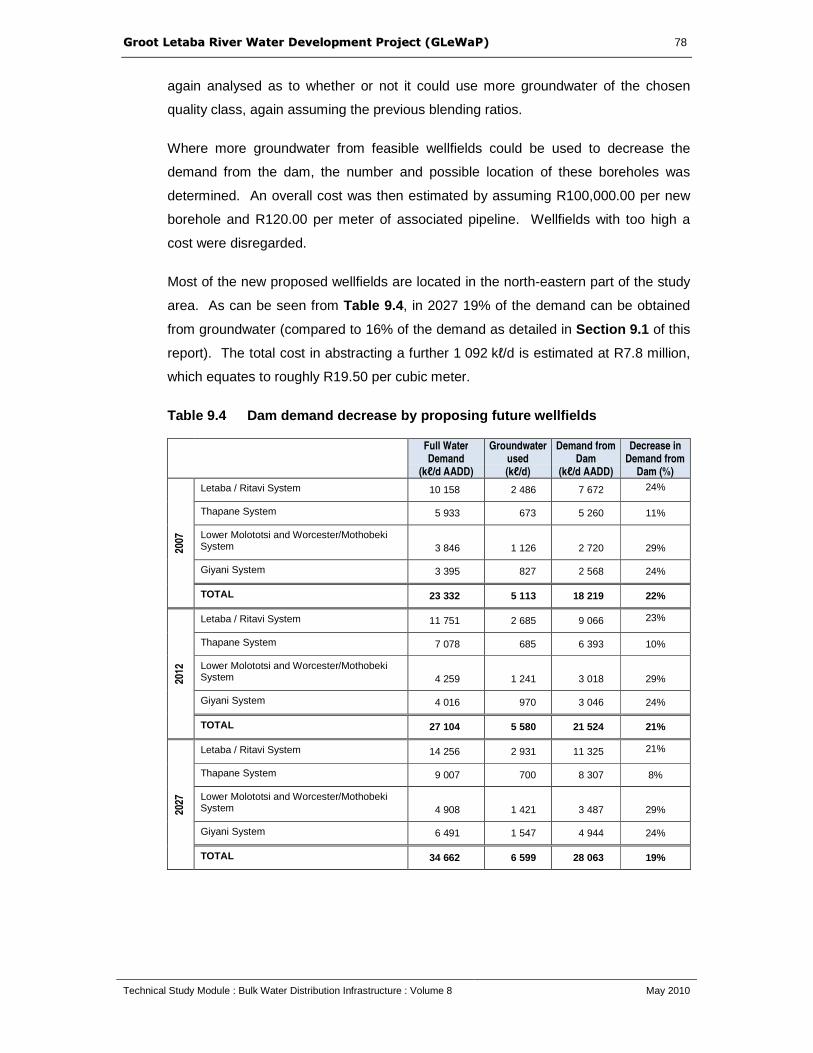
GGrroooott LLeettaabbaa RRiivveerr WWaatteerr DDeevveellooppmmeenntt PPrroojjeecctt ((GGLLeeWWaaPP)) 78
Technical Study Module : Bulk Water Distribution Infrastructure : Volume 8 May 2010
again analysed as to whether or not it could use more groundwater of the chosen
quality class, again assuming the previous blending ratios.
Where more groundwater from feasible wellfields could be used to decrease the
demand from the dam, the number and possible location of these boreholes was
determined. An overall cost was then estimated by assuming R100,000.00 per new
borehole and R120.00 per meter of associated pipeline. Wellfields with too high a
cost were disregarded.
Most of the new proposed wellfields are located in the north-eastern part of the study
area. As can be seen from Table 9.4 , in 2027 19% of the demand can be obtained
from groundwater (compared to 16% of the demand as detailed in Section 9.1 of this
report). The total cost in abstracting a further 1 092 kℓ/d is estimated at R7.8 million,
which equates to roughly R19.50 per cubic meter.
Table 9.4 Dam demand decrease by proposing future w ellfields
Full Water Demand
(kℓ/d AADD)
Groundwater used (kℓ/d)
Demand from Dam
(kℓ/d AADD)
Decrease in Demand from
Dam (%)
2007
Letaba / Ritavi System 10 158 2 486 7 672 24%
Thapane System 5 933 673 5 260 11%
Lower Molototsi and Worcester/Mothobeki System 3 846 1 126 2 720 29%
Giyani System 3 395 827 2 568 24%
TOTAL 23 332 5 113 18 219 22%
2012
Letaba / Ritavi System 11 751 2 685 9 066 23%
Thapane System 7 078 685 6 393 10%
Lower Molototsi and Worcester/Mothobeki System 4 259 1 241 3 018 29%
Giyani System 4 016 970 3 046 24%
TOTAL 27 104 5 580 21 524 21%
2027
Letaba / Ritavi System 14 256 2 931 11 325 21%
Thapane System 9 007 700 8 307 8%
Lower Molototsi and Worcester/Mothobeki System 4 908 1 421 3 487 29%
Giyani System 6 491 1 547 4 944 24%
TOTAL 34 662 6 599 28 063 19%
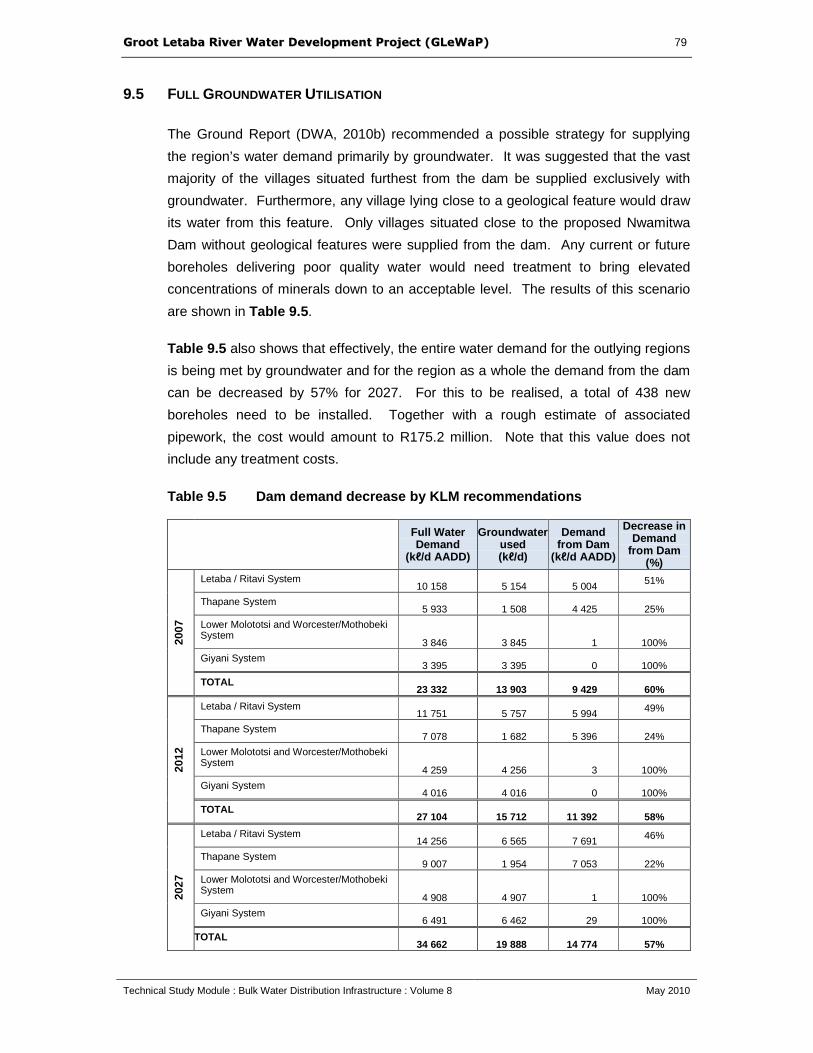
GGrroooott LLeettaabbaa RRiivveerr WWaatteerr DDeevveellooppmmeenntt PPrroojjeecctt ((GGLLeeWWaaPP)) 79
Technical Study Module : Bulk Water Distribution Infrastructure : Volume 8 May 2010
9.5 FULL GROUNDWATER UTILISATION
The Ground Report (DWA, 2010b) recommended a possible strategy for supplying
the region’s water demand primarily by groundwater. It was suggested that the vast
majority of the villages situated furthest from the dam be supplied exclusively with
groundwater. Furthermore, any village lying close to a geological feature would draw
its water from this feature. Only villages situated close to the proposed Nwamitwa
Dam without geological features were supplied from the dam. Any current or future
boreholes delivering poor quality water would need treatment to bring elevated
concentrations of minerals down to an acceptable level. The results of this scenario
are shown in Table 9.5 .
Table 9.5 also shows that effectively, the entire water demand for the outlying regions
is being met by groundwater and for the region as a whole the demand from the dam
can be decreased by 57% for 2027. For this to be realised, a total of 438 new
boreholes need to be installed. Together with a rough estimate of associated
pipework, the cost would amount to R175.2 million. Note that this value does not
include any treatment costs.
Table 9.5 Dam demand decrease by KLM recommendation s
Full Water Demand
(kℓ/d AADD)
Groundwater used (kℓ/d)
Demand from Dam
(kℓ/d AADD)
Decrease in Demand
from Dam (%)
2007
Letaba / Ritavi System 10 158 5 154 5 004 51%
Thapane System 5 933 1 508 4 425 25%
Lower Molototsi and Worcester/Mothobeki System
3 846 3 845 1 100%
Giyani System 3 395 3 395 0 100%
TOTAL 23 332 13 903 9 429 60%
2012
Letaba / Ritavi System 11 751 5 757 5 994 49%
Thapane System 7 078 1 682 5 396 24%
Lower Molototsi and Worcester/Mothobeki System
4 259 4 256 3 100%
Giyani System 4 016 4 016 0 100%
TOTAL 27 104 15 712 11 392 58%
2027
Letaba / Ritavi System 14 256 6 565 7 691 46%
Thapane System 9 007 1 954 7 053 22%
Lower Molototsi and Worcester/Mothobeki System
4 908 4 907 1 100%
Giyani System 6 491 6 462 29 100%
TOTAL 34 662 19 888 14 774 57%
GGrroooott LLeettaabbaa RRiivveerr WWaatteerr DDeevveellooppmmeenntt PPrroojjeecctt ((GGLLeeWWaaPP)) 80
Technical Study Module : Bulk Water Distribution Infrastructure : Volume 8 May 2010
9.6 INTEGRATION OF FUTURE GROUNDWATER SUPPLIES INTO PRO POSED REGIONAL BULK
WATER SUPPLY INFRASTRUCTURE
It is envisaged that groundwater obtained from a wellfiled in the Worcester/Molototsi
system could be either taken to command reservoir C or D, or to a regional bulk water
supply reservoir where the groundwater can be blended with better quality water from
other source. Supplies from a wellfield developed in the Letaba/Ritavi supply area
should be conveyed to either command reservoir A or B or to Runnymede regional
bulk water supply Reservoir.
Groundwater sources can meet a portion of the AADD. The proposed regional bulk
water supply systems would then supply the balance of the AADD, as well as the
peak week water requirements. By utilising groundwater conjunctively with water
from the proposed Nwamitwa Dam, it would be possible to:
• delay future extensions to the Nkambako WTW;
• delay the need for increased conveyance capacity to the proposed Command
Reservoirs from Nkambako WTW (provided the yield of proposed Nwamitwa
Dam is sufficient to allow for this possibility); and
• delay supplying water outside the logical supply area, such as to meet the
future shortfall in the Mojadji system.
Command reservoir A and B and the Runnymede Reservoir are all located at an
elevation of approximately 600 masl. The abovementioned system of reservoirs can
also be gravity fed from the proposed command reservoir C situated north-west of
Hlohlokwe at an elevation of 635 masl. Command reservoir D (elevation 550 masl)
could also be gravity fed from command reservoir A or from command reservoir C.
The planning of any future ground water scheme should take cognisance of the
abovementioned flexibility which exists within the command reservoirs.
GGrroooott LLeettaabbaa RRiivveerr WWaatteerr DDeevveellooppmmeenntt PPrroojjeecctt ((GGLLeeWWaaPP)) 81
Technical Study Module : Bulk Water Distribution Infrastructure : Volume 8 May 2010
10. NWAMITWA RWS: CONCEPTUAL MASTER PLAN
In parallel with the GLeWaP Study, DWA appointed EVN Africa (EVN) to undertake a
bulk water supply planning assignment for the area surrounding the proposed
Nwamitwa Dam. In order to ensure integration between the two studies, EVN utilised
the services of Aurecon to develop a conceptual master plan for the bulk distribution
system. The conceptual master plan integrated the planning of the GLeWaP
Regional Bulk Water Supply Infrastructure with the planning of the "Connector" Bulk
Water Supply Infrastructure. The “connector” bulk water supply infrastructure links
the command reservoirs identified in the GLeWaP Study with the water reticulation
infrastructure in each settlement area. The Nwamitwa RWS Conceptual Master Plan
Report is contained in Appendix J of this Report.
The analysis of the Letaba/Ritavi System, the Thapane System and the
Worcester/Molototsi systems was undertaken using the Epanet model (free software
provided by the US Environmental Protection Agency for the analysis of water
distribution models). Epanet allows for a dynamic time simulation of reservoir levels
which makes it ideal for this type of analysis, since it is able to monitor the behaviour
of the reticulation system over a specified time period.
The systems were analysed independently to avoid overloading the application. An
Epanet model of the existing system was set up initially and incrementally added to in
order to be able to develop a model with bulk connector infrastructure covering the
entire study area. The models were run for a peak week demand (i.e.168 hours)
scenario, as this would represent the worst case in terms of the sizing of the
proposed infrastructure. Since the ultimate goal is to provide infrastructure that will
cater for demands up to the year 2027, 2027 demands were used in the hydraulic
analysis.
The GLeWAP 2027 High Level Service Scenario water demand figures, received
from EVN Africa Consulting Engineers, were used to determine the 2027
infrastructure requirements. The water demand figures for the all villages in each
system are given in Appendix A . The High Level Service Scenario was chosen as
the basis upon which to design the future infrastructure requirements as this
represents the Water Service Authorities ultimate goal of providing water to each
household as opposed to the current system of communal stand pipes.

GGrroooott LLeettaabbaa RRiivveerr WWaatteerr DDeevveellooppmmeenntt PPrroojjeecctt ((GGLLeeWWaaPP)) 82
Technical Study Module : Bulk Water Distribution Infrastructure : Volume 8 May 2010
The timing and phasing of both the regional bulk water supply infrastructure and the
connector bulk water supply infrastructure is described in more detail in Section 12 of
this Report.

GGrroooott LLeettaabbaa RRiivveerr WWaatteerr DDeevveellooppmmeenntt PPrroojjeecctt ((GGLLeeWWaaPP)) 83
Technical Study Module : Bulk Water Distribution Infrastructure : Volume 8 May 2010
11. COST ESTIMATE
The cost estimate of the various components of the Regional Bulk Water Supply
Infrastructure are described in detail in Section 6 of this report and are summarised in
Table 11.1 .
Table 11.1 Cost estimate of the various components of the Regional Bulk
Water Supply Infrastructure
Scheme Component
Cost Estimate
(excluding VAT)
(Note 1)
Nkambako WTW to Serolorolo
Reservoir (Command Reservoir A)
Pump station, 450 mm diameter
pipeline and upgrading of existing
315 m diameter Xihoko pipeline
R 37 million
Nkambako WTW to Babanana
Reservoir (Command Reservoir B)
Pump station and 450 mm
diameter pipeline
R 27 million
Serolorolo Reservoir to Command
Reservoir C
Pump Station and 350 mm
diameter pipeline
R 17 million
Command Reservoir C 5 Ml Reservoir R 5 million
Serolorolo Reservoir to Command
Reservoir D
450 mm diameter pipeline R 24 million
Command Reservoir D 5 Ml Reservoir R 5 million
Nkambako WTW For an increase in capacity from
12 Ml/d to 45 Ml/d.
R 198 million
TOTAL R 313 million
Note 1: Costs include contingencies and professional fees. Costs have been escalated to reflect 2009 prices.
GGrroooott LLeettaabbaa RRiivveerr WWaatteerr DDeevveellooppmmeenntt PPrroojjeecctt ((GGLLeeWWaaPP)) 84
Technical Study Module : Bulk Water Distribution Infrastructure : Volume 8 May 2010
12. TIMING AND PHASING OF PROPOSED INFRASTRUCTURE
It is evident that all three water supply systems in the area currently receive an
inadequate supply of water. All the proposed infrastructure components will be
required to satisfy the specified level of service at the planning horizon of 2027.
Because of the lack of usage metering and effective water conservation and demand
management, there is uncertainty regarding current and the projected future water
requirements. Therefore the implementation of the bulk connector infrastructure
should proceed with caution. It is believed that there is an immediate need to
implement certain components of the new bulk regional infrastructure as proposed in
this report.
The proposed timing and phasing of the bulk water supply infrastructure (both
Regional and Connector Infrastructure) is based on the following considerations:
1) The need to utilise existing unutilised bulk water supply infrastructure.
2) The need to provide reliable water services to area which currently receive no
potable water.
3) The need to augment water supplies to areas which currently experience water
shortages and water rationing.
4) The need to expand the water reticulation network to all settlements and
villages.
A number of logical schemes have been conceptualized and are presented below.
Whilst the schemes are presented as individual stand alone schemes, it is important
to note that the individual schemes operate as part of a bigger system and therefore
should not be viewed in isolation. Figure 12.1 graphically illustrates the regional and
connector bulk water supply schemes which were conceptualised.
12.1 SCHEME 1: SUPPLY TO THE EXISTING 5 Mℓ SEROLOROLO RESERVOIR
Current Situation: Currently the 5 Mℓ Reservoir at Serolorolo does not receive any
treated water from Nkambako WTW. The designated supply zone of Serolorolo
Reservoir therefore receives limited water. Currently there is no water in Mookgo 7,
Ga-Wale, Mawa 12, Mawa 8, Mawa 9, Mawa 12, Gamokgwathi and Miragoma
despite having supply pipelines.

Figure 12.1 Regional water supply infrastructure : proposed scheme
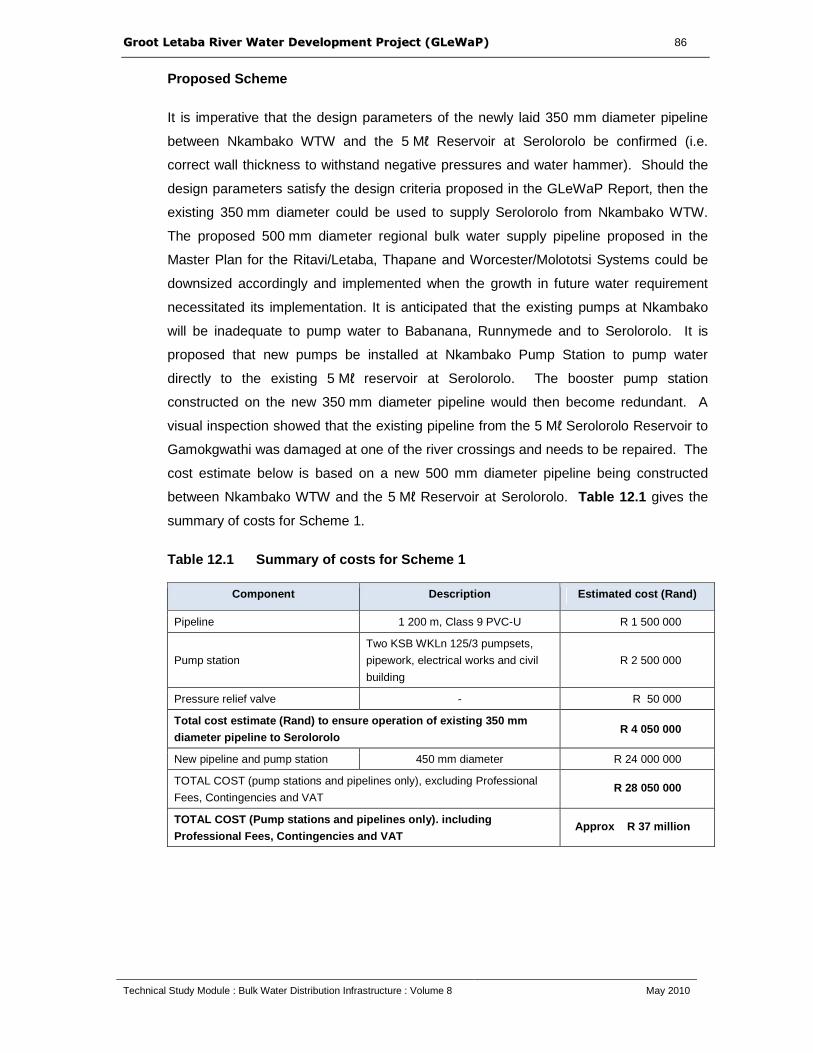
GGrroooott LLeettaabbaa RRiivveerr WWaatteerr DDeevveellooppmmeenntt PPrroojjeecctt ((GGLLeeWWaaPP)) 86
Technical Study Module : Bulk Water Distribution Infrastructure : Volume 8 May 2010
Proposed Scheme
It is imperative that the design parameters of the newly laid 350 mm diameter pipeline
between Nkambako WTW and the 5 Mℓ Reservoir at Serolorolo be confirmed (i.e.
correct wall thickness to withstand negative pressures and water hammer). Should the
design parameters satisfy the design criteria proposed in the GLeWaP Report, then the
existing 350 mm diameter could be used to supply Serolorolo from Nkambako WTW.
The proposed 500 mm diameter regional bulk water supply pipeline proposed in the
Master Plan for the Ritavi/Letaba, Thapane and Worcester/Molototsi Systems could be
downsized accordingly and implemented when the growth in future water requirement
necessitated its implementation. It is anticipated that the existing pumps at Nkambako
will be inadequate to pump water to Babanana, Runnymede and to Serolorolo. It is
proposed that new pumps be installed at Nkambako Pump Station to pump water
directly to the existing 5 Mℓ reservoir at Serolorolo. The booster pump station
constructed on the new 350 mm diameter pipeline would then become redundant. A
visual inspection showed that the existing pipeline from the 5 Mℓ Serolorolo Reservoir to
Gamokgwathi was damaged at one of the river crossings and needs to be repaired. The
cost estimate below is based on a new 500 mm diameter pipeline being constructed
between Nkambako WTW and the 5 Mℓ Reservoir at Serolorolo. Table 12.1 gives the
summary of costs for Scheme 1.
Table 12.1 Summary of costs for Scheme 1
Component Description Estimated cost (Rand)
Pipeline 1 200 m, Class 9 PVC-U R 1 500 000
Pump station
Two KSB WKLn 125/3 pumpsets,
pipework, electrical works and civil
building
R 2 500 000
Pressure relief valve - R 50 000
Total cost estimate (Rand) to ensure operation of e xisting 350 mm
diameter pipeline to Serolorolo R 4 050 000
New pipeline and pump station 450 mm diameter R 24 000 000
TOTAL COST (pump stations and pipelines only), excluding Professional
Fees, Contingencies and VAT R 28 050 000
TOTAL COST (Pump stations and pipelines only). incl uding
Professional Fees, Contingencies and VAT Approx R 37 million

GGrroooott LLeettaabbaa RRiivveerr WWaatteerr DDeevveellooppmmeenntt PPrroojjeecctt ((GGLLeeWWaaPP)) 87
Technical Study Module : Bulk Water Distribution Infrastructure : Volume 8 May 2010
12.2 SCHEME 2: SUPPLY TO GIYANI
Current Situation
Greater Giyani sub-system is situated to the east of the Letaba system. The scheme is
fed from Giyani WTW which draws raw water from Middle Letaba and Nsami Dams, and
from a weir near Zava on the Groot Letaba River. Due to all the connections and high
water requirements on the bulk reticulation supply line from Kremertart, the lower areas
beyond Dzumeri do not receive any water supply in spite of the existing pipeline
infrastructure. Most of the settlements downstream of Dzumeri are now relying on
groundwater supply. The overall quality of the existing groundwater supply to the area is
a DWAF Class III water which is classified as an unacceptable water quality.
Proposed Scheme
This scheme will entail laying a new gravity pipeline from the existing 5 Mℓ Reservoir at
Serolorolo to a proposed 5 Mℓ Reservoir sited to the east of Gamokgwathi. A further
gravity pipeline will have to be constructed from the new 5 Mℓ reservoir to Dzumeri in
Giyani. It is proposed that the existing 160 mm diameter pipeline laid between the
existing 5 Mℓ reservoir at Serolorolo and Gamokgwathi be extended to the proposed
5 Mℓ reservoir and be utilised until the conveyance capacity of the existing pipeline is
exceeded, whereafter the proposed 450 mm gravity pipeline would have to be
implemented. The cost estimate provided below is based on the proposed 450 mm
diameter pipeline being implemented. Table 12.2 gives the summary of costs for
Scheme 2.
Table 12.2 Summary of costs for Scheme 2
Scheme 2: Supply to Giyani
Infrastructure Requirements Cost Comments
New 450 mm diameter pipeline from Serolorolo Reservoir (Reservoir A) to Command Reservoir D
R 24.0 Could utilise existing 160 mm diameter pipeline to Gamokgwathi in interim
Command Reservoir D R 4.6 Needed to provide balancing storage
Pipeline from Command Reservoir D to Giyani
R 14.5 Pipelines required to connect Reservoir D to Giyani
Proposed Reticulation Reservoirs
R 13.5 Reticulation Reservoirs required to provide balancing storage
TOTAL R 57
GGrroooott LLeettaabbaa RRiivveerr WWaatteerr DDeevveellooppmmeenntt PPrroojjeecctt ((GGLLeeWWaaPP)) 88
Technical Study Module : Bulk Water Distribution Infrastructure : Volume 8 May 2010
12.3 SCHEME 3: SUPPLY TO THAPANE
Current Situation
The Thapane system is bound by the Lower Modjadji system in the north and the Letaba
system in the east. The system serves villages which are in relatively close proximity to
each other with the exception of Madumane and Pfapfamela.
The scheme is currently under the jurisdiction of Greater Tzaneen Municipality. The
scheme is supplied by Thapane Dam, which has a reported yield of 1.5 Mm3/a. Raw
water is pumped to Thapane WTW using two submersible pumps with a total capacity of
50 ℓ/s. Thapane WTW has a capacity to supply 4 100 kℓ/d.
Mopye booster pump station consists of two pump sets (one duty and one standby).
The pump station feeds two service reservoirs; one at Motupa and the other at Mopye.
The operation is such that they pump to one reservoir at a time. Currently, the reservoir
at Mopye is only supplied until half-filled as a way of water rationing. When half-filled, it
takes about six hours for the reservoir to empty. Villagers do therefore not receive a
continuous supply of water throughout the day. Some villages go for three days without
running water. This is as a result of inadequate water resources and inadequate
infrastructure. Major parts of Relela, Jokong and Mothomeng do not have water supply,
primarily due to lack of infrastructure, but also due to inadequate pressure in the case of
Mothomeng.
Proposed Scheme
The proposed Scheme will supplement the supply to the Thapane area from the
proposed Nwamitwa Dam. The Scheme entails installing additional pumps at Nkambako
WTW and ultimately laying a new rising main from Nkambako WTW to the existing 7 Mℓ
Babanana Reservoir, when the capacity of the existing pipeline is exceeded. A new
pump station and 400 mm rising main would have to be constructed from Babanana
Reservoir to a proposed 5 Mℓ reservoir at Mohlokong. From Mohlokong new gravity
pipeline(s) would have to be constructed to be able to supply a greater part of the
Thapane area. Table 12.3 gives the summary of costs for Scheme 3.
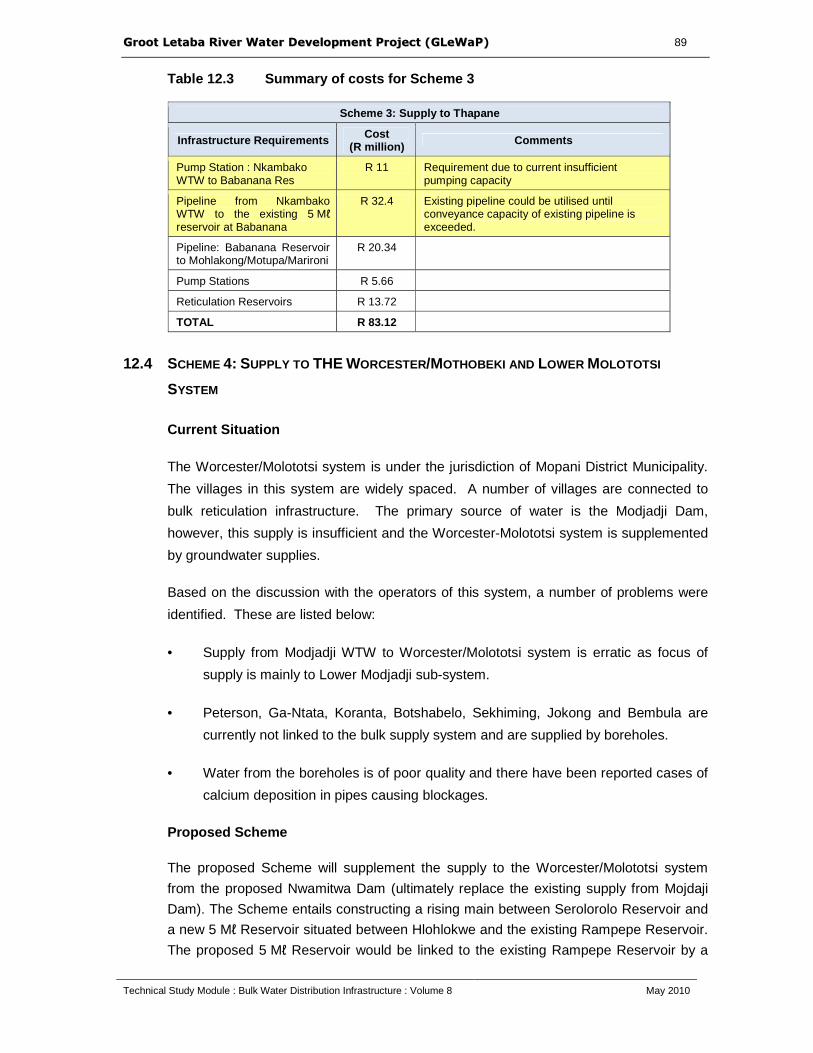
GGrroooott LLeettaabbaa RRiivveerr WWaatteerr DDeevveellooppmmeenntt PPrroojjeecctt ((GGLLeeWWaaPP)) 89
Technical Study Module : Bulk Water Distribution Infrastructure : Volume 8 May 2010
Table 12.3 Summary of costs for Scheme 3
Scheme 3: Supply to Thapane
Infrastructure Requirements Cost (R million) Comments
Pump Station : Nkambako WTW to Babanana Res
R 11 Requirement due to current insufficient pumping capacity
Pipeline from Nkambako WTW to the existing 5 Mℓ reservoir at Babanana
R 32.4 Existing pipeline could be utilised until conveyance capacity of existing pipeline is exceeded.
Pipeline: Babanana Reservoir to Mohlakong/Motupa/Marironi
R 20.34
Pump Stations R 5.66
Reticulation Reservoirs R 13.72
TOTAL R 83.12
12.4 SCHEME 4: SUPPLY TO THE WORCESTER/MOTHOBEKI AND LOWER MOLOTOTSI
SYSTEM
Current Situation
The Worcester/Molototsi system is under the jurisdiction of Mopani District Municipality.
The villages in this system are widely spaced. A number of villages are connected to
bulk reticulation infrastructure. The primary source of water is the Modjadji Dam,
however, this supply is insufficient and the Worcester-Molototsi system is supplemented
by groundwater supplies.
Based on the discussion with the operators of this system, a number of problems were
identified. These are listed below:
• Supply from Modjadji WTW to Worcester/Molototsi system is erratic as focus of
supply is mainly to Lower Modjadji sub-system.
• Peterson, Ga-Ntata, Koranta, Botshabelo, Sekhiming, Jokong and Bembula are
currently not linked to the bulk supply system and are supplied by boreholes.
• Water from the boreholes is of poor quality and there have been reported cases of
calcium deposition in pipes causing blockages.
Proposed Scheme
The proposed Scheme will supplement the supply to the Worcester/Molototsi system
from the proposed Nwamitwa Dam (ultimately replace the existing supply from Mojdaji
Dam). The Scheme entails constructing a rising main between Serolorolo Reservoir and
a new 5 Mℓ Reservoir situated between Hlohlokwe and the existing Rampepe Reservoir.
The proposed 5 Mℓ Reservoir would be linked to the existing Rampepe Reservoir by a
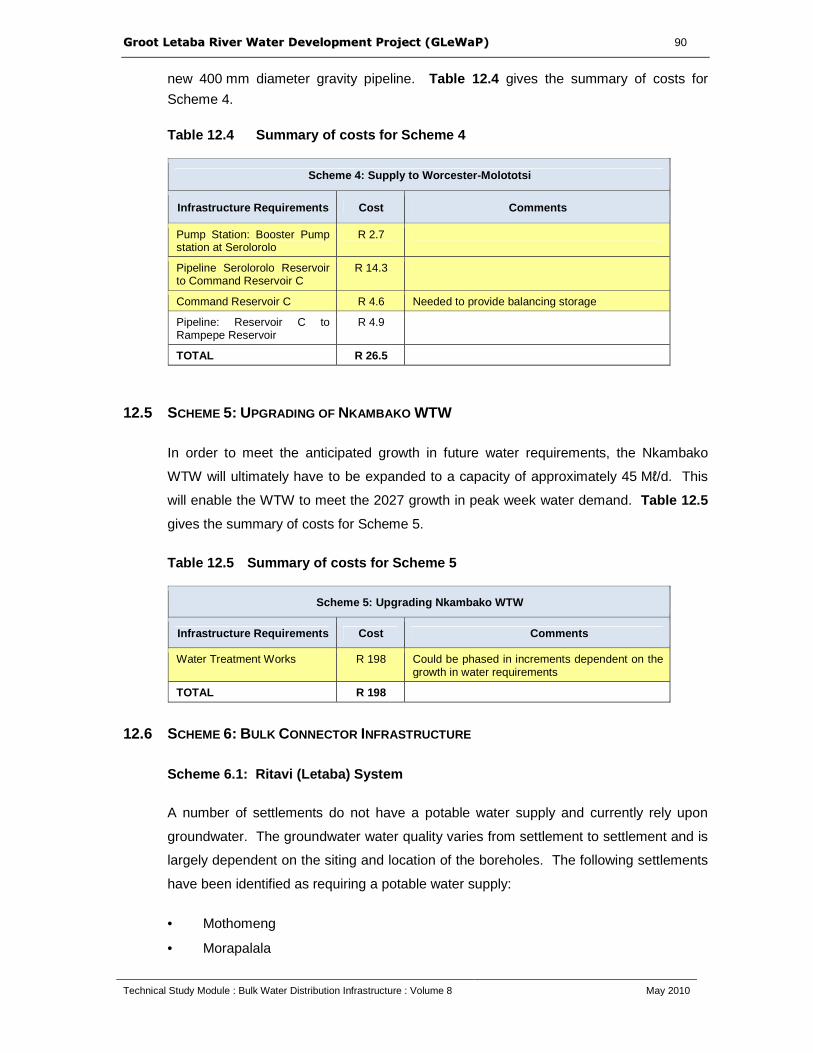
GGrroooott LLeettaabbaa RRiivveerr WWaatteerr DDeevveellooppmmeenntt PPrroojjeecctt ((GGLLeeWWaaPP)) 90
Technical Study Module : Bulk Water Distribution Infrastructure : Volume 8 May 2010
new 400 mm diameter gravity pipeline. Table 12.4 gives the summary of costs for
Scheme 4.
Table 12.4 Summary of costs for Scheme 4
Scheme 4: Supply to Worcester-Molototsi
Infrastructure Requirements Cost Comments
Pump Station: Booster Pump station at Serolorolo
R 2.7
Pipeline Serolorolo Reservoir to Command Reservoir C
R 14.3
Command Reservoir C R 4.6 Needed to provide balancing storage
Pipeline: Reservoir C to Rampepe Reservoir
R 4.9
TOTAL R 26.5
12.5 SCHEME 5: UPGRADING OF NKAMBAKO WTW
In order to meet the anticipated growth in future water requirements, the Nkambako
WTW will ultimately have to be expanded to a capacity of approximately 45 Mℓ/d. This
will enable the WTW to meet the 2027 growth in peak week water demand. Table 12.5
gives the summary of costs for Scheme 5.
Table 12.5 Summary of costs for Scheme 5
Scheme 5: Upgrading Nkambako WTW
Infrastructure Requirements Cost Comments
Water Treatment Works R 198 Could be phased in increments dependent on the growth in water requirements
TOTAL R 198
12.6 SCHEME 6: BULK CONNECTOR INFRASTRUCTURE
Scheme 6.1: Ritavi (Letaba) System
A number of settlements do not have a potable water supply and currently rely upon
groundwater. The groundwater water quality varies from settlement to settlement and is
largely dependent on the siting and location of the boreholes. The following settlements
have been identified as requiring a potable water supply:
• Mothomeng
• Morapalala

GGrroooott LLeettaabbaa RRiivveerr WWaatteerr DDeevveellooppmmeenntt PPrroojjeecctt ((GGLLeeWWaaPP)) 91
Technical Study Module : Bulk Water Distribution Infrastructure : Volume 8 May 2010
• Mabyepelong
• Hlohlokwe
• Mamanyoha
• Taulome
• Morasetta
• Miragoma
With the necessary bulk connector infrastructure (pipelines, reservoirs and pump
stations), the abovementioned settlements will be able to abstract water either under
gravity or via pumping from the regional bulk water supply infrastructure and connector
bulk water supply infrastructure proposed under this conceptual master plan. Table 12.6
gives the summary of costs for Scheme 6.1.
Table 12.6 Summary of costs for Scheme 6.1
Scheme 6.1: Supply to Ritavi (Letaba)
Infrastructure Requirements Cost
Pump Stations R 0.3
Pipelines R 28.8
Reservoirs R 35.0
TOTAL R 64.8
Scheme 6.2: Thapane System
A limited number of settlements in the Thapane area would require additional bulk
infrastructure to, as the required connector infrastructure has already been allowed for
under Scheme 3: Supply to Thapane. The settlements which require additional
infrastructure (over and above Scheme 3) are: Botludi, Mothomeng, Madumane and
Pjapjamela plan. Table 12.7 gives the summary of costs for Scheme 6.2.
Table 12.7 Summary of costs for Scheme 6.21
Scheme 6.2: Supply to Thapane
Infrastructure Requirements Cost
Pump Stations R 1.92
Pipelines R 1.6
Reservoirs R 3.4
TOTAL R 6.92
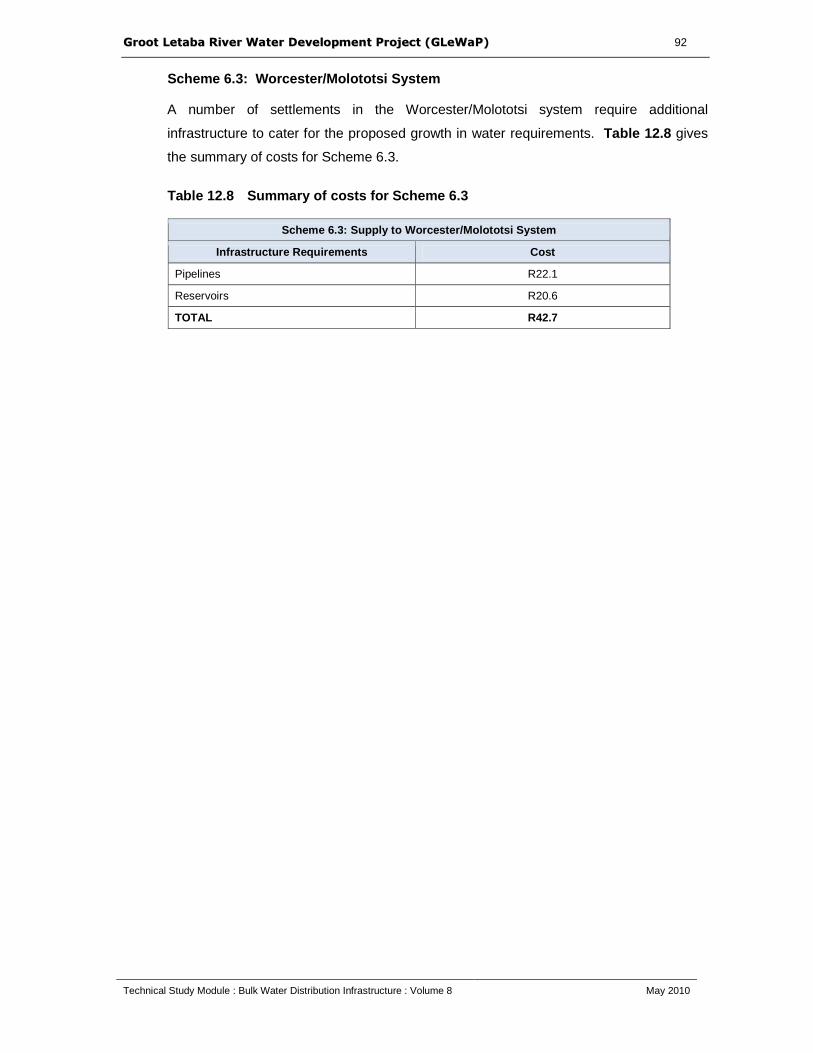
GGrroooott LLeettaabbaa RRiivveerr WWaatteerr DDeevveellooppmmeenntt PPrroojjeecctt ((GGLLeeWWaaPP)) 92
Technical Study Module : Bulk Water Distribution Infrastructure : Volume 8 May 2010
Scheme 6.3: Worcester/Molototsi System
A number of settlements in the Worcester/Molototsi system require additional
infrastructure to cater for the proposed growth in water requirements. Table 12.8 gives
the summary of costs for Scheme 6.3.
Table 12.8 Summary of costs for Scheme 6.3
Scheme 6.3: Supply to Worcester /Molototsi System
Infrastructure Requirements Cost
Pipelines R22.1
Reservoirs R20.6
TOTAL R42.7

GGrroooott LLeettaabbaa RRiivveerr WWaatteerr DDeevveellooppmmeenntt PPrroojjeecctt ((GGLLeeWWaaPP)) 93
Technical Study Module : Bulk Water Distribution Infrastructure : Volume 8 May 2010
13. CONCLUSIONS
From the study undertaken, it is evident that critical shortages of treated potable water
exist in the Letaba, Thapane and Worcester/Molototsi systems. These water shortages
can be attributed to insufficient water resources, the lack of bulk water infrastructure and
incorrect pump type selection. In order to alleviate these shortages, it is imperative that
the regional bulk water supply infrastructure as proposed in the recommendations of this
report be implemented. It is important that the design of the regional bulk water supply
infrastructure be integrated with the design of the bulk connector infrastructure in order
to avoid unnecessary redundancies in the water supply system and to ensure that the
most optimal design is obtained. There is uncertainty regarding the current and future
water requirements in the area of supply of the proposed Nwamitwa Dam. It is therefore
imperative that Mopani District Municipality ensure the metering and monitoring of all the
proposed bulk water supply schemes. The expansion of the Nkambako WTW could be
undertaken modularly as the water requirement increases in the future.
It is important to ensure that the recently constructed 355 mm Xihoko rising main is able
to deliver water to the command reservoir at Serolorolo and that the Nkambako WTW is
functioning at 12 Ml/d. Proposed modifications to this rising main have been made in this
report and should be implemented as soon as possible. This will ensure that the existing
bulk water infrastructure is fully utilised and certain villages that have not received
potable water before will now be able to receive potable water.
Most of the good quality groundwater is found in the relatively wetter western part of the
study area. The north-eastern part of the region, namely the villages in the
Worcester/Molototsi system are being supplied by boreholes of Class III and IV, which is
unacceptable for potable use. Groundwater could potentially supply a significant portion
of the future water requirements in the logical supply area of the proposed Nwamitwa
Dam, either through blending with potable supplies or by onsite treatment prior to
conveying the treated water to the regional bulk water supply reservoirs. More detailed
investigative studies have to be undertaken by the DWAF in order to determine the full
potential of groundwater in the area.
GGrroooott LLeettaabbaa RRiivveerr WWaatteerr DDeevveellooppmmeenntt PPrroojjeecctt ((GGLLeeWWaaPP)) 94
Technical Study Module : Bulk Water Distribution Infrastructure : Volume 8 May 2010
14. RECOMMENDATIONS
14.1 REGIONAL BULK WATER SUPPLY INFRASTRUCTURE
The following recommendations are made regarding the implementation of the regional
bulk water supply infrastructure:
a. The Regional Bulk Water Supply Infrastructure as proposed should be implemented.
b. The proposed timing and phasing of the bulk water supply infrastructure (both
Regional and Connector Infrastructure) be based on the following considerations:
1) The need to utilise existing bulk water supply infrastructure to maximum
capacity
2) The need to augment water supplies to areas which currently receive little or
no potable water
3) The need to augment water supplies to areas which currently experience
water shortages and water rationing
4) The need to expand the water reticulation network to all settlements and
villages.
c. The Nkambako WTW shall be designed to cater for the expected changes in the raw
water quality in the long term.
d. The following upgrades are recommended for the existing 355 mm Xihoko rising
main:
• Replace approximately 1 200 m of Class 6 PVC-U pipes with Class 9 pipes
• Install two new pumps (i.e. one duty, one standby) at the WTW to feed the
355 mm rising main (i.e. the existing pumps are not suited for the required
duty)
• Construct a sump at the suction side of the booster pump station or install a
pressure relief valve
e. Mopani District Municipality should implement a metering and monitoring system in
order to ascertain the actual water consumption for domestic purposes and to
establish how the water requirement changes with the implementation of the regional
bulk water supply and connector bulk infrastructure. This will enable informed
decisions to be taken about future infrastructure upgrades as well as the timing of
the necessary increase in water treatment capacity.
GGrroooott LLeettaabbaa RRiivveerr WWaatteerr DDeevveellooppmmeenntt PPrroojjeecctt ((GGLLeeWWaaPP)) 95
Technical Study Module : Bulk Water Distribution Infrastructure : Volume 8 May 2010
f. The capacity of the Babanana Reservoir (command reservoir B) and the Serolorolo
Reservoir (command reservoir A) should be increased when the future water
requirements reach the stage that there is insufficient emergency and balancing
storage in the respective supply areas.
g. Provision should be made for including water from a future regional groundwater
supply system in the bulk infrastructure which stores and distributes treated water
from surface water resources.
h. It is proposed that the regional bulk water supply infrastructure supplying the
Worcester/Molototsi System be used to supplement the water requirement shortfall
to the Modjadji system during off peak periods should it be required.
GGrroooott LLeettaabbaa RRiivveerr WWaatteerr DDeevveellooppmmeenntt PPrroojjeecctt ((GGLLeeWWaaPP)) 96
Technical Study Module : Bulk Water Distribution Infrastructure : Volume 8 May 2010
15. REFERENCES
Department of Housing. 2000. Guidelines for Human Settlement Planning and Design
Volume 1 (“Red Book”). Compiled by CSIR Building and Construction Technology.
Department of Water Affairs and Forestry, South Africa. 2003. Mopani District Development
Plan : DWAF Project LP 182, Book of Plans with descriptive details.
Department of Water Affairs and Forestry, South Africa. 2004. Technical guidelines for
planning and design in the development of water and sanitation services. 2nd edition.
Mopani District Municipality, Department of Water Affairs and Forestry : Directorate : Water
services Macro Planning and Information Systems. 2006. Water Services Planning Reference
Framework (Draft 2).
Department of Water Affairs, South Africa, 2010 a. Groot Letaba River Water Development
Project (GLeWaP): Technical Study Module: Water Resource Analysis: Volume 5. Prepared by
Aurecon for the Option Analysis Directorate. DWA Report No. P 02/B810/00/0608/5.
Department of Water Affairs, South Africa, 2010 b. Groot Letaba River Water Development
Project (GLeWaP): Technical Study Module: Groundwater: Volume 3. Prepared by Aurecon for
the Option Analysis Directorate. DWA Report No. P 02/B810/00/0608/3.
Mopani District Municipality Water Services Development Plan. 2007.
Design Report for Letaba RWS, Xihoko Rising Main. 2004.


