

GSRC Annual Symposium
September 28 & 29, 2006
Faculty: Kahng, Markov, Orshansky, Sylvester
GSRC Annual Symposium
September 28 & 29, 2006
Faculty: Kahng, Markov, Orshansky, Sylvester
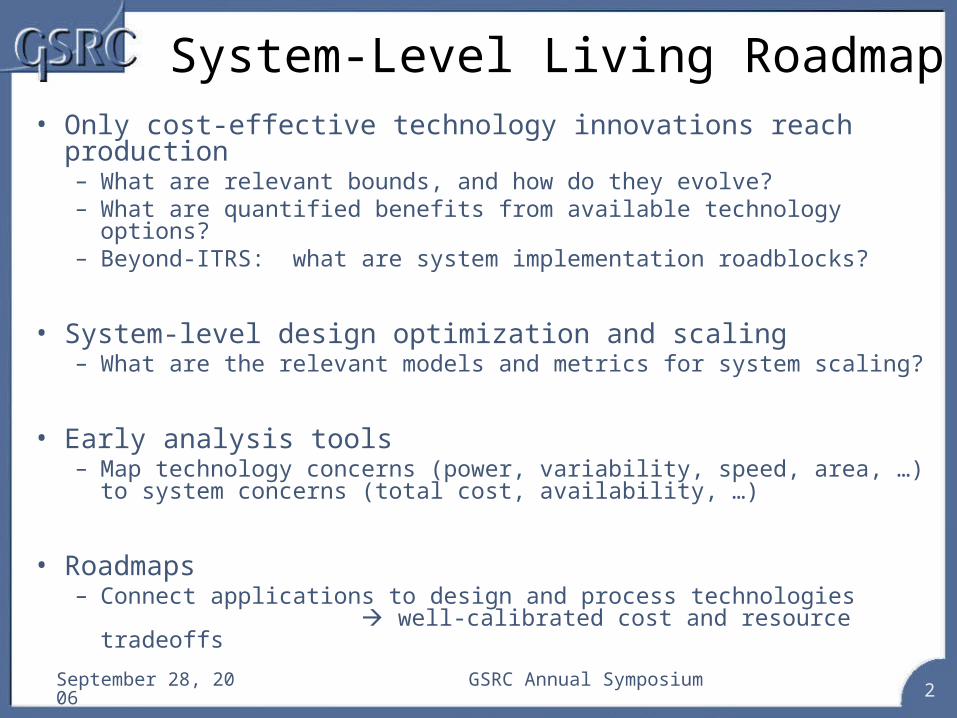
System-Level Living RoadmapSystem-Level Living Roadmap
September 28, 2006 GSRC Annual Symposium2
System-Level Living Roadmap• Only cost-effective technology innovations reach production
– What are relevant bounds, and how do they evolve?– What are quantified benefits from available technology options?– Beyond-ITRS: what are system implementation roadblocks?
• System-level design optimization and scaling– What are the relevant models and metrics for system scaling?
• Early analysis tools– Map technology concerns (power, variability, speed, area, …) to
system concerns (total cost, availability, …)
• Roadmaps– Connect applications to design and process technologies
well-calibrated cost and resource tradeoffs
September 28, 2006 GSRC Annual Symposium3
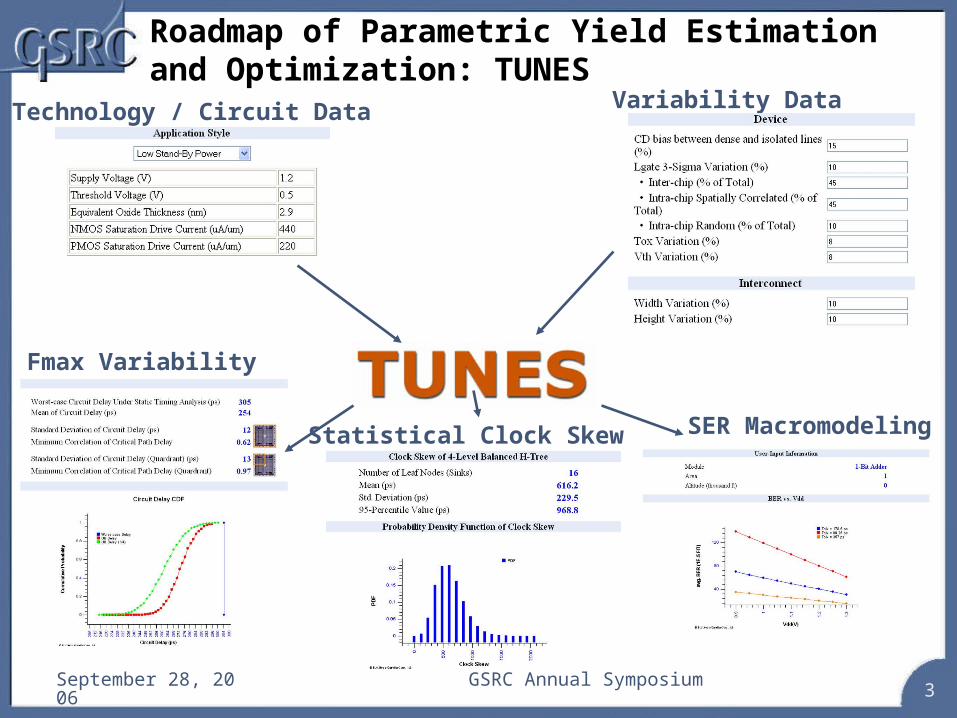
Technology / Circuit Data
Fmax Variability
Statistical Clock Skew SER Macromodeling
Variability Data
Roadmap of Parametric Yield Estimation and Optimization: TUNES
September 28, 2006 GSRC Annual Symposium4
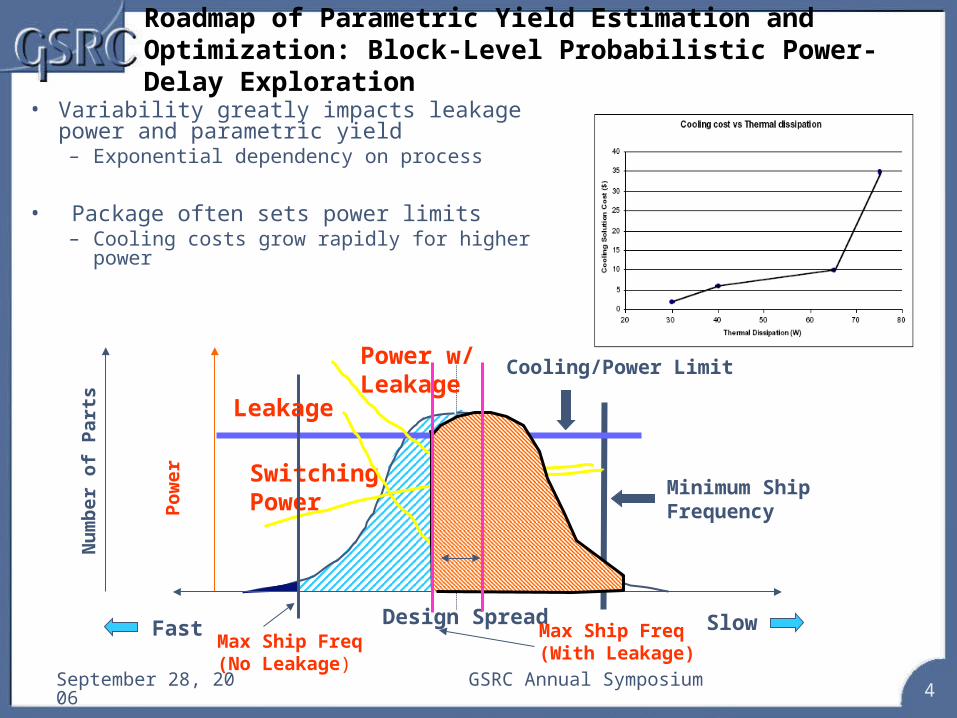
Roadmap of Parametric Yield Estimation and Optimization: Block-Level Probabilistic Power-Delay Exploration
• Variability greatly impacts leakagepower and parametric yield– Exponential dependency on process
• Package often sets power limits– Cooling costs grow rapidly for higher power
Minimum Ship Frequency
Design Spread SlowFast
Po
wer
Cooling/Power Limit
Max Ship Freq(No Leakage)
Power w/Leakage
SwitchingPower
Nu
mb
er o
f P
arts Leakage
Max Ship Freq(With Leakage)
September 28, 2006 GSRC Annual Symposium5
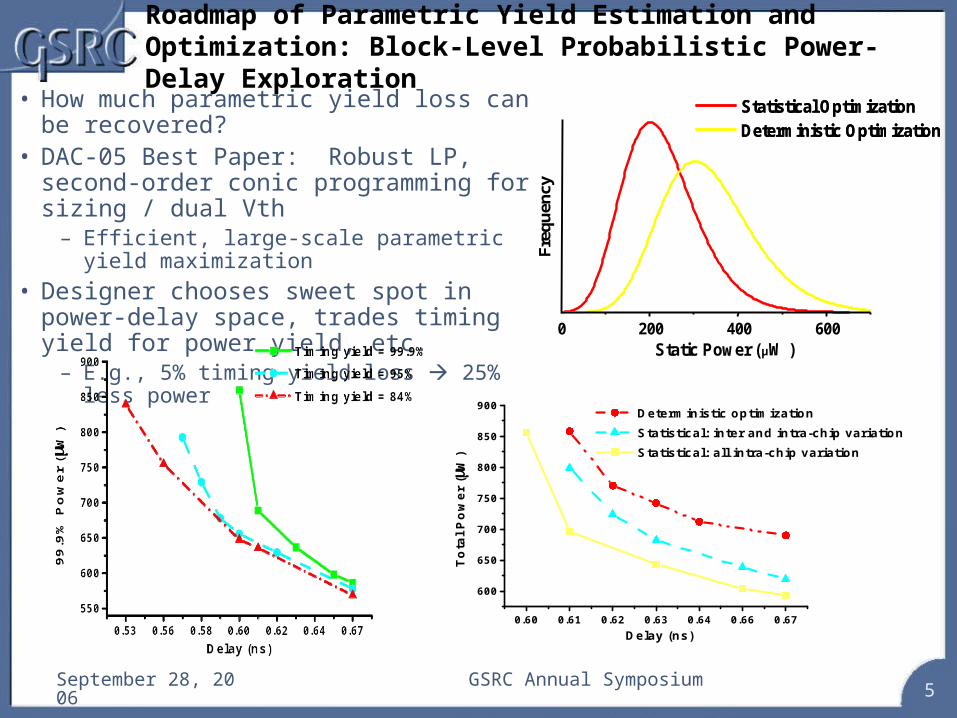
Roadmap of Parametric Yield Estimation and Optimization: Block-Level Probabilistic Power-Delay Exploration
• How much parametric yield loss can be recovered?
• DAC-05 Best Paper: Robust LP, second-order conic programming for sizing / dual Vth
– Efficient, large-scale parametric yield maximization
• Designer chooses sweet spot in power-delay space, trades timing yield for power yield, etc.
– E.g., 5% timing yield loss 25% less power
Statistical Optimization
Deterministic Optimization
Statistical Optimization
Deterministic Optimization
0 200 400 600
Fre
qu
ency
Static Power ( μW )
0.60 0.61 0.62 0.63 0.64 0.66 0.67
600
650
700
750
800
850
900 Deterministic optimization Statistical: inter and intra-chip variation Statistical: all intra-chip variation
To
tal P
ow
er (W
)
Delay (ns)
September 28, 2006 GSRC Annual Symposium6
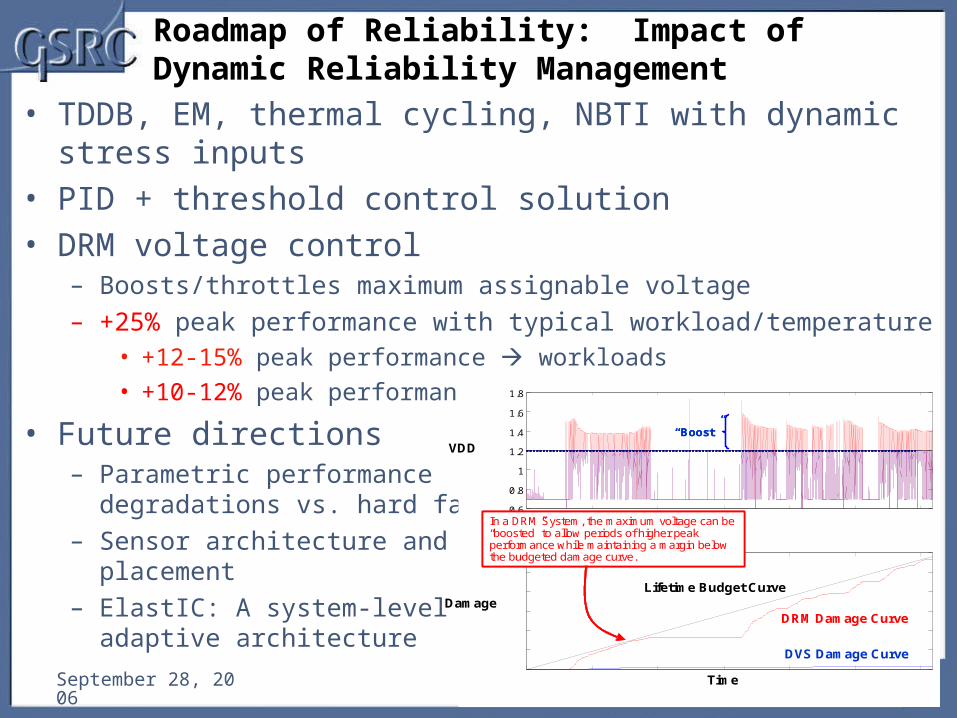
Roadmap of Reliability: Impact of Dynamic Reliability Management
• TDDB, EM, thermal cycling, NBTI with dynamic stress inputs• PID + threshold control solution• DRM voltage control
– Boosts/throttles maximum assignable voltage– +25% peak performance with typical workload/temperature
• +12-15% peak performance workloads
• +10-12% peak performance temperature
• Future directions– Parametric performance
degradations vs. hard failures– Sensor architecture and
placement– ElastIC: A system-level
adaptive architecture
0 2 4 6 8 10 12
x 104
0.6
0.8
1
1.2
1.4
1.6
1.8
0 2 4 6 8 10 12
x 104
0
0.5
1
1.5
2
2.5
3x 10⁻⁹
VDD
DamageDRM Damage Curve
Time
Lifetime Budget Curve
DVS Damage Curve
In a DRM System, the maximum voltage can be “boosted” to allow periods of higher peak performance while maintaining a margin below the budgeted damage curve.
In a DRM System, the maximum voltage can be “boosted” to allow periods of higher peak performance while maintaining a margin below the budgeted damage curve.
“Boost”“Boost”
September 28, 2006 GSRC Annual Symposium7
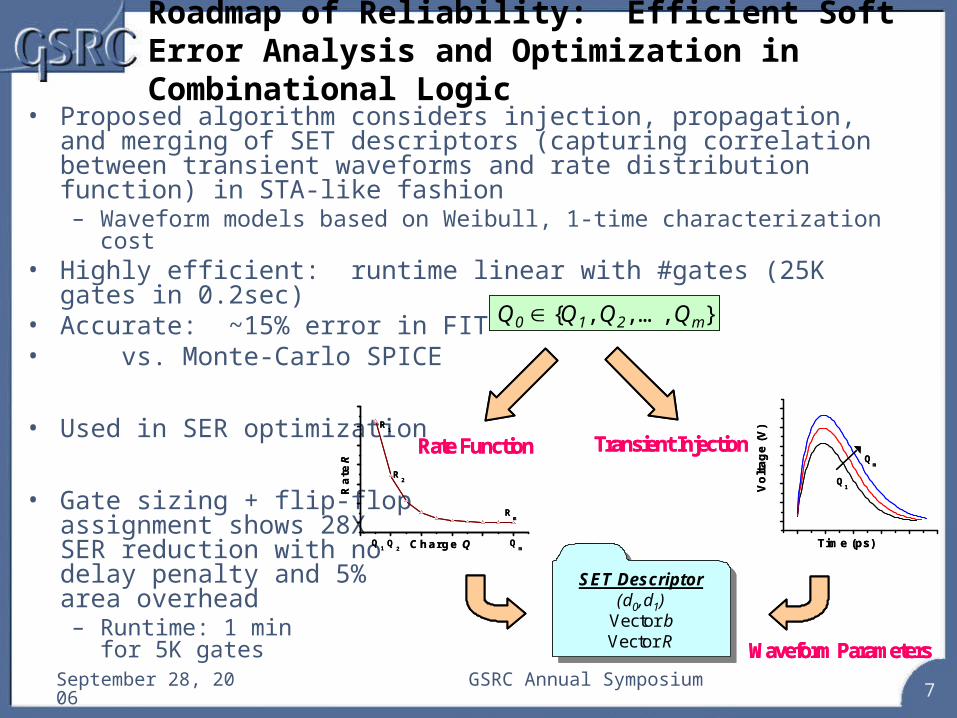
Roadmap of Reliability: Efficient Soft Error Analysis and Optimization in Combinational Logic
• Proposed algorithm considers injection, propagation, and merging of SET descriptors (capturing correlation between transient waveforms and rate distribution function) in STA-like fashion– Waveform models based on Weibull, 1-time characterization cost
• Highly efficient: runtime linear with #gates (25K gates in 0.2sec)• Accurate: ~15% error in FIT• vs. Monte-Carlo SPICE
• Used in SER optimization
• Gate sizing + flip-flopassignment shows 28X SER reduction with nodelay penalty and 5% area overhead– Runtime: 1 min
for 5K gates
Q0 {Q1, Q2, …, Qm}
Qm
Q1V
olt
age
(V)
Time (ps)
Rate Function
Ra
te R
Qm
Q2
Q1
R2
Rm
R1
Charge Q
Transient Injection
SET Descriptor(d0,d1)
Vector bVector R Waveform Parameters
Q0 {Q1, Q2, …, Qm}
Qm
Q1V
olt
age
(V)
Time (ps)
Rate Function
Ra
te R
Qm
Q2
Q1
R2
Rm
R1
Charge Q
Transient Injection
SET Descriptor(d0,d1)
Vector bVector R Waveform Parameters
September 28, 2006 GSRC Annual Symposium8
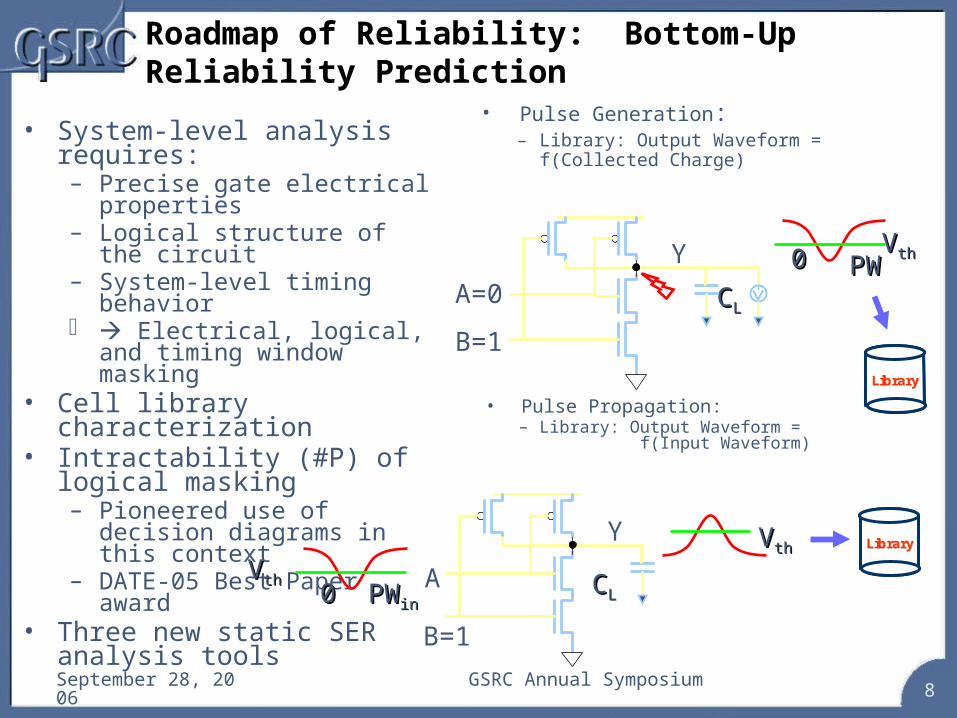
Roadmap of Reliability: Bottom-Up Reliability Prediction
• System-level analysis requires:– Precise gate electrical
properties– Logical structure of the circuit– System-level timing behavior Electrical, logical, and timing
window masking• Cell library characterization• Intractability (#P) of logical
masking– Pioneered use of decision
diagrams in this context– DATE-05 Best Paper award
• Three new static SER analysis tools
• Pulse Generation: – Library: Output Waveform = f(Collected
Charge)
CCLLA=0
B=1
Y 00 PWPWVVthth
LibraryLibraryLibraryLibrary
00 PWPWininCCLL
A
B=1
Y
VVthth
VVthth
• Pulse Propagation: – Library: Output Waveform = f(Input
Waveform)
LibraryLibraryLibraryLibrary
September 28, 2006 GSRC Annual Symposium9
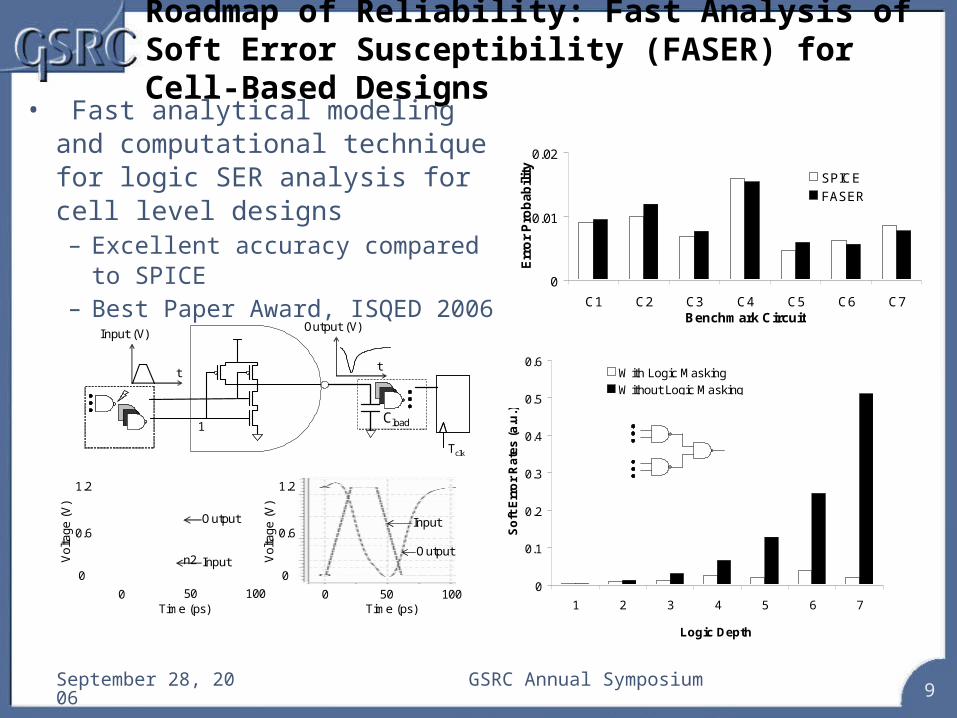
Roadmap of Reliability: Fast Analysis of Soft Error Susceptibility (FASER) for Cell-Based Designs
0
0.1
0.2
0.3
0.4
0.5
0.6
1 2 3 4 5 6 7
Logic Depth
So
ft E
rro
r R
ate
s (
a.u
.)
With Logic Masking
Without Logic Masking
1
n2
Tclk
Output (V)
t
Cload
Input (V)
t
1.2
0.6
0
0 50 100 0 50 100
Vo
ltage
(V
)
1.2
0.6
0Input
Output
Output
Input
Vol
tag
e (
V)
Time (ps) Time (ps)
• Fast analytical modeling and computational technique for logic SER analysis for cell level designs– Excellent accuracy compared to
SPICE– Best Paper Award, ISQED 2006
0
0.01
0.02
C1 C2 C3 C4 C5 C6 C7Benchmark Circuit
Err
or
Pro
ba
bil
ity
SPICE
FASER
September 28, 2006 GSRC Annual Symposium10
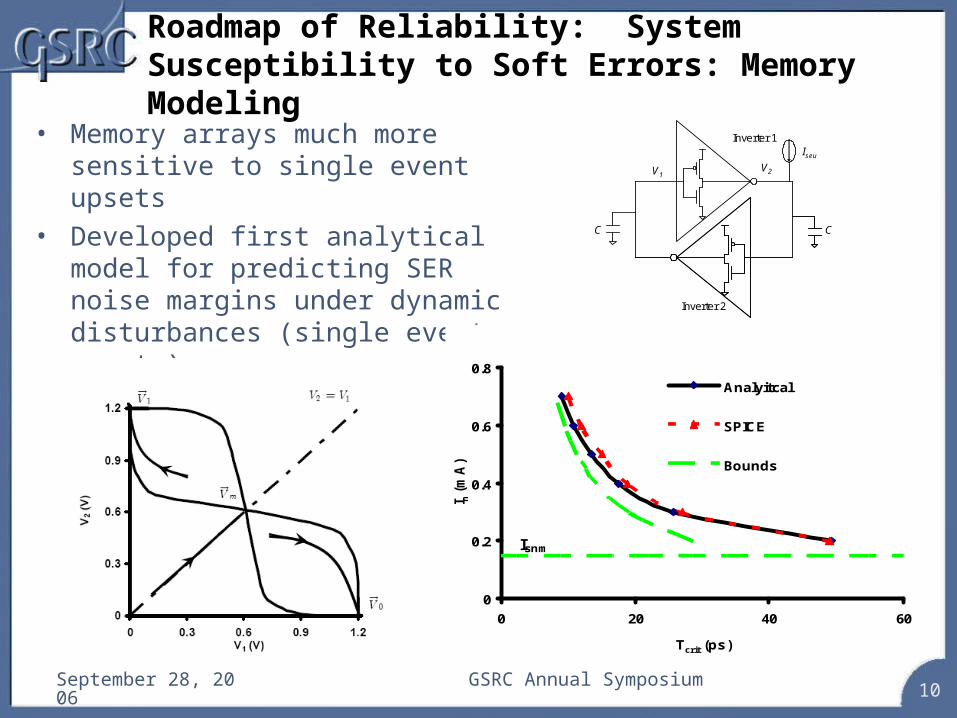
Roadmap of Reliability: System Susceptibility to Soft Errors: Memory Modeling
C C
Inverter 1
Inverter 2
V1V2
Iseu
• Memory arrays much more sensitive to single event upsets
• Developed first analytical model for predicting SER noise margins under dynamic disturbances (single event upsets)
0
0.2
0.4
0.6
0.8
0 20 40 60
Tcrit (ps)
I n (
mA
)
Analyitcal
SPICE
Bounds
Isnm
September 28, 2006 GSRC Annual Symposium11
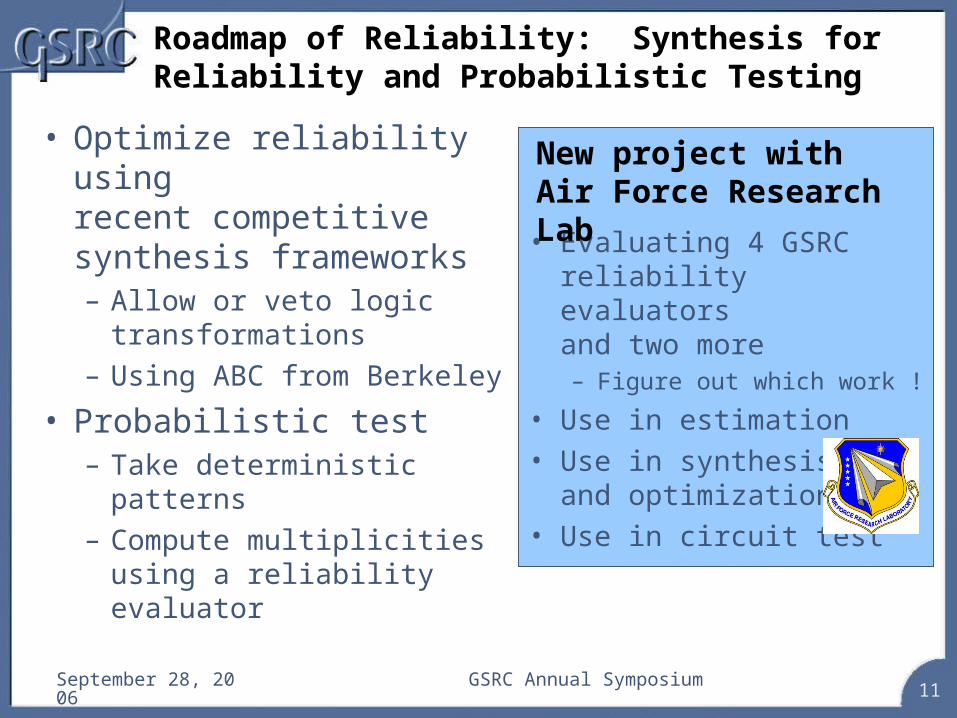
Roadmap of Reliability: Synthesis for Reliability and Probabilistic Testing
• Optimize reliability usingrecent competitive synthesis frameworks– Allow or veto logic
transformations– Using ABC from Berkeley
• Probabilistic test– Take deterministic patterns– Compute multiplicities
using a reliability evaluator
• Evaluating 4 GSRC reliability evaluatorsand two more– Figure out which work !
• Use in estimation• Use in synthesis
and optimization• Use in circuit test
New project withAir Force Research Lab
September 28, 2006 GSRC Annual Symposium12
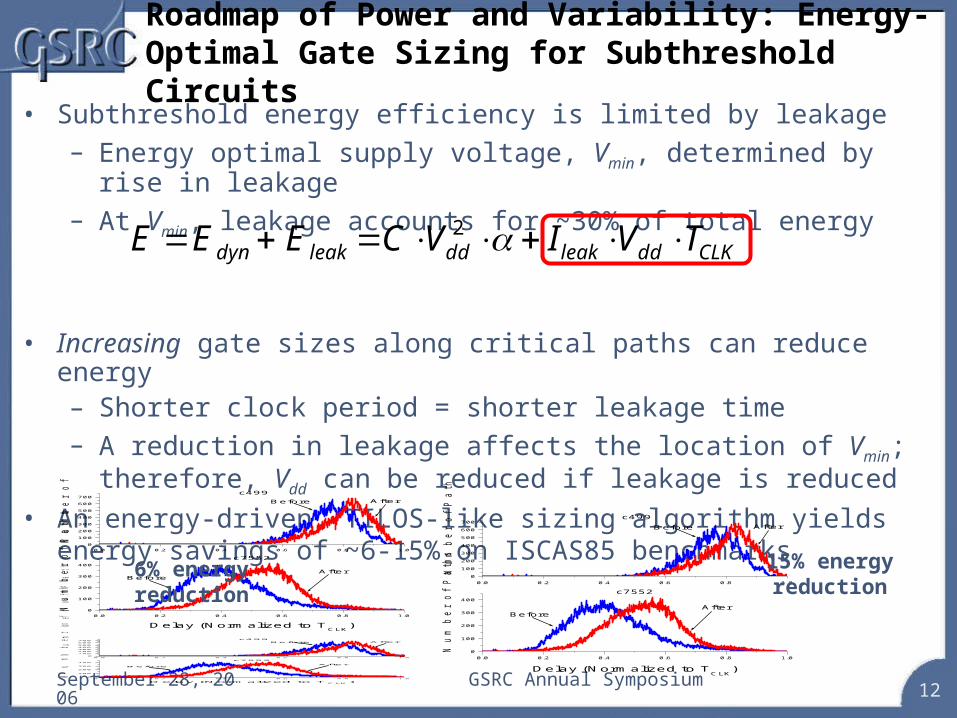
Roadmap of Power and Variability: Energy-Optimal Gate Sizing for Subthreshold Circuits
• Subthreshold energy efficiency is limited by leakage– Energy optimal supply voltage, Vmin, determined by rise in leakage– At Vmin, leakage accounts for ~30% of total energy
• Increasing gate sizes along critical paths can reduce energy– Shorter clock period = shorter leakage time– A reduction in leakage affects the location of Vmin; therefore, Vdd can
be reduced if leakage is reduced
• An energy-driven, TILOS-like sizing algorithm yields energy savings of ~6-15% on ISCAS85 benchmarks
E Edyn E leak CVdd2 Ileak Vdd TCLK
0.0 0.2 0.4 0.6 0.8 1.00
100
200
300
400
BeforeAfter
Nu
mb
er o
f P
ath
s
Delay (Normalized to TCLK
)
0.0 0.2 0.4 0.6 0.8 1.00
100
200
300
400
500
600
700Before After
c499
c7552
Nu
mb
er o
f P
ath
s
0.0 0.2 0.4 0.6 0.8 1.00
100
200
300
400
BeforeAfter
Nu
mb
er o
f P
ath
s
Delay (Normalized to TCLK
)
0.0 0.2 0.4 0.6 0.8 1.00
100
200
300
400
500
600
700Before After
c499
c7552
Nu
mb
er o
f P
ath
s
0.0 0.2 0.4 0.6 0.8 1.00
100
200
300
400
BeforeAfter
Nu
mb
er o
f P
ath
s
Delay (Normalized to TCLK
)
0.0 0.2 0.4 0.6 0.8 1.00
100
200
300
400
500
600
700Before After
c499
c7552
Nu
mb
er o
f P
ath
s
6% energy reduction
15% energy reduction
September 28, 2006 GSRC Annual Symposium13
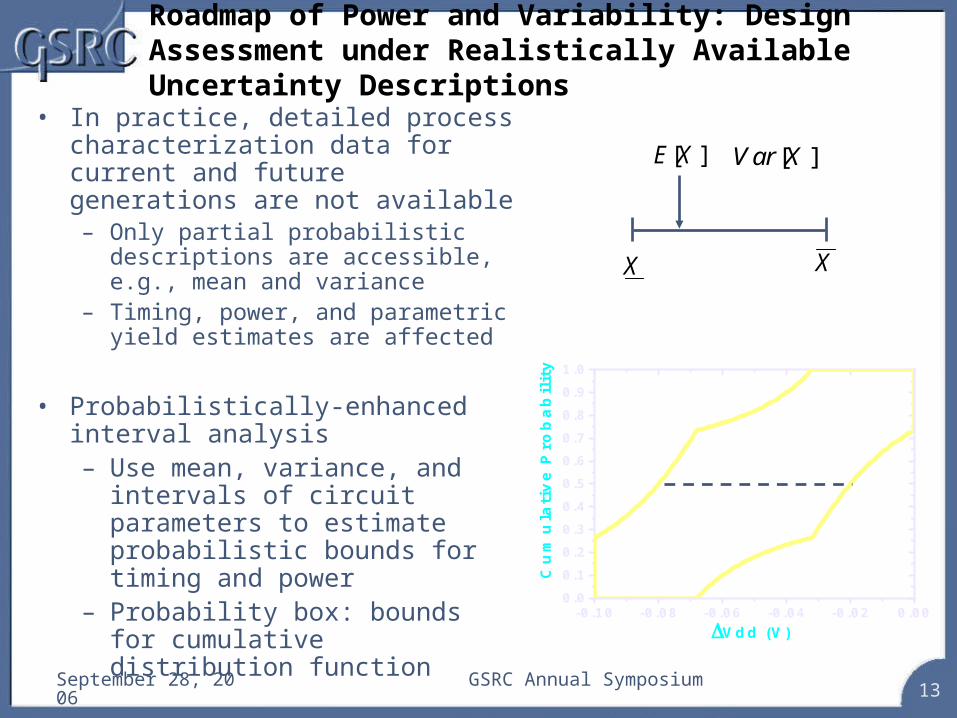
Roadmap of Power and Variability: Design Assessment under Realistically Available Uncertainty Descriptions
• In practice, detailed process characterization data for current and future generations are not available– Only partial probabilistic descriptions
are accessible, e.g., mean and variance
– Timing, power, and parametric yield estimates are affected
• Probabilistically-enhanced interval analysis– Use mean, variance, and intervals
of circuit parameters to estimate probabilistic bounds for timing and power
– Probability box: bounds for cumulative distribution function -0.10 -0.08 -0.06 -0.04 -0.02 0.00
0.0
0.1
0.2
0.3
0.4
0.5
0.6
0.7
0.8
0.9
1.0
Cu
mu
lati
ve
Pro
ba
bil
ity
Vdd (V)
X X
[ ]E X [ ]Var X
September 28, 2006 GSRC Annual Symposium14
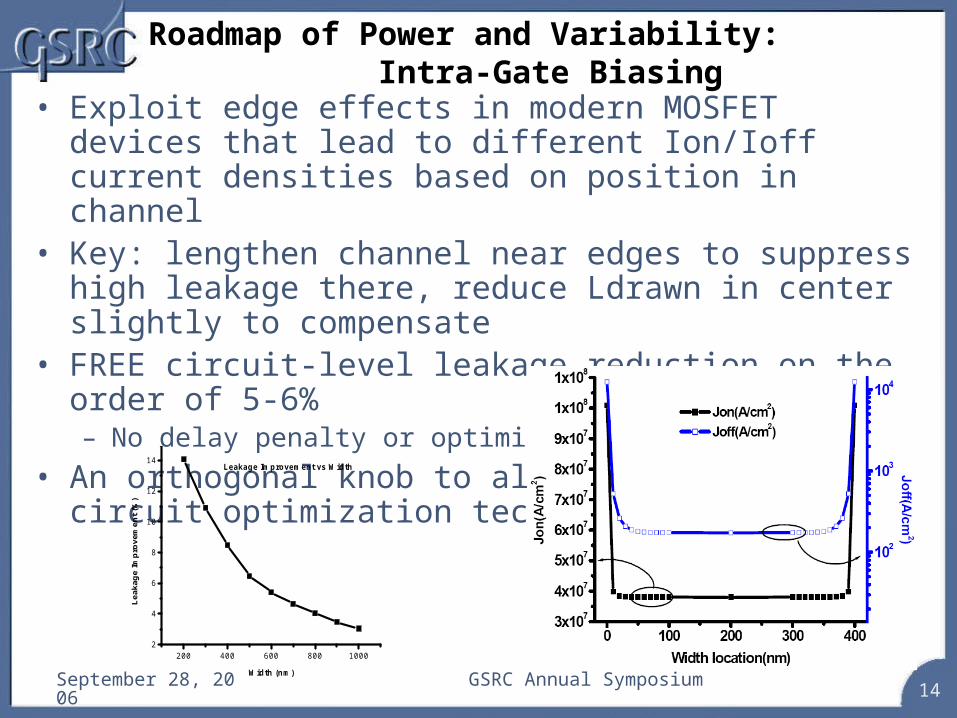
Roadmap of Power and Variability: Intra-Gate Biasing
• Exploit edge effects in modern MOSFET devices that lead to different Ion/Ioff current densities based on position in channel
• Key: lengthen channel near edges to suppress high leakage there, reduce Ldrawn in center slightly to compensate
• FREE circuit-level leakage reduction on the order of 5-6%– No delay penalty or optimization cost
• An orthogonal knob to all other circuit optimization techniques
200 400 600 800 10002
4
6
8
10
12
14
Leak
age
Impr
ovem
ent (
%)
Width (nm)
Leakage Improvement vs Width
September 28, 2006 GSRC Annual Symposium15
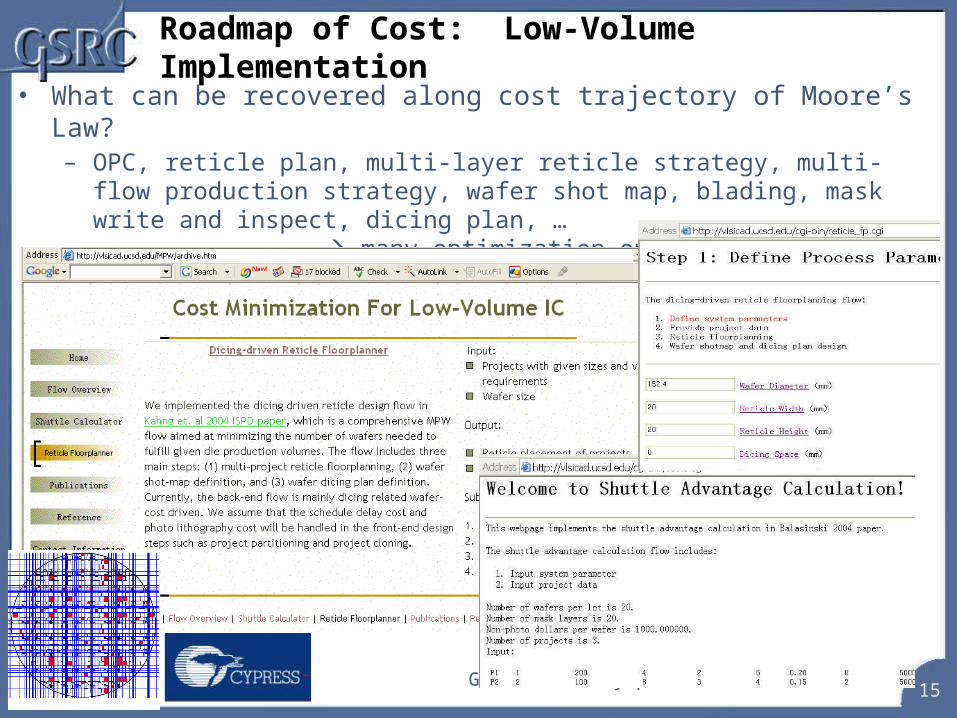
Roadmap of Cost: Low-Volume Implementation
• What can be recovered along cost trajectory of Moore’s Law?– OPC, reticle plan, multi-layer reticle strategy, multi-flow production strategy,
wafer shot map, blading, mask write and inspect, dicing plan, … many optimization opportunities
– Goal: 10X reduction in per-die cost for low volume

September 28, 2006 GSRC Annual Symposium16
MFMLMP Reticles
• A reticle has multi-layers of multi-projects of multi-flows• Different printing frames for different wafers• More design challenges: layer assignment, flow embedding and
frame floorplan
Die 1Lay 3
Die 2Lay 3
Die 1Lay 2
Die 2Lay 2
Die 1Lay 1
Die 2Lay 1
Reticle 1
Reticle 2Wafer 1
Die 1 Die 2 Die 1 Die 2
Wafer 2
Die 1Lay 2
Die 1Lay 1
Die 1Lay 3
Die 2Lay 1
Die 2Lay 3
Die 1Lay 1
Die 1Lay 3
Die 2Lay 2
Die 2Lay 1
Die 2Lay 3
Example of MFMLMP Reticles: Layer 2 of Die 1 and Die 2 cannot share the same reticle
Frame
September 28, 2006 GSRC Annual Symposium17
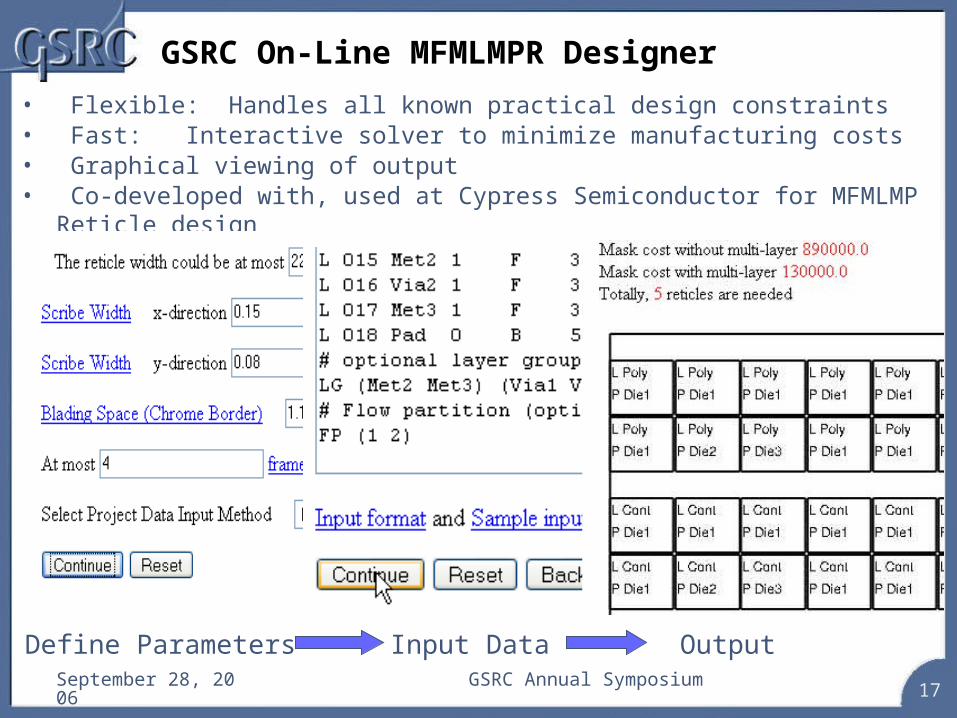
GSRC On-Line MFMLMPR Designer
• Flexible: Handles all known practical design constraints• Fast: Interactive solver to minimize manufacturing costs• Graphical viewing of output• Co-developed with, used at Cypress Semiconductor for MFMLMP Reticle design
Define Parameters Input Data Output
September 28, 2006 GSRC Annual Symposium18
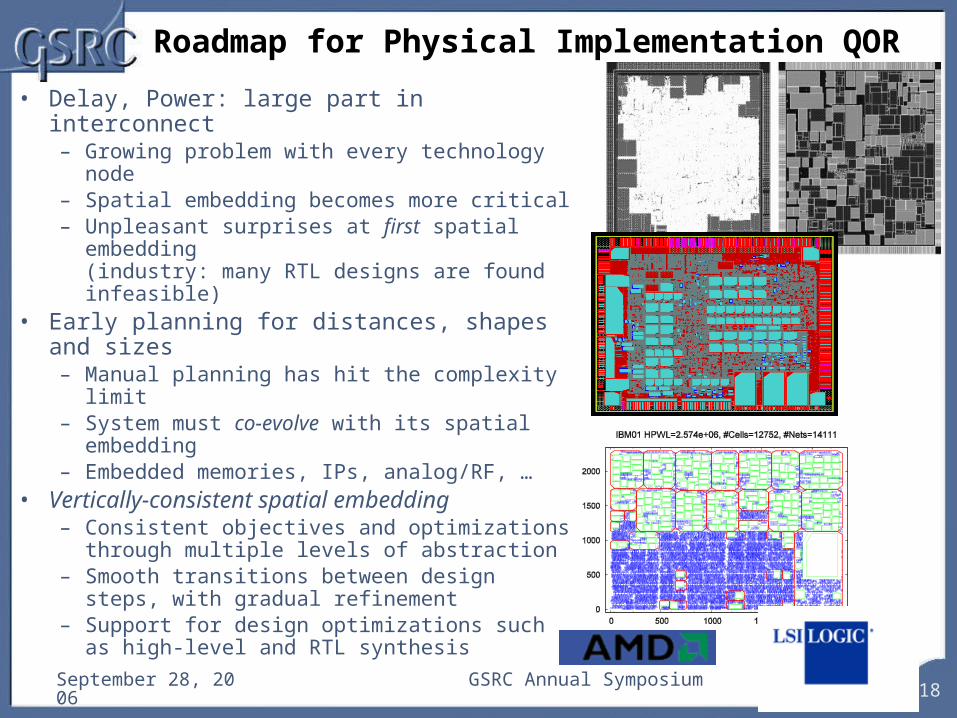
Roadmap for Physical Implementation QOR
• Delay, Power: large part in interconnect– Growing problem with every technology node– Spatial embedding becomes more critical– Unpleasant surprises at first spatial
embedding(industry: many RTL designs are found infeasible)
• Early planning for distances, shapes and sizes– Manual planning has hit the complexity limit– System must co-evolve with its spatial
embedding– Embedded memories, IPs, analog/RF, …
• Vertically-consistent spatial embedding– Consistent objectives and optimizations
through multiple levels of abstraction– Smooth transitions between design steps,
with gradual refinement– Support for design optimizations such as
high-level and RTL synthesis

September 28, 2006 GSRC Annual Symposium19
Vertical Consistency (1)
• SCAMPI: SCalable Advanced Macro Placement Improvements
– Variety of macro sizes & shapes– Look-ahead, macro clustering,
obstacle evasion• Floorist:
Floorplan Assistant(constraint-driven FP repair)
red: overlap
blue: block movement(no overlap)
September 28, 2006 GSRC Annual Symposium20
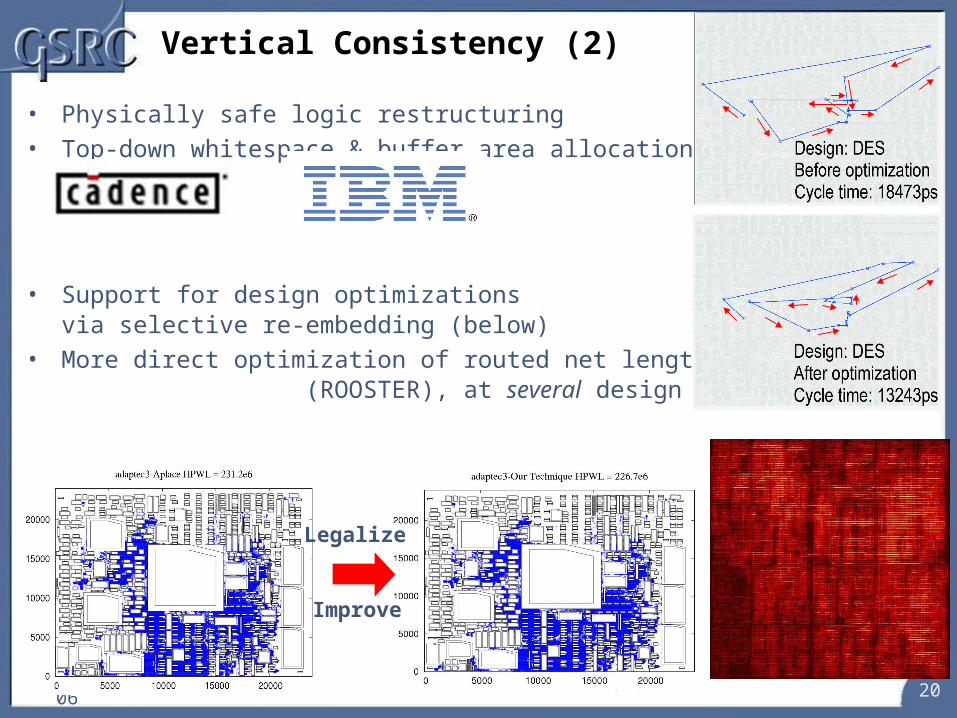
• Physically safe logic restructuring• Top-down whitespace & buffer area allocation
• Support for design optimizationsvia selective re-embedding (below)
• More direct optimization of routed net lengths (ROOSTER), at several design steps
Legalize
Improve
Vertical Consistency (2)
September 28, 2006 GSRC Annual Symposium21
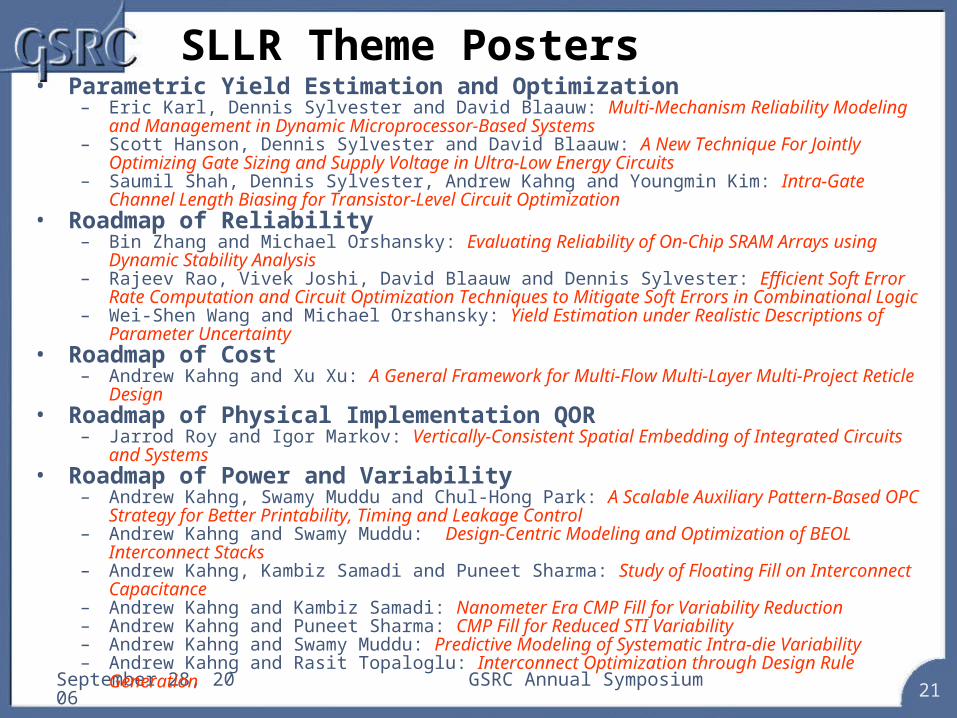
SLLR Theme Posters• Parametric Yield Estimation and Optimization
– Eric Karl, Dennis Sylvester and David Blaauw: Multi-Mechanism Reliability Modeling and Management in Dynamic Microprocessor-Based Systems
– Scott Hanson, Dennis Sylvester and David Blaauw: A New Technique For Jointly Optimizing Gate Sizing and Supply Voltage in Ultra-Low Energy Circuits
– Saumil Shah, Dennis Sylvester, Andrew Kahng and Youngmin Kim: Intra-Gate Channel Length Biasing for Transistor-Level Circuit Optimization
• Roadmap of Reliability– Bin Zhang and Michael Orshansky: Evaluating Reliability of On-Chip SRAM Arrays using Dynamic
Stability Analysis – Rajeev Rao, Vivek Joshi, David Blaauw and Dennis Sylvester: Efficient Soft Error Rate
Computation and Circuit Optimization Techniques to Mitigate Soft Errors in Combinational Logic– Wei-Shen Wang and Michael Orshansky: Yield Estimation under Realistic Descriptions of
Parameter Uncertainty • Roadmap of Cost
– Andrew Kahng and Xu Xu: A General Framework for Multi-Flow Multi-Layer Multi-Project Reticle Design
• Roadmap of Physical Implementation QOR– Jarrod Roy and Igor Markov: Vertically-Consistent Spatial Embedding of Integrated Circuits and
Systems• Roadmap of Power and Variability
– Andrew Kahng, Swamy Muddu and Chul-Hong Park: A Scalable Auxiliary Pattern-Based OPC Strategy for Better Printability, Timing and Leakage Control
– Andrew Kahng and Swamy Muddu: Design-Centric Modeling and Optimization of BEOL Interconnect Stacks
– Andrew Kahng, Kambiz Samadi and Puneet Sharma: Study of Floating Fill on Interconnect Capacitance
– Andrew Kahng and Kambiz Samadi: Nanometer Era CMP Fill for Variability Reduction– Andrew Kahng and Puneet Sharma: CMP Fill for Reduced STI Variability– Andrew Kahng and Swamy Muddu: Predictive Modeling of Systematic Intra-die Variability– Andrew Kahng and Rasit Topaloglu: Interconnect Optimization through Design Rule Generation
September 28, 2006 GSRC Annual Symposium22
Toward System Scaling TheoryTraditional Scaling
• Driven by min feature size
• Determinism: size directly impacts performance and density
• FO4-based performance metric
• Transistors are either logic or memory
• Cost not discussed (e.g., design TAT, leakage current from Tox scaling, …)
Future Scaling• Driven by system constraints
• Non-determinism: size impact mediated by power density, redundancy overhead, low yield, increased comm overhead
• System-level overdesign and effective transistor density
• Performance is achieved by multi-core architectures running at lower frequencies• Adaptivity/reliability many transistors are used to diagnose and tune• Power trades off with design time• Impacts of concurrency, spatial embedding, application domain, …
September 28, 2006 GSRC Annual Symposium23
Future: GSRC Modeling and Metrics SIG
• Enable system design to comprehend impact and feasibility of technology options– Variability, power, cost– Reliability, flexibility, resilience
• Initial focus: uncalibrated, “variational” scaling models– Priority: modeling requests from system-level design and GSRC sponsors– “X% increase in reliability requires Y% increase in power”?– “X% (transient + hard) fault coverage can be achieved with < Y% area overhead”?– How to measure efficiency and yield in the presence of failures?– Approximations + Abstractions “block models” for system optimization
• Future system scaling is dominated by silicon non-idealities– Variability and reliability will fundamentally change density, power, speed, cost scaling laws– Long-term goal: a new system scaling theory


![FINAL RESULTS - Zaterdag 14 April 2018 · [13] GSRC (GBR) DNS-RD Johnstone Orla / Henderson Isla [20] GSRC (GBR) DNS-RD Milne Emily / McCann Darcy Race no. 104 JM18 2X Beker geschonken](https://static.documents.pub/doc/80x56/5eaca919ffaf761f9d1e9a53/final-results-zaterdag-14-april-13-gsrc-gbr-dns-rd-johnstone-orla-henderson.jpg)


