

GUARANTY TRUST BANK PLC
PILLAR III DISCLOSURES
JUNE 2016

2 | P a g e
Guaranty Trust Bank Plc June 2016 Pillar III Disclosures
Contents
1. Executive Summary ................................................................................................................. 6
1.1 Background....................................................................................................................... 6
1.2 Aim of the disclosure report .............................................................................................. 7
1.3 Frequency and means of disclosure ................................................................................. 7
1.4 Scope of Application and Basis of Consolidation .............................................................. 7
1.5 Summary of key metrics as at June 30, 2016 .................................................................. 10
2. Risk Management and Objectives .......................................................................................... 11
2.1 Introduction and overview ............................................................................................... 11
2.2 Risk Management Philosophy and Risk Appetite. ........................................................... 11
2.3 Risk Tolerance ................................................................................................................ 12
2.4 Risk Management Framework ........................................................................................ 12
2.5 Identification and Measurement of Key Risks .................................................................. 18
2.6 Credit Risk Management................................................................................................. 18
2.7 Market Risk Management ............................................................................................... 21
2.7.1 Exposure to market risks – trading portfolios ........................................................... 21
2.7.2 Exposure to interest rate risk – Trading and non-trading portfolios ........................... 22
2.8 Operational Risk Management ........................................................................................ 22
2.8.1 Treatment of Operational Risks ............................................................................... 25
2.9 Liquidity Risk Management ............................................................................................. 25
2.9.1 Funding approach .................................................................................................... 26
2.9.2 Exposure to liquidity risk .......................................................................................... 26
2.10 Information Technology Risk Management ..................................................................... 27
3 Capital Resources and Capital Requirements ........................................................................ 31
3.1 Capital Resources........................................................................................................... 31
3.2 Capital Requirements ..................................................................................................... 32
3.2.1 Minimum capital requirements ................................................................................. 32
3.2.2 Internal Capital Adequacy Assessment Process ICAAP .......................................... 33
4 Credit Risk ............................................................................................................................. 35
4.1 Overview ......................................................................................................................... 35
4.2 Credit risk exposure ........................................................................................................ 35
4.3 Geographical Analysis of Exposures ............................................................................... 37
4.4 Industry Analysis of Exposures ....................................................................................... 38
4.5 Credit exposures by maturity .......................................................................................... 43
4.6 Impairment ...................................................................................................................... 47
4.6.1 Identification and measurement of impairment for accounting purposes .................. 47

3 | P a g e
Guaranty Trust Bank Plc June 2016 Pillar III Disclosures
4.6.2 Impairment and provisioning policies ....................................................................... 50
4.7 Credit Quality .................................................................................................................. 55
4.8 Credit Risk Mitigation ...................................................................................................... 57
5 Operational Risk .................................................................................................................... 63
5.1 Overview ......................................................................................................................... 63
5.2 Operational Risk Capital ................................................................................................. 63
6 Market Risk ............................................................................................................................ 66
7 Equity exposures: disclosures for banking book positions. ..................................................... 73
7.1 Overview ......................................................................................................................... 73
7.2 Description of the valuation Methodology ........................................................................ 73

4 | P a g e
Guaranty Trust Bank Plc June 2016 Pillar III Disclosures
List of Figures and Tables
Figure 1: Summary of key metrics as at June 30, 2016……………………………………….. 10
Figure 2: Risk Management organisational structure……………………………………………… 14
Table 1: Liquidity Ratios……………………………………………………………………………. 27
Table 2: Capital resources………………………………………………………………………. 32
Table 3: Summary of Risk Assessments and Capital Adequacy ratio…………………………… 33
Table4: Total and Average credit risk exposures by counterparty……………………………. 36
Table 5a: Geographical analysis of exposures as at June 30, 2016..…………………………….. 37
Table 5b: Geographical analysis of exposures as at December 31, 2015………………………… 38
Table 6a: Industry Analysis of Exposures (On-balance sheet) as at June 30, 2016………………. 39
Table 6b: Industry Analysis of Exposures (Off-balance sheet) as at June 30, 2016………… 40
Table 6c: Industry Analysis of Exposures (On-balance sheet) as at December 31,2015 ………. 41
Table 6d: Industry Analysis of Exposures (Off-balance sheet) as at December 31,2015 ………… 42
Table 7a: Residual Maturity of Credit Exposures (On-balance sheet) as at June 30, 2016………. 43
Table 7b: Residual Maturity of Credit Exposures (Off-balance sheet) as at June 30, 2016……….44
Table 7c: Residual Maturity of Credit Exposures (On-balance sheet) as at December 31,2015…. 45
Table 7d: Residual Maturity of Credit Exposures (Off-balance sheet) as at December 31,2015….46
Table 8: Non-Performing Loans by Industry as at June 30, 2016 and December 31, 2015……. 50
Table 9a: Loans and Advances and impairment (specific and collective)…………………………... 52
Table 9b: Loans and Advances and impairment (specific and collective) by products…………... 53
Table 10: Movement in impairment on Loans and Advances to Banks, Individuals and non-
Individuals………………………… 54
Table 11: Credit Quality Assessment Scale and Risk Weights as specified by CBN…… ….…... 55
Table 12a: Analysis of Exposures with or without CRM and risk weight applied
(On-Balance Sheet)………………………….. 56
Table 12b: Analysis of Exposures with or without CRM and risk weight applied
(Off-Balance Sheet)…………………………….. 57
Table 13: Eligible financial collaterals and standard supervisory haircuts…………….……. 59
Table 14a: Credit risk concentrations and mitigation Instruments as at June 30, 2016……… 60
Table 14b: Credit risk concentrations and mitigation Instruments as at December 31, 2016… 60
Table 15a: Exposure values covered by eligible financial collaterals and guarantees
as at June 30, 2016…….................................................................................... 61
Table 15b: Exposure values covered by eligible financial collaterals and guarantees
as at December 31, 2015…….......................................................................... 62

5 | P a g e
Guaranty Trust Bank Plc June 2016 Pillar III Disclosures
Table 16 Operational Risk Appetite…………………………………………………………. 63
Table 17 Basel Business lines and Beta factor………………………………………………… 64
Table 18: Market Risk Components…………………………………………………………….…. 66
Table 19a: Interest Rate Sensitivity (Fair value and Cash flow Interest rate) on Statement of
Financial Position for June 30, 2016…………………………………………………… 68
Table 19b: Interest Rate Sensitivity (Fair value and Cash flow Interest rate) on Statement of
Financial Position for December 31, 2015…………………………………………… 69
Table 20a: Financial Instrument by Currency for June 30 2016………………………………… 70
Table 20b: Financial Instrument by Currency for December 31 2015………………………… 71
Table 21: Unquoted Equities: Value disclosed in the balance sheet and fair value ………… 75
Table 22: Unrealized Gains/ (Losses) Recognized in Other comprehensive income………… 75
6 | P a g e
Guaranty Trust Bank Plc June 2016 Pillar III Disclosures
1. Executive Summary
1.1 Background The Basel Committee on Banking and Supervision published a set of capital standards and banking
regulations in June 2004 that became known as Basel II. These standards were subsequently
updated with implementation beginning in 2007. The Basel II framework stipulates a minimum level
of capital that banks must maintain to ensure that they can meet their obligations, cover unexpected
losses; and can, very importantly, promote public confidence.
The Central Bank of Nigeria (CBN) in 2013 issued a framework on Regulatory Capital Measurement
and Management for the Nigerian Banking System for the implementation of Basel II/III in Nigeria.
The Basel II standard is based on three “pillars”: Minimum Capital Requirements; Supervisory
Review and Market Discipline.
The Pillar 1 Minimum Capital Requirements details various approaches to measure and quantify
capital required for the three major risk components that a bank faces: credit risk, market risk and
operational risk. The general requirement for internationally active banks is that banks hold a total
capital equal to 8% of their risk-weighted assets (RWA). In Nigeria, banks with international banking
licence are required to hold a minimum of 15% of their total RWAs as capital while banks with
regional and national banking licence require 10%.
The second Pillar, Supervisory Review is concerned with the quantitative and qualitative measures
of the ways risks are managed within a bank. Supervisors/regulators are to ensure that Banks have
processes in place for maintaining their capital as well as encourage banks to adopt better risk
management techniques and develop a continuous process for evaluating these techniques.
Furthermore, banks are also required to assess Pillar 2 risks, that is, other risks not covered in Pillar
1 and discuss any deficiencies arising with Supervisors. Banks are also required to hold additional
internal capital buffer above the regulatory minimum to allow for fluctuations in capital requirements.
Market discipline is the third Pillar and it requires Banks to disclose information on the risks they
take, how they allocate capital and their risk quantification and management approaches. The
objective of Market Discipline disclosures is to promote transparency by ensuring that current and
potential investors have information on the risk management decisions made by banks, thus
pressurising banks to make the right decisions.
Effective October 1 2014, banks in Nigeria were required to commence monthly Capital Adequacy
reporting, carry out an Internal Capital Adequacy Assessment Process (ICAAP) on an annual basis
and comply with the Basel II Pillar 3 disclosure requirements on a bi-annual basis.

7 | P a g e
Guaranty Trust Bank Plc June 2016 Pillar III Disclosures
However, in the 2015 financial year, CBN revised the Capital Adequacy Ratio (CAR) reporting
template and existing guidance notes on Regulatory capital, Credit risk, Market risk, Operational risk
and Pillar 3 disclosure requirement for Basel II implementation in the Industry.
By revising the guideline, CBN tends towards strict compliance with the recommended approach for
credit, market and operational risks measurements thereby introducing more stringent measures for
calculating Risk weighted assets for the Pillar 1 risks ensuring that banks are adequately capitalised
and poised to withstand any threat to their solvency.
1.2 Aim of the disclosure report This report shall provide an overview of the risk profile and risk management practices of Guaranty
Trust Bank Plc hereafter referred to as the “the Bank” or “GTBank”. This disclosure fulfils the
requirements set out in the Guidance Notes on Pillar III Disclosures as set forth by the Central Bank
of Nigeria. In accordance with section 2.4 of the Guidance Notes on materiality, proprietary and
confidential information, and the representations in this report are based on materiality as defined in
the CBN Guidance Notes on Pillar III disclosures
1.3 Frequency and means of disclosure The disclosure frequency is as assessed under section 2.5 of the Pillar III Guidance Notes which
requires Domestic Systemically Important Banks (DSIBs) to publish pillar III disclosures on a bi-
annual basis and is made available in accordance with the same section through the Bank’s website
at;
http://www.gtbank.com/investor-relations
1.4 Scope of Application and Basis of Consolidation Guaranty Trust Bank plc is a financial institution incorporated in Nigeria and is licensed and regulated
by the Central Bank of Nigeria with the purpose of receiving deposits, extending credit and provision
of basic investment services via its various products and services to various markets tailoring its
products and services to suit the needs of the various market segments;
1. Corporate Banking (Institutional Banking)
This segment covers corporations with turnover in excess of ₦5bn. The products offered
include current accounts, deposits, overdrafts, loans and other credit facilities, foreign
currency and derivative products offered to large corporate customers. The Bank’s
portfolio in this segment is dominated by the following sectors: manufacturing,
telecommunications, construction and energy (upstream, downstream and midstream).

8 | P a g e
Guaranty Trust Bank Plc June 2016 Pillar III Disclosures
2. Commercial Banking
This segment covers companies with a turnover between ₦500mn to ₦5bn. The products
offered to this segment include current accounts, deposits, overdraft, loans and other
credit facilities and foreign currency services. After the Corporate Banking segment,
commercial banking represents the second largest segment in terms of Loans &
Advances.
3. Retail and SME Banking
This segment covers individuals, High Net worth Individuals (HNI) and Micro, Small &
Medium scale Enterprises. The products offered to this segment include: individuals and
medium-size enterprises current accounts, savings deposits, credit and debit cards,
consumer and SME loans and mortgages.
4. Public sector
This covers banking services to Local governments, State Governments, Ministries,
Departments and Agencies and product offerings include: current accounts, deposits,
overdrafts, loans and other credit facilities to etc.
5. Correspondent Banking
This includes trade finance facilities, predominantly the confirmation, negotiation and
advising of letters of credit, the provision of foreign exchange and funds transfer
services to Nigeria, West African banks and off-shore banks.
The Bank is one of the biggest (by total asset size) and most profitable banks in Nigeria with various
subsidiaries in sub-Saharan Africa (Cote-d’Ívoire, Gambia, Ghana, Kenya, Liberia, Rwanda, Sierra-
Leone and Uganda) and the United Kingdom also licensed and regulated by their different host
country regulators to carrying out the business of banking. The Bank’s subsidiary - GTB Finance
B.V. Netherlands is a special purpose entity used to raise funds from the international financial
market. A brief description of each subsidiary is provided below;
Subsidiaries information
Guaranty Trust Bank (Gambia) Limited is a commercial bank established in The Gambia in 2002.
As of June 30, 2016, the Bank held 77.81% of GTB Gambia, and the remaining shares held by
Gambian nationals. As of June 30, 2016, GTB Gambia had seventeen (17) branches. The banking
operations in the country comprise of a wide range of financial services and products for individuals,
corporations, international institutions and public sector organisations.

9 | P a g e
Guaranty Trust Bank Plc June 2016 Pillar III Disclosures
Guaranty Trust Bank (Sierra Leone) Limited is a commercial bank established in Sierra Leone in
2001 as the First Merchant Bank of Sierra Leone. In 2002, following the Bank’s acquisition of a
majority interest in the bank, it changed its name to Guaranty Trust Bank (Sierra Leone) Limited. As
of June 30, 2016, the Bank held 84.24% of GTB Sierra Leone, and the remaining shares held by
Sierra Leoneans. As of June 30, 2016, GTB Sierra Leone had fourteen (14) branches and provides
a wide range of financial services and products for corporate and retail customers.
Guaranty Trust Bank (Ghana) Limited is a commercial bank established in Ghana in 2004 and
commenced operations in 2006. As of June 2016, the Bank owned 97.94% of GTB Ghana, and the
other shares held by FMO and a Ghanaian national. As of June 30, 2016, GTB Ghana operated
thirty four (34) branches in Ghana. The Group’s banking operations in Ghana consist of general
financial services to corporate and retail customers.
Guaranty Trust Bank (Liberia) Limited is a commercial bank established in Liberia in 2007. It
commenced operations in March 2009. As of June 30, 2016, the Bank owned 99.43% of GTB Liberia
and the remaining shares owned by Liberian individuals. GTB Liberia had eight (8) branches as of
June 30, 2016. The services provided in Liberia consist of general financial services to corporate,
public sector and retail services.
Guaranty Trust Bank (Cote D’Ivoire) S.A. is the Group’s first subsidiary in francophone West
Africa. The bank was licensed by the Central Bank of West African States (BCEAO) to offer banking
services to the Ivorian public and operations commenced in April 2012. As of June 30, 2016, the
Bank owned 100% of GTB Cote d’Ivoire. The subsidiary has four (4) branches and its operations
consist of general financial services to corporate, retail and public sector customers.
Guaranty Trust Bank (Kenya) Limited was established in 2013 as a result of the acquisition of
Fina Bank Limited (a commercial bank incorporated in Kenya which operates two subsidiaries in
Rwanda and Uganda), which was subsequently rebranded. As of June 30, 2016, the Bank owned
70% of GTB Kenya. GTB Kenya had fifteen (15) branches as of June 30, 2016. The services
provided in Kenya consist of general financial services to corporate, public sector and retail services.
Guaranty Trust Bank (Rwanda) Limited is a subsidiary of GTBank Kenya. The company equity is
96% held by GTBank Kenya and the balance by the Government of Rwanda. The Subsidiary
represents an indirect subsidiary of GTBank Plc with 67% ownership. GTB Rwanda had fourteen
(14) branches as of June 30, 2016, providing general financial services to corporate, public sector
and retail services.
Guaranty Trust Bank (Uganda) Limited is a wholly owned subsidiary of GTBank Kenya. The
Subsidiary represents an indirect subsidiary of GTBank Plc with 70% ownership. GTB Uganda had

10 | P a g e
Guaranty Trust Bank Plc June 2016 Pillar III Disclosures
nine (9) branches as of June 30, 2016, providing general financial services to corporate, public sector
and retail services.
Guaranty Trust Bank (UK) Limited was established in 2006 to extend the Group’s business into
the United Kingdom, with its Head Office in London to service the Group’s West African clientele
(and their businesses) that frequently travel between West Africa and London. As of June 30, 2016,
the Bank owned 100% of GTB UK. GTB UK commenced operations as a commercial bank in 2008
providing trade finance, correspondent banking, corporate banking and personal banking services,
with principal focus on the provision of mortgage products and trade finance to West African
counterparties who have business connections in the UK.
Basis of consolidation and disclosures
GTBank plc produces consolidated and separate financial statements for accounting purposes under
International Financial Reporting Standards (IFRS) but produce individual regulatory returns for
submission to the CBN relating to capital adequacy and balance sheet information. The disclosures
in this document are therefore reported at the individual, parent entity level and not at a consolidated
level as a result, investments in the subsidiaries discussed above are deducted from regulatory
capital for capital adequacy purposes. In line with the frequency of disclosure, these disclosures are
updated semi-annually after the conclusion of the half and full-year audits of the Bank and will be
assessed for more frequent disclosures should market and business conditions so warrant. Unless
otherwise stated, all tables are as at June 30, 2016, with prior year comparatives as at December
31, 2015.
1.5 Summary of key metrics as at June 30, 2016 Figure 1 below illustrates GTBank’s key capital metrics. The Bank’s capital resources is composed
mainly of tier 1 capital and the Bank continues to maintain its capital ratio above the regulatory
minimum of 15% for banks with international banking license.
Total
capital
resources
Regulatory
capital
Net Tier 1
capital
Minimum
regulatory
capital
Excess
Capital
Risk
Weighted
Assets
CAR
N431.0bn N356.3bn N358.0bn N268.5bn N87.8bn N1.95trn 18.25%

11 | P a g e
Guaranty Trust Bank Plc June 2016 Pillar III Disclosures
2. Risk Management and Objectives
2.1 Introduction and overview Guaranty Trust Bank has a strong risk culture and employs an enterprise wide risk management
approach, in line with best practice, to align strategy, policies, people, processes, technology and
business intelligence in order to evaluate, manage and optimize the opportunities and threats it may
face in its efforts to maximize sustainable stakeholders’ value within the defined risk appetite.
To continually sustain this strong risk culture, the bank adopted the COSO definition of Enterprise
Risk Management which depicts ERM as a process driven by an entity’s board of directors,
management and other personnel, applied in strategy setting and across the enterprise, to identify
potential events that may affect the entity, and manage risk to be within its risk appetite, to provide
reasonable assurance regarding the achievement of the entity’s objectives. This involves the
application of risk management principles and processes in every business activity to determine
potential threats, and adopt appropriate control measures, to contain risks with the aim of achieving
its objectives.
The Bank has identified its major risk areas as Credit, Market, Operational, Liquidity and Information
Technology Risks. Risk identification in these areas is carried out by the relevant risk owners, in
collaboration with the ERM Division.
.
2.2 Risk Management Philosophy and Risk Appetite. GTBank’s Risk Management Philosophy describes its attitude to risk taking. It is the driving force
behind its officers’ behaviour in the conduct of business activities and operations from a risk
perspective. This is summarized in the statement:
“To enhance shareholders’ value by creating and maintaining a culture of intelligent risk-
taking”.
This philosophy is further cascaded into working statements via the following risk principles:
The Bank’s decisions will be based on careful analysis of its operating environment as well
as the implications of risks to the achievement of its strategic goals.
The Bank will not take any action that will compromise its integrity
Risk control will not constitute an impediment to the achievement of strategic objectives.

12 | P a g e
Guaranty Trust Bank Plc June 2016 Pillar III Disclosures
The Bank will always comply with all government regulations and embrace global best
practice.
Risk management will form an integral part of the Bank’s strategy setting process
The Bank will only assume risks that fall within its risk appetite with commensurate returns.
The Bank shall adhere to the risk management cycle of identifying, measuring, controlling
and reporting risks.
The Bank shall continually review its activities to determine the level of risks inherent in them
and adopt appropriate risk responses at all time.
The Bank recognises that there are risk elements associated with the pursuit of growth opportunities
to achieve its strategic objectives. While its risk philosophy articulates how inherent risks are
considered when making decisions, the Board and management of the bank determine the risks that
are acceptable based on its capabilities in terms of capital, technology and people.
2.3 Risk Tolerance To cascade the risk appetite statement across all business levels, the management of the Bank
defines the risk tolerances applicable to risk factor. The tolerances are measured via a three leg limit
system which measures an extreme upper region suggesting high risk or unacceptable risk level, a
middle range region known as trigger point and a lower region suggesting a low risk or acceptable
risk level. This establishes the acceptable level of variation relative to the bank’s desired objective.
In setting the risk tolerances, the bank adopts the interview session approach wherein Management
of the bank are questioned to ascertain their position on the degree of risk the bank is willing to take.
The set risk acceptance levels are subject to the approval of the Board of Directors and can be
changed at the discretion of the Board and Management, when there are compelling regulatory and
operating factors.
The risk tolerance limit is monitored periodically using a dashboard which establishes the status of
each risk factor at any given point in time. The results of the dashboard is made available to the
Management and board of directors to enable them take appropriate decisions regarding the
acceptability of the risk tolerance level.
2.4 Risk Management Framework The Bank’s Risk Management Framework is built on a well-defined organisational structure and
established policies to guide in the function of identifying, analysing, managing and monitoring the
various risks inherent in the business as well as setting appropriate risk limits and controls to align

13 | P a g e
Guaranty Trust Bank Plc June 2016 Pillar III Disclosures
the risks with the strategic objectives. The risk management policies are subject to review at least
once a year. However more frequent reviews may be conducted at the instance of the Board, when
changes in laws, regulations, market conditions or the Bank’s activities are material enough to impact
on the continued adoption of the existing policies. The Bank, through its trainings and management
standards and procedures, aims to develop a disciplined, engaging and controlled environment, in
which all employees understand their roles and obligations.
The Board of Directors has overall responsibility for the establishment of the Bank’s Risk
Management framework and exercises its oversight function over all the Bank’s prevalent risks via
its various committees; Board Risk Committee, Board Credit Committee, and Board Audit
Committee. These committees are responsible for developing and monitoring risk policies in their
specific areas and report regularly to the Board of Directors. All Board committees have both
executive and non-executive members.
The Board Committees are assisted by the various Management Committees in identifying and
assessing risks arising from day to day activities of the Bank. These committees include:
The Management Credit Committee
Criticized Assets Committee
Asset and Liability Management Committee (ALMAC)
Management Risk Committee
IT Steering Committee
Other Ad-hoc Committees
These committees meet on a regular basis while others are set up on an ad-hoc basis as dictated
by circumstances.
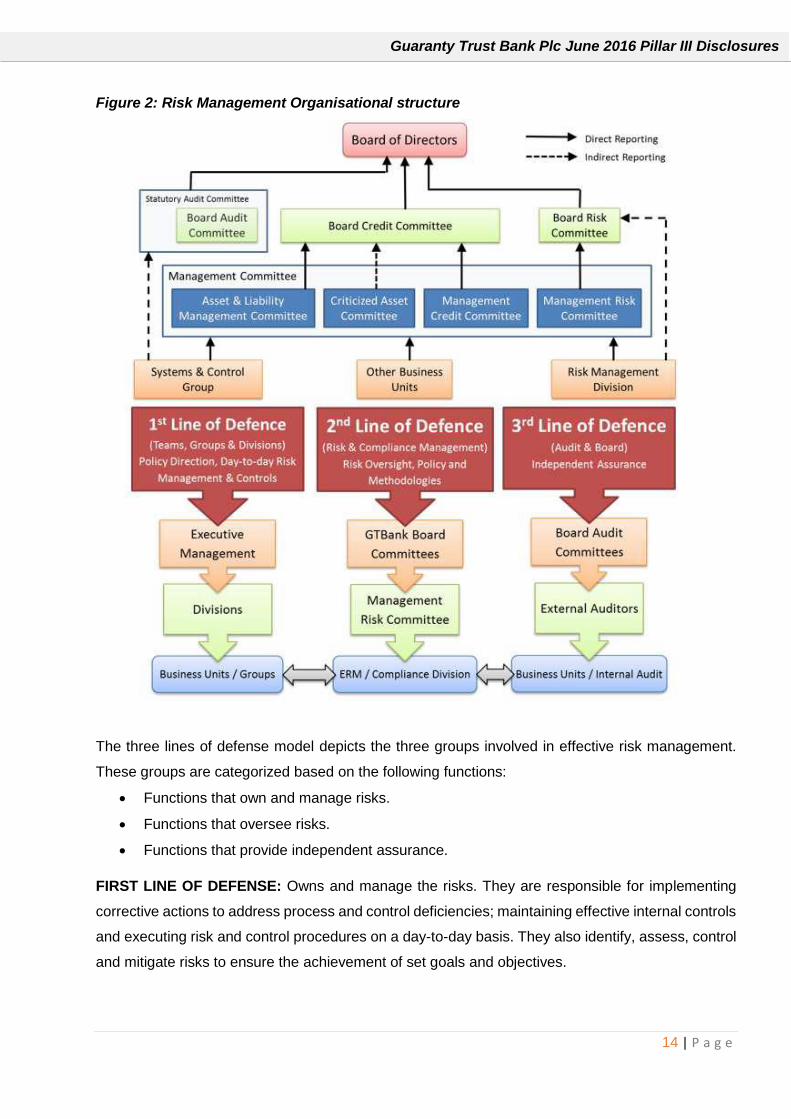
The figure below shows “three lines of defense governance model” that the Bank employs in its risk
management framework to implement and control decisions on strategy, risk and capital that are
taken by the Board:
14 | P a g e
Guaranty Trust Bank Plc June 2016 Pillar III Disclosures
Figure 2: Risk Management Organisational structure
The three lines of defense model depicts the three groups involved in effective risk management.
These groups are categorized based on the following functions:
Functions that own and manage risks.
Functions that oversee risks.
Functions that provide independent assurance.
FIRST LINE OF DEFENSE: Owns and manage the risks. They are responsible for implementing
corrective actions to address process and control deficiencies; maintaining effective internal controls
and executing risk and control procedures on a day-to-day basis. They also identify, assess, control
and mitigate risks to ensure the achievement of set goals and objectives.

15 | P a g e
Guaranty Trust Bank Plc June 2016 Pillar III Disclosures
SECOND LINE OF DEFENSE: Established to perform a policy-setting and monitoring role. It is a
risk management function (and/or committee) that facilitates and monitors the implementation of
effective risk management practices and a compliance function that monitors various specific risks
such as non-compliance with applicable laws and regulations. Other functions include identifying
known and emerging issues, providing risk management framework, assisting management in
developing processes and controls to manage risks, monitoring the adequacy and effectiveness of
internal control, accuracy and completeness of reporting and timely remediation of deficiencies.
THIRD LINE OF DEFENSE: Provides objective assurance on the effectiveness of governance, risk
management and internal controls. The scope of the assurance, which is reported to senior
management and Board covers a broad range of objectives, including efficiency and effectiveness
of operations, safeguarding of assets, reliability and integrity of reporting processes, and compliance
with laws, regulations, policies, procedures and contracts. It also includes all elements of the risk
management and internal control framework.
The Board Risk Committee is responsible for reviewing and recommending risk management
policies, procedures and profiles including risk philosophy, risk appetite and risk tolerance of the
Bank. The oversight functions cut across all risk areas including credit risk, market and interest rate
risk, liquidity risk, operational risk, reputation risk, technology risk and other major risks that may
arise from time to time. The committee monitors the Bank’s plans and progress towards meeting
regulatory Risk-Based Supervision requirements including Basel II compliance as well as the overall
Regulatory and Economic Capital Adequacy. It also reviews and approves the contingency plan for
specific risks and ensures that all members of the Bank are fully aware of the risks involved in their
functions.
The Bank’s Board Audit Committee is responsible for monitoring compliance with the risk
management policies and procedures, and for reviewing the adequacy of the risk management
framework in relation to risks faced by the Bank. The Audit Committee is assisted by the Internal
Audit Bank, in carrying out these functions. Internal Audit undertakes both regular and ad-hoc
reviews of risk management controls and procedures, the results of which are reported to the Audit
Committee.
The Bank’s Board of Directors has delegated responsibility for the management of credit risk to the
Board Credit Committee. The Board Credit Committee considers and approves all lending
exposures, including treasury investment exposures, as well as insider-related credits in excess of
limits assigned to the Management Credit Committee by the Board. The committee also ensures

16 | P a g e
Guaranty Trust Bank Plc June 2016 Pillar III Disclosures
that the Bank’s internal control procedures in the area of risk assets remain fool proof to safeguard
the quality of the Bank’s risk assets.
Board Information Technology Strategy Committee
The Board Information Technology Strategy Committee is responsible for the provision of strategic
guidance to Management on Information Technology issues and monitoring the effectiveness and
efficiency of Information Technology within the Bank and the adequacy of controls.
The Terms of Reference of the Board Information Technology Strategy Committee include:
To provide advice on the strategic direction of Information Technology issues in the Bank;
To inform and advise the Board on important Information Technology issues in the Bank;
To monitor overall Information Technology performance and practices in the Bank. Management Risk Committee examines risk in its entirety by reviewing and analysing
environmental issues and policies impacting the Bank, either directly or remotely, and make
recommendations to the Board Risk Committee.
Management Credit Committee formulates credit policies in consultation with business units,
covering credit assessment, risk grading and reporting, collateral, regulatory and statutory
requirements. The committee also assesses and approves all credit exposures in excess of the
Managing Director’s limit set by the Board.
Information Technology (IT) Steering Committee
The Committee is responsible for assisting Management with the implementation of IT strategy
approved by the Board. The roles and responsibilities of the Committee include:
1. Planning, Budgeting and Monitoring
Review and approve the Bank’s IT plan and budget (short and long term).
Review IT performance against plans and budgets, and recommend changes, as required.
Review, prioritize and approve IT investment initiatives.
Establish a balance in overall IT investment portfolio in terms of risk, return and strategy.
2. Ensuring Operational Excellence
Provide recommendations to Management on strategies for new technology and systems.
Review and approve changes to IT structure, key accountabilities, and practices.
Ensure project priorities and success measures are clearly defined, and effectively
monitored.

17 | P a g e
Guaranty Trust Bank Plc June 2016 Pillar III Disclosures
Conduct a review of exceptions and projects on selected basis.
Perform service catalogue reviews for continued strategic relevance.
Review and approve current and future technology architecture for the Bank.
Monitor service levels, improvements and IT service delivery.
Assess and improve the Bank’s overall IT competitiveness.
3. IT Risk Assurance
Review and approve governance, risk and control framework.
Monitor compliance with defined standards and agreed performance metrics.
Ensure that vulnerability assessments of new technology are performed.
Reviewing and ensuring the effectiveness of the IT Risk Management and Security plan.
Ensure the effectiveness of disaster recovery plans and review reports on periodic disaster
recovery testing.
Review key IT risk and security issues relevant to the Bank’s IT processes / systems.
Ensure that the Bank complies with relevant laws and regulations.
Information Technology (IT) Risk Management Committee
The Information Technology Risk Management Committee is responsible for establishing
standardised IT risk management practices and ensuring compliance, for institutionalising IT risk
management in the Bank’s operations at all levels; and identifying and implementing cost effective
solutions for IT risk mitigation. The Committee is also responsible for the continuous development
of IT risk management expertise and ensuring that a proactive risk management approach is
adopted throughout the Bank to drive competitive advantage.
The Asset & Liability Management Committee establishes the Bank’s standards and policies
covering the various components of Market Risk Management. These include Interest Rate Risk,
Liquidity Risk, Investment Risk and Trading Risk. It ensures that the authority delegated by the Board
and Management Risk Committees with regard to Market Risk is exercised, and that Market Risk
exposures are monitored and managed. Furthermore, the Committee limits and monitors the
potential impact of specific pre-defined market movements on the comprehensive income of the
Bank through stress tests and simulations.
Criticised Assets Committee is responsible for the assessment of the bank’s credit risk asset
portfolio. It highlights the status of the risk assets in line with the internal and external regulatory
framework and ensures that triggers are sent in respect of delinquent credit risk assets. It also
ensures adequate provisions are taken in line with the regulatory guidelines.

18 | P a g e
Guaranty Trust Bank Plc June 2016 Pillar III Disclosures
The Credit Risk Management Group is responsible for identifying, controlling, monitoring and
reporting credit risk related issues. The Group also serves as the secretariat for the Management
Credit Committee. Credit risk is the most critical risk for the Bank as credit exposures, arising from
lending activities account for the major portion of the Bank’s assets and source of its revenue. Thus,
the Bank ensures that credit risk related exposures are properly monitored, managed and controlled.
The Credit Risk Management Group is responsible for managing the credit exposures, which arise
as a result of the lending and investment activities as well other unfunded credit exposures that have
default probabilities; such as contingent liabilities.
The Enterprise-wide Risk Management (ERM) Division is responsible for optimising the risks and
returns opportunities inherent in the business. The risk management infrastructure encompasses a
comprehensive and integrated approach to identifying, managing, monitoring and reporting risks
with focus on the following:
(i) The 5 main inherent risk groups – Credit, Market, Operational, Liquidity and Technology.
(ii) Additional risk areas such as Reputation and Strategy risks
In compliance with the Central Bank of Nigeria’s ‘Risk-based Supervision’ guidelines, best global
practices, and to align with Basel II Capital requirements, the Bank incorporated a strategic
framework for efficient measurement and management of the Bank’s risks and capital. The Bank
has implemented Basel II recommended capital measurement approaches for the estimate of the
bank’s economic capital required to cope with unexpected losses using Oracle Financial Services
Analytical Applications. The Bank has also put in place other qualitative and quantitative measures
that will assist with enhancing risk management processes and creating a platform for more risk-
adjusted decision-making.
2.5 Identification and Measurement of Key Risks
GTBank conducts the Internal Capital Adequacy Assessment Process (ICAAP) on an annual basis
and forms part of management and decision-making processes such as the Bank’s risk appetite,
strategy, capital and risk management frameworks, and stress testing. The ICAAP is used to assess
the key risks to which the Bank is exposed; how these risks are measured, managed, monitored and
mitigated; and how much capital the firm should hold to reflect these risks now, in the future and
under stressed conditions. Further information is provided on the ICAAP document on page 26.
2.6 Credit Risk Management Lending and other financial activities form the core business of the Bank. The Bank recognises this
and has laid great emphasis on effective management of its exposure to credit risk. The Bank defines
credit risk as the risk of counterparty’s failure to meet the terms of any lending contracts with the

19 | P a g e
Guaranty Trust Bank Plc June 2016 Pillar III Disclosures
Bank or otherwise to perform as agreed. Credit risk arises anytime the Bank’s funds are extended,
committed, invested or otherwise exposed through actual or implied contractual agreements.
The Bank’s specific credit risk objectives, as contained in the Credit Risk Management Framework,
are:
Maintenance of an efficient loan portfolio
Institutionalization of sound credit culture in the Bank
Adoption of international best practices in credit risk management
Development of Credit Risk Management professionals.
Each business unit is required to implement the credit policies and procedures in line with the credit
policy guide approved by the Board. Each business unit is responsible for the quality and
performance of its credit portfolio and for monitoring and controlling all credit risks in its portfolio,
including those subject to Management Credit Committee’s approval. The Internal Audit and Credit
Administration units are independent risk management functions and they undertake regular audits
of business units and credit quality reviews.
The Bank continues to focus attention on intrinsic and concentration risks inherent in its business in
order to manage its portfolio risk. It sets portfolio concentration limits that are measured under the
following parameters: concentration limits per obligor, business lines, industry, sector, rating grade
and geographical area. Sector limits reflect the risk appetite of the Bank.
The Bank drives the credit risk management processes using appropriate technology to achieve
global best practices. To comply with the CBN requirements on implementation of Basel II, especially
with the computation of capital adequacy ratio and market disclosure, the Bank invested in two major
software namely: Lead to Loan and OFSAA Basel II solution. These software are customised to suit
the internal processes of GTBank and to interact seamlessly with the bank’s core banking
application. To satisfy the Basel II pillar 2 requirements, the Bank came up with a comprehensive
ICAAP (Internal Capital Adequacy Assessment Process) document which detailed our approach and
procedures on how the bank measures its various risks and capital required. The document also
spells out the capital planning process of the bank and it is updated annually.
Lead to Loan is an integrated credit solution software which handles credit customers’ profiles, rating
scores, documents and collateral management, credit workflow processes, disbursement,
recoveries and collection. The deployment of ‘Lead to Loan’ has further enhanced the credit
processes of the Bank and guarantee data integrity towards achieving the CBN required sets of
disclosures and the seamless application of Internal Rating Based – Advanced in the measurement
and management of capital.

20 | P a g e
Guaranty Trust Bank Plc June 2016 Pillar III Disclosures
OFSAA Basel II solution is an Oracle Financial Services Analytical Application which is capable of
handling the complete range of calculations covered in the Basel II Accord. It supports Risk Weighted
Assets (RWA) computation for credit risk, market risk and operational risk and performs the capital
computation as well as risk weighted assets aggregation for all risk areas considered. Aside from
achieving Pillar 1 with OFSAA, the software is configured to process data from the Bank’s core
application and generate different required management reports for decision.
For capital adequacy computation under Basel ll Pillar l, the Bank has implemented the Standardized
Approach for the three risk areas – credit, market & operational risk.
The Board of Directors has delegated responsibility for the management of credit risk to its Board
Credit Committee. The Management Credit Committee reporting to the Board Credit Committee is
responsible for oversight of the Bank’s credit risk, including:
Formulating credit policies in consultation with business units, covering collateral
requirements, credit assessment, risk grading and reporting, documentary and legal
procedures, and compliance with regulatory and statutory requirements.
Establishing the authorisation structure for the approval and renewal of credit facilities.
Authorisation limits are allocated to business unit heads. Larger facilities require approval by
the Management Credit Committee, Deputy Managing Director, Managing Director and the
Board Credit Committee/Board of Directors as appropriate.
Reviewing and assessing credit risk. Management Credit Committee assesses all credit
exposures in excess of designated limits, prior to facilities being committed to customers by
the business unit concerned. Renewals and reviews of facilities are subject to the same
review process.
Developing and maintaining the Bank’s risk grading in order to categorise exposures
according to the degree of risk of financial loss faced and to focus management on the
attendant risks. The current risk grading framework consists of ten grades reflecting varying
degrees of risk of default and the availability of collateral or other credit risk mitigation. The
responsibility for approving the risk grades lies with the Board Credit Committee. The risk
grades are subject to regular reviews by the Risk Management Group.
Reviewing compliance of business units with agreed exposure limits, including those for
selected industries, country risk and product types. Regular reports are provided to Risk
Management Group on the credit quality of local portfolios and appropriate corrective action
is taken.

21 | P a g e
Guaranty Trust Bank Plc June 2016 Pillar III Disclosures
Providing advice, guidance and specialist skills to business units to promote best practice
throughout the Bank in the management of credit risk.
There were no changes in the Bank’s risk management policies. Each business unit is required to
implement credit policies and procedures, with credit approval authorised by the Board Credit
Committee.
2.7 Market Risk Management
Market risk is the risk that changes in market variables, such as interest rate, equity prices, foreign
exchange rates and credit spreads (not relating to changes in the obligor’s / issuer’s credit standing)
will affect the Bank’s income or the value of its holdings of financial instruments. The objective of
market risk management is to manage and control market risk exposures within acceptable
parameters, while optimising the return on risk.
The Bank separates its exposure to market risk between trading and non-trading portfolios. Trading
portfolios are mainly held by the Treasury Group, and include positions arising from market making
and proprietary position taking, together with financial assets and liabilities that are managed on a
fair value basis. With the exception of translation risk arising on the Bank’s net investment in its
foreign operations, all foreign exchange risks within the Bank are monitored by the Treasury Group.
Accordingly, the foreign exchange position is treated as part of the Bank’s trading portfolios for risk
management purposes.
Overall authority for market risk is vested in Market Risk Management Committee. However, the
Market Risk Management Group within the Enterprise-wide Risk Management Division is
responsible for the development of detailed risk management policies (subject to review and
approval by the Committee) and for the day-to-day review of their implementation.
2.7.1 Exposure to market risks – trading portfolios The principal tool used to measure and control market risk exposure within the Bank’s trading
portfolios is the open position limits using the Earning-at-Risk approach. Specific limits (regulatory
and in-house) have been set across the various trading portfolios to prevent undue exposure and
the Market Risk Management Group ensures that these limits and triggers are adhered to by the
bank.

22 | P a g e
Guaranty Trust Bank Plc June 2016 Pillar III Disclosures
2.7.2 Exposure to interest rate risk – Trading and non-trading
portfolios
The principal risk to which non-trading portfolios are exposed is the risk of loss from fluctuations in
the future cash flows or fair values of financial instruments because of a change in market interest
rates. Interest rate risk is managed principally through monitoring interest rate gaps and by having
pre-approved limits for re-pricing bands. The ALMAC is the monitoring body for compliance with
these limits and is assisted by Risk Management in its day-to-day monitoring activities.
The Bank makes use of limit monitoring, earnings-at-risk, gap analyses and scenario analyses to
measure and control the market risk exposures within its trading and banking books.
The bank also performs regular stress tests on its banking and trading books. In performing this, the
Bank ensures there are quantitative criteria in building the scenarios. The Bank determines the effect
of changes in interest rates on interest income; volatility in prices on trading income; and changes in
funding sources and uses on the Bank’s liquidity.
During the period, the key potential risks the bank was exposed to from these instruments were
foreign exchange risk and interest rate risk and price risk. However, all potential risk exposures in
the course of the period were successfully mitigated as mentioned above.
2.8 Operational Risk Management
Guaranty Trust Bank defines Operational Risk Management (OpRisk) as “the direct or indirect risk
of loss resulting from inadequate and/or failed internal processes, people, and systems or from
external events”. In GTBank, this involves the review and monitoring of all strategies and initiatives
deployed in its people management, process engineering and re-engineering, technology
investment and deployment, management of all regulatory responsibilities, engagement of third party
services, and response to major disruptions and external threats.
To ensure a holistic framework is implemented, Operational Risk Management also monitors
Strategic and Reputational Risks from a broad perspective. Strategic Risk Management is the
process for identifying, assessing and managing risks and uncertainties, affected by internal and
external events or scenarios, that could inhibit the Bank’s ability to achieve its strategic objectives
with the ultimate goal of creating and protecting shareholder and stakeholder value.
The Bank considers Reputational Risk to be the current and prospective adverse impact on earnings
and capital arising from negative public opinion. It measures the change in perception of the Bank
by its stakeholders. It is linked with customers’ expectations regarding the Bank’s ability to conduct

23 | P a g e
Guaranty Trust Bank Plc June 2016 Pillar III Disclosures
business securely and responsibly. All adverse trends identified are reported to relevant
stakeholders for timely redress.
The following practices, tools and methodologies have been deployed in the Bank for the purpose
of Operational Risk Management implementation:
Loss Incident Reporting – Loss incidents are reported to OpRisk Group by all business areas in
the Bank. All staff are encouraged to report operational risk events as they occur in their respective
business spaces whether these risks crystallize into actual losses or not. As a result, the Bank has
a robust OpRisk loss database detailing relevant OpRisk loss data for four years. Information collated
is analyzed for identification of risk concentrations, appropriate OpRisk risk profiling and capital
estimation.
Risk and Control Self Assessments (RCSAs) – This is a qualitative risk identification tool deployed
bank-wide. All branches and Head-Office departments are required to complete the Risk Self-
Assessment process at least once a year. A risk-based approach has been adopted for the
frequency of RCSAs to be conducted by branches, departments, groups and divisions of the Bank.
These assessments enable risk profiling and risk mapping of prevalent operational risks across the
Bank. A detailed risk register cataloguing key risks identified and controls for implementation is also
developed and maintained from this process.
Risk Assessments of the Bank’s new and existing products, services, branches and
vendors/contractors are also carried out. This process tests the quality of controls the Bank has in
place to mitigate likely risks. Other Risk Assessments conducted include Process Risk
Assessments, Product Risk Assessments, Vendor Risk Assessments, Fire Risk Assessments, New
Branch Risk Assessment and Fraud Risk Assessments.
Key Risk Indicators (KRI) – These are quantitative parameters defined for the purpose of
monitoring operational risk trends across the Bank. A comprehensive KRI Dashboard is in place and
it is supported by specific KRIs for key departments in the Bank. Medium – High risk trends are
reported in the Monthly and Quarterly Operational Risk Status reports circulated to Management
and key stakeholders.
Fraud Risk Management Initiatives – Causal analysis of key fraud and forgeries trends identified
in the Bank or prevalent in local and global business environments are carried out and reported on
a monthly basis. Likely and unlikely loss estimations are also determined in the process as input in
the OpRisk capital calculation process. The focus in Fraud Risk Management is to ensure that

24 | P a g e
Guaranty Trust Bank Plc June 2016 Pillar III Disclosures
processes for preventing, deterring, detecting fraud and forgeries incidents, and sanctioning
offenders are effective.
Business Continuity Management (BCM) in line with ISO 22301 Standards – To ensure the
resilience of our business to any disruptive eventuality, the Bank has in place a robust Business
Continuity Plan (BCP). This plan assures timely resumption of its business with minimal financial
losses or reputational damage and continuity of service to its customers, vendors and regulators.
Various testing and exercising programs are conducted bank-wide to ensure that recovery
coordinators are aware of their roles and responsibilities. The Plan is reviewed and updated
periodically to ensure reliability and relevance of information contained. GTBank has been certified
ISO 22301 BC compliant by the globally recognized British Standards Institution signifying that the
Bank has instituted internationally accepted processes, structures and systems that demonstrate its
capacity to resume business within a short timeframe in the event of any business disruption.
Compliance and Legal Risk Management – Compliance Risk Management involves close
monitoring of KYC compliance by the Bank, escalation of Audit Non-conformances, Complaints
Management, and observance of the Bank’s zero-tolerance culture for regulatory breaches. It also
entails an oversight role for monitoring adherence to regulatory guidelines and global best practices
on an on-going basis.
Legal Risk Management involves the monitoring of litigations against the Bank to ascertain likely
financial or non-financial loss exposures. It also involves conduct of causal analysis on identified
points of failure that occasioned these litigations. Medium – High risk factors identified are duly
reported and escalated for appropriate treatment where necessary.
Occupational Health and Safety procedures and initiatives – Global best practices for ensuring
the health and safety of all staff, customers and visitors to the Bank’s premises are advised, reported
to relevant stakeholders and monitored for implementation. Related incidents are recorded bank-
wide for identification of causal factors and implementation of appropriate mitigants to forestall
reoccurrence As a result, the following are conducted and monitored: Fire Risk Assessments,
Quarterly Fire Drills, Burglaries and Injuries that occur within the Bank’s premises.
Operational Risk Capital Calculation – The Bank has adopted the Basic Indicator Approach under
Basel II Pillar 1 for the calculation of its Operational Risk Economic Capital for internal risk monitoring
and decision-making. Whilst the Bank has the required OpRisk loss data to migrate to other capital
calculation methods i.e. the Standardized Approach and Advanced Measurement Approach, it is
mindful of investing in the additional resources required especially as the Central Bank of Nigeria
has recommended the Basic Indicator Approach for all banks in Nigeria. The Estimated OpRisk
25 | P a g e
Guaranty Trust Bank Plc June 2016 Pillar III Disclosures
Capital Charge is reported to the Board and Management for guidance in Capital Planning and
decision making.
Operational Risk Reporting – Monthly, quarterly, and annual reports highlighting key operational
risks identified are circulated to relevant stakeholders for awareness and timely implementation of
mitigation strategies. Reports are also generated and circulated on a need-basis. To aid timely and
comprehensive reporting of prevalent OpRisk exposures in the Bank, an OpRisk Management
software/application has been acquired by the Bank. This has been successfully implemented to aid
data collation and information gathering, analysis, escalation and reporting of key OpRisk incidents
or emerging trends observed.
2.8.1 Treatment of Operational Risks GTBank adopts several risk treatment strategies to mitigate identified operational risks. These
mitigants are applied to achieve a residual risk level aligned with the Bank’s risk tolerances. In line
with best practices, the cost of risk treatments introduced must not exceed the reward.
The following comprise the OpRisk treatments adopted by the Bank:
Risk Acceptance and Reduction: The Bank accepts the risk because the reward of engaging in
the business activity far outweighs the cost of mitigating the risk. Residual risks retained by the
business after deploying suitable mitigants are accepted. For reduction option, risks that are within
the Bank’s strategic objectives but are outside the defined risk tolerance are reduced by
implementing or increasing controls to reduce the impact and/or likelihood of the risk.
Risk Transfer (Insurance): This involves another party or parties bearing the risk, by mutual
consent. Relationships are guided by the use of contracts and insurance arrangements
Risk Sharing (Outsourcing): Risk is shared with other parties that provide expert solutions required
to mitigate risk or reduce risk burden whether operationally or financially
Risk Avoidance: Requires discontinuance of the business activity that gives rise to the risk
2.9 Liquidity Risk Management The Bank’s liquidity risk management process is primarily the responsibility of the Market Risk
Management Group within the ERM Division. A brief overview of the bank’s liquidity management
processes during the year includes the following:

26 | P a g e
Guaranty Trust Bank Plc June 2016 Pillar III Disclosures
Maintenance of minimum levels of liquid and marketable assets above the regulatory
requirement of 30%. The Bank has also set for itself more stringent in-house limits above this
regulatory requirement to which it adheres.
Monitoring of its cash flow and balance sheet trends. The Bank also makes forecasts of
anticipated deposits and withdrawals to determine their potential effect on the Bank.
Regular measurement and monitoring of its liquidity position/ratios in line with regulatory
requirements and in-house limits.
Regular monitoring of non-earning assets.
Monitoring of deposit concentration.
Ensure diversification of funding sources.
Monitoring of level of undrawn commitments.
Maintaining a contingency funding plan.
2.9.1 Funding approach The Bank’s overall approach to funding is as follows:
Generation of large pool of low cost deposits.
Maintenance of efficiently diversified sources of funds along product lines, business
segments and also regions to avoid concentration risk.
The Bank was able to meet all its financial commitments and obligations without any liquidity risk
exposure for the period ended June 2016. The Bank’s Asset and Liability Management Committee
(ALMAC) is charged with the responsibility of managing the Bank’s daily liquidity position. Liquidity
position is monitored daily and stress testing is conducted regularly under a variety of scenarios
covering both normal and more severe market conditions.
All liquidity policies and procedures are subject to review and approval by ALMAC. The Risk
Management Group sets limits which are in conformity with the regulatory limits. The limits are
monitored regularly and exceptions are reported to ALMAC as appropriate. In addition, gap reports
are prepared monthly to measure the maturity mismatches between assets and liabilities. The
cumulative gap over total assets is not expected to exceed 20%.
2.9.2 Exposure to liquidity risk The key measure used by the Bank for managing liquidity risk is the ratio of liquid assets to short
term liabilities. For this purpose, liquid assets are considered as including cash and cash equivalents
and investment grade debt securities for which there is an active and liquid market. Short term liability
includes local currency deposits from banks and customers.

27 | P a g e
Guaranty Trust Bank Plc June 2016 Pillar III Disclosures
The liquidity ratio of the Bank, which is a measure of liquidity risk, is calculated as a ratio of naira
liquid assets to local currency deposits and shown in Table 1 below:
Table 1: Liquidity Ratios Jun-2016 Dec-2015
At end of year 36.87% 42.21%
Average for the year 37.41% 41.04%
Maximum for the year 38.53% 44.02%
Minimum for the year 36.13% 38.23%
Regulatory requirement 30.00% 30.00%
2.10 Information Technology Risk Management
Technology continues to play a critical role in the Bank’s operations and in the fulfilment of
its strategic objectives. Given this importance of information technology to the overall
performance and success of the Bank, GTBank has in place a sound framework to identify,
monitor, control and report on IT risks. The Bank‘s IT governance framework aligns its IT
strategy with its overall business objective. The Board of directors through the Board
Information Technology Strategy Committee provides guidance to Management on
information technology issues and monitors the effectiveness of information technology
within the Bank and the adequacy of controls. The management also establishes a more
detailed framework of supporting policies, standards and procedures that demonstrates how
they will operate within the broader risk parameters established by the Board. As a result,
there are two management committees that are responsible for controlling and mitigating IT
risks in the Bank. These are:
a) Information Technology (IT) Steering Committee- responsible for assisting
management with the implementation of IT strategy approved by the Board as
well as IT risk assurance.
b) Information Technology (IT) Risk Management Committee- responsible for
establishing standardised IT risk management practices and ensuring compliance
and institutionalising IT risk management in the Bank’s operations at all levels.

28 | P a g e
Guaranty Trust Bank Plc June 2016 Pillar III Disclosures
These committees ensure strategic alignment of information technology with business
goals, value delivery, resource management, IT risk management and setting
performance measures.
In order to monitor IT compliance, the Bank set up an IT Audit team in the Systems and
Control Division with the mandate to examine and evaluate the Bank’s IT infrastructure,
policies and procedures. The audits determine whether IT controls protect corporate
assets, ensure data integrity and are aligned with the business overall objectives. In
fulfilment of this mandate, the IT Audit unit conducts an annual risk assessment exercise
on the Bank’s information technology infrastructure to identify high risk areas. This
assessment culminates in an audit plan which is reviewed and approved by the Board
Audit committee. The team also draws up a checklist which identifies the audit criteria,
the Bank’s policies and standards in effect, controls in place for information
systems/products, statutory requirements and changes to the control environment.
The audit is performed through spot checks, comprehensive sweep exercises to ensure
the following:
Detect and prevent abuse of access right to the Bank’s core banking application
and other system applications
System investigation to identify, rectify and prevent system malfunctions,
Income and expense verification to verify that there no income losses due to
system error and provide assurance that the income recognised is based on set
parameters.
The team also performs a review of the Bank’s network to prevent unauthorised
accesses and breaches.
Based on the audit findings, exception reports and recommendations are prepared and sent
to the relevant unit for prompt response and/or implementation. Follow up meetings are also
made to ensure that issues identified are properly resolved and the recommendations made
are being implemented.
Furthermore, the Bank was awarded a triple International Organization for Standardization
certification for ISO/IEC 27001- for Information Security, ISO 20000 – for IT Service
Management and ISO 22301 – for Business Continuity by the British Standard Institute
29 | P a g e
Guaranty Trust Bank Plc June 2016 Pillar III Disclosures
(BSI). The British Standard Institute (BSI) certification recognizes companies that have
implemented systems and structures that ensure their operations are in line with
international best practices. The certification attests that the Bank has instituted
internationally accepted processes that guaranty the security of its customers’ information,
the ability of the institution to consistently provide quality service and its capacity to resume
business within a short timeframe in the event of any business disruptions. These certificates
are valid for a period of three years during which surveillance audits will be conducted by
the BSI on an annual basis to ascertain conformity with established standards and
procedures. After the expiration of the certificates, a re-certification audit will be conducted
to evaluate the Bank’s fulfilment of all the requirement of the internationally recognised
standards.
The Bank also adopts the following mitigation strategies to manage information security
risks:
Network Controls – The bank has put in place different controls on the network to
facilitate access to network resources on need to have basis. Different network
segmentations exist on the network to protect specific areas from access to
unauthorized personnel. Also, a network access control security solution has been
implemented to guard against enterprise network access to rogue systems.
Application Security Controls (e.g. Secure Coding controls) – The Bank ensures that
new and modified applications are well tested before deployment to production
environment. Such tests include functional and security tests. Also, applications
running on endpoint systems are reviewed quarterly to ensure that unauthorized
applications are not freely used within the enterprise environment. In addition to this,
security solutions such has Web Application Firewall, Database Activity Monitoring
and Threat Management have been deployed to provide enhanced security for web
facing applications in Bank.
Operating system hardening – Bank has baseline security configurations for the
various operating systems and network devices based on global security best
practices. Operating systems are deployed and configured based on published
security standards of Centre for Internet security.

30 | P a g e
Guaranty Trust Bank Plc June 2016 Pillar III Disclosures
Patch management – A benchmark threshold of permissible patch compliance status
was instituted by the Management of Bank. The monthly compliance status is
obtained on a monthly basis, compared to the established threshold and reported to
management for review and informed decision.
Administrative Controls (policies, procedures, attestations etc.) – The Bank was
certified by PCI DSS version 2.0 in 2012 and has continued to be recertified to
upgraded version ever since, currently certified to PCI DSS Version 3.2. The Bank
was also certified in ISO 27001, 22301 and 2000 in 2014 and was recertified in 2015.
The tedious process of getting these certifications and recertification has really help
in the development and maturity of appropriate policies, processes and procedures
on business operations and security controls.

3 Capital Resources and Capital Requirements
3.1 Capital Resources The Bank complies with the Basel II guidance notes on regulatory capital by the CBN which requires
banks to maintain a minimum level of prescribed capital over the pillar 1 requirements while it also
holds excess capital to cover additional obligations or the pillar 2 risks which are covered by the
Bank’s ICAAP. The Bank therefore assesses its capital adequacy internally and for regulatory
reporting purposes.
GTBank’s regulatory capital resources comprise of the following distinct elements which are further
classified under two main categories – Tier 1 and Tier 2 capital;
Tier 1 capital is going concern capital and is available for unrestricted and immediate use to cover
risks and losses whilst enabling the organisation to continue in business. Tier 1 consists of only
permanent shareholders’ equity and disclosed reserves and it includes the following;
Paid up share capital which is issued and fully paid; only redeemed on the winding-up of the
business.
Share premium, the excess paid over the par value of the shares.
General reserves, the earnings derived after all distributable allocations have been made.
SMEEIS reserves
Statutory reserve, made out of profit after tax
Tier 2 capital consists of capital instruments which are normally of medium to long-term maturity
with an original maturity of at least five years. For regulatory purposes, it is a requirement that these
instruments be amortised on a straight-line basis in their final five years of maturity. Also considered
part of tier 2 capital is other comprehensive income (OCI) other than fixed asset revaluation reserves
created by the adoption of IFRS which are subjected to CBN’s limitations. However, Tier 2 items in
the Bank only consists of OCI, particularly the fair value reserves used to account for the revaluation
changes in Available-for-sale financial instruments.
Deductions made from capital include;
Intangible assets

32 | P a g e
Guaranty Trust Bank Plc June 2016 Pillar III Disclosures
100% investments in unconsolidated subsidiaries
Deferred tax assets
The Table 2 shows the regulatory capital resources of GTBank as at 30 June 2016 and 31 December
2015.
Table 2: Capital resources
In thousands of Nigerian Naira Jun-2016 Dec-2015
Tier 1 capital
Share capital 14,715,590 14,715,590
Share premium 123,471,114 123,471,114
Retained profits 60,231,078 46,048,031
Statutory Reserve 177,752,657 161,134,636
SMEEIS Reserve 4,232,478 4,232,478
Other reserves 28,279,386 24,457,544
Tier 1 Sub-Total 408,682,303 374,059,393
Less Regulatory deductions :
Other intangible assets (3,450,473) (2,492,959)
Deferred Tax Assets (3,299,014) -
100% of investments in unconsolidated Banking and financial subsidiary/associate companies.
(43,968,474) (41,905,781)
Net Total Tier 1 Capital (A) 357,964,342 329,660,653
Tier 2 capital
Fair Value Reserves (1,662,029) 3,765,486
Net Total Tier 2 Capital (B) (1,662,029) 3,765,486
Total Qualifying Capital (C= A+B) 356,302,313 333,426,139
3.2 Capital Requirements
3.2.1 Minimum capital requirements The minimum capital requirement is the amount of Pillar 1 capital that the regulator requires GTBank
to hold at all times. Pillar 1 deals with maintenance of minimum regulatory capital and specifies
approaches for the quantification of the three traditional risks that might crystallize on a bank: Credit
risk, Operational risk and Market risk. Other risks are not considered fully quantifiable at this stage.
Banking regulators define capital requirements for banks and financial services holding companies
expressed in the form of a Capital to Risk (Weighted) Assets Ratio (CRAR) or as commonly known
Capital Adequacy Ratio (CAR). The current minimum required level for this ratio is 10% or 15%
respectively for Nigerian banks or banking groups with regional/national license and international
banking license.
Furtherance to this, CBN has urged all banks and banking groups in Nigeria to adopt the
Standardized Approach (SA) in determining Credit Risk and Market Risk and Basic Indicator
33 | P a g e
Guaranty Trust Bank Plc June 2016 Pillar III Disclosures
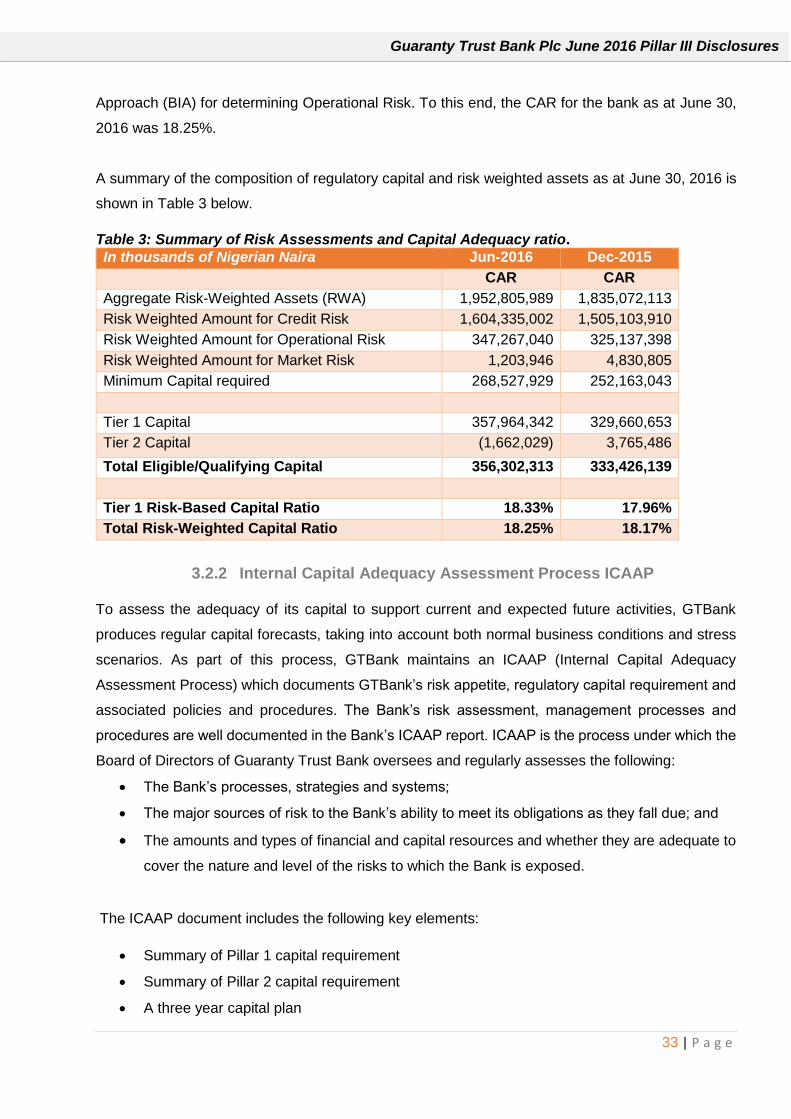
Approach (BIA) for determining Operational Risk. To this end, the CAR for the bank as at June 30,
2016 was 18.25%.
A summary of the composition of regulatory capital and risk weighted assets as at June 30, 2016 is
shown in Table 3 below.
Table 3: Summary of Risk Assessments and Capital Adequacy ratio.
In thousands of Nigerian Naira Jun-2016 Dec-2015
CAR CAR
Aggregate Risk-Weighted Assets (RWA) 1,952,805,989 1,835,072,113
Risk Weighted Amount for Credit Risk 1,604,335,002 1,505,103,910
Risk Weighted Amount for Operational Risk 347,267,040 325,137,398
Risk Weighted Amount for Market Risk 1,203,946 4,830,805
Minimum Capital required 268,527,929 252,163,043
Tier 1 Capital 357,964,342 329,660,653
Tier 2 Capital (1,662,029) 3,765,486
Total Eligible/Qualifying Capital 356,302,313 333,426,139
Tier 1 Risk-Based Capital Ratio 18.33% 17.96%
Total Risk-Weighted Capital Ratio 18.25% 18.17%
3.2.2 Internal Capital Adequacy Assessment Process ICAAP To assess the adequacy of its capital to support current and expected future activities, GTBank
produces regular capital forecasts, taking into account both normal business conditions and stress
scenarios. As part of this process, GTBank maintains an ICAAP (Internal Capital Adequacy
Assessment Process) which documents GTBank’s risk appetite, regulatory capital requirement and
associated policies and procedures. The Bank’s risk assessment, management processes and
procedures are well documented in the Bank’s ICAAP report. ICAAP is the process under which the
Board of Directors of Guaranty Trust Bank oversees and regularly assesses the following:
The Bank’s processes, strategies and systems;
The major sources of risk to the Bank’s ability to meet its obligations as they fall due; and
The amounts and types of financial and capital resources and whether they are adequate to
cover the nature and level of the risks to which the Bank is exposed.
The ICAAP document includes the following key elements:
Summary of Pillar 1 capital requirement
Summary of Pillar 2 capital requirement
A three year capital plan

34 | P a g e
Guaranty Trust Bank Plc June 2016 Pillar III Disclosures
Analysis of the impact of stress testing on Profit and Loss, Balance Sheet and regulatory
capital.
The ICAAP is regularly reviewed at the highest levels of Guaranty Trust Bank’s organisation
structure. As such the Bank’s risk management processes and ICAAP assumptions are regularly
being challenged. Maintaining and continually reviewing the Bank’s ICAAP helps to ensure that the
Bank continues to retain its focus on the risks it faces.
A key feature of the ICAAP is to identify those risks which are not captured in the Pillar 1 capital
adequacy calculation and to assess an appropriate additional capital requirement to be included as
Pillar 2. The Bank's approach to calculating its own internal capital requirements has been to take
the minimum capital required for capitalised risks – credit, market and operational under Pillar I as
the starting point, assess whether this is sufficient to cover the risks and then identify other risks and
assess the prudent levels of capital to meet them.
In determining its Internal Assessment of Capital Requirements (IACR), the Bank adopted the
Standardized Approach (SA) for determining all of its Pillar 1 Risks with model developed for
determining quantifiable Pillar 2 Risks. The internal assessment of the Bank’s capital shows that the
Bank has enough capital to withstand the severe stresses modelled in the internal capital
assessment and therefore ahead of what continues to be a stressed and challenging financial
environment.

35 | P a g e
Guaranty Trust Bank Plc June 2016 Pillar III Disclosures
4 Credit Risk
4.1 Overview Credit risk is the principal source of risk to the Bank arising from exposures in form of loans and
advances extended to customers under the corporate, commercial, small & medium enterprises
and retail business lines. Credit risk also arises through the use of off-balance sheet guarantees
and commitments and through the Bank’s investment in financial instruments. Capital requirements
are based on the perceived level of risk of the individual credit exposures. As stipulated in the Basel
II implementation document of the Central Bank local regulator, the bank classified its various
loan exposures into appropriate Basel II classes – corporate exposures, retail, exposures to
public sector entities, exposures secured by residential mortgages and mortgages on
commercial properties and equity.
The CBN framework provides two approaches for the calculation of minimum regulatory capital
requirements for credit risk - the Standardised Approach; and Internal Ratings Based Approach (“IRB
Approach”) of which banks were directed to adopt the standardised approach. To this end, as at 30
June 2016, GTBank used the Standardised Approach only for assessing its capital requirements for
credit risk for regulatory and internal capital assessment purposes. Because the standardized
approach is hinged on assignment of diversified risk weights to the asset classes, based on the
ratings provided by the External Rating Agencies; which are not available in the local operating
environment, the regulator; CBN thus stipulates that all unrated exposures irrespective of the
asset classes shall be assigned a risk weight of 100% with the exception of exposures to the
Federal Government of Nigeria, the Central Bank of Nigeria and some Multilateral development
banks which a risk weight of 0% is to be applied while a risk weight of 75% is to be applied to
retail exposures and exposures secured by residential mortgages.
4.2 Credit risk exposure The total and average credit risk exposures after accounting offsets and without taking into
account the effects of credit risk mitigation as at June 30, 2016 are set out below in Table 4
below. These exposures include both banking book and trading book activity and have been
calculated in accordance with the regulatory requirements applicable.

36 | P a g e
Guaranty Trust Bank Plc June 2016 Pillar III Disclosures
Table 4: Total and Average credit risk exposures by counterparty
In thousands of Nigerian Naira Jun-16 Dec-15
Credit Risk exposures/Counterparty Total Exposure
Average
exposure Total Exposure
Average
exposure
Central Governments and Central
Banks
791,561,375 747,238,611 729,525,288 634,193,343
State Government and Local
Authorities
61,158,982 61,902,225 52,574,926 50,067,789
Supervised Institutions
174,884,845 150,996,681 126,289,817 151,662,052
Corporate and Other Persons
1,199,011,296 1,074,494,639 1,076,890,470 1,130,397,130
Regulatory Retail Portfolio
85,339,874 87,903,568 73,800,562 75,751,017
Secured by Mortgages on
Residential Properties
1,975,143 2,296,382 2,189,958 2,522,978
Exposures Secured by Mortgages on
Commercial Real Estates
62,329,841 55,368,593 63,600,918 63,878,776
High Risk Exposures (Unquoted
Equity investments)
3,901,551 4,059,343 4,217,135 5,916,396
Unsettled and Failed Transactions
4,885,232 3,235,062 1,584,892 1,057,312
Other Assets
111,282,490 106,919,502 102,556,515 105,807,607
Sub-total
2,496,330,629 2,294,414,606 2,233,230,481 2,221,254,400
Off Balance sheet exposures
Public Sector Entities
170,115 170,115 170,115 1,020,115
Supervised Institutions (DMBs,
Discount Houses, etc.)
300,283 1,178,362 2,056,441 3,318,861
Corporates
486,599,672 505,358,837 524,118,003 572,932,213
Retail Portfolios and Other
Contingents
1,773,116 1,406,088 1,039,060 938,757
Sub-total
488,843,186 508,113,403 527,383,620 578,209,947
Total
2,985,173,815 2,802,528,009 2,760,614,100 2,799,464,346
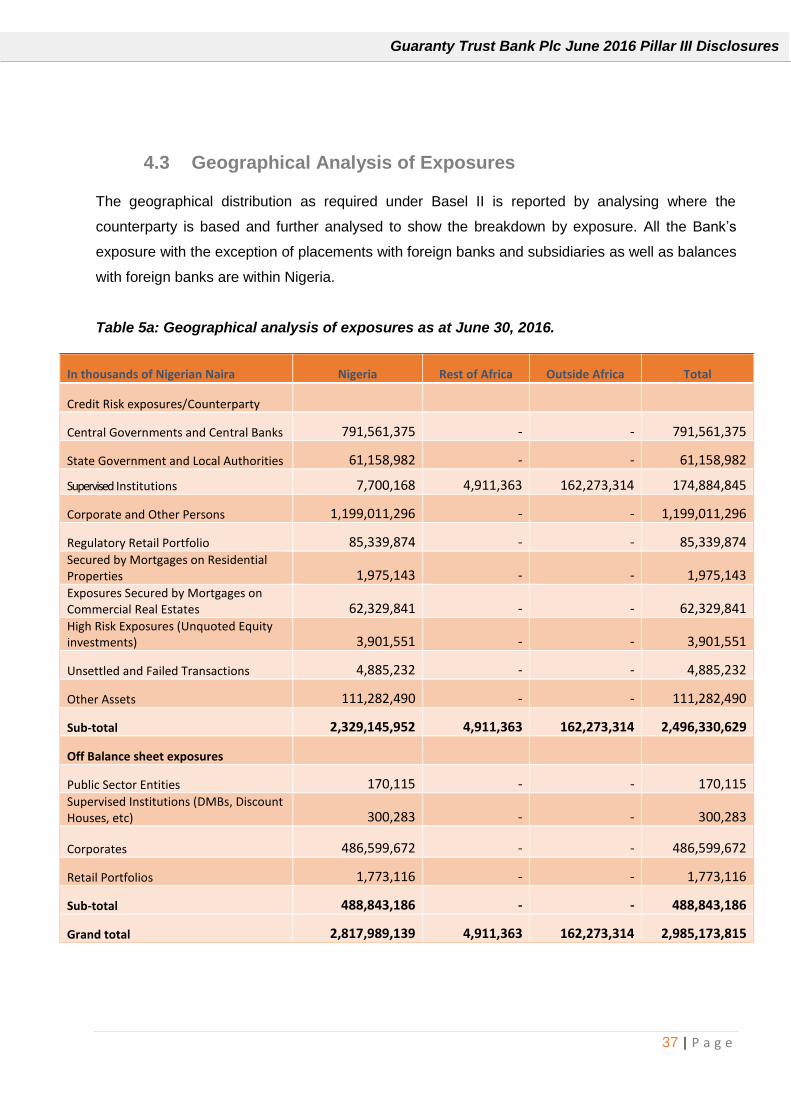
37 | P a g e
Guaranty Trust Bank Plc June 2016 Pillar III Disclosures
4.3 Geographical Analysis of Exposures The geographical distribution as required under Basel II is reported by analysing where the
counterparty is based and further analysed to show the breakdown by exposure. All the Bank’s
exposure with the exception of placements with foreign banks and subsidiaries as well as balances
with foreign banks are within Nigeria.
Table 5a: Geographical analysis of exposures as at June 30, 2016.
In thousands of Nigerian Naira Nigeria Rest of Africa Outside Africa Total
Credit Risk exposures/Counterparty
Central Governments and Central Banks 791,561,375 - - 791,561,375
State Government and Local Authorities 61,158,982 - - 61,158,982
Supervised Institutions 7,700,168 4,911,363 162,273,314 174,884,845
Corporate and Other Persons 1,199,011,296 - - 1,199,011,296
Regulatory Retail Portfolio 85,339,874 - - 85,339,874 Secured by Mortgages on Residential Properties 1,975,143 - - 1,975,143 Exposures Secured by Mortgages on Commercial Real Estates 62,329,841 - - 62,329,841 High Risk Exposures (Unquoted Equity investments) 3,901,551 - - 3,901,551
Unsettled and Failed Transactions 4,885,232 - - 4,885,232
Other Assets 111,282,490 - - 111,282,490
Sub-total 2,329,145,952 4,911,363 162,273,314 2,496,330,629
Off Balance sheet exposures
Public Sector Entities 170,115 - - 170,115 Supervised Institutions (DMBs, Discount Houses, etc) 300,283 - - 300,283
Corporates 486,599,672 - - 486,599,672
Retail Portfolios 1,773,116 - - 1,773,116
Sub-total 488,843,186 - - 488,843,186
Grand total 2,817,989,139 4,911,363 162,273,314 2,985,173,815

38 | P a g e
Guaranty Trust Bank Plc June 2016 Pillar III Disclosures
Table 5b: Geographical analysis of exposures as at December 31, 2015.
In thousands of Nigerian Naira Nigeria Rest of Africa Outside Africa Total
Credit Risk exposures/Counterparty
Central Governments and Central Banks 729,525,288 - - 729,525,288
State Government and Local Authorities 52,574,926 - - 52,574,926
Supervised Institutions 9,259,186
3,593,270
113,437,361 126,289,817
Corporate and Other Persons 1,076,890,470 - - 1,076,890,470
Regulatory Retail Portfolio 73,800,562 - - 73,800,562
Secured by Mortgages on Residential Properties 2,189,958 - - 2,189,958
Exposures Secured by Mortgages on Commercial Real Estates 63,600,918 - - 63,600,918
High Risk Exposures (Unquoted Equity investments) 4,217,135 - - 4,217,135
Unsettled and Failed Transactions 1,584,892 - - 1,584,892
Other Assets 102,556,515 - - 102,556,515
Sub-total 2,116,199,850 3,593,270 113,437,361 2,233,230,481
Off Balance sheet exposures
Public Sector Entities 170,115 - - 170,115
Supervised Institutions (DMBs, Discount Houses, etc.) 2,056,441 - - 2,056,441
Corporates 524,118,003 - - 524,118,003
Retail Portfolios and Other Contingents 1,039,060 - - 1,039,060
Sub-total 527,383,620 - - 527,383,620
Total 2,643,583,469
3,593,270
113,437,361 2,760,614,100
4.4 Industry Analysis of Exposures Table 6 shows the balances by industry classification and by exposure class as at June 30, 2016 and as at December 31, 2015

Table 6a: Industry Analysis of Exposures (On- balance sheet) as at June 30, 2016
Credit Exposures ot On-Balance sheet items
Parent
Jun-2016
In thousands of Nigerian naira
Classification Agriculture
Capital market &
Financial
institution
Construction/
Real Estate Education
General
Commerce Government Manufacturing
Mining, Oil &
Gas
Info.Telecoms
& Transport.2 Individual Others 1 Total
Cash and cash equivalents
Unrestricted balances
with central banks - - - - - 48,479,926 - - - - - 48,479,926
Balances held with other
banks - 126,419,235 - - - - - - - - - 126,419,235
Money market placements - 65,175,804 - - - - - - - - - 65,175,804
Loans and advances to banks - 29,837 - - - - - - - - - 29,837
Loans and advances to
customers3:
Loans to individuals - - - - - - - - - 97,381,016 - 97,381,016
Loans to non-individuals 20,004,476 39,508,078 91,382,286 8,009,619 78,982,142 57,953,364 241,239,172 513,748,863 153,251,557 - 105,115,859 1,309,195,416
Financial assets held for
trading
Debt securities - - - - - 7,247,621 - - - - - 7,247,621
Derivative financial instruments - 442,181 - - - - 1,068 - 15,455 6,425 465,129
Hedging derivatives - - - - - - - - - -
Investment securities:
Debt securities - 7,700,168 - - - 281,929,327 - - - - - 289,629,495
Assets pledged as
collateral:
Debt securities - - - - - 61,592,845 - - - - - 61,592,845
Restricted deposits and
other assets4 - - - - - 348,768,573 - - - - 23,344,119 372,112,692
20,004,476 239,275,303 91,382,286 8,009,619 78,982,142 805,971,656 241,240,240 513,748,863 153,267,012 97,381,016 128,466,403 2,377,729,016

40 | P a g e
Guaranty Trust Bank Plc June 2016 Pillar III Disclosures
Table 6b: Industry Analysis of Exposures (Off-balance sheet) as at June 30, 2016
1 Includes Engineering Services, Hospitality, Clubs, Cooperative Societies etc.
2 Logistics, Maritime and Haulage.
Credit Risk Exposure to off-balance sheet items
Parent
Jun-2016
In thousands of Nigerian naira
Classification Agriculture
Capital
market &
Financial
institution
Constructio/
Real estate Education
General
Commerce Government Manufacturing
Mining, Oil
& Gas
Info.Telecoms
& Transport.2 Individual Others 1 Total
Financial guarantees - 571,949 293,781,253 200,000 8,738,666 170,115 8,513,720 71,444,400 3,353,859 - 42,104,430 428,878,392
Other contingents 495,378 - 285,479 - 11,645,167 - 25,170,754 22,098,372 - - 269,644 59,964,794
Total 495,378 571,949 294,066,732 200,000 20,383,833 170,115 33,684,474 93,542,772 3,353,859 0 42,374,074 488,843,186
Classification of Sectorial Credit Concentration on Loans to Customers by Product
Parent
Jun-2016
In thousands of Nigerian naira
Classification Agriculture
Capital
market &
Financial
institution
Constructio/
Real estate Education
General
Commerce Government Manufacturing
Mining, Oil
& Gas
Info.Telecoms
& Transport.2 Individual Others 1 Total
Loans to individuals:
Overdraft - - - - - - - - - 5,320,631 - 5,320,631
Loans - - - - - - - - - 92,060,385 - 92,060,385
Others - - - - - - - - - - - -
- - - - - - - - - 97,381,016 - 97,381,016
Loans to non-individuals:
Overdraft 498,584 7,342,430 10,498,426 606,363 22,046,576 26,473 32,674,523 46,721,881 4,305,275 - 12,624,256 137,344,787
Loans 17,684,118 32,165,648 80,883,860 7,403,256 46,793,126 57,926,891 205,498,304 426,230,091 148,946,282 - 92,467,690 1,115,999,266
Others 1,821,774 - - - 10,142,440 - 3,066,345 40,796,891 - - 23,913 55,851,363
20,004,476 39,508,078 91,382,286 8,009,619 78,982,142 57,953,364 241,239,172 513,748,863 153,251,557 0 105,115,859 1,309,195,416

41 | P a g e
Guaranty Trust Bank Plc June 2016 Pillar III Disclosures
Table 6c: Industry Analysis of Exposures (On-balance sheet) as at December 31, 2015
Credit Risk Exposure to on-balance sheet items
Parent
Dec-2015
In thousands of Nigerian naira
Classification Agriculture
Capital market
& Financial
institution
Construction
/ real estate Education
General
Commerce Government
Manufacturing
Mining, oil &
gas
Info.Telecoms
& Transport.2 Individual Others 1 Total
Cash and cash equivalents
Unrestricted balances
with central banks - - - - - 25,453,036 - - - - - 25,453,036
Balances held with other
banks - 100,404,743 - - - - - - - - - 100,404,743
Money market
placements - 20,178,228 - - - - - - - - - 20,178,228
Loans and advances to
banks - 638,817 - - - - - - - - - 638,817
Loans and advances to
customers 3 :
- Loans to individuals - - - - - - - - - 77,647,274 - 77,647,274
- Loans to non-individuals 48,048,185 32,985,514 109,586,192 5,618,625 75,081,270 49,364,351 225,656,642 418,664,599 130,726,894 - 91,827,897 1,187,560,169
Financial assets held for
trading
Debt securities - - - - - 25,075,618 - - - - - 25,075,618
Hedging derivatives - - - - - - - - - -
Investment securities:
Debt securities - 5,858,270 - - - 320,720,992 - - - - - 326,579,262
Assets pledged as
collateral:
Debt securities - - - - - 61,946,270 - - - - - 61,946,270
Restricted deposits and
other assets4 - 7,348,576 - - - 273,873,799 - - - - - 281,222,375
48,048,185 167,414,148 109,586,192 5,618,625 75,081,270 756,434,066 225,656,642 418,664,599 130,726,894 77,647,274 91,827,897 2,106,705,792

42 | P a g e
Guaranty Trust Bank Plc June 2016 Pillar III Disclosures
Table 6d: Industry Analysis of Exposures (Off-balance sheet) as at December 31, 2015
Credit Risk Exposure to off-balance sheet items
Parent
Dec-2015
In thousands of Nigerian naira
Classification Agriculture
Capital
market &
Financial
institution
Construction/
real estate Education
General
Commerce Government Manufacturing
"Mining,oil &
gas
Info.Telecoms
& Transport.2 Individual Others 1 Total
Financial guarantees - 2,056,441 290,949,086 200,000 6,559,810 170,115 9,534,874 100,315,461 4,025,004 - 40,312,286 454,123,077
Other contingents 348,736 15,220,737 742,273 - 13,406,595 - 26,071,155 17,300,557 126,289 - 44,201 73,260,543
Total 348,736 17,277,178 291,691,359 200,000 19,966,405 170,115 35,606,029 117,616,018 4,151,293 - 40,356,487 527,383,620
Classification of Sectorial Credit Concentration on Loans to Customers by Product
Parent
Dec-2015
In thousands of Nigerian naira
Classification Agriculture
Capital
market &
Financial
institution
Construction/
real estate Education
General
Commerce Government Manufacturing
"Mining,oil &
gas
Info.Telecoms
& Transport.2 Individual Others 1 Total
Loans to individuals:
Overdraft - - - - - - - - - 4,858,203 - 4,858,203
Loans - - - - - - - - - 72,789,071 - 72,789,071
Others - - - - - - - - - - - -
- - - - - - - - - 77,647,274 - 77,647,274
Loans to non-individuals:
Overdraft 7,127,986 7,861,953 17,589,199 609,750 19,035,977 6,852 24,640,548 47,972,815 8,971,886 - 13,158,771 146,975,737
Loans 38,619,345 25,123,561 91,830,252 5,008,875 45,358,699 49,357,499 192,289,662 342,925,333 121,750,043 - 78,668,895 990,932,164
Others 2,300,854 - 166,741 - 10,686,594 - 8,726,432 27,766,451 4,965 - 231 49,652,268
48,048,185 32,985,514 109,586,192 5,618,625 75,081,270 49,364,351 225,656,642 418,664,599 130,726,894 - 91,827,897 1,187,560,169

43 | P a g e
Guaranty Trust Bank Plc June 2016 Pillar III Disclosures
4.5 Credit exposures by maturity The residual maturity distribution of credit exposures for GTBank is broken down as follows:
Table 7a: Residual maturity of credit exposures (On-balance sheet) for the year ended June 30, 2016
Residual Contractual Maturities of Financial Assets and LiabilitiesParentJun-2016
Carrying Less than 3 to 6 6 to 12 1 to 5 More thanIn thousands of Nigerian Naira Note amount 3 months1 months months years 5 years
Financial assetsCash and cash equivalents 23 266,940,752 266,940,752 - - - - Loans and advances to banks 28 29,837 29,837 - - - - Loans and advances to customers 29 1,406,576,432 459,473,860 188,563,818 166,946,119 532,599,655 58,992,980 Financial assets held for trading 24 7,247,621 4,115,191 2,233,826 897,378 1,226 - Hedging derivatives 25 - - - - - - Derivative financial assets 25 465,129 465,129 - - - - Investment securities:– Available for sale2 26 290,322,177 193,184,286 62,482,030 12,883,711 3,603,813 18,168,337 – Loans and receivables 26 - - - - - - – Held to maturity 26 3,208,868 - - - 3,208,868 - Assets pledged as collateral 27 61,592,845 40,084,000 20,446,271 1,062,574 - - Restricted deposits and other assets3 34 377,208,025 364,637,020 7,410,013 65,659 5,095,333 -
2,413,591,686 1,328,930,075 281,135,958 181,855,441 544,508,895 77,161,317 Financial liabilitiesDeposits from banks 35 158,087 158,087 - - - - Deposits from customers 36 1,700,295,053 1,694,284,172 5,494,390 510,419 6,072 - Financial liabilities held for trading 37 - - - - - - Derivative financial liabilities 25 398,493 398,493 - - - - Debt securities issued 38 - - - - - - Other borrowed funds 41 312,388,240 3,054,063 7,974,151 12,436,683 190,723,977 98,199,366 Other liabilities4 39 101,663,576 91,459,927 7,410,013 1,173,934 1,619,702 -
2,114,903,449 1,789,354,742 20,878,554 14,121,036 192,349,751 98,199,366 Gap (asset - liabilities) (460,424,667) 260,257,404 167,734,405 352,159,144 (21,038,049) Cumulative liquidity gap (460,424,667) (200,167,263) (32,432,858) 319,726,286 298,688,237
1 Includes balances with no speci fic contractual maturi ties 2 Included in More than 5 years maturi ty bucket of Avai lable for Sa le are equity securi ties .3 Excludes prepayments
4 Excludes Deferred Income
Management of this l iquidi ty gap is as disclosed in Note 4(g)
Restricted depos its have been bucketed within "less than 3 months" to match the underlying depos it l iabi l i ties
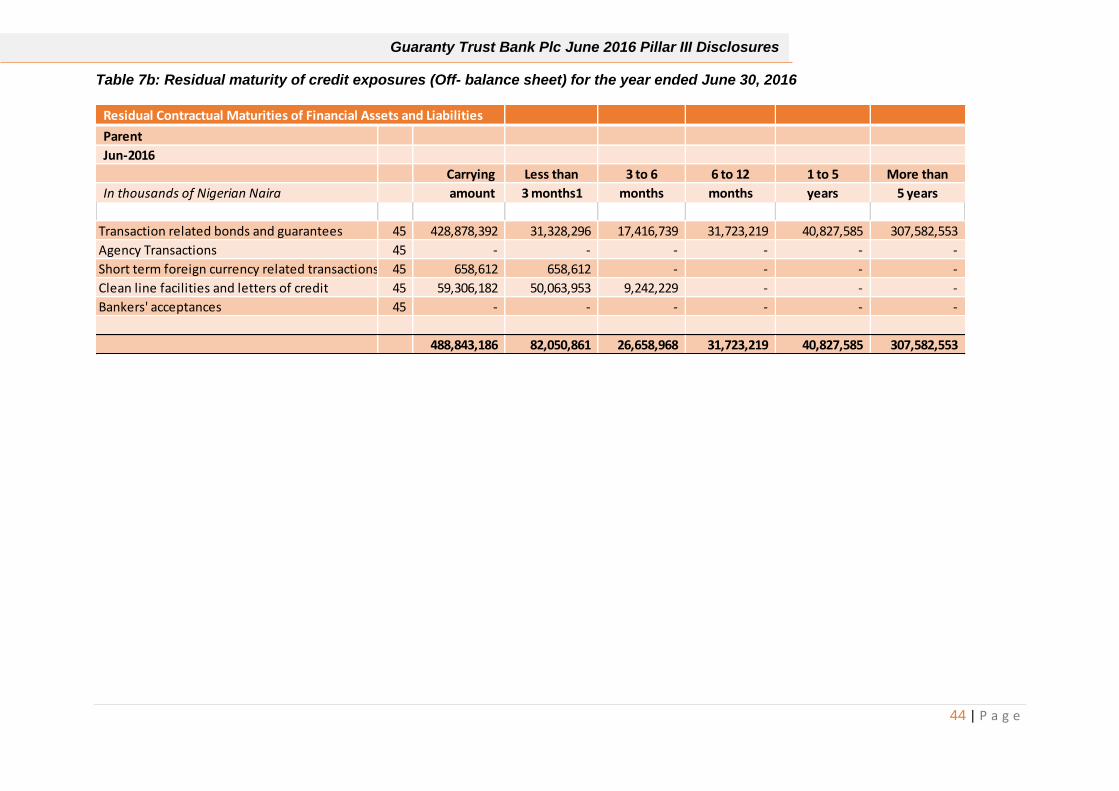
44 | P a g e
Guaranty Trust Bank Plc June 2016 Pillar III Disclosures
Table 7b: Residual maturity of credit exposures (Off- balance sheet) for the year ended June 30, 2016
Residual Contractual Maturities of Financial Assets and Liabilities
Parent
Jun-2016
Carrying Less than 3 to 6 6 to 12 1 to 5 More than
In thousands of Nigerian Naira amount 3 months1 months months years 5 years
Transaction related bonds and guarantees 45 428,878,392 31,328,296 17,416,739 31,723,219 40,827,585 307,582,553
Agency Transactions 45 - - - - - -
Short term foreign currency related transactions 45 658,612 658,612 - - - -
Clean line facilities and letters of credit 45 59,306,182 50,063,953 9,242,229 - - -
Bankers' acceptances 45 - - - - - -
488,843,186 82,050,861 26,658,968 31,723,219 40,827,585 307,582,553

45 | P a g e
Guaranty Trust Bank Plc June 2016 Pillar III Disclosures
Table 7c: Residual maturity of credit exposures (On- balance sheet) for the year ended December 31, 2015
Residual contractual maturities of financial assets and liabilities
Parent
Dec-2015
Carrying Less than 3 to 6 6 to 12 1 to 5 More than
In thousands of Nigerian Naira Note amount 3 months1
months months years 5 years
Financial assets
Cash and cash equivalents 23 173,133,109 173,133,109 - - - -
Loans and advances to banks 28 638,817 38,077 600,740 - - -
Loans and advances to customers 29 1,265,207,443 551,847,626 115,889,357 91,169,909 449,908,304 56,392,247
Hedging derivatives 25 - - - - - -
Investment securities:
– Available for sale2
26 327,585,822 205,914,031 25,431,180 86,165,205 2,449,650 7,625,756
– Held to maturity 26 3,210,575 - - - 3,210,575 -
Assets pledged as collateral 27 61,946,270 61,946,270 - - - -
Restricted deposits and other assets3
34 286,317,708 281,222,375 - - 5,095,333 -
2,143,115,362 1,275,493,790 146,683,874 183,555,566 460,673,439 76,708,693
Financial liabilities
Deposits from banks 35 39,941 39,941 - - - -
Deposits from customers 36 1,422,550,125 1,415,734,635 4,799,121 2,011,492 4,877 -
Other borrowed funds 40 338,580,300 5,214,764 106,382,771 10,911,529 169,781,131 46,290,105
Other liabilities4
38 85,088,484 78,119,387 3,817,041 1,582,862 1,569,194 -
1,846,258,850 1,499,108,727 114,998,933 14,505,883 171,355,202 46,290,105
Gap (asset - liabilities) (223,614,937) 31,684,941 169,049,683 289,318,237 30,418,588
Cumulative liquidity gap (223,614,937) (191,929,996) (22,880,313) 266,437,924 296,856,512
1 Includes balances with no specific contractual maturities
2 Included in More than 5 years maturity bucket of Available for Sale are equity securities.
3 Excludes prepayments
4 Excludes Deferred Income
Management of this liquidity gap is as disclosed in Note 4(c )
Restricted deposits have been bucketed within "less than 3 months" to match the underlying deposit liabilities

46 | P a g e
Guaranty Trust Bank Plc June 2016 Pillar III Disclosures
Table 7d: Residual maturity of credit exposures (Off- balance sheet) for the year ended December 31, 2015
Residual contractual maturities of contingencies
Parent
Dec-2015
Carrying Less than 3 to 6 6 to 12 1 to 5 More than
In thousands of Nigerian Naira amount 3 months months months years 5 years
Transaction related bonds and guarantees 43 454,123,077 25,584,729 8,148,959 37,576,123 21,836,887 360,976,379
Clean line facilities and letters of credit 43 73,260,543 41,237,545 27,826,631 4,196,367 - -
527,383,620 66,822,274 35,975,590 41,772,490 21,836,887 360,976,379
1 Includes balances with no specific contractual maturities
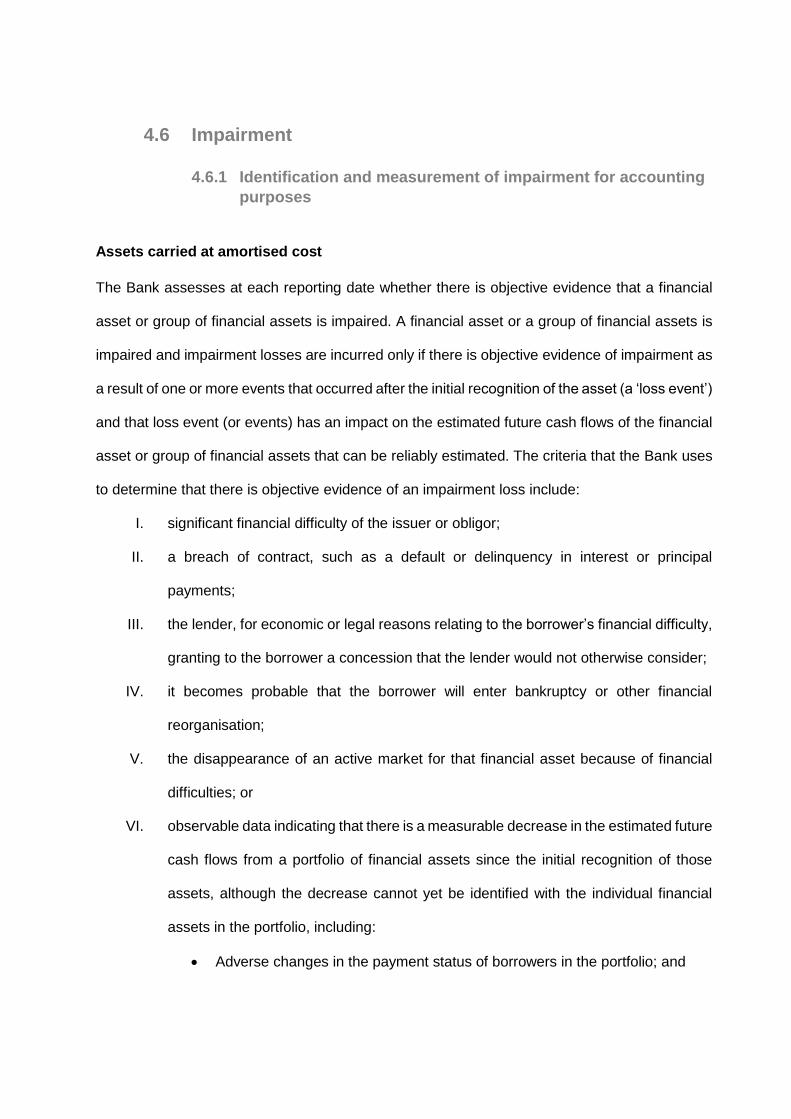
4.6 Impairment
4.6.1 Identification and measurement of impairment for accounting
purposes
Assets carried at amortised cost
The Bank assesses at each reporting date whether there is objective evidence that a financial
asset or group of financial assets is impaired. A financial asset or a group of financial assets is
impaired and impairment losses are incurred only if there is objective evidence of impairment as
a result of one or more events that occurred after the initial recognition of the asset (a ‘loss event’)
and that loss event (or events) has an impact on the estimated future cash flows of the financial
asset or group of financial assets that can be reliably estimated. The criteria that the Bank uses
to determine that there is objective evidence of an impairment loss include:
I. significant financial difficulty of the issuer or obligor;
II. a breach of contract, such as a default or delinquency in interest or principal
payments;
III. the lender, for economic or legal reasons relating to the borrower’s financial difficulty,
granting to the borrower a concession that the lender would not otherwise consider;
IV. it becomes probable that the borrower will enter bankruptcy or other financial
reorganisation;
V. the disappearance of an active market for that financial asset because of financial
difficulties; or
VI. observable data indicating that there is a measurable decrease in the estimated future
cash flows from a portfolio of financial assets since the initial recognition of those
assets, although the decrease cannot yet be identified with the individual financial
assets in the portfolio, including:
Adverse changes in the payment status of borrowers in the portfolio; and

48 | P a g e
Guaranty Trust Bank Plc June 2016 Pillar III Disclosures
National economic conditions that correlate with defaults on the assets in the
portfolio.
The estimated period between losses occurring and its identification is determined by local
management for each identified portfolio. In general, the periods used vary between three
months and 12 months.
The Bank first assesses whether objective evidence of impairment exists individually for financial
assets that are individually significant, and individually or collectively for financial assets that are
not individually significant. If the Bank determines that no objective evidence of impairment exists
for an individually assessed financial asset, whether significant or not, it includes the asset in a
group of financial assets with similar credit risk characteristics and collectively assesses them
for impairment. Assets that are individually assessed for impairment and for which an impairment
loss is or continues to be recognised are not included in a collective assessment of impairment.
The amount of the loss is measured as the difference between the asset’s carrying amount and
the present value of estimated future cash flows (excluding future credit losses that have not
been incurred) discounted at the financial asset’s original effective interest rate. The carrying
amount of the asset is reduced through the use of an allowance account and the amount of the
loss is recognised in the Income statement. If a loan or held-to-maturity investment has a variable
interest rate, the discount rate for measuring any impairment loss is the current effective interest
rate determined under the contract. As a practical expedient, the Bank may measure impairment
on the basis of an instrument’s fair value using an observable market price.
The calculation of the present value of the estimated future cash flows of a collateralized financial
asset reflects the cash flows that may result from foreclosure less costs for obtaining and selling
the collateral, whether or not foreclosure is probable.
For the purposes of a collective evaluation of impairment, financial assets are grouped on the
basis of similar credit risk characteristics (that is, on the basis of the Bank’s grading process that
considers asset type, industry, geographical location, collateral type, past-due status and other
relevant factors). Those characteristics are relevant to the estimation of future cash flows for

49 | P a g e
Guaranty Trust Bank Plc June 2016 Pillar III Disclosures
groups of such assets by being indicative of the debtors’ ability to pay all amounts due according
to the contractual terms of the assets being evaluated.
Future cash flows in a group of financial assets that are collectively evaluated for impairment are
estimated on the basis of the contractual cash flows of the assets in the Bank and historical loss
experience for assets with credit risk characteristics similar to those in the Bank. Historical loss
experience is adjusted on the basis of current observable data to reflect the effects of current
conditions that did not affect the period on which the historical loss experience is based and to
remove the effects of conditions in the historical period that do not currently exist.
Estimates of changes in future cash flows for groups of assets should reflect and be directionally
consistent with changes in related observable data from period to period (for example, changes
in unemployment rates, property prices, payment status, or other factors indicative of changes
in the probability of losses in the Bank and their magnitude). The methodology and assumptions
used for estimating future cash flows are reviewed regularly by the Bank to reduce any
differences between loss estimates and actual loss experience.
When a loan is uncollectible, it is written off against the related allowance for loan impairment.
Such loans are written off after all the necessary procedures have been completed and the
amount of the loss has been determined. Impairment charges relating to loans and advances to
banks and customers are classified in loan impairment charges whilst impairment charges
relating to investment securities (held to maturity category) are classified in ‘Net gains/ (losses)
on investment securities’.
If in a subsequent period, the amount of the impairment loss decreases and the decrease can
be related objectively to an event occurring after the impairment was recognised (such as an
improvement in the debtor’s credit rating), the previously recognised impairment loss is reversed
by adjusting the allowance account. The amount of the reversal is recognised in the
Income statement.
The Table 8 below shows the non-performing loans and total by industry

50 | P a g e
Guaranty Trust Bank Plc June 2016 Pillar III Disclosures
Table 8: Non-Performing Loans by Industry as at June 30, 2016 and December 31, 2015
Contribution
In thousands of Nigerian Naira Jun-16 Dec-15 Jun-16 Dec-15
Manufacturing 18,544,897 15,668,622 36% 43%
Construction & Real Estate 13,300,958 1,846,360 26% 5%
Info.Telecoms & Transport 7,824,642 1,045,139 15% 3%
Downstream Oil & Gas 4,781,482 6,332,322 9% 17%
Others 3,427,414 5,554,904 7% 15%
Midstream Oil & Gas 1,900,412 485,367 4% 1%
General Commerce 1,173,177 1,771,417 2% 5%
Individual 984,178 960,706 2% 3%
Agriculture - 669,664 0% 2%
Capital Market & Fin. Institution - 2,276,426 0% 6%
Grand Total 51,937,160 36,610,928 100% 100%
Assets classified as available for sale
The Bank assesses at the end of each reporting period whether there is objective evidence that
a financial asset or a group of financial assets is impaired. In the case of equity investments
classified as available for sale, a significant or prolonged decline in the fair value of the security
below its cost is objective evidence of impairment resulting in the recognition of an impairment
loss. If any such evidence exists for available-for-sale financial assets, the cumulative loss –
measured as the difference between the acquisition cost and the current fair value, less any
impairment loss on that financial asset previously recognised in profit or loss – is removed from
equity and recognised in the Income statement. Impairment losses recognised in the Income
statement on equity instruments are not reversed through the Income statement. If, in a
subsequent period, the fair value of a debt instrument classified as available for sale increases
and the increase can be objectively related to an event occurring after the impairment loss was
recognised in profit or loss, the impairment loss is reversed through the Income statement.
Assets classified as available for sale are assessed for impairment in the same manner as assets
carried at amortised cost.
4.6.2 Impairment and provisioning policies
The following policies guide the Bank’s provisioning and impairment:

51 | P a g e
Guaranty Trust Bank Plc June 2016 Pillar III Disclosures
(1) Loan Categorization
All loans and advances are categorized as follows:
Neither past due nor impaired:
These are significant loans and advances where contractual interest or principal payments are
not past due. The credit quality of the portfolio of loans and advances that were neither past due
nor impaired can be assessed by reference to the internal rating system adopted by the Bank.
These are assigned ratings 1-61.
Past due but not impaired:
These are loans and advances where contractual interest or principal payments are past due but
individually assessed as not being impaired. The Bank believes that impairment is not
appropriate on the basis of the level of receivable/security/collateral available and/or the stage
of collection of amounts owed to the Bank. This is assigned rating 71.
Individually impaired:
Individually impaired are loans and advances for which the Bank determines that it is probable
that it will be unable to collect all principal and interest due according to the contractual terms of
the loan/advance agreement(s). These are loans and advances specifically impaired. These are
assigned ratings 8-101.
Collectively impaired:
Collectively impaired are portfolios of homogenous loans and advances where contractual
interest or principal payments are not past due, but have been assessed for impairment by the
Bank. Thus, Loans assessed for collective impairment transverse from ratings 1 to ratings 71.
The following tables 9 & 10 below present a breakdown of the Bank’s Loans and advances based
on the categorization of exposures and impairment taken on them and also by products; as well
as movement in impairment on loans to banks, individuals and non-individuals.
1 Ratings 1 Exceptional capacity
Ratings 2 Very strong capacity
Ratings 3-5 Strong repayment capacity
Ratings 6 Acceptable Risk
Ratings 1-7 Collectively impaired
Ratings 8-10 Individually impaired

52 | P a g e
Guaranty Trust Bank Plc June 2016 Pillar III Disclosures
Table 9a: Loans and Advances and impairment (specific and collective)
Parent
In thousands of Nigerian naira
Loans to
Individual
Loans to non-
Individual
Loans to
Banks Total
Loans to
Individual
Loans to non-
Individual
Loans to
Banks Total
Neither past due nor
impaired 78,291,159 1,124,860,567 27,277 1,203,179,003 63,317,528 1,022,941,662 613,796 1,086,872,986
Past due but not impaired - 730,712 - 730,712 - 2,126,983 - 2,126,983
Individually impaired 984,178 50,222,271 - 51,206,449 960,706 33,523,238 - 34,483,944
Collectively Impaired 20,085,586 190,701,481 3,224 210,790,291 14,178,683 154,467,428 25,285 168,671,396
Gross Loans and Advances 99,360,923 1,366,515,031 30,501 1,465,906,455 78,456,917 1,213,059,311 639,081 1,292,155,309
Less allowances for
impairment:
Individually impaired 29,883 24,230,316 - 24,260,199 138,049 18,781,373 - 18,919,422
Portfolio allowance 1,950,024 33,089,299 664 35,039,987 671,594 6,717,769 264 7,389,627
Total allowance 1,979,907 57,319,615 664 59,300,186 809,643 25,499,142 264 26,309,049
Net Loans and Advances 97,381,016 1,309,195,416 29,837 1,406,606,269 77,647,274 1,187,560,169 638,817 1,265,846,260
Jun-2016 Dec-2015

53 | P a g e
Guaranty Trust Bank Plc June 2016 Pillar III Disclosures
Table 9b: Loans and Advances and impairment (specific and collective) by products
Loans and advances to customers
Parent Parent
Jun-2016 Jun-2016 Dec-2015
Loans to individuals:
Loans 92,935,691 73,176,379
Overdrafts 6,425,232 5,280,538
Others1 - -
Gross loans 99,360,923 78,456,917
Loans (23,452) (137,114)
Overdrafts (6,431) (935)
Others1 - -
Specific impairment (29,883) (138,049)
Loans (851,854) (250,194)
Overdrafts (1,098,170) (421,400)
Others1 - -
Collective impairment (1,950,024) (671,594)
Loans (875,306) (387,308)
Overdrafts (1,104,601) (422,335)
Others1 - -
Total impairment (1,979,907) (809,643)
Loans 92,060,385 72,789,071
Overdrafts 5,320,631 4,858,203
Others1 - -
Carrying amount 97,381,016 77,647,274
Loans to Non-individuals:
Loans 1,165,222,982 1,000,955,826
Overdrafts 144,102,325 162,210,692
Others1 57,189,724 49,892,793
Gross loans 1,366,515,031 1,213,059,311
Loans (23,127,953) (6,979,085)
Overdrafts (1,102,363) (11,802,288)
Others1 - -
Specific impairment (24,230,316) (18,781,373)
Loans (26,095,763) (3,044,577)
Overdrafts (5,655,175) (3,432,667)
Others1 (1,338,361) (240,525)
Collective impairment (33,089,299) (6,717,769)
Loans (49,223,716) (10,023,662)
Overdrafts (6,757,538) (15,234,955)
Others1 (1,338,361) (240,525)
Total impairment (57,319,615) (25,499,142)
Loans 1,115,999,266 990,932,164
Overdrafts 137,344,787 146,975,737
Others1 55,851,363 49,652,268
Carrying amount 1,309,195,416 1,187,560,169
Total carrying amount (individual and non individual) 1,406,576,432 1,265,207,443
1 Others include Usances and Usances Settlement

54 | P a g e
Guaranty Trust Bank Plc June 2016 Pillar III Disclosures
Table 10: Movement in impairment on Loans and Advances to Banks, Individuals and non- Individuals
Movement in Impairment-
Individuals
In thousands of Nigerian Naira
Specific
allowance for
impairment
Collective
allowance for
impairment
Total
allowance for
impairment
Specific
allowance for
impairment
Collective
allowance for
impairment
Total
allowance for
impairment
Balance at 1 January 138,049 671,594 809,643 69,838 611,585 681,423 Foreign currency translation
and other adjustments - - - - - - Increase in impairment
allowances 109,493 1,376,402 1,485,895 714,062 408,911 1,122,973
Reversal of impairment (115,511) (97,972) (213,483) (6,437) (348,902) (355,339)
Reclassifications - - - - - -
Write offs (102,148) - (102,148) (639,414) - (639,414) Impairment of subsidiary
acquired - - - - - -
Balance, end of period 29,883 1,950,024 1,979,907 138,049 671,594 809,643
Movement in Impairment-
Non-Individuals
In thousands of Nigerian Naira
Specific
allowance for
impairment
Collective
allowance for
impairment
Total
allowance for
impairment
Specific
allowance for
impairment
Collective
allowance for
impairment
Total
allowance for
impairment
Balance at 1 January 18,781,373 6,717,769 25,499,142 18,479,842 6,896,906 25,376,748Foreign currency translation
and other adjustments 315 - 315 49 - 49Increase in impairment
allowances 20,045,384 28,881,273 48,926,657 11,486,652 3,394,719 14,881,371
Reversal of impairment (10,721,171) (2,509,743) (13,230,914) (201,193) (3,573,856) (3,775,049)
Reclassifications - - - - - -
Write offs (3,875,585) - (3,875,585) (10,983,977) - (10,983,977)Impairment of subsidiary
acquired - - - - - -
Balance, end of period 24,230,316 33,089,299 57,319,615 18,781,373 6,717,769 25,499,142
Movement in Impairment
in Bank
In thousands of Nigerian Naira
Specific
allowance for
impairment
Collective
allowance for
impairment
Total
allowance for
impairment
Specific
allowance for
impairment
Collective
allowance for
impairment
Total
allowance for
impairment
Ba lance at 1 January - 264 264 - 21 21
Foreign currency trans lation
and other adjustments - - - - - - Increase in impairment
a l lowances - 452 452 - 249 249
Reversa l of impairment - (52) (52) - (6) (6)
Reclass i fications - - - - - -
Wri te offs - - - - - -
Impairment of subs idiary
acquired - - - - - -
- 664 664 - 264 264
Jun-2016 Dec-2015
Jun-2016 Dec-2015
Jun-2016 Dec-2015

55 | P a g e
Guaranty Trust Bank Plc June 2016 Pillar III Disclosures
4.7 Credit Quality
Risk exposures calculated by the standardised approach
As earlier mentioned, the use of the standardised approach for quantifying credit risk involves
the application of risk weights to the exposure types. The risk weights applied are a function of
the credit ratings of the counterparty or the exposures which are made available by External
Credit Assessment Institutions (ECAIs). The credit quality assessment scale assigns a credit
quality step to each rating provided by the ECAIs, as set out in the Table 11 below.
Table 11: Credit Quality Assessment Scale and Risk Weights as specified by CBN
Credit Quality Step Credit Rating Risk Weight
1 AAA to AA- 0%/20%1
2 A+ to A- 20%/50%1
3 BBB+ to BBB- 50%
4-5 BB+ to B- 100%
6 Below B- 150%
Unrated Unrated 100% 1 A risk weight one category less favourable than the sovereign assigned to Banks incorporated in other countries
The Basel II guidance notes on credit risk by the CBN directs banks to use a chosen ECAI and
their external credit assessments consistently for each type of exposure, for both risk weighting
and risk management purposes. However, the Bank only uses the credit ratings of Fitch,
Standard and Poor’s and Moody’s to rate exposures (Placements and balances) to supervised
institutions not in Nigeria and their sovereigns where a rating for the institution is not available.
For other exposures given the unavailability of ratings for them, the CBN has directed Banks to
apply a risk weight of 100% to all corporates exposures while exposures to the Federal
Government of Nigeria, Central Bank of Nigeria, some multilateral development Banks and cash
are to be risk weighted at 0% and a risk weight of 75% to be applied to retail exposures below
N100million and exposures secured by residential mortgages. Table 12 below shows the
exposures, the credit quality step and risk weight applied.

56 | P a g e
Guaranty Trust Bank Plc June 2016 Pillar III Disclosures
Table 12a: Analysis of Exposures with or without CRM and risk weight applied (On-
Balance Sheet)
In thousands of Nigerian Naira Jun-16 Dec-15
Credit Risk exposures/Counterparty
Credit Quality Step/Risk
Weight Exposure
value
Exposure after CRM & on-balance
sheet netting Exposure
value Exposure after
CRM
Central Governments and Central Banks 1
791,561,375
791,561,375
729,525,288
729,525,288
State Govt and Local Authorities
2
3,208,868
3,208,868
3,210,575
3,210,575
Unrated
57,950,114
56,030,990
49,364,351
48,406,641
Supervised Institutions 2
162,273,314
138,929,194
120,431,546
113,082,970
Unrated
12,611,531
12,611,531
5,858,271
5,858,271
Corporate and Other Persons Unrated
1,199,011,296
1,010,292,097
1,076,890,470
913,847,726
Regulatory Retail Portfolio 75%
85,339,874
84,903,870
73,800,562
73,315,225
Secured by Mortgages on Residential Properties 75%
1,975,143
1,975,143
2,189,958
2,189,958
Exposures Secured by Mortgages on Commercial Real Estates Unrated
62,329,841
61,762,641
63,600,918
63,600,918
High Risk Exposures (Unquoted Equity investments) 150%
3,901,551
3,901,551
4,217,135
4,217,135
Unsettled and Failed Transactions 0%
4,885,232
4,885,232
1,584,892
1,584,892
Other Assets
0%
26,865,787
26,865,787
27,097,102
27,097,102
20%
(3,417,573)
- -
19,751,040
-
100%
87,834,275
87,834,275
95,210,453
95,210,453
Total 2,496,330,629 2,284,762,554
2,233,230,481
2,081,147,154

57 | P a g e
Guaranty Trust Bank Plc June 2016 Pillar III Disclosures
Table 12b: Analysis of Exposures with or without CRM and risk weight applied (Off-
Balance Sheet)
4.8 Credit Risk Mitigation The Bank has a lending policy encapsulated in the Credit Policy Guide which prescribes lending
limits to manage credit risk concentration and ensure diversification of its risk assets portfolio. It
maintains borrowing limits for individuals and groups of related borrowers, business lines,
sector/industry, geographical area and rating grade.
The limits are usually recommended annually by Credit Risk Management Group (CRMG) and
approved by the Board. For each industry or economic sector, the set limits are dependent on
regulatory limits, historical performance of the sector as well as the intelligence report on the
outlook of the sector. Limits can however be realigned (by reduction or increase) to meet the
exigencies of the prevailing macroeconomic events subject to appropriate approval.
Other credit risk mitigation techniques include: establishing and enforcing authorisation limits,
including set-off limits; defining exposure levels to counterparties; verifying the creditworthiness
of counterparties that are not parent undertakings; daily monitoring of positions to ensure that
prudential limits are not exceeded and imposing industry / economic sector limits to guard against
concentration risk.
Likewise, in order to comply with the CBN requirements on implementation of Basel II, especially
with the computation of capital adequacy ratio and market disclosure, the Bank invested in two
major software namely: Lead to Loan and OFSAA Basel II solution. These software are
customised to suit the internal processes of GTBank and to interact seamlessly with the bank’s
core banking application. “Lead-to-Loan” is an integrated credit solution software which handles
In thousands of Nigerian Naira
Off Balance sheet
exposures Risk Weight
Credit Equivalent
Amount
Exposure after
CRM
Credit
Equivalent
Amount
Exposure after
CRM
Public Sector 100% 170,115 170,115 170,115 170,115
Supervised
Institutions (DMBs,
Discount Houses in 100% 300,283 174,401 1,207,210 232,097
Corporates 100% 307,695,288 299,484,504 354,643,021 320,049,118
Retail Portfolios 75% 1,112,191 1,101,579 1,036,748 613,313
Total 309,277,878 300,930,599 357,057,093 321,064,642
Dec-15Jun-16

58 | P a g e
Guaranty Trust Bank Plc June 2016 Pillar III Disclosures
credit customers’ profiles, rating scores, documents and collateral management, credit workflow
processes, disbursement, recoveries and collection. The deployment of ‘Lead to Loan’ has
further enhanced the credit processes of the Group and guarantee data integrity towards
achieving the CBN required sets of disclosures.
Credit Collaterals
As discussed in details under Notes 4 (Financial Risk Management) in our Financial Statements
for June 2016, the Bank ensures that each credit is reviewed and granted based on the strength
of the borrowers’ cash flow. However, the Bank also ensures its credit facilities are well secured
as a second way out. The policies that guide collateral for facilities are embedded within the
Bank’s credit policy guide. These include the following policy statements amongst others:
Loans to individuals or sole proprietors must be secured by tangible, marketable collateral that
has a market value that is supported by a valuation report from a registered estate valuer who is
acceptable to the Bank. The collateral must also be easy to check and easy to dispose of. This
collateral must be in the possession of, or pledged to, the Bank. Client’s account balances must
be within the scope of cover provided by its collateral. All collateral offered must have the
following attributes:
There must be good legal title
The title must be easy to transfer
It should be easy and relatively cheap to value
The value should be appreciating or at least stable
The security must be easy to sell.
All collateral must be protected by insurance. Exceptions include cash collateral, securities in
safe keeping, indemnity or guarantees, or where our interest is general (for instance in a negative
pledge). The insurance policy has to be issued by an insurer acceptable to the Bank. All cash
collateralized facilities shall have a 20% margin to provide cushion for interest and other charges
i.e. only 80% of the deposit or cash collateral may be availed to an obligor. The main collateral
types acceptable to the Bank for loans and advances include:
Mortgages over residential properties
Charges over business premises, fixed and floating assets as well as inventory.
Charges over financial instruments such as equities, treasury bills etc.
The Basel II guidelines restrict eligible financial collaterals for credit risk mitigation to just cash,
gold, debt securities, equities with applicable standard supervisory haircuts as shown in table 13
below and credit protection from guarantees which the Bank has adopted for computation of risk
weighted assets under credit risk.

59 | P a g e
Guaranty Trust Bank Plc June 2016 Pillar III Disclosures
Table 13: Eligible financial collaterals and standard supervisory haircuts
Issue rating by ECAI for debt securities
Residual Maturity
Sovereigns (%)
Other issuers (%)
AAA to AA-/A-1 (long and short positions), FGN bonds & T-bills and State Government bonds
=< 1 year 0.5 1
>1 year, < 5 2 4
years
> 5 Years 4 8
A+ to BBB-/ A-2/A-3/P-3 and unrated bank securities
=< 1 year 1 2
>1 year, < 5 3 6
years
> 5 Years 6 12
BB+ to BB- 15 NA
Main index equities (including convertible bonds) and Gold
15
Other equities (including convertible bonds) listed on a recognized exchange.
25
Cash in the same currency 0
The fair values of collaterals are based upon last annual valuation undertaken by independent
valuers on behalf of the Bank. The valuation techniques adopted for properties are based upon
fair values of similar properties in the neighbourhood taking into cognizance the advantages and
disadvantages of the comparatives over the subject property and any other factor which can
have effect on the valuation e.g. subsequent movements in house prices, after making allowance
for dilapidations. The fair values of non-property collaterals (such as equities, bond, treasury
bills, etc.) are determined with reference to market quoted prices or market values of similar
instrument.
The same fair value approach is used in determining the value of the collaterals in the course of
sale or realisation. The Bank does not take physical possession of properties or other assets
held as collateral and it uses external agents to realise the value as soon as practicable,
generally at auction, to settle indebtedness. Any surplus funds are returned to the borrower.
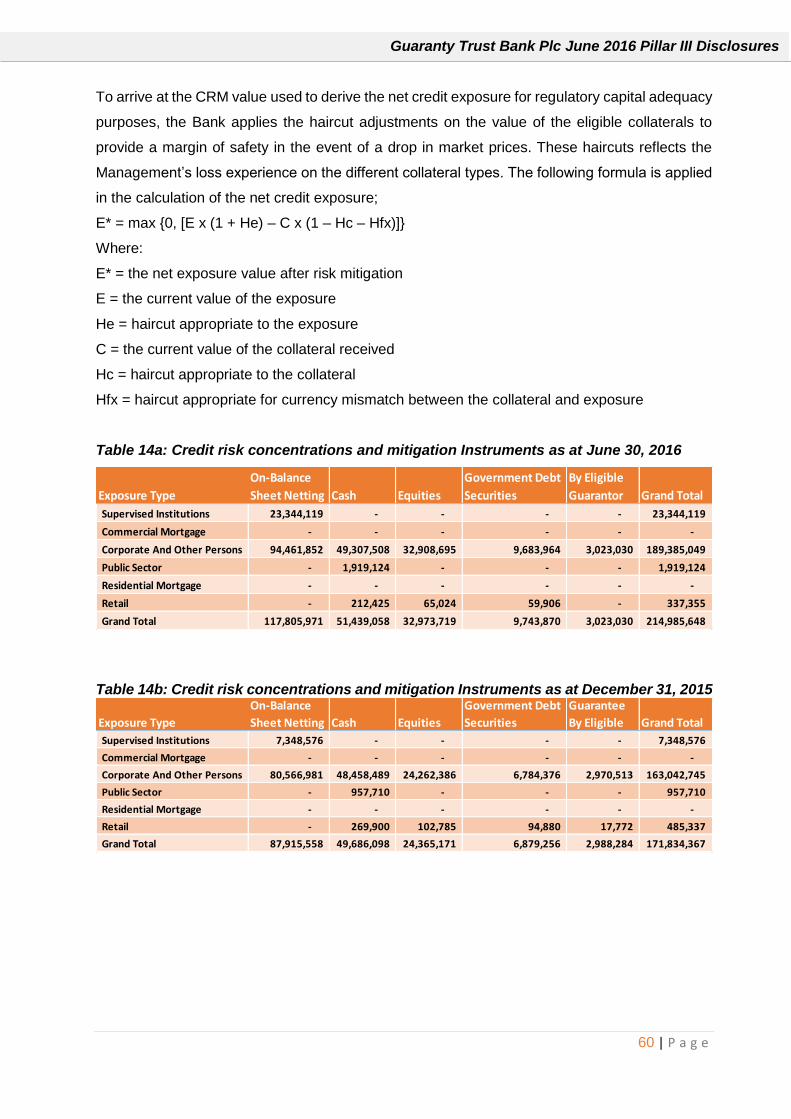
60 | P a g e
Guaranty Trust Bank Plc June 2016 Pillar III Disclosures
To arrive at the CRM value used to derive the net credit exposure for regulatory capital adequacy
purposes, the Bank applies the haircut adjustments on the value of the eligible collaterals to
provide a margin of safety in the event of a drop in market prices. These haircuts reflects the
Management’s loss experience on the different collateral types. The following formula is applied
in the calculation of the net credit exposure;
E* = max {0, [E x (1 + He) – C x (1 – Hc – Hfx)]}
Where:
E* = the net exposure value after risk mitigation
E = the current value of the exposure
He = haircut appropriate to the exposure
C = the current value of the collateral received
Hc = haircut appropriate to the collateral
Hfx = haircut appropriate for currency mismatch between the collateral and exposure
Table 14a: Credit risk concentrations and mitigation Instruments as at June 30, 2016
Table 14b: Credit risk concentrations and mitigation Instruments as at December 31, 2015
Exposure Type
On-Balance
Sheet Netting Cash Equities
Government Debt
Securities
Guarantee
By Eligible
Guarantor Grand Total
Supervised Institutions 23,344,119 - - - - 23,344,119
Commercial Mortgage - - - - - -
Corporate And Other Persons 94,461,852 49,307,508 32,908,695 9,683,964 3,023,030 189,385,049
Public Sector - 1,919,124 - - - 1,919,124
Residential Mortgage - - - - - -
Retail - 212,425 65,024 59,906 - 337,355
Grand Total 117,805,971 51,439,058 32,973,719 9,743,870 3,023,030 214,985,648
Exposure Type
On-Balance
Sheet Netting Cash Equities
Government Debt
Securities
Guarantee
By Eligible Grand Total
Supervised Institutions 7,348,576 - - - - 7,348,576
Commercial Mortgage - - - - - -
Corporate And Other Persons 80,566,981 48,458,489 24,262,386 6,784,376 2,970,513 163,042,745
Public Sector - 957,710 - - - 957,710
Residential Mortgage - - - - - -
Retail - 269,900 102,785 94,880 17,772 485,337
Grand Total 87,915,558 49,686,098 24,365,171 6,879,256 2,988,284 171,834,367

61 | P a g e
Guaranty Trust Bank Plc June 2016 Pillar III Disclosures
Table 15a: Exposure values covered by eligible financial collaterals and guarantees as at June 30, 2016
In thousands of Nigerian Naira Jun-16
Credit Risk exposures/Counterparty Gross Exposure
Exposures covered by eligible collaterals
(excluding On-balance sheet
netting)
Exposures covered by guarantees
Central Governments and Central Banks 791,561,375 - -
State Government and Local Authorities 61,158,982 57,950,114 -
Supervised Institutions 174,884,845 - -
Corporate and Other Persons 1,199,011,296 331,909,106 3,493,546
Regulatory Retail Portfolio 85,339,874 746,353 -
Secured by Mortgages on Residential Properties 1,975,143 - -
Exposures Secured by Mortgages on Commercial Real Estates 62,329,841 - -
High Risk Exposures (Unquoted Equity investments) 3,901,551 - -
Unsettled and Failed Transactions 4,885,232 - -
Other Assets 111,282,490 - -
Total 2,496,330,629 390,605,572 3,493,546
Off Balance sheet exposures
Public Sector Entities 170,115 - -
Supervised Institutions (DMBs, Discount Houses, etc) 300,283 300,283 -
Corporates 487,258,285 427,293,491 -
Retail Portfolios 1,114,504 1,109,879 -
Total 488,843,186 428,703,652 -
Grand total 2,985,173,815 819,309,224 3,493,546

62 | P a g e
Guaranty Trust Bank Plc June 2016 Pillar III Disclosures
Table 15b: Exposure values covered by eligible financial collaterals and guarantees as at December 31, 2015
In thousands of Nigerian Naira Dec 2015
Credit Risk exposures/Counterparty Gross Exposure
Exposures covered by eligible collaterals
(excluding On-balance sheet
netting) Exposures covered
by guarantees
Central Governments and Central Banks
729,525,288 - -
State Govt and Local Authorities
52,574,926 49,364,351 -
Supervised Institutions
126,289,817 - -
Corporate and Other Persons
1,076,890,470 252,516,522 3,065,990
Regulatory Retail Portfolio
73,800,562 921,964
Secured by Mortgages on Residential Properties
2,189,958 - -
Exposures Secured by Mortgages on Commercial Real Estates
63,600,918 - -
High Risk Exposures (Unquoted Equity invesments)
4,217,135 - -
Unsettled and Failed Transactions
1,584,892 - -
Other Assets
102,556,515 - -
Total
2,233,230,481 302,802,836 3,065,990
Off Balance sheet exposures
Public Sector Entities
170,115 - -
Supervised Institutions (DMBs, Discount Houses, etc)
2,056,441 2,056,441 -
Corporates
524,118,003 450,857,460 -
Retail Portfolios
1,039,060 1,034,435,333 -
Total
527,383,620 1,487,349,234 -
Grand total
2,760,614,100 1,790,152,071 3,065,990

63 | P a g e
Guaranty Trust Bank Plc June 2016 Pillar III Disclosures
5 Operational Risk
5.1 Overview Operational Risk is the risk of loss resulting from inadequate or failed internal processes, people
and systems and from external events. Operational risk is categorized into the following risk
categories:
People risk
Process risk
System risk
External event risk
Risk Appetite and Acceptance Criteria
The Bank’s operational risk appetite as set for key categories of operational risk event is
as defined below:
Table 16 – Operational Risk Appetite
S/N Operational Risk Parameter Threshold
1 Fraud & Forgeries 1% of Gross Income
2 Legal Settlements 1% of Gross Income
3 Damage to Physical Assets -
All other OpsRisk Exposure ≤ 3% of
Gross Income
4 Business Disruption Issues -
5 Occupational Health & Safety
(OHS) Issues
6 Fines & Penalties -
Total Operational Risk Loss 5% of Gross Income
5.2 Operational Risk Capital
The Bank adopts the Standardized Approach for estimating capital charge for internal capital
assessment. This involves mapping the business activities into the eight (8) Basel defined
business lines as applicable.
Under this approach, the capital requirement for operational risk is an average of gross income
for each business line over the last three years and weighted on the basis of the beta
percentages applicable to them.

64 | P a g e
Guaranty Trust Bank Plc June 2016 Pillar III Disclosures
The Bank’s operations five out of the eight Basel defined business lines as depicted in Table 17
below:
Table 17 – Basel Business lines and Beta factor
BASEL BUSINESS LINES BREAK DOWN GTBANK
BETA FACTOR (%)
Corporate Finance
Corporate Finance Corporate Finance
18
Government Finance Public Sector
Merchant Banking Energy, Telecoms, Corporate Bank
Advisory Services
Trading and Sales
Sales
Treasury 18 Market Making
Proprietary Positions
Treasury
Payments and Settlement
Settlement 18
Retail Banking
Retail Banking Retail Banking / SME / E-Business
12 Private Banking
Card Services
Commercial Banking Commercial Banking Commercial Banking 15
The bank’s capital charge for operational risk is thus expressed as:
Krq = {∑years1-3max [∑ (GI1-3*β1-3), 0]}/3
Where:
Krq = Capital charge required
GI1-3 = Annual gross income in a given year for three (3) business lines in table above.
β1-3 = Fixed Beta factor in percentages for the business lines
For regulatory capital assessment, the bank uses the Basic Indicator Approach (BIA) in which
the bank calculates its regulatory capital requirement by multiplying an indicator of the bank's
volume of business, net income, by a specified regulatory percentage (15%) using the formula
below.
KBIA = [𝑮𝒍𝒊….𝜼∗𝜶]∕𝜼
Where:
KBIA = the capital charge under the Basic Indicator Approach
Gl = positive annual gross income for the previous three years
𝜂 = number of the previous three years for which gross income is positive

65 | P a g e
Guaranty Trust Bank Plc June 2016 Pillar III Disclosures
𝜶 =15%
i.e. average over the previous three years of a fixed percentage of positive annual gross income.
Gross income is computed in line with the regulatory description as;
Gross income under this guideline includes the sum of a bank’s
Net interest income, and
Net non-interest income;
All of which shall be gross of:
Any provisions (example unpaid interest); and write-offs made during the year
Any operating expenses, including fees paid to outsourcing service providers; in addition
to fees paid for services that are outsourced, fees received by banks that provide
outsourcing services shall be included in the definition of gross income
But shall exclude;
Realized or unrealized profits/losses from the sale or impairment of securities in the banking
book;
Extraordinary or irregular items;
Income derived from insurance recoveries.
exclude reversal during the year in respect of provisions and write-offs made during the
previous year(s);
exclude income from legal settlements in favour of the bank;

66 | P a g e
Guaranty Trust Bank Plc June 2016 Pillar III Disclosures
6 Market Risk The Bank’s exposure to market risk comprises interest rate risk (trading & banking book) and
foreign exchange risk as detailed below in Table 18:
Table 18: Market Risk Components
Market Risk Composition Risk Weight (%) Comments
A. Interest Rate Risk
1. Trading Book
Interest Rate Risk - General (Trading FGN
– Treasury Bills (TB) & Bonds)
As defined within
the zones based
on the maturity
bands
Capitalised
Interest Rate Risk - Specific ( Trading FGN
- TB & Bonds) 0
Not
capitalised
2. Banking Book
Earning at Risk (Discounted Earning
Impact). To enable management ascertain
the likely impact on earnings if interest rate
changes are not properly managed. In
doing this, the gap between the rate
sensitive assets and liabilities are multiplied
by volatility/interest rate change & roll over
periods/intervals of 30days and divided by
the period covered/horizon of 365 days.
The outcome is multiplied by a discount
factor.
0
Not
Capitalised
B. Foreign
Exchange Risk
It is the higher of foreign currency position
(long & short) throughout the Bank. 15
Capitalised
To determine the required capital for these risks, the Bank employs a building block approach
by aggregating the individual capital requirement for each of the risks aforementioned.
Interest Rate Risk: This is the risk of loss to the Bank’s earnings and capital as a result of
adverse movements in market prices and rates. Interest rate risk can arise from mismatch / re-

67 | P a g e
Guaranty Trust Bank Plc June 2016 Pillar III Disclosures
pricing risk, basis risk, prepayment or extension risk and yield curve risk. Adverse movement in
interest rates may potentially impact the Bank’s reported earnings and capital through its interest
income, interest expense, the present and future market value of the Bank’s trading books and
the present and future value of the Bank’s cash flows.. To calculate the capital requirement for
the interest rate risk on the trading book, the Bank uses the maturity method of Basel II
Standardized Approach.
The use of Earnings at Risk (EaR) to measure interest rate risk in the banking book helps the
Bank determine how much the Bank’s margin could change given a change in interest rates. It
is a tool that measures short-term interest rate risk by projecting the change in interest income
12-month into the future.
The tables 19 & 20 below shows the changes that would impact the income statement after
carrying out interest rate sensitivities and provides further information on the breakdown by main
currencies:

68 | P a g e
Guaranty Trust Bank Plc June 2016 Pillar III Disclosures
Table 19a: Interest Rate Sensitivity (Fair value and Cash flow Interest rate) on Statement
of financial Position for June 30, 2016
In thousands of Nigerian naira Jun-16 Jun-16
Pre-tax Post-tax
TOTAL TOTAL
Decrease
Assets
Cash and cash equivalents (258,780) (222,292)
Loans and Advances to Banks (72) (62)
Loans and Advances to Customers (6,328,883) (5,436,510)
Financial assets held for trading (63,012) (54,127)
Investment Securities (1,533,675) (1,317,427)
Assets pledged as collateral (302,250) (259,632)
(8,486,672) (7,290,051)
Liabilities
Deposit from banks 9,107 7,823
Deposit from customers 7,842,821 6,736,983
Financial liabilities held for trading 9,724 8,353
Debt securities - -
Other borrowed funds 1,576,655 1,354,346
9,438,306 8,107,505
Total 951,634 817,454
Increase
Assets
Cash and cash equivalents 258,780 222,292
Loans and Advances to Banks 72 62
Loans and Advances to Customers 6,328,883 5,436,510
Financial assets held for trading 63,012 54,127
Investment Securities 1,533,675 1,317,427
Assets pledged as collateral 302,250 259,632
8,486,672 7,290,051
Liabilities
Deposit from banks (9,107) (7,823)
Deposit from customers (7,842,821) (6,736,983)
Financial liabilities held for trading (9,724) (8,353)
Debt securities - -
Other borrowed funds (1,576,655) (1,354,346)
(9,438,306) (8,107,505)
TOTAL (951,634) (817,454)

69 | P a g e
Guaranty Trust Bank Plc June 2016 Pillar III Disclosures
Table 19b: Interest Rate Sensitivity (Fair value and Cash flow Interest rate) on Statement
of financial Position for December 31, 2015
In thousands of Nigerian naira Dec-15 Dec-15
Pre-tax Post-tax
TOTAL TOTAL
Decrease
Assets
Cash and cash equivalents (600,570) (502,045)
Loans and Advances to Banks (6,387) (5,340)
Loans and Advances to Customers (12,327,567) (10,305,202)
Financial assets held for trading (161,739) (135,205)
Investment Securities (3,199,141) (2,674,315)
Assets pledged as collateral (572,463) (478,549)
(16,867,867) (14,100,655)
Liabilities
Deposits from banks 3,180 2,658
Deposits from customers 14,714,048 12,300,175
Financial liabilities held for trading 32,456 27,132
Debt securities issued - -
Other borrowed funds 3,187,526 2,664,605
17,937,210 14,994,570
Total 1,069,343 893,915
Increase
Assets
Cash and cash equivalents 600,570 502,045
Loans and Advances to Banks 360 301
Loans and Advances to Customers 12,333,594 10,310,240
Financial assets held for trading 161,738.6 135,205
Investment Securities 3,199,141 2,674,315
Assets pledged as collateral 572,462.7 478,549
16,867,866 14,100,654
Liabilities
Deposits from banks (3,180) (2,658)
Deposits from customers (14,714,048) (12,300,175)
Financial liabilities held for trading (32,456) (27,132)
Debt securities issued - -
Other borrowed funds (3,187,526) (2,664,605)
(17,937,210) (14,994,570)
Total (1,069,344) (893,916)

Table 20a: Financial Instrument by Currency for June 30 2016
Parent
Jun-2016
In thousands of Nigerian Naira Total Naira USD GBP Euro Others
Cash and cash equivalents 266,940,752 117,425,190 112,869,064 18,229,678 17,888,413 528,407
Loans and advances to banks 29,837 29,276 561 - - -
Loans and advances to customers 1,406,576,432 657,490,937 749,067,799 385 17,311 -
Financial assets held for trading 7,247,621 7,247,621 - - - -
Derivative financial assets 465,129 442,181 - - 22,948 -
Investment securities:
– Available for sale 290,322,177 280,280,721 10,041,456 - - -
– Held to maturity 3,208,868 3,208,868 - - - -
Assets pledged as collateral 61,592,845 61,592,845 - - - -
Restricted deposits and other assets1 377,208,025 353,863,906 21,195,014 203,684 1,945,421 -
2,413,591,686 1,481,581,545 893,173,894 18,433,747 19,874,093 528,407
Deposits from banks 158,087 158,087 - - - -
Deposits from customers 1,700,295,053 1,280,119,195 397,920,041 13,544,315 8,710,678 824
Derivative financial liabilities 398,493 - 398,493 - - -
Other borrowed funds 312,388,240 94,461,852 217,926,388 - - -
Other liabilities2 101,663,576 77,147,344 20,123,225 242,478 4,149,441 1,088
2,114,903,449 1,451,886,478 636,368,147 13,786,793 12,860,119 1,912
Financial Instrument Gap 298,688,237 29,695,067 256,805,747 4,646,954 7,013,974 526,495
1 Excludes prepayments 2 Excludes Deferred Income and impact of currency pos i tion
The above table does not give complete representation of the On-Balance sheet gap of the Parent in terms of currency (foreign and local currencies) because non Financial
Instruments items are not taken into consideration in this disclosure as it falls outside the IFRS 7 disclosure requirement. On the Asset side Property, Plant & Equipment,
Intangible Assets and Prepayment are not included while on the Liability side, Deferred Income, Tax Payable and Deferred Tax and Positions have also been excluded.

71 | P a g e
Guaranty Trust Bank Plc June 2016 Pillar III Disclosures
Table 20b: Financial Instrument by Currency for December 31 2015
Parent
Dec-2015
Financial instruments by currency
In thousands of Nigerian Naira Total Naira USD GBP Euro Others
Cash and cash equivalents 173,133,109 60,900,361 86,803,401 16,303,440 8,774,840 351,067
Loans and advances to banks 638,817 616,350 22,467 - - -
Loans and advances to customers 1,265,207,443 682,221,754 582,341,419 312 643,887 71
Financial assets held for trading 25,075,618 25,075,618 - - - -
Investment securities:
– Available for sale 327,585,822 321,727,551 5,858,271 - - -
– Held to maturity 3,210,575 3,210,575 - - - -
Assets pledged as collateral 61,946,270 61,946,270 - - - -
Restricted deposits and other assets1 286,317,708 278,969,132 6,357,038 230,468 761,070 -
2,143,115,362 1,434,667,611 681,382,596 16,534,220 10,179,797 351,138
Deposits from banks 39,941 39,941 - - - -
Deposits from customers 1,422,550,125 1,161,931,095 244,302,305 10,700,273 5,615,953 499
Derivative financial liabilities - - - - - -
Other borrowed funds 338,580,300 80,566,981 258,013,319 - - -
Other liabilities2 85,088,484 75,558,016 8,546,614 230,463 752,325 1,066
1,846,258,850 1,318,096,033 510,862,238 10,930,736 6,368,278 1,565
Financial Instrument Gap 296,856,512 116,571,578 170,520,358 5,603,484 3,811,519 349,573
1Excludes prepayments 2 Excludes Deferred Income and impact of currency position
The above table does not give complete representation of the On-Balance sheet gap of the Parent in terms of currency (foreign and local currencies) because non Financial
Instruments items are not taken into consideration in this disclosure as it falls outside the IFRS 7 disclosure requirement. On the Asset side Property, Plant & Equipment,
Intangible Assets and Prepayment are not included while on the Liability side, Deferred Income, Tax Payable and Deferred Tax and Positions have also been excluded.
Foreign Exchange Risk: Foreign Exchange risk arises when fluctuations in the exchange rates
of the Bank’s foreign currencies assets and liabilities impact its earnings and capital. Foreign
Exchange risk has been considered as either transactional (occurs when exchange rate changes
unfavourably) or translational (balance sheet exposure that results from the consolidation of
financial statements of subsidiaries abroad into the ‘’home currency’’. The Bank’s Foreign
Exchange Risk is measured in two ways;
Use of the Net Open Foreign Exchange position of the Bank
Use of Liquidity Gaps in the currency used for business activities by the Bank.
However, for the purpose of calculating its capital requirements, the Bank measures its foreign
exchange risk using the Standardized Approach. This process involves determining the Bank’s
net open position in foreign currency calculated according to Short-hand Method and then
multiplying the net open position by market risk capital charge factor of 8%
As mentioned earlier, the Bank’s detailed computation of its Risk Weighted Assets (RWA) for
credit, market and operational risks and its Capital Adequacy Ratio is rendered to Central Bank
of Nigeria (CBN) on a monthly basis in line with CBN.

73 | P a g e
Guaranty Trust Bank Plc June 2016 Pillar III Disclosures
7 Equity exposures: disclosures for banking book positions.
7.1 Overview Equity risk refers to risk of losses arising from negative changes in the fair value of the long term
equity investment portfolio.
The equity investments in the banking book are largely holding of investment in the Bank’s
subsidiaries. Equity investments in subsidiaries are held at historical cost and are in the
Consolidated Financial Statements.
The Bank also invested in unquoted equity securities in compliance with the Central Bank of
Nigeria’s directive in 2006 to Deposit Money Banks’ to set aside a specified portion of their Profit
after Tax for investment in Small and Medium Enterprises. The impact of the unquoted equity
risk in the banking book is deemed immaterial as it constitutes only 0.1 per cent of the balance
sheet. Unquoted equity securities are designated as Available for sale instruments and are
measured at fair value in line with IAS 39. They are measured at cost less impairment where fair
value is not easily determinable.
7.2 Description of the valuation Methodology
Discounted Cash flow Technique (DCF)
The fair value of the other unquoted equity securities were derived using the Discounted Cash
Flow technique of the income approach. The steps involved in estimating the fair value of the
Bank’s investment in each of the investees (i.e. unquoted equity securities) are as follows:
Step 1: A five-year forecast of the Free Cash Flow to the Firm (FCFF) for each of the equity
investments was made (see (a) below for the definition, explanation and derivation of
FCFF).
Step 2: The yearly FCFF forecasts were discounted to present value using the company’s
WACC. (See (b) below for the definition, explanation and derivation of WACC).
Step 3: The terminal value at year five was estimated by dividing the compounded (with ‘g’) -
year five FCFF by the capitalization rate (please see (c) below) Step 4: The terminal value was
discounted to present value using the company’s WACC
Step 5: The firm value was obtained by adding the present value of the five-year FCFF obtained
in step (2) above to the present value of terminal value obtained in step (4) above.

74 | P a g e
Guaranty Trust Bank Plc June 2016 Pillar III Disclosures
Step 6: The equity value of the firm was obtained by deducting the value of the debt of the
company from the firm value obtained in step (5) above (i.e. Firm value minus market
value of debt = Equity value)
Step 7: The equity value per share was obtained by dividing the Equity value obtained in step
(6) above by the number of shares outstanding in the company.
Step 8: The fair value of the Bank’s investment in each of the relevant unquoted equity securities
was derived by multiplying the number of the Banks’ shares in the investee by the value
per share obtained in step (7) above.
a. Free Cash flow to the Firm (FCFF):
A measure of financial performance that expresses the net amount of cash that is
generated for the firm, consisting of expenses, taxes and changes in net working capital
and investments. Free cash flow to the firm is the cash available to all investors, both
equity and debt holders.
FCFF = NI + NCC + [Int x (1-tax rate)] – Changes in FCInv – Changes in WCInv
Where:
NI = Net Income
NCC = Non-Cash Charges
Int = Interest
T= tax rate
FCI = Fixed Capital Investment
WCI = Working Capital Investment
b. Weighted average Cost of Capital (WACC):
This is the average cost of both equity and debt capital used in financing a business.
WACC= {(D/D+E) x Kd(1-T)} + {(E/D+E) x Ke }
Where:
D = Value of Debt
E = Equity value
Ke = Cost of equity
Kd = Cost of debt
T = Tax rate
c. Capitalization Rate= WACC – g
Terminal value = (FCFF5 *(1+g))/ (WACC – g)

75 | P a g e
Guaranty Trust Bank Plc June 2016 Pillar III Disclosures
Where:
FCFF = Year5 FCFF
g = Growth rate
WACC = Weighted average Cost of Capital
Valuation Assumptions – Discounted Cash flow
1. Risk free rate (Rf) = 11.01% yield on 10-year Federal Government of Nigeria Bond
2. Beta = 1 or Less than 1.
3. Market premium = 6% based on trend analysis and research of market premiums
across the globe by Aswath Damodaran.
4. Growth rate used is growth rate in earnings between the latest year and prior period.
It is important to note that some unquoted equities were carried at cost less impairment as there
are no audited internal data (financial statements) that can be used for the purpose of fair
valuation.
Table 21: Unquoted Equities: Value disclosed in the balance sheet and fair value
In thousands of Nigerian naira Jun-16 Dec-15
Fair Value 3,763,386 3,608,972
Cost less Impairment 138,164 608,163
Carrying Amount as per Balance Sheet 3,901,550 4,217,135
Table 22: Unquoted Equities: Unrealized Gains/ Losses recognized in Other
Comprehensive Income
In thousands of Nigerian naira Jun-16 Dec-16
Historical cost (2,415,699) (2,415,699)
Fair Value 4,271,402 4,116,988
Unrealized Fair Value Gain recognized in Equity (OCI) 1,855,703 1,701,289 Fair value gains/losses included in Tier 2 capital = N1, 855,703,000


