
H12021 RESULTS

1
SOGECLAIR is a leading supplier of technological solutions and products withhigh added-value in the transportation industry (air and ground)
SOGECLAIR is a family company listed on Euronext Paris
2020Restructuring following the
Covid-19 crisis
2021« One SOGECLAIR »
Strategic plan
2019Entry into the capital of KEY’S
(6.4% of the capital –74 « Key people »)
2018Set up in Asia Pacific
2013-2015Set up in North America
2001 – 2005Set up in Europe
1998SOGECLAIR creation to lead the
companies development
created in 1962
1986Listed on the
Paris Stock Exchange
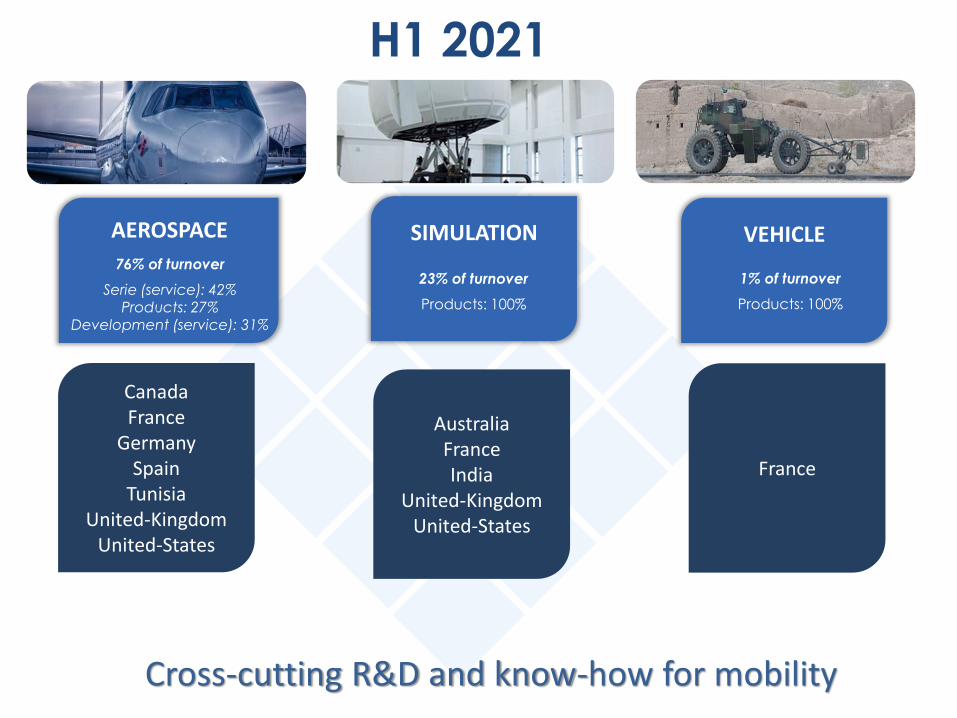
Cross-cutting R&D and know-how for mobility
AEROSPACE
76% of turnover
Serie (service): 42%Products: 27%
Development (service): 31%
SIMULATION
23% of turnover
Products: 100%
VEHICLE
1% of turnover
Products: 100%
CanadaFrance
GermanySpain
TunisiaUnited-Kingdom
United-States
AustraliaFranceIndia
United-KingdomUnited-States
France
H1 2021
www.sogeclair.com
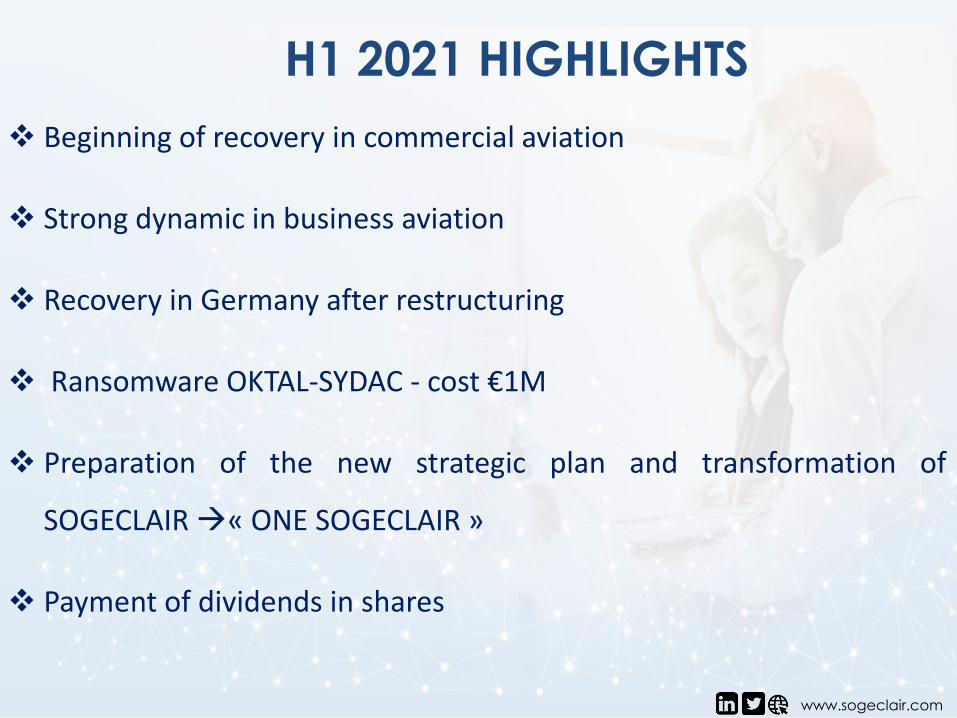
H1 2021 HIGHLIGHTS
Beginning of recovery in commercial aviation
Strong dynamic in business aviation
Recovery in Germany after restructuring
Ransomware OKTAL-SYDAC - cost €1M
Preparation of the new strategic plan and transformation of
SOGECLAIR« ONE SOGECLAIR »
Payment of dividends in shares

MARKETS H1 2021
Aeronautics and Space: 73% of turnover (- 12%)
Commercial aeronautic (25% of turnover) decreases by 46.9%: IATA (airlinescompanies) forecasts a return to the pre-crisis situation between 2023 and 2025.World air traffic is decreasing by 28.6% in August compared to 2020. Large aircraft and turboprop engines aircrafts are recovering more slowly than
single-aisle aircraft which see their production rates increase to exceed their pre-crisis level by 2023.
Business aviation (44% of turnover) increases by 35.3%: the higher traffic thanbefore the crisis (-1% in Europe and +18% in the USA) and the competition betweenmanufacturers are supporting the market.
Space (4% of turnover) increases by 16.3%: the needs in terms oftelecommunications and observation are strongly supported by public and privateinvestment.
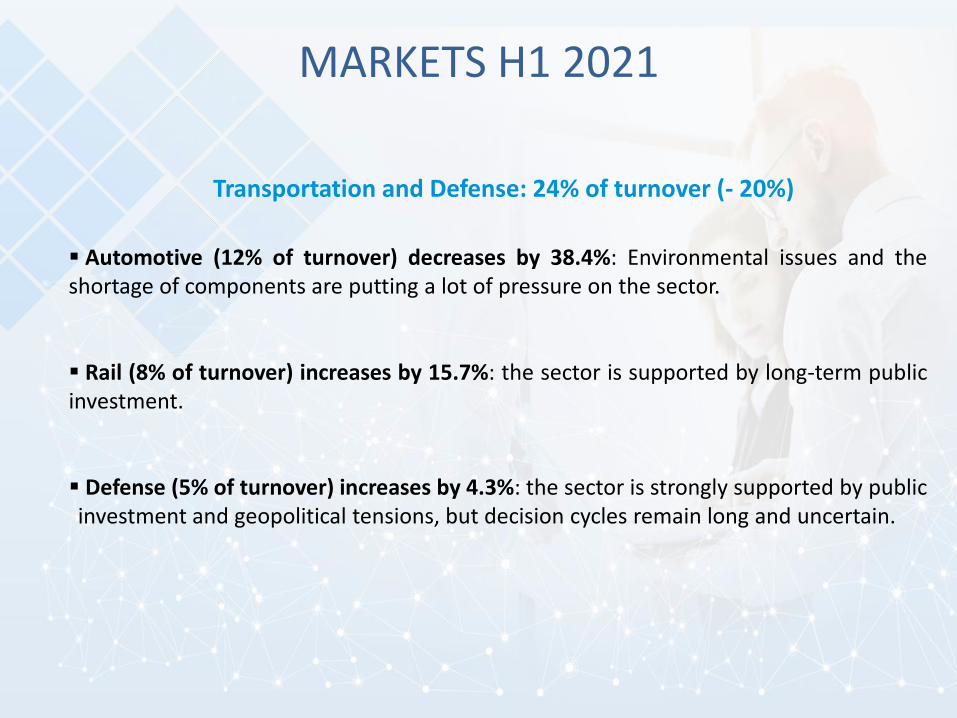
MARKETS H1 2021
Automotive (12% of turnover) decreases by 38.4%: Environmental issues and theshortage of components are putting a lot of pressure on the sector.
Rail (8% of turnover) increases by 15.7%: the sector is supported by long-term publicinvestment.
Defense (5% of turnover) increases by 4.3%: the sector is strongly supported by publicinvestment and geopolitical tensions, but decision cycles remain long and uncertain.
Transportation and Defense: 24% of turnover (- 20%)

H1 2021 RESULTS
www.sogeclair.com
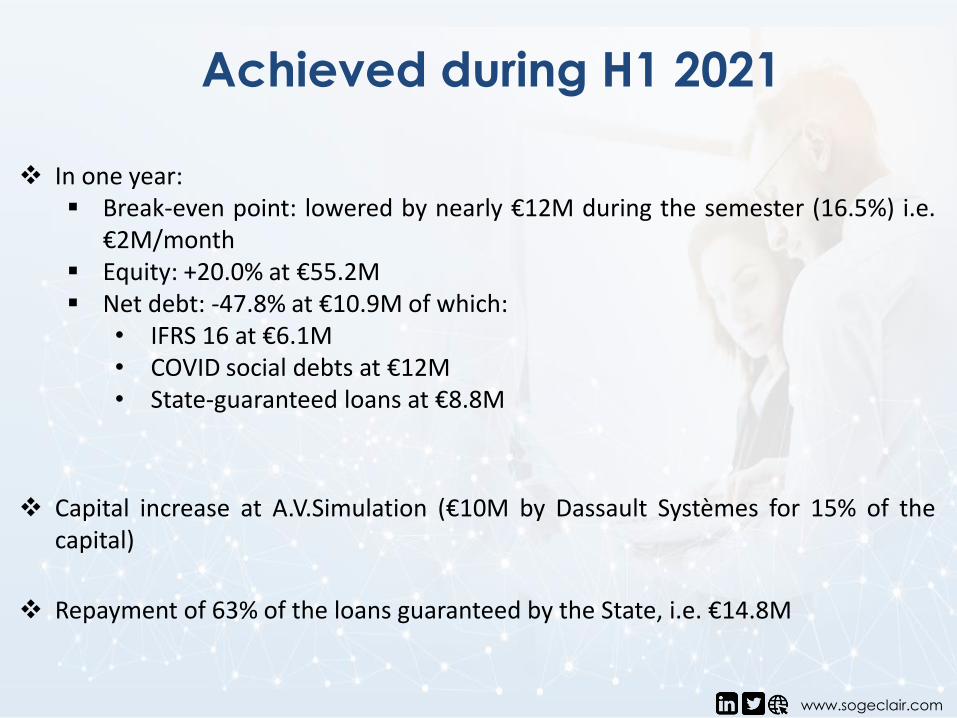
Achieved during H1 2021
In one year: Break-even point: lowered by nearly €12M during the semester (16.5%) i.e.
€2M/month Equity: +20.0% at €55.2M Net debt: -47.8% at €10.9M of which:
• IFRS 16 at €6.1M• COVID social debts at €12M• State-guaranteed loans at €8.8M
Capital increase at A.V.Simulation (€10M by Dassault Systèmes for 15% of thecapital)
Repayment of 63% of the loans guaranteed by the State, i.e. €14.8M
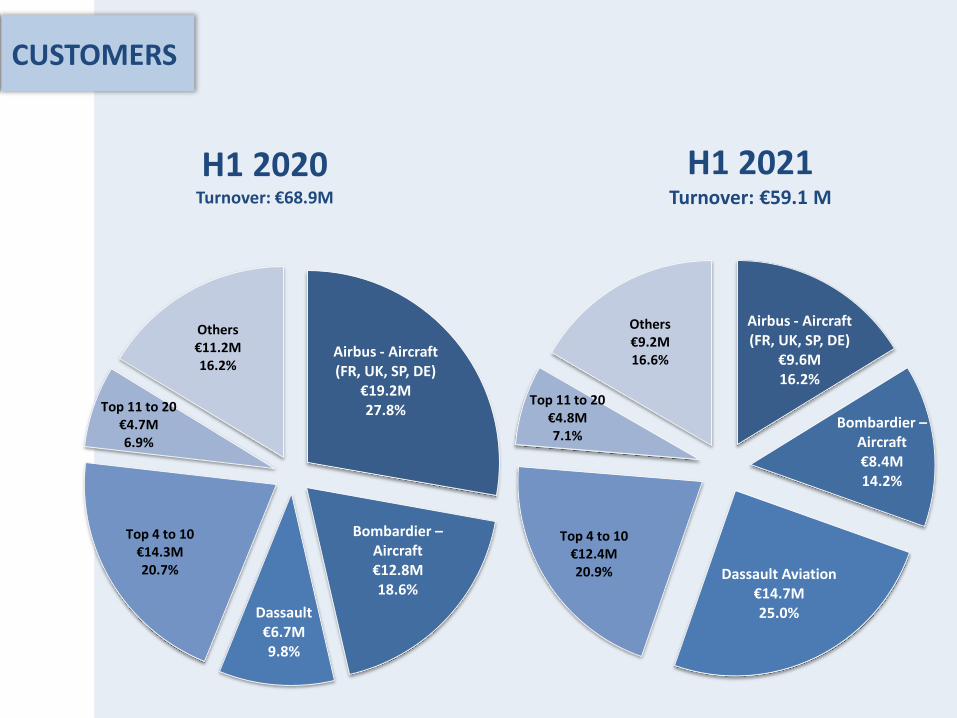
CUSTOMERS
H1 2021Turnover: €59.1 M
H1 2020Turnover: €68.9M
Airbus - Aircraft (FR, UK, SP, DE)
€19.2M27.8%
Bombardier –Aircraft€12.8M18.6%
Dassault€6.7M 9.8%
Top 4 to 10€14.3M20.7%
Top 11 to 20€4.7M6.9%
Others€11.2M16.2%
Airbus - Aircraft (FR, UK, SP, DE)
€9.6M16.2%
Bombardier –Aircraft€8.4M14.2%
Dassault Aviation €14.7M25.0%
Top 4 to 10€12.4M20.9%
Top 11 to 20€4.8M7.1%
Others€9.2M16.6%
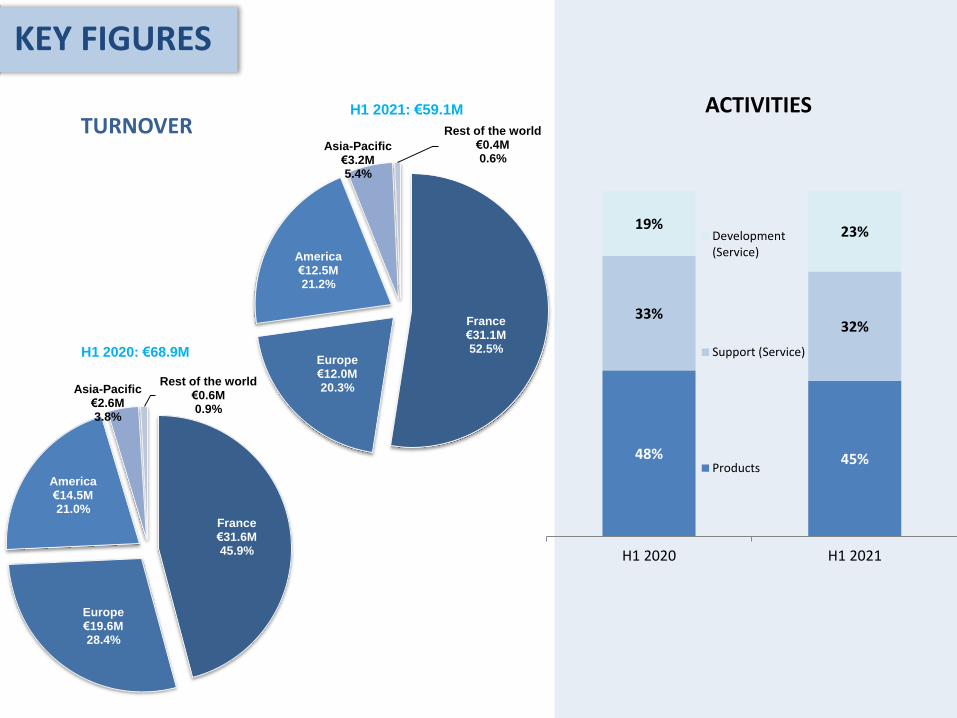
ACTIVITIESTURNOVER
KEY FIGURES
France€31.1M52.5%
Europe€12.0M20.3%
America €12.5M21.2%
Asia-Pacific €3.2M5.4%
Rest of the world €0.4M0.6%
48% 45%
33%32%
19% 23%
H1 2020 H1 2021
Development(Service)
Support (Service)
Products
France€31.6M45.9%
Europe€19.6M28.4%
America €14.5M21.0%
Asia-Pacific €2.6M3.8%
Rest of the world €0.6M0.9%
H1 2020: €68.9M
H1 2021: €59.1M
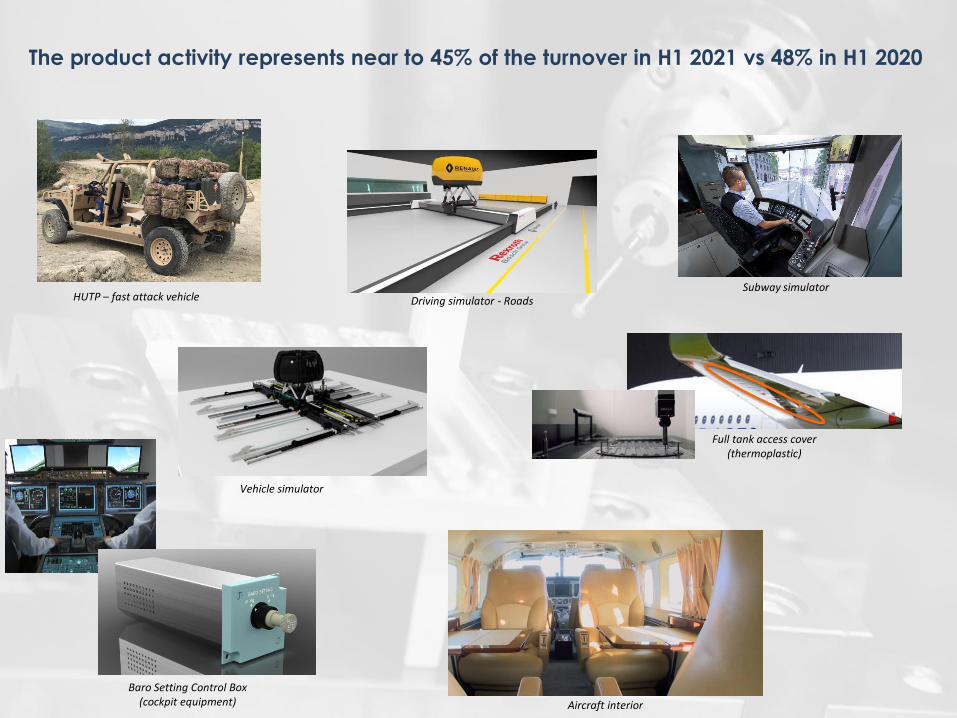
Subway simulatorHUTP – fast attack vehicle
Baro Setting Control Box (cockpit equipment)
Vehicle simulator
Aircraft interior
Driving simulator - Roads
The product activity represents near to 45% of the turnover in H1 2021 vs 48% in H1 2020
Full tank access cover (thermoplastic)

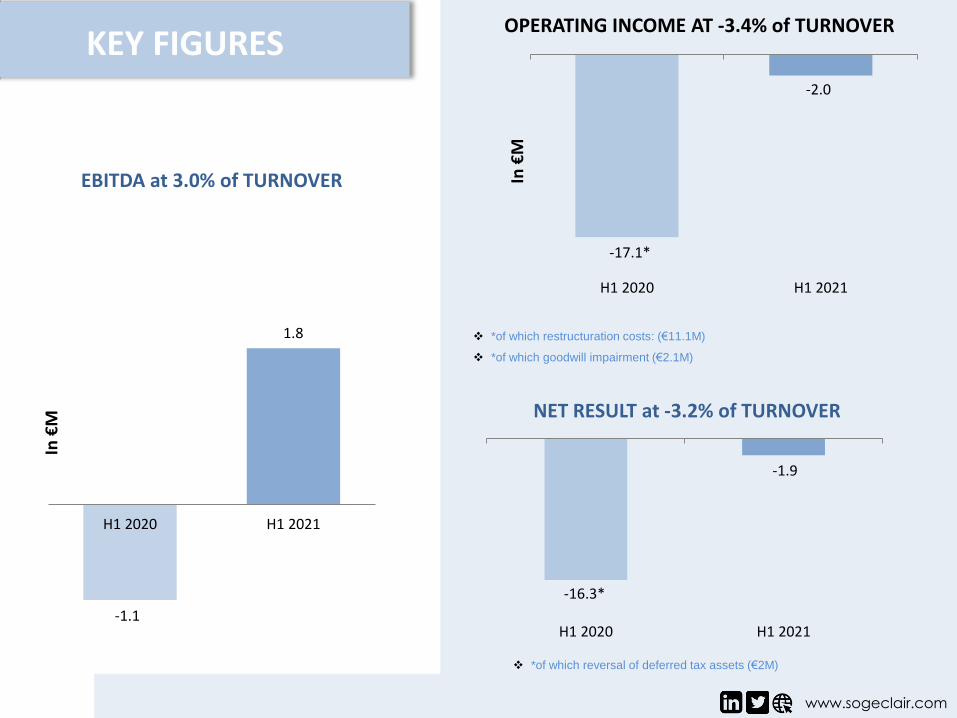
H1 2021 ACCOUNTS (€K)
H1 2020 H1 2021 Evolution
Turnover 68,892 59,091 <9,801>
EBITDA
As % of turnover
-1,077(1.6%)
1,795+3.0%
+2,872
Operating Income
As % of turnover
-17,121(24.9%)
-1,985(3.4%)
+15,136
Net Result
As % of turnover
-16,310(23.7%)
-1,904(3.2%)
+14,406
Net Debt*
(including qualified pre-payments)20,868** 10,903** <9,965>
*of which IFRS 16 8,117 6,071
**of which deferral of social deadlines 4,293 12,000
KEY FIGURES
KEY FIGURES
www.sogeclair.com
NET RESULT at -3.2% of TURNOVER
OPERATING INCOME AT -3.4% of TURNOVER
EBITDA at 3.0% of TURNOVER
*of which restructuration costs: (€11.1M)
*of which goodwill impairment (€2.1M)
*of which reversal of deferred tax assets (€2M)
In €
M
-1.1
1.8
H1 2020 H1 2021
CA
-17.1*
H1 2020 H1 2021
In €
M
-2.0
-16.3*
-1.9
H1 2020 H1 2021

www.sogeclair.comwww.sogeclair.com
GEARING (including qualified pre-payment)
€M H1 2020 H1 2021Evolution (points)
Net debt excluding IFRS 16Of which State-guaranteed loans
8.523.6
-7.28.8
-15.7-14.8
IFRS 16 8.1 6.1 -2.0
Deferral of social debts 4.3 12.0 7.7
Total restated net debt(1) 20.9 10.9 -10
Shareholders’ equity(2) 46.0 55.2 9.2
Gearing total restated (1)/(2) 45.4% 19.8% -25.6
Cash available 43.8 37.1 -6.7
Gross debt excluding IFRS 16 49.3 29.9 -19.4
Net Debt8.5
Net Debt -7.2
IFRS 168.1
IFRS 16
6.1
Deferral of social
debts4.3
Deferral of social
debts
12.0
H1 2020 H1 2021
In €
M
(1) Repayment of state-guaranteed loans in H1 2021 for €14.8M, i.e. nearly 63%
(2) Capital increase of €10M subscribed on 2021/01/15 by Dassault Systèmes into the
subsidiary A.V.Simulation owned at 55%
KEY FIGURES

AEROSPACE
DIVISION
Engineering & Products
www.sogeclair.com
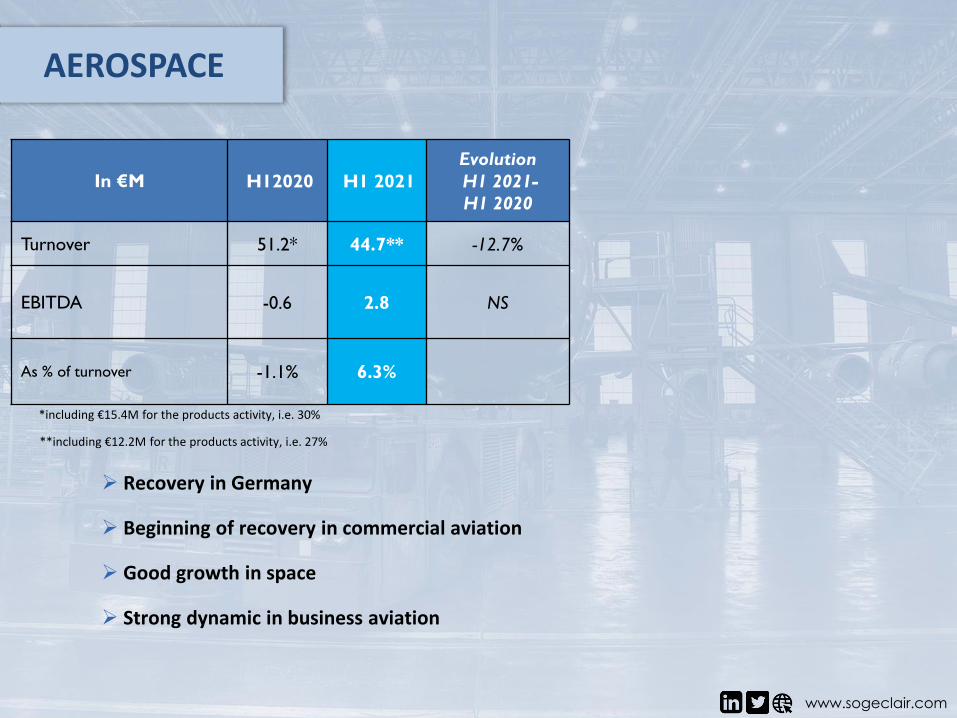
AEROSPACE
www.sogeclair.com
**including €12.2M for the products activity, i.e. 27%
*including €15.4M for the products activity, i.e. 30%
Recovery in Germany
Beginning of recovery in commercial aviation
Good growth in space
Strong dynamic in business aviation
In €M H12020 H1 2021
Evolution
H1 2021-
H1 2020
Turnover 51.2* 44.7** -12.7%
EBITDA -0.6 2.8 NS
As % of turnover -1.1% 6.3%
SIMULATION
DIVISION
Simulators and simulation
software

www.sogeclair.com
SIMULATION
www.sogeclair.com
Entry of Dassault Systèmes into the capital of A.V.Simulation (cash capital increase of €10M
representing 15% of the capital / Oktal (Sogeclair) holds 55.25%
Cyberattack: operating losses on OKTAL-SYDAC of €1M following the stop of the production
during 1 month and the security measures
Reinforced R&D
In €M H12020 H1 2021
Evolution
H1 2021-
H1 2020
Turnover 17.2 13.9 -19.2%
EBITDA -1.4 -1.2 NS
As % of turnover -7.9% -8.4%
VEHICLE
DIVISION
Engineering & manufacturing
of mission vehicles
(military and industrial)

www.sogeclair.com
VEHICLE
Sustained international business activity
Long decision cycles
www.sogeclair.com
In €M H12020 H1 2021
Evolution
H1 2021-
H1 2020
Turnover 0.4 0.5 +6.0%
EBITDA -0.4 -0.5 NS
As % of turnover -94.2% -104.1%

« ONE SOGECLAIR »
Strategic plan
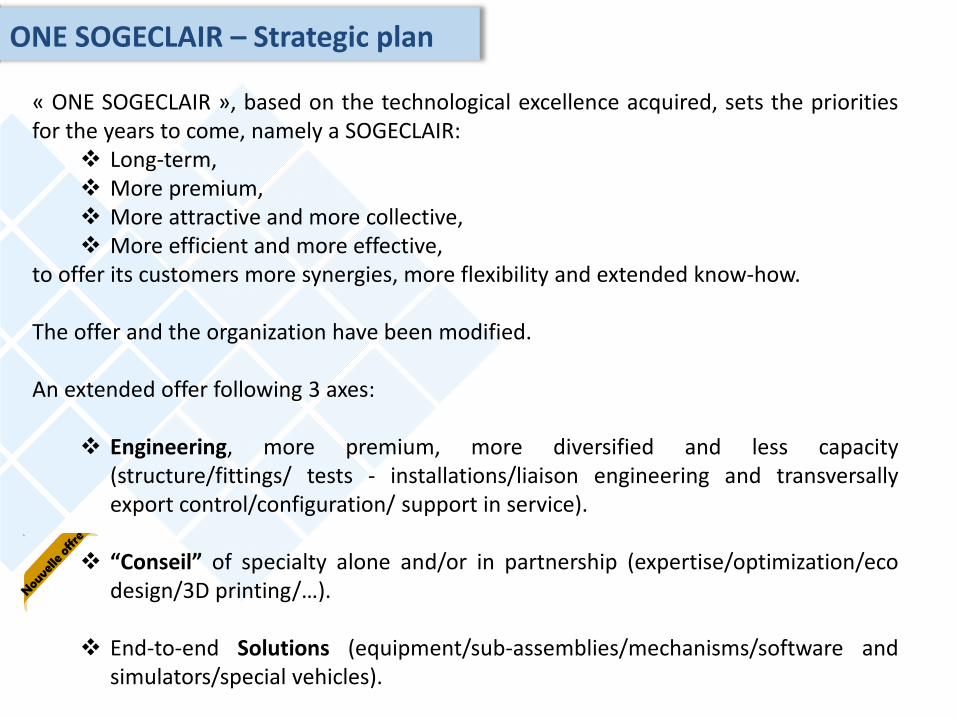
« ONE SOGECLAIR », based on the technological excellence acquired, sets the prioritiesfor the years to come, namely a SOGECLAIR:
Long-term, More premium, More attractive and more collective, More efficient and more effective,
to offer its customers more synergies, more flexibility and extended know-how.
The offer and the organization have been modified.
An extended offer following 3 axes:
Engineering, more premium, more diversified and less capacity(structure/fittings/ tests - installations/liaison engineering and transversallyexport control/configuration/ support in service).
“Conseil” of specialty alone and/or in partnership (expertise/optimization/ecodesign/3D printing/…).
End-to-end Solutions (equipment/sub-assemblies/mechanisms/software andsimulators/special vehicles).
ONE SOGECLAIR – Strategic plan
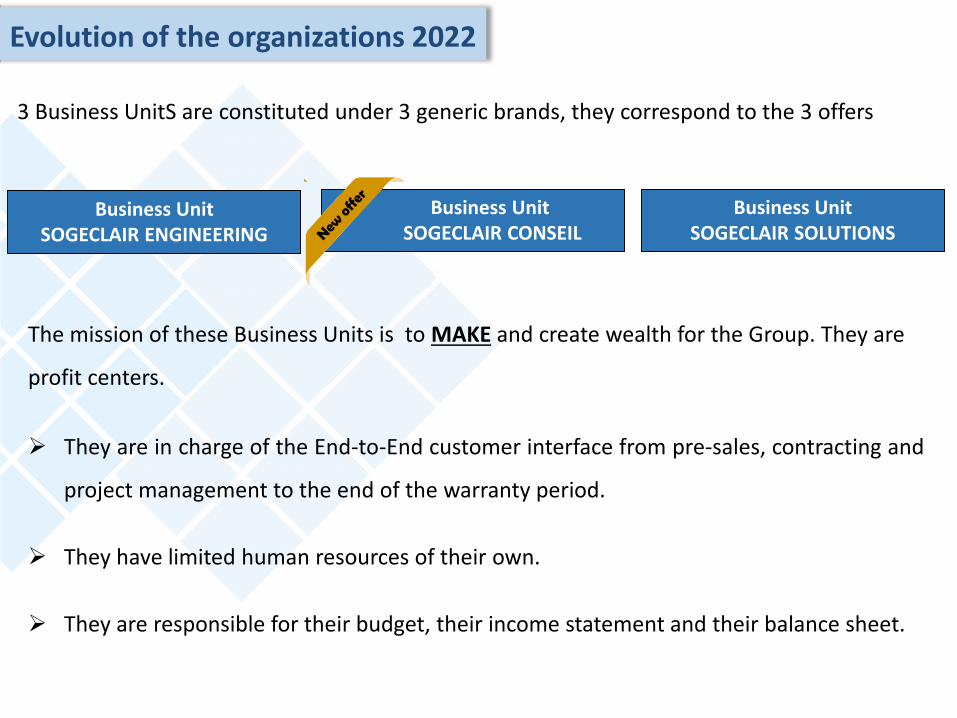
3 Business UnitS are constituted under 3 generic brands, they correspond to the 3 offers
Evolution of the organizations 2022
The mission of these Business Units is to MAKE and create wealth for the Group. They are
profit centers.
They are in charge of the End-to-End customer interface from pre-sales, contracting and
project management to the end of the warranty period.
They have limited human resources of their own.
They are responsible for their budget, their income statement and their balance sheet.
Business UnitSOGECLAIR ENGINEERING
Business UnitSOGECLAIR CONSEIL
Business UnitSOGECLAIR SOLUTIONS
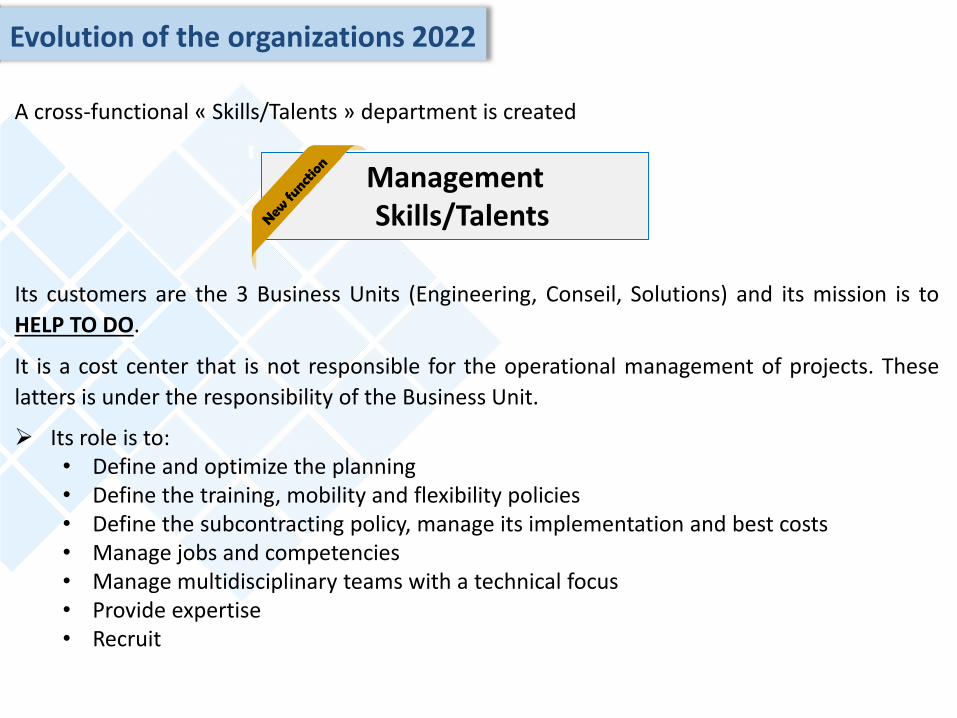
A cross-functional « Skills/Talents » department is created
ManagementSkills/Talents
Its customers are the 3 Business Units (Engineering, Conseil, Solutions) and its mission is to
HELP TO DO.
It is a cost center that is not responsible for the operational management of projects. These
latters is under the responsibility of the Business Unit.
Its role is to:• Define and optimize the planning• Define the training, mobility and flexibility policies• Define the subcontracting policy, manage its implementation and best costs• Manage jobs and competencies• Manage multidisciplinary teams with a technical focus• Provide expertise• Recruit
Evolution of the organizations 2022
A Deputy General Management is created and the transversalfunctions are revisited.
Deputy General Management
Evolution of the organizations 2022

General ManagementPhilippe ROBARDEYFinance/Legal
Elise LEGENDRE
IT and toolsJacques DEJEAN
HR/Staff Administration (France)
Marc DAROLLES
Skills
Business UnitSOGECLAIR CONSEIL
Michael RIBIERE
Business UnitSOGECLAIR SOLUTIONS
Olivier PEDRON
Vehicles Software/Simulators and equipment
Cabin Interiors
Sub-assemblies
Business UnitSOGECLAIR ENGINEERING
Nicolas COUZINET
Communication/ Marketing (TBC)
Deputy General ManagementOlivier PEDRON
ManagementSkills/TalentsStéphanie MARTEL
Deputy General ManagementMarc DAROLLES
MAKE IT POSSIBLE
MAKE
HELP TO DO

NAMEPosition held in
« ONE SOGECLAIR »Previous position in the Group
Nicolas COUZINETDirector of the Business Unit SOGECLAIR Engineering
Deputy Managing Director in charge of business aviation and space at SOGECLAIR aerospace France
Marc DAROLLES Chief Operating Officer
Jacques DEJEAN Director of IT and ToolsResponsible for IT (information technology) of the aeronautical activities
Elise LEGENDRE Administrative and Financial Director
Stéphanie MARTEL Director of Skills / Talents Responsible for Human Resources and Skills in Canada
Olivier PEDRON New Chief Operating OfficerPresident of Rockwell Collins France and l’Hotellier
Michael RIBIEREDirector of the Business Unit SOGECLAIR Conseil
Deputy Managing Director in charge of the commercial aviation at SOGECLAIR aerospace France
Philippe ROBARDEY President and Chief Executive Officer
Evolution of the organizations 2022
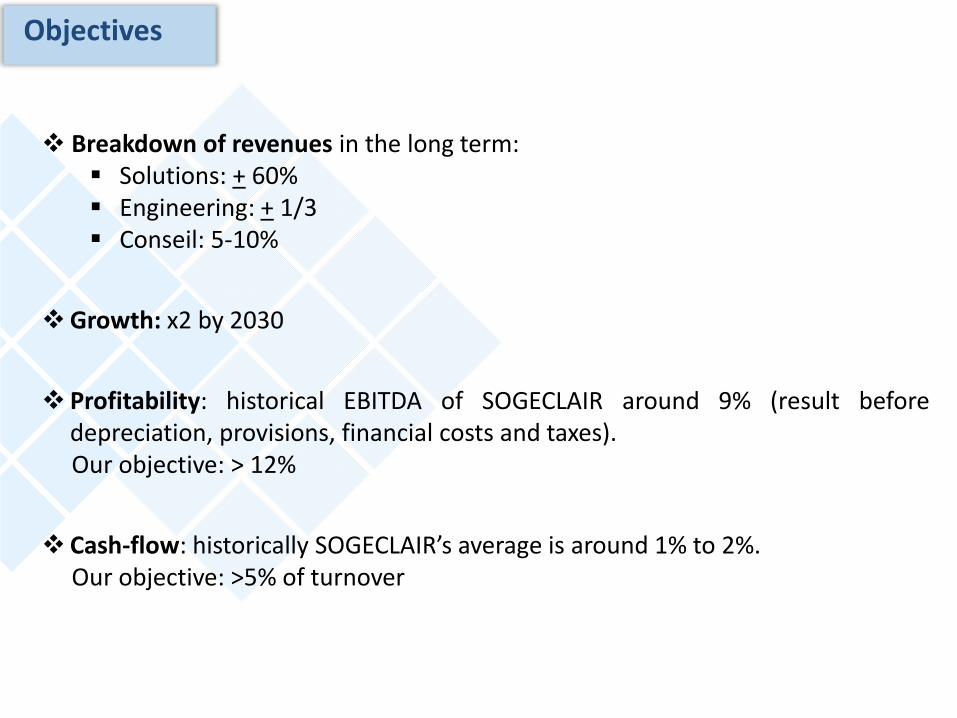
Objectives
Breakdown of revenues in the long term: Solutions: + 60% Engineering: + 1/3 Conseil: 5-10%
Growth: x2 by 2030
Profitability: historical EBITDA of SOGECLAIR around 9% (result beforedepreciation, provisions, financial costs and taxes).Our objective: > 12%
Cash-flow: historically SOGECLAIR’s average is around 1% to 2%.Our objective: >5% of turnover

Schedule
2021/092021/09 to
2021/11Q4 2021 January 2022
+
Implementation of organizations
« One SOGECLAIR »Presentation
Chief Operating Officer / Manager of Skills/Talents
Preparation of 2022 budgets by the new
Business Units
Nominal operation“ONE SOGECLAIR”
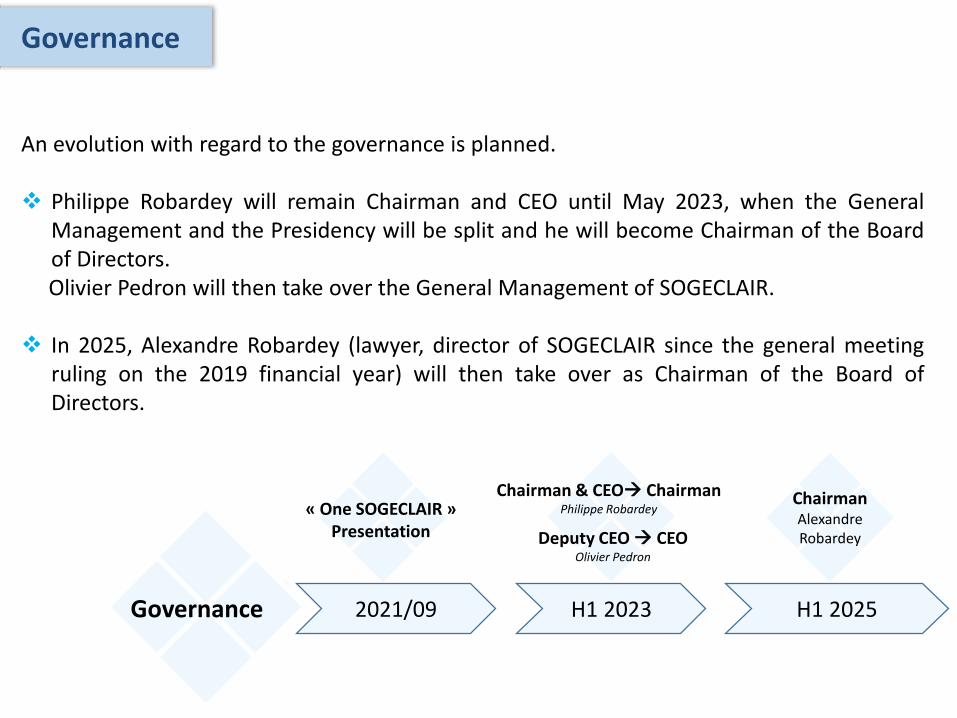
Governance
An evolution with regard to the governance is planned.
Philippe Robardey will remain Chairman and CEO until May 2023, when the GeneralManagement and the Presidency will be split and he will become Chairman of the Boardof Directors.Olivier Pedron will then take over the General Management of SOGECLAIR.
In 2025, Alexandre Robardey (lawyer, director of SOGECLAIR since the general meetingruling on the 2019 financial year) will then take over as Chairman of the Board ofDirectors.
2021/09 H1 2023 H1 2025Governance
Deputy CEO CEOOlivier Pedron
« One SOGECLAIR »Presentation
Chairman & CEO ChairmanPhilippe Robardey
ChairmanAlexandre Robardey

2021FORECAST PRESS RELEASE DATES
Q3 2021 Turnover – 2021/11/03
APPENDIXES
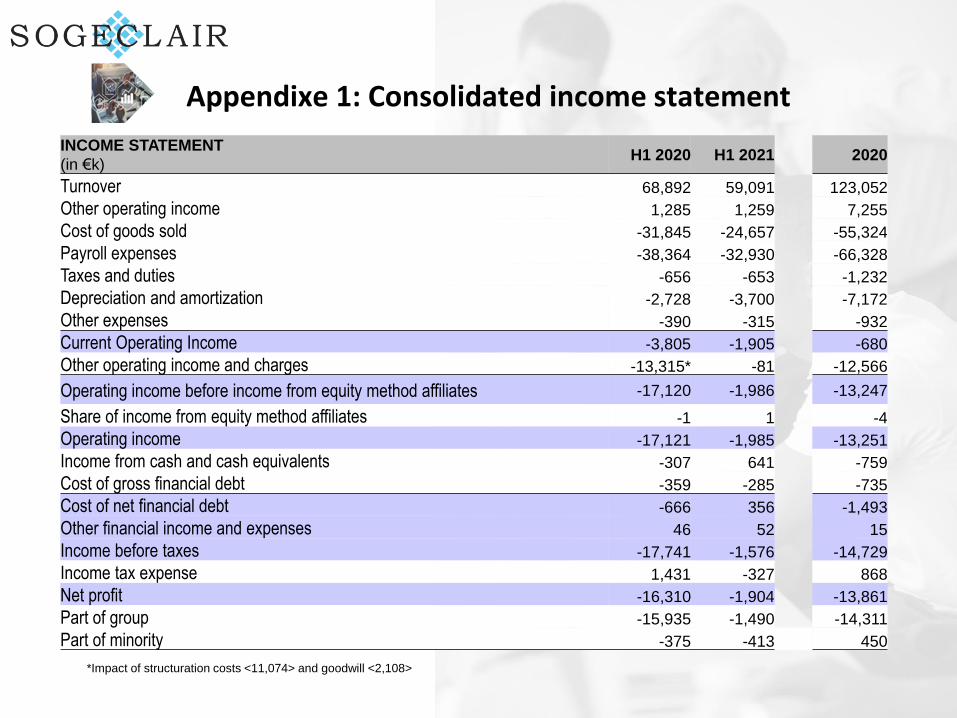
Appendixe 1: Consolidated income statement
*Impact of structuration costs <11,074> and goodwill <2,108>
INCOME STATEMENT
(in €k)H1 2020 H1 2021 2020
Turnover 68,892 59,091 123,052
Other operating income 1,285 1,259 7,255
Cost of goods sold -31,845 -24,657 -55,324
Payroll expenses -38,364 -32,930 -66,328
Taxes and duties -656 -653 -1,232
Depreciation and amortization -2,728 -3,700 -7,172
Other expenses -390 -315 -932
Current Operating Income -3,805 -1,905 -680
Other operating income and charges -13,315* -81 -12,566
Operating income before income from equity method affiliates -17,120 -1,986 -13,247
Share of income from equity method affiliates -1 1 -4
Operating income -17,121 -1,985 -13,251
Income from cash and cash equivalents -307 641 -759
Cost of gross financial debt -359 -285 -735
Cost of net financial debt -666 356 -1,493
Other financial income and expenses 46 52 15
Income before taxes -17,741 -1,576 -14,729
Income tax expense 1,431 -327 868
Net profit -16,310 -1,904 -13,861
Part of group -15,935 -1,490 -14,311
Part of minority -375 -413 450
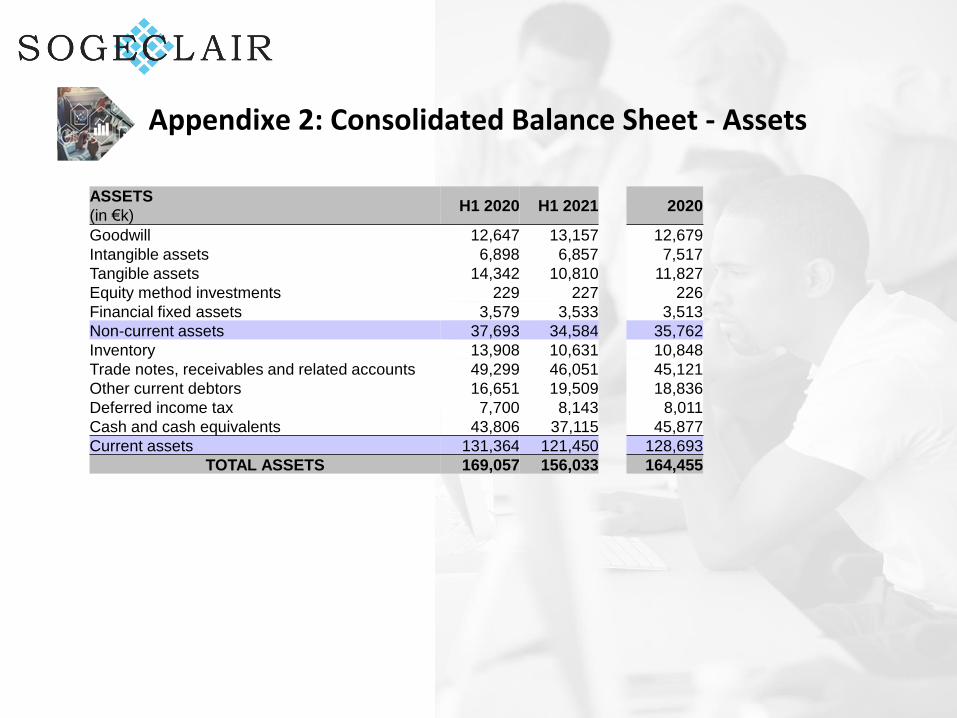
Appendixe 2: Consolidated Balance Sheet - Assets
ASSETS
(in €k)H1 2020 H1 2021 2020
Goodwill 12,647 13,157 12,679
Intangible assets 6,898 6,857 7,517
Tangible assets 14,342 10,810 11,827
Equity method investments 229 227 226
Financial fixed assets 3,579 3,533 3,513
Non-current assets 37,693 34,584 35,762
Inventory 13,908 10,631 10,848
Trade notes, receivables and related accounts 49,299 46,051 45,121
Other current debtors 16,651 19,509 18,836
Deferred income tax 7,700 8,143 8,011
Cash and cash equivalents 43,806 37,115 45,877
Current assets 131,364 121,450 128,693
TOTAL ASSETS 169,057 156,033 164,455
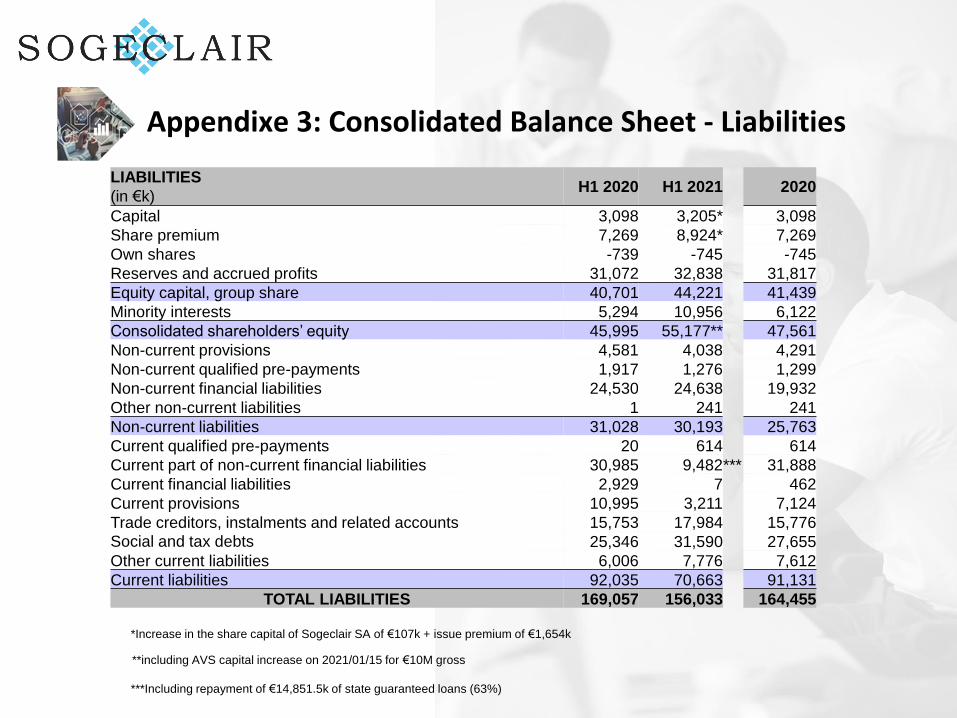
Appendixe 3: Consolidated Balance Sheet - Liabilities
*Increase in the share capital of Sogeclair SA of €107k + issue premium of €1,654k
LIABILITIES
(in €k)H1 2020 H1 2021 2020
Capital 3,098 3,205* 3,098
Share premium 7,269 8,924* 7,269
Own shares -739 -745 -745
Reserves and accrued profits 31,072 32,838 31,817
Equity capital, group share 40,701 44,221 41,439
Minority interests 5,294 10,956 6,122
Consolidated shareholders’ equity 45,995 55,177** 47,561
Non-current provisions 4,581 4,038 4,291
Non-current qualified pre-payments 1,917 1,276 1,299
Non-current financial liabilities 24,530 24,638 19,932
Other non-current liabilities 1 241 241
Non-current liabilities 31,028 30,193 25,763
Current qualified pre-payments 20 614 614
Current part of non-current financial liabilities 30,985 9,482*** 31,888
Current financial liabilities 2,929 7 462
Current provisions 10,995 3,211 7,124
Trade creditors, instalments and related accounts 15,753 17,984 15,776
Social and tax debts 25,346 31,590 27,655
Other current liabilities 6,006 7,776 7,612
Current liabilities 92,035 70,663 91,131
TOTAL LIABILITIES 169,057 156,033 164,455
***Including repayment of €14,851.5k of state guaranteed loans (63%)
**including AVS capital increase on 2021/01/15 for €10M gross
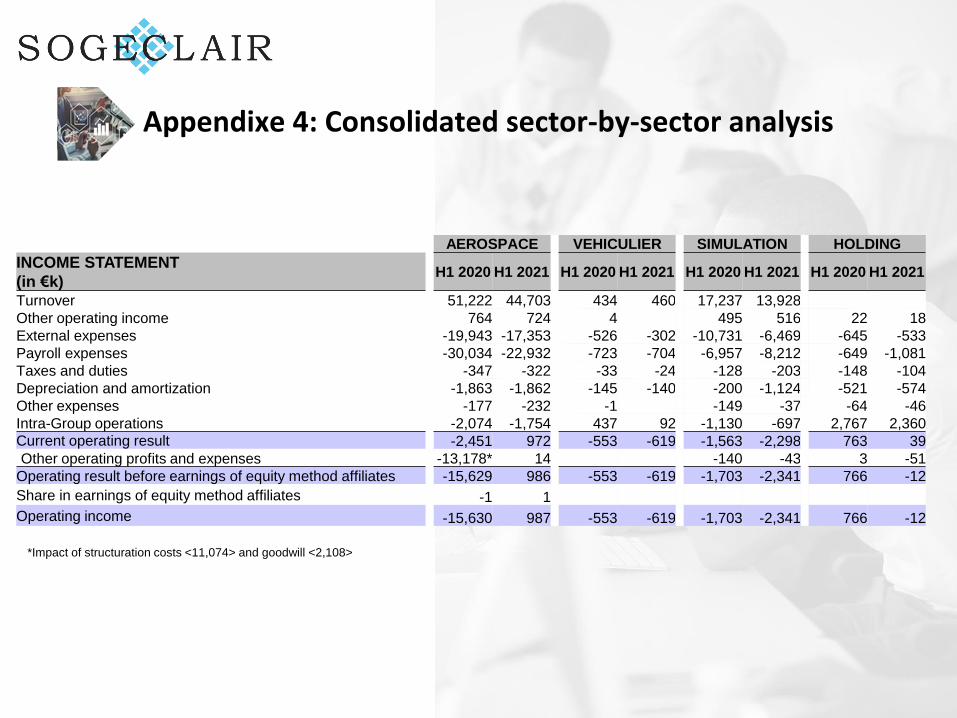
Appendixe 4: Consolidated sector-by-sector analysis
*Impact of structuration costs <11,074> and goodwill <2,108>
AEROSPACE VEHICULIER SIMULATION HOLDING
INCOME STATEMENT
(in €k)H1 2020 H1 2021 H1 2020 H1 2021 H1 2020 H1 2021 H1 2020 H1 2021
Turnover 51,222 44,703 434 460 17,237 13,928
Other operating income 764 724 4 495 516 22 18
External expenses -19,943 -17,353 -526 -302 -10,731 -6,469 -645 -533
Payroll expenses -30,034 -22,932 -723 -704 -6,957 -8,212 -649 -1,081
Taxes and duties -347 -322 -33 -24 -128 -203 -148 -104
Depreciation and amortization -1,863 -1,862 -145 -140 -200 -1,124 -521 -574
Other expenses -177 -232 -1 -149 -37 -64 -46
Intra-Group operations -2,074 -1,754 437 92 -1,130 -697 2,767 2,360
Current operating result -2,451 972 -553 -619 -1,563 -2,298 763 39
Other operating profits and expenses -13,178* 14 -140 -43 3 -51
Operating result before earnings of equity method affiliates -15,629 986 -553 -619 -1,703 -2,341 766 -12
Share in earnings of equity method affiliates -1 1
Operating income -15,630 987 -553 -619 -1,703 -2,341 766 -12

Appendixe 5: Cash flow Statement
CONSOLIDATED CASHFLOW STATEMENT(in €k)
H1 2020 H1 2021 2020
Consolidated net result (including minority interests) -16,310 -1,904 -13,861
+/- Amortization and provisions (excluding those linked to current assets) 15,695 -454 15,691
-/+ Latent gains and losses linked to fair value variations -15 -15 -29
-/+ Transfer capital gains and losses 100 3
-/+ Dilution profits and losses -26 633 -604
+/- Share in the result linked to equity method affiliates 1 -1 4
- Dividends (non consolidated securities) -37 -37
Self-financing capacity after net finance costs and tax -691 -1,641 1,168
+ Net finance costs 368 247 717
+/- Tax charge (including deferred tax) -1,431 327 -868
Self-financing capacity before net finance costs and tax (A) -1,754 -1,067 1,017
- Tax paid (B) 2,221 -502 -3,183
+/- Variation in working capital requirement linked to the activity (including debt related to personnel benefits) (C) 12,041 4,616 28,008
= CASHFLOWS FROM OPERATING ACTIVITIES (D) = (A + B + C) 12,508 3,047 25,843
- Outflows linked to the acquisition of tangible and intangible assets -1,610 -1,004 -3,918
+ Inflows linked to the sale of tangible and intangible assets 3 10
- Outflows linked to the acquisition of financial assets (non-consolidated securities)
+/- Impact of variations in scope -83 25 -1,033
+ Dividends received (equity method affiliates, non-consolidated securities) * see alternative processing 7.2 37 37
+/- Variation in loans and advances granted -13 2 -1,305
+ Investments grants received 97 68
= CASHFLOWS FROM INVESTMENT ACTIVITIES (E) -1,570 -977 -6,141
Acquisition of non-controlling interests
+ Sums received from shareholders at time of capital increases 9,835
-/+ Buyback and sale of own shares -59 -65
- Dividends allocated for payment during the year
- Dividends paid to the parent company shareholders -2,662 -897 -2,662
- Dividends paid to the integrated company minority interests -142
+ Revenue from loan issues 24,802 56 24,827
- Loan reimbursements (including leasing contracts) -3,968 -19,055 -7,782
- Net finance costs (including leasing contracts) -280 -267 -567
= NET CASHFLOWS FROM FINANCING ACTIVITIES (F) 17,833 -10,470 13,752
+/- Impact of changes in currency exchange rates (G) -27 92 -170
= NET CASH VARIATION (D + E + F + G) 28,745 -8,308 33,283
EMAIL [email protected]
PHONE NUMBER+33 (0)5 61 71 70 00
SOGECLAIR 7 avenue Albert DurandCS 20069 – 31703 Blagnac Cedex France


