


HEI's RIOPA and Other Air Quality Databases
Rashid Shaikhand
Geoffrey Sunshine
Health Effects Institute

The HEI Strategic Plan – 2010 - 2015
Cross-Cutting Issues in HEI Research• Sensitive Populations• Innovation and Validation:
– Enhanced Statistical Techniques– New Methods for Toxicity Testing– New Biomarkers– Increasing Access to High Quality Air Pollution
Data: Three Web-based Databases• Air Quality Databases• RIOPA Databases• iHAPSS Database

HEI Databases• HEI Policy on Data Access “…… it is the policy of the
Health Effects Institute to provide access expeditiously to data for studies that it has funded and to provide that data in a manner that facilitates review and validation of the work but also protects the confidentiality of any subjects who may have participated in the study and respects the intellectual interests of the investigator in the work.”
• HEI has developed publicly-accessible databases:– Where underlying data can be made public – Information would be of wide interest in the scientific
community– Where HEI development or support can make the
database more accessible and user friendly4
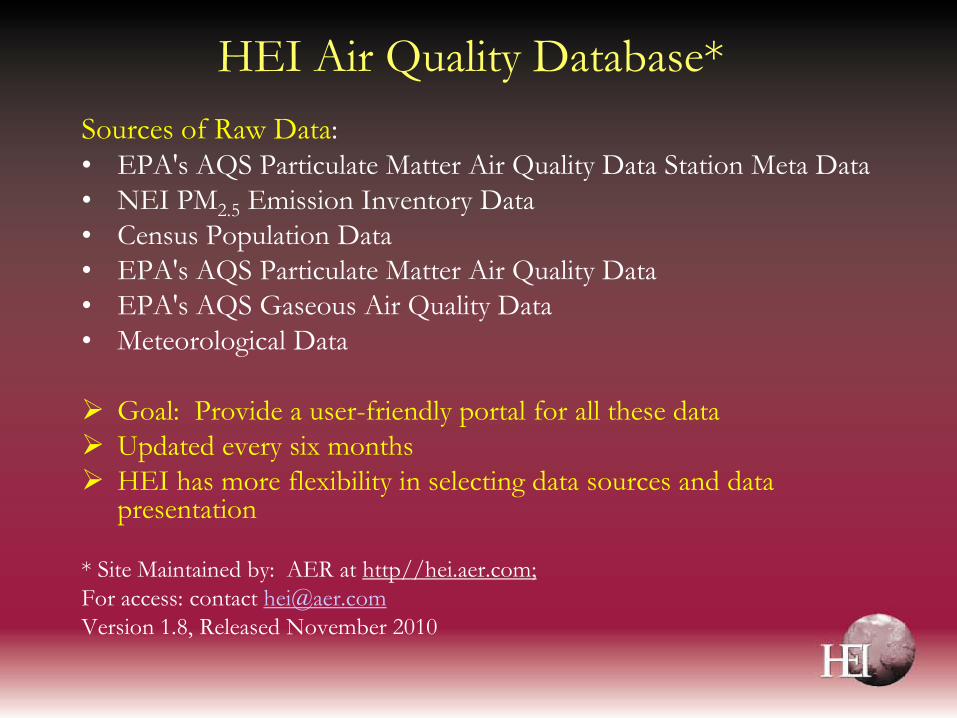
HEI Air Quality Database* Sources of Raw Data: • EPA's AQS Particulate Matter Air Quality Data Station Meta Data • NEI PM2.5 Emission Inventory Data • Census Population Data • EPA's AQS Particulate Matter Air Quality Data • EPA's AQS Gaseous Air Quality Data • Meteorological Data
Goal: Provide a user-friendly portal for all these data Updated every six months HEI has more flexibility in selecting data sources and data
presentation
* Site Maintained by: AER at http//hei.aer.com; For access: contact [email protected] 1.8, Released November 2010
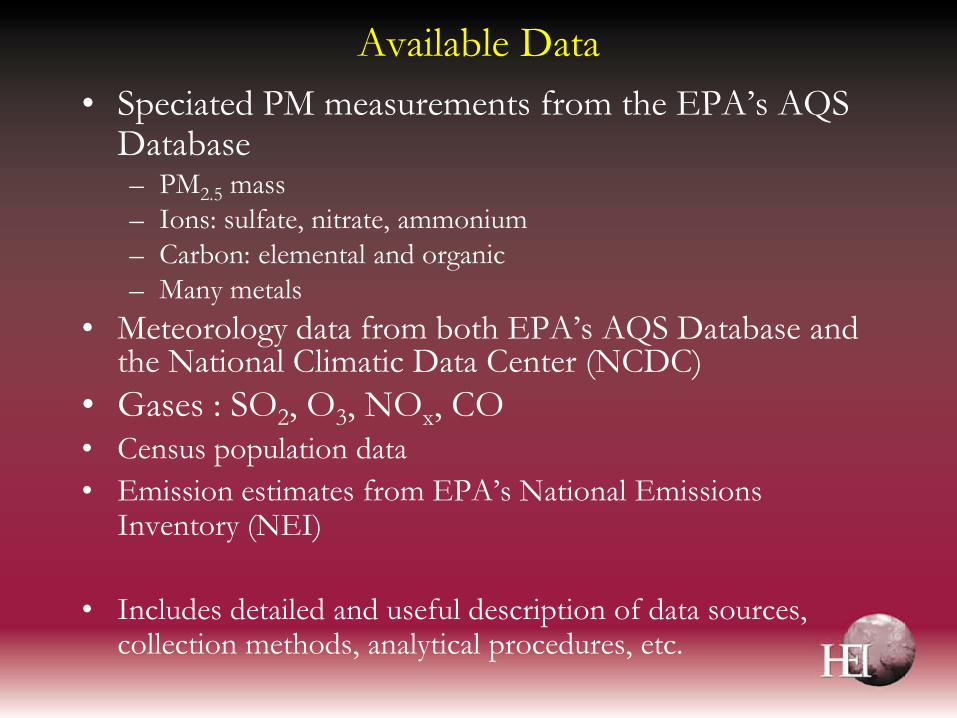
Available Data• Speciated PM measurements from the EPA’s AQS
Database – PM2.5 mass– Ions: sulfate, nitrate, ammonium– Carbon: elemental and organic– Many metals
• Meteorology data from both EPA’s AQS Database and the National Climatic Data Center (NCDC)
• Gases : SO2, O3, NOx, CO• Census population data• Emission estimates from EPA’s National Emissions
Inventory (NEI)
• Includes detailed and useful description of data sources, collection methods, analytical procedures, etc.
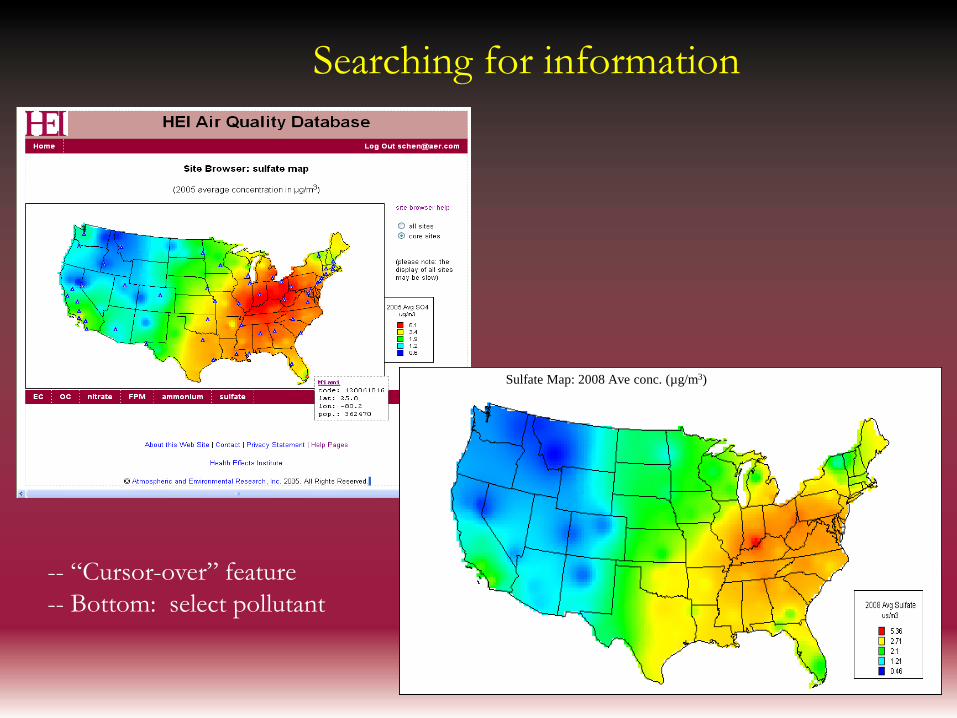
Searching for information
Sulfate Map: 2008 Ave conc. (µg/m3)
-- “Cursor-over” feature-- Bottom: select pollutant

Click on Site to See Summary Graphics
• Pie chart
• Longitudinal

PM Composition Varies Among Cities
Pittsburgh, PAHigh sulfate
34%
10%13%
35%
5% 3%
Gulfport, MSHigh acidity
31%
5%
8%43%
3%10%
Kansas City, KSHigh OM
18%
14%
9%
55%
4% 0%
Commerce City, COHigh EC
12%
15%
7%
56%
10% 0%
El Cajon, CAHigh nitrate
18%
22%
10%
45%
5% 0%
SulfateNitrateAmmoniumOMECOther
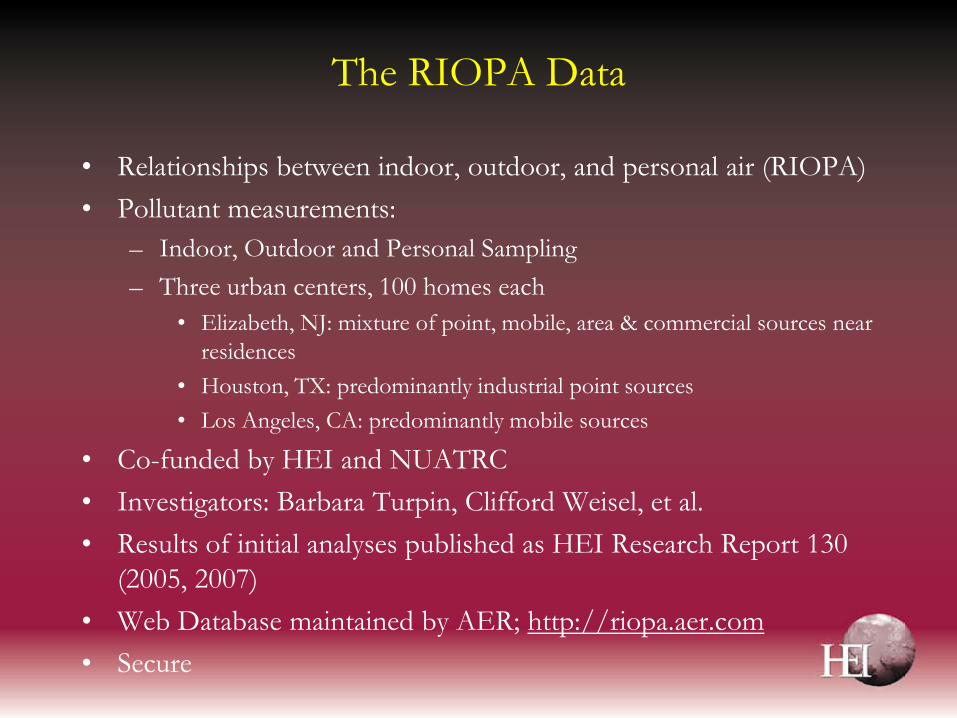
The RIOPA Data
• Relationships between indoor, outdoor, and personal air (RIOPA)• Pollutant measurements:
– Indoor, Outdoor and Personal Sampling– Three urban centers, 100 homes each
• Elizabeth, NJ: mixture of point, mobile, area & commercial sources near residences
• Houston, TX: predominantly industrial point sources• Los Angeles, CA: predominantly mobile sources
• Co-funded by HEI and NUATRC• Investigators: Barbara Turpin, Clifford Weisel, et al.• Results of initial analyses published as HEI Research Report 130
(2005, 2007)• Web Database maintained by AER; http://riopa.aer.com• Secure

The RIOPA Database
• Includes measurements of: – VOCs (18)– carbonyl compounds (10)– PM2.5 mass and species– OC and EC– elements (22)– PAHs (32) and chlordanes (6) (gas and particle) – In-vehicle carbonyls
• Other data– Household– air exchange rates – neighborhood / surroundings– subject– activity

Data recently added to the RIOPA Database
• Traffic flow for nearest highway • Traffic intensity • Elevation• Intensity of development in developed areas• Wind speed• Prevailing wind direction
Use of the RIOPA Data
• HEI recently funded two new studies to further analyze the RIOPA data– Stuart Batterman, University of Michigan– Patrick Ryan, University of Cincinnati
• Many investigators have used this database, resulting in many published articles

The iHAPPS Database • Contains data and and analytical software from HEI’s National
Morbidity, Mortality and Air Pollution Study (NMMAPS) –published as HEI Reports and multiple publications from Johns Hopkins group
• Study evaluated associations between air pollutants and morbidity and mortality in 108 US cities from 1987-2000
• Data include multiple pollutants (EPA’s AQS Database), meteorological (National Climatic Data Center), and census
• Site found at Dept. of Biostatistics, Johns Hopkins Bloomberg School of Public Health, http://www.ihapss.jhsph.edu/

HEI Annual Conference
• Boston. May 1 – 3, 2011• Sessions on: how low can NAAQS go; emissions
and exposure – with emphasis on remote sensing; long range transport; others
• 40+ posters (HEI and other studies)• EPA, Auto industry and lot of other scientists
• Contact HEI for more information:www.HealthEffects.org
15
Pre-Conference Workshop:
The Evolution of Statistical Methods Used to Assess the Health Effects of Air Pollution
• Assessing Health Effects of Short-Term Exposures to Air Pollution – From Single-City to Multi-City Coordinated Analyses
(F Dominici) – Alternative Models and Approaches (R Smith)
• Assessing Health Effects of Long-Term Exposures to Air Pollution – Impact of Long-Term Exposures to Air Pollution (A Pope) – Characterizing Exposure Measurement Error (A Szpiro)– Summary and New Directions (L Sheppard)
• Boston. SUNDAY, MAY 1, 2011, 8:30–11:30 AM
16

Thank you!!! Rashid Shaikh ([email protected])
Geoffrey Sunshine ([email protected]) www.HealthEffects.org
17


