

High Frequency Ultrasonic Characterization of Carrot Tissue
Christopher VickAdvisor: Dr. Navalgund Rao
Center for Imaging Science
Rochester Institute of Technology

Overview
• Introduction
• Hypothesis
• Theory
• Experimental
• Results
• Conclusion
Introduction
• Ultrasound: fast, nondestructive, noninvasive, and inexpensive.
• Long history of diagnostic use.
• Many medical applications consist of interpreting an image, based on gray-level and texture.
Introduction
• System and processing limitations make this ineffective in identifying small variations in specific tissue structure.
• Computer texture analysis models are limited in scope.
• Models can be aided by quantitatively examining the ultrasonic response of tissue.
Alternate Ultrasound Uses
• Ripeness measurement in banana and avocado; animal backfat estimation; examination of the structure of metals and wood.
• Ultrasound has been proposed for texture evaluation of plant tissues, but not widely tested.
Why carrots?
• Biological changes well documented.
• Homogenous structure
• Since the changing carrot biology is well understood, can examine how ultrasound propagates through various tissues.
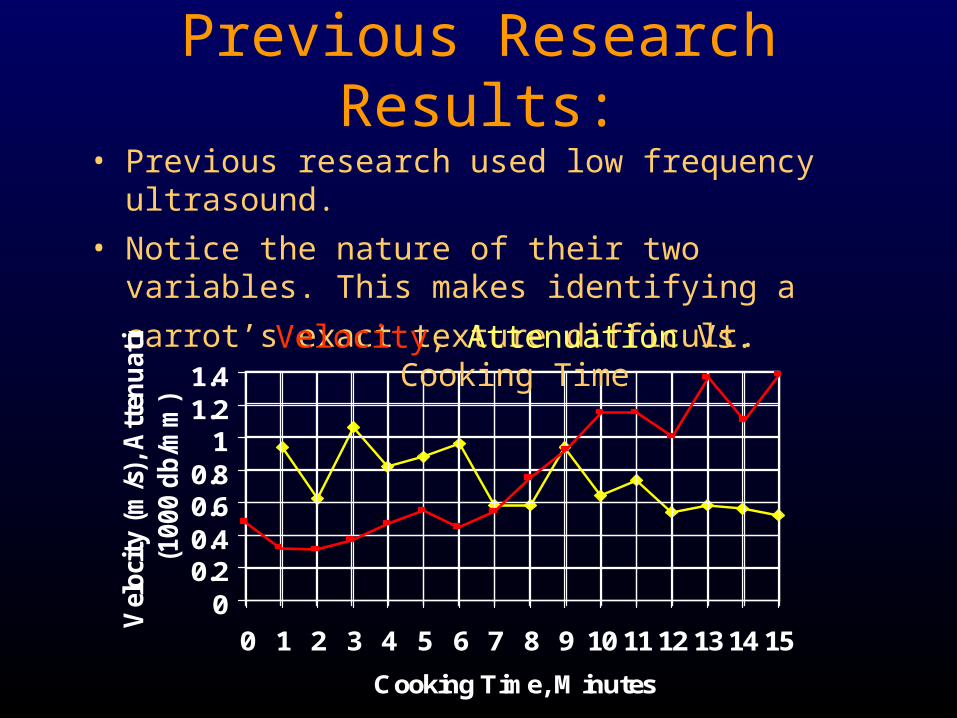
Previous Research Results:• Previous research used low frequency ultrasound.
• Notice the nature of their two variables. This makes
identifying a carrot’s exact texture difficult.
00.20.40.60.8
11.21.4
0 1 2 3 4 5 6 7 8 9 10 11 12 13 14 15
Cooking Time, Minutes
Vel
oci
ty (
m/s
), A
tten
ua
tio
n
(10
00
db
/mm
)
Velocity, Attenuation Vs. Cooking Time
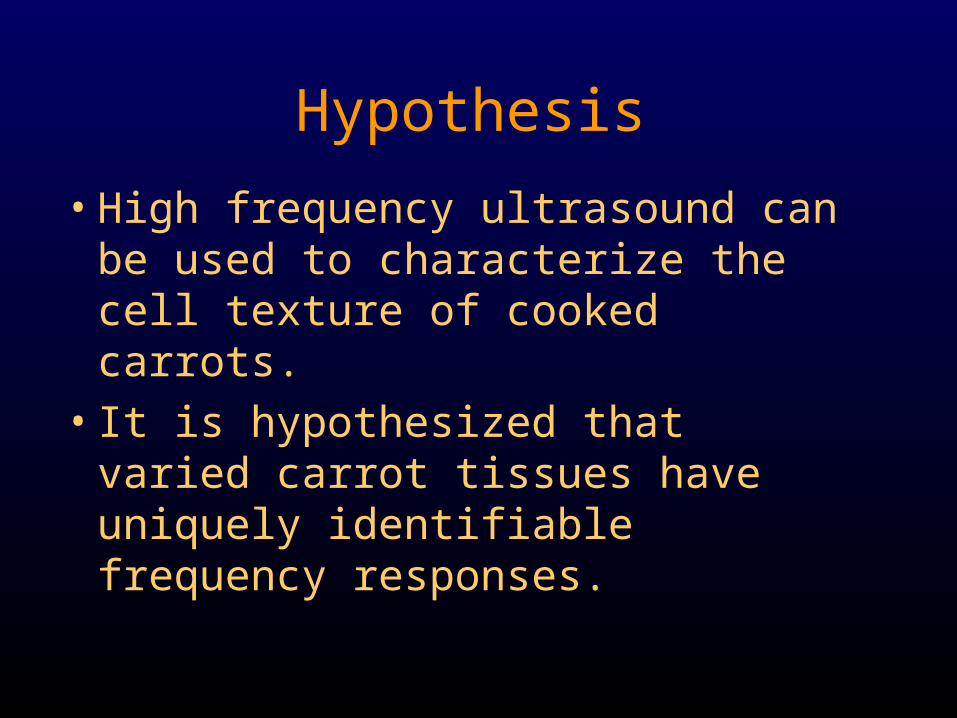
Hypothesis
• High frequency ultrasound can be used to characterize the cell texture of cooked carrots.
• It is hypothesized that varied carrot tissues have uniquely identifiable frequency responses.
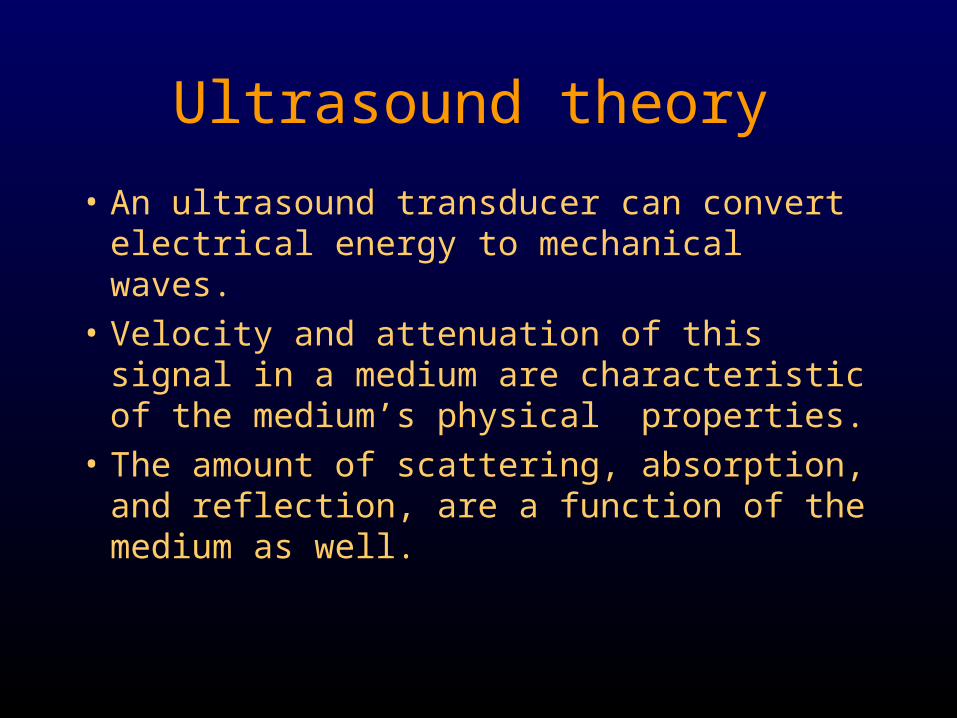
Ultrasound theory
• An ultrasound transducer can convert electrical energy to mechanical waves.
• Velocity and attenuation of this signal in a medium are characteristic of the medium’s physical properties.
• The amount of scattering, absorption, and reflection, are a function of the medium as well.
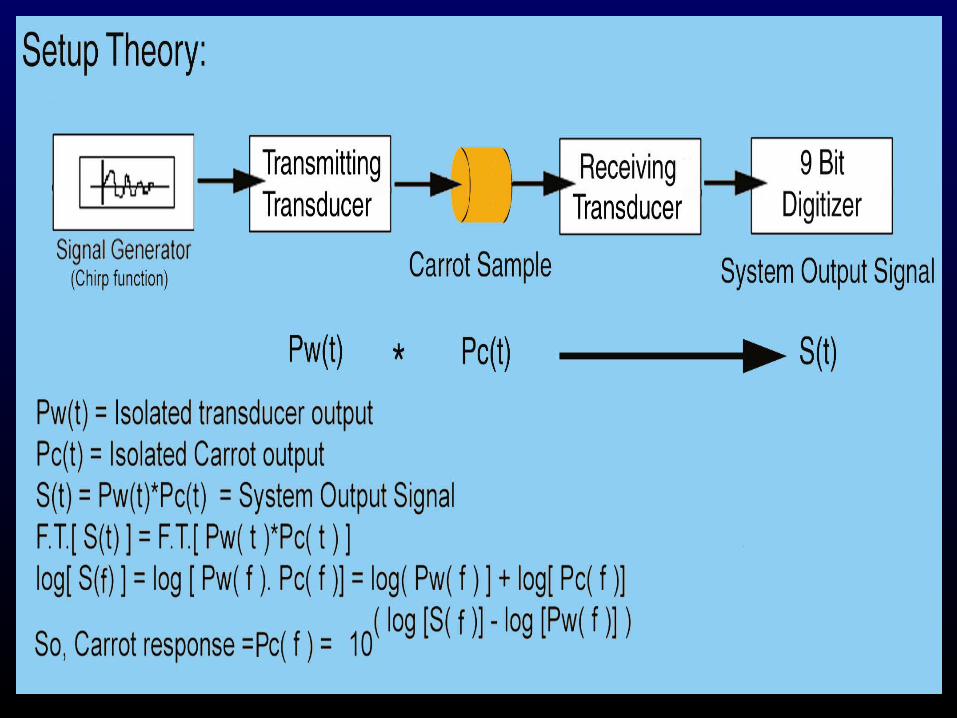
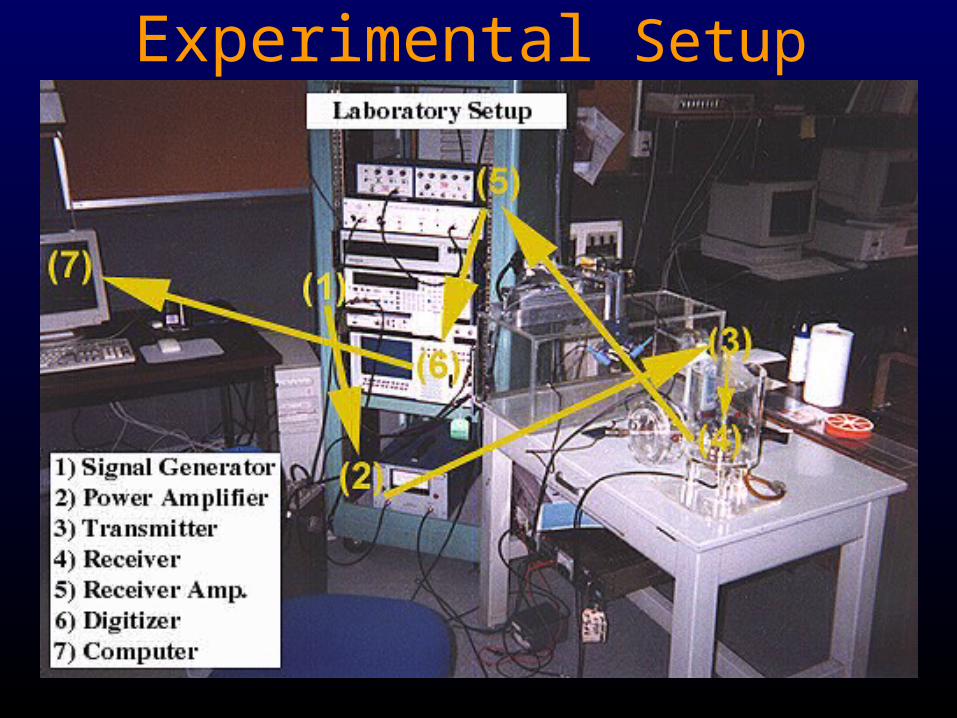
Experimental Setup
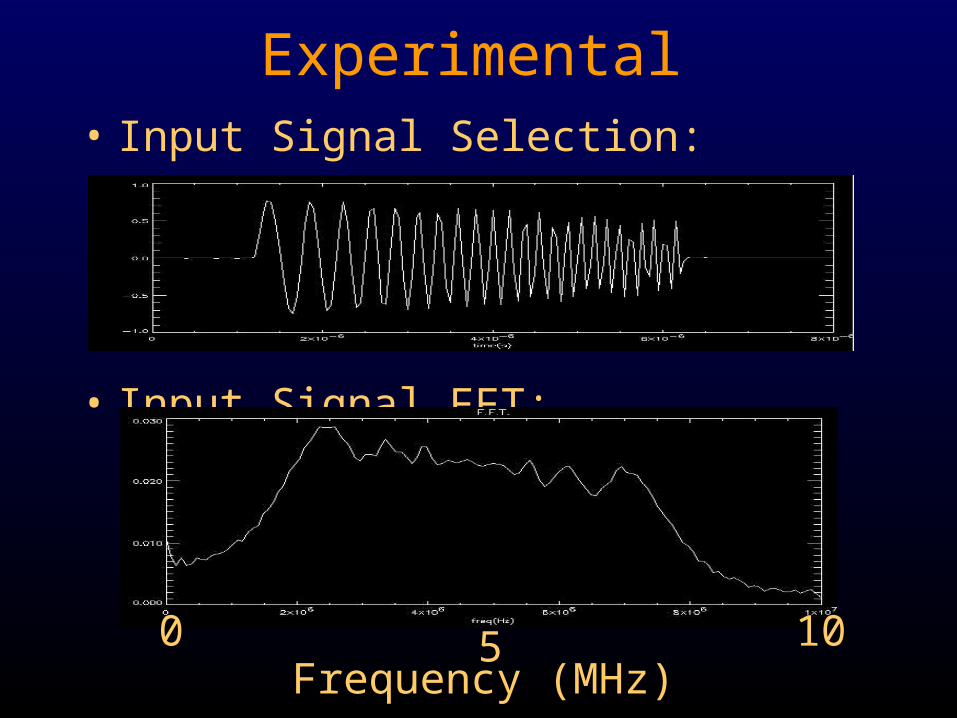
Experimental• Input Signal Selection:
• Input Signal FFT:
0 5 10Frequency (MHz)
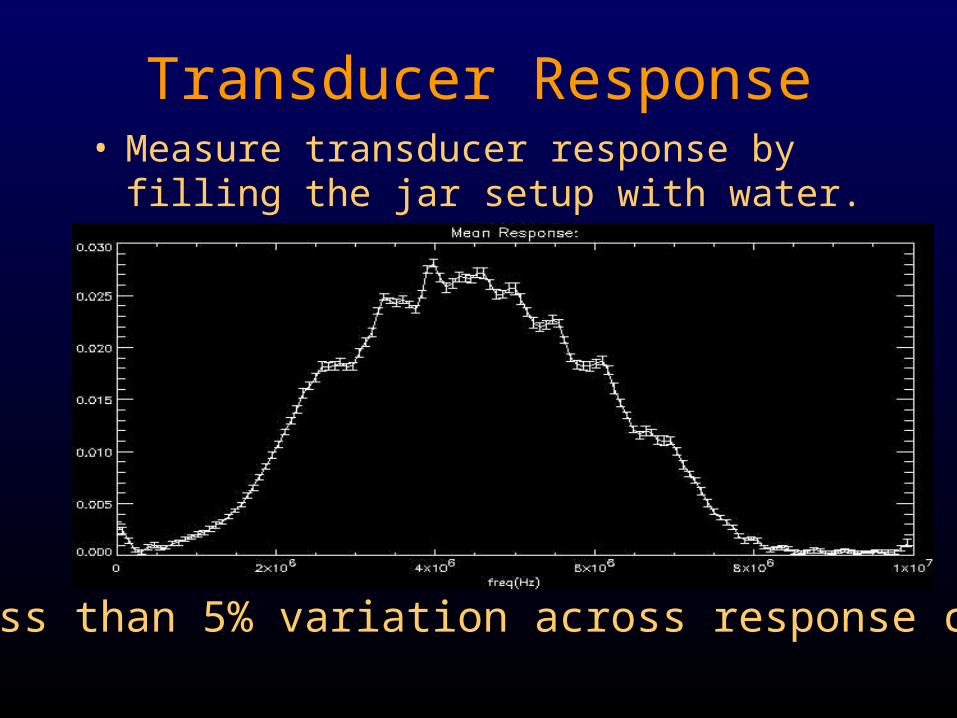
Transducer Response• Measure transducer response by filling the jar
setup with water.
- Less than 5% variation across response curve.

Carrot Sample Preparation• Samples were cored from
normal Dole carrots, using an apple corer.
• Samples to be cooked were placed in boiling water for the appropriate 0-16 minute cooking times, removed, and cooled in distilled water.

Tests: Same Sample
• Examine signal variation from imaging the same carrot sample, repeatedly.
- Align carrot/transducers
- Image the sample
- Remove the sample
- Repeat process

Testing: Different Samples
• Examine signal variation along the length of the carrot, as the xylem core diameter changes.
• Examine signal variation among different carrots of equal cooking time.

Testing: Cooked Carrots
• Random carrot segments, boiled for between 1-16 minutes, in 30 second intervals.
• Lastly, random carrot samples were cooked for an unknown length of time.
• If successful, results from the previous tests should allow for identification of the unknown samples.
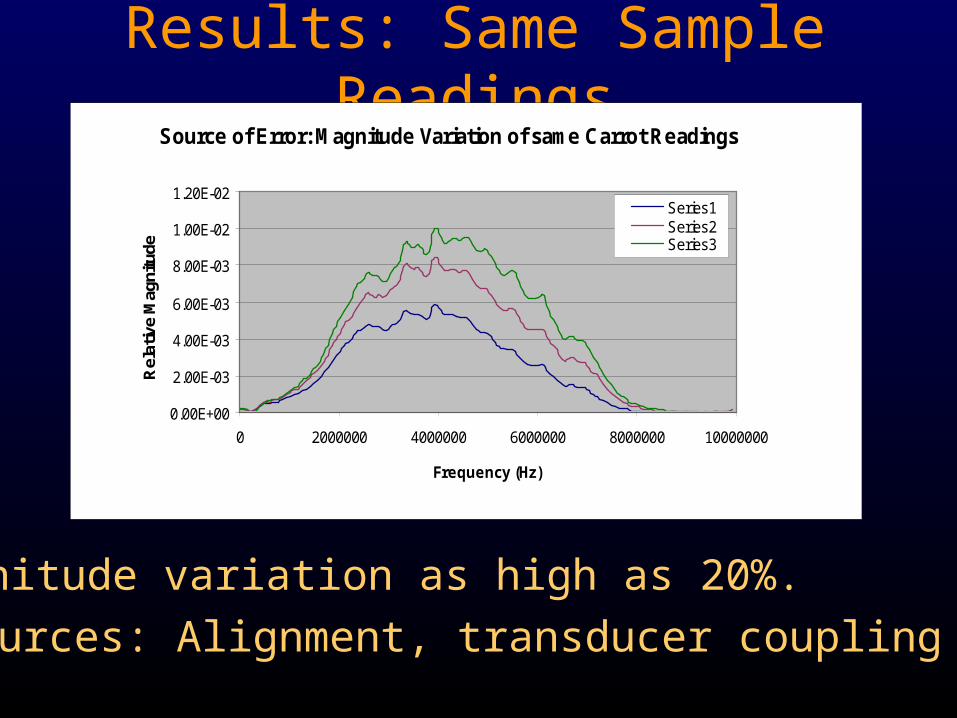
Results: Same Sample ReadingsSource of Error: Magnitude Variation of same Carrot Readings
0.00E+00
2.00E-03
4.00E-03
6.00E-03
8.00E-03
1.00E-02
1.20E-02
0 2000000 4000000 6000000 8000000 10000000
Frequency (Hz)
Rel
ativ
e M
agni
tude
Series1Series2Series3
- Magnitude variation as high as 20%.
- Sources: Alignment, transducer coupling

Results: Normalized
- Variance drops to below 7%.
Standard Deviation of Normalized Same Carrot Readings
0
0.2
0.4
0.6
0.8
1
1.2
0 2000000 4000000 6000000 8000000 10000000
Frequency (Hz)
Rel
ativ
e M
agni
tude
Series1
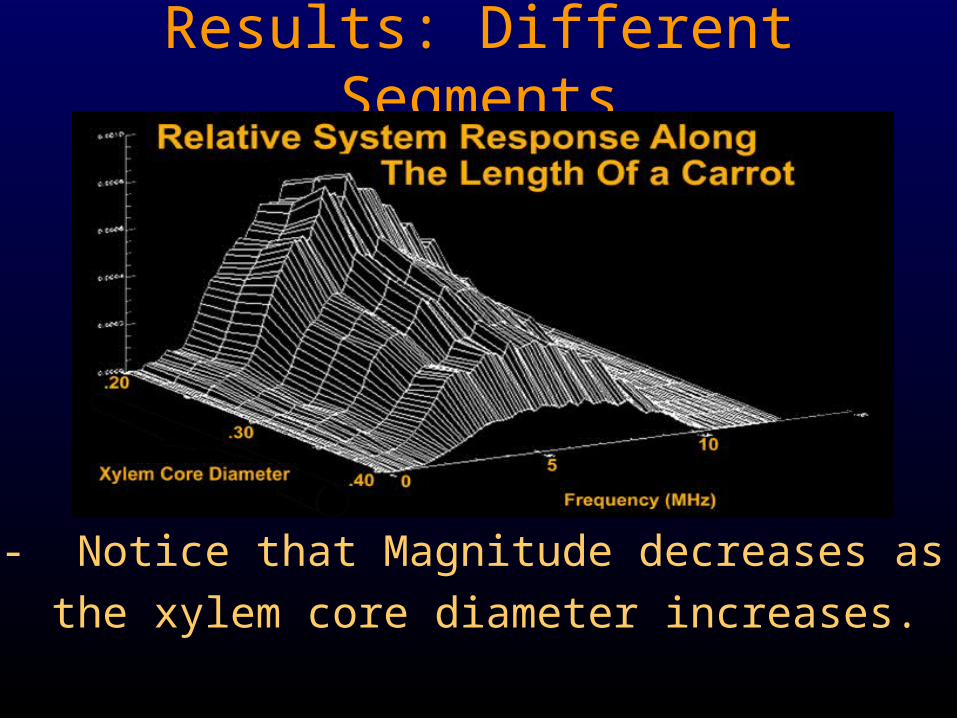
Results: Different Segments
- Notice that Magnitude decreases as
the xylem core diameter increases.
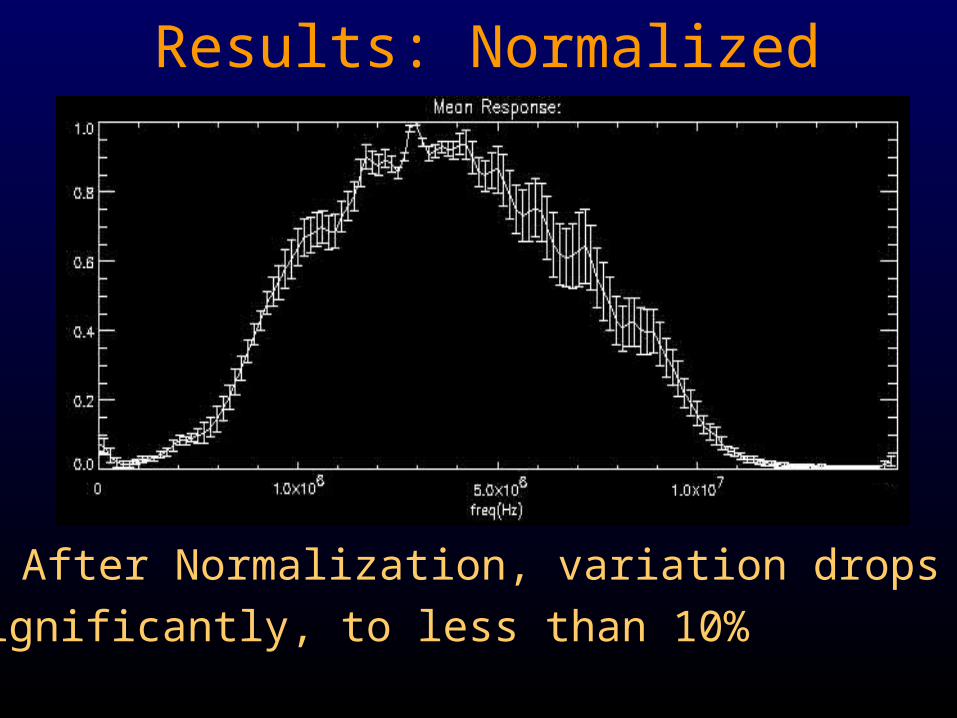
Results: Normalized
- After Normalization, variation drops
significantly, to less than 10%
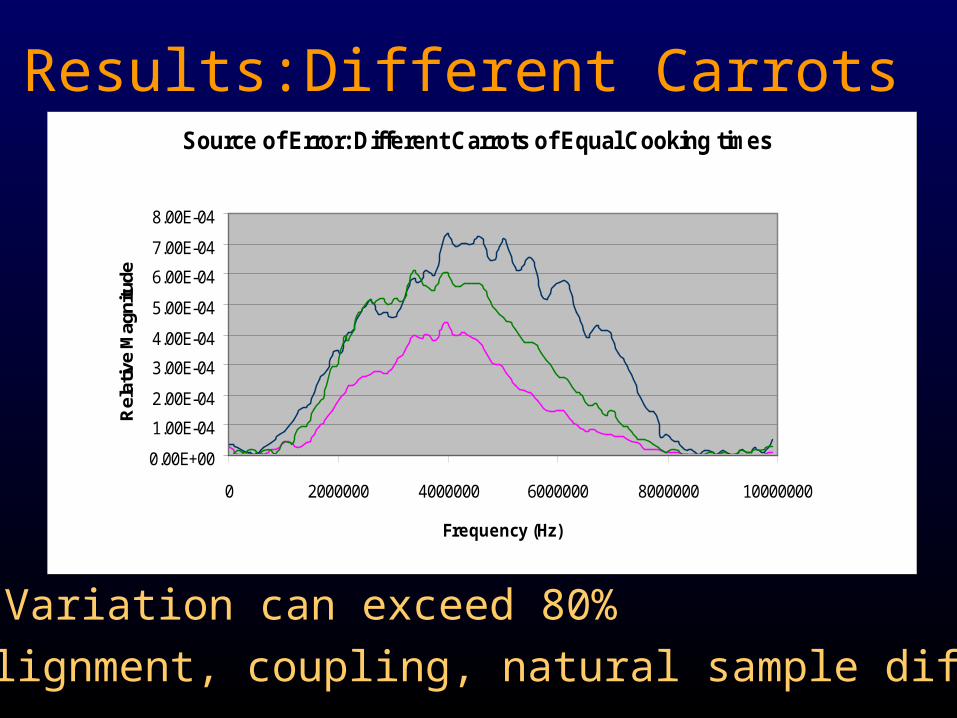
Results:Different Carrots Source of Error: Different Carrots of Equal Cooking times
0.00E+00
1.00E-04
2.00E-04
3.00E-04
4.00E-04
5.00E-04
6.00E-04
7.00E-04
8.00E-04
0 2000000 4000000 6000000 8000000 10000000
Frequency (Hz)
Rel
ativ
e M
agni
tude
- Magnitude Variation can exceed 80%
- From alignment, coupling, natural sample differences
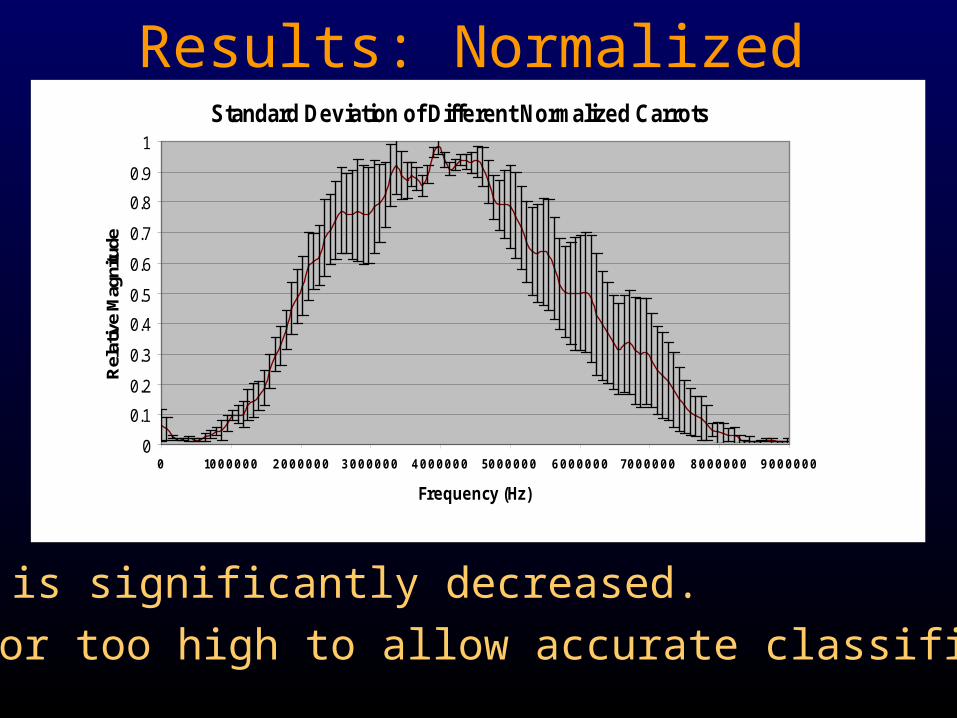
Results: NormalizedStandard Deviation of Different Normalized Carrots
0
0.1
0.2
0.3
0.4
0.5
0.6
0.7
0.8
0.9
1
0 1000000 2000000 3000000 4000000 5000000 6000000 7000000 8000000 9000000
Frequency (Hz)
Rel
ativ
e M
agni
tude
- Variation is significantly decreased.
- Is error too high to allow accurate classification?

Results: Various Cooked Carrots
- Frequency response changes can be explained by
the structural changes invoked through cooking.

Results: Normalized Response LUT

Results: Normalized Response LUT
Side View of
Normalized
Response LUT
0 5 10
Frequency (MHz)
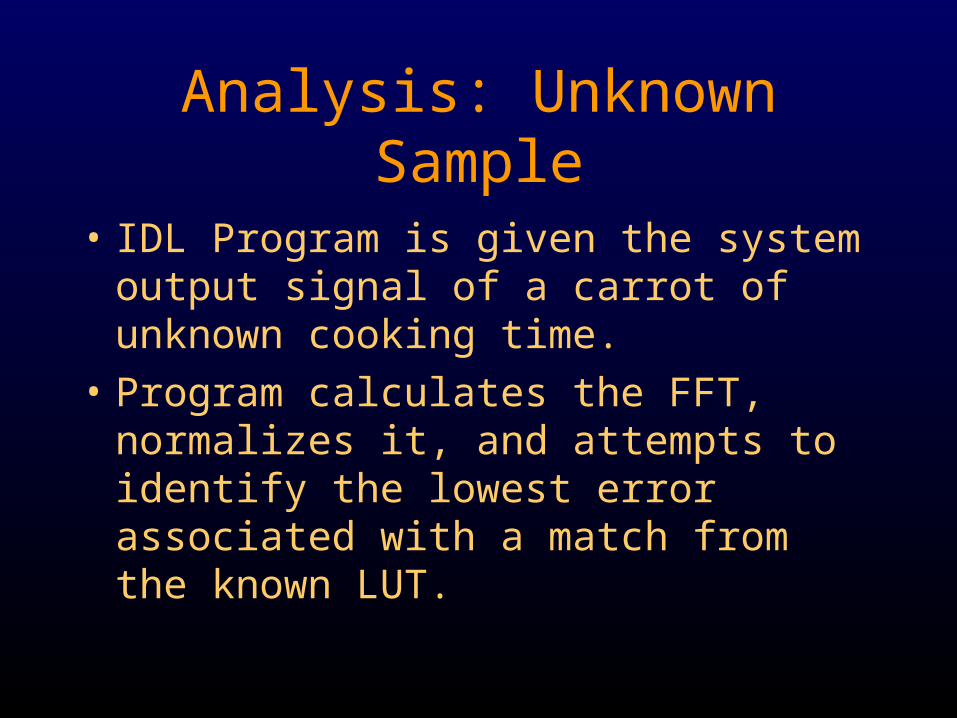
Analysis: Unknown Sample
• IDL Program is given the system output signal of a carrot of unknown cooking time.
• Program calculates the FFT, normalizes it, and attempts to identify the lowest error associated with a match from the known LUT.
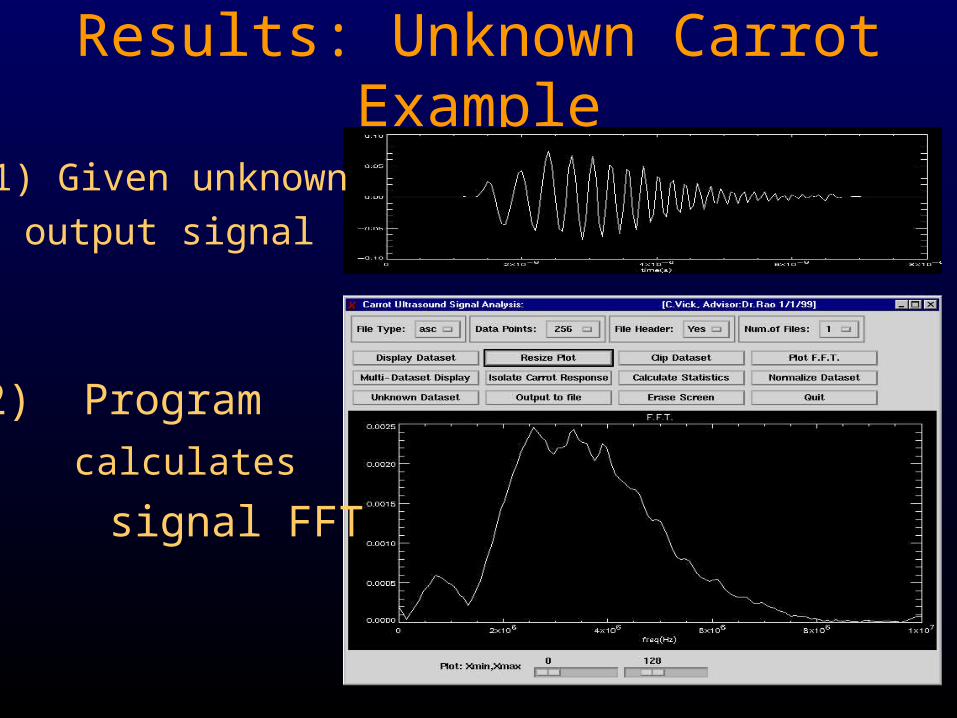
Results: Unknown Carrot Example
1) Given unknown
output signal
2) Program
calculates
signal FFT
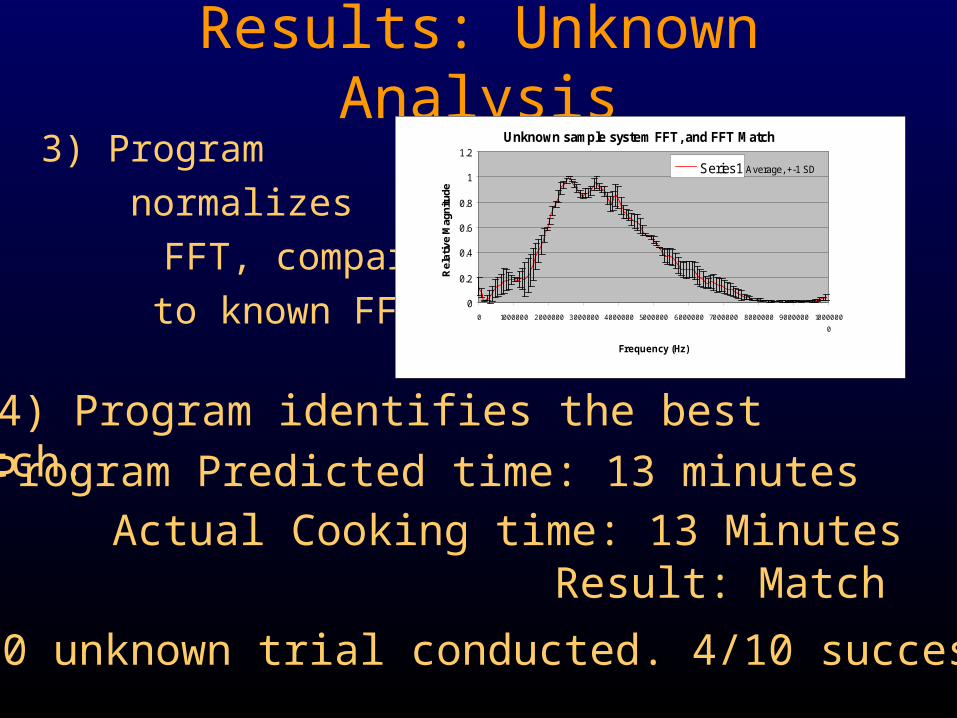
Results: Unknown Analysis3) Program
normalizes
FFT, compares
to known FFTs.
Unknown sample system FFT, and FFT Match
0
0.2
0.4
0.6
0.8
1
1.2
0 1000000 2000000 3000000 4000000 5000000 6000000 7000000 8000000 9000000 1000000
0
Frequency (Hz)
Rel
ativ
e M
agni
tude
Series1 Average, +-1 SD
4) Program identifies the best match. 5) Program Predicted time: 13 minutes
6) Actual Cooking time: 13 MinutesResult: Match
Only 10 unknown trial conducted. 4/10 successful.

Conclusions• Focused on the frequency response of
carrots.• Magnitude variation is important factor. • By normalizing, variation among same
sample, or different segments is lowered substantially.
• Large signal variation among different carrots.

Conclusion:
• IDL analysis needs further attention; not all carrots can be identified.
• Combining analysis with the previously studies variables of Velocity and Attenuation would likely provide a more robust tissue identification model.
Special Thanks to:Dr. Navalgund Rao
Maria Helguera
Brad Miller


