

This document is downloaded from DR‑NTU (https://dr.ntu.edu.sg)Nanyang Technological University, Singapore.
Highly integrated biosensors based on fiber optics
Zhang, Mengying
2018
Zhang, M. (2018). Highly integrated biosensors based on fiber optics. Doctoral thesis,Nanyang Technological University, Singapore.
https://hdl.handle.net/10356/89954
https://doi.org/10.32657/10220/47180
Downloaded on 17 Mar 2022 20:51:17 SGT

HIGHLY INTEGRATED BIOSENSORS
BASED ON FIBER OPTICS
ZHANG MENGYING
SCHOOL OF ELECTRICAL & ELECTRONIC
ENGINEERING
2018

Highly Integrated Biosensors Based on
Fiber Optics
Zhang Mengying
School of Electrical & Electronic Engineering
A thesis submitted to the Nanyang Technological University
in partial fulfillment of the requirement for the degree of
Doctor of Philosophy
2018


Acknowledgements
I
Acknowledgements
During my Ph.D. journey in the last four years, I received so much kind help and
support from my professors, colleagues and beloved ones. I would like to express my
sincere appreciations to them.
First and foremost, I would like to express my great gratitude towards my
supervisors, Prof. Wei Lei and Prof. Shum Ping. Prof. Wei inspires me with innovative
research ideas, equips me with experimental and analytical skills and guides me to
overcome difficulties during my Ph.D. study. Under his patient guidance, I gradually
get to know what research is. The professional attitude and learning skills he taught me
will benefit my whole career. Prof. Shum has always been supportive throughout the
years. He is always willing to share his valuable experience with me and introduce
collaboration opportunities to me. I also received lots of encouragement from him,
which gives me hope and courage to persist in research work.
I would like to extend my sincere thankfulness to Dr. Li Kaiwei, Dr. Wu
Zhifang and Dr. Hu Juanjuan. They pass their precious research experience on to me
unreservedly. Communicating with them has always helped me get a deeper
understanding on my research topics. I also would like to thank my wonderful
colleagues Dr. Huang Tianye, Dr. Xu Zhilin, Dr. Zhang Ting, Dr. Chen Ming, Dr. Chen
Mengxiao, Dr. Jin Yunxia, Dr. Zhang Nan, Zhang Jing, Wu Tingting, Ma Shaoyang,
Wang Zhe, Wang Zhixun, Yang Jiao and Qi Miao. They provide me with lots of kind
help to my research work and enrich my campus life with much joy.
Last but not least, I express my love to my parents and grandparents. Their love
gives me the greatest happiness and the courage to cope with any challenges.

Acknowledgements
II

Table of Contents
III
Table of Contents
Acknowledgements ........................................................................................................................... I
Abstract ............................................................................................................................................ V
List of Figures ................................................................................................................................ VII
List of Abbreviations .....................................................................................................................XV
Chapter 1 Introduction .................................................................................................................... 1
1.1 Background and Motivation .......................................................................................................... 1
1.2 Objectives ...................................................................................................................................... 5
1.3 Major Contributions ...................................................................................................................... 6
1.4 Organization ................................................................................................................................. 8
Chapter 2 Literature Review ......................................................................................................... 10
2.1 Fiber-Optic Sensing Schemes ...................................................................................................... 10 2.1.1 Long Period Fiber Grating................................................................................................ 10 2.1.2 Side-Polished Optical Fiber............................................................................................... 12 2.1.3 Microfiber ........................................................................................................................... 14
2.2 Fiber-Optic Magnetic Field Sensors ........................................................................................... 16 2.2.1 Magnetic Fluid ................................................................................................................... 16 2.2.2 Magnetic Fluid and Optical Fiber Based Magnetic Sensors .......................................... 19
2.3 Surface Plasmon Resonances ...................................................................................................... 21 2.3.1 Drude Model ....................................................................................................................... 21 2.3.2 SPR Theory ........................................................................................................................ 22 2.3.3 LSPR Theory ...................................................................................................................... 25 2.3.4 Fiber-Optic SPR/LSPR Biosensors .................................................................................. 28
2.4 Nanomaterials Based Plasmonic Biosensing .............................................................................. 32 2.4.1 Graphene Enhanced Plasmonic Biosensing ..................................................................... 34 2.4.2 TMO Based Plasmonic Biosensing ................................................................................... 38 2.4.3 Macrocyclic Supramolecules Based Plasmonic Biosensing ............................................ 42
Chapter 3 Magnetic Field Sensor Based on Magnetic Fluid Coated LPG .................................... 45
3.1 LPG Characterization ................................................................................................................. 45
3.2 Detection of Magnetic Field ........................................................................................................ 48
3.3 Summary ...................................................................................................................................... 51
Chapter 4 Hybrid Graphene- on-Gold Plasmonic Fiber-Optic Biosensor .................................... 52
4.1 Design and Numerical Analysis .................................................................................................. 52
4.2 Fabrication and Characterization of Gold-Coated Side-polished Fiber .................................... 58
4.3 Graphene/Gold Hybrid Plasmonic Sensor ........................................................................... 61

Table of Contents
IV
4.3.1 Graphene Transfer............................................................................................................. 61 4.3.2 Characterization of Graphene/Gold Hybrid Plasmonic Sensor ..................................... 64
4.4 ssDNA Detection ......................................................................................................................... 65
4.5 Summary ...................................................................................................................................... 68
Chapter 5 Electron-Rich 2D MoO3 for Highly Integrated Plasmonic Biosensing ........................ 69
5.1 Design and Construction of Biosensor ........................................................................................ 69 5.1.1 Biosensor Configuration .................................................................................................... 69 5.1.2 Synthesis and Characterization of MoO3 Nanoflakes ..................................................... 70 5.1.3 Integration of MoO3 Nanoflakes and Microfiber ............................................................ 74
5.2 BSA Detection .............................................................................................................................. 77
5.3 Numerical Analysis ...................................................................................................................... 79
5.4 Summary ...................................................................................................................................... 82
Chapter 6 CD-Modified AuNPs Based Fiber-Optic LSPR Biosensor .......................................... 83
6.1 Design and Configuration ........................................................................................................... 84
6.2 Synthesis and Characterization of AuNPs ................................................................................... 85
6.3 Selective Detection of Cholesterol ............................................................................................... 91
6.4 Summary ...................................................................................................................................... 95
Chapter 7 Highly-Birefringent MOF Based SPR Sensor .............................................................. 97
7.1 Configuration and Principle ........................................................................................................ 98
7.2 Phase Birefringence and Sensing Accuracy .............................................................................. 101
7.3 Influencing Factors on SPR Behavior ....................................................................................... 104
7.4 Summary .................................................................................................................................... 107
Chapter 8 Summary and Future Work ....................................................................................... 108
8.1 Summary and Discussion .......................................................................................................... 108
8.2 Future Work .............................................................................................................................. 110
Publications.................................................................................................................................. 112
References .................................................................................................................................... 115

Abstract
V
Abstract
Benefited from the advantages of flexibility, miniaturization, immunity to
electromagnetic interference and compatibility with today’s well-developed optical
fiber based telecommunication system, fiber-optic sensors show huge potentials with
the increasing demand of comprehensive perception in every aspect of life. Especially
in the practices of biosensing, optical fibers are prevailing platforms for highly-
sensitive, real-time, label-free and in vivo detection due to their high degree of
integration, dielectric nature, non-toxicity and chemical inertness. In this thesis, we
investigate several approaches focusing on the proper design of optical fiber structure
and the efficient integrations with functional materials to enhance the effectiveness of
light-matter interaction and the reliability of biosensing output.
Firstly, we develop a highly sensitive magnetic field sensor based on magnetic-
fluid-coated long period fiber grating (LPG). The emergence of optomagnetic
biosensors in recent years brings the needs of all-optical, integrated and flexible
magnetic field sensors. Benefited from the acute response of LPG to ambient medium
and the remarkable magneto-optic properties of magnetic fluid, our proposed magnetic
field sensor provides a superior sensitivity of 0.154 dB/Gauss. Secondly, we investigate
the possibility of improving conventional fiber-optic plasmonic biosensors by
employing a graphene/gold hybrid plasmonic structure. Introducing a graphene layer
not only strengthens the surface plasmons but also acts as an excellent replacement of
surface functionalization. We construct a biosensor that integrates such hybrid
plasmonic architecture with a side-polished optical fiber and achieves a limit of
detection (LOD) of ssDNA as low as 1 pM. Thirdly, we explore the potentials of
adopting transition metal oxides as an alternative class of plasmonic 2D materials for
biosensing in well-developed visible and near-infrared (NIR) optical windows, since
plasmonics of common 2D materials locate intrinsically at mid-infrared range. Here we
demonstrate the feasibility of integrating heavily-doped 2D MoO3 with fiber-optic
platform and achieving strong surface plasmons in NIR range, which facilities low
LOD of biomolecules. Fourthly, we realize one-step green synthesis of -cyclodextrin
(-CD) capped gold nanoparticles. The macrocyclic supramolecular -CD serves as
Abstract
VI
both reducing and stabilizing agent during synthesis and also biocompatible selective
surface functionalization for target molecule recognition. Benefited from the highly
efficient host-guest interaction between -CDs and cholesterol molecules, we achieve
an ultra-sensitive microfiber based cholesterol biosensor with good biocompatibility,
specific selectivity and LOD as low as 5 aM. Lastly, we propose a highly-birefringent
microstructured optical fiber (MOF) based plasmonic biosensor. Birefringence
commonly exists in fiber-optic platforms and external perturbations would induce
polarization crosstalk thereby destabilize the sensor output. We theoretically prove that
the output instability due to polarization crosstalk can be effectively suppressed when
the birefringence of MOF is larger than 2 × 10⁻⁴. Here, we design a polarization
maintaining MOF with birefringence as large as 4 × 10⁻⁴, which can suppress the impact
of polarization crosstalk to be negligible. Meanwhile, our proposed highly-birefringent
MOF based plasmonic sensor also provides a high sensitivity of 3100 nm/RIU.
In the studies we conducted so far, it is shown that the vast possibilities of
optical fiber design and the breakthroughs of functional nanomaterials facilitate
promising potentials in achieving highly sensitive and highly integrated biosensors.
Further improvements in the specificity, sensitivity, biocompatibility and integration
of fiber-optic biosensors will be carried out in the near future.

List of Figures
VII
List of Figures
Figure 1-1. Schematic illustration of conventional configuration of (a) SPR [5] and (b)
LSPR [6]. .................................................................................................................................. 1
Figure 1-2. Representative fiber-optic SPR/LSPR biosensing platforms based on (a) cascaded
unclad optical fibers decorated with noble metal nanoparticles [11]; (b) unclad optical fiber
coated with thin gold film [10]; (c) optical fiber endface integrated with metallic
nanostructures [2]. ..................................................................................................................... 2
Figure 1-3. Magnetic nanoparticles assisted optical biosensor [54]. ........................................ 5
Figure 2-1. The schematic illustration of LPG and its mode couplings [60]. ......................... 11
Figure 2-2. (a) The wavelength shift of LPG against surrounding refractive index [63]; (b) The
wavelength shift of LPG resonant wavelength against a wide range of surrounding refractive
index [64]. ............................................................................................................................... 11
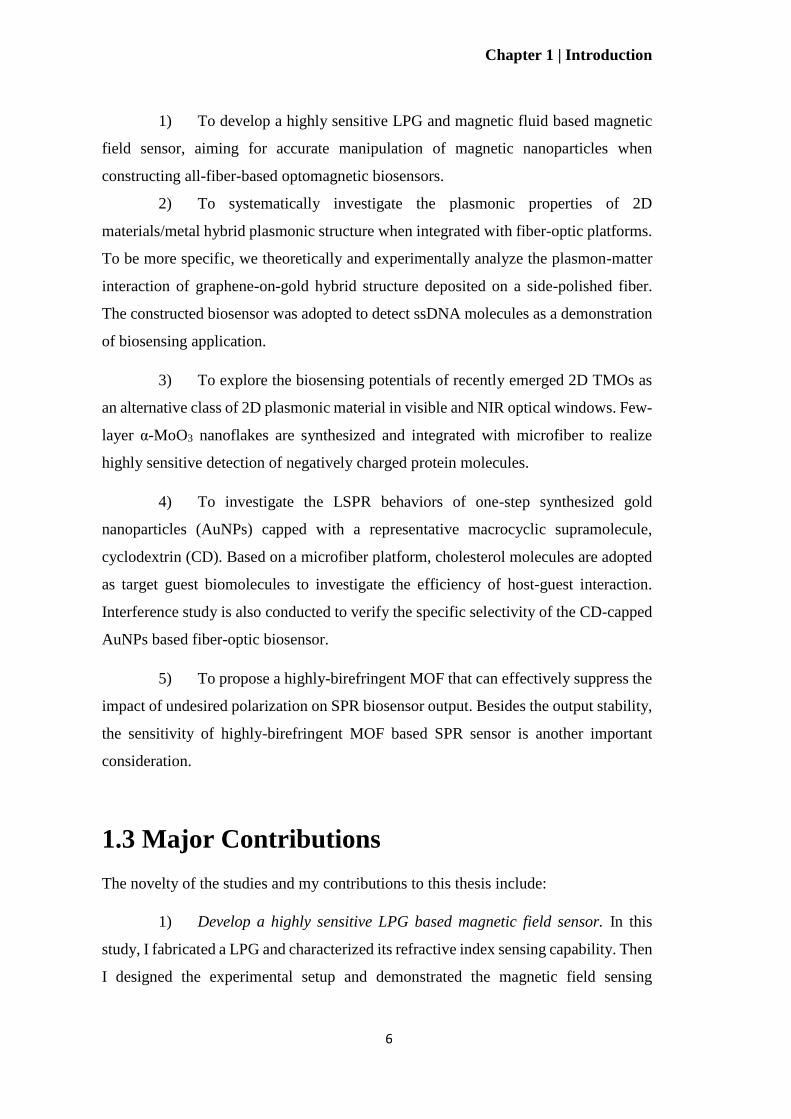
Figure 2-3. Schematic diagram of quartz block assisted side-polished fiber fabrication [82]. 13
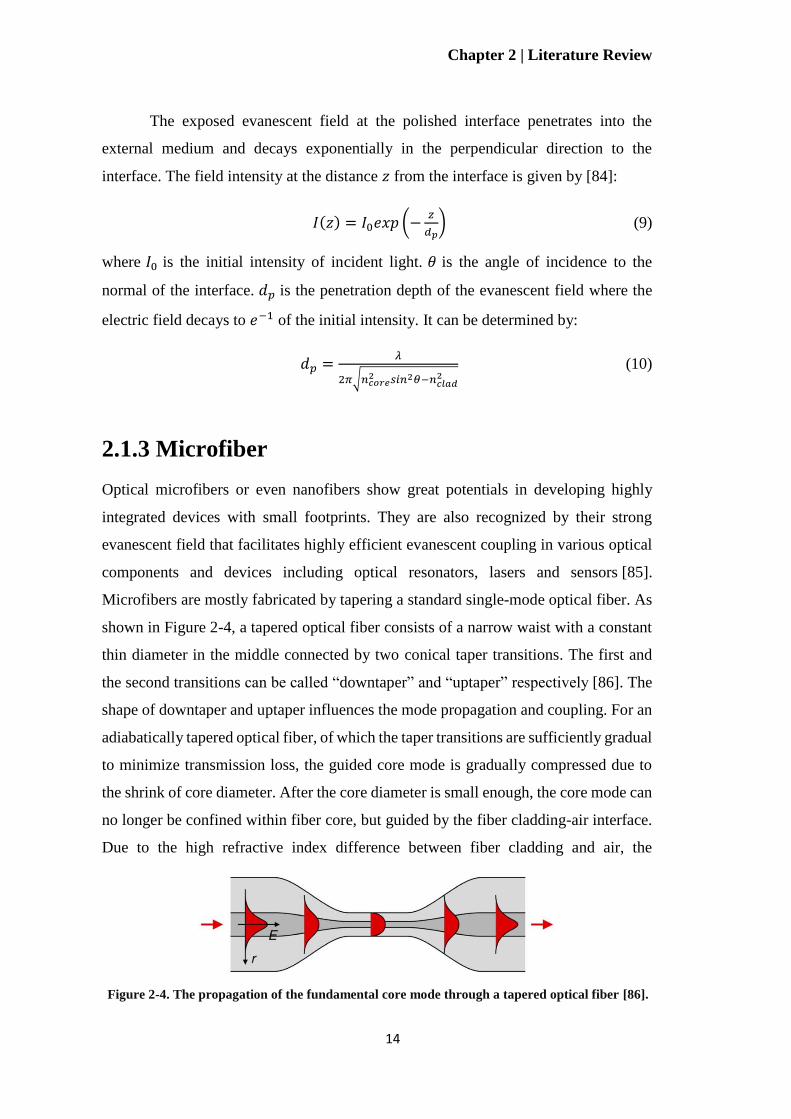
Figure 2-4. The propagation of the fundamental core mode through a tapered optical fiber [86].
................................................................................................................................................. 14
Figure 2-5. The structural parameters of a taper transition [88]. ............................................ 15
Figure 2-6. The setup for fabricating an adiabatic tapered optical fiber [86]. ........................ 16
Figure 2-7. Nanostructure of magnetic fluid particles [94]. .................................................... 17
Figure 2-8. The magnetic nanoparticles gradually aggregate into (a) short needles, (b) columns
mixed with short needles and (c) columnar glassy as the magnetic field strengthens; (d) The
top view of hexagonally arranged columns [102]. .................................................................. 18
Figure 2-9. (a) The side view and (b) the top view of the hexagonal columnar phase of magnetic
fluid [101]. .............................................................................................................................. 18
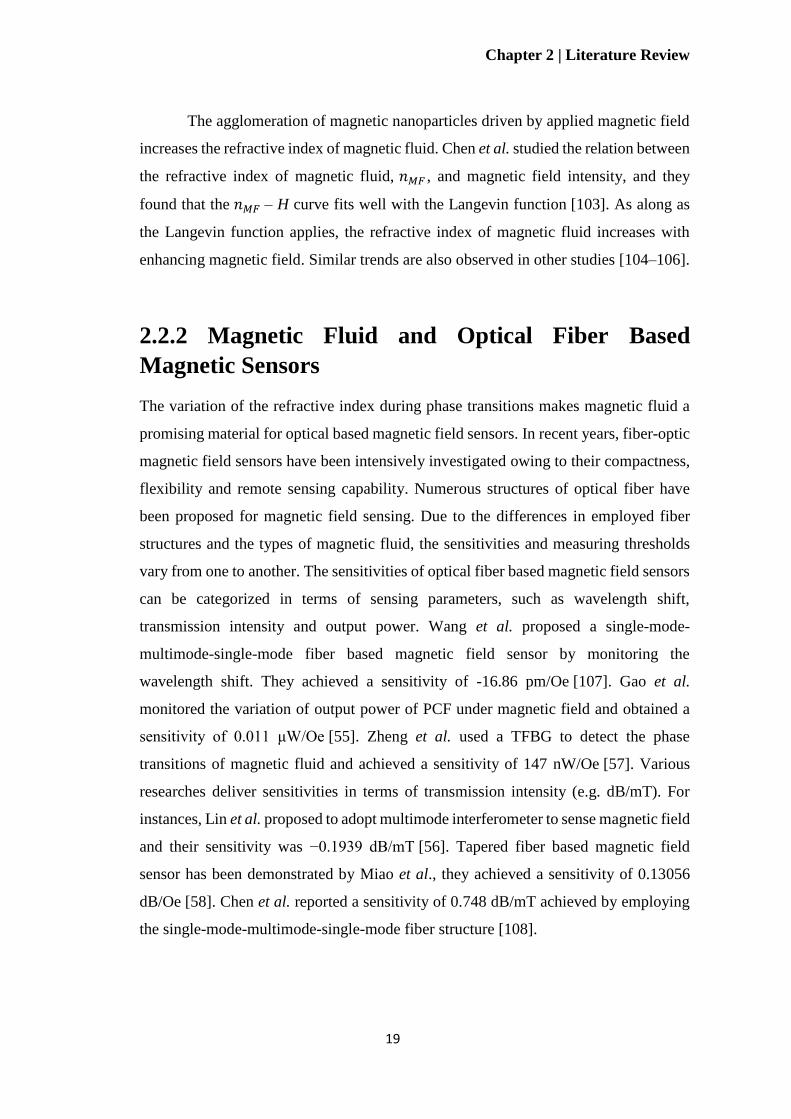
Figure 2-10. The schematic illustration of propagating SPR [124]. ....................................... 23
Figure 2-11. (a) The schematic illustration of Kretschmann configuration; (b) The plots of
propagation constants of direct light in dielectric medium (ks), the evanescent wave of total
refractive incident beam at the prism-metal interface (Kev = kpsinθ), the evanescent wave of
direct light in prism (kp), the SPP propagating at the metal-dielectric interface (Ksp(M/D))
and the SPP propagating at the metal-prism interface (Ksp(M/P)) [123]. ............................. 24
Figure 2-12. The schematic illustration of propagating SPR [129]. ....................................... 25
Figure 2-13. The formation of AuNPs using the Turkevich method [131]. ............................ 27

List of Figures
VIII
Figure 2-14. The colors of aqueous solutions of gold nanospheres with increasing particle size.
The particle sizes shown in (A-E) vary from 4 nm to 40 nm. All red bars represent 100 nm [133].
................................................................................................................................................. 27
Figure 2-15. The redshift of LSPR peak as the AuNP size increases from 9 nm to 99 nm [142].
................................................................................................................................................. 28
Figure 2-16. SPR/LSPR sensors based on (a) LPG [147]; (b) TFBG [175]; (c) tapered fiber
with core diameter (ρ) of 50 μm and length of sensing region (L) of 2 mm [8]; (d) side-polished
fiber [8]; (e) U-shaped fiber [146]; (f) patterned fiber end face [146]. ................................... 29
Figure 2-17. Representative SPR/LSPR biosensors based on (a) PCF with hexagonal arranged
air holes [12]; (b) PCF with liquid core [159]; (c) suspended-core MOF [163]; (d) semicircular
channel MOF [166]; (e) semicircular channel MOF [165]; (f) exposed core MOF [168]; (g)
exposed core grapefruit MOF [169]; (h) H-shaped MOF [170]. Λ: the pitch of photonic crystal
air holes. .................................................................................................................................. 30
Figure 2-18 (a) A typical functionalization strategy of SPR immunosensor [40]. EDC/NHS: 1-
Ethyl-3-(3-dimethylaminopropyl)carbodiimide/N-Hydroxysuccinimide. CNT: carbon
nanotube. (b) AuNPs can form conjugation with numerous functional molecules mostly via
gold-thiolate bonds [41]. ......................................................................................................... 32
Figure 2-19. (a) The hexagonal lattice of graphene. Each carbon atom is sp2 hybridized [185].
(b) The band structures of graphene. VB and CB touch at the conical point [16]. ................. 34
Figure 2-20. Schematic illustration of the energy bands of graphene and metal (a) before and
(b) after they are in contact. Φ1 : the work function of metal. ΦG : the work function of
graphene [192]. ........................................................................................................................ 36
Figure 2-21. Hybrid plasmonic architectures based on (a) monolayer graphene/gold [197]; (b)
multilayer graphene/Py/gold [21]; (c) graphene oxide/gold [29]; (d) graphene-MoS2/gold [31].
................................................................................................................................................. 37
Figure 2-22. Free electrons are doped to TMOs via oxygen vacancies. (a) The pristine TMO
lattice. (b) Two electrons are left in the lattice defect after the removal of an oxygen atom.
Yellow spheres: metal cations. Red spheres: oxygen anions [203]. ........................................ 38
Figure 2-23. The polymorphs of (a) α-MoO3 (b) β-MoO3 (c) h-MoO3 [205]. ........................ 38
Figure 2-24. A typical process of synthesizing α-MoO3 nanoflakes by liquid phase
exfoliation [212]. ..................................................................................................................... 40
Figure 2-25. (a) The SEM image of α-MoO3 nanoflakes [213]. (b) The TEM characterization
of α-MoO3 nanoflakes [39]. The AFM characterization of (c) monolayer and bilayer α-MoO3
nanoflakes [212] and (d) multilayer α-MoO3 nanoflakes [201]. ............................................. 40
Figure 2-26. Molecular structures of some common macrocyclic supramolecules [282]. ...... 43

List of Figures
IX
Figure 2-27. (a) Molecular structures and structural parameters of -, - and -CD [283]. (b)
The side view and top view of the inclusion complexation formed by -CD and cholesterol
molecules [284]. ...................................................................................................................... 43
Figure 2-28. Synthesis process of (a) carboxylatopillar[5]arene capped AuNPs [46]; (b) CD
capped AuNPs [226]; (c) CD capped AgNPs, AuNPs and Agcore-Aushell/Aucore-Agshell
bimetallic nanoparticles [49]. .................................................................................................. 44
Figure 3-1. The transmission spectrum of LPG. ..................................................................... 46
Figure 3-2. Variation of the attenuation band of LPG as the surrounding refractive index
increases. ................................................................................................................................. 47
Figure 3-3. Wavelength shift and transmission minimum of LPG against surrounding refractive
index. ....................................................................................................................................... 47
Figure 3-4. The experiment setup of magnetic field sensor. ................................................... 48
Figure 3-5. Variation of LPG attenuation band along with increasing magnetic field strength.
................................................................................................................................................. 49
Figure 3-6. Wavelength shift and transmission minimum of LPG against magnetic field ..... 50
Figure 4-1. Configuration of proposed graphene-on-gold SPR biosensor. ssDNA molecules are
adsorbed on single sheet of graphene through 𝜋-stacking interactions between the aromatics
rings of nucleobases and honeycomb latticed carbon atoms. .................................................. 53
Figure 4-2. The HE11y mode patterns of side-polished optical fiber based SPR sensors (a)
without and (b) with graphene enhancement. Red arrows: the electric field directions of HE11y
modes. ..................................................................................................................................... 54
Figure 4-3. The gold film thickness is 50 nm. (a) Transmission spectra of conventional side-
polished optical fiber based SPR sensor and graphene enhanced SPR sensor. (b) Comparison
of sensitivities of conventional SPR and graphene enhanced SPR using wavelength
interrogation (blue solid line and dashed line) and intensity interrogation (red solid line and
dashed line). ............................................................................................................................ 54
Figure 4-4. The gold film thickness is 40 nm. (a) Transmission spectra of conventional side-
polished optical fiber based SPR sensor and graphene enhanced SPR sensor. (b) Comparison
of sensitivities of conventional SPR and graphene enhanced SPR using wavelength
interrogation (blue solid line and dashed line) and intensity interrogation (red solid line and
dashed line). ............................................................................................................................ 55
Figure 4-5. The gold film thickness is 30 nm. (a) Transmission spectra of conventional side-
polished optical fiber based SPR sensor and graphene enhanced SPR sensor. (b) Comparison
of sensitivities of conventional SPR and graphene enhanced SPR using wavelength
interrogation (blue solid line and dashed line) and intensity interrogation (red solid line and
dashed line). ............................................................................................................................ 55
List of Figures
X
Figure 4-6. Normalized electric field intensities of excited SPPs when no graphene layer, single
layer graphene, 2-layer graphene and 3-layer graphene are deposited on the 30 nm gold film
coated on the side-polished facet of fiber. (Inset) Distributions of normalized electric field
intensity over the entire simulated geometry........................................................................... 57
Figure 4-7. Sensitivities corresponding to single, double and triple layers of graphene when
using (a) wavelength interrogation and (b) intensity interrogation. ........................................ 57
Figure 4-8. Schematic diagram of side-polished single-mode optical fiber. ........................... 58
Figure 4-9. The SEM image of the cross section of the side-polished fiber. .......................... 59
Figure 4-10. Schematic diagram of side-polished single-mode optical fiber. ......................... 59
Figure 4-11 (a) Transmission spectra of a side-polished fiber based SPR sensor with gold
thickness of 30 nm. (b) Measured sensitivities that correspond to wavelength and intensity
interrogations. .......................................................................................................................... 60
Figure 4-12. (a) Microscopic view of the boundary of transferred single layer graphene (b) The
boundary between the polished and the unpolished region of optical fiber which is fully covered
with homogeneously deposited graphene. ............................................................................... 62
Figure 4-13. (a) Raman spectrum of monolayer CVD-grown graphene on copper foil. (b)
Raman spectrum of transferred monolayer graphene on gold-coated fiber. (c) Raman spectra at
5 different positions along the longitude of optical fiber. ....................................................... 62
Figure 4-14. Comparison of transmission spectra of configurations with and without graphene.
................................................................................................................................................. 63
Figure 4-15. The variations of transmission spectrum of (a) gold-coated side-polished fiber
based plasmonic sensor and (b) graphene/gold hybrid plasmonic side-polished fiber based
sensor. ...................................................................................................................................... 64
Figure 4-16. The comparison of the sensitivities before and after transferring graphene for (a)
wavelength interrogation and (b) intensity interrogation. ....................................................... 64
Figure 4-17. (a) Change of transmission spectra of graphene enhanced SPR fiber sensor when
detecting concentrations of ssDNA; (b) Variations of transmission minimum and resonant
wavelength against ssDNA concentrations (log pM). ............................................................. 66
Figure 4-18. (a) The variations of transmission spectrum as ssDNA concentration increases
when there is no graphene on thin gold film. (b) The comparison of the sensitivities to ssDNA
solutions with and without graphene transfer. ......................................................................... 67
Figure 5-1. Schematic diagram of fiber-optic biosensor integrated with heavily-doped MoO3-x
nanoflakes. Inset 1: Crystal structure of stable orthorhombic α-MoO3. Inset 2: Molecular
structure of BSA protein. ........................................................................................................ 70
Figure 5-2. The XRD pattern of polycrystalline α-MoO3 powder .......................................... 71
List of Figures
XI
Figure 5-3. Color variations of MoO3 nanoflakes suspensions along with increasing doping
extent. ...................................................................................................................................... 71
Figure 5-4. (a) Low-magnification TEM of the exfoliated MoO3 nanoflakes. (b) SAED pattern
of MoO3 nanoflakes. (c) HRTEM of MoO3 nanoflakes. (d) AFM measurement of MoO3
nanoflakes. The average thickness of nanoflakes is ~2.8 nm and the lateral dimensions range
from tens of nm to ~1 µm. ...................................................................................................... 72
Figure 5-5. The evolvement of absorption spectrum from pristine MoO3 nanoflakes suspension
(black curve) to increasing doping extent. 2 mL pristine MoO3 nanoflakes suspensions are
added with 0, 50 µL, 60 µL, 70 µL and 80 µL 0.01 M NaBH4 respectively. ......................... 73
Figure 5-6. (a) XPS analysis of pristine MoO3. (b) XPS analysis of highly doped MoO3
nanoflakes. Mo6+ and Mo5+ coexist after doping. ................................................................... 74
Figure 5-7. Real-time monitoring of the transmission intensity of microfiber within 745 nm –
755 nm as MoO3-x nanoflakes are bonding to the microfiber surface. .................................. 75
Figure 5-8. (a) Morphology of MoO3-x nanoflakes on the SiO2 (285 nm)/Si substrate. The
nanoflakes are functionalized by the same method as microfiber functionalization. (b) AFM
characterization of MoO3-x nanoflakes dispersed on bare Si substrate without electrostatic
attractions. ............................................................................................................................... 76
Figure 5-9. (a) Fluorescent microscopic images of MoO3-x nanoflakes coated fibers that are
functionalized with different concentrations of BSA molecules labelled with Cy3 dyes. (b)
Absorption spectrum when MoO3-x nanoflakes are mixed with different BSA concentrations.
(c) Transmission spectra of the proposed biosensor when detecting incrementing BSA
concentrations. (d) Linear response of transmission minimum as a function of BSA
concentration in log-scale. ...................................................................................................... 77
Figure 5-10. (a) Simulated plasmon resonance band with the deduced Drude model of MoO3-x.
Inset: HE11 mode profile of MoO3-x nano-layer coated microfiber. (b) Simulated electric field
distribution near the MoO3-x nanolayer. Inset: Electric field distribution over the whole fiber
diameter. .................................................................................................................................. 81
Figure 5-11. (a) Electric field distribution over the diameter of a bare microfiber. Inset: HE11
mode profile of the bare microfiber. (b) Electric field distribution over the diameter of a MoO3-
x coated microfiber. Inset: HE11 mode profile of the MoO3-x coated microfiber. .................... 81
Figure 6-1. Schematic illustration of the proposed microfiber based biosensor. Inset 1: The
molecular structure of -CD. Inset 2: The molecular structure of cholesterol. ....................... 84
Figure 6-2. The evolvement of AuNPs solution absorption during the synthesis process. Inset:
The variation of solution color along with synthesis time. ..................................................... 85
Figure 6-3. The DLS measurements of AuNPs size distributions at different synthesis time. 86
Figure 6-4. The absorption of AuNPs solution after centrifugation and redispersion. Inset: the
color of purified AuNPs solution. ........................................................................................... 87

List of Figures
XII
Figure 6-5.SEM image of the as-prepared -CD-capped AuNPs. ....................................... 88
Figure 6-6. (a) Low-magnification TEM of -CD-capped AuNPs. (b) HRTEM of a single -
CD-capped AuNP. ................................................................................................................... 88
Figure 6-7. (a) The AuNPs size distribution of 30 min synthesis time measured by DLS. (b)
The comparison of AuNPs size distributions obtained from DLS measurement and TEM
observation. ............................................................................................................................. 89
Figure 6-8. The ξ-potential value of the -CD-capped AuNPs. .............................................. 90
Figure 6-9. The 1H NMR spectrum (300 MHz, D2O) of the β-CD-capped AuNPs. Inset:
Schematic -CD structure associated with corresponding chemical shifts and interaction with
AuNP surface. ......................................................................................................................... 90
Figure 6-10. The FTIR spectra of pristine -CD and -CD-capped AuNPs. .......................... 90
Figure 6-11. (a) C 1s XPS spectrum and (b) O 1s XPS spectrum of pristine -CD; (c) C 1s XPS
spectrum and (d) O 1s XPS spectrum of -CD-capped AuNPs. ............................................. 91
Figure 6-12. (a) The SEM image of the thinnest portion of microfiber. (b) The distribution of
the immobilized -CD-capped AuNPs on microfiber surface. ............................................... 92
Figure 6-13. (a) The variation of transmission spectrum as the cholesterol concentration
increases. (b) The response of transmission minimum against log-scale cholesterol
concentration. .......................................................................................................................... 93
Figure 6-14. An interference study with the existence of common substances in human serum.
The concentrations of interfering substances are added based on the realistic proportions in
human serum. .......................................................................................................................... 95
Figure 7-1. Mesh sizes around the boundaries of gold layer in numerical model. .................. 98
Figure 7-2. (a) Schematic drawing of the proposed MOF structure; (b) x-polarized and (c) y-
polarized core mode pattern calculated by FEM. .................................................................... 99
Figure 7-3. Effective indices of core mode and surface plasmon mode with refractive index of
analyte of 1.33 and gold layer thickness of 70 nm. ............................................................... 100
Figure 7-4. Changes of core mode transmission loss when refractive index of analyte increases
from 1.33 to 1.34. .................................................................................................................. 100
Figure 7-5. Mode patterns of (a) x- and (b) y-polarized core mode in conventional PCF with
50 nm gold layers and analyte refractive index of 1.38. ....................................................... 101
Figure 7-6. Loss spectra of MOF based SPR sensors when (a) d1/d2=0.95 (b) d1/d2=0.4 with
analyte refractive index of 1.38. ............................................................................................ 102
Figure 7-7. The relation between phase birefringence and the resonant wavelength offset.. 103

List of Figures
XIII
Figure 7-8. (a) Loss spectra and (b) Sensitivity curves of proposed SPR sensor when gold
thickness is 50, 60, 70 and 100 nm respectively. .................................................................. 105
Figure 7-9. Sensitivity curves when d1/d2 = 1.0, 0.6, 0.5 and 0.4 respectively. .................... 106

List of Figures
XIV

List of Abbreviations
XV
List of Abbreviations
1H NMR Proton Nuclear Magnetic Resonance
2D Two-Dimensional
AFM Atomic Force Microscopy
AuNPs Gold Nanoparticles
BSA Bovine Serum Albumin
CB Conduction Band
CD Cyclodextrin
CVD Chemical Vapor Deposition
Cy3 Cyanine 3
DI Deionized
DLS Dynamic Light Scattering
FEM Finite Element Method
FTIR Fourier-Transform Infrared Spectroscopy
HAuCl4 Chloroauric Acid
HRTEM High-Resolution Transmission Electron Microscopy
LOD Limit of Detection
LPG Long Period Fiber Grating
LSPR Localized Surface Plasmon Resonance
MIR Mid-Infrared
MOF Microstructured Optical Fiber
MoO3 Molybdenum Trioxide
MUA 11-Mercaptoundecanoic Acid

List of Abbreviations
XVI
MZI Mach–Zehnder Interferometer
NIR Near-Infrared
PAA Poly(allylamine)
PBS Phosphate Buffer Solution
PCF Photonic Crystal Fiber
PCR Polymerase Chain Reaction
PML Perfectly Matched Layer
PSS Poly(styrene sulfonate)
SAM Self-Assembled Monolayer
SEM Scanning Electron Microscope
SERS Surface-Enhanced Raman Scattering
SMF Single-Mode Fiber
SP Surface Plasmon
SPP Surface Plasmon Polariton
SPR Surface Plasmon Resonance
TEM Transmission Electron Microscopy
TFBG Tilted Fiber Bragg Grating
TMO Transition Metal Oxide
VB Valence Band
WGM Whispering Gallery Mode
WO3 Tungsten Oxide
XPS X-ray Photoelectron Spectroscopy

Chapter 1 | Introduction
1
Chapter 1 Introduction
1.1 Background and Motivation
Optical biosensors have been rapidly developed over the past decade thanks to their
great potentials in highly sensitive, real-time, label-free and in vivo detection [1].
Widely applied optical biosensing techniques are surface plasmon resonance (SPR),
localized surface plasmon resonance (LSPR), surface-enhanced Raman scattering
(SERS), whispering gallery mode (WGM) resonators, etc. [2,3]. Under the trend of
sensing system miniaturization, fiber-optic biosensors are favored by their compact
size, flexibility, remote and in situ sensing capability. So far, various optical fiber based
platforms have shown promising prospect in biosensing with high-degree of integration.
One crucial point of improving optical biosensing performance is to optimize
the light-matter interaction. Among various forms of light-matter interaction, SPR and
LSPR have captured intensive research interests due to their exceptional sensitivity.
SPR/LSPR arises from the collective electron oscillations of noble metals or electron-
rich semiconductors in resonance with incident light [4]. Conventionally SPR is
implemented by coating a prism base with a thin noble metal film that excites resonant
electron oscillations (Figure 1-1 (a) [5]), which are known as surface plasmon polariton
(SPP). SPP can only be excited by TM-polarized light and it exponentially decays into
the dielectric analyte thereby acutely responses to the variation of analyte refractive
index. Generally, the shift of resonant angle or resonant wavelength at which light
reflectance is minimum is used as the indication of biomolecules immobilization on the
metal surface. If the thin metal film is replaced with metallic nanoparticles, resonant
Figure 1-1. Schematic illustration of conventional configuration of (a) SPR [5] and (b) LSPR [6].

Chapter 1 | Introduction
2
electron oscillations can also be induced except that the surface plasmon is
nonpropagating, which is the so-called LSPR. The excitation of LSPR is not restrained
by the incident light polarization, thus it can be realized by both prism based reflection
configuration and transmission configuration (Figure 1-1 (b) [6]).
However, the aforementioned SPR/LSPR configurations are limited by the
bulky and non-flexible configuration especially under the increasing demand for
portable, point-of-care or in vivo biosensing devices. Fortunately, such shortcoming
can be addressed by optical fibers. Various optical fiber structures have been proven
feasible and shown promising prospect for SPR/LSPR biosensing, such as fiber
gratings, unclad fiber, side-polished fiber, microfiber, U-shaped fiber, etc. [2,7–11].
Figure 1-2 illustrates some typical configurations of fiber-optic SPR/LSPR biosensors.
Figure 1-2. Representative fiber-optic SPR/LSPR biosensing platforms based on (a) cascaded
unclad optical fibers decorated with noble metal nanoparticles [11]; (b) unclad optical fiber coated
with thin gold film [10]; (c) optical fiber endface integrated with metallic nanostructures [2].
In recent years, microstructured optical fiber (MOF) based SPR/LSPR sensors
have drawn much research interest. MOFs possess fine arrangement of air holes that
extend along the entire fiber. The fiber core dimension can be made very small to
facilitate strong light-matter interaction while still maintaining flexibility and
robustness thanks to the support of thin silica walls among air holes. The air holes
surrounding the small fiber core can be infiltrated with gas or liquid analyte so that the
strong evanescent field of guided light penetrates into the analyte. MOF based
SPR/LSPR biosensor significantly improves the integration and also reduces the
required sample volume. Several MOF structures have been proposed for SPR/LSPR

Chapter 1 | Introduction
3
biosensor, for instances, selectively coated photonic crystal fiber (PCF) [12],
semicircular channel MOF [13] and suspended-core MOF [14]. Since most MOF
designs for SPR/LSPR biosensors are asymmetric in two orthogonal polarization
directions, phase birefringence commonly exists. Hence, the resonant wavelengths
corresponding to two polarizations are apart while their transmission dips partially
overlap. As a consequence, external perturbations such as pressure, bending, twisting
or inaccurate input polarization would result in the offset of resonant wavelength.
Therefore, an MOF design that can suppress the measurement offset due to polarization
crosstalk meanwhile providing highly sensitive biosensing performance would be
promising.
Besides optimizing the configuration of fiber-optic platform, introducing
functional nanomaterials is also a promising solution to enhance the plasmon-matter
interaction [15]. The rapid development of two-dimensional (2D) materials in the past
decade redefines the frontier of biosensing with high degree of integration and
extremely low limit of detection (LOD). 2D materials show remarkable advantages in
surface-to-volume ratio, near field confinement and in situ tunability of plasmonic
properties [16,17]. Intrinsically the propagating SPR and LSPR can be supported by
2D materials and patterned 2D materials respectively in mid-infrared (MIR) or
terahertz range [18,19]. Although 2D materials based plasmonic biosensing in MIR
range has shown promising performance [20], it faces the challenges of achieving high
degree of integration, compactness and cost effectiveness when it comes to practical
applications. Hence the majority of researches focus on constructing hybrid plasmonic
2D materials/metal architectures, where the 2D materials deposited on conventional
plasmonic thin metal film serve as a functional layer to promote the plasmon-matter
interaction. Various hybrid plasmonic structures based on conventional prism
configuration have been proposed, including graphene/gold [21–24], graphene
oxide/gold [25–29], graphene-MoS2/gold [30–32], etc., and they have proven the
sensitivity enhancement benefited from the additional 2D materials functional layer.
However, most of these studies are preliminary theoretical investigations and
systematic exploration on such hybrid structures integrated with flexible waveguides
(e.g. optical fibers) has yet to be conducted.

Chapter 1 | Introduction
4
Since the intrinsic plasmonics of most common 2D materials locate within MIR
and terahertz regions, employing heavily doped few-layer transition metal oxides
(TMOs) as an alternative class of 2D plasmonic materials for frequently-used optical
windows have attracted considerable attention recently. Benefited from their outer-d
electrons, sufficient free carriers can be doped to TMOs via ionic intercalation to
facilitate surface plasmons in visible and near-infrared (NIR) frequencies [33–35]. At
the current stage, thin atomic layers of molybdenum trioxide (MoO3) doped with
abundant electrons are most widely studied due to the layered crystalized structure.
Strong plasmonic peaks of 2D MoO3 in visible or NIR range have been achieved
through several approaches [34,36–39]. However, the biosensing capability of the
highly integrated devices based on such plasmonic 2D MoO3 or other TMOs remains
unexplored.
Apart from the strong plasmon-matter interaction, surface functionalization that
equips SPR/LSPR platforms with good biocompatibility, biomolecules immobilization
and recognition is another key point to improve the biosensing performance.
Conventional SPR/LSPR biosensors normally require tedious surface functionalization
strategies to immobilize and recognize biomolecules [40,41]. Macrocyclic
supramolecules are revealed to be an excellent molecular recognition element as they
can form specific host-guest interaction with particular guest molecules. Also, they can
reduce the cytotoxicity of noble metal nanoparticles [42]. Recently, one-step synthesis
of macrocyclic supramolecules capped noble metal nanoparticles with good
monodispersity have been demonstrated, indicating that the synthesis and the surface
functionalization can be realized in one simple process [43–50]. However, the LSPR
biosensing potential of macrocyclic supramolecules modified noble metal
nanoparticles has not been comprehensively studied.
A new type of optomagnetic biosensor, in which magnetic nanoparticles are
functionalized with molecular recognition element and mixed with sample fluid [51–
53], emerges recently. Those magnetic nanoparticles are actuated by controllable
magnetic field and rapidly accumulate at the detection area (Figure 1-3 [54]). The high
refractive index of magnetic nanoparticles leads to substantial absorption and scattering
of evanescent field so that effectively improves the sensitivity. Magnetic field

Chapter 1 | Introduction
5
manipulated optical biosensor requires accurate measurement of applied field strength.
Driven by the purpose of achieving compact and all-optical sensing system, optical
fiber based magnetic field sensor attracts much attention. Due to its remarkable
magneto-optic properties, magnetic fluid is considered as a promising material for
magnetic field sensing. It is a colloidal suspension of surfactant-coated magnetic
nanoparticles. Each nanoparticle can be viewed as a magnet that is driven to align with
magnetic field direction. The change of optical properties of magnetic fluid during such
phase transition can be detected by fiber-optic sensors. Various optical fiber based
magnetic field sensors have been developed. Previous studies show the feasibility of
using PCF [55], multimode interferometer [56], tilted fiber Bragg grating (TFBG) [57]
and tapered fiber [58] for magnetic field sensing combined with magnetic fluid. A
magnetic field sensor simply based on long period fiber grating (LPG), however, is
rarely investigated.
Figure 1-3. Magnetic nanoparticles assisted optical biosensor [54].
1.2 Objectives
In this thesis, we aim to develop and validate well-designed fiber-optic platforms
coupled with functional nanomaterials to achieve promising biosensing features,
including high degree of integration, superior sensitivity, biocompatibility, molecular
recognition, reliable output, flexibility, etc. The main objectives of our works are:
Chapter 1 | Introduction
6
1) To develop a highly sensitive LPG and magnetic fluid based magnetic
field sensor, aiming for accurate manipulation of magnetic nanoparticles when
constructing all-fiber-based optomagnetic biosensors.
2) To systematically investigate the plasmonic properties of 2D
materials/metal hybrid plasmonic structure when integrated with fiber-optic platforms.
To be more specific, we theoretically and experimentally analyze the plasmon-matter
interaction of graphene-on-gold hybrid structure deposited on a side-polished fiber.
The constructed biosensor was adopted to detect ssDNA molecules as a demonstration
of biosensing application.
3) To explore the biosensing potentials of recently emerged 2D TMOs as
an alternative class of 2D plasmonic material in visible and NIR optical windows. Few-
layer α-MoO3 nanoflakes are synthesized and integrated with microfiber to realize
highly sensitive detection of negatively charged protein molecules.
4) To investigate the LSPR behaviors of one-step synthesized gold
nanoparticles (AuNPs) capped with a representative macrocyclic supramolecule,
cyclodextrin (CD). Based on a microfiber platform, cholesterol molecules are adopted
as target guest biomolecules to investigate the efficiency of host-guest interaction.
Interference study is also conducted to verify the specific selectivity of the CD-capped
AuNPs based fiber-optic biosensor.
5) To propose a highly-birefringent MOF that can effectively suppress the
impact of undesired polarization on SPR biosensor output. Besides the output stability,
the sensitivity of highly-birefringent MOF based SPR sensor is another important
consideration.
1.3 Major Contributions
The novelty of the studies and my contributions to this thesis include:
1) Develop a highly sensitive LPG based magnetic field sensor. In this
study, I fabricated a LPG and characterized its refractive index sensing capability. Then
I designed the experimental setup and demonstrated the magnetic field sensing
Chapter 1 | Introduction
7
capability of the LPG coated with magnetic fluid. The transmission spectrum of LPG
varies in accord with the increase of magnetic fluid refractive index due to the phase
transitions under the enhancing magnetic field strength. The acute response of LPG to
the ambient environment variation results in the high sensitivity of magnetic field,
which is superior to the state-of-the-art fiber-optic magnetic field sensors.
2) Demonstrate a fiber-optic plasmonic biosensor based on graphene-on-
gold hybrid plasmonic structure. First, I carried out numerical analysis to verify that
the addition of single graphene layer on thin gold film can enhance the SPP as well as
the bulk refractive index sensing performance to the greatest extent compared with
bilayer graphene/gold and multi-layer graphene/gold structures. Second, I fabricated a
side-polished optical fiber and coated it with thin gold film and then characterized its
SPR behavior. Then I deposited a single sheet of graphene on top of the thin gold film
via wet-transfer method. Again, I characterized the SPR behavior of the graphene/gold
hybrid structure and proved that additional graphene layer obviously enhances the SPR
sensing performance. Lastly, I validated the proposed biosensing platform by ssDNA
detection. A LOD as low as 1 pM is achieved, which is 3 orders of magnitude lower
than the conventional SPR simply based on thin gold film.
3) Realize a highly integrated biosensor based on 2D plasmonic MoO3-x
nanoflakes. First, I synthesized and characterized 2D morphologies of MoO3
nanoflakes. After doped with abundant electrons, the sub-stoichiometric MoO3-x is
formed and a strong plasmon resonance appears at NIR range. Then I integrated the
MoO3-x nanoflakes with microfiber via electrostatic interaction by facile layer-by-layer
self-assembly of polyelectrolytes. The deposited MoO3-x nanoflakes induce a strong
plasmon resonance in the same NIR range on microfiber transmission spectrum and
show good affinity to negatively charged biomolecules. To validate the proposed
biosensor, I applied it in the detection of bovine serum albumin (BSA). A LOD as low
as 1 pg/mL is achieved. I also carried out numerical calculation to deduce the Drude
model parameters of electron-rich MoO3-x based on the experimental results.
4) Construct a biocompatible fiber-optic LSPR biosensor based on CD-
modified AuNPs. In this work, I synthesized -CD-capped AuNPs in an eco-friendly
and facile one-step process. The plasmonic property and the morphology of the -CD-

Chapter 1 | Introduction
8
capped AuNPs are then characterized. Then I integrated the synthesized AuNPs with a
microfiber via electrostatic interaction and employed it in cholesterol detection.
Benefited from the highly efficient host-guest interaction between -CD and
cholesterol molecules, the proposed fiber-optic biosensor achieves an ultralow LOD of
cholesterol of 5 aM. I also conducted an interference study to verify the specific
detection of the biosensor to cholesterol molecules. It shows that common interfering
substances in human serum hardly affect the cholesterol detection.
5) Design and analyze a highly-birefringent MOF based SPR sensor with
high resistance to polarization crosstalk. This study theoretically investigates the
relation between phase birefringence and polarization crosstalk in MOF based SPR
sensors. I carried out numerical analysis and found that commonly existed
birefringence in MOF based SPR sensor designs induces considerable measurement
offset when polarization crosstalk occurs unless the birefringence exceeds a threshold
value, ~2×10⁻⁴. Therefore, I designed a MOF of which two central cladding air holes
in the lateral direction are intentionally enlarged to introduce high phase birefringence
to suppress the SPR sensing offset caused by polarization crosstalk. The proposed MOF
structure provides a birefringence as high as ~4.2×10⁻⁴, which can suppress the offset
to be negligible.
1.4 Organization
This thesis consists of 8 chapters:
Chapter 1 is an introduction. It introduces the background of optical fiber based
biosensors and the recent development of functional nanomaterials, states the
motivations and the objectives of our works and outlines the thesis organization.
Chapter 2 explains the concepts and the theories associated with fiber-optic
sensing schemes, SPR/LSPR and relevant functional nanomaterials. It also reviews the
state-of-the-art development of optical fiber based biosensors and functional
nanomaterials in recent years.

Chapter 1 | Introduction
9
Chapter 3 describes the experimental details and the results discussion of
magnetic field sensor based on magnetic-fluid-coated LPG.
Chapter 4 numerically analyzes the design parameters of side-polished fiber
based hybrid graphene-on-gold plasmonic biosensing platform, characterizes the
plasmonic properties of the constructed hybrid structure and demonstrates its
biosensing performance.
Chapter 5 demonstrates the synthesis and the characterization of heavily doped
2D MoO3-x nanoflakes. It also describes how to construct and validate the highly
integrated microfiber and nanoflakes based biosensing platform. The plasmonic
behaviors of MoO3-x nanoflakes are theoretically analyzed.
Chapter 6 constructs an LSPR fiber-optic biosensor based on -CD-capped
AuNPs. The eco-friendly synthesis and the characterization of the as-prepared AuNPs
are presented in this chapter. An interference study is conducted to verify the specific
molecular recognition of the proposed biosensor.
Chapter 7 shows the design of highly-birefringent MOF and numerically
analyzes how it suppresses the output inaccuracy caused by polarization crosstalk.
Chapter 8 draws the conclusions and puts forward future research plans.

Chapter 2 | Literature Review
10
Chapter 2 Literature Review
This chapter reviews the background and the theories of state-of-the-art fiber-optic
biosensors related to our research topics. First, we introduce some commonly employed
optical fiber based sensing schemes in Section 2.1, including LPG, side-polished
optical fiber and microfiber. Section 2.2 presents the magneto-optic properties of
magnetic fluid and their potentials in magnetic field sensing. Previously reported
magnetic fluid and optical fiber based magnetic field sensors are also summarized in
this section. Section 2.3 explains the theories associated with SPR and LSPR. The state-
of-the-art fiber-optic SPR/LSPR biosensors are also discussed in this section. Section
2.4 shows how some emerging nanomaterials, e.g. graphene, 2D TMOs and
macrocyclic supramolecules, improve the performance of conventional plasmonic
biosensing platforms and what potentials of these nanomaterials remained unexplored.
2.1 Fiber-Optic Sensing Schemes
2.1.1 Long Period Fiber Grating
LPG is a periodic perturbation of the refractive index of fiber core (Figure 2-1) [59]. It
couples the forward-propagating fundamental core mode into several co-propagating
cladding modes as long as the phase matching condition is satisfied. The high loss of
the forward-propagating cladding modes leads to a series of attenuation bands at
discrete wavelengths on the LPG transmission spectrum [60]. Each of the attenuation
bands corresponds to a coupling from the fundamental core mode to a cladding mode.
The phase matching condition is given by Equation (1) [61]:
𝜆𝑝 = (𝑛𝑐𝑜𝑟𝑒𝑒𝑓𝑓
− 𝑛𝑝,𝑐𝑙𝑎𝑑𝑒𝑓𝑓
)Λ (1)
where 𝜆p is the resonant wavelength of cladding mode of the pth order. 𝑛𝑐𝑜𝑟𝑒𝑒𝑓𝑓
and 𝑛𝑝,𝑐𝑙𝑎𝑑𝑒𝑓𝑓
are the effective refractive indices of the core mode and the pth order cladding mode
respectively. 𝛬 is the period of grating, which is shown in Figure 2-1.

Chapter 2 | Literature Review
11
Figure 2-1. The schematic illustration of LPG and its mode couplings [60].
According to Equation (1) that the resonant wavelengths of LPG are dependent
on the difference between the effective refractive indices of core mode and the
corresponding cladding modes. The resonant wavelengths are therefore modulated by
the surrounding refractive index of LPG as it influences the effective refractive indices
of cladding modes. Equation (2) expresses the dependence of resonant wavelengths on
surrounding refractive index [62]:
𝑑𝜆𝑝
𝑑𝑛𝑠𝑢𝑟=
𝑑𝜆𝑝
𝑑𝑛𝑝,𝑐𝑙𝑎𝑑𝑒𝑓𝑓
𝑑𝑛𝑝,𝑐𝑙𝑎𝑑𝑒𝑓𝑓
𝑑𝑛𝑠𝑢𝑟 (2)
where 𝑛𝑠𝑢𝑟 is the surrounding refractive index of LPG. The higher the order of cladding
mode, the corresponding resonant wavelength is more sensitive to ambient refractive
index [62,63]. The sensitivity also increases as the surrounding refractive index
approaches to that of fiber cladding. The enhancement of sensitivity along with
increasing ambient refractive index is shown by Figure 2-2 (a) [63]. When the
Figure 2-2. (a) The wavelength shift of LPG against surrounding refractive index [63]; (b) The
wavelength shift of LPG resonant wavelength against a wide range of surrounding refractive
index [64].

Chapter 2 | Literature Review
12
surrounding refractive index becomes closed to that of fiber cladding, the resonant dips
on transmission spectrum are greatly weakened or even disappear. The resonant dips
will reappear once the refractive index of ambient medium exceeds that of fiber
cladding (Figure 2-2 (b)). The reappeared resonant wavelengths would no longer be
varied by changing ambient refractive index [64].
The transmission minimum of the attenuation bands is a cosine-squared
function of the coupling coefficient, 𝜅, and the grating length, 𝐿 [65,66]:
𝑇 = 𝑐𝑜𝑠2(𝜅𝐿) (3)
The coupling coefficient 𝜅 reduces as the external perturbation enhances. The increase
of ambient refractive index, bending or transverse load would decrease 𝜅 [65]. As the
value of cosine-squared function fluctuates between 0 and 1, the variation trend of LPG
transmission minimum is thereby dependent on its initial position. A resonant dip with
its transmission minimum located at the valley (i.e. the lowest value) of the 𝑐𝑜𝑠2(𝜅𝐿)
curve is considered as “saturated”. Hence the transmission minimum of a saturated
LPG increases with the ascending 𝑐𝑜𝑠2(𝜅𝐿) curve when 𝜅 decreases. On the other
hand, a transmission minimum located at point far from the valley of 𝑐𝑜𝑠2(𝜅𝐿), which
is corresponding to a “over-coupled” LPG, decreases along with reducing 𝜅 as the
function curve is descending.
2.1.2 Side-Polished Optical Fiber
Side-polished optical fiber, which is also called D-shaped optical fiber, is a widely
applied fiber configuration in fiber lasers [67–69], polarizers [70,71], numerous
sensing applications [72–78], etc. Benefitted from the planar interface, side-polished
fiber is a versatile platform for easy patterning of micro/nanostructures and easy
deposition of functional layers or materials (e.g. gold thin film and 2D materials) [74–
79]. The most frequently used fabrication method is to glue a stripped optical fiber in
a V-groove of quartz block, and then polish the whole quartz block till strong enough
evanescent field is exposed. Figure 2-3 illustrates the configuration and the cross-
section of fixed side-polished fiber in V-groove [80]. To achieve acute response of
Chapter 2 | Literature Review
13
evanescent field to ambient environment, the distance between the polished facet and
the fiber core should be kept comparable to the guided wavelength [81].
Figure 2-3. Schematic diagram of quartz block assisted side-polished fiber fabrication [82].
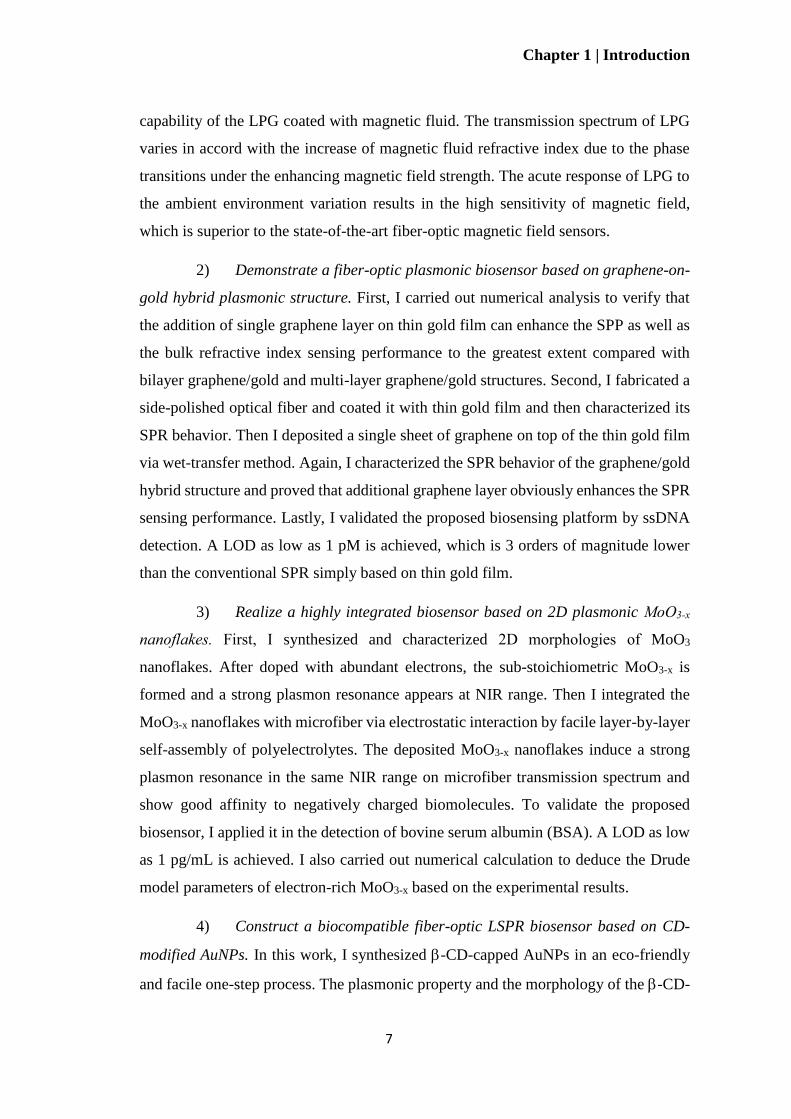
The attenuation coefficient α of the fundamental mode in side-polished fiber
can be estimated by the following Vassalo’s Formula [83]:
𝛼 =4√2∆
𝑎(1+2𝑏∆)
1−𝑏
𝐾12(𝑉√𝑏)
√𝑏(𝑉𝑒𝑥2 −𝑏𝑉2)
𝑉𝑒𝑥2 𝐾0 (
2√𝑏𝑉𝑑
𝑎) (4)
where 𝑎 is the radius of fiber core, 𝑑 is the distance from the polished facet to the center
of fiber core. 𝐾0 and 𝐾1 are the modified Bessel function of the second kind of the
zeroth and first order respectively. 𝑏 is the normalized refractive index that is a function
of effective refractive index 𝑁𝑒𝑓𝑓02 :
𝑏 =𝑁𝑒𝑓𝑓0
2 −𝑛𝑐𝑙𝑎𝑑2
𝑛𝑐𝑜𝑟𝑒2 −𝑛𝑐𝑙𝑎𝑑
2 (5)
∆ is relative refractive index difference:
∆=𝑛𝑐𝑜𝑟𝑒−𝑛𝑐𝑙𝑎𝑑
𝑛𝑐𝑜𝑟𝑒 (6)
𝑉 and 𝑉𝑒𝑥 are the normalized frequency parameters of the guide mode and external
medium respectively:
𝑉 =2𝜋𝑎
𝜆√𝑛𝑐𝑜𝑟𝑒
2 − 𝑛𝑐𝑙𝑎𝑑2 (7)
𝑉𝑒𝑥 =2𝜋𝑎
𝜆√𝑛𝑒𝑥𝑡𝑒𝑟𝑛𝑎𝑙
2 − 𝑛𝑐𝑙𝑎𝑑2 (8)
Chapter 2 | Literature Review
14
The exposed evanescent field at the polished interface penetrates into the
external medium and decays exponentially in the perpendicular direction to the
interface. The field intensity at the distance 𝑧 from the interface is given by [84]:
𝐼(𝑧) = 𝐼0𝑒𝑥𝑝 (−𝑧
𝑑𝑝) (9)
where 𝐼0 is the initial intensity of incident light. 𝜃 is the angle of incidence to the
normal of the interface. 𝑑𝑝 is the penetration depth of the evanescent field where the
electric field decays to 𝑒−1 of the initial intensity. It can be determined by:
𝑑𝑝 =𝜆
2𝜋√𝑛𝑐𝑜𝑟𝑒2 𝑠𝑖𝑛2𝜃−𝑛𝑐𝑙𝑎𝑑
2 (10)
2.1.3 Microfiber
Optical microfibers or even nanofibers show great potentials in developing highly
integrated devices with small footprints. They are also recognized by their strong
evanescent field that facilitates highly efficient evanescent coupling in various optical
components and devices including optical resonators, lasers and sensors [85].
Microfibers are mostly fabricated by tapering a standard single-mode optical fiber. As
shown in Figure 2-4, a tapered optical fiber consists of a narrow waist with a constant
thin diameter in the middle connected by two conical taper transitions. The first and
the second transitions can be called “downtaper” and “uptaper” respectively [86]. The
shape of downtaper and uptaper influences the mode propagation and coupling. For an
adiabatically tapered optical fiber, of which the taper transitions are sufficiently gradual
to minimize transmission loss, the guided core mode is gradually compressed due to
the shrink of core diameter. After the core diameter is small enough, the core mode can
no longer be confined within fiber core, but guided by the fiber cladding-air interface.
Due to the high refractive index difference between fiber cladding and air, the
Figure 2-4. The propagation of the fundamental core mode through a tapered optical fiber [86].

Chapter 2 | Literature Review
15
propagating light is tightly confined in the microfiber waist (Figure 2-4). At the uptaper,
the mode transformation process is reversed [87].
To realize adiabaticity, the structural parameters of taper transition should be
properly designed. Figure 2-5 shows the structural parameters of taper transition. Let 𝑧
represent the position along the longitude of tapered fiber, and 𝜌(𝑧) represent the fiber
core radius at position 𝑧. Then the local taper angle 𝛺(𝑧) is:
𝛺(𝑧) = 𝑡𝑎𝑛−1 |𝑑𝜌
𝑑𝑧| (11)
As 𝛺(𝑧) ≪ 1 in practice, then the length of taper transition can be estimated as:
𝑧𝑡 ≈𝜌
𝛺 (12)
The fundamental LP01 mode tends to couple to a higher order mode with the
same azimuthal symmetry and the closest propagation constant 𝛽 (i.e. LP02 mode). Let
𝛽1 and 𝛽2 be the propagation constants of LP01 and LP02 modes respectively. The
coupling length, which is also called the beat length 𝑧𝑏, between the two modes is
calculated as:
𝑧𝑏 =2𝜋
𝛽1−𝛽2 (13)
Figure 2-5. The structural parameters of a taper transition [88].
If the condition 𝑧𝑡 ≫ 𝑧𝑏 is satisfied everywhere along the microfiber, the mode
coupling is negligible and the taper is considered as adiabatic [88]. Otherwise, the taper
is nonadiabatic. In a nonadiabatic tapered fiber, the fundamental core mode
𝐿𝑃01𝑐𝑜𝑟𝑒 couples to fundamental cladding mode 𝐿𝑃01
𝑐𝑙𝑎𝑑 and higher order cladding modes

Chapter 2 | Literature Review
16
𝐿𝑃0𝑚𝑐𝑙𝑎𝑑 at the downtaper [89,90]. Those cladding modes propagate through the uniform
central waist and couple back to the fiber core at uptaper, thus form a Mach–Zehnder
interferometer (MZI). The phase difference ∆𝛷 between two cladding modes can be
found by 2𝜋∆𝑛𝑒𝑓𝑓𝑚 𝐿/𝜆, where ∆𝑛𝑒𝑓𝑓
𝑚 effective refractive index difference, and 𝐿 is the
interference length. Such tapered fiber based MZI results in modal interference
spectrum [90,91].
The microfibers are mostly fabricated by the heat-and-pull method. Figure 2-6
illustrates the fabrication setup. A standard optical fiber is stripped to expose the silica
fiber cladding and fixed between two translation stages. A heat source with temperature
at least 1700 ̊C (e.g. a small flame) is placed in the middle to soften the silica fiber so
that the fiber can be stretched. To obtain a uniform central waist diameter, the heat
source is scanned repeatedly over several centimeters at a constant speed which is the
so-called flame brush technique [86,92].
Figure 2-6. The setup for fabricating an adiabatic tapered optical fiber [86].
2.2 Fiber-Optic Magnetic Field Sensors
2.2.1 Magnetic Fluid
Magnetic fluid is a synthesized liquids-like material that becomes strongly magnetized
under magnetic field. It is a colloidal fluid consisting of nano-scaled magnetic particles
such as magnetite (Fe3O4), nickel (Ni) and cobalt (Co) [93]. To prevent the magnetic
nanoparticles from aggregation driven by van der Waals force, each particle is coated
with 2-3 nm thick surfactant, which is generally fatty acid. Hence with no presence of

Chapter 2 | Literature Review
17
magnetic field, the surfactant-coated nanoparticles evenly suspend in the carrier liquid.
The most common magnetic particle is Fe3O4 with a diameter of ~10 nm [94]. Figure
2-7 illustrates the nanostructure of magnetic fluid particles.
Figure 2-7. Nanostructure of magnetic fluid particles [94].
The remarkable magneto-optic effects such as birefringence, tunable refractive
index and the Faraday Effect delivered by magnetic fluid have attracted much research
attention especially in sensing applications. Although Fe3O4 is ferromagnetic in bulk
volume, it becomes superparamagnetic when the size reduces to nano-scale and shows
no hysteresis property unless it is applied with strong magnetic field beyond its
threshold field [93,95–97]. When the superparamagnetic magnetic fluid is subjected to
a magnetic field below the threshold, it undergoes phase transitions that lead to the
variation of optical properties. The magnetic nanoparticles, which can be treated as
permanent magnets, tend to align the magnetic moment with magnetic field direction
and aggregate to chain-like clusters [98,99]. The phase transitions under gradually
increased magnetic field strength have been deeply investigated by Islam et al. [100]
and they are shown in Figure 2-8. As the applied magnetic field strength gradually
increases, the magnetic nanoparticles gradually cluster due to the dipole-dipole
interaction to form short needles in alignment with the field direction (Figure 2-8 (a)).
As the field strength further increases, more magnetic nanoparticles are magnetized to
aggregate and some short needles elongate into columns (Figure 2-8 (b)). Finally, all
the clusters of nanoparticles evolve into long columns along the magnetic field
direction, which is a phase called “columnar glassy” (Figure 2-8 (c)). Figure 2-8 (d)

Chapter 2 | Literature Review
18
shows the top view of the columnar phase of magnetic fluid. When the magnetic field
reaches certain strength, the repulsive forces among the columnar clusters lead to a
hexagonal arrangement of those columns which is relatively stable. The hexagonal
structure of columnar clusters induced by relatively high magnetic field strength has
also been reported by Yang et al. [101]. As shown in Figure 2-9 (a), the side view of
columnar phase is a one-dimensional periodic distribution of parallel columns. The top
view, which is shown in Figure 2-9 (b), shows a hexagonal pattern similar to that of
Figure 2-8 (d).
Figure 2-8. The magnetic nanoparticles gradually aggregate into (a) short needles, (b) columns
mixed with short needles and (c) columnar glassy as the magnetic field strengthens; (d) The top
view of hexagonally arranged columns [102].
Figure 2-9. (a) The side view and (b) the top view of the hexagonal columnar phase of magnetic
fluid [101].
Chapter 2 | Literature Review
19
The agglomeration of magnetic nanoparticles driven by applied magnetic field
increases the refractive index of magnetic fluid. Chen et al. studied the relation between
the refractive index of magnetic fluid, 𝑛𝑀𝐹 , and magnetic field intensity, and they
found that the 𝑛𝑀𝐹 – H curve fits well with the Langevin function [103]. As along as
the Langevin function applies, the refractive index of magnetic fluid increases with
enhancing magnetic field. Similar trends are also observed in other studies [104–106].
2.2.2 Magnetic Fluid and Optical Fiber Based
Magnetic Sensors
The variation of the refractive index during phase transitions makes magnetic fluid a
promising material for optical based magnetic field sensors. In recent years, fiber-optic
magnetic field sensors have been intensively investigated owing to their compactness,
flexibility and remote sensing capability. Numerous structures of optical fiber have
been proposed for magnetic field sensing. Due to the differences in employed fiber
structures and the types of magnetic fluid, the sensitivities and measuring thresholds
vary from one to another. The sensitivities of optical fiber based magnetic field sensors
can be categorized in terms of sensing parameters, such as wavelength shift,
transmission intensity and output power. Wang et al. proposed a single-mode-
multimode-single-mode fiber based magnetic field sensor by monitoring the
wavelength shift. They achieved a sensitivity of -16.86 pm/Oe [107]. Gao et al.
monitored the variation of output power of PCF under magnetic field and obtained a
sensitivity of 0.011 μW/Oe [55]. Zheng et al. used a TFBG to detect the phase
transitions of magnetic fluid and achieved a sensitivity of 147 nW/Oe [57]. Various
researches deliver sensitivities in terms of transmission intensity (e.g. dB/mT). For
instances, Lin et al. proposed to adopt multimode interferometer to sense magnetic field
and their sensitivity was −0.1939 dB/mT [56]. Tapered fiber based magnetic field
sensor has been demonstrated by Miao et al., they achieved a sensitivity of 0.13056
dB/Oe [58]. Chen et al. reported a sensitivity of 0.748 dB/mT achieved by employing
the single-mode-multimode-single-mode fiber structure [108].

Chapter 2 | Literature Review
20
Table 1 compares the magnetic fluid and optical fiber based magnetic field
sensors with the common non-fiber based magnetic field sensors [109–113]. Different
types of magnetic field sensors have their own measurement ranges and resolutions
thereby can be suitable for difference applications. For instances, search coil is favored
by the simple configuration and the broadest measurement range. However, it cannot
detect static magnetic fields since its working principal is based on the Faraday’s law
of induction [109,110]. The most sensitive low-field sensor is superconducting
quantum interference device (SQUID) which is mainly used in astronomy, geological
and medical applications. However, SQUID is also the most expensive magnetic field
sensor as it has to be operated at very low temperature even near absolute
zero [109,110,112]. Hall effect sensors are the most widely applied magnetic field
sensors due to their broad measurement range, cost effectiveness and high accuracy
especially for high field strength of > 1 T. The measurement ranges of the
aforementioned fiber-optic magnetic field sensors fall within 0.1-60 mT, which overlap
with the lower range of Hall effect sensors (Table 1). Besides achieving high degree of
integration with the magnetic nanoparticles assisted optomagnetic biosensors, it would
be more advantageous if the fiber-optic magnetic field sensors can provide comparable
resolutions to the commonly used Hall effect sensors. However, the resolutions of the
great majority of previously studied fiber-optic magnetic field sensors are still
uncompetitive. As discussed in Section 2.1.1, LPG provides merits of high sensitivity
to ambient refractive index, simple configuration and multi-parameter
measurement [62,114,115], which has not been proposed for magnetic field sensing
and we believe it would bring better sensing performance.
Table 1. Comparison of common magnetic field sensing mechanisms.
Mechanism Range
(mT)
Resolution
(nT)
Pros Cons
Search coil 10-10-106 Variable Broadest measurement
range
Unable to detect static fields
SQUID 10-9-0.1 10-4 Highest sensitivity Operating below the
superconducting transition
temperature; Most expensive
Fluxgate 10-4-0.5 0.1 Versatile; Low power
consumption
Expensive
Magneto-
resistance
10-3-5 10 Low cost; Good
temperature stability
Demagnetization/destroyed
by large magnetic fields

Chapter 2 | Literature Review
21
Hall effect 0.1-3×10⁴ 100 High yield; Reliable for
large field measurement
(> 1 T)
Nonlinearity
Optical
fibers
0.1-60 Variable Remote sensing;
Flexibility;
Miniaturization
Temperature sensitive
2.3 Surface Plasmon Resonances
SPR is the collective oscillations of free electrons at the interface between a metal and
a dielectric medium [116]. There are two distinct forms of SPR: propagating SPR
which is the term “SPR” normally refers to and localized SPR (LSPR) [15,117]. The
theories behind these two prominent biosensing techniques and the state-of-the-art SPR
and LSPR biosensors as well as their prospects will be discussed in this section.
2.3.1 Drude Model
To understand the interaction between light and metals or heavily doped
semiconductors that are abundant with free conduction electrons, it is fundamental to
understand the Drude model, which is a classical conductivity model widely adopted
and proven to be accurate for the optical properties of electron-rich materials. Based
on the assumption that the free electrons in conduction band are independent and do
not interact with each other, the complex dielectric function is given by [118]:
𝜀(𝜔) = 𝜀′ + 𝑖𝜀′′ = 1 −𝜔𝑝
2
𝜔(𝜔+𝑖/𝜏) (14)
where 𝜏 is the relaxation time which is inversely proportional to the electron density,
𝑁 [119]. The inverse of 𝜏, 1/ 𝜏, is defined as the collision frequency 𝛾. 𝛾 characterizes
the damping of electron oscillations in response to electromagnetic field and
numerically equals to the linewidth of the plasmon resonance band [120]. 𝜔𝑝 is the
bulk plasma frequency which is the characteristic frequency of conduction electrons
and it is defined as:
𝜔𝑝 = √𝑁𝑒2
0𝑚∗ (15)

Chapter 2 | Literature Review
22
where 𝜀0 is the free space permittivity, and 𝑚∗ is the effective mass of free electrons.
Expanded from Equation (14), the real part and the imaginary part of 𝜀(𝜔) can be
respectively expressed as:
𝜀′ = 1 −𝜔𝑝
2
(𝜔2+𝛾2) (16)
𝜀′′ =𝜔𝑝
2𝛾
(𝜔2+𝛾2)𝜔 (17)
Since the Drude model only takes the conduction electrons into consideration,
offset often occurs between the theoretical model and experimental observation. An
effective revision is to introduce the contribution from the positive ion core by adding
a constant to the real part of dielectric function, 𝜀′ [121]. Then the overall expression
becomes:
𝜀(𝜔) = 𝜀𝑏 −𝜔𝑝
2
(𝜔2+𝛾2)+ 𝑖
𝜔𝑝2𝛾
(𝜔2+𝛾2)𝜔 (18)
where 𝜀𝑏 denotes the background permittivity which is the response from core
polarization [34,122]. The plasmon resonance frequency is determined by:
𝜔𝑠𝑝 = √𝜔𝑝
2
1+2 𝑑𝑖𝑒𝑙𝑒𝑐𝑡𝑟𝑖𝑐− 𝛾2 (19)
where 𝜀𝑑𝑖𝑒𝑙𝑒𝑐𝑡𝑟𝑖𝑐 represents the dielectric constant of ambient dielectric medium.
2.3.2 SPR Theory
SPR is the coupling between the evanescent electromagnetic wave and the propagating
surface plasmon wave, which is also called SPP [123]. SPP is a TM-polarized
electromagnetic wave that propagates parallel to the interface between the metal film
and dielectric medium. Figure 2-10 illustrates the transverse electromagnetic field of
SPP. SPP is strongest at the thin metal surface and exponentially decays into the
dielectric medium.

Chapter 2 | Literature Review
23
Figure 2-10. The schematic illustration of propagating SPR [124].
Figure 2-11 (a) illustrates the conventional SPR configuration, a Kretschmann-
Raether silica prism coated with a thin noble metal film beyond which is a semi-infinite
dielectric medium. SPR occurs when the phase matching condition is
satisfied [123,125,126]. By solving the Maxwell equations for the interface of a semi-
infinite metal layer and a dielectric medium, the propagation constant of SPP is given
by [126]:
𝐾𝑠𝑝 =𝜔
𝑐√
𝑚𝑒𝑡𝑎𝑙 𝑑𝑖𝑒𝑙𝑒𝑐𝑡𝑟𝑖𝑐
𝑚𝑒𝑡𝑎𝑙+ 𝑑𝑖𝑒𝑙𝑒𝑐𝑡𝑟𝑖𝑐 (20)
where 𝜔 is the frequency of the TM-polarized incident light, and 𝑐 is the light velocity.
𝜀𝑚𝑒𝑡𝑎𝑙 and 𝜀𝑑𝑖𝑒𝑙𝑒𝑐𝑡𝑟𝑖𝑐 are the dielectric constants of the metal layer and the dielectric
medium respectively. The function curve of 𝐾𝑠𝑝 is plotted in Figure 2-11 (b). The
propagation constant of light that transmits in dielectric medium can be expressed
as [126]:
𝑘𝑠 =𝜔
𝑐√𝜀𝑑𝑖𝑒𝑙𝑒𝑐𝑡𝑟𝑖𝑐 (21)
It can be seen from Figure 2-11 (b) that 𝐾𝑠𝑝 will always be larger than 𝑘𝑠
regardless of light frequency. Therefore, there could never be phase matching between
SPP and direct light in dielectric medium. The propagation constant of the evanescent
wave of the total reflected incident light at the interface between the prism and
dielectric medium (air in this case) is:
𝐾𝑒𝑣 =𝜔
𝑐√𝜀𝑝𝑟𝑖𝑠𝑚 𝑠𝑖𝑛𝜃 (22)
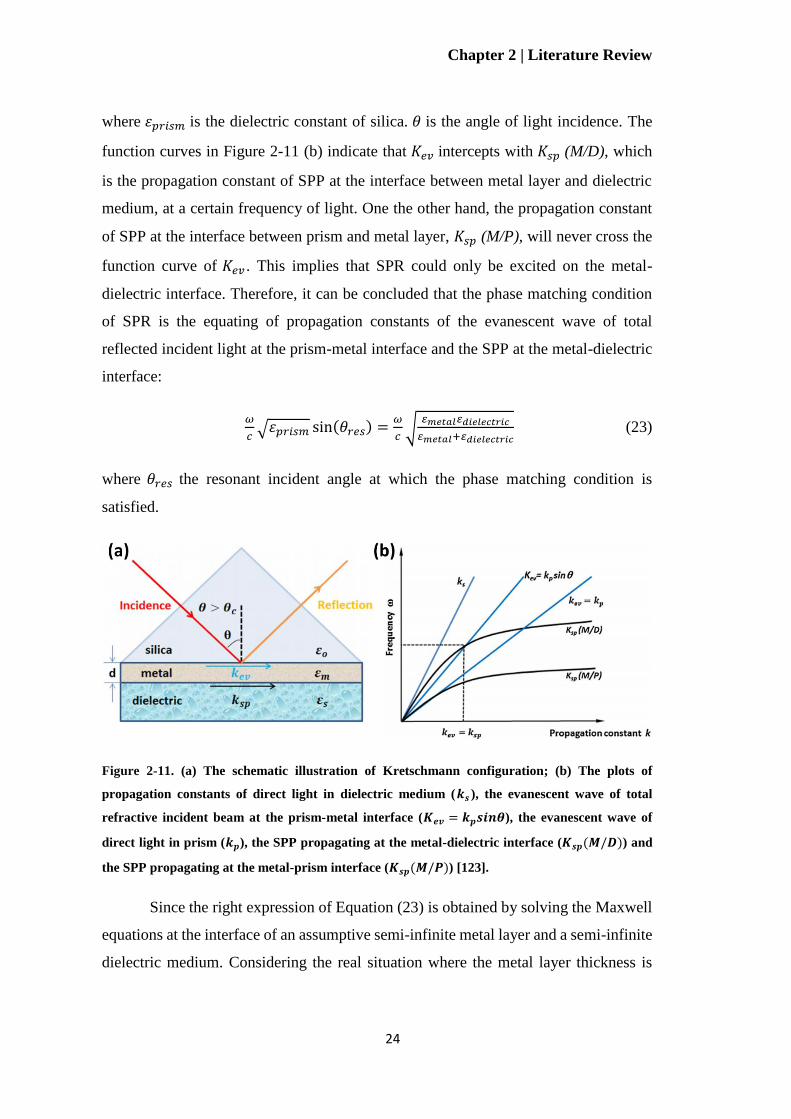
Chapter 2 | Literature Review
24
where 𝜀𝑝𝑟𝑖𝑠𝑚 is the dielectric constant of silica. 𝜃 is the angle of light incidence. The
function curves in Figure 2-11 (b) indicate that 𝐾𝑒𝑣 intercepts with 𝐾𝑠𝑝 (M/D), which
is the propagation constant of SPP at the interface between metal layer and dielectric
medium, at a certain frequency of light. One the other hand, the propagation constant
of SPP at the interface between prism and metal layer, 𝐾𝑠𝑝 (M/P), will never cross the
function curve of 𝐾𝑒𝑣 . This implies that SPR could only be excited on the metal-
dielectric interface. Therefore, it can be concluded that the phase matching condition
of SPR is the equating of propagation constants of the evanescent wave of total
reflected incident light at the prism-metal interface and the SPP at the metal-dielectric
interface:
𝜔
𝑐√𝜀𝑝𝑟𝑖𝑠𝑚 sin(𝜃𝑟𝑒𝑠) =
𝜔
𝑐√
𝑚𝑒𝑡𝑎𝑙 𝑑𝑖𝑒𝑙𝑒𝑐𝑡𝑟𝑖𝑐
𝑚𝑒𝑡𝑎𝑙+ 𝑑𝑖𝑒𝑙𝑒𝑐𝑡𝑟𝑖𝑐 (23)
where 𝜃𝑟𝑒𝑠 the resonant incident angle at which the phase matching condition is
satisfied.
Figure 2-11. (a) The schematic illustration of Kretschmann configuration; (b) The plots of
propagation constants of direct light in dielectric medium (𝒌𝒔 ), the evanescent wave of total
refractive incident beam at the prism-metal interface (𝑲𝒆𝒗 = 𝒌𝒑𝒔𝒊𝒏𝜽), the evanescent wave of
direct light in prism (𝒌𝒑), the SPP propagating at the metal-dielectric interface (𝑲𝒔𝒑(𝑴/𝑫)) and
the SPP propagating at the metal-prism interface (𝑲𝒔𝒑(𝑴/𝑷)) [123].
Since the right expression of Equation (23) is obtained by solving the Maxwell
equations at the interface of an assumptive semi-infinite metal layer and a semi-infinite
dielectric medium. Considering the real situation where the metal layer thickness is

Chapter 2 | Literature Review
25
finite and the high refractive index the silica prism affects 𝐾𝑠𝑝 (M/D), the phase
matching condition can be more precisely expressed as [127]:
𝜔
𝑐√𝜀𝑝𝑟𝑖𝑠𝑚 sin(𝜃𝑟𝑒𝑠) =
𝜔
𝑐√
𝑚𝑒𝑡𝑎𝑙 𝑑𝑖𝑒𝑙𝑒𝑐𝑡𝑟𝑖𝑐
𝑚𝑒𝑡𝑎𝑙+ 𝑑𝑖𝑒𝑙𝑒𝑐𝑡𝑟𝑖𝑐+ ∆𝛽 (24)
The second term, ∆𝛽, of the right expression of Equation (24) denotes the effects of
finite metal layer thickness and high refractive index of prism. ∆𝛽 decreases as the
metal layer thickness increases.
In most fiber-optic SPR, the wavelength interrogation method is employed. The
sensitivity of wavelength interrogation, 𝑆𝜆 (𝑛𝑚/𝑅𝐼𝑈) , is the shift of resonant
wavelength divided by the change of analyte refractive index [127]:
𝑆𝜆 =𝛿𝜆
𝛿𝑛𝑎=
𝑛𝑝 𝑚𝑒𝑡𝑎𝑙′
𝑛𝑝
𝜆𝑛𝑎
3 (1
𝜀𝑚𝑒𝑡𝑎𝑙′ −1)+
𝑑𝑛𝑝
𝑑𝜆𝑛𝑎(𝑛𝑎
2+ 𝑚𝑒𝑡𝑎𝑙′ )
(25)
Therefore, the sensitivity of wavelength interrogation is determined by 𝑛𝑎 , the
refractive index of analyte, and 𝑛𝑝, the refractive index of prism, and also 𝜀𝑚𝑒𝑡𝑎𝑙′ , the
real part of the dielectric constant of metal layer.
2.3.3 LSPR Theory
When light interacts with a noble metal nanoparticle that is smaller than the wavelength,
the excited surface plasmon is nonpropagating due to the restriction of particle size,
thereby it is called localized SPR. LSPR can be treated as the oscillation of the electron
Figure 2-12. The schematic illustration of propagating SPR [129].
Chapter 2 | Literature Review
26
cloud with respect to the positive ionic core induced by the incident electric field
(Figure 2-12) [128,129]. The electron oscillation is strongest when the oscillation
frequency resonances with the incident light frequency. To understand the LSPR
behaviors in depth, Mie theory describing the scattering and absorption of light by a
nanoparticle with diameter much smaller than wavelength (d ≪ λ) is a proper model.
Based on the Mie theory, the extinction cross-section of a homogeneous
conducting spherical nanoparticle can be deduced as:
𝜎𝑒𝑥𝑡 = 9 (𝜔
𝑐) (𝜀𝑑𝑖𝑒𝑙𝑒𝑐𝑡𝑟𝑖𝑐)
3
2𝑉 𝑚𝑒𝑡𝑎𝑙′′
( 𝑚𝑒𝑡𝑎𝑙′ +2 𝑑𝑖𝑒𝑙𝑒𝑐𝑡𝑟𝑖𝑐)
2+( 𝑚𝑒𝑡𝑎𝑙
′′ )2 (26)
where 𝑉 is the volume of spherical nanoparticle. It can be seen from Equation (26) that
the extinction cross-section reaches maximum when the condition 𝜀𝑚𝑒𝑡𝑎𝑙′ =
−2𝜀𝑑𝑖𝑒𝑙𝑒𝑐𝑡𝑟𝑖𝑐 is met. At visible or NIR frequencies, 𝛾 ≪ 𝜔𝑝 . Then according to
Equation (16), we can simplify the real part of dielectric function of noble metal to:
𝜀𝑚𝑒𝑡𝑎𝑙′ = 1 −
𝜔𝑝2
𝜔2 (27)
At the oscillations resonance where 𝜀𝑚𝑒𝑡𝑎𝑙′ = −2𝜀𝑑𝑖𝑒𝑙𝑒𝑐𝑡𝑟𝑖𝑐 , we can obtain the
expression of LSPR resonant frequency:
𝜔𝐿𝑆𝑃𝑅 =𝜔𝑝
√2 𝑑𝑖𝑒𝑙𝑒𝑐𝑡𝑟𝑖𝑐+1 (28)
Taking 𝜀𝑑𝑖𝑒𝑙𝑒𝑐𝑡𝑟𝑖𝑐 = 𝑛𝑑𝑖𝑒𝑙𝑒𝑐𝑡𝑟𝑖𝑐2 for dielectric medium, the LSPR resonant wavelength
is impacted by the ambient refractive index as follows:
𝜆𝐿𝑆𝑃𝑅 = 𝜆𝑝√2𝑛𝑑𝑖𝑒𝑙𝑒𝑐𝑡𝑟𝑖𝑐2 + 1 (29)
Based on the aforementioned theories, LSPR can be supported by any metal,
alloy or semiconductor with proper complex dielectric constant. Although copper,
aluminum and zinc oxide nanostructures have been investigated for LSPR sensing, gold
and silver plasmonic nanosensors are overwhelmingly studied and employed. This is
due to the poor resistance of non-noble metals to corrosion and oxidation that depresses
the plasmonic sensitivity. Hence benefited from their chemical stability, AuNPs are
most widely applied in complex biological sensing [130].

Chapter 2 | Literature Review
27
The most popular conventional synthesis method of AuNPs was proposed by
Turkevich in 1951 [131]. In this method, chloroauric acid (HAuCl4) solution is heated
to boiling point and added with sodium citrate under good mechanical stirring. The
citrate functions as both stabilizing and reducing agent [132]. Figure 2-13 shows
reaction process of reducing gold ions to gold atoms capped with citrate in Turkevich
Figure 2-13. The formation of AuNPs using the Turkevich method [131].
Figure 2-14. The colors of aqueous solutions of gold nanospheres with increasing particle size. The
particle sizes shown in (A-E) vary from 4 nm to 40 nm. All red bars represent 100 nm [133].

Chapter 2 | Literature Review
28
method. The synthesized aqueous AuNPs solutions possess peak extinctions at visible
frequencies. The size of AuNPs impacts the LSPR behaviors. As shown in Figure 2-
14, the variation of particle size leads to the change of solution colors, indicating the
shift of resonant frequencies [133]. All the red bars in Figure 2-14 represent 100 nm. It
has been reported that very small AuNPs with diameter less 5 nm show no LSPR
absorption. For AuNPs of 5-50 nm, their sharp LSPR resonance peaks range from 520
nm to 530 nm. As the particle size grows larger, the absorption band undergoes redshift
meanwhile broadens [129]. Figure 2-15 shows the variation of LSPR absorption band
along with the increasing of AuNPs size. Unlike SPP, the inducement of LSPR is not
limited to total reflected TM-polarized light. It can be induced directly by the incident
electromagnetic field [117]. Therefore, the configurations of LSPR sensors include not
only prism, but also direct extinction measurements [134,135], lab-on-a-chip
platforms [136–138], and certainly optical fibers [2,139–141].
Figure 2-15. The redshift of LSPR peak as the AuNP size increases from 9 nm to 99 nm [142].
2.3.4 Fiber-Optic SPR/LSPR Biosensors
Compared with the Kretschmann-Raether prism, solution-based extinction
measurement and lab-on-a-chip platform, optical fiber based SPR/LSPR is favored by
its miniaturization, flexibility, remote and in situ sensing capability and low

Chapter 2 | Literature Review
29
consumption of clinic samples. The phase matching condition also applies to fiber-
optic SPR, except that the incident angle varies from the critical angle to 90̊ in optical
fibers [123]. At the phase matching point, the effective refractive index of core mode
equals to that of surface plasmon mode [143]. The attenuation of the fiber core mode
𝐿𝑐 (dB m-1) is given by [144,145]:
40𝜋
𝑙𝑛(10)𝜆𝐼𝑚(𝑛𝑒𝑓𝑓) = 8.686 × 𝑘0𝐼𝑚(𝑛𝑒𝑓𝑓) (30)
where 𝑘0 is the wave vector in free space, and 𝐼𝑚(𝑛𝑒𝑓𝑓) is the imaginary part of the
core mode effective refractive index. The resonant dip on fiber-optic SPR transmission
spectrum corresponds to the largest transmission loss of the core mode.
Since SPR is generated by the coupling between the evanescent field of the total
reflected light in silica prism and SPP at the metal-dielectric interface and LSPR is the
collective oscillations of electron clouds in resonance with the incident light, the
exposure of relatively strong evanescent field is crucial in the design of fiber-optic
SPR/LSPR sensor. So far, many optical fiber structures have been proven to be feasible
for SPR/LSPR sensing. They can mainly be classified into 3 categories: grating-
Figure 2-16. SPR/LSPR sensors based on (a) LPG [147]; (b) TFBG [175]; (c) tapered fiber with
core diameter (ρ) of 50 μm and length of sensing region (L) of 2 mm [8]; (d) side-polished fiber [8];
(e) U-shaped fiber [146]; (f) patterned fiber end face [146].

Chapter 2 | Literature Review
30
assisted fibers, geometry-modified fibers and microstructured fibers [146]. Grating-
assisted fibers are basically LPG and TFBG [147–149], since they couple the core
mode into cladding modes of which the mode effective indices are modulated by
surrounding refractive index. Common geometry-modified fibers are unclad fiber of
which the fiber cladding is etched [150–152], side-polished fiber [153–155], tapered
fiber [156,157], U-shaped fiber [9,158], etc. Figure 2-16 illustrates some representative
configurations of SPR/LSPR biosensors based on grating-assisted and geometry-
modified optical fibers.
MOFs significantly improve the integration of SPR/LSPR sensor as the
cladding air holes could be used as microfluidic channels infiltrated with gas or liquid
analyte [144]. The dimension of the fiber core of MOF can be made very small without
Figure 2-17. Representative SPR/LSPR biosensors based on (a) PCF with hexagonal arranged air
holes [12]; (b) PCF with liquid core [159]; (c) suspended-core MOF [163]; (d) semicircular channel
MOF [166]; (e) semicircular channel MOF [165]; (f) exposed core MOF [168]; (g) exposed core
grapefruit MOF [169]; (h) H-shaped MOF [170]. Λ: the pitch of photonic crystal air holes.
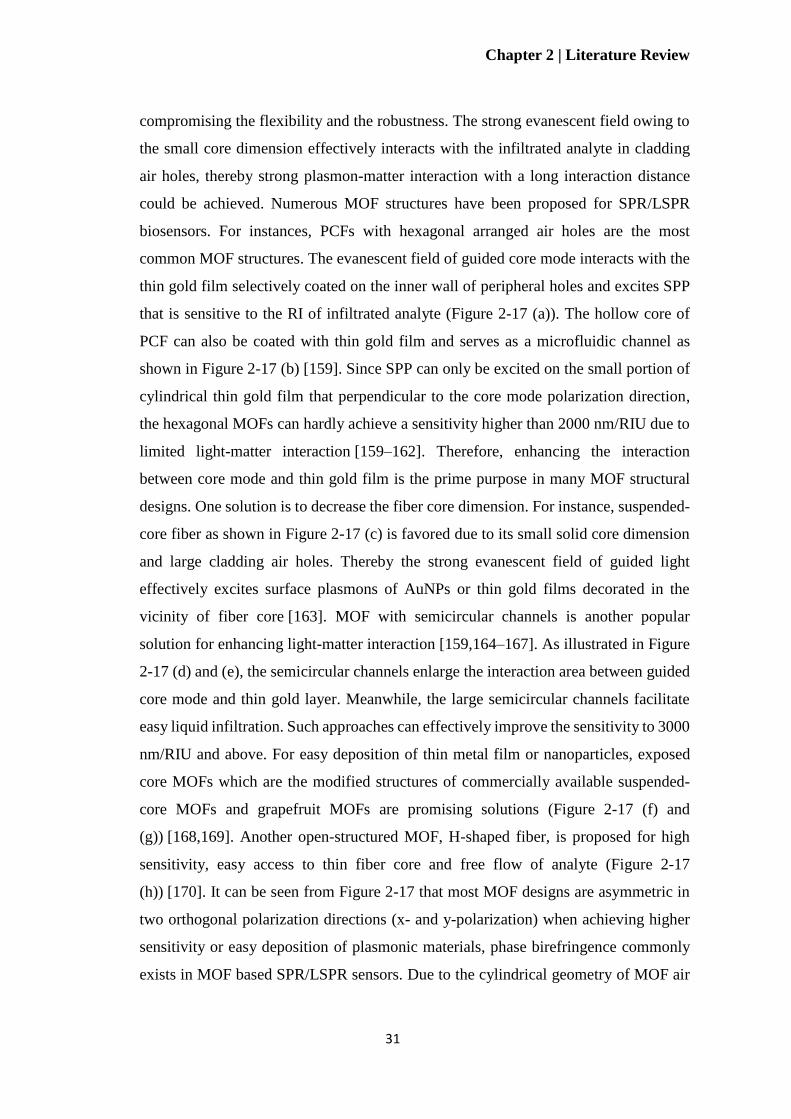
Chapter 2 | Literature Review
31
compromising the flexibility and the robustness. The strong evanescent field owing to
the small core dimension effectively interacts with the infiltrated analyte in cladding
air holes, thereby strong plasmon-matter interaction with a long interaction distance
could be achieved. Numerous MOF structures have been proposed for SPR/LSPR
biosensors. For instances, PCFs with hexagonal arranged air holes are the most
common MOF structures. The evanescent field of guided core mode interacts with the
thin gold film selectively coated on the inner wall of peripheral holes and excites SPP
that is sensitive to the RI of infiltrated analyte (Figure 2-17 (a)). The hollow core of
PCF can also be coated with thin gold film and serves as a microfluidic channel as
shown in Figure 2-17 (b) [159]. Since SPP can only be excited on the small portion of
cylindrical thin gold film that perpendicular to the core mode polarization direction,
the hexagonal MOFs can hardly achieve a sensitivity higher than 2000 nm/RIU due to
limited light-matter interaction [159–162]. Therefore, enhancing the interaction
between core mode and thin gold film is the prime purpose in many MOF structural
designs. One solution is to decrease the fiber core dimension. For instance, suspended-
core fiber as shown in Figure 2-17 (c) is favored due to its small solid core dimension
and large cladding air holes. Thereby the strong evanescent field of guided light
effectively excites surface plasmons of AuNPs or thin gold films decorated in the
vicinity of fiber core [163]. MOF with semicircular channels is another popular
solution for enhancing light-matter interaction [159,164–167]. As illustrated in Figure
2-17 (d) and (e), the semicircular channels enlarge the interaction area between guided
core mode and thin gold layer. Meanwhile, the large semicircular channels facilitate
easy liquid infiltration. Such approaches can effectively improve the sensitivity to 3000
nm/RIU and above. For easy deposition of thin metal film or nanoparticles, exposed
core MOFs which are the modified structures of commercially available suspended-
core MOFs and grapefruit MOFs are promising solutions (Figure 2-17 (f) and
(g)) [168,169]. Another open-structured MOF, H-shaped fiber, is proposed for high
sensitivity, easy access to thin fiber core and free flow of analyte (Figure 2-17
(h)) [170]. It can be seen from Figure 2-17 that most MOF designs are asymmetric in
two orthogonal polarization directions (x- and y-polarization) when achieving higher
sensitivity or easy deposition of plasmonic materials, phase birefringence commonly
exists in MOF based SPR/LSPR sensors. Due to the cylindrical geometry of MOF air

Chapter 2 | Literature Review
32
holes, both two orthogonal core mode polarizations can excite SPP. The phase
birefringence induces the offset between the resonant wavelengths of two orthogonal
polarizations based on Equation (24). The polarization that is perpendicular to the
larger portion of inner wall thin metal film is normally monitored for plasmonic sensing.
However, external perturbations such as pressure, bending or twisting and inaccurate
input polarization would lead to the existence of undesired polarization thereby a
shifted resonant wavelength. To address this issue, a polarization-maintaining MOF
would be a promising solution to suppress the effects of polarization crosstalk.
2.4 Nanomaterials Based Plasmonic Biosensing
Optical fiber based SPR/LSPR has been employed in various practical biosensing
applications such as the detections of bacteria [171], food poisoning [172,173] and
proteins [174–177]. Surface functionalization of thin gold films and AuNPs is often
required for targeting a specific biomolecule. In addition, despite the inert nature of
gold, surface functionalization of AuNPs to diminish cytotoxicity should also be taken
into consideration [178,179]. Self-assembled monolayer (SAM) is an extensively
applied surface functionalization strategy [180]. Since gold possesses high reactivity
with thiols (-SH), molecules with thiol groups can form highly ordered SAM via strong
gold-thiolate bonds (Au-S) (Figure 2-18) [41,180]. Figure 2-18 (a) shows a typical
surface functionalization strategy of thin gold film for SPR immunosensor [40]. A
Figure 2-18 (a) A typical functionalization strategy of SPR immunosensor [40]. EDC/NHS: 1-
Ethyl-3-(3-dimethylaminopropyl)carbodiimide/N-Hydroxysuccinimide. CNT: carbon nanotube.
(b) AuNPs can form conjugation with numerous functional molecules mostly via gold-thiolate
bonds [41].

Chapter 2 | Literature Review
33
SAM of 11-Mercaptoundecanoic acid (MUA) is formed on gold film via Au-S bonds.
The MUA monolayer adsorbs specific antigens which immobilize the corresponding
antibodies in the analyte. The formation of the antigen-antibody complexes at the metal
film surface varies the local refractive index which modulates the propagation constant
of SPP, thereby changes the phase matching condition. For AuNPs, surface
functionalization strategies like ligand substitution, polymer deposition, biomolecule
coating, etc. have been proven effective to meet goals of both biocompatibility and
specific molecular recognition (Figure 2-18 (b)) [178–181].
Besides the specific biomolecule recognition, another consideration is the
influence of surface functionalization on plasmonic sensitivity. As the strength of
surface plasmons exponentially decays from the interfaces of thin gold film and AuNPs,
the closer the captured biomolecules to the interface, the higher the plasmonic
sensitivity would be [117,128,182]. A study proves that the target biomolecules
binding activity is observable only if the SAM layer is kept within 20 nm [128].
Another study compares the sensitivities corresponding to two functionalization
strategies with different recognition layer thickness [182]. One strategy is to modify
AuNPs surface with a layer of 4.24 nm antibody. The other is to functionalize a layer
of peptide as thin as 0.96 nm. It shows that keeping the surface functionalization within
1 nm significantly improves the sensitivity and the LOD of the LSPR biosensor. Based
on the distance-dependent plasmonic sensitivity and the requirement of biomolecule
recognition, the recent emergence of 2D materials and supramolecular chemistry has
attracted great attention. In our works, 2D materials such as graphene and few-layer
MoO3 are employed as both the booster of plasmon-matter interaction and the
biointerface in highly integrated fiber-optic plasmonic biosensors. Also, CD, a
representative supramolecule is adopted as both reducing and capping agent in one-
step synthesis of biocompatible AuNPs and also the biointerface for molecular
recognition.
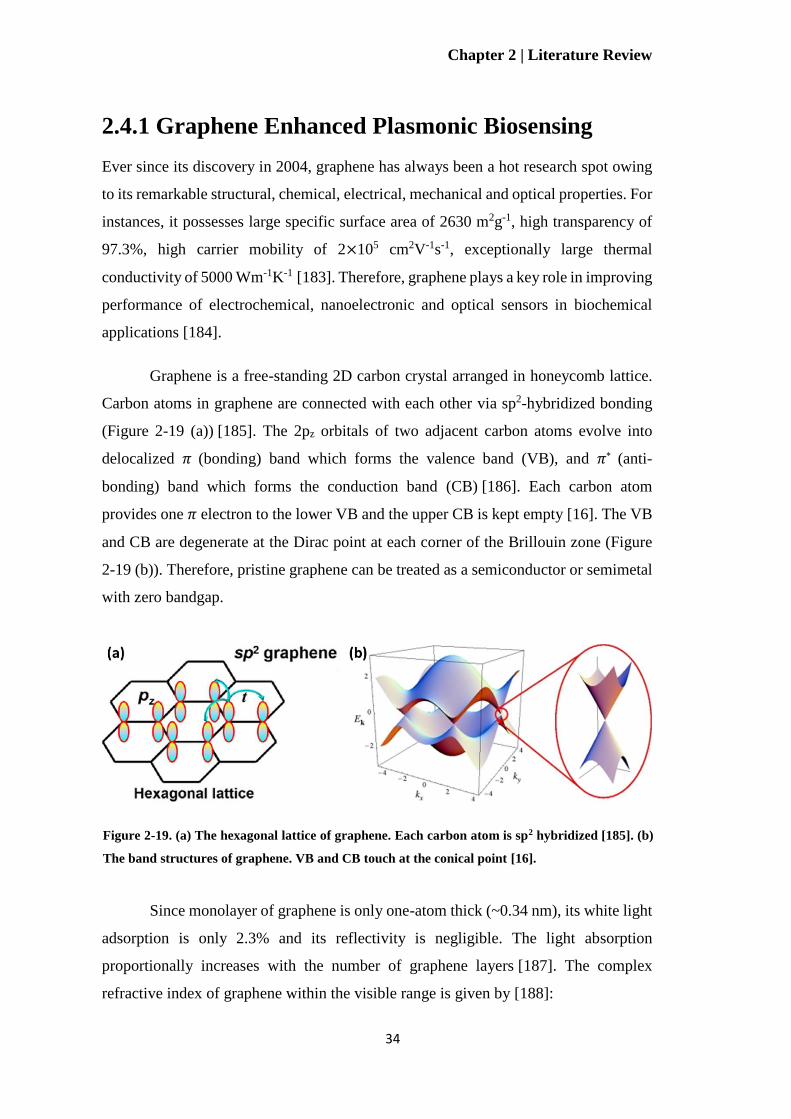
Chapter 2 | Literature Review
34
2.4.1 Graphene Enhanced Plasmonic Biosensing
Ever since its discovery in 2004, graphene has always been a hot research spot owing
to its remarkable structural, chemical, electrical, mechanical and optical properties. For
instances, it possesses large specific surface area of 2630 m2g-1, high transparency of
97.3%, high carrier mobility of 2×105 cm2V-1s-1, exceptionally large thermal
conductivity of 5000 Wm-1K-1 [183]. Therefore, graphene plays a key role in improving
performance of electrochemical, nanoelectronic and optical sensors in biochemical
applications [184].
Graphene is a free-standing 2D carbon crystal arranged in honeycomb lattice.
Carbon atoms in graphene are connected with each other via sp2-hybridized bonding
(Figure 2-19 (a)) [185]. The 2pz orbitals of two adjacent carbon atoms evolve into
delocalized 𝜋 (bonding) band which forms the valence band (VB), and 𝜋* (anti-
bonding) band which forms the conduction band (CB) [186]. Each carbon atom
provides one 𝜋 electron to the lower VB and the upper CB is kept empty [16]. The VB
and CB are degenerate at the Dirac point at each corner of the Brillouin zone (Figure
2-19 (b)). Therefore, pristine graphene can be treated as a semiconductor or semimetal
with zero bandgap.
Since monolayer of graphene is only one-atom thick (~0.34 nm), its white light
adsorption is only 2.3% and its reflectivity is negligible. The light absorption
proportionally increases with the number of graphene layers [187]. The complex
refractive index of graphene within the visible range is given by [188]:
Figure 2-19. (a) The hexagonal lattice of graphene. Each carbon atom is sp2 hybridized [185]. (b)
The band structures of graphene. VB and CB touch at the conical point [16].
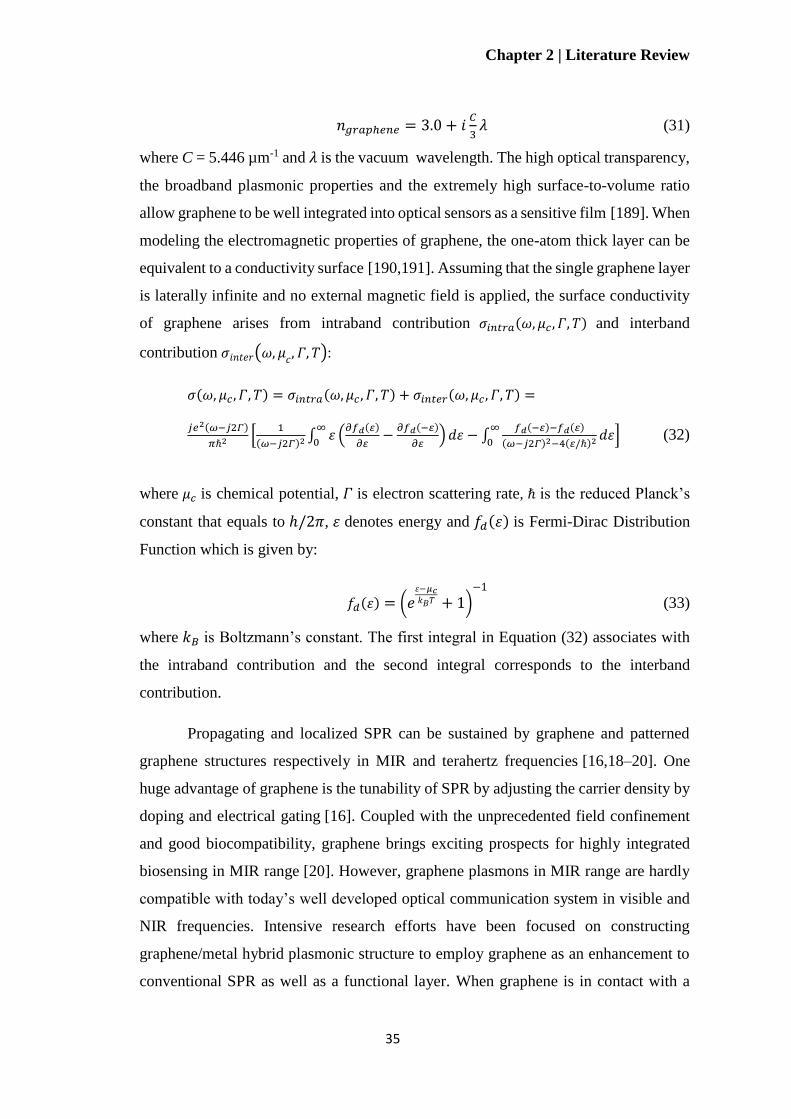
Chapter 2 | Literature Review
35
𝑛𝑔𝑟𝑎𝑝ℎ𝑒𝑛𝑒 = 3.0 + 𝑖𝐶
3𝜆 (31)
where C = 5.446 µm-1 and 𝜆 is the vacuum wavelength. The high optical transparency,
the broadband plasmonic properties and the extremely high surface-to-volume ratio
allow graphene to be well integrated into optical sensors as a sensitive film [189]. When
modeling the electromagnetic properties of graphene, the one-atom thick layer can be
equivalent to a conductivity surface [190,191]. Assuming that the single graphene layer
is laterally infinite and no external magnetic field is applied, the surface conductivity
of graphene arises from intraband contribution 𝜎𝑖𝑛𝑡𝑟𝑎(𝜔, 𝜇𝑐 , 𝛤, 𝑇) and interband
contribution 𝜎𝑖𝑛𝑡𝑒𝑟(𝜔, 𝜇𝑐, 𝛤, 𝑇):
𝜎(𝜔, 𝜇𝑐 , 𝛤, 𝑇) = 𝜎𝑖𝑛𝑡𝑟𝑎(𝜔, 𝜇𝑐 , 𝛤, 𝑇) + 𝜎𝑖𝑛𝑡𝑒𝑟(𝜔, 𝜇𝑐 , 𝛤, 𝑇) =
𝑗𝑒2(𝜔−𝑗2𝛤)
𝜋ℏ2 [1
(𝜔−𝑗2𝛤)2 ∫ 𝜀 (𝜕𝑓𝑑( )
𝜕−
𝜕𝑓𝑑(− )
𝜕) 𝑑𝜀 − ∫
𝑓𝑑(− )−𝑓𝑑( )
(𝜔−𝑗2𝛤)2−4( /ℏ)2 𝑑𝜀∞
0
∞
0] (32)
where 𝜇𝑐 is chemical potential, 𝛤 is electron scattering rate, ℏ is the reduced Planck’s
constant that equals to ℎ/2𝜋, 𝜀 denotes energy and 𝑓𝑑(𝜀) is Fermi-Dirac Distribution
Function which is given by:
𝑓𝑑(𝜀) = (𝑒𝜀−𝜇𝑐𝑘𝐵𝑇 + 1)
−1
(33)
where 𝑘𝐵 is Boltzmann’s constant. The first integral in Equation (32) associates with
the intraband contribution and the second integral corresponds to the interband
contribution.
Propagating and localized SPR can be sustained by graphene and patterned
graphene structures respectively in MIR and terahertz frequencies [16,18–20]. One
huge advantage of graphene is the tunability of SPR by adjusting the carrier density by
doping and electrical gating [16]. Coupled with the unprecedented field confinement
and good biocompatibility, graphene brings exciting prospects for highly integrated
biosensing in MIR range [20]. However, graphene plasmons in MIR range are hardly
compatible with today’s well developed optical communication system in visible and
NIR frequencies. Intensive research efforts have been focused on constructing
graphene/metal hybrid plasmonic structure to employ graphene as an enhancement to
conventional SPR as well as a functional layer. When graphene is in contact with a
Chapter 2 | Literature Review
36
metal, the difference between the work functions of graphene and metal leads to the
transfer of charges thereby the doping of graphene [183]. Figure 2-20 illustrates the
electrons flow when graphene seamlessly contacts with a metal with a higher work
function [192]. Graphene has a work function of 4.5 eV. When it contacts with a metal
of which the work function is higher than 5.4 eV (e.g. the work function of gold is 5.54
eV), electrons transfer from graphene to the surface of metal to equilibrate the Fermi
levels [193,194]. Hence the graphene becomes p-type doped. The charge transfer
increases the electron density at metal surface, thereby enhances the strength of
SPP [195].
In recent years, numerous studies have proven the great potentials of applying
2D material/metal hybrid film-like architectures to the conventional Kretschmann
configuration based SPR sensor for sensitivity enhancement. Hybrid plasmonic sensing
platforms such as monolayer graphene/gold [196,197], multilayer graphene/gold [21–
24], graphene oxide/gold [25–29], reduced graphene oxide/gold [198], graphene-
MoS2/gold [30–32], etc. have been proposed and investigated. Figure 2-21 shows some
representative configurations of 2D material/metal hybrid plasmonic biosensing
platforms. One significant motivation is that graphene strengthens the intensity of SPP
on the metal surface. This is due to the transport of electrons from graphene to gold
when the two materials are in contact as explained above. Besides the SPP
Figure 2-20. Schematic illustration of the energy bands of graphene and metal (a) before and (b)
after they are in contact. 𝜱𝟏: the work function of metal. 𝜱𝑮: the work function of graphene [192].

Chapter 2 | Literature Review
37
enhancement, graphene provides another attractive advantage to biosensing. Profited
from its honeycomb lattice arrangement of carbon atoms, graphene forms 𝜋-stacking
interaction with aromatic rings which commonly exist in biomolecules [199]. Hence
the biomolecules could be stably immobilized on graphene surface and vary the local
refractive index that intimates to the SPP propagation surface. Moreover, as
aforementioned, owing the evanescent nature of SPP at the perpendicular direction to
the metal-dielectric interface, the sensitivity of SPR decreases with the increasing
thickness of surface functionalization [200]. The one-atom thickness of graphene offers
huge superiority over conventional surface functionalization strategies.
Although the mechanism of how graphene enhances the Kretschmann prism
based SPR biosensing has been widely investigated, most of these researches are
preliminary theoretical analysis. In addition, a systematic study of integrating such 2D
material/metal hybrid structure with miniaturized and flexible optical fibers to achieve
highly integrated and highly sensitive biosensing remains blank.
Figure 2-21. Hybrid plasmonic architectures based on (a) monolayer graphene/gold [197]; (b)
multilayer graphene/Py/gold [21]; (c) graphene oxide/gold [29]; (d) graphene-MoS2/gold [31].
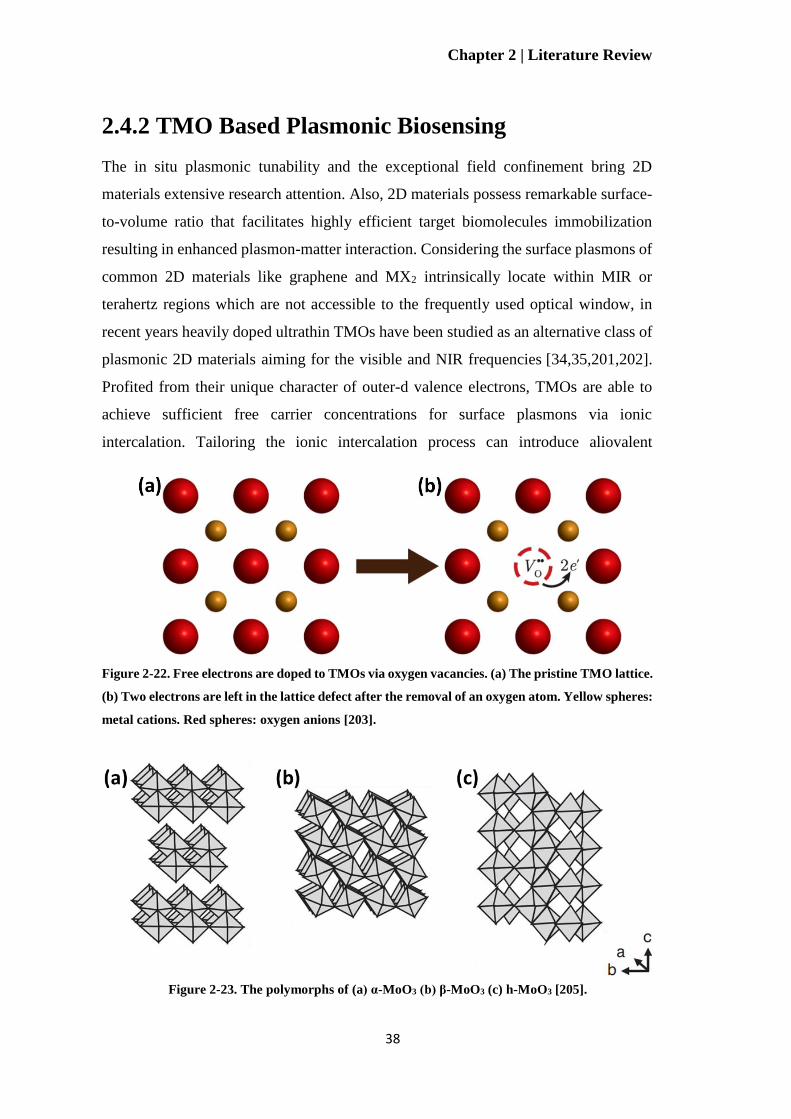
Chapter 2 | Literature Review
38
2.4.2 TMO Based Plasmonic Biosensing
The in situ plasmonic tunability and the exceptional field confinement bring 2D
materials extensive research attention. Also, 2D materials possess remarkable surface-
to-volume ratio that facilitates highly efficient target biomolecules immobilization
resulting in enhanced plasmon-matter interaction. Considering the surface plasmons of
common 2D materials like graphene and MX2 intrinsically locate within MIR or
terahertz regions which are not accessible to the frequently used optical window, in
recent years heavily doped ultrathin TMOs have been studied as an alternative class of
plasmonic 2D materials aiming for the visible and NIR frequencies [34,35,201,202].
Profited from their unique character of outer-d valence electrons, TMOs are able to
achieve sufficient free carrier concentrations for surface plasmons via ionic
intercalation. Tailoring the ionic intercalation process can introduce aliovalent
Figure 2-22. Free electrons are doped to TMOs via oxygen vacancies. (a) The pristine TMO lattice.
(b) Two electrons are left in the lattice defect after the removal of an oxygen atom. Yellow spheres:
metal cations. Red spheres: oxygen anions [203].
Figure 2-23. The polymorphs of (a) α-MoO3 (b) β-MoO3 (c) h-MoO3 [205].

Chapter 2 | Literature Review
39
heteroatoms or lattice vacancies to tune the carrier concentrations of TMOs [203].
Taking the most commonly investigated TMOs, tungsten oxide (WO3) and MoO3, as
examples, a large amount of free electrons can be doped by inducing oxygen vacancy
defects. An oxygen atom is a dianion. The removal of an oxygen atom from TMO
lattice leaves a doubly ionized point defect in the vacancy (Figure 2-22), meaning that
two free electrons are introduced to the conduction band [33,203]. Such oxygen
vacancies induced doping can facilitate enough electron concentration to support LSPR
in the visible or NIR regions [33–35]. Recently, the tunable LSPR of 2D MoO3 has
been most widely studied [34,35,38].
There are three polymorphs of MoO3, the stable orthorhombic α-MoO3 (Figure
2-23 (a)), the metastable monoclinic β-MoO3 (Figure 2-23 (b)) and the hexagonal h-
MoO3 (Figure 2-23 (c)) [204,205]. It can be seen from Figure 2-23, among the three
polymorphs, 2D morphology of α-MoO3 can be easily acquired due to the layered
crystalized structure. Each two adjacent atomically thin planar units of α-MoO3 form a
double-layer with thickness of 1.4 nm. Distorted MoO6 octahedra are joined by sharing
zigzag edges. The adjacent double-layer units are held together by the weak van der
Waals force [206].
2D few-layer α-MoO3 nanoflakes or nanosheets can be obtained via various
methods including top-down exfoliation and bottom-up synthesis. Originated from the
discovery of graphene, mechanical exfoliation is a low-cost and straightforward
method to get high quality crystalline 2D α-MoO3 nanosheets [207]. However, it
suffers from low yield [208]. Oxidizing few-layer MoS2 nanoflakes can be a high yield
synthesis method to acquire 2D MoO3 nanoflakes. Nevertheless, the quality of MoO3
nanoflakes is compromised by impurities and hydration during the oxidation
process [38,209]. Another high yield method is liquid phase exfoliation which is also
the most widely applied method [36,37,201,210–213]. Liquid phase exfoliation is a
facile three-step process as shown in Figure 2-24. α-MoO3 powder is ground and
undergone sonication in solvent (e.g. water/ethanol). The exfoliated few-layer α-MoO3
nanoflakes can be retrieved from the supernatant after centrifugation [212]. Figure 2-
25 shows the representative morphologies of α-MoO3 nanoflakes characterized by
scanning electron microscope (SEM), transmission electron microscopy (TEM) and

Chapter 2 | Literature Review
40
atomic force microscopy (AFM). From the thickness of nanoflakes measured by AFM,
the number of double-layer planner units can be deduced as the thickness of a double-
layer unit is fixed at 1.4 nm. As shown in Figure 2-25 (c) and (d), the α-MoO3
Figure 2-25. (a) The SEM image of α-MoO3 nanoflakes [213]. (b) The TEM characterization of α-
MoO3 nanoflakes [39]. The AFM characterization of (c) monolayer and bilayer α-MoO3
nanoflakes [212] and (d) multilayer α-MoO3 nanoflakes [201].
Figure 2-24. A typical process of synthesizing α-MoO3 nanoflakes by liquid phase exfoliation [212].

Chapter 2 | Literature Review
41
nanoflakes obtained by liquid phase exfoliation can be the mixture of monolayer,
bilayer and multilayer. As an n-type semiconductor with a bandgap of 3.2 eV, pristine
α-MoO3 only induces absorption in UV frequencies [39]. After ionic intercalation, the
oxygen vacancies in resultant sub-stoichiometric MoO3-x behave as shallow donors and
support LSPR in visible and NIR ranges [214]. A few methods have been proposed to
introduce oxygen vacancies in α-MoO3 nanoflakes, such as hydrogen spill-over [34,36],
NaBH4 reduction [39] and light stimulation [37,38]. The essence of these methods is
to generate and intercalate H+ ions to MoO3 lattice. The intercalated H+ ions mainly
interact with the corner-sharing oxygen atoms in the lattice, leading to the formation of
-OH2 groups and hydrogen molybdenum bronze (HxMoO3, 0 < 𝑥 ≤ 2) [36,215,216].
Eventually, water molecules are formed and released from the lattice, inducing oxygen
vacancies and the formation of MoO3-x. The reaction can be represented by the
following expressions [36]:
𝑀𝑜𝑂3 + 𝑥𝐻+ + 𝑥𝑒− ⇋ 𝐻𝑥𝑀𝑜𝑂3 (34)
2𝐻𝑥𝑀𝑜𝑂3 ⇋ 𝑥𝐻2𝑂 + 2𝑀𝑜𝑂3−𝑥/2 (35)
Although the mechanism of inducing LSPR in heavily doped MoO3 nanoflakes
has been thoroughly investigated, the potential of implementing such 2D plasmonic
material in biosensing is seldom explored. Previous researchers studied the mixture of
different concentrations of bovine serum albumin (BSA) solution and α-MoO3
nanoflakes solution [37,38,201]. They showed that negatively charged protein
molecules have high affinity to α-MoO3 nanoflakes due to van der Waals forces and
electrostatic interaction as α-MoO3 nanoflakes are positively charged. Moreover,
owing to the repellent between the negatively charged BSA molecules and electrons at
the surface of nanoflakes, the increase of BSA concentration reduces the free electron
density at nanoflakes surface leading to the decrease of plasmon resonance peak. This
unique biosensing mechanism where α-MoO3 nanoflakes act as both the plasmonic
material and the surface functionalization has yet to be applied in highly integrated
optical platforms.

Chapter 2 | Literature Review
42
2.4.3 Macrocyclic Supramolecules Based Plasmonic
Biosensing
Besides 2D materials, macrocyclic supramolecules can also be excellent surface
functionalization for plasmonic biosensing. Macrocyclic supramolecules, such as CDs,
pillararenes, calixarenes and cucurbiturils (Figure 2-26), are recognized by their
macrocyclic cavities and favored by their selective molecular recognition capability via
host-guest interaction, where macrocyclic supramolecules function as host molecules
to form inclusion complexations with certain guest molecules. The driving force of
forming host-guest interaction is noncovalent interaction such as hydrophobic
association, electrostatic attraction, van der Waals force, -stacking interaction,
etc. [217]. Encouragingly, such host-guest interaction provides even higher efficiency
in recognizing and capturing target molecules than the conventional biomolecule-
ligand binding [218].
In conjunction with noble metal nanoparticles, macrocyclic supramolecules not
only serve as biorecognition elements but also improve the biocompatibility of
nanoparticles as well as the stabilizing performance [42,218,219]. Moreover,
macrocyclic supramolecules have another huge advantage of being the surface
functionalization layer, i.e. their cavity heights are generally less than 1 nm [220–222],
which is comparable to 2D materials. Among the various macrocyclic supramolecules,
CD has attracted most attention in biological applications due to their good water
solubility, nontoxicity and biocompatibility [42]. A CD molecule is a macrocyclic
linkage of several ᴅ-glucose units via -1,4-glucose bonds. -, - and -CD are three
common formations of CD that consist of six, seven and eight glucose units
respectively (Figure 2-27 (a)). Figure 2-27 (a) compares the structural parameters of
-, - and -CD. CD is a torus-shaped cavity with the hydroxyl groups oriented towards
outside and the methinic protons reside inside. Hence CD cavity has hydrophilic
external surface and hydrophobic inner surface [42]. Therefore, the formation of
inclusion complexations is mainly driven by the hydrophobic association between the
hydrophobic groups in guest molecule and the interior of CD cavity [171]. Common
guest molecules of CD are adamantane, lithocholic acid, ferrocene, cholesterol,
etc. [220]. The stability of the host-guest interaction is largely dependent on the cavity

Chapter 2 | Literature Review
43
size. For instance, the cavity of -CD most tightly fits with the sterol group (Figure 2-
27 (b)), making -CD a highly efficient cholesterol receptor in many biomedical
applications [224,225].
Compared with functionalizing the macrocyclic supramolecules to noble metal
nanoparticles surface via post-processing surface modification, capping the
nanoparticles with supramolecules during the synthesis would be much more efficient.
Several studies have been carried out to realize macrocyclic supramolecules modified
noble metal nanoparticles in one-step synthesis [43–50]. These synthesis methods are
similar to the Turkevich method as explained in Section 2.3.3, except that
supramolecules are added instead of sodium citrate as the capping agent. However, the
majority of these attempts either introduce harsh reducing reagents (e.g. NaBH4, NaOH,
thiols) or rely on high PH condition, which would be detrimental in biological
applications [46,49,226]. Figure 2-28 demonstrates some typical one-step synthesis
Figure 2-26. Molecular structures of some common macrocyclic supramolecules [282].
Figure 2-27. (a) Molecular structures and structural parameters of -, - and -CD [283]. (b) The
side view and top view of the inclusion complexation formed by -CD and cholesterol
molecules [284].
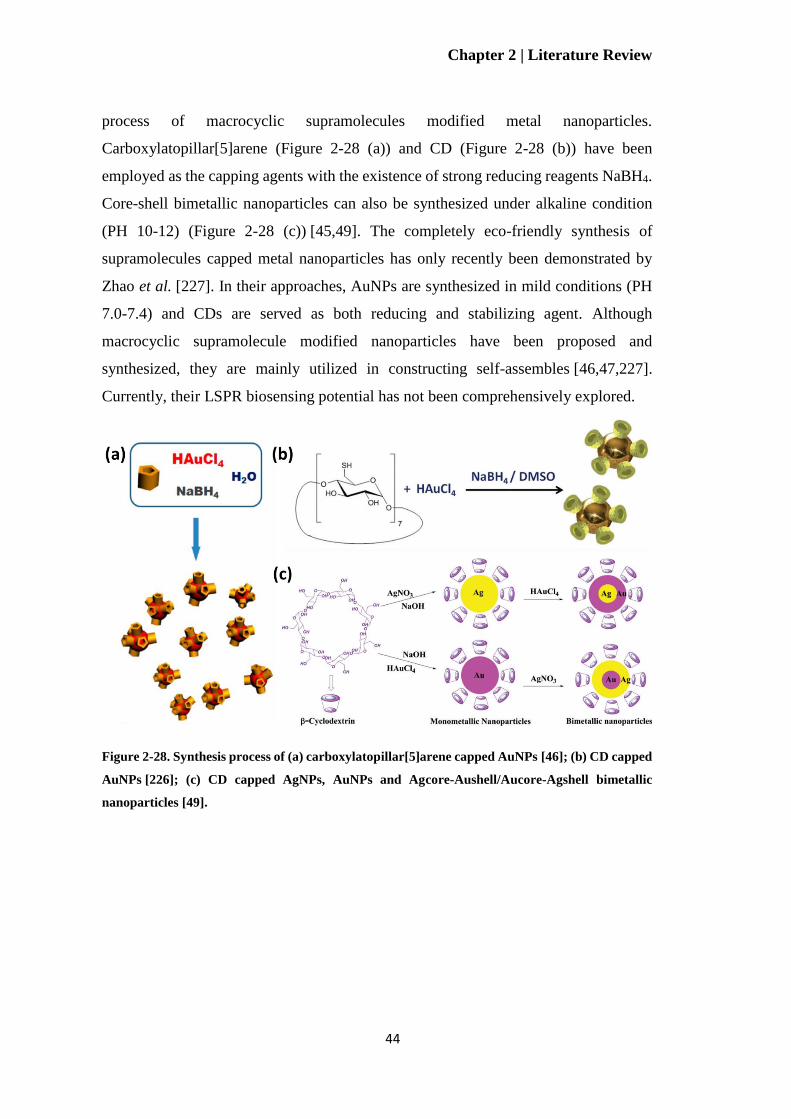
Chapter 2 | Literature Review
44
process of macrocyclic supramolecules modified metal nanoparticles.
Carboxylatopillar[5]arene (Figure 2-28 (a)) and CD (Figure 2-28 (b)) have been
employed as the capping agents with the existence of strong reducing reagents NaBH4.
Core-shell bimetallic nanoparticles can also be synthesized under alkaline condition
(PH 10-12) (Figure 2-28 (c)) [45,49]. The completely eco-friendly synthesis of
supramolecules capped metal nanoparticles has only recently been demonstrated by
Zhao et al. [227]. In their approaches, AuNPs are synthesized in mild conditions (PH
7.0-7.4) and CDs are served as both reducing and stabilizing agent. Although
macrocyclic supramolecule modified nanoparticles have been proposed and
synthesized, they are mainly utilized in constructing self-assembles [46,47,227].
Currently, their LSPR biosensing potential has not been comprehensively explored.
Figure 2-28. Synthesis process of (a) carboxylatopillar[5]arene capped AuNPs [46]; (b) CD capped
AuNPs [226]; (c) CD capped AgNPs, AuNPs and Agcore-Aushell/Aucore-Agshell bimetallic
nanoparticles [49].
Chapter 3 | Magnetic Field Sensor Based on Magnetic Fluid Coated LPG
45
Chapter 3 Magnetic Field
Sensor Based on Magnetic Fluid
Coated LPG
Optomagnetic biosensors, in which magnetic nanoparticles bonded with target
biomolecules are manipulated via controllable magnetic field, effectively improve the
efficiency of biomolecule detection. The manipulation of magnetic nanoparticles
requires accurate measurement of applied field strength. Driven by the purpose of
achieving highly integrated all-optical biosensing systems, fiber-optic magnetic field
sensor attracts much attention. In parallel, magnetic fluid shows remarkable magneto-
optic properties and becomes promising material for magnetic field sensing. Although
various specific optical fiber structures coupled with magnetic fluid have been
proposed to measure the field strength, a fiber-optic magnetic field sensor with
improved sensitivity and simplified configuration still needs to be explored. LPG is
favored due to the outstanding sensitivity to ambient environment and the simplicity of
configuration for multi-parameter measurement. In this work, we propose a magnetic
sensor based on LPG coated with the magnetic fluid, providing with high sensitivity
and reduced cost.
In this chapter, Section 3.1 presents the characterization of LPG we fabricated
for magnetic field sensing. Section 3.2 introduces the setup for magnetic field
measurement and analyzes the sensing performance of magnetic fluid coated LPG.
3.1 LPG Characterization
We write the LPG on a standard single-mode fiber (SMF) using the ultraviolet
irradiation method [66]. The grating period of LPG is 450 µm and the grating length is
30 mm. Figure 3-1 plots the transmission spectrum of LPG, of which the resonant
wavelength corresponding to the highest order cladding mode (𝐿𝑃06) [228] is at 1590.8
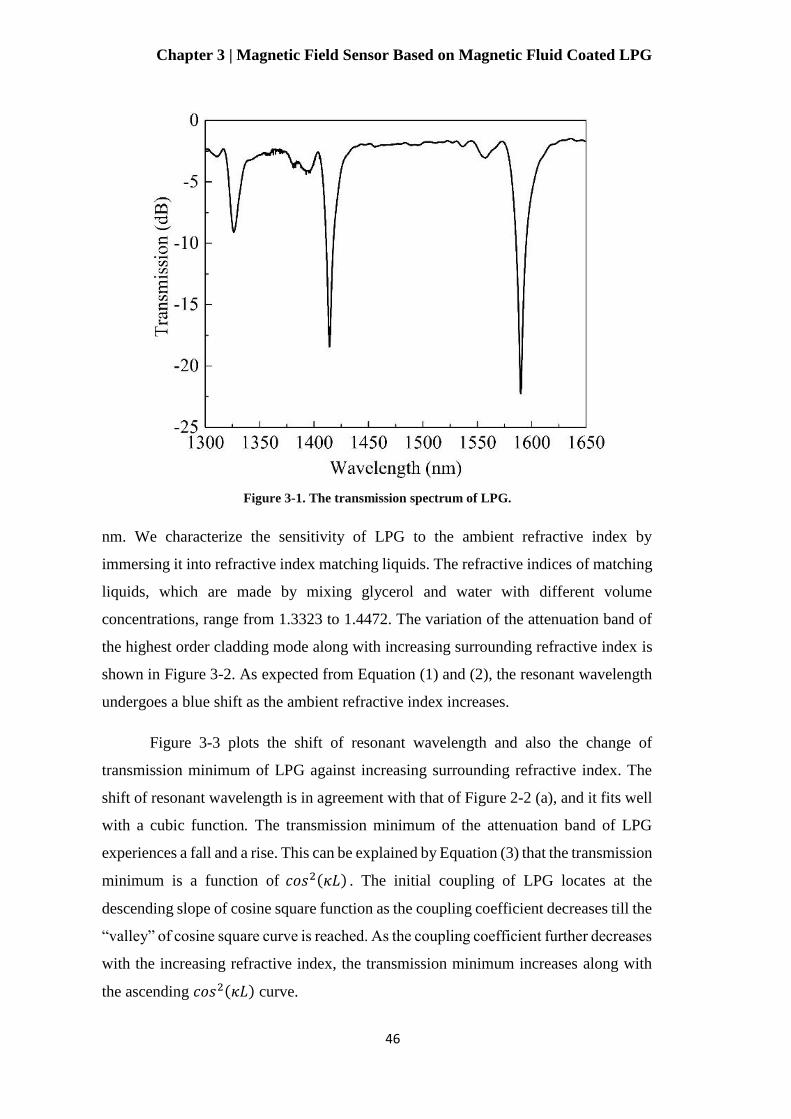
Chapter 3 | Magnetic Field Sensor Based on Magnetic Fluid Coated LPG
46
nm. We characterize the sensitivity of LPG to the ambient refractive index by
immersing it into refractive index matching liquids. The refractive indices of matching
liquids, which are made by mixing glycerol and water with different volume
concentrations, range from 1.3323 to 1.4472. The variation of the attenuation band of
the highest order cladding mode along with increasing surrounding refractive index is
shown in Figure 3-2. As expected from Equation (1) and (2), the resonant wavelength
undergoes a blue shift as the ambient refractive index increases.
Figure 3-3 plots the shift of resonant wavelength and also the change of
transmission minimum of LPG against increasing surrounding refractive index. The
shift of resonant wavelength is in agreement with that of Figure 2-2 (a), and it fits well
with a cubic function. The transmission minimum of the attenuation band of LPG
experiences a fall and a rise. This can be explained by Equation (3) that the transmission
minimum is a function of 𝑐𝑜𝑠2(𝜅𝐿) . The initial coupling of LPG locates at the
descending slope of cosine square function as the coupling coefficient decreases till the
“valley” of cosine square curve is reached. As the coupling coefficient further decreases
with the increasing refractive index, the transmission minimum increases along with
the ascending 𝑐𝑜𝑠2(𝜅𝐿) curve.
Figure 3-1. The transmission spectrum of LPG.

Chapter 3 | Magnetic Field Sensor Based on Magnetic Fluid Coated LPG
47
Figure 3-3. Wavelength shift and transmission minimum of LPG against surrounding refractive
index.
Figure 3-2. Variation of the attenuation band of LPG as the surrounding refractive index increases.

Chapter 3 | Magnetic Field Sensor Based on Magnetic Fluid Coated LPG
48
3.2 Detection of Magnetic Field
After the characterization, we seal the LPG in a capillary tube with an inner diameter
of 450 µm. The capillary is infiltrated with magnetic fluid EMG605, which is a water-
based suspension of Fe3O4 particles. The volume concentration of Fe3O4 particles is
3.9% and the nominal diameter is 10 nm. We stabilize the magnetic fluid coated LPG
in the middle of a pair of electromagnets (EM4-HVA LakeShore). Meanwhile, the
magnetic field strength is measured by a gaussmeter (Model 425, Lake Shore). The
experiment setup is illustrated in Figure 3-4. Before the experiment, the temperature
between the two electromagnets is monitored for 40 minutes under a field strength of
~700 Gauss (G). The temperature varies from 23.9 ̊C to 24.4 C̊. According to the
thermal sensitivities reported by Hu et al. (47.4 pm/ ̊C) [229] and Chaubey et al. (0.06
nm/ ̊C) [230] and the thermo-optic coefficient of magnetic fluid reported by Chen et al.
(-10-4/ ̊C) [103], we consider the thermal effects during the magnetic field detection can
be neglected. After the monitoring of temperature, we adjust the field strength back to
0 and subject the LPG to be perpendicular to the direction of magnetic field. Then we
gradually increase the magnetic field strength from 0 to ~110 G.
Figure 3-4. The experiment setup of magnetic field sensor.
Figure 3-5 shows the change of LPG attenuation band as the magnetic field
strength increases. The red dashed line is the attenuation band of the bare LPG exposed
in air. It can be seen that the resonant dip significantly deepens by 12.5 dB when the
LPG immerge into magnetic fluid (blue solid line). Also, there is a blue shift of resonant
wavelength from 1590.8 nm to 1582.9 nm. According to the fitting curve in Figure 3-
6, we estimate the refractive index of magnetic fluid to be ~1.39, which agrees

Chapter 3 | Magnetic Field Sensor Based on Magnetic Fluid Coated LPG
49
reasonably well with that in [57]. Then the attenuation band further shifts to shorter
wavelengths in the meanwhile becomes shallower and broader as the applied field
strength increments from 0 to ~110 G. We estimate that the magnetic fluid refractive
index increases from ~1.39 to ~1.41, as the resonant wavelength shifts from ~1583 nm
to ~1580 nm. The increase of magnetic fluid refractive index is in agreement with
previous studies [104–106], as explained in Section 2.2.1. The magnetic particles
gradually aggregate into columns along the magnetic field direction, which leads to the
increase of refractive index. The significant reduction of attenuation band depth of ~19
dB is caused by the increasing magnetic fluid refractive index as well as the enhancing
absorption and scattering effects during the phase transitions [108,231], which have
been demonstrated in Section 2.2.1. According to Figure 3-3, our LPG is “over-
coupled”. The transmission minimum decreases with increasing external perturbation
till the “valley” is reached. Hence we observe an enhancement of attenuation band
when the surrounding material of LPG changes from air to magnetic fluid. As the
magnetic field strength increases from 0 to ~110 G, the increase of transmission
Figure 3-5. Variation of LPG attenuation band along with increasing magnetic field strength.
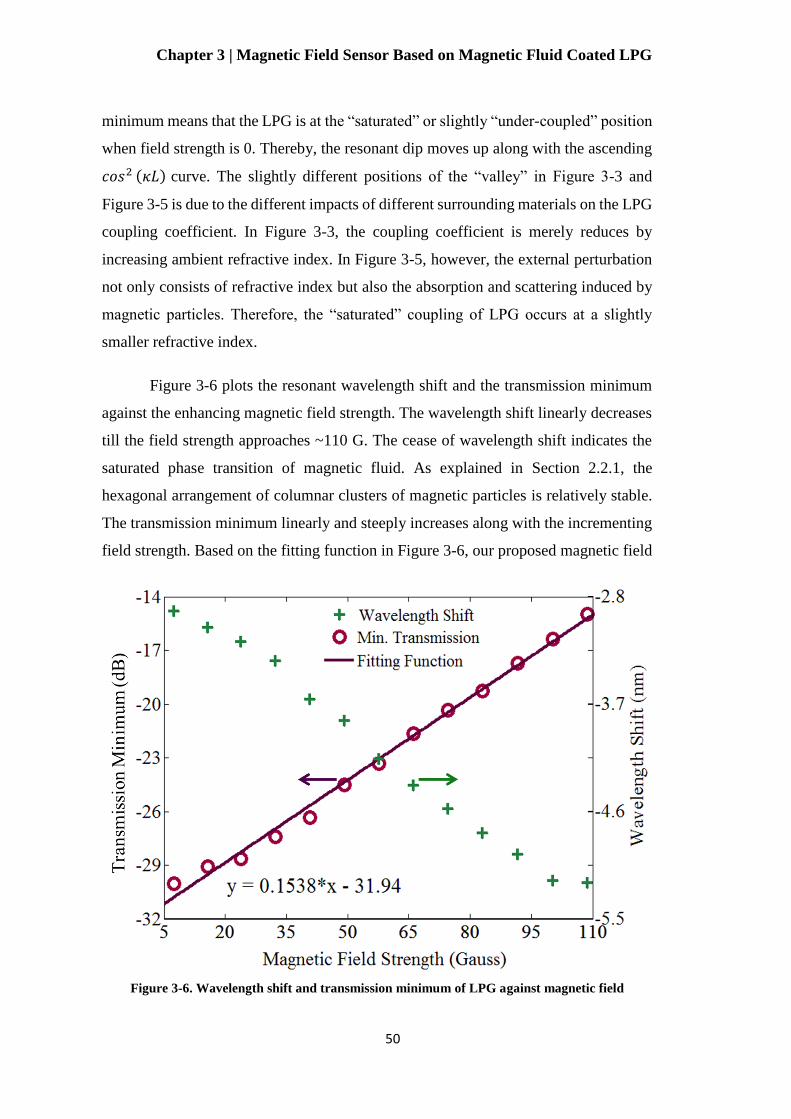
Chapter 3 | Magnetic Field Sensor Based on Magnetic Fluid Coated LPG
50
minimum means that the LPG is at the “saturated” or slightly “under-coupled” position
when field strength is 0. Thereby, the resonant dip moves up along with the ascending
𝑐𝑜𝑠2 (𝜅𝐿) curve. The slightly different positions of the “valley” in Figure 3-3 and
Figure 3-5 is due to the different impacts of different surrounding materials on the LPG
coupling coefficient. In Figure 3-3, the coupling coefficient is merely reduces by
increasing ambient refractive index. In Figure 3-5, however, the external perturbation
not only consists of refractive index but also the absorption and scattering induced by
magnetic particles. Therefore, the “saturated” coupling of LPG occurs at a slightly
smaller refractive index.
Figure 3-6 plots the resonant wavelength shift and the transmission minimum
against the enhancing magnetic field strength. The wavelength shift linearly decreases
till the field strength approaches ~110 G. The cease of wavelength shift indicates the
saturated phase transition of magnetic fluid. As explained in Section 2.2.1, the
hexagonal arrangement of columnar clusters of magnetic particles is relatively stable.
The transmission minimum linearly and steeply increases along with the incrementing
field strength. Based on the fitting function in Figure 3-6, our proposed magnetic field
Figure 3-6. Wavelength shift and transmission minimum of LPG against magnetic field

Chapter 3 | Magnetic Field Sensor Based on Magnetic Fluid Coated LPG
51
sensor provides a sensitivity of ~0.154 dB/G, which is higher than those of [56,58,108].
Moreover, as the transmission intensity resolution of optical spectrum analyzer can
reach 0.001 dB, theoretically the resolution of our proposed sensor can be estimated to
be 650 nT, which is superior than all the previously reported fiber-optic magnetic field
sensors [55–58,107,108] and comparable to that of the Hall effect sensors (Table 1).
The measurement range of a magnetic field sensor is limited by the threshold field
strength at which the sensor starts to response. Profited from the excellent sensitivity
of LPG and the acute phase transitions of the employed magnetic fluid, the
measurement threshold of our proposed sensor is as low as ~7.4 G. Therefore, the
magnetic fluid coated LPG is promising in relatively low magnetic field detection
compared with previously reported fiber-optic magnetic field sensors that most
measurement thresholds start from 20 G or even higher [55,56,58,107,108]. The
reliability of the magnetic field sensor can be further improved by introducing
temperature compensation to eliminate the temperature crosstalk [232,233]. For
example, a fiber Bragg grating (FBG) can be cascaded to the LPG based magnetic field
sensor to calibrate the temperature perturbation without responding to the ambient
refractive index change [232].
3.3 Summary
We demonstrate a magnetic field sensor based on LPG coated with magnetic fluid.
Benefited from the acute response of LPG to ambient environment and the tunable
optical properties of magnetic fluid under applied field, our proposed sensor provides
a superior sensitivity of ~0.154 dB/G as well as a high resolution of 650 nT. This work
takes a step further in the optical fiber based magnetic field sensors and shows prospect
of implementing all-fiber-based optomagnetic biosensors.

Chapter 4 | Hybrid Graphene-on-Gold Plasmonic Fiber-Optic Biosensor
52
Chapter 4 Hybrid Graphene-
on-Gold Plasmonic Fiber-Optic
Biosensor
Integrating 2D materials into conventional plasmonic sensors delivers unprecedented
enhancement on sensing performance. Although various hybrid 2D material/metal
plasmonic sensing platforms have been proposed, most of these studies are preliminary
theoretical investigations. In this work, we systematically investigate the influence of
2D material on hybrid plasmonic photonic structure on the SPP excitation as well as
the sensing performance. To be more specific, we numerically analyze and
experimentally demonstrate an optical fiber based plasmonic biosensor seamlessly
integrated with the graphene-on-gold hybrid structure.
In this chapter, Section 4.1 introduces the design and configuration of our
proposed hybrid plasmonic biosensor. It also presents the eigenmode analysis to
optimize the structural parameters. Section 4.2 presents the fabrication and
characterization of a conventional SPR sensor based on a side-polished optical fiber
coated with thin gold film. Section 4.3 shows the construction of graphene-on-gold
hybrid architecture and how the additional graphene layer improves the sensing
capability. Section 4.4 presents the ssDNA detection using our proposed graphene-on-
gold fiber-optic biosensor. It also proves that the hybrid structure provides superior
biosensing performance than the conventional thin gold film.
4.1 Design and Numerical Analysis
We propose an optical fiber based SPR biosensor seamlessly integrated with the
graphene-on-gold hybrid structure. Figure 4-1 illustrates the configuration of our
proposed biosensor. Considering the cylindrical geometry of optical fiber is not suitable
for the transfer of large-area single-layer graphene, we decide to use side-polished fiber

Chapter 4 | Hybrid Graphene-on-Gold Plasmonic Fiber-Optic Biosensor
53
of which the flat polished facet can better preserve the integrity as well as prevent the
wrinkles of graphene sheet. To do so, a standard SMF is side-polished to expose the
evanescent field of core mode and a thin gold film is coated on the side-polished facet.
Single sheet of graphene is then deposited on top of the gold film to enhance the excited
SPP as well as to bond with biomolecules. A polychromatic light source couples into
the fiber core. The peak transmission loss of the output spectrum occurs at the
resonance at which the phase matching condition is satisfied. We use both wavelength
and intensity interrogations to characterize the SPR behaviors. The nucleobases of
analyte ssDNA are enriched with carbon rings so that ssDNA molecules can be stably
bonded to graphene sheet through 𝜋-stacking interaction.
Figure 4-1. Configuration of proposed graphene-on-gold SPR biosensor. ssDNA molecules are
adsorbed on single sheet of graphene through 𝜋-stacking interactions between the aromatics rings
of nucleobases and honeycomb latticed carbon atoms.
We carry out numerical analysis using the mode analysis in FDTD Solutions of
Lumerical to verify that the graphene enhanced SPR provides better performance even
for bulk refractive index sensing. In the simulation, the fiber core diameter is 8 µm and
the polished fiber cladding facet just coincides with the perimeter of fiber core. The
refractive indices of fiber core and cladding are set based on the Sellmeier equations of
fused silica and GeO2-doped silica respectively [234]. Firstly, we investigate how the
gold film thickness impacts the SPR behaviors of our proposed biosensor. As discussed
in Section 2.3.2, SPP is TM-polarized electromagnetic wave. Hence only guided core
modes with polarization perpendicular to the thin gold film (i.e. y-polarized modes)
can excite SPP. Although the standard SMF becomes multimode at visible
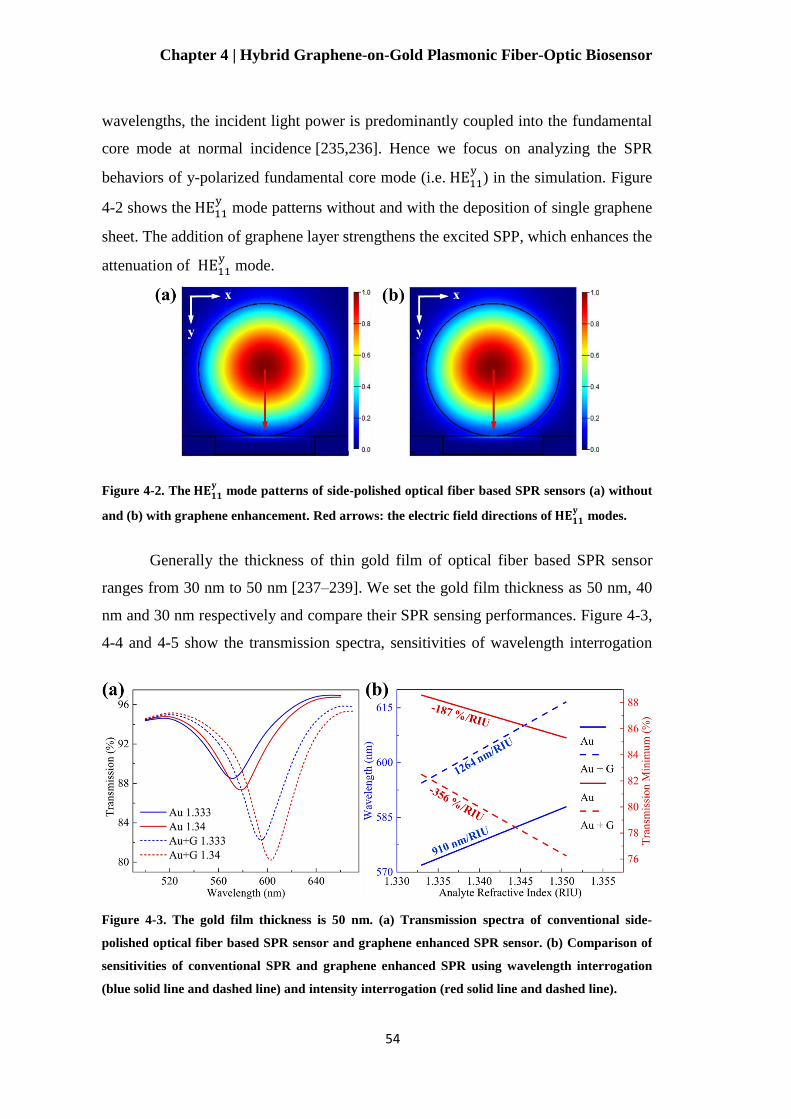
Chapter 4 | Hybrid Graphene-on-Gold Plasmonic Fiber-Optic Biosensor
54
wavelengths, the incident light power is predominantly coupled into the fundamental
core mode at normal incidence [235,236]. Hence we focus on analyzing the SPR
behaviors of y-polarized fundamental core mode (i.e. HE11y
) in the simulation. Figure
4-2 shows the HE11y
mode patterns without and with the deposition of single graphene
sheet. The addition of graphene layer strengthens the excited SPP, which enhances the
attenuation of HE11y
mode.
Figure 4-2. The 𝐇𝐄𝟏𝟏𝐲
mode patterns of side-polished optical fiber based SPR sensors (a) without
and (b) with graphene enhancement. Red arrows: the electric field directions of 𝐇𝐄𝟏𝟏𝐲
modes.
Generally the thickness of thin gold film of optical fiber based SPR sensor
ranges from 30 nm to 50 nm [237–239]. We set the gold film thickness as 50 nm, 40
nm and 30 nm respectively and compare their SPR sensing performances. Figure 4-3,
4-4 and 4-5 show the transmission spectra, sensitivities of wavelength interrogation
Figure 4-3. The gold film thickness is 50 nm. (a) Transmission spectra of conventional side-
polished optical fiber based SPR sensor and graphene enhanced SPR sensor. (b) Comparison of
sensitivities of conventional SPR and graphene enhanced SPR using wavelength interrogation
(blue solid line and dashed line) and intensity interrogation (red solid line and dashed line).
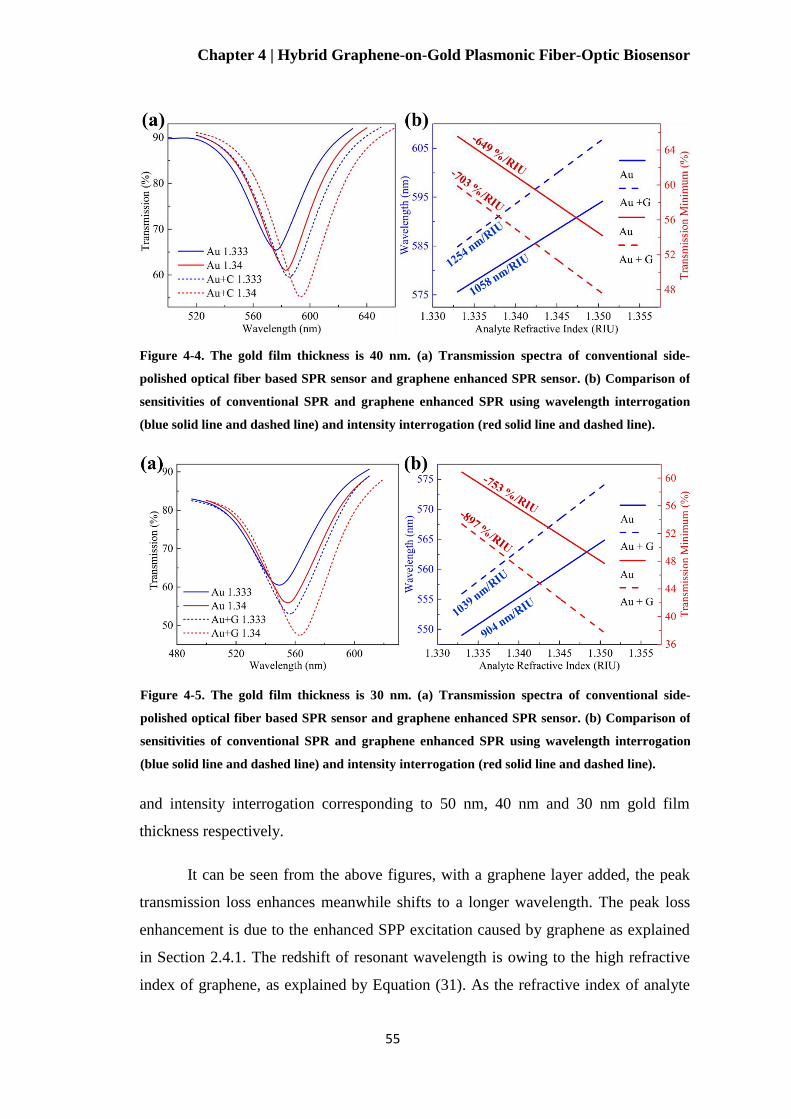
Chapter 4 | Hybrid Graphene-on-Gold Plasmonic Fiber-Optic Biosensor
55
and intensity interrogation corresponding to 50 nm, 40 nm and 30 nm gold film
thickness respectively.
It can be seen from the above figures, with a graphene layer added, the peak
transmission loss enhances meanwhile shifts to a longer wavelength. The peak loss
enhancement is due to the enhanced SPP excitation caused by graphene as explained
in Section 2.4.1. The redshift of resonant wavelength is owing to the high refractive
index of graphene, as explained by Equation (31). As the refractive index of analyte
Figure 4-5. The gold film thickness is 30 nm. (a) Transmission spectra of conventional side-
polished optical fiber based SPR sensor and graphene enhanced SPR sensor. (b) Comparison of
sensitivities of conventional SPR and graphene enhanced SPR using wavelength interrogation
(blue solid line and dashed line) and intensity interrogation (red solid line and dashed line).
Figure 4-4. The gold film thickness is 40 nm. (a) Transmission spectra of conventional side-
polished optical fiber based SPR sensor and graphene enhanced SPR sensor. (b) Comparison of
sensitivities of conventional SPR and graphene enhanced SPR using wavelength interrogation
(blue solid line and dashed line) and intensity interrogation (red solid line and dashed line).

Chapter 4 | Hybrid Graphene-on-Gold Plasmonic Fiber-Optic Biosensor
56
increases, the graphene enhanced sensor undergoes a larger wavelength redshift as well
as a larger peak loss enhancement, leading to the improved sensitivities in both
wavelength and intensity interrogations. As the gold thickness decreases, the resonant
peak shifts to shorter wavelengths and the peak transmission loss enhances. This can
be explained by Equation (24) that the propagation constant increases along with
decreasing gold thickness, thus the phase matching condition is satisfied at a larger
effective refractive index which corresponds to a shorter wavelength. Moreover, a
thinner gold film makes it easier for the electric field of SPP to penetrate through, hence
the intensity of SPP strengthens. The addition of a single sheet of graphene improves
SPR sensitivities of both wavelength and intensity interrogations for all gold film
thickness. Graphene on 50 nm gold film shows advantage in wavelength interrogation.
It provides sensitivity as large as 1264 nm/RIU. However, the intensity interrogation
sensitivity of 50 nm is much smaller compares with that of 40 nm and 30 nm. Graphene
on 30 nm gold film possesses tremendous advantage in the intensity interrogation
sensitivity. It provides a sensitivity - 897%/RIU, which is several times larger than that
of 50 nm. Considering the resonant wavelength shift of SPR is driven by the variation
of local refractive index, and the peak transmission loss enhancement is caused by both
refractive index change and molecular scattering, we decide to use intensity
interrogation as it is more affected by the adsorption of biomolecules to the SPP
propagation surface. Therefore, we choose the gold film thickness as 30 nm.
Then we investigate the relation between number of graphene layers and SPP
excitation. In the first scenario, a 30 nm gold film, beyond which is dielectric liquid
medium, is coated on top of the side-polished facet. The blue curve in Figure 4-6 shows
the normalized electric field distribution of SPP excited by thin gold film. The zero
position is the boundary between gold film and side-polished facet. The inset of Figure
4-6 plots the electric field distributions over the entire simulated configuration, which
includes the dielectric medium, thin gold film, fiber core and fiber cladding. In
agreement with theory, the electric field of guided core mode is Gaussian distributed
and that of SPP is the strongest at the thin film surface and exponentially decays into
the dielectric medium. We add single layer of graphene on top of the gold film in the
following scenario. As shown by the black curve in Figure 4-6, the intensity of SPP
considerably enhances by ~30.2% with the addition of single graphene sheet. We also

Chapter 4 | Hybrid Graphene-on-Gold Plasmonic Fiber-Optic Biosensor
57
investigate the impact of multiple graphene layers on the SPR behaviors. Two or more
graphene layers would depress the SPP intensity instead of further boosting it. The
increase of graphene layers leads to the gradual decrease of SPP due to the energy loss
of electrons induced by additional graphene layer [195]. Therefore, single sheet of
graphene maximizes the SPP intensity.
Figure 4-7. Sensitivities corresponding to single, double and triple layers of graphene when using
(a) wavelength interrogation and (b) intensity interrogation.
Figure 4-6. Normalized electric field intensities of excited SPPs when no graphene layer, single
layer graphene, 2-layer graphene and 3-layer graphene are deposited on the 30 nm gold film coated
on the side-polished facet of fiber. (Inset) Distributions of normalized electric field intensity over
the entire simulated geometry.
Chapter 4 | Hybrid Graphene-on-Gold Plasmonic Fiber-Optic Biosensor
58
Figure 4-7 compares the sensitivities of single, double and triple graphene
layers. For wavelength interrogation, the sensitivities corresponding to single, double
and triple graphene layers are 1039.18, 1037.55 and 1036.73 nm/RIU respectively. And
the sensitivities of intensity interrogation are -897.15, -871.61 and -847.36%/RIU
respectively. Hence multiple layers of graphene compromise the SPR sensing
performance compared with single layer, since the SPP intensity weakens as the
number of graphene layer increases. Therefore, our proposed biosensor is composed of
single graphene sheet deposited on 30 nm gold film with high sensitivity and easy
accomplishment.
4.2 Fabrication and Characterization of Gold-
Coated Side-polished Fiber
We use the commonly adopted method as shown in Section 2.1.2 to fabricate the side-
polished optical fiber. An SMF is firstly fixed in a groove of a silica block using epoxy,
and then polished the entire silica block till the fiber core is exposed. The side view of
the fabricated side-polished fiber is shown in Figure 4-8. Figure 4-9 illustrates the
cross-section of the deepest polishing depth. It matches well with the structure we
constructed for simulation that the polished facet just coincides with the perimeter of
fiber core. To examine the surface quality, we have measured the surface roughness of
the side-polished fiber sample using AFM. Figure 4-10 shows that the surface height
deviation of the side-polished fiber is 6.24 nm. The polished facet is further coated with
a 30 nm gold film by electron beam evaporation. We characterize the SPR behaviors
Figure 4-8. Schematic diagram of side-polished single-mode optical fiber.
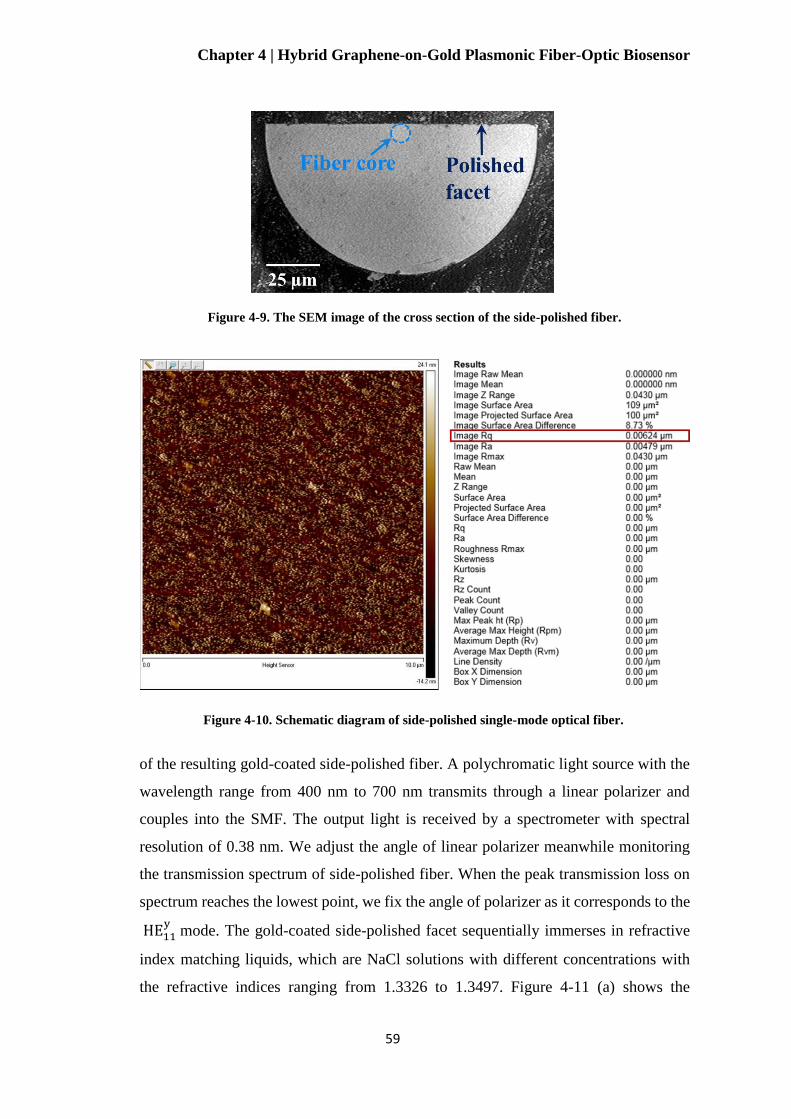
Chapter 4 | Hybrid Graphene-on-Gold Plasmonic Fiber-Optic Biosensor
59
of the resulting gold-coated side-polished fiber. A polychromatic light source with the
wavelength range from 400 nm to 700 nm transmits through a linear polarizer and
couples into the SMF. The output light is received by a spectrometer with spectral
resolution of 0.38 nm. We adjust the angle of linear polarizer meanwhile monitoring
the transmission spectrum of side-polished fiber. When the peak transmission loss on
spectrum reaches the lowest point, we fix the angle of polarizer as it corresponds to the
HE11y
mode. The gold-coated side-polished facet sequentially immerses in refractive
index matching liquids, which are NaCl solutions with different concentrations with
the refractive indices ranging from 1.3326 to 1.3497. Figure 4-11 (a) shows the
Figure 4-10. Schematic diagram of side-polished single-mode optical fiber.
Figure 4-9. The SEM image of the cross section of the side-polished fiber.
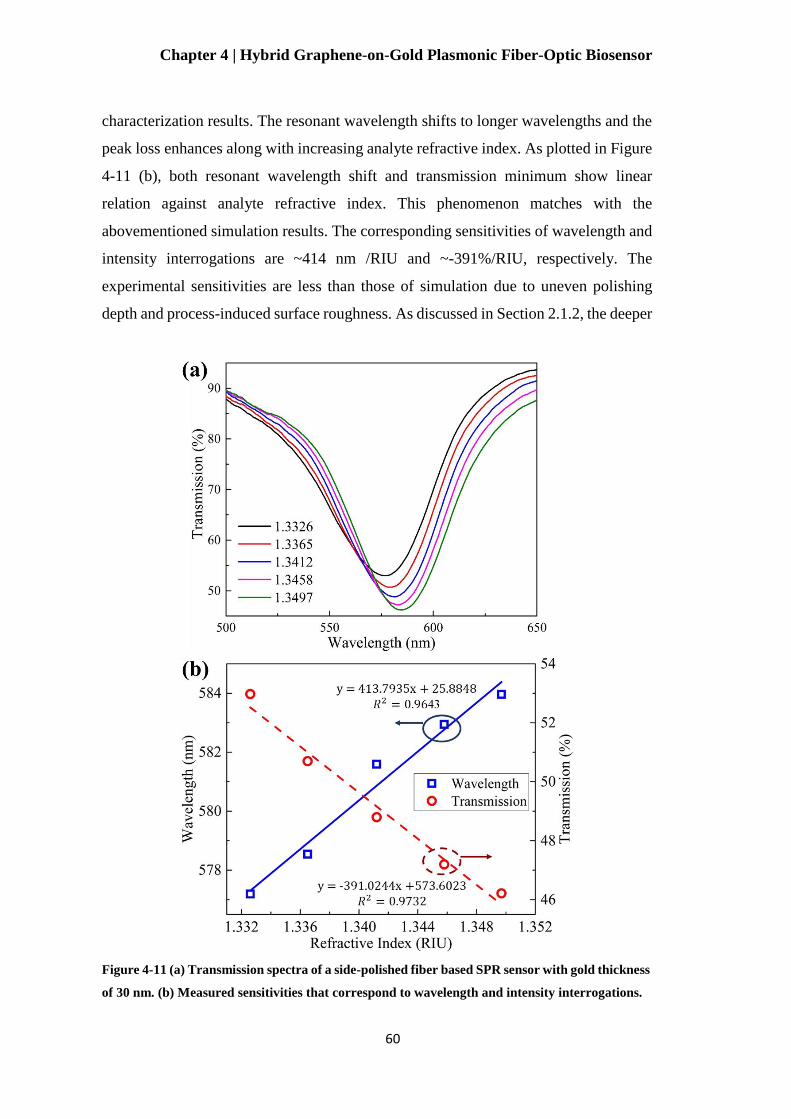
Chapter 4 | Hybrid Graphene-on-Gold Plasmonic Fiber-Optic Biosensor
60
characterization results. The resonant wavelength shifts to longer wavelengths and the
peak loss enhances along with increasing analyte refractive index. As plotted in Figure
4-11 (b), both resonant wavelength shift and transmission minimum show linear
relation against analyte refractive index. This phenomenon matches with the
abovementioned simulation results. The corresponding sensitivities of wavelength and
intensity interrogations are ~414 nm /RIU and ~-391%/RIU, respectively. The
experimental sensitivities are less than those of simulation due to uneven polishing
depth and process-induced surface roughness. As discussed in Section 2.1.2, the deeper
Figure 4-11 (a) Transmission spectra of a side-polished fiber based SPR sensor with gold thickness
of 30 nm. (b) Measured sensitivities that correspond to wavelength and intensity interrogations.

Chapter 4 | Hybrid Graphene-on-Gold Plasmonic Fiber-Optic Biosensor
61
the polishing depth is, the higher the sensitivity is [240]. Based on the side view of
side-polished fiber shown in Figure 4-8, the deepest polishing depth is at the central
region of the side-polished facet and gradually shallows away from the center of side-
polished fiber. Hence the sensing performance of our fabricated side-polished fiber is
a compositive result of the high sensitivity of deep-polished region and the relatively
lower sensitivity of shallow-polished region. Also, surface roughness has considerable
impact on the performance of plasmonic sensors, and cannot be achieved to be perfectly
smooth in the fabricated side-polished fiber. Surface polariton would be attenuated by
radiating or scattering into other surface-polariton states if roughness exists [241]. A
study has found that, if the surface height deviation is larger than 5 nm, the excited
surface plasmon will be considerably scattered leading to destructive coupling and
degradation of sensing performance [242]. Since our surface height deviation is 6.24
nm, which is slightly higher than 5 nm, surface roughness is a considerable factor to
lower the sensing performance in our experimental study. Besides the fine polishing
we adopted in the experiment, surface roughness could be further improved by
chemical etching of the polished facet, for example, using HF solution.
4.3 Graphene/Gold Hybrid Plasmonic Sensor
4.3.1 Graphene Transfer
Following the characterization, we transfer single sheet of graphene on top of the thin
gold film by the wet-transfer approach [243]. We use a commercial 1 cm × 1 cm single-
layer graphene grown on copper foil via chemical vapor deposition (CVD). Firstly, a
few hundred nanometers of PMMA thin film is spin-coated on the top surface of
graphene sheet. After the PMMA film is solidified, we float the whole copper foil on
8.33% ammonium persulfate (NH4)2S2O8 solution to etch the copper foil beneath
graphene. Then the remaining PMMA coated graphene sheet is transferred to float on
deionized (DI) water for several times to remove the residual ions. We locate the
floating graphene sheet on top of gold coated side-polished facet of the fiber, and
gradually lift it out of water with the graphene sheet attached on the side-polished facet.

Chapter 4 | Hybrid Graphene-on-Gold Plasmonic Fiber-Optic Biosensor
62
After drying the graphene-coated fiber in a 37 ̊C oven for 12 hours, the PMMA thin
film is removed by acetone.
Figure 4-12 (a) shows the boundary of transferred single-layer graphene. The
sensing area of side-polished fiber has an effective length of ~1 mm. The strip in the
middle is the groove of silica block in which the SMF is fixed with epoxy. Hence the
effective sensing area of the side-polished fiber is much smaller than the size of
graphene sheet. During the process of graphene transfer, we locate the sensing area of
the side-polished fiber to be at the center of the square graphene. Therefore, the
Figure 4-13. (a) Raman spectrum of monolayer CVD-grown graphene on copper foil. (b) Raman
spectrum of transferred monolayer graphene on gold-coated fiber. (c) Raman spectra at 5
different positions along the longitude of optical fiber.
Figure 4-12. (a) Microscopic view of the boundary of transferred single layer graphene (b) The
boundary between the polished and the unpolished region of optical fiber which is fully covered
with homogeneously deposited graphene.

Chapter 4 | Hybrid Graphene-on-Gold Plasmonic Fiber-Optic Biosensor
63
boundary of transferred graphene is at least 3 to 4 mm away from the sensing area.
Even though the boundary of graphene is a bit torn, the effective sensing area of side-
polished fiber is fully covered with well-preserved single-layer graphene sheet. Figure
4-12 (b) shows the boundary between the polished and the unpolished region of optical
fiber which right under the center of transferred graphene sheet. It can be seen that the
whole area is covered with homogeneously deposited graphene.
Figure 4-13 (a) and (b) show the Raman spectra of the monolayer CVD-grown
graphene on copper foil and the monolayer graphene transferred onto the gold-coated
side-polished optical fiber, respectively. The peak locations of G and 2D bands are at
1589 cm-1 ± 2cm-1 and 2678 cm-1 ± 2cm-1 respectively. The intensity ratios of 2D to G
peaks in Figure 4-13 (a) and (b) are 2.70 and 2.26 respectively, which indicate the
monolayer of graphene [244]. To verify the consistency of the monolayer graphene
after wet transfer, we collect Raman spectra at 5 different locations along the fiber
longitude. Figure 4-13 (c) plots the peak locations of G and 2D bands of positions that
are 0, 0.2 cm, 0.4 cm, 0.6 cm and 0.8 cm from the edge of graphene. Both the two bands
vary within ± 2cm-1 as the data-collecting position changes.
Figure 4-14 compares the transmission spectra of plain gold film and graphene
coated gold film on side-polished fiber when immersing in DI water. In agreement with
simulation, the SPR resonant wavelength undergoes a redshift from 577.2 nm to 579.3
Figure 4-14. Comparison of transmission spectra of configurations with and without graphene.

Chapter 4 | Hybrid Graphene-on-Gold Plasmonic Fiber-Optic Biosensor
64
nm with the addition of a graphene layer. Meanwhile, the graphene sheet obviously
decreases the transmission minimum from 52.97% to 48.27%.
4.3.2 Characterization of Graphene/Gold Hybrid
Plasmonic Sensor
We carry out experiments to verify that the graphene enhanced plasmonic sensor
provides better performance even for bulk refractive index sensing. First, we fabricate
and characterize another side-polished optical fiber coated with 30 nm gold film. The
gold-coated side-polished facet sequentially immerses in the same refractive index
matching liquids. Figure 4-15 (a) shows the variation of the transmission spectrum as
the analyte refractive index increases. As expected, the resonant wavelength shifts to
Figure 4-15. The variations of transmission spectrum of (a) gold-coated side-polished fiber based
plasmonic sensor and (b) graphene/gold hybrid plasmonic side-polished fiber based sensor.
Figure 4-16. The comparison of the sensitivities before and after transferring graphene for (a)
wavelength interrogation and (b) intensity interrogation.
Chapter 4 | Hybrid Graphene-on-Gold Plasmonic Fiber-Optic Biosensor
65
longer wavelengths and the peak loss enhances along with increasing refractive index.
Following the characterization of gold-coated side-polished fiber, we transfer a single-
layer graphene on top of the gold film using the same wet transfer method. Then we
characterize such graphene/gold hybrid plasmonic sensor using the same method.
Figure 4-15 (b) shows the characterization results. When immersing in DI water, the
resonant wavelength undergoes a redshift from 579.9 nm to 582.3 nm with the addition
of a graphene layer. Meanwhile, the additional graphene sheet decreases the
transmission minimum from 52.55% to 49.89%. These spectrum variations induced by
graphene transfer is very similar to that shown in Figure 4-14. As the refractive index
gradually increases, it is obvious that the wavelength shift and the peak transmission
loss enhancement are larger than those of Figure 4-15 (a).
Figure 4-16 compares the sensitivities of wavelength and intensity
interrogations before and after transferring single-layer graphene. As shown in Figure
4-15 (a), the sensitivity of wavelength interrogation increases from 352.29 nm/RIU to
417.73 nm/RIU after the graphene transfer. Also, the sensitivity of intensity
interrogation increases from -427.76%/RIU to -462.01%/RIU (Figure 4-16 (b)).
Therefore, in agreement with the simulation, the graphene/gold hybrid structure could
effectively improve the plasmonic sensing performance.
4.4 ssDNA Detection
Lastly, we validate the biosensing capability of our proposed sensor by detecting
ssDNA, as ssDNA quantitation is a critical process in many biomedical techniques such
as DNA sequencing, cloning, gene expression and polymerase chain reaction
(PCR) [245]. We use 7.3 kDa 24-mer (5’-CTT CTG TCT TGA TGT TTG TCA AAC-
3’) ssDNA (Integrated DNA Technologies) with concentrations ranging from 1 pM to
10 µM. 24-mer is a commonly used oligonucleotide probe length in the detections of
human diseases-causing peptides and bacteria such as amyloid-β peptide [246],
Streptococcus pyogenes [247], Enterobacteriaceae [248] and Arcobacter
butzleri [249]. Using the same setup with aforementioned characterization, we flow
various concentrations of ssDNA to the sensing area of the graphene enhanced SPR

Chapter 4 | Hybrid Graphene-on-Gold Plasmonic Fiber-Optic Biosensor
66
sensor, and wait for 8 minutes to ensure that ssDNA molecules fully interact with gold
film or graphene. Then we inject DI water to flush away the unbonded or weakly
adsorbed ssDNA molecules and then record the stabilized transmission spectrum.
Figure 4-17 (a) plots the magnified transmission spectra with various ssDNA
concentrations. Same with the trend when sensing bulk refractive index, the resonant
dip deepens and also shifts to longer wavelengths as the concentration increments. This
phenomenon is caused by the adsorption of ssDNA molecules on graphene sheet. The
bonding of ssDNA varies the local refractive index as well as scatters evanescent field
Figure 4-17. (a) Change of transmission spectra of graphene enhanced SPR fiber sensor when
detecting concentrations of ssDNA; (b) Variations of transmission minimum and resonant
wavelength against ssDNA concentrations (log pM).

Chapter 4 | Hybrid Graphene-on-Gold Plasmonic Fiber-Optic Biosensor
67
that intimates to the SPP propagation surface, thereby causes higher transmission loss.
Also, the propagation constant of SPP is modified so that the phase matching condition
of SPR is satisfied at a longer wavelength. We also observe a distinguishable
enhancement of peak transmission loss when ssDNA concentration is as small as 1 pM.
Figure 4-17 (b) plots the linearly decreasing transmission minimum and the gradually
saturated increasing resonant wavelength against log pM concentration. Therefore,
using transmission minimum as the measuring parameter, our proposed biosensor
Figure 4-18. (a) The variations of transmission spectrum as ssDNA concentration increases when
there is no graphene on thin gold film. (b) The comparison of the sensitivities to ssDNA solutions
with and without graphene transfer.
Chapter 4 | Hybrid Graphene-on-Gold Plasmonic Fiber-Optic Biosensor
68
provides a linear response over a wide detection range of log scale ssDNA
concentration from 1 pM to 10 µM.
Furthermore, we experimentally compare the biosensing performance of the
cases with and without a single-layer graphene deposited on the gold film. We use a
gold-coated side-polished fiber to detect the ssDNA solutions with concentrations
ranging from 1 pM to 10 µM. Figure 4-18 (a) shows the variation of transmission
spectrum as the ssDNA concentration increases. It can be seen that when the ssDNA
concentrations are as low as 1 pM and 10 pM, the variation of spectrum is hardly
distinguishable. When the ssDNA concentration increases to 1 nM, we can observe a
distinguishable enhancement of peak transmission loss of 0.1%. Therefore the hybrid
graphene/gold plasmonic structure improves the LOD from 1 nM to 1 pM. The
improvement of LOD is benefited from the improved adsorption of ssDNA molecules
to graphene due to the 𝜋-𝜋 interactions. In Figure 4-18 (b), we compare the sensitivities
to ssDNA solutions in two cases with and without graphene transfer. It is obvious that
the graphene/gold hybrid structure not only improves the LOD but also provides a two
times higher sensitivity.
4.5 Summary
We demonstrate a fiber-optic biosensor based on graphene-on-gold hybrid architecture.
We prove by both numerical analysis and experimental demonstration that the
deposition of graphene on the thin gold film effectively enhances the excited SPP, thus
promotes the SPR sensitivities in both wavelength and intensity interrogations.
Coupled with biomolecules adsorption capability, graphene enhanced SPR fiber sensor
delivers distinctive sensing performance, leading to the realization of the prospect of
highly sensitive, highly integrated, flexible and miniaturized in situ biosensors.

Chapter 5 | Electron-Rich 2D MoO3 for Highly Integrated Plasmonic Biosensing
69
Chapter 5 Electron-Rich 2D
MoO3 for Highly Integrated
Plasmonic Biosensing
2D plasmonic materials facilitate exceptional light-matter interaction and enable in situ
plasmon resonance tunability. However, surface plasmons of 2D materials intrinsically
locate at MIR range that are hardly accessible for practical applications. To address this
fundamental challenge, heavily-doped MoO3 nanoflakes have captured considerable
research efforts to achieve tunable plasmonic properties in visible and NIR region.
However, the feasibility of integrating plasmonic MoO3 nanoflakes in a sensing carrier,
as well as its potential for biological detection, still remain unexplored. In this work,
we synthesize few-layer α-MoO3 nanoflakes that are heavily doped with free electrons
via H+ intercalation. The resultant sub-stoichiometric MoO3-x nanoflakes provide
strong plasmon resonance located at ~735 nm. Integrated with microfiber, the MoO3-x
nanoflakes show good affinity to negatively charged biomolecules and provide a
detection limit of BSA as low as 1 pg/mL.
In this chapter, Section 6.1 introduces the design of MoO3-x based fiber-optic
biosensing platform. It also describes in details how to synthesize and characterize
MoO3-x nanoflakes and how to integrate the nanoflakes with microfiber. Section 6.2
presents the biosensing performance of our proposed MoO3-x based plasmonic sensor.
Section 6.3 numerically analyzes the plasmonic behaviors of MoO3-x coated microfiber.
5.1 Design and Construction of Biosensor
5.1.1 Biosensor Configuration
Figure 5-1 schematically illustrates our proposed biosensing platform that the surface
of microfiber is covered with a thin layer of heavily-doped α-MoO3. The strong
evanescent field of microfiber effectively excites the surface plasmons of MoO3 nano-

Chapter 5 | Electron-Rich 2D MoO3 for Highly Integrated Plasmonic Biosensing
70
layer. BSA molecules are then immobilized onto the surface of MoO3 nanoflakes and
interact with surface plasmons leading to the change of transmission spectrum. 2D
morphology of α-MoO3 nanoflakes can be easily synthesized by liquid phase
exfoliation due to the layered crystalized structure as demonstrated in Section 2.4.2.
5.1.2 Synthesis and Characterization of MoO3
Nanoflakes
0.4 g α-MoO3 (Alfa Aesar) powder is ground for 1 hour and then dissolved in 50 mL
solution of ethanol/DI water (1:1, v/v). As shown by the X-ray crystallography pattern
in Figure 5-2, the α-MoO3 powder we used is polycrystalline. After 2 hours of
sonication, the α-MoO3 solution undergoes 20 min centrifugation with 10000 rpm. 15
mL of lucid supernatant with MoO3 nanoflakes evenly dispersed is then collected. After
adding with 600 µL 0.01 M NaBH4 (Alfa Aesar), the color of supernatant turns into
dark blue. The doping of free carriers is realized by the H+ intercalation process, which
induces oxygen vacancies in MoO3 nanoflakes. As we gradually add NaBH4 to the
suspension of pristine MoO3 nanoflakes, sub-stoichiometric MoO3-x [201,250] forms
and the color of supernatant evolves from colorless to dark blue (Figure 5-3).
Figure 5-1. Schematic diagram of fiber-optic biosensor integrated with heavily-doped MoO3-x
nanoflakes. Inset 1: Crystal structure of stable orthorhombic α-MoO3. Inset 2: Molecular
structure of BSA protein.
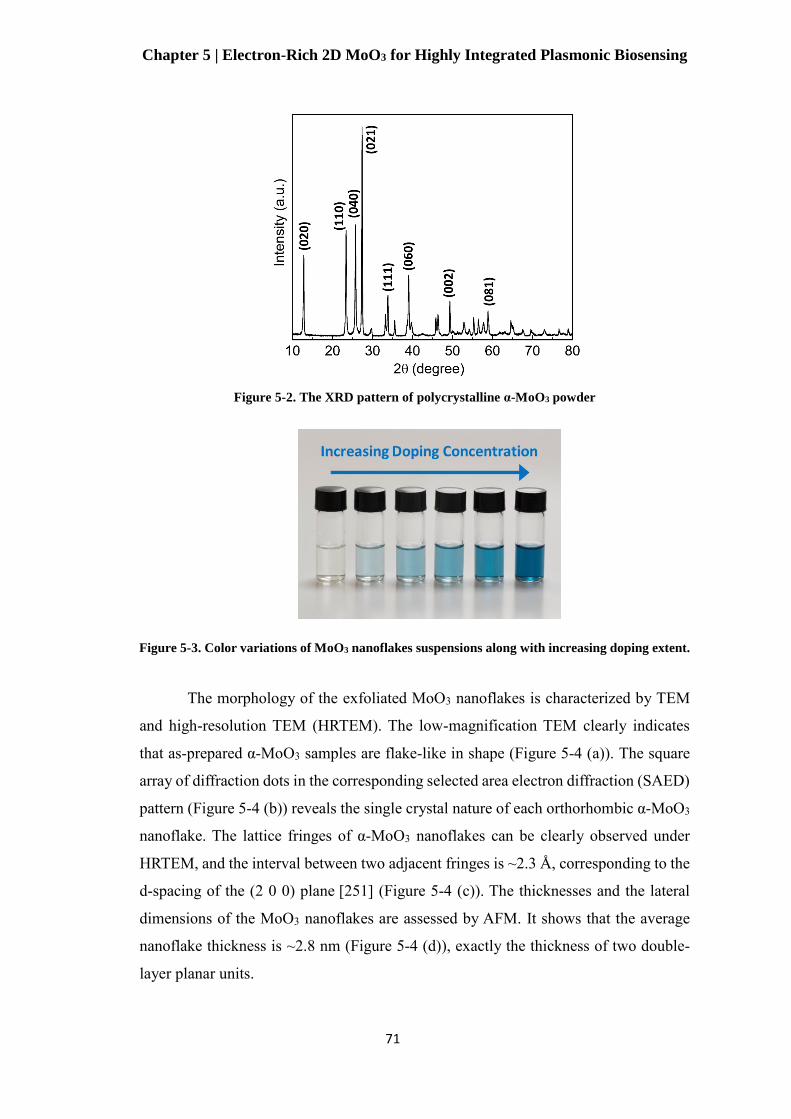
Chapter 5 | Electron-Rich 2D MoO3 for Highly Integrated Plasmonic Biosensing
71
The morphology of the exfoliated MoO3 nanoflakes is characterized by TEM
and high-resolution TEM (HRTEM). The low-magnification TEM clearly indicates
that as-prepared α-MoO3 samples are flake-like in shape (Figure 5-4 (a)). The square
array of diffraction dots in the corresponding selected area electron diffraction (SAED)
pattern (Figure 5-4 (b)) reveals the single crystal nature of each orthorhombic α-MoO3
nanoflake. The lattice fringes of α-MoO3 nanoflakes can be clearly observed under
HRTEM, and the interval between two adjacent fringes is ~2.3 Å, corresponding to the
d-spacing of the (2 0 0) plane [251] (Figure 5-4 (c)). The thicknesses and the lateral
dimensions of the MoO3 nanoflakes are assessed by AFM. It shows that the average
nanoflake thickness is ~2.8 nm (Figure 5-4 (d)), exactly the thickness of two double-
layer planar units.
Figure 5-2. The XRD pattern of polycrystalline α-MoO3 powder
Figure 5-3. Color variations of MoO3 nanoflakes suspensions along with increasing doping extent.
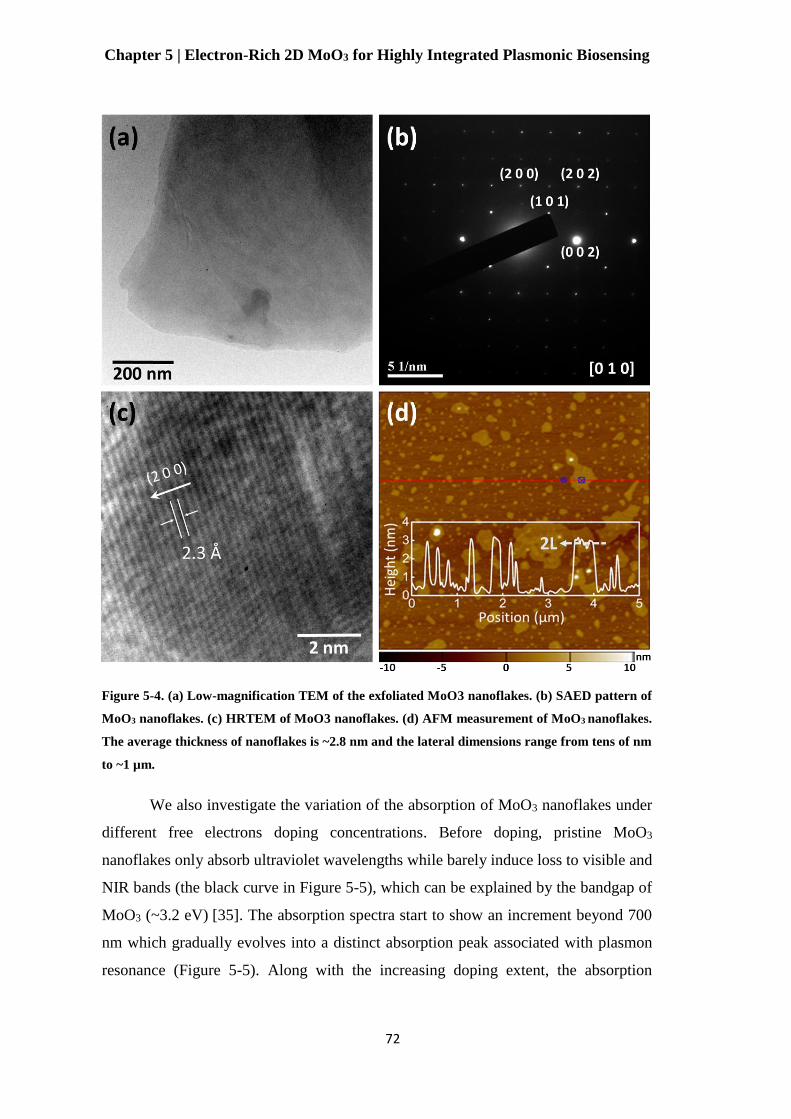
Chapter 5 | Electron-Rich 2D MoO3 for Highly Integrated Plasmonic Biosensing
72
We also investigate the variation of the absorption of MoO3 nanoflakes under
different free electrons doping concentrations. Before doping, pristine MoO3
nanoflakes only absorb ultraviolet wavelengths while barely induce loss to visible and
NIR bands (the black curve in Figure 5-5), which can be explained by the bandgap of
MoO3 (~3.2 eV) [35]. The absorption spectra start to show an increment beyond 700
nm which gradually evolves into a distinct absorption peak associated with plasmon
resonance (Figure 5-5). Along with the increasing doping extent, the absorption
Figure 5-4. (a) Low-magnification TEM of the exfoliated MoO3 nanoflakes. (b) SAED pattern of
MoO3 nanoflakes. (c) HRTEM of MoO3 nanoflakes. (d) AFM measurement of MoO3 nanoflakes.
The average thickness of nanoflakes is ~2.8 nm and the lateral dimensions range from tens of nm
to ~1 µm.

Chapter 5 | Electron-Rich 2D MoO3 for Highly Integrated Plasmonic Biosensing
73
increases steadily and meanwhile, the resonant wavelength undergoes a blue-shift from
767 nm to 738 nm. The blueshift of wavelength along with the enhancing doping
concentration is predictable since the plasma frequency is directly related to the
electron density (𝜔𝑝 ∝ n1/2) described by the Drude model [252], meaning that the
increase of free electron density in sub-stoichiometric MoO3-x leads to the increase of
surface plasmon frequency that corresponds to a shorter resonant wavelength.
Figure 5-5. The evolvement of absorption spectrum from pristine MoO3 nanoflakes suspension
(black curve) to increasing doping extent. 2 mL pristine MoO3 nanoflakes suspensions are added
with 0, 50 µL, 60 µL, 70 µL and 80 µL 0.01 M NaBH4 respectively.
The formation of sub-stoichiometric MoO3-x is further verified by X-ray
photoelectron spectroscopy (XPS) measurements shown in Figure 5-6 (a) and (b).
Before the H+ intercalation, only two binding energy peaks locate at 233.1 eV and 236.2
eV correlated with Mo6+ 3d5/2 and Mo6+ 3d3/2, respectively (Figure 5-6 (a)). After the
doping of free carriers, the lower oxidation state Mo5+ with binding energy peaks at
231.9 eV and 235.1 eV, coexists with Mo6+ in MoO3-x samples [253]. Evaluated from
the peak areas corresponding to the two oxidation states, Mo6+ and Mo5+ ions account
for 71.7% and 28.3%, respectively (Figure 5-6 (b)). The increased free electron density
of sub-stoichiometric MoO3-x originates from the two leftover electrons per oxygen
vacancy once an oxygen atom is removed from the oxide as explained in Section 2.4.2.

Chapter 5 | Electron-Rich 2D MoO3 for Highly Integrated Plasmonic Biosensing
74
These leftover electrons facilitate the collective oscillations at the surface of MoO3-x
nanoflakes at the resonant frequency.
Figure 5-6. (a) XPS analysis of pristine MoO3. (b) XPS analysis of highly doped MoO3 nanoflakes.
Mo6+ and Mo5+ coexist after doping.
5.1.3 Integration of MoO3 Nanoflakes and Microfiber
The microfiber is fabricated using the heat-and-pull method as explained in Section
2.1.3. It is tapered from a standard SMF. The whole length of the tapered fiber
consisting of two identical taper transitions and the central uniform waist is 30 mm.
The waist diameter is 2 μm and the waist length is ~10 mm. Based on Equation (11),
the taper angle 𝛺(𝑧) ≪ 1. Hence the tapered fiber is adiabatic. To stably immobilize
the MoO3-x nanoflakes, we adopt polyelectrolytes to functionalize the fiber surface.
Since MoO3-x is positively charged [254], it undergoes strong electrostatic attraction to
polyanions. Therefore, we functionalize the microfiber with self-assembled
poly(allylamine) (PAA)/poly(styrene sulfonate) (PSS) bilayer to introduce evenly
distributed negative charges on the outer surface. We immobilize the microfiber in a
flow chamber and fill up the chamber with DI water. Then we flow 100 µL 1.0 M
NaOH (Alfa Aesar) solution into the chamber and monitor the real-time transmission
intensity of the microfiber. The transmission intensity stabilizes in about 10 min. Then
the microfiber as well as the chamber are rinsed with DI water for 5 times. 100 µL 0.05
wt% positively charged PAA (Sigma-Aldrich) is then flowed into the chamber and
stagnated for 20 min, meanwhile the real-time transmission of microfiber tends to

Chapter 5 | Electron-Rich 2D MoO3 for Highly Integrated Plasmonic Biosensing
75
steady intensity. After 5 times rinsing with DI water, 100 µL 0.05 wt% PSS (Sigma-
Aldrich) carried with negative charges is flowed into the chamber and stagnated for 20
min. Again, the microfiber is rinsed with DI water for 5 times to wash away redundant
PSS. Now the microfiber is functionalized with evenly distributed negative charges.
Then the functionalized microfiber is immersed in 50 µL MoO3-x solution. We monitor
the real-time transmission intensity of microfiber within 745 nm – 755 nm. As shown
in Figure 5-7, the transmission intensity keeps steady before adding the MoO3-x
nanoflakes. After adding the MoO3-x nanoflakes, the transmission intensity suddenly
declines and then gradually tends to a steady level meaning the deposition of nanoflakes
on microfiber surface tends to saturation. This phenomenon is a typical self-assembly
process of plasmonic nanomaterials to optical fibers.
Figure 5-7. Real-time monitoring of the transmission intensity of microfiber within 745 nm – 755
nm as MoO3-x nanoflakes are bonding to the microfiber surface.
We characterize the morphology of the immobilized MoO3-x nanoflakes using
SEM. Low accelerating voltages (≤ 5 kV) are suitable for observing the surface
morphology. Since microfiber is made of insulating SiO2 that the electrons strike on it
accumulate at the surface as there is no conducting path to the ground [255]. Observing
microfiber surface morphology suffers from the charging effect that the MoO3-x
nanoflakes cannot be clearly seen. To address the charging issue, we functionalize a

Chapter 5 | Electron-Rich 2D MoO3 for Highly Integrated Plasmonic Biosensing
76
SiO2 (285 nm)/Si substrate with MoO3-x nanoflakes using exactly the same method as
microfiber functionalization. The top thin SiO2 film is the same material as microfiber,
thus we can achieve the same functionalization effectiveness on the thin SiO2 film
surface. Also, the interaction volume of electron beam at low accelerating voltage is
less than 1 µm [256]. Hence the insulating SiO2 layer is thin enough that considerable
interaction volume lies in the conductive Si substrate beneath so that the amount of
electrons accumulated on specimen surface is significantly reduced. Figure 5-8 (a)
shows the SEM image of the morphology of MoO3-x nanoflakes on the SiO2 (285
nm)/Si substrate. The large bright color areas are the connected MoO3-x nanoflakes. It
can be seen the negatively charged PAA/PSS bilayer effectively adsorbs the positively
charged MoO3-x nanoflakes that the nanoflakes spread over the great majority of the
area. Some individual MoO3-x nanoflakes intersperse among the large-area connected
nanoflakes (red circled areas in Figure 5-8 (a)). The sizes of scattered individual
nanoflakes are comparable to those in AFM characterization (red circled areas in Figure
5-8 (b)), where the MoO3-x nanoflakes disperse on bare Si substrate without
electrostatic attractions. Therefore, the electrostatic interaction significantly promotes
the MoO3-x deposition on microfiber surface that the nanoflakes expand to micro-size
in the lateral dimension.
Figure 5-8. (a) Morphology of MoO3-x nanoflakes on the SiO2 (285 nm)/Si substrate. The
nanoflakes are functionalized by the same method as microfiber functionalization. (b) AFM
characterization of MoO3-x nanoflakes dispersed on bare Si substrate without electrostatic
attractions.
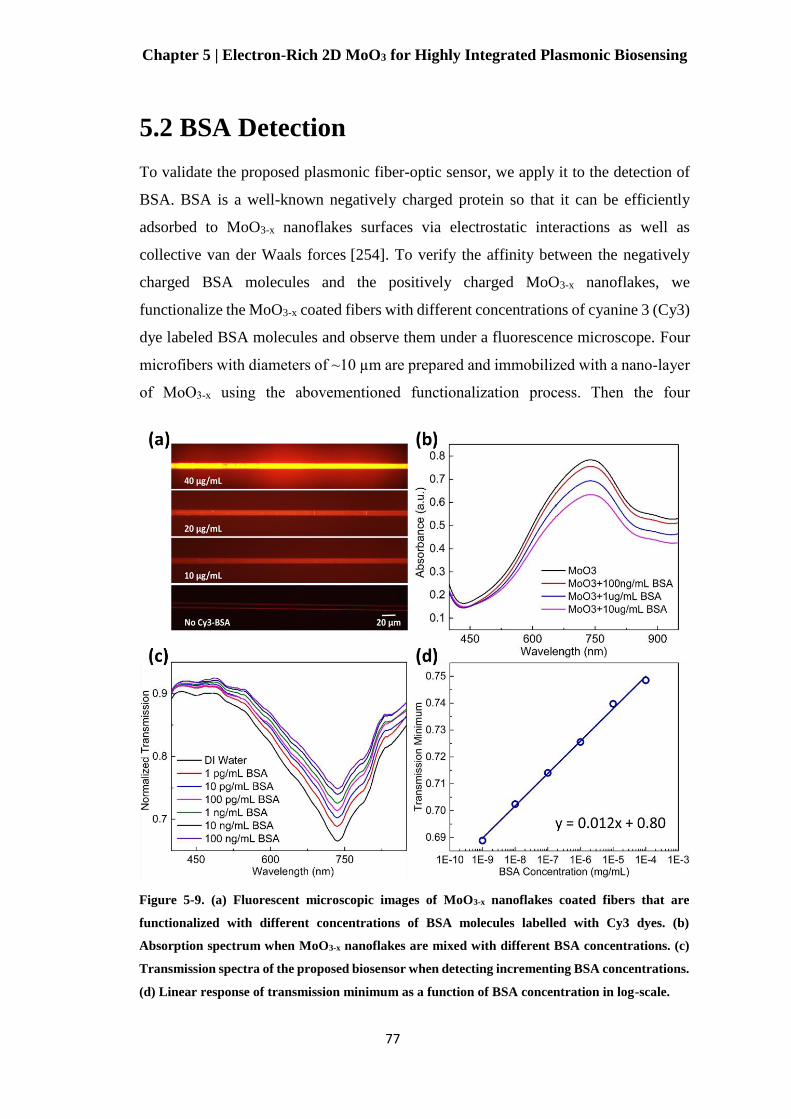
Chapter 5 | Electron-Rich 2D MoO3 for Highly Integrated Plasmonic Biosensing
77
5.2 BSA Detection
To validate the proposed plasmonic fiber-optic sensor, we apply it to the detection of
BSA. BSA is a well-known negatively charged protein so that it can be efficiently
adsorbed to MoO3-x nanoflakes surfaces via electrostatic interactions as well as
collective van der Waals forces [254]. To verify the affinity between the negatively
charged BSA molecules and the positively charged MoO3-x nanoflakes, we
functionalize the MoO3-x coated fibers with different concentrations of cyanine 3 (Cy3)
dye labeled BSA molecules and observe them under a fluorescence microscope. Four
microfibers with diameters of ~10 µm are prepared and immobilized with a nano-layer
of MoO3-x using the abovementioned functionalization process. Then the four
Figure 5-9. (a) Fluorescent microscopic images of MoO3-x nanoflakes coated fibers that are
functionalized with different concentrations of BSA molecules labelled with Cy3 dyes. (b)
Absorption spectrum when MoO3-x nanoflakes are mixed with different BSA concentrations. (c)
Transmission spectra of the proposed biosensor when detecting incrementing BSA concentrations.
(d) Linear response of transmission minimum as a function of BSA concentration in log-scale.
Chapter 5 | Electron-Rich 2D MoO3 for Highly Integrated Plasmonic Biosensing
78
microfibers are respectively immersed in 100 µL Cy3-BSA (Nanocs Inc.) solutions
with concentrations of 0, 10 µg/mL, 20 µg/mL, and 40 µg/mL for 20 min. The four
microfibers are then rinsed with DI water to wash away non-adsorbed Cy3-BSA
molecules. Figure 5-9 (a) presents the fluorescent microscopic images of four
microfibers functionalized with 0, 10 µg/mL, 20 µg/mL, and 40 µg/mL Cy3-BSA,
respectively. The even brightness along the fiber at each concentration indicates the
even distribution of the stably adsorbed Cy3-BSA molecules, which also implies the
uniformity of the immobilized MoO3-x nano-layer. As expected, the brightness
enhances as the Cy3-BSA concentration increases, indicating the incrementing quantity
of adsorbed Cy3-BSA molecules.
To investigate the impact of the bonded BSA molecules on the plasmonic
behaviors of heavily-doped MoO3-x, we measure the absorption spectra of MoO3-x
suspensions mixed with different concentrations of BSA. 1 mL of MoO3-x suspensions
is blended with 2 mL of BSA solutions with concentrations of 100 ng/mL, 1 µg/mL,
and 10 µg/mL, respectively. As shown in Figure 5-9 (b), the peak absorption of MoO3-
x slightly reduces when adding with relatively small BSA concentration of 100 ng/mL.
The plasmonic peak intensity further attenuates as the BSA concentration increases.
This is owing to the repulsion between the negatively charged BSA molecules and the
free electrons at MoO3-x nanoflakes surface, which reduces the free electron density
participated in the plasmonic resonance [201,202].
As MoO3-x nanoflakes are bonded to the microfiber surface, a plasmon
resonance centered at 735 nm forms on the transmission spectrum (the black curve in
Figure 5-9 (c)). 100 µL of BSA analyte with concentrations range from 1pg/mL to 100
ng/mL are sequentially tested using the MoO3-x coated microfiber. The resonance on
the transmission spectrum gradually attenuates as the BSA concentration increases. The
shallowing of plasmon resonance can be explained by the reduction of free carrier
density. An obvious weakening of the plasmon resonance appears when the BSA
concentration is as low as 1 pg/mL. Compared with the detection limit of 100 ng/mL
obtained from the absorption measurement shown in Figure 5-9 (b), such a low
detection limit of the proposed fiber-optic biosensor is benefited from the full
utilization of the high aspect ratio of 2D MoO3-x nanoflakes. As the MoO3-x is
Chapter 5 | Electron-Rich 2D MoO3 for Highly Integrated Plasmonic Biosensing
79
immobilized by electrostatic attraction, only a nano-scaled layer of nanoflakes can
stably attach to the microfiber, and additional layers of MoO3-x with positive charges
repel each other which will be washed away. This leads to the fact that the surface of
immobilized MoO3-x nanoflakes fully interacts with the BSA molecules and 100 µL of
analyte is a considerably large amount compared with the nano-scale MoO3-x.
Therefore, this fiber-based biosensing platform effectively reduces the required
amounts of 2D plasmonic material and biological analyte. Furthermore, the
transmission minimum corresponding to the peak plasmon resonance increases linearly
with the log-scale increment of BSA concentration (Figure 5-9 (d)).
The reproducibility of the MoO3-x based fiber-optic plasmonic biosensing
device we designed is mainly determined by the reproducibility of microfiber
fabrication and MoO3-x immobilization procedure. As the microfiber is fabricated via
the heat-and-pull method as introduced in Section 2.1.3, the structural parameters of
microfiber (i.e. waist diameter, waist length and taper transition length) can be very
well controlled during fabrication if the flame size, the scanning speed and the scanning
length of flame, and the pulling speed and the pulling length of translation stages are
fixed. Hence we can repeatedly fabricate microfibers with same structural parameters
and same sensing behaviors. The immobilization of MoO3-x nanoflakes on microfiber
is also highly reproducible. The surface functionalization of PAA/PSS bilayer has even
thickness and very good surface smoothness, thus it hardly induces perturbations on
the output spectrum. And based on Figure 5-8 (a) and Figure 5-9 (a), the immobilized
MoO3-x nanoflakes as well as the BSA molecules can evenly distribute on microfiber
surface. As long as the concentrations and volumes of MoO3-x nanoflakes solution used
for surface functionalization is fixed, the sensing performance of the fiber-optic
plasmonic device can be highly reproducible.
5.3 Numerical Analysis
As the heavily doped MoO3-x nanoflakes show quasi-metallic plasmonic properties, the
complex dielectric constant of MoO3-x can be described by the Drude Model as
explained in Section 2.3.1. Based on the plasmon resonance band shown in Figure 5-9

Chapter 5 | Electron-Rich 2D MoO3 for Highly Integrated Plasmonic Biosensing
80
(c) (the black curve in Figure 5-9 (c)), the resonance locates at 735 nm corresponding
to the resonant frequency 𝜔𝑠𝑝 of 1.687 eV. Also, the linewidth of resonance band is
180.7 nm, thus 𝛾 can be calculated to be 0.416 eV. As the transmission spectrum is
obtained when the biosensor is surrounded by DI water, 𝜀𝑑𝑖𝑒𝑙𝑒𝑐𝑡𝑟𝑖𝑐 is substituted with
1.333. Hence, the plasma frequency 𝜔𝑝 can be deduced as 3.327 eV. We carry out
eigenmode analysis where the fiber diameter is constructed to be 2 µm which exactly
equals to that of the microfiber in our experiment. The thickness of MoO3-x nano-layer
surrounding the microfiber is set to be 5.6 nm, which is the thickness of two stacked
layers of MoO3-x nanoflakes. During the calculation, we keep adjusting the value of 𝜀𝑏
to match the theoretical and experimental results. 𝜀𝑏 is found to be 3.52 by fitting the
simulated resonant wavelength to 735 nm. The deduced parameters are summarized in
Table 2. The parameters in Table 2 are their average values since there is size
distribution of MoO3-x nanoflakes.
Based on the Drude model parameters in Table 2, we carry out eigenmode
analysis to simulate the electromagnetic field distribution of MoO3-x nanoflakes coated
microfiber. As discussed in Section 2.1.3, the fiber core at microfiber waist is too small
to confine a guided core mode at the core-cladding interface. In this case, the
fundamental HE11 mode is guided by the cladding-air interface [257,258]. We calculate
the plasmon resonance band as plotted in Figure 5-10 (a) and it matches well with the
experimental spectrum. The inset of Figure 5-10 (a) presents the HE11 mode profile of
the MoO3-x coated microfiber. The evanescent field distributed in the vicinity of MoO3-
x nano-layer surface can be clearly observed. The electric field distribution of the entire
HE11 mode profile is shown in the inset of Figure 5-10 (b), while Figure 5-10 (b) plots
the magnified electric field distribution in the vicinity of MoO3-x nano-layer. MoO3-x
nano-layer strongly absorbs and confines the electric field of the guided mode in fiber,
which gives rise to the attenuation band in transmission spectrum.
Table 2. Drude Model Parameters of MoO3-x

Chapter 5 | Electron-Rich 2D MoO3 for Highly Integrated Plasmonic Biosensing
81
Figure 5-10. (a) Simulated plasmon resonance band with the deduced Drude model of MoO3-x.
Inset: HE11 mode profile of MoO3-x nano-layer coated microfiber. (b) Simulated electric field
distribution near the MoO3-x nanolayer. Inset: Electric field distribution over the whole fiber
diameter.
Figure 5-11 compares the electric field distributions over the entire microfiber
diameter without and with the nano-layer of MoO3-x. For a bare microfiber, the electric
field distribution matches well with the Gaussian distribution (Figure 5-11 (a)). The
HE11 mode profile of bare microfiber is shown in the inset of Figure 5-11 (a). When
the microfiber is coated with a nano-layer of MoO3-x, the electric field remains the
Gaussian distribution except that the additional MoO3-x layer strongly absorbs and
confines a portion of the guided mode (Figure 5-11 (b)). The evanescent field in the
vicinity of fiber surface becomes stronger in the HE11 mode profile (The inset of Figure
5-11 (b)), leading to a better biosensing performance.
Figure 5-11. (a) Electric field distribution over the diameter of a bare microfiber. Inset: HE11 mode
profile of the bare microfiber. (b) Electric field distribution over the diameter of a MoO3-x coated
microfiber. Inset: HE11 mode profile of the MoO3-x coated microfiber.

Chapter 5 | Electron-Rich 2D MoO3 for Highly Integrated Plasmonic Biosensing
82
5.4 Summary
For the first time, we integrate 2D plasmonic MoO3-x nanoflakes with optical
biosensing platform and demonstrate that when integrated with microfiber, a small
amount of MoO3-x nanoflakes would induce strong plasmon resonance in NIR and
provide a promising detection of protein molecules. We also deduce the Drude model
parameters of quasi-metallic MoO3-x via eigenmode analysis. This work proves the
unprecedented potentials of employing TMOs as an alternative class of 2D plasmonic
materials in highly integrated plasmonic devices compliant with frequently used and
cost-effective optical system.

Chapter 6 | CD-Modified AuNPs Based Fiber-Optic LSPR Biosensor
83
Chapter 6 CD-Modified AuNPs
Based Fiber-Optic LSPR
Biosensor
LSPR of AuNPs has become a prominent biosensing technique as it facilitates highly
sensitive and label-free detection of biomolecular quantification, binding and
dissociation. Especially when integrated with fiber-optic probes, it brings the feasibility
of miniaturized, remote and even in vivo biosensing. Biocompatibility is of crucial
importance for in vivo biosensing. Despite the inert nature of gold, further surface
functionalization of AuNPs to diminish cytotoxicity is often required. Meanwhile,
surface functionalization should also serve as selective biointerface without
compromising the sensitivity. Macrocyclic supramolecule-modified AuNPs is revealed
to simultaneously satisfy biocompatibility, selective molecular recognition as well as
high sensitivity. Although several attempts have been carried out to save post-
processing surface modification by capping AuNPs with macrocyclic supramolecules
during the synthesis, the majorities introduce harsh reducing reagents (e.g. NaBH4,
NaOH, thiols, etc.) which would be detrimental in biomedical practices. Also, the
LSPR biosensing potential of the macrocyclic supramolecule-modified AuNPs has not
been comprehensively explored. Therefore, in this work, we realize completely “green”
synthesis of biocompatible, high-quality and monodisperse -CD-capped AuNPs. We
decorate the biocompatible AuNPs on the surface of a microfiber to realize a highly
sensitive and highly integrated biosensing device with good molecular selectivity.
In this chapter, Section 6.1 introduces the architecture of our proposed
biosensing platform. Section 6.2 describes the synthesis procedures of -CD-capped
AuNPs and the characterization of the as-prepared AuNPs. Section 6.3 presents the
detection of cholesterol molecules using the -CD-capped AuNPs coated fiber-optic
biosensor. It also proves the exclusive selectivity of -CD-capped AuNPs to cholesterol
molecules via interference study.
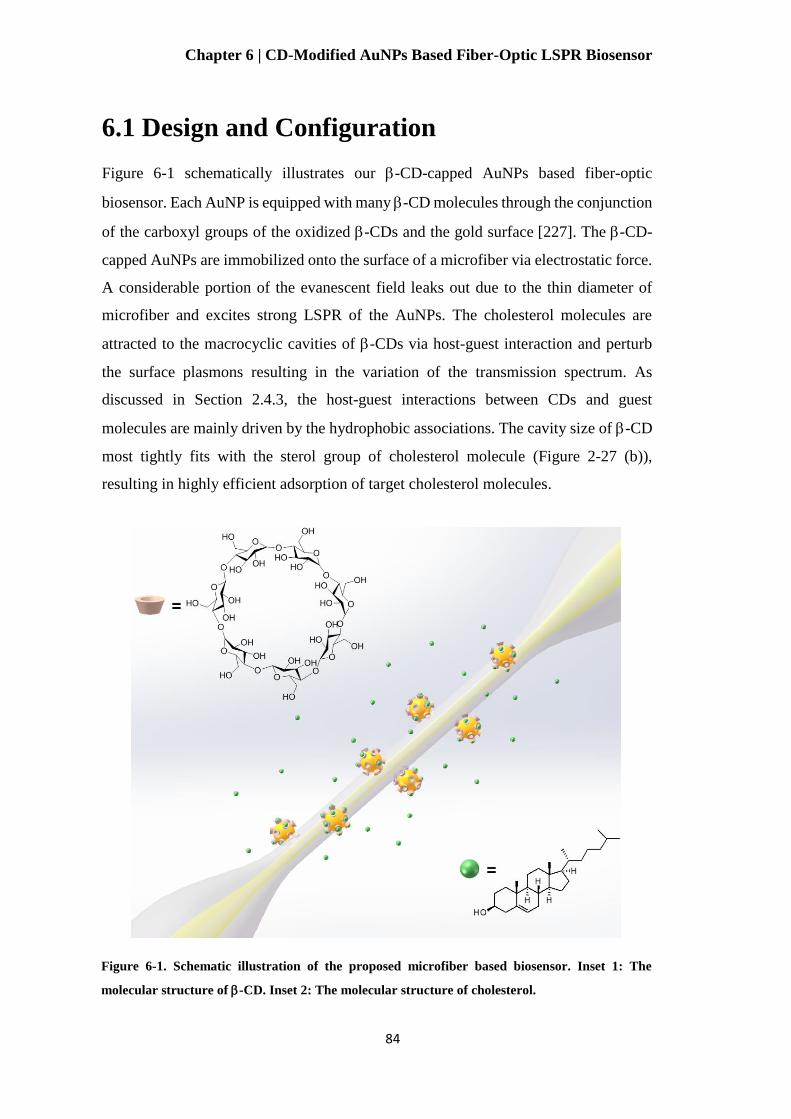
Chapter 6 | CD-Modified AuNPs Based Fiber-Optic LSPR Biosensor
84
6.1 Design and Configuration
Figure 6-1 schematically illustrates our -CD-capped AuNPs based fiber-optic
biosensor. Each AuNP is equipped with many -CD molecules through the conjunction
of the carboxyl groups of the oxidized -CDs and the gold surface [227]. The -CD-
capped AuNPs are immobilized onto the surface of a microfiber via electrostatic force.
A considerable portion of the evanescent field leaks out due to the thin diameter of
microfiber and excites strong LSPR of the AuNPs. The cholesterol molecules are
attracted to the macrocyclic cavities of -CDs via host-guest interaction and perturb
the surface plasmons resulting in the variation of the transmission spectrum. As
discussed in Section 2.4.3, the host-guest interactions between CDs and guest
molecules are mainly driven by the hydrophobic associations. The cavity size of -CD
most tightly fits with the sterol group of cholesterol molecule (Figure 2-27 (b)),
resulting in highly efficient adsorption of target cholesterol molecules.
Figure 6-1. Schematic illustration of the proposed microfiber based biosensor. Inset 1: The
molecular structure of -CD. Inset 2: The molecular structure of cholesterol.
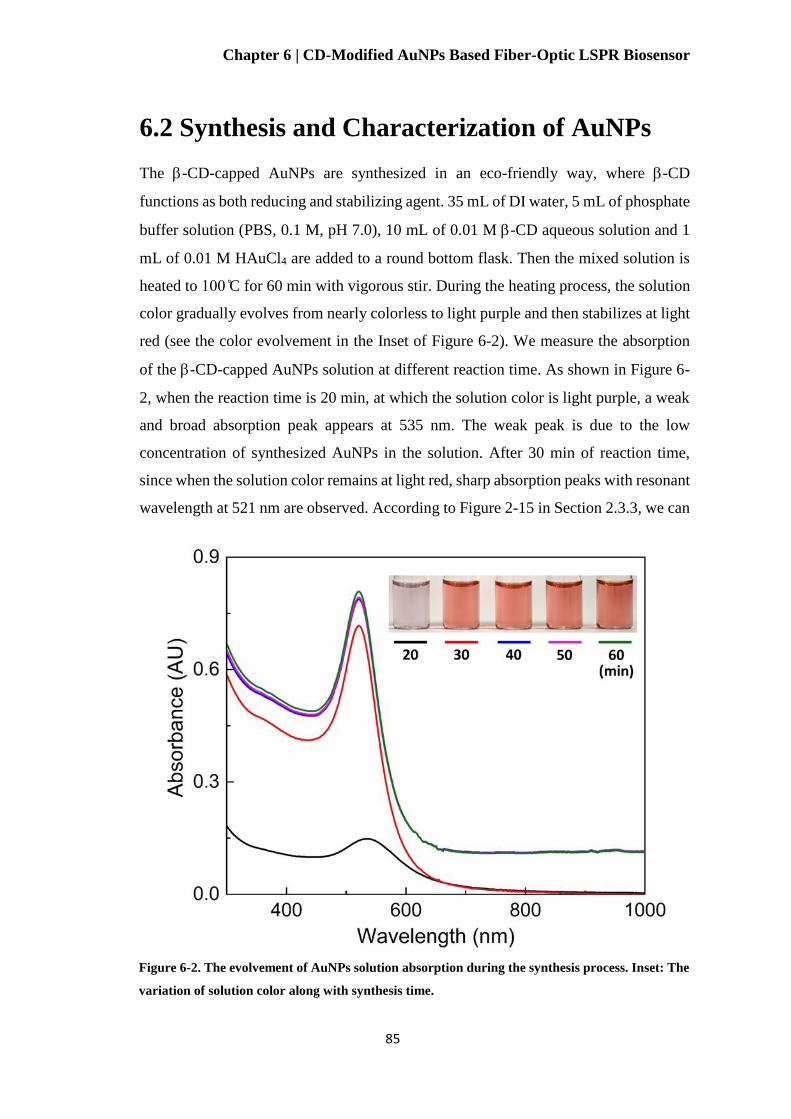
Chapter 6 | CD-Modified AuNPs Based Fiber-Optic LSPR Biosensor
85
6.2 Synthesis and Characterization of AuNPs
The -CD-capped AuNPs are synthesized in an eco-friendly way, where -CD
functions as both reducing and stabilizing agent. 35 mL of DI water, 5 mL of phosphate
buffer solution (PBS, 0.1 M, pH 7.0), 10 mL of 0.01 M -CD aqueous solution and 1
mL of 0.01 M HAuCl4 are added to a round bottom flask. Then the mixed solution is
heated to 100 ̊C for 60 min with vigorous stir. During the heating process, the solution
color gradually evolves from nearly colorless to light purple and then stabilizes at light
red (see the color evolvement in the Inset of Figure 6-2). We measure the absorption
of the -CD-capped AuNPs solution at different reaction time. As shown in Figure 6-
2, when the reaction time is 20 min, at which the solution color is light purple, a weak
and broad absorption peak appears at 535 nm. The weak peak is due to the low
concentration of synthesized AuNPs in the solution. After 30 min of reaction time,
since when the solution color remains at light red, sharp absorption peaks with resonant
wavelength at 521 nm are observed. According to Figure 2-15 in Section 2.3.3, we can
Figure 6-2. The evolvement of AuNPs solution absorption during the synthesis process. Inset: The
variation of solution color along with synthesis time.

Chapter 6 | CD-Modified AuNPs Based Fiber-Optic LSPR Biosensor
86
roughly estimate the nanoparticle sizes are stabilized at ~20 nm. To obtain a clear
picture of the AuNPs size distribution, we characterize the -CD-capped AuNPs
solutions by dynamic light scattering (DLS). As shown in Figure 6-3, at 20 min, the
AuNPs sizes have a broad distribution around 83 nm. This is in accordance with the
absorption curve in Figure 6-2 that the larger particle sizes lead to a longer LSPR
wavelength. The broad particle size distribution also explains the corresponding broad
absorption spectrum in Figure 6-2 (the black curve). Similar with the solution color and
the absorption spectra, the DLS result also stabilizes after reaction time of 30 min. It
can be seen from Figure 6-3 that the AuNPs sizes stabilize around ~18 nm during 30
min to 60 min with a much narrower size distribution. It can be concluded from Figure
6-2 and Figure 6-3 that 30 min of synthesis time can deliver -CD-capped AuNPs with
good enough plasmonic resonance and monodispersity. Therefore, we finalize our
synthesis time at 30 min.
Figure 6-3. The DLS measurements of AuNPs size distributions at different synthesis time.
To purify the AuNPs, the cooled solution undergoes centrifugation with 8000
rpm for 8 min. The precipitates are collected and redispersed in 5 mL DI water for next-
step characterizations and optical biosensing. After the purification, we get a more

Chapter 6 | CD-Modified AuNPs Based Fiber-Optic LSPR Biosensor
87
condensed AuNPs solution with ruby-red color (Inset of Figure 6-4). The peak
absorption remains at 521 nm but with a much sharper plasmonic resonance. The
linewidth of resonance band is as narrow as 47 nm, which is competitive with
conventionally synthesized AuNPs.
Figure 6-4. The absorption of AuNPs solution after centrifugation and redispersion. Inset: the
color of purified AuNPs solution.
Figure 6-5 shows the SEM observation of the as-prepared -CD-capped AuNPs
with synthesis time of 30 min. We can see the homogeneous particle size distribution
in SEM and the AuNPs tend to contiguously attach to each other after the solvent fully
evaporates. From the SEM image, we can estimate the average diameter of -CD-
capped AuNPs is ~19-20 nm, which matches well the DLS measurement in Figure 6-
3. A clear picture of AuNPs morphology can be provided by TEM and HRTEM. The
TEM image shown in Figure 6-6 (a) indicates that the AuNPs have almost uniform
spherical structures, and the particle diameters mostly range from ~18 nm to ~21 nm,
which is also in accordance with DLS results. The comparison between the particle size
distributions obtained from DLS and TEM is shown in Figure 6-7. Due to the limited
nanoparticle samples in TEM characterization, the TEM based size distribution is
narrower. We can conclude the good crystallinity of the -CD-capped AuNPs from the
distinct lattice fringes under HRTEM (Figure 6-6 (b)). The (1 1 1) plane can be clearly
observed. The ξ-potential value of the -CD-capped AuNPs is -33 mV (Figure 6-8),

Chapter 6 | CD-Modified AuNPs Based Fiber-Optic LSPR Biosensor
88
meaning that our as-prepared AuNPs are negatively charged at surface. The AuNPs in
solution are kept from aggregation by the electrostatic repulsion. The proton nuclear
magnetic resonance (1H NMR) spectrum of the -CD-capped AuNPs in D2O shown in
Figure 6-9 indicates that the macrocyclic structure of -CD is well preserved on AuNPs
surface after the synthesis process [259]. The well-maintained macrocyclic structure
can be further verified by the Fourier-transform infrared spectroscopy (FTIR) (Figure
6-10). The FTIR spectra of -CD and -CD-capped AuNPs have very similar profiles
except that the band corresponding to hydroxyl group becomes much narrower after
Figure 6-5.SEM image of the as-prepared -CD-capped AuNPs.
Figure 6-6. (a) Low-magnification TEM of -CD-capped AuNPs. (b) HRTEM of a single -CD-
capped AuNP.

Chapter 6 | CD-Modified AuNPs Based Fiber-Optic LSPR Biosensor
89
the formation of AuNPs, which indicates that the hydroxyl groups of -CD molecules
mainly participate in reducing Au3+ ions to metallic Au0. To obtain a precise
characterization of the transformation of -CD featured groups during AuNPs synthesis,
we carry out XPS measurements for pristine -CD and as-synthesized -CD-capped
AuNPs (Figure 6-11). As shown in Figure 6-11 (a), The C 1s XPS spectrum of pristine
-CD consists of three peaks located at 284.7 eV, 286.4 eV and 287.6 eV,
corresponding to C–C, C–OH and O–C–O bonds respectively. There is only one peak
at 532.8 eV in O 1s spectrum, which is contributed by C–OH or C–O–C bonds in -
CD (Figure 6-11 (b)) [227]. After the formation of -CD-capped AuNPs, we can
observe an obvious shrink of C–OH peak in the C 1s XPS spectrum (Figure 6-11 (c)).
The peak area of C–OH decreases from 65.9% in Figure 6-11 (a) to 60.7% in Figure 6-
11 (c), indicating the reduction of hydroxyl groups that is in accordance with the FTIR
observation. Meanwhile, a new peak appears at 289.1 eV, which is correlated with the
O–C=O bond [260]. Hence as expected, a new peak appears at 531.0 eV in the O 1s
spectrum (Figure 6-11 (d)), corresponding to the C=O bond [261]. Therefore, we can
conclude from XPS results that after reducing Au3+ to Au0, the reacted hydroxyl groups
of -CD molecules are oxidized to carboxyl groups. The newly formed carboxyl groups
strongly interact with the AuNPs surface via O–Au bond (Inset of Figure 6-9) and
effectively stabilizes the AuNPs [227,261].
Figure 6-7. (a) The AuNPs size distribution of 30 min synthesis time measured by DLS. (b) The
comparison of AuNPs size distributions obtained from DLS measurement and TEM observation.

Chapter 6 | CD-Modified AuNPs Based Fiber-Optic LSPR Biosensor
90
Figure 6-8. The ξ-potential value of the -CD-capped AuNPs.
Figure 6-9. The 1H NMR spectrum (300 MHz, D2O) of the β-CD-capped AuNPs. Inset: Schematic
-CD structure associated with corresponding chemical shifts and interaction with AuNP surface.
Figure 6-10. The FTIR spectra of pristine -CD and -CD-capped AuNPs.

Chapter 6 | CD-Modified AuNPs Based Fiber-Optic LSPR Biosensor
91
Figure 6-11. (a) C 1s XPS spectrum and (b) O 1s XPS spectrum of pristine -CD; (c) C 1s XPS
spectrum and (d) O 1s XPS spectrum of -CD-capped AuNPs.
6.3 Selective Detection of Cholesterol
The microfiber is fabricated by tapering a standard SMF using the heat-and-pull
method described in Section 2.1.3. The thinnest portion of microfiber has a diameter
of 4 m (Figure 6-12 (a)) and a length of ~8 mm. Electrostatic deposition of
polyelectrolyte is a facile yet efficient surface functionalization technique [262]. Since
the -CD-capped AuNPs have been proven to be negatively charged, we functionalize
the microfiber surface with a layer of positively charged PAA to adsorb AuNPs via
electrostatic interaction. A homogeneous layer of PAA is deposited on microfiber
surface using the same method as described in Section 5.1.3. The purified AuNPs
solution is diluted by 3 times for the decoration of microfiber surface. 50 L of the
diluted AuNPs solution is flowed into the chamber and stagnated for 10 min. Then we

Chapter 6 | CD-Modified AuNPs Based Fiber-Optic LSPR Biosensor
92
rinse the chamber with DI water for 5 times to flush away the redundant and weakly
adsorbed AuNPs. Figure 6-12 (b) shows the surface morphology of microfiber
immobilized with -CD-capped AuNPs.
It can be seen that the AuNPs evenly spread on fiber surface other than packing
together as shown in Figure 6-5, indicating the homogeneous distribution of the
positively charged PAA and the stable immobilization of AuNPs. As the AuNPs are
gradually attached on microfiber surface, an attenuation band centered at 530.7 nm
appears on the transmission spectrum and gradually deepens. The black curve in Figure
6-13 (a) is the stabilized transmission spectrum after the redundant AuNPs are removed
by rinsing. The reason for the redshift of resonance peak from 521.5 nm as shown in
Figure 6-4 to 530.7 nm in Figure 6-13 (a) is due to the high refractive index of silica
microfiber, since the LSPR resonant wavelength is proportional to √2𝑛𝑑𝑖𝑒𝑙𝑒𝑐𝑡𝑟𝑖𝑐2 + 1
at optical frequencies, where 𝑛𝑑𝑖𝑒𝑙𝑒𝑐𝑡𝑟𝑖𝑐 is the refractive index of ambient dielectric
material as explained in Equation (29) [263]. The -CD-capped AuNPs decorated
microfiber is sequentially immersed in 200 L aqueous cholesterol solutions with
concentrations range from 5 aM to 0.5 M. We can observe a distinguishable
deepening of the attenuation band when the cholesterol concentration is as low as 5 aM
(the red curve in Figure 6-13 (a)). Such low limit of detection is benefited from the
highly efficient interaction between -CD and cholesterol molecules. The formation of
host-guest inclusion complexations at AuNPs surface increases the local refractive
index as well as the scattering of evanescent field, leading to a higher transmission loss.
Figure 6-12. (a) The SEM image of the thinnest portion of microfiber. (b) The distribution of the
immobilized -CD-capped AuNPs on microfiber surface.
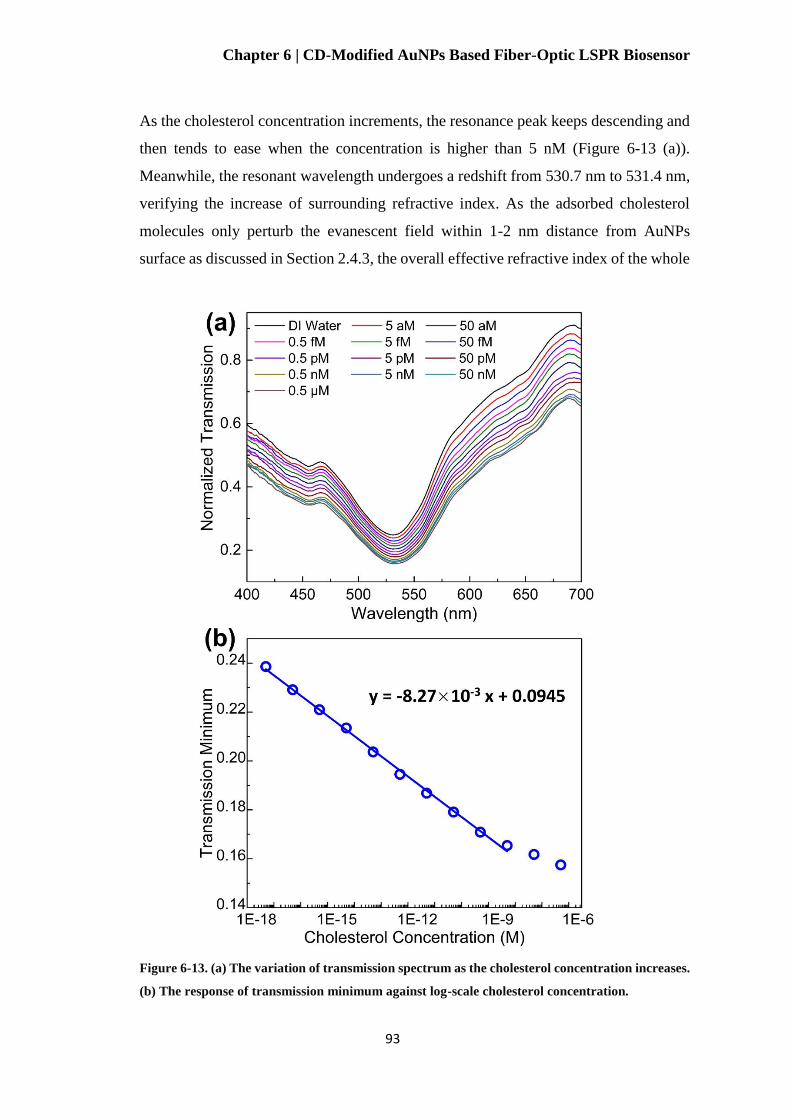
Chapter 6 | CD-Modified AuNPs Based Fiber-Optic LSPR Biosensor
93
As the cholesterol concentration increments, the resonance peak keeps descending and
then tends to ease when the concentration is higher than 5 nM (Figure 6-13 (a)).
Meanwhile, the resonant wavelength undergoes a redshift from 530.7 nm to 531.4 nm,
verifying the increase of surrounding refractive index. As the adsorbed cholesterol
molecules only perturb the evanescent field within 1-2 nm distance from AuNPs
surface as discussed in Section 2.4.3, the overall effective refractive index of the whole
Figure 6-13. (a) The variation of transmission spectrum as the cholesterol concentration increases.
(b) The response of transmission minimum against log-scale cholesterol concentration.
Chapter 6 | CD-Modified AuNPs Based Fiber-Optic LSPR Biosensor
94
penetration depth of surface plasmon is not largely increased. Hence the resonant
wavelength shift is not obvious. Taking the transmission minimum as the sensing
parameter, our proposed biosensor provides a linear response within a wide range of
log-scale cholesterol concentration from 5 aM to 5 nM (Figure 6-13 (b)). It can be seen
from Figure 6-13 (b) the response tends to saturate when cholesterol concentration is
larger than 5 nM. Limited by the poor water solubility of cholesterol molecules [264],
only concentrations no more than 0.5 μM are prepared and tested.
To verify the reliability of our proposed biosensor in practical applications, we
carry out an interference study for the commonly present compounds in human serum,
including glutamic acid, cysteine, ascorbic acid and dopamine [227,265,266]. For each
tested cholesterol concentration, the interfering substances are diluted to their
corresponding concentrations based on the realistic proportions in human serum [227].
For example, when 5 fM cholesterol is tested, glutamic acid, cysteine, ascorbic acid
and dopamine solutions with concentrations of 0.15 fM, 0.31 fM, 0.13 fM and 3.75×10-
21 M respectively are sequentially introduced. Figure 6-14 presents the real-time
monitoring of the average transmission intensity within 530-535 nm when we detect
50 aM – 5 fM cholesterol while introducing the interfering substances. It shows that
each time when the cholesterol is added, the average transmission intensity quickly
descends by ~1%, which matches with the descending trend of transmission minimum
shown in Figure 6-13 (b). Introducing the interfering substances induces slight but
tolerable fluctuations on transmission intensity. Each addition of interfering substance
leads to slow and very small-scale decrease of transmission intensity. After the
intensity is stabilized, the redundant substances are flushed away by rinsing with DI
water (the blue arrows in Figure 6-14). We can see that the rinse almost brings the
intensity back to the level before the interfering substances are added. The negligible
impact of interfering substances on the biosensing performance is due to the much
weaker host-guest interaction between the interfering compounds and β-CDs compared
with the cholesterol-β-CD inclusion complexation and also the relatively low
concentrations of interfering substances in human serum. As the interaction between
β-CDs and guest molecules is mainly driven by hydrophobic attraction, the
hydrophobic groups in guest molecules play an essential role in forming the host-guest
complexation. A glutamic acid molecule contains two hydrophobic –(CH2) groups and

Chapter 6 | CD-Modified AuNPs Based Fiber-Optic LSPR Biosensor
95
one hydrophilic –(COOH) group. The interaction between glutamic acids and β-CDs
are based on the association between the –(CH2) groups and the interior cavity of β-
CD [267]. However, due to the mismatch between sizes of –(CH2) group and β-CD
cavity, although the inclusion complexation of glutamic acid and β-CD can be formed,
it would be much weaker compared with the tightly fitted cholesterol. Similarly, a
cysteine molecule has only one hydrophobic –(CH2) group, the interaction between
cysteine and β-CD would be even weaker than glutamic acid. The lactone ring in
ascorbic acid and the benzene ring in dopamine can also be housed by the CD
cavity [268–270]. However, their sizes most tightly fit with α-CD cavity but a bit
loosely fit with β-CD cavity [271]. Moreover, the concentrations of ascorbic acid and
dopamine in human serum are much lower than that of cholesterol. Especially for
dopamine, although the host-guest interaction with CD has been adopted for dopamine
sensing [268], its concentration is lower by 106 in human serum. Therefore it has
negligible interference to realistic cholesterol detection.
Figure 6-14. An interference study with the existence of common substances in human serum. The
concentrations of interfering substances are added based on the realistic proportions in human
serum.
6.4 Summary
For the first time, we investigate the highly integrated LSPR biosensing potential of -
CD-capped AuNPs synthesized in a facial and eco-friendly way where -CDs function

Chapter 6 | CD-Modified AuNPs Based Fiber-Optic LSPR Biosensor
96
as reducing and stabilizing agents as well as selective biointerface. The synthesis of -
CD-capped AuNPs is a one-step process that realizes not only the formation of uniform
nanoparticles but also the functionalization of biorecognition layer. Benefited from the
very thin thickness of -CD layer which is even comparable to 2D materials and the
highly efficient molecular recognition capability, the -CD-capped AuNPs based fiber-
optic biosensor achieves ultralow LOD as well as specific recognition of cholesterol
molecules. Given that CD can house a variety of guest molecules, our proposed highly
integrated and biocompatible plasmonic sensing platform can be versatile in various
biosensing scenarios.

Chapter 7 | Highly-Birefringent MOF Based SPR Sensor
97
Chapter 7 Highly-Birefringent
MOF Based SPR Sensor
MOFs are recognized by their fine arrangement of air holes in the cladding region
extended along the entire fiber length. Gas or liquid analyte can be infiltrated into the
cladding air holes around fiber core and approaches to the strong evanescent field of
guided mode due to the small core dimension. Meanwhile, the interaction between the
evanescent field and the infiltrated analyte can extend along the entire fiber length. This
unique feature realizes exceptional excitation of surface plasmons when coating
plasmonic materials on the inner walls of cladding air holes. Several structures of MOF
have been proposed previously for plasmonic sensing. However, as discussed in
Section 2.3.4, phase birefringence exists in most designs of MOF based SPR sensors
due to the structural asymmetry in two orthogonal polarization directions in pursuit of
higher sensitivities by enhancing the light-matter interaction. Birefringence leads to the
separation of resonant wavelengths corresponding to two orthogonal polarizations.
Generally, the output of an SPR sensor is obtained by monitoring the resonant dip of
the polarization that excites the strongest SPP. However, external perturbations or
inaccurate input polarization would mix unwanted polarization, thus result in an output
which is the superposition of two resonant dips of orthogonal polarizations. The
resultant resonant wavelength is thereby divergent from that of wanted polarization,
hence the accuracy of SPR sensor is compromised. To address such issue, we propose
to use a so-called polarization-maintaining MOF that introduces a phase birefringence
large enough to suppress the impact of polarization crosstalk on sensor output,
meanwhile achieving a promising sensitivity.
In this chapter, we design a highly-birefringent MOF and numerically analyze
its SPR sensing performance. Section 7.1 introduces the configuration and working
principle of our proposed highly-birefringent MOF. Section 7.2 discusses how the
phase birefringence impacts the output accuracy of MOF based SPR sensor. Section
7.3 analyzes what parameters in MOF structure can impact the performance of SPR
sensing.

Chapter 7 | Highly-Birefringent MOF Based SPR Sensor
98
7.1 Configuration and Principle
The SPR sensor we proposed is a near-panda MOF as shown in Figure 7-2 (a). It
consists of three rings of photonic-crystal arranged cladding air holes. The two central
air holes in lateral direction are enlarged so that their diameters are 2.5 times larger
than those of the others. The diameters of the enlarged holes and normal holes are d1 =
1.75 µm and d2 = 4.38 µm, respectively. The pitch of photonic crystal is 3.94 µm. Thin
gold layers are coated on the inner walls of two enlarged holes, in which analyte will
be infiltrated. The SPR behavior of our proposed sensor is numerically analyzed by
COMSOL, that employs the finite element method (FEM) to mesh the constructed
geometry into different sizes of triangular elements [272]. In our calculation, we use
very dense mesh at the boundaries of gold layers which are quite thin compared with
the fiber dimension. The maximum and minimum element sizes are set to be 0.05 µm
and 0.45 nm respectively. The remaining part of geometry is meshed with the fine mesh
that is predefined by COMSOL. A portion of the mesh is shown in Figure 7-1, where
the two blue lines are the boundaries of gold layer. At the boundary of constructed fiber
geometry, we add a 3-µm thick perfectly matched layer (PML) to avoid the reflection
interference.
Figure 7-1. Mesh sizes around the boundaries of gold layer in numerical model.

Chapter 7 | Highly-Birefringent MOF Based SPR Sensor
99
The fiber material is fused silica, of which the refractive index can be calculated
by the Sellmeier equation. The optical property of gold is characterized by an improved
Drude-Lorentz model [273]. Figure 7-2 (b) and (c) show the x-polarized and y-
polarized core mode pattern respectively. It can be seen that SPP is only excited by the
polarization of which the direction is perpendicular to the surface of thin metal film,
which is expected based on the SPR theories explained in Section 2.3.2.
According to Equation (24), SPR is excited when achieving the phase matching
condition, at which the real part of the effective index of core mode equals to that of
the surface plasmon (SP) mode. We use the eigenmode analysis of COMSOL to get
the effective indices at each wavelength. Figure 7-3 plots both the real part and the
imaginary part of the effective refractive index of the x-polarized core mode, which
primarily excites SPP, and the real part of effective index of surface plasmon (SP)
mode. The intersection of the red line and the black line in Figure 7-3 indicates the
phase matching point, which corresponds to the highest attenuation on the transmission
spectrum. The resonant wavelength is ~600 nm, since the effective index of SP mode
is closed to that of bordering analyte, e.g. 1.33, which is much lower than a silica
Figure 7-2. (a) Schematic drawing of the proposed MOF structure; (b) x-polarized and (c) y-
polarized core mode pattern calculated by FEM.

Chapter 7 | Highly-Birefringent MOF Based SPR Sensor
100
fiber [125]. Hence the phase matching condition can only be satisfied at ~600 nm where
the mode indices are ~1.45. Based on Equation (30), the core mode attenuation is a
function of the imaginary part of core mode effective index. We use the wavelength
Figure 7-4. Changes of core mode transmission loss when refractive index of analyte increases
from 1.33 to 1.34.
Figure 7-3. Effective indices of core mode and surface plasmon mode with refractive index of
analyte of 1.33 and gold layer thickness of 70 nm.

Chapter 7 | Highly-Birefringent MOF Based SPR Sensor
101
interrogation that follows the shift of resonant wavelength at which the core mode loss
is highest to calculate the sensitivity of SPR sensor. Figure 7-4 shows the variation of
attenuation spectrum when the analyte refractive index increases from 1.33 to 1.34.
The resonant peak undergoes a redshift from 604 nm to 617 nm. We can also observe
a considerable enhancement of the peak transmission loss.
7.2 Phase Birefringence and Sensing Accuracy
Considering a conventional solid core PCF with hexagonal-lattice arranged cladding
holes. The diameter of the air holes is the same with that of the normal air holes in our
proposed sensor, 1.75 µm and the pitch is also 3.94 µm. Thin gold films are coated on
the inner walls of first-ring air holes. As shown in Figure 7-5, SPP can be excited by
both x- and y- polarized core mode since the thin gold layers coated on the inner walls
of air holes are cylindrical. To investigate how the birefringence in fiber structure
influences the divergence between the resonant dips corresponding to two orthogonal
polarizations thereby offset the sensor output, we intentionally introduce birefringence
by gradually enlarging the diameters of the two central holes in lateral direction. The
thickness of thin gold layers is 50 nm and the refractive index of infiltrated analyte is
set to be 1.38, since it is a typical refractive index of cytoplasm [274–276] and several
types of proteins [277,278].
Figure 7-5. Mode patterns of (a) x- and (b) y-polarized core mode in conventional PCF with 50 nm
gold layers and analyte refractive index of 1.38.

Chapter 7 | Highly-Birefringent MOF Based SPR Sensor
102
Figure 7-6 (a) shows the loss spectra of the SPR sensor when the ratio of the
normal holes diameter d1 and the enlarged holes diameter d2 is 0.95. When d1/d2 = 0.95,
a small phase birefringence of ~2×10⁻⁵ is introduced. The resonant wavelengths
corresponding to x- and y-polarized core modes are 642.66 nm and 641.19 nm,
respectively. There is not much difference between the peak losses of the two resonant
dips. The overall resonant wavelength is 641.99 nm, which drifts 0.67 nm from that of
Figure 7-6. Loss spectra of MOF based SPR sensors when (a) d1/d2=0.95 (b) d1/d2=0.4 with analyte
refractive index of 1.38.

Chapter 7 | Highly-Birefringent MOF Based SPR Sensor
103
the x-polarized mode. Therefore, the existence of the unwanted y-polarization would
cause an offset of 0.67 nm that considerably compromises the accuracy of SPR sensor.
On the other hand, Figure 7-6 (b) shows the loss spectra of our proposed high-
birefringent MOF, i.e. d1/d2 = 0.4. It can be seen that the high birefringence
significantly enlarges the difference between the intensities of the peak losses
corresponding to the two orthogonal polarizations. SPP is mainly excited by x-
polarized core mode as shown in Figure 7-2 (b). Hence the overall attenuation spectrum
is predominated by that of x-polarized core mode. As a result, although the resonant
wavelengths of x- and y-polarized modes are more divergent, the resonant wavelength
offset is suppressed to be as small as 0.06 nm. The phase birefringence of d1/d2 = 0.4
is as large as ~4.2×10⁻⁴.
Figure 7-7. The relation between phase birefringence and the resonant wavelength offset.
The offset of the resonant wavelength of overall attenuation spectrum from that
of x-polarized core mode is determined by phase birefringence. As the two central holes
in lateral direction expanding, the wavelength offset experiences a rise and fall along
Chapter 7 | Highly-Birefringent MOF Based SPR Sensor
104
with the increasing phase birefringence. As shown in Figure 7-7, the wavelength offset
increases to be as high as 18.89 nm when d1/d2 varies from 0.9 to 0.65, meanwhile the
phase birefringence increases from ~4×10⁻⁵ to ~1×10⁻⁴. As the central holes dimension
keeps increasing, the wavelength offset suddenly drops and tends towards 0 after the
phase birefringence exceeds ~4×10⁻⁴. The resonant wavelengths of x- and y-polarized
core modes are more and more separated as the phase birefringence increases. When
the birefringence is relatively small, the overall resonant wavelength is drifted away
from that of x-polarized core mode since the relative magnitude between two
polarizations is not significant. The influence of y-polarized mode on the overall
spectrum is considerable. After the birefringence exceeds a threshold, i.e. ~2×10⁻⁴, the
wavelength offset is effectively reduced since the intensity of peak loss of y-polarized
mode is much smaller than that of x-polarized mode. Even though the two resonant
wavelengths keep drifting apart, the overall resonant wavelength quickly shifts back
towards that of x-polarized core modes. That is the reason why the offset suddenly
drops after d1/d2 = 0.65. Our proposed sensor provides a phase birefringence as high as
~4.2×10⁻⁴, which can suppress the wavelength offset to be extremely small.
7.3 Influencing Factors on SPR Behavior
We also investigate how the thickness of gold layer influences the SPR behaviors.
Figure 7-8 (a) plots the loss spectra of our proposed sensor when the gold thickness is
50 nm, 60 nm, 70 nm and 100 nm. The thickening of gold layer shifts the resonance
peak towards longer wavelengths, meanwhile significantly reduces its intensity
especially when the thickness increases from 50 nm to 60 nm. Similar phenomenon has
been reported in [279,280]. The decrease of peak loss intensity is due to the reduction
of the penetration of electric field through the gold layer. The redshift of resonant
wavelength along with gold layer thickening can be explained by Equation (24), that
∆β decreases as the metal layer thickness increases. Thereby the phase matching
condition is satisfied at a longer wavelength, at which the mode effective indices are
smaller. Although the intensity of SPP is highly dependent on the gold layer thickness,
the sensitivity of our proposed SPR sensor is weakly affected. Figure 7-8 (b) compares
the sensitivities when the gold thickness is 50 nm, 60 nm, 70 nm and 100 nm. We can

Chapter 7 | Highly-Birefringent MOF Based SPR Sensor
105
see that the resonant wavelength shifts can be fit into polynomial curves. The larger the
analyte refractive index, the high the sensitivity is. According to Equation (25), the
denominator consists of two terms with opposite signs, since 𝑑𝑛𝑝/𝑑𝜆, the material
dispersion is negative. The second term slightly increases with increasing wavelength,
hence the sensitivity is dominated by the first term of denominator. Hence the
sensitivity is higher at longer wavelength, which corresponds to larger analyte
Figure 7-8. (a) Loss spectra and (b) Sensitivity curves of proposed SPR sensor when gold thickness
is 50, 60, 70 and 100 nm respectively.

Chapter 7 | Highly-Birefringent MOF Based SPR Sensor
106
refractive index. Also, the parameters in Equation (25) are weekly affected by the
thickness of gold layer. That explains why the sensitivity curves of 50 nm, 60 nm, 70
nm and 100 nm are nearly parallel. Within a relatively small refractive index range, the
sensitivity can be considered to be linear. Within analyte refractive index of 1.37-1.38,
the sensitivity of 50 nm, 60 nm, 70 nm and 100 nm are 3000, 3000, 3100 and 3100
nm/RIU respectively.
Besides effectively suppressing the impact of polarization crosstalk, the
expanding of the two central holes also promotes the sensitivity of SPR sensor. Figure
7-9 compares the sensitivities of different central holes dimensions of d1/d2 = 0.4, d1/d2
= 0.5, d1/d2 = 0.6 and d1/d2 = 1.0. It shows that the more expanded central holes provide
higher sensitivity, especially at relatively high refractive index range. Within refractive
index of 1.37-1.38, the sensitivities corresponding to d1/d2 = 1.0, 0.6, 0.5 and 0.4 are
1900, 2500, 2800 and 3000 nm/RIU respectively. The improvement of sensitivity is
due to the expanded interaction area between the guided light in fiber core and the
infiltrated analyte in the enlarged holes. Also, the expanding of two central holes leads
to a small lateral dimension of fiber, thus enhances the SPP intensity. Therefore
compared with other hexagonal latticed non-birefringent PCF, our proposed sensor also
shows advantages in sensitivity [160–162].
Figure 7-9. Sensitivity curves when d1/d2 = 1.0, 0.6, 0.5 and 0.4 respectively.

Chapter 7 | Highly-Birefringent MOF Based SPR Sensor
107
7.4 Summary
For the first time we investigate the relation between the phase birefringence and the
resonant wavelength offset. Our results show that a phase birefringence higher than
4×10⁻⁴ can effectively suppress the wavelength offset caused by polarization crosstalk.
Large phase birefringence can be introduced by expanding the two central holes in
lateral direction. The proposed sensor could be easily fabricated by the stack-and-draw
process and infiltrated with analyte in the enlarged microfluidic channels. Meanwhile,
it also provides a sensitivity as high as 3100 nm/RIU.
Chapter 8 | Summary and Future Work
108
Chapter 8 Summary and Future
Work
8.1 Summary and Discussion
In this thesis, we integrate recent emerging functional nanomaterials with various fiber-
optic platforms and explore their potentials in highly integrated and highly sensitive
biosensing applications. We also analyze the proper designs of optical fiber structures
to optimize the light-matter interaction meanwhile improve the measurement accuracy.
The first contribution is to develop a highly sensitive optical fiber based
magnetic field sensor. Inspired by the emergence of magnetic nanoparticles enhanced
biosensing schemes, optical fiber based accurate measurement of magnetic field
strength responded by magnetic nanoparticles would pave the path to realize highly-
integrated and all-fiber optomagnetic biosensing system. In this work, the fiber-optic
magnetic field sensor is constructed by coating an LPG with magnetic fluid which
possesses remarkable optomagnetic properties. When the magnetic-fluid-coated LPG
is subjected to external magnetic field, the magnetic fluid undergoes phase transitions
thereby varies the surrounding refractive index of LPG. Benefited from the acute
response of LPG to the change of ambient medium, our proposed magnetic field sensor
provides a sensitivity as high as 0.154 dB/Gauss, which is superior in the state-of-the-
art fiber-optic magnetic field sensors.
The second contribution is to demonstrate a side-polished optical fiber based
biosensing platform integrated with a graphene-on-gold hybrid plasmonic structure. In
this work, we first carry out numerical analysis and found that depositing single-layer
graphene on thin gold film effectively enhances the SPP strength as well as the
plasmonic sensing performance. Then we experimentally verify that additional layer of
graphene effectively improves the bulk refractive index sensitivity of conventional
fiber-optic SPR sensor. Besides the SPP enhancement, the graphene sheet also serves
as surface functionalization that stably adsorbs ssDNA molecules. The proposed
biosensing platform provides a LOD of ssDNA as low as 1 pM. As a comparison, we

Chapter 8 | Summary and Future Work
109
also conduct ssDNA detection using bare thin gold film coated side-polished fiber and
find that LOD degrades to 1 nM, proving the huge prospect of integrating 2D materials
with conventional SPR biosensor in achieving highly sensitive, highly integrated,
miniaturized and flexible biosensors.
The third contribution is to explore the potentials of 2D TMOs in highly
integrated plasmonic biosensing for the first time. We fabricate and characterize
electron-rich 2D -MoO3-x nanoflakes with strong plasmon resonance in NIR range.
Integrated with a microfiber, the -MoO3-x nanoflakes show good affinity to negatively
charged protein molecules and promising plasmonic biosensing capability. A low LOD
of BSA of 1 pg/mL is achieved. In addition, the Drude model parameters of quasi-
metallic -MoO3-x are deduced via eigenmode analysis. Based on the deduced Drude
model parameters, we carry out simulation and prove that the -MoO3-x nano-layer on
microfiber surface strongly absorbs and confines the electric field, leading to improved
biosensing capability.
The fourth contribution is to investigate the LSPR biosensing performance of
-CD-capped AuNPs in highly integrated fiber-optic device. We realize completely
green synthesis of monodisperse -CD-capped AuNPs. -CDs serve as both reducing
and capping agent during the synthesis process. The host-guest interaction between the
-CD cavities on AuNPs surface and the cholesterol molecules facilitates highly
efficient immobilization of target cholesterol molecules. Meanwhile, the -CD cavities
with height less than 1 nm enables strong plasmon-matter interaction even comparable
with 2D materials. Therefore, our proposed -CD-capped AuNPs and microfiber based
biosensing device achieves a LOD of cholesterol as low as 5 aM, meaning extremely
low consumption of clinical samples in practical applications. Moreover, we conduct
interference study and verify that common substances in human serum hardly interfere
with the cholesterol detection.
The fifth contribution is to design a highly birefringent MOF that can
effectively suppress the SPR sensing inaccuracy caused by polarization crosstalk. We
carry out numerical analysis to figure out the relation between phase birefringence and
SPR sensing output. It is shown that commonly existed phase birefringence in MOF
based SPR sensor designs would induce considerable sensing offset. If the

Chapter 8 | Summary and Future Work
110
birefringence is intentionally enlarged to beyond ~2×10⁻⁴, the sensing offset can be
significantly reduced. Our proposed MOF based SPR sensor possesses a phase
birefringence as high as ~4.2×10⁻⁴, which effectively suppresses the measurement
offset to be negligible. Meanwhile, it provides a sensitivity of 3100 nm/RIU, which is
comparable to those of the state-of-the-art MOF based SPR sensors.
8.2 Future Work
In the future work, we plan to fulfill following experiments:
1) Synthesis of various morphologies of macrocyclic supramolecules
modified AuNPs for biosensing. In our work presented in Chapter 6, we synthesized
monodisperse spherical AuNPs in an eco-friendly and facile way. Other morphologies
of AuNPs such as gold nanorods and nanostars have not been synthesized by such eco-
friendly and facile method. Gold nanorods and nanostars possess unique advantages in
enhancing plasmon-matter interaction. The hotspots between two self-assembled gold
nanorods and the intense field enhancement at sharp tips of gold nanostars facilitate
more acute biomolecule detection. We plan to achieve facile synthesis of various gold
nanostructures with macrocyclic supramolecules function as both reducing and capping
agent. Not only CDs, other macrocyclic supramolecules such as pillar[n]arene,
calix[n]arene and cucurbit[n]uril can also be explored for synthesizing biocompatible
AuNPs without introducing harsh reagents. Different morphologies of AuNPs capped
with a serious of macrocyclic supramolecules can target for numerous guest
biomolecules. Coupled with flexible optical fibers, we can achieve a versatile
biosensing platform with high degree of integration, high sensitivity, good
biocompatibility and numerous selective biomolecular recognitions.
2) Green synthesis and biosensing of 2D plasmonic TMOs. Our synthesis
of MoO3-x nanoflakes shown in Chapter 5 is realized by introducing strong reagent
NaBH4, which degrades the biocompatibility of the biosensing device. A very recent
research has reported the possibility of inducing and tuning the plasmonic properties
of MoO3-x nanoflakes in NIR range by employing ascorbic acid as a reducing
agent [281]. We plan to explore the feasibility of synthesizing not only MoO3-x

Chapter 8 | Summary and Future Work
111
nanoflakes but also other few-layer TMOs (e.g. WO3) in a mild environment, thus
achieving biocompatible biosensing platforms. Moreover, the tunable plasmon
resonance of 2D TMOs is an indicator of the concentration of mild reducing agents
such as ascorbic acid. We will try to discover more kinds of proper biomolecules
functioning as both reducing agent and target analyte that can be detected via tuning
the plasmonic properties of 2D TMOs.
Publications
112
Publications Journals
N.M.Y. Zhang, K. Li, T. Zhang, P.P. Shum, Z. Wang, Z. Wang, N. Zhang, J. Zhang,
T. Wu and L. Wei, “Electron-Rich Two-Dimensional Molybdenum Trioxides for
Highly Integrated Plasmonic Biosensing,” ACS Photonics 5(2), (2018).
N.M.Y. Zhang, K. Li, P.P. Shum, X. Yu, S. Zeng, Z. Wu, Q.J. Wang, K.T. Yong
and L. Wei, “Hybrid Graphene/Gold Plasmonic Fiber‐Optic Biosensor,” Advanced
Materials Technologies, 2(2), (2017).
N.M.Y. Zhang, D.J.J. Hu, Shum, Z. Wu, K. Li, T. Huang and L. Wei, “Design and
analysis of surface plasmon resonance sensor based on high-birefringent
microstructured optical fiber,” Journal of Optics, 18(6), 065005, (2016).
N.M.Y. Zhang, X. Dong, P.P. Shum, D.J.J. Hu, H. Su, W. S. Lew and L. Wei,
“Magnetic Field Sensor Based on Magnetic-Fluid-Coated Long-Period Fiber
Grating,” Journal of Optics, 17(6), 065402 (2015).
K. Li, N. Zhang, T. Zhang, Z. Wang, M. Chen, T. Wu, S. Ma, N.M.Y. Zhang, J.
Zhang, U.S. Dinish, P.P. Shum, M. Olivo and L. Wei, “Ultra-flexible, conformal,
and nano-patterned photonic surfaces via polymer cold-drawing,” Journal of
Materials Chemistry C (2018).
K. Li, N.M.Y. Zhang, N. Zhang, T. Zhang, G. Liu and L. Wei, “Spectral
characteristics and ultrahigh sensitivity near the dispersion turning point of optical
microfiber couplers,” Journal of Lightwave Technology PP(99), (2018).
K. Li, N. Zhang, N.M.Y. Zhang, G. Liu, T. Zhang and L. Wei, “Ultrasensitive
measurement of gas refractive index using an optical nanofiber coupler,” Optics
letters, 43(4), (2018).

Publications
113
J. Zhang, K. Li, T. Zhang, P.J.S Buenconsejo, M. Chen, Z. Wang, N.M.Y. Zhang,
Z. Wang, and L. Wei, “Laser‐Induced In‐Fiber Fluid Dynamical Instabilities for
Precise and Scalable Fabrication of Spherical Particles,” Advanced Functional
Materials, 27(43), (2017).
N. Zhang, G. Humbert, Z. Wu, K. Li, P.P. Shum, N.M.Y. Zhang, Y. Cui, J.L.
Auguste, X.Q. Dinh and L. Wei, “In-line optofluidic refractive index sensing in a
side-channel photonic crystal fiber,” Optics Express, 24(24), 27674-27682, (2016).
K. Li, T. Zhang, G. Liu, N. Zhang, N.M.Y. Zhang and L. Wei, “Ultrasensitive
optical microfiber coupler based sensors operating near the turning point of effective
group index difference,” Applied Physics Letters, 109(10), 101101, (2016).
K. Li, T. Zhang, N. Zhang, N.M.Y. Zhang, J. Zhang, T. Wu, S. Ma, J. Wu, M. Chen,
Y. He and L. Wei, “Integrated liquid crystal photonic bandgap fiber
devices,” Frontiers of Optoelectronics, 9(3), 466-482, (2016).
Conferences
N.M.Y. Zhang, K. Li, T. Zhang, P. Shum, Z. Wang, Z. Wang, N. Zhang, J. Zhang,
T. Wu and L. Wei, “Layered Molybdenum Trioxides as Two-Dimensional
Plasmonic Material for Highly Integrated and Flexible Biosensing,” Accepted by
MRS Spring Meeting & Exhibit, Materials Research Society, (2018).
N.M.Y. Zhang, K.Li, P.P. Shum, X.Yu, S.Zeng, Z.Wu, Q. J. Wang, K.T. Yong and
L. Wei, “Graphene Enhanced Surface Plasmon Resonance Fiber-Optic Biosensor,”
In CLEO: Science and Innovations (SM4P-4), Optical Society of America (2016).
N.M.Y. Zhang, D.J.J. Hu, P.P. Shum, Z. Wu, K. Li, T. Huang and L. Wei, “High-
Birefringent Microstructured Optical Fiber Based Surface Plasmon Resonance
Sensor,” In CLEO: Applications and Technology (JTu5A-116), Optical Society of
America (2016).

Publications
114
N.M.Y. Zhang, X. Dong, P.P. Shum, D.J.J. Hu, H. Su, W. S. Lew and L. Wei,
“Highly Sensitive Magnetic Field Sensor Using Long-Period Fiber Grating,”
In Conference on Lasers and Electro-Optics/Pacific Rim (CLEO-PR), 27F2_3,
Optical Society of America (2015).
J. Zhang, K. Li, N.M.Y. Zhang, T. Zhang and L. Wei, “High-Q silicon microsphere
whispering gallery mode resonator fabricated by laser induced in-fiber capillary
instability,” In Conference on Lasers and Electro-Optics/Pacific Rim (CLEO-PR),
IEEE (2017).
N. Zhang, G. Humbert, K. Li, Z. Wu, N.M.Y. Zhang, P.P. Shum, Y. Cui, J.L.
Auguste, X.Q. Dinh and L. Wei, “In-Line Optofluidic Sensor Based on a Long-
Period Grating in a Side-Channel Photonic Crystal Fiber,” In CLEO: Science and
Innovations (SM2P-2), Optical Society of America (2016).
K. Li, T. Zhang, G. Liu, N. Zhang, N.M.Y. Zhang and L. Wei, “Extraordinary
sensitivity in optical microfiber based refractive index sensors near the turning point
of turning point of effective group index difference,” In Asia Communications and
Photonics Conference (AF1B-5), Optical Society of America (2016).
References
115
References
1. D. Dey and T. Goswami, "Optical biosensors: A revolution towards quantum
nanoscale electronics device fabrication," J. Biomed. Biotechnol. 2011, (2011).
2. A. Ricciardi, A. Crescitelli, P. Vaiano, G. Quero, M. Consales, M. Pisco, E.
Esposito, and A. Cusano, "Lab-on-fiber technology: a new vision for chemical
and biological sensing," Analyst 140, 8068–8079 (2015).
3. A. François, Y. Zhi, and A. Meldrum, "Whispering gallery mode devices for
sensing and biosensing," in Springer Series in Materials Science (2015), Vol.
229, pp. 237–288.
4. A. J. Haes and R. P. Van Duyne, "A unified view of propagating and localized
surface plasmon resonance biosensors," Anal. Bioanal. Chem. 379, 920–930
(2004).
5. Y. Yanase, T. Hiragun, K. Ishii, T. Kawaguchi, T. Yanase, M. Kawai, K.
Sakamoto, and M. Hide, "Surface plasmon resonance for cell-based clinical
diagnosis.," Sensors (Basel). 14, 4948–59 (2014).
6. G. A. Lopez, M. C. Estevez, M. Soler, and L. M. Lechuga, "Recent advances in
nanoplasmonic biosensors: Applications and lab-on-a-chip integration,"
Nanophotonics 6, 123–136 (2017).
7. T. Schuster, N. Neumanna, and C. Schäffer, "Miniaturized fiber-optic surface-
plasmon-resonance sensor 7753_474," 21st Int. Conf. Opt. Fiber Sensors (2011).
8. S. Roh, T. Chung, and B. Lee, "Overview of the characteristics of micro- and
nano-structured surface plasmon resonance sensors," Sensors 11, 1565–1588
(2011).
9. R. K. Verma and B. D. Gupta, "Theoretical modelling of a bi-dimensional U-
shaped surface plasmon resonance based fibre optic sensor for sensitivity
enhancement," J. Phys. D-Applied Phys. 41, (2008).
10. A. Cusano, Lab-on-Fiber Technology (Springer Series in Surface Sciences 56,

References
116
2015).
11. H.-Y. Lin, C.-H. Huang, C.-C. Huang, Y.-C. Liu, and L.-K. Chau, "Multiple
resonance fiber-optic sensor with time division multiplexing for multianalyte
detection," Opt. Lett. 37, 3969 (2012).
12. Y. Peng, J. Hou, Z. Huang, and Q. Lu, "Temperature sensor based on surface
plasmon resonance within selectively coated photonic crystal fiber," Appl ied
Opt. 51, 6361–6367 (2012).
13. A. Hassani and M. Skorobogatiy, "Photonic crystal fiber-based plasmonic
sensors for the detection of biolayer thickness," J. Opt. Soc. Am. B 26, 1550
(2009).
14. Y. Zhang, C. Zhou, L. Xia, X. Yu, and D. Liu, "Wagon wheel fiber based
multichannel plasmonic sensor," Opt. Express 19, 22863–73 (2011).
15. S. Zeng, D. Baillargeat, H.-P. Ho, and K.-T. Yong, "Nanomaterials enhanced
surface plasmon resonance for biological and chemical sensing applications,"
Chem. Soc. Rev. 43, 3426 (2014).
16. X. Luo, T. Qiu, W. Lu, and Z. Ni, "Plasmons in graphene: Recent progress and
applications," Mater. Sci. Eng. R Reports 74, 351–376 (2013).
17. D. Rodrigo, O. Limaj, D. Janner, D. Etezadi, F. J. García De Abajo, V. Pruneri,
and H. Altug, "Mid-infrared plasmonic biosensing with graphene," Science
(80-. ). 349, 165–168 (2015).
18. L. Ju, B. Geng, J. Horng, C. Girit, M. Martin, Z. Hao, H. A. Bechtel, X. Liang,
A. Zettl, Y. R. Shen, and F. Wang, "Graphene plasmonics for tunable terahertz
metamaterials," Nat. Nanotechnol. 6, 630–634 (2011).
19. F. H. L. Koppens, D. E. Chang, and F. J. García De Abajo, "Graphene
plasmonics: A platform for strong light-matter interactions," Nano Lett. 11,
3370–3377 (2011).
20. D. Rodrigo, O. Limaj, D. Janner, D. Etezadi, F. J. Garcia de Abajo, V. Pruneri,
and H. Altug, "Mid-infrared plasmonic biosensing with graphene," Science

References
117
(80-. ). 349, 165–168 (2015).
21. E. Faridi, M. Moradi, N. Ansari, A. H. B. Ghasemi, A. Afshar, and S. M.
Mohseni, "Au/NiFe/M(Au, MoS<inf>2</inf>, graphene) trilayer
magnetoplasmonics DNA-hybridized sensors with high record of sensitivity," J.
Biomed. Opt. 22, (2017).
22. S. H. El-Gohary, N.-H. Kim, and K. M. Byun, "Optical determination of thick
graphene layer number based on surface plasmon resonance," J. Nanophotonics
7, 073799 (2013).
23. L. Wu, H. S. Chu, W. S. Koh, and E. P. Li, "Highly sensitive graphene
biosensors based on surface plasmon resonance," Opt. Express 18, 14395–14400
(2010).
24. P. K. Maharana and R. Jha, "Chalcogenide prism and graphene multilayer based
surface plasmon resonance affinity biosensor for high performance," Sensors
Actuators, B Chem. 169, 161–166 (2012).
25. N. F. Chiu, S. Y. Fan, C. Du Yang, and T. Y. Huang, "Carboxyl-functionalized
graphene oxide composites as SPR biosensors with enhanced sensitivity for
immunoaffinity detection," Biosens. Bioelectron. 89, 370–376 (2017).
26. B. Meshginqalam, H. Toloue, M. T. Ahmadi, A. Sabatyan, A. Centeno, and R.
Ismail, "Graphene embedded surface plasmon resonance based sensor prediction
model," Opt. Quantum Electron. 48, (2016).
27. H. Zhang, Y. Sun, S. Gao, J. Zhang, H. Zhang, and D. Song, "A novel graphene
oxide-based surface plasmon resonance biosensor for immunoassay," Small 9,
2537–2540 (2013).
28. Y. Ryu, S. Moon, Y. Oh, Y. Kim, T. Lee, D. H. Kim, and D. Kim, "Effect of
coupled graphene oxide on the sensitivity of surface plasmon resonance
detection," Appl. Opt. 53, 1419 (2014).
29. Y. V. Stebunov, O. A. Aftenieva, A. V. Arsenin, and V. S. Volkov, "Highly
Sensitive and Selective Sensor Chips with Graphene-Oxide Linking Layer,"
ACS Appl. Mater. Interfaces 7, 21727–21734 (2015).
References
118
30. J. B. Maurya, Y. K. Prajapati, V. Singh, and J. P. Saini, "Sensitivity enhancement
of surface plasmon resonance sensor based on graphene-MoS2 hybrid structure
with TiO2-SiO2 composite layer," Appl. Phys. a-Materials Sci. Process. 121,
525–533 (2015).
31. S. Zeng, S. Hu, J. Xia, T. Anderson, X.-Q. Dinh, X.-M. Meng, P. Coquet, and
K.-T. Yong, "Graphene–MoS2 hybrid nanostructures enhanced surface plasmon
resonance biosensors," Sensors Actuators B Chem. 207, 801–810 (2015).
32. J. B. Maurya, Y. K. Prajapati, V. Singh, J. P. Saini, and R. Tripathi,
"Performance of graphene–MoS2 based surface plasmon resonance sensor using
Silicon layer," Opt. Quantum Electron. 47, 3599–3611 (2015).
33. K. Manthiram and A. P. Alivisatos, "Tunable localized surface plasmon
resonances in tungsten oxide nanocrystals," J. Am. Chem. Soc. 134, 3995–3998
(2012).
34. H. Cheng, M. Wen, X. Ma, Y. Kuwahara, K. Mori, Y. Dai, B. Huang, and H.
Yamashita, "Hydrogen Doped Metal Oxide Semiconductors with Exceptional
and Tunable Localized Surface Plasmon Resonances," J. Am. Chem. Soc. 138,
9316–9324 (2016).
35. H. Cheng, T. Kamegawa, K. Mori, and H. Yamashita, "Surfactant-free
nonaqueous synthesis of plasmonic molybdenum oxide nanosheets with
enhanced catalytic activity for hydrogen generation from ammonia borane under
visible light," Angew. Chemie - Int. Ed. 53, 2910–2914 (2014).
36. M. M. Y. A. Alsaif, S. Balendhran, M. R. Field, K. Latham, W. Wlodarski, J. Z.
Ou, and K. Kalantar-Zadeh, "Two dimensional α-MoO3nanoflakes obtained
using solvent-assisted grinding and sonication method: Application for H2gas
sensing," Sensors Actuators, B Chem. 192, 196–204 (2014).
37. M. M. Y. A. Alsaif, M. R. Field, T. Daeneke, A. F. Chrimes, W. Zhang, B. J.
Carey, K. J. Berean, S. Walia, J. Van Embden, B. Zhang, K. Latham, K.
Kalantar-Zadeh, and J. Z. Ou, "Exfoliation solvent dependent plasmon
resonances in two-dimensional sub-stoichiometric molybdenum oxide
nanoflakes," ACS Appl. Mater. Interfaces 8, 3482–3493 (2016).

References
119
38. W. Liu, Q. Xu, W. Cui, C. Zhu, and Y. Qi, "CO2-Assisted Fabrication of Two-
Dimensional Amorphous Molybdenum Oxide Nanosheets for Enhanced
Plasmon Resonances," Angew. Chemie - Int. Ed. 56, 1600–1604 (2017).
39. H. Cheng, X. Qian, Y. Kuwahara, K. Mori, and H. Yamashita, "A Plasmonic
Molybdenum Oxide Hybrid with Reversible Tunability for Visible-Light-
Enhanced Catalytic Reactions," Adv. Mater. 27, 4616–4621 (2015).
40. E. G. Lee, K. M. Park, J. Y. Jeong, S. H. Lee, J. E. Baek, H. W. Lee, J. K. Jung,
and B. H. Chung, "Carbon nanotube-assisted enhancement of surface plasmon
resonance signal," Anal. Biochem. 408, 206–211 (2011).
41. C. M. Cobley, J. Chen, E. C. Cho, L. V. Wang, and Y. Xia, "Gold nanostructures:
A class of multifunctional materials for biomedical applications," Chem. Soc.
Rev. 40, 44–56 (2011).
42. X. Ma and Y. Zhao, "Biomedical Applications of Supramolecular Systems
Based on Host-Guest Interactions," Chem. Rev. 115, 7794–7839 (2015).
43. P. F. Andrade, A. F. de Faria, D. S. da Silva, J. A. Bonacin, and M. do C.
Goncalves, "Structural and morphological investigations of beta-cyclodextrin-
coated silver nanoparticles.," Colloids Surf. B. Biointerfaces 118, 289–297
(2014).
44. D. Wen, W. Liu, A. K. Herrmann, D. Haubold, M. Holzschuh, F. Simon, and A.
Eychmüller, "Simple and Sensitive Colorimetric Detection of Dopamine Based
on Assembly of Cyclodextrin-Modified Au Nanoparticles," Small 12, 2439–
2442 (2016).
45. S. Pande, S. K. Ghosh, S. Praharaj, S. Panigrahi, S. Basu, S. Jana, A. Pal, T.
Tsukuda, and T. Pal, "Synthesis of normal and inverted gold-silver core-shell
architectures in β-cyclodextrin and their applications in SERS," J. Phys. Chem.
C 111, 10806–10813 (2007).
46. H. Li, D. X. Chen, Y. L. Sun, Y. B. Zheng, L. L. Tan, P. S. Weiss, and Y. W.
Yang, "Viologen-mediated assembly of and sensing with
carboxylatopillar[5]arene- modified gold nanoparticles," J. Am. Chem. Soc. 135,

References
120
1570–1576 (2013).
47. T. Huang, F. Meng, and L. Qi, "Facile Synthesis and One-Dimensional
Assembly of Cyclodextrin-Capped Gold Nanoparticles and Their Applications
in Catalysis and Surface-Enhanced Raman Scattering," J. Phys. Chem. C 113,
13636–13642 (2009).
48. T. Premkumar and K. E. Geckeler, "Facile synthesis of silver nanoparticles using
unmodified cyclodextrin and their surface-enhanced Raman scattering activity,"
New J. Chem. 38, 2847 (2014).
49. V. I. Bhoi, S. Kumar, and C. N. Murthy, "Cyclodextrin encapsulated
monometallic and inverted core–shell bimetallic nanoparticles as efficient free
radical scavengers," New J. Chem. 40, 1396–1402 (2016).
50. J. R. Lakkakula, D. Divakaran, M. Thakur, M. K. Kumawat, and R. Srivastava,
"Cyclodextrin-stabilized Gold nanoclusters for bioimaging and selective label-
free intracellular sensing of Co2+ions," Sensors Actuators, B Chem. 262, 270–
281 (2018).
51. Y. Teramura, Y. Arima, and H. Iwata, "Surface plasmon resonance-based highly
sensitive immunosensing for brain natriuretic peptide using nanobeads for signal
amplification," Anal. Biochem. 357, 208–215 (2006).
52. S. Krishnan, V. Mani, D. Wasalathanthri, C. V. Kumar, and J. F. Rusling,
"Attomolar detection of a cancer biomarker protein in serum by surface plasmon
resonance using superparamagnetic particle labels," Angew. Chemie - Int. Ed.
50, 1175–1178 (2011).
53. Y. Wang, W. Knoll, and J. Dostalek, "Bacterial pathogen surface plasmon
resonance biosensor advanced by long range surface plasmons and magnetic
nanoparticle assays," Anal. Chem. 84, 8345–8350 (2012).
54. D. M. Bruls, T. H. Evers, J. a H. Kahlman, P. J. W. van Lankvelt, M. Ovsyanko,
E. G. M. Pelssers, J. J. H. B. Schleipen, F. K. de Theije, C. a Verschuren, T. van
der Wijk, J. B. a van Zon, W. U. Dittmer, a H. J. Immink, J. H. Nieuwenhuis,
and M. W. J. Prins, "Rapid integrated biosensor for multiplexed immunoassays

References
121
based on actuated magnetic nanoparticles.," Lab Chip 9, 3504–3510 (2009).
55. R. Gao, Y. Jiang, and S. Abdelaziz, "All-fiber magnetic field sensors based on
magnetic fluid-filled photonic crystal fibers.," Opt. Lett. 38, 1539–41 (2013).
56. W. Lin, Y. Miao, H. Zhang, B. Liu, Y. Liu, and B. Song, "Fiber-optic in-line
magnetic field sensor based on the magnetic fluid and multimode interference
effects," Appl. Phys. Lett. 103, (2013).
57. J. Zheng, X. Dong, P. Zu, J. Ji, H. Su, and P. Ping Shum, "Intensity-modulated
magnetic field sensor based on magnetic fluid and optical fiber gratings," Appl.
Phys. Lett. 103, 1–5 (2013).
58. Y. Miao, J. Wu, W. Lin, K. Zhang, Y. Yuan, B. Song, H. Zhang, B. Liu, and J.
Yao, "Magnetic field tunability of optical microfiber taper integrated with
ferrofluid," Opt. Express 21, 29914–29920 (2013).
59. J. M. P. Coelho, C. Silva, M. Nespereira, M. Abreu, and J. Rebordão, "Writing
of Long Period Fiber Gratings Using CO 2 Laser Radiation," Adv. Opt. Fiber
Technol. Fundam. Opt. Phenom. Appl. (2015).
60. S. W. James and R. P. Tatam, "Optical fibre long-period grating sensors:
characteristics and application," Meas. Sci. Technol. 14, R49–R61 (2003).
61. R. Hou, Z. Ghassemlooy, A. Hassan, C. Lu, and K. P. Dowker, "Modelling of
long-period fibre grating response to refractive index higher than that of
cladding," Meas. Sci. Technol. 12, 1709–1713 (2001).
62. J. H. Chong, P. Shum, H. Haryono, A. Yohana, M. K. Rao, C. Lu, and Y. Zhu,
"Measurements of refractive index sensitivity using long-period grating
refractometer," Opt. Commun. 229, 65–69 (2004).
63. V. Bhatia and a M. Vengsarkar, "Optical fiber long-period grating sensors.,"
Opt. Lett. 21, 692–694 (1996).
64. B. H. Lee, Y. Liu, S. B. Lee, S. S. Choi, and J. N. Jang, "Displacements of the
resonant peaks of a long-period fiber grating induced by a change of ambient
refractive index.," Opt. Lett. 22, 1769–1771 (1997).

References
122
65. H. Young-Geun, "Dependence of the Refractive Index of a Coating on a Long-
Period Fiber Grating on the Initial Coupling Strength," J. Korean Phys. Soc. 55,
2621 (2009).
66. S. W. J. and R. P. Tatam, "Optical fibre long-period grating sensors:
characteristics and application," Meas. Sci. Technol. 14, R49 (2003).
67. M. Jung, J. Koo, J. Park, Y.-W. Song, Y. M. Jhon, K. Lee, S. Lee, and J. H. Lee,
"Mode-locked pulse generation from an all-fiberized, Tm-Ho-codoped fiber
laser incorporating a graphene oxide-deposited side-polished fiber," Opt.
Express 21, 20062 (2013).
68. Y. W. Song, S. Y. Jang, W. S. Han, and M. K. Bae, "Graphene mode-lockers for
fiber lasers functioned with evanescent field interaction," Appl. Phys. Lett. 96,
(2010).
69. J. Lee, J. Koo, P. Debnath, Y.-W. Song, and J. H. Lee, "A Q -switched, mode-
locked fiber laser using a graphene oxide-based polarization sensitive saturable
absorber," Laser Phys. Lett. 10, 035103 (2013).
70. S. G. Lee, J. P. Sokoloff, B. P. McGinnis, and H. Sasabe, "Fabrication of a side-
polished fiber polarizer with a biref ringent polymer overlay," Opt. Lett. 22,
606–608 (1997).
71. Q. Bao, H. Zhang, B. Wang, Z. Ni, C. H. Y. X. Lim, Y. Wang, D. Y. Tang, and
K. P. Loh, "Broadband graphene polarizer," Nat. Photonics 5, 411–415 (2011).
72. R. Slavík, J. Homola, J. Tyroký, and E. Brynda, "Novel spectral fiber optic
sensor based on surface plasmon resonance," Sensors Actuators, B Chem. 74,
106–111 (2001).
73. W. G. Jung, S. W. Kim, K. T. Kim, E. S. Kim, and S. W. Kang, "High-sensitivity
temperature sensor using a side-polished single-mode fiber covered with the
polymer planar waveguide," IEEE Photonics Technol. Lett. 13, 1209–1211
(2001).
74. A. O. Dikovska, P. A. Atanasov, A. T. Andreev, B. S. Zafirova, E. I. Karakoleva,
and T. R. Stoyanchov, "ZnO thin film on side polished optical fiber for gas

References
123
sensing applications," Appl. Surf. Sci. 254, 1087–1090 (2007).
75. M. Yang, H. Liu, D. Zhang, and X. Tong, "Hydrogen sensing performance
comparison of Pd layer and Pd/WO3 composite thin film coated on side-
polished single- and multimode fibers," Sensors Actuators, B Chem. 149, 161–
164 (2010).
76. H.-Y. Lin, W.-H. Tsai, Y.-C. Tsao, and B.-C. Sheu, "Side-polished multimode
fiber biosensor based on surface plasmon resonance with halogen light.," Appl.
Opt. 46, 800–806 (2007).
77. J. Dai, M. Yang, Y. Chen, K. Cao, H. Liao, and P. Zhang, "Side-polished fiber
Bragg grating hydrogen sensor with WO3-Pd composite film as sensing
materials.," Opt. Express 19, 6141–6148 (2011).
78. H. S. Jang, K. N. Park, J. P. Kim, S. J. Sim, O. J. Kwon, Y.-G. Han, and K. S.
Lee, "Sensitive DNA biosensor based on a long-period grating formed on the
side-polished fiber surface," Opt. Express 17, 3855–3860 (2009).
79. J. Tang, J. Zhou, J. Guan, S. Long, J. Yu, H. Guan, H. Lu, Y. Luo, J. Zhang, and
Z. Chen, "Fabrication of Side-Polished Single Mode-Multimode-Single Mode
Fiber and Its Characteristics of Refractive Index Sensing," IEEE J. Sel. Top.
Quantum Electron. 23, (2017).
80. M. R. R. Khan, B.-H. Kang, S.-W. Lee, S.-H. Kim, S.-H. Yeom, S.-H. Lee, and
S.-W. Kang, "Fiber-optic multi-sensor array for detection of low concentration
volatile organic compounds," Opt. Express 21, 20119 (2013).
81. S. K. Liaw, J. Y. Chiu, and S. M. Tseng, "Precision side-polished fibers with a
long interaction length," Japanese J. Appl. Physics, Part 2 Lett. 36, (1997).
82. M. R. R. Khan, B. H. Kang, S. H. Yeom, D. H. Kwon, and S. W. Kang, "Fiber-
optic pulse width modulation sensor for low concentration VOC gas," Sensors
Actuators, B Chem. 188, 689–696 (2013).
83. S.-M. Tseng and C.-L. Chen, "Side-polished fibers," Appl. Opt. 31, 3438 (1992).
84. W. Cao and Y. Duan, "Optical fiber-based evanescent ammonia sensor," Sensors

References
124
Actuators, B Chem. 110, 252–259 (2005).
85. X. Wu and L. Tong, "Optical microfibers and nanofibers," Nanophotonics 2,
407–428 (2013).
86. T. A. Birks, I. Gris-Sánchez, S. Yerolatsitis, S. G. Leon-Saval, and R. R.
Thomson, "The photonic lantern," Adv. Opt. Photonics 7, 107 (2015).
87. R. Garcia-Fernandez, W. Alt, F. Bruse, C. Dan, K. Karapetyan, O. Rehband, A.
Stiebeiner, U. Wiedemann, D. Meschede, and A. Rauschenbeutel, "Optical
nanofibers and spectroscopy," Appl. Phys. B Lasers Opt. 105, 3–15 (2011).
88. J. D. Love, W. M. Henry, W. J. Stewart, R. J. Black, S. Lacroix, and F. Gonthier,
"Tapered single-mode fibres and devices. I. Adiabaticity criteria," Optoelectron.
IEE Proc. J 138, 343–354 (1991).
89. M. I. Zibaii, H. Latifi, Z. Saeedian, and Z. Chenari, "Nonadiabatic tapered
optical fiber sensor for measurement of antimicrobial activity of silver
nanoparticles against Escherichia coli," J. Photochem. Photobiol. B Biol. 135,
55–64 (2014).
90. P. Lu, J. Harris, X. Wang, G. Lin, L. Chen, and X. Bao, "Tapered-fiber-based
refractive index sensor at an air/solution interface.," Appl. Opt. 51, 7368–73
(2012).
91. W. Bin Ji, H. H. Liu, S. C. Tjin, K. K. Chow, and A. Lim, "Ultrahigh sensitivity
refractive index sensor based on optical microfiber," IEEE Photonics Technol.
Lett. 24, 1872–1874 (2012).
92. T. A. Birks and Y. W. Li, "The Shape of Fiber Tapers," J. Light. Technol. 10,
432–438 (1992).
93. H. G. Cha, C. W. Kim, S. W. Kang, B. K. Kim, and Y. S. Kang, "Preparation
and Characterization of the Magnetic Fluid of Trimethoxyhexadecylsilane-
Coated Fe3O4 Nanoparticles," J. Phys. Chem. C 114, 9802–9807 (2010).
94. S. Odenbach, "Ferrofluids - Magnetically controlled suspensions," in Colloids
and Surfaces A: Physicochemical and Engineering Aspects (2003), Vol. 217, pp.

References
125
171–178.
95. A. Weddemann, I. Ennen, A. Regtmeier, C. Albon, A. Wolff, K. Eckstädt, N.
Mill, M. K. H. Peter, J. Mattay, C. Plattner, N. Sewald, and A. Hütten, "Review
and outlook: From single nanoparticles to self-assembled monolayers and
granular GMR sensors," Beilstein J. Nanotechnol. 75 (2010).
96. D. Jin and H. Kim, "Magnetization of magnetite ferrofluid studied by using a
magnetic balance," Bull. Korean Chem. Soc. 34, 1715–1721 (2013).
97. A. Skumiel, A. Józefczak, T. Hornowski, and M. Labowski, "The influence of
the concentration of ferroparticles in a ferrofluid on its magnetic and acoustic
properties," J. Phys. D. Appl. Phys. 36, 3120 (2003).
98. X. Fang, Y. Xuan, and Q. Li, "Theoretical investigation of the extinction
coefficient of magnetic fluid," J. Nanoparticle Res. 15, (2013).
99. D. Heinrich, A. R. Goñi, and C. Thomsen, "Dynamics of magnetic-field-induced
clustering in ionic ferrofluids from Raman scattering," J. Chem. Phys. 126,
(2007).
100. M. F. Islam, K. H. Lin, D. Lacoste, T. C. Lubensky, and A. G. Yodh, "Field-
induced structures in miscible ferrofluid suspensions with and without latex
spheres," Phys. Rev. E 67, 21402 (2003).
101. S. Y. Yang, H. E. Horng, C. Y. Hong, and H. C. Yang, "Structures, optical
properties and potentially electro-optical applications of magnetic fluid films,"
Tamkang J. Sci. Eng. 5, 85–93 (2002).
102. M. F. Islam, K. H. Lin, D. Lacoste, T. C. Lubensky, and A. G. Yodh, "Field-
induced structures in miscible ferrofluid suspensions with and without latex
spheres," Phys. Rev. E - Stat. Physics, Plasmas, Fluids, Relat. Interdiscip. Top.
67, 8 (2003).
103. Y. F. Chen, S. Y. Yang, W. S. Tse, H. E. Horng, C. Y. Hong, and H. C. Yang,
"Thermal effect on the field-dependent refractive index of the magnetic fluid
film," Appl. Phys. Lett. 82, 3481–3483 (2003).

References
126
104. L. X. Chen, X. G. Huang, J. H. Zhu, G. C. Li, and S. Lan, "Fiber magnetic-field
sensor based on nanoparticle magnetic fluid and Fresnel reflection," Opt Lett 36,
2761–2763 (2011).
105. S. Y. Yang, Y. F. Chen, H. E. Horng, C. Y. Hong, W. S. Tse, and H. C. Yang,
"Magnetically-modulated refractive index of magnetic fluid films," Appl. Phys.
Lett. 81, 4931–4933 (2002).
106. C. Y. Hong, H. E. Horng, and S. Y. Yang, "Tunable refractive index of magnetic
fluids and its applications," in Physica Status Solidi C: Conferences (2004), Vol.
1, pp. 1604–1609.
107. H. Wang, S. Pu, N. Wang, S. Dong, and J. Huang, "Magnetic field sensing based
on singlemode-multimode-singlemode fiber structures using magnetic fluids as
cladding," Opt. Lett. 38, 3765–8 (2013).
108. Y. Chen, Q. Han, T. Liu, X. Lan, and H. Xiao, "Optical fiber magnetic field
sensor based on single-mode-multimode-single-mode structure and magnetic
fluid.," Opt. Lett. 38, 3999–4001 (2013).
109. J. Lenz and S. Edelstein, "Magnetic sensors and their applications," Sensors
Journal, IEEE 6, 631–649 (2006).
110. H. Eren and J. G. Webster, Measurement, Instrumentation, and Sensors
Handbook: Electromagnetic, Optical, Radiation, Chemical, and Biomedical
Measurement (CRC Press, 2014).
111. V. Kravljaca and S. E. Lyshevski, "Measuring spatiotemporal magnetic fields
by hall effect sensors with post-processing solutions," in 2017 IEEE 37th
International Conference on Electronics and Nanotechnology, ELNANO 2017 -
Proceedings (2017), pp. 61–66.
112. S. Tumanski, "Modern Magnetic Field Sensors – A Review," PRZEGLĄD
ELEKTROTECHNICZNY 10, (2013).
113. P. Ripka and M. Janošek, "Advances in magnetic field sensors," in IEEE Sensors
Journal (2010).

References
127
114. Z. Wang, "Analysis of optical response of long period fiber gratings to nm-thick
thin-film coatings," Opt. Express 13, 2808–2813 (2005).
115. T. Liu, X. Chen, Z. Di, J. Zhang, X. Li, and J. Chen, "Tunable magneto-optical
wavelength filter of long-period fiber grating with magnetic fluids," Appl. Phys.
Lett. 91, 2005–2008 (2007).
116. A. H. P. Ho, D. Kim, and M. G. Somekh, Handbook of Photonics for Biomedical
Engineering (2017).
117. M. Li, S. K. Cushing, and N. Wu, "Plasmon-enhanced optical sensors: a review,"
Analyst 140, 386–406 (2015).
118. G. R. Parkins, W. E. Lawrence, and R. W. Christy, "Intraband optical
conductivity (T) of Cu, Ag, and Au: Contribution from electron-electron
scattering," Phys. Rev. B 23, 6408–6416 (1981).
119. S. A. Maier, Plasmonics: Fundamentals and Applications (2007).
120. J. M. Luther, P. K. Jain, T. Ewers, and A. P. Alivisatos, "Localized surface
plasmon resonances arising from free carriers in doped quantum dots," Nat.
Mater. 10, 361–366 (2011).
121. A. V. Andrade-Neto, "Dielectric function for free electron gas: comparison
between Drude and Lindhard models Função dielétrica de um gás de elétrons:
comparação entre os modelos de Drude e de Lindhard," Rev. Bras. Ensino Física
39, (2017).
122. F. Wooten, "Optical Properties of Solids," Am. J. Phys. 70, 1269 (2002).
123. Y. Zhao, Z. Deng, and J. Li, "Photonic crystal fiber based surface plasmon
resonance chemical sensors," Sensors Actuators B Chem. 202, 557–567 (2014).
124. J. Jana, M. Ganguly, and T. Pal, "Enlightening surface plasmon resonance effect
of metal nanoparticles for practical spectroscopic application," RSC Adv. 6,
86174–86211 (2016).
125. B. Gauvreau, A. Hassani, M. Fassi Fehri, A. Kabashin, and M. a Skorobogatiy,
"Photonic bandgap fiber-based Surface Plasmon Resonance sensors.," Opt.

References
128
Express 15, 11413–11426 (2007).
126. B. D. Gupta and R. K. Verma, "Surface plasmon resonance-based fiber optic
sensors: Principle, probe designs, and some applications," J. Sensors 2009,
(2009).
127. J. Homola, "On the sensitivity of surface plasmon resonance sensors with
spectral interrogation," Sensors Actuators B Chem. 41, 207–211 (1997).
128. K. M. Mayer and J. H. Hafner, "Localized surface plasmon resonance sensors,"
Chem. Rev. 111, 3828–3857 (2011).
129. S. Peiris, J. McMurtrie, and H.-Y. Zhu, "Metal nanoparticle photocatalysts:
emerging processes for green organic synthesis," Catal. Sci. Technol. 6, 320–
338 (2016).
130. L. Guo, J. A. Jackman, H. H. Yang, P. Chen, N. J. Cho, and D. H. Kim,
"Strategies for enhancing the sensitivity of plasmonic nanosensors," Nano
Today 10, 213–239 (2015).
131. P. Zhao, N. Li, and D. Astruc, "State of the art in gold nanoparticle synthesis,"
Coord. Chem. Rev. 257, 638–665 (2013).
132. J. Turkevich, P. C. Stevenson, and J. Hillier, "A study of the nucleation and
growth processes in the synthesis of colloidal gold," Discuss. Faraday Soc. 11,
55–75 (1951).
133. V. Mody, R. Siwale, A. Singh, and H. Mody, "Introduction to metallic
nanoparticles," J. Pharm. Bioallied Sci. 2, 282 (2010).
134. M. Wang, P. Wang, J. Zhang, H. Hou, C. Li, and Y. Jin, "Pd/Ag nanosheet as a
plasmonic sensing platform for sensitive assessment of hydrogen evolution
reaction in colloid solutions," Nano Res. 11, 2093–2103 (2018).
135. F. Qadami, A. Molaeirad, M. Alijanianzadeh, A. Azizi, and N. Kamali,
"Localized Surface Plasmon Resonance (LSPR)-Based Nanobiosensor for
Methamphetamin Measurement," Plasmonics (2018).
136. J. Kim, S. Y. Oh, S. Shukla, S. B. Hong, N. S. Heo, V. K. Bajpai, H. S. Chun,

References
129
C. H. Jo, B. G. Choi, Y. S. Huh, and Y. K. Han, "Heteroassembled gold
nanoparticles with sandwich-immunoassay LSPR chip format for rapid and
sensitive detection of hepatitis B virus surface antigen (HBsAg)," Biosens.
Bioelectron. 107, 118–122 (2018).
137. Y.-T. Long and C. Jing, Localized Surface Plasmon Resonance Based
Nanobiosensors. (2014).
138. J. A. Jackman, A. Rahim Ferhan, and N.-J. Cho, "Nanoplasmonic sensors for
biointerfacial science," Chem. Soc. Rev. 46, 3615–3660 (2017).
139. G. Liang, Z. Zhao, Y. Wei, K. Liu, W. Hou, and Y. Duan, "Plasma enhanced
label-free immunoassay for alpha-fetoprotein based on a U-bend fiber-optic
LSPR biosensor," RSC Adv. 5, 23990–23998 (2015).
140. R. Dutta, R. Bharadwaj, S. Mukherji, and T. Kundu, "Study of localized surface-
plasmon-resonance-based optical fiber sensor," Appl. Opt. 50, E138 (2011).
141. H.-Y. Lin, C.-H. Huang, G.-L. Cheng, N.-K. Chen, and H.-C. Chui, "Tapered
optical fiber sensor based on localized surface plasmon resonance.," Opt.
Express 20, 21693–701 (2012).
142. S. Link and M. A. El-Sayed, "Size and Temperature Dependence of the Plasmon
Absorption of Colloidal Gold Nanoparticles," J. Phys. Chem. B 103, 4212–4217
(1999).
143. E. K. Akowuah, T. Gorman, H. Ademgil, S. Haxha, G. K. Robinson, and J. V.
Oliver, "Numerical analysis of a photonic crystal fiber for biosensing
applications," IEEE J. Quantum Electron. 48, 1403–1410 (2012).
144. X. Yu, Y. Zhang, S. Pan, P. Shum, M. Yan, Y. Leviatan, and C. Li, "A
selectively coated photonic crystal fiber based surface plasmon resonance
sensor," J. Opt. 12, 015005 (2009).
145. Z. Tan, X. Li, Y. Chen, and P. Fan, "Improving the Sensitivity of Fiber Surface
Plasmon Resonance Sensor by Filling Liquid in a Hollow Core Photonic Crystal
Fiber," Plasmonics 9, 167–173 (2014).
References
130
146. C. Caucheteur, T. Guo, and J. Albert, "Review of plasmonic fiber optic
biochemical sensors: improving the limit of detection," Anal. Bioanal. Chem.
407, 3883–3897 (2015).
147. T. Schuster, N. Neumann, and C. Schäffer, "Miniaturized fiber-optic surface-
plasmon-resonance sensor," 77530W (2011).
148. C. Caucheteur, Y. Shevchenko, L.-Y. Shao, M. Wuilpart, and J. Albert, "High
resolution interrogation of tilted fiber grating SPR sensors from polarization
properties measurement.," Opt. Express 19, 1656–1664 (2011).
149. M. D. Baiad, M. Gagné, W.-J. Madore, E. De Montigny, N. Godbout, C.
Boudoux, and R. Kashyap, "Surface plasmon resonance sensor interrogation
with a double-clad fiber coupler and cladding modes excited by a tilted fiber
Bragg grating.," Opt. Lett. 38, 4911–4 (2013).
150. D. J. Gentleman and K. S. Booksh, "Determining salinity using a multimode
fiber optic surface plasmon resonance dip-probe," Talanta 68, 504–515 (2006).
151. J. Pollet, F. Delport, D. T. Thi, M. Weversy, and J. Lammertyn, "Aptamer-Based
Surface Plasmon Resonance Probe," in Proceedings of IEEE Sensors (2008), pp.
1187–1190.
152. S. K. Srivastava, R. Verma, and B. D. Gupta, "Surface plasmon resonance based
fiber optic sensor for the detection of low water content in ethanol," Sensors
Actuators, B Chem. 153, 194–198 (2011).
153. T. Allsop, R. Neal, C. Mou, P. Brown, S. Rehman, K. Kalli, D. J. Webb, D.
Mapps, and I. Bennion, "Multilayered coated infra-red surface plasmon
resonance fibre sensors for aqueous chemical sensing," Opt. Fiber Technol. 15,
477–482 (2009).
154. C. Te Huang, C. P. Jen, T. C. Chao, W. Te Wu, W. Y. Li, and L. K. Chau, "A
novel design of grooved fibers for fiber-optic localized plasmon resonance
biosensors," Sensors 9, 6456–6470 (2009).
155. J. H. Ahn, T. Y. Seong, W. M. Kim, T. S. Lee, I. Kim, and K.-S. Lee, "Fiber-
optic waveguide coupled surface plasmon resonance sensor," Opt. Express 20,
References
131
21729 (2012).
156. M.-C. Navarrete, N. Díaz-Herrera, A. González-Cano, and Ó. Esteban, "Surface
plasmon resonance in the visible region in sensors based on tapered optical
fibers," Sensors Actuators B Chem. 190, 881–885 (2014).
157. T. Wieduwilt, K. Kirsch, J. Dellith, R. Willsch, and H. Bartelt, "Optical Fiber
Micro-Taper with Circular Symmetric Gold Coating for Sensor Applications
Based on Surface Plasmon Resonance," Plasmonics 8, 545–554 (2013).
158. S. K. Srivastava, V. Arora, S. Sapra, and B. D. Gupta, "Localized Surface
Plasmon Resonance-Based Fiber Optic U-Shaped Biosensor for the Detection
of Blood Glucose," Plasmonics 7, 261–268 (2012).
159. Y. Zhao, Z. Deng, and J. Li, "Photonic crystal fiber based surface plasmon
resonance chemical sensors," Sensors Actuators B Chem. 202, 557–567 (2014).
160. L. Zheng, X. Zhang, X. Ren, J. Gao, L. Shi, X. Liu, Q. Wang, and Y. Huang,
"Surface plasmon resonance sensors based on Ag-metalized nanolayer in
microstructured optical fibers," Opt. Laser Technol. 43, 960–964 (2011).
161. W. Wei, X. Zhang, X. Guo, L. Zheng, J. Gao, W. Shi, Q. Wang, Y. Huang, and
X. Ren, "Refractive index sensors based on Ag-metalized nanolayer in
microstructured optical fibers," Optik (Stuttg). 123, 1167–1170 (2012).
162. P. Bing, J. Yao, Y. Lu, and Z. Li, "A surface-plasmon-resonance sensor based
on photonic-crystal-fiber with large size microfluidic channels," Opt. Appl. 42,
493–501 (2012).
163. B. Doherty, A. Csáki, M. Thiele, M. Zeisberger, A. Schwuchow, J. Kobelke, W.
Fritzsche, and M. A. Schmidt, "Nanoparticle functionalised small-core
suspended-core fibre – a novel platform for efficient sensing," Biomed. Opt.
Express 8, 790 (2017).
164. A. A. Rifat, R. Ahmed, A. K. Yetisen, H. Butt, A. Sabouri, G. A. Mahdiraji, S.
H. Yun, and F. R. M. Adikan, "Photonic crystal fiber based plasmonic sensors,"
Sensors Actuators, B Chem. 243, 311–325 (2017).

References
132
165. A. Hassani and M. Skorobogatiy, "Design criteria for microstructured-optical-
fiber-based surface-plasmon-resonance sensors," J. Opt. Soc. Am. B 24, 1423
(2007).
166. A. Hassani and M. Skorobogatiy, "Photonic crystal fiber-based plasmonic
sensors for the detection of biolayer thickness," J. Opt. Soc. Am. B 26, 1550
(2009).
167. E. K. Akowuah, T. Gorman, H. Ademgil, and S. Haxha, "A highly sensitive
photonic crystal fibre (PCF) surface plasmon resonance (SPR) sensor based on
a bimetallic structure of gold and silver," Proc. 2012 IEEE 4th Int. Conf. Adapt.
Sci. Technol. ICAST 2012 121–125 (2012).
168. N. Luan and J. Yao, "Surface Plasmon Resonance Sensor Based On Exposed-
Core Microstructured Optical Fiber Placed With A Silver Wire," IEEE
Photonics J. 8, 1–8 (2016).
169. X. Yang, Y. Lu, M. Wang, and J. Yao, "SPR Sensor Based on Exposed-Core
Grapefruit Fiber with Bimetallic Structure," IEEE Photonics Technol. Lett. 28,
649–652 (2016).
170. M. Erdmanis, D. Viegas, M. Hautakorpi, S. Novotny, J. L. Santos, and H.
Ludvigsen, "Comprehensive numerical analysis of a surface-plasmon-resonance
sensor based on an H-shaped optical fiber," Opt. Express 19, 13980–13988
(2011).
171. H.-Y. Lin, Y.-C. Tsao, W.-H. Tsai, Y.-W. Yang, T.-R. Yan, and B.-C. Sheu,
"Development and application of side-polished fiber immunosensor based on
surface plasmon resonance for the detection of Legionella pneumophila with
halogens light and 850nm-LED," Sensors Actuators A Phys. 138, 299–305
(2007).
172. R. Slavík, J. Homola, and E. Brynda, "A miniature fiber optic surface plasmon
resonance sensor for fast detection of Staphylococcal enterotoxin B.," Biosens.
Bioelectron. 17, 591–595 (2002).
173. J. Pollet, F. Delport, K. P. F. Janssen, D. T. Tran, J. Wouters, T. Verbiest, and J.
References
133
Lammertyn, "Fast and accurate peanut allergen detection with nanobead
enhanced optical fiber SPR biosensor," Talanta 83, 1436–1441 (2011).
174. L. Lipoprotein, R. Verma, S. K. Srivastava, and B. D. Gupta, "Surface-Plasmon-
Resonance-Based Fiber-Optic Sensor for the Detection," IEEE Sens. J. 12,
3460–3466 (2012).
175. Y. Shevchenko, T. J. Francis, D. A. D. Blair, R. Walsh, M. C. Derosa, and J.
Albert, "In situ biosensing with a surface plasmon resonance fiber grating
aptasensor," Anal. Chem. 83, 7027–7034 (2011).
176. V. Voisin, J. Pilate, P. Damman, P. Mégret, and C. Caucheteur, "Highly sensitive
detection of molecular interactions with plasmonic optical fiber grating sensors,"
Biosens. Bioelectron. 51, 249–254 (2014).
177. B. Sciacca, A. Fran??ois, P. Hoffmann, and T. M. Monro, "Multiplexing of
radiative-surface plasmon resonance for the detection of gastric cancer
biomarkers in a single optical fiber," Sensors Actuators, B Chem. 183, 454–458
(2013).
178. A. J. Mieszawska, W. J. M. Mulder, Z. A. Fayad, and D. P. Cormode,
"Multifunctional gold nanoparticles for diagnosis and therapy of disease," Mol.
Pharm. 10, 831–847 (2013).
179. S. Tadepalli, Z. Kuang, Q. Jiang, K.-K. Liu, M. A. Fisher, J. J. Morrissey, E. D.
Kharasch, J. M. Slocik, R. R. Naik, and S. Singamaneni, "Peptide Functionalized
Gold Nanorods for the Sensitive Detection of a Cardiac Biomarker Using
Plasmonic Paper Devices.," Sci. Rep. 5, 16206 (2015).
180. M. Oliverio, S. Perotto, G. C. Messina, L. Lovato, and F. De Angelis, "Chemical
Functionalization of Plasmonic Surface Biosensors: A Tutorial Review on
Issues, Strategies, and Costs," ACS Appl. Mater. Interfaces 9, 29394–29411
(2017).
181. O. R. Bolduc and J. F. Masson, "Advances in surface plasmon resonance sensing
with nanoparticles and thin films: Nanomaterials, surface chemistry, and hybrid
plasmonic techniques," Anal. Chem. 83, 8057–8062 (2011).

References
134
182. S. Tadepalli, Z. Kuang, Q. Jiang, K. K. Liu, M. A. Fisher, J. J. Morrissey, E. D.
Kharasch, J. M. Slocik, R. R. Naik, and S. Singamaneni, "Peptide Functionalized
Gold Nanorods for the Sensitive Detection of a Cardiac Biomarker Using
Plasmonic Paper Devices," Sci. Rep. 5, (2015).
183. F. Ruffino, G. Meli, and M. G. Grimaldi, "Nanoscale electrical characteristics
of metal (Au, Pd)-graphene-metal (Cu) contacts," Solid State Commun. 225, 1–
6 (2016).
184. Y. Liu, X. Dong, and P. Chen, "Biological and chemical sensors based on
graphene materials," Chem. Soc. Rev. 41, 2283 (2012).
185. M. Zhou, Z. Liu, W. Ming, Z. Wang, and F. Liu, "Sd2 Graphene: Kagome Band
in a Hexagonal Lattice," Phys. Rev. Lett. 113, (2014).
186. G. Lu, K. Yu, Z. Wen, and J. Chen, "Semiconducting graphene: Converting
graphene from semimetal to semiconductor," Nanoscale 5, 1353–1368 (2013).
187. J. A. Kim, T. Hwang, S. R. Dugasani, R. Amin, A. Kulkarni, S. H. Park, and T.
Kim, "Graphene based fiber optic surface plasmon resonance for bio-chemical
sensor applications," Sensors Actuators, B Chem. 187, 426–433 (2013).
188. M. Bruna and S. Borini, "Optical constants of graphene layers in the visible
range," Appl. Phys. Lett. 94, (2009).
189. Y. Zhao, X. Li, X. Zhou, and Y. Zhang, "Review on the graphene based optical
fiber chemical and biological sensors," Sensors Actuators B Chem. 231, 324–
340 (2016).
190. G.-D. J.S. and J. Perruisseau-Carrier, "Microwave to THz properties of graphene
and potential antenna applications," 2012 Int. Symp. Antennas Propag. 239–242
(2012).
191. G. W. Hanson, "Dyadic Green’s functions and guided surface waves for a
surface conductivity model of graphene," J. Appl. Phys. 103, (2008).
192. K. Nagashio and A. Toriumi, "Density-of-states limited contact resistance in
graphene field-effect transistorsc," Jpn. J. Appl. Phys. 50, (2011).

References
135
193. G. Giovannetti, P. A. Khomyakov, G. Brocks, V. M. Karpan, J. Van Den Brink,
and P. J. Kelly, "Doping graphene with metal contacts," Phys. Rev. Lett. 101,
(2008).
194. P. A. Khomyakov, G. Giovannetti, P. C. Rusu, G. Brocks, J. Van Den Brink,
and P. J. Kelly, "First-principles study of the interaction and charge transfer
between graphene and metals," Phys. Rev. B - Condens. Matter Mater. Phys. 79,
1–12 (2009).
195. S. Zeng, K. V. Sreekanth, J. Shang, T. Yu, C. K. Chen, F. Yin, D. Baillargeat,
P. Coquet, H. P. Ho, A. V. Kabashin, and K. T. Yong, "Graphene-Gold
Metasurface Architectures for Ultrasensitive Plasmonic Biosensing," Adv.
Mater. 27, 6163–6169 (2015).
196. S. Zeng, K. V. Sreekanth, J. Shang, T. Yu, C. K. Chen, F. Yin, D. Baillargeat,
P. Coquet, H. P. Ho, A. V. Kabashin, and K. T. Yong, "Graphene-Gold
Metasurface Architectures for Ultrasensitive Plasmonic Biosensing," Adv.
Mater. 27, 6163–6169 (2015).
197. O. Salihoglu, S. Balci, and C. Kocabas, "Plasmon-polaritons on graphene-metal
surface and their use in biosensors," Appl. Phys. Lett. 100, (2012).
198. T. Xue, S. Yu, X. Zhang, X. Zhang, L. Wang, Q. Bao, C. Chen, W. Zheng, and
X. Cui, "R6G molecule induced modulation of the optical properties of reduced
graphene oxide nanosheets for use in ultrasensitive SPR sensing," Sci. Rep. 6,
(2016).
199. B. Song, D. Li, W. Qi, M. Elstner, C. Fan, and H. Fang, "Graphene on Au(111):
A highly conductive material with excellent adsorption properties for high-
resolution bio/nanodetection and identification," ChemPhysChem 11, 585–589
(2010).
200. S. Tadepalli, Z. Kuang, Q. Jiang, K.-K. Liu, M. A. Fisher, J. J. Morrissey, E. D.
Kharasch, J. M. Slocik, R. R. Naik, and S. Singamaneni, "Peptide Functionalized
Gold Nanorods for the Sensitive Detection of a Cardiac Biomarker Using
Plasmonic Paper Devices.," Sci. Rep. 5, 16206 (2015).

References
136
201. M. M. Y. A. Alsaif, K. Latham, M. R. Field, D. D. Yao, N. V. Medhekar, G. A.
Beane, R. B. Kaner, S. P. Russo, J. Z. Ou, and K. Kalantar-Zadeh, "Tunable
plasmon resonances in two-dimensional molybdenum oxide nanoflakes," Adv.
Mater. 26, 3931–3937 (2014).
202. W. Liu, Q. Xu, W. Cui, C. Zhu, and Y. Qi, "Surface Plasmon Resonance Very
Important Paper CO 2 -Assisted Fabrication of Two-Dimensional Amorphous
Molybdenum Oxide Nanosheets for Enhanced Plasmon Resonances
Angewandte," 450052, 1600–1604 (2017).
203. S. D. Lounis, E. L. Runnerstrom, A. Llordés, and D. J. Milliron, "Defect
chemistry and Plasmon physics of colloidal metal oxide Nanocrystals," J. Phys.
Chem. Lett. 5, 1564–1574 (2014).
204. M. M. Y. A. Alsaif, S. Balendhran, M. R. Field, K. Latham, W. Wlodarski, J. Z.
Ou, and K. Kalantar-Zadeh, "Two dimensional ??-MoO3 nanoflakes obtained
using solvent-assisted grinding and sonication method: Application for H2 gas
sensing," Sensors Actuators, B Chem. 192, 196–204 (2014).
205. K. Kazuto, W. Ryota, Y. Shinji, H. Yoshiyuki, S. Shigehiko, and Y. Mitsuaki,
"Characteristics of MoO 3 films grown by molecular beam epitaxy," Jpn. J. Appl.
Phys. 53, 05FJ02 (2014).
206. J. Z. Ou, J. L. Campbell, D. Yao, W. Wlodarski, and K. Kalantar-Zadeh, "In situ
Raman spectroscopy of H2 gas interaction with layered MoO3," J. Phys. Chem.
C 115, 10757–10763 (2011).
207. K. Kalantar-Zadeh, J. Tang, M. Wang, K. L. Wang, A. Shailos, K. Galatsis, R.
Kojima, V. Strong, A. Lech, W. Wlodarski, and R. B. Kaner, "Synthesis of
nanometre-thick MoO3 sheets," Nanoscale 2, 429–433 (2010).
208. K. Kalantar-zadeh, J. Z. Ou, T. Daeneke, A. Mitchell, T. Sasaki, and M. S.
Fuhrer, "Two dimensional and layered transition metal oxides," Appl. Mater.
Today 5, 73–89 (2016).
209. M. B. Sreedhara, H. S. S. R. Matte, A. Govindaraj, and C. N. R. Rao, "Synthesis,
characterization, and properties of few-layer moO3," Chem. - An Asian J. 8,
References
137
2430–2435 (2013).
210. J. Dagar, P. Tyagi, R. Ahmad, R. Singh, O. P. Sinha, C. K. Suman, and R.
Srivastava, "Application of 2D-MoO3 nano-flakes in organic light emitting
diodes: effect of semiconductor to metal transition with irradiation," Rsc Adv. 5,
8397–8403 (2015).
211. M. M. Y. A. Alsaif, A. F. Chrimes, T. Daeneke, S. Balendhran, D. O. Bellisario,
Y. Son, M. R. Field, W. Zhang, H. Nili, E. P. Nguyen, K. Latham, J. Van
Embden, M. S. Strano, J. Z. Ou, and K. Kalantar-Zadeh, "High-Performance
Field Effect Transistors Using Electronic Inks of 2D Molybdenum Oxide
Nanoflakes," Adv. Funct. Mater. 26, 91–100 (2016).
212. S. Balendhran, S. Walia, M. Alsaif, E. P. Nguyen, J. Z. Ou, S. Zhuiykov, S.
Sriram, M. Bhaskaran, and K. Kalantar-Zadeh, "Field effect biosensing platform
based on 2D α-MoO3," ACS Nano 7, 9753–9760 (2013).
213. X. Tan, L. Wang, C. Cheng, X. Yan, B. Shen, and J. Zhang, "Plasmonic MoO3-
x@MoO3nanosheets for highly sensitive SERS detection through nanoshell-
isolated electromagnetic enhancement," Chem. Commun. 52, 2893–2896 (2016).
214. H. S. Kim, J. B. Cook, H. Lin, J. S. Ko, S. H. Tolbert, V. Ozolins, and B. Dunn,
"Oxygen vacancies enhance pseudocapacitive charge storage properties of
MoO3−x," Nature Materials (2016).
215. M. M. Y. A. Alsaif, M. R. Field, B. J. Murdoch, T. Daeneke, K. Latham, A. F.
Chrimes, A. S. Zoolfakar, S. P. Russo, J. Z. Ou, and K. Kalantar-Zadeh,
"Substoichiometric two-dimensional molybdenum oxide flakes: A plasmonic
gas sensing platform," Nanoscale 6, 12780–12791 (2014).
216. X. K. Hu, Y. T. Qian, Z. T. Song, J. R. Huang, R. Cao, and J. Q. Xiao,
"Comparative Study on MoO3 and HxMoO3 Nanobelts: Structure and Electric
Transport," Chem. Mater. 20, 1527–1533 (2008).
217. D. H. Qu, Q. C. Wang, Q. W. Zhang, X. Ma, and H. Tian, "Photoresponsive
Host-Guest Functional Systems," Chem. Rev. 115, 7543–7588 (2015).
218. Y. W. Yang, Y. L. Sun, and N. Song, "Switchable host-guest systems on

References
138
surfaces," Acc. Chem. Res. 47, 1950–1960 (2014).
219. H. Li, D.-X. Chen, Y.-L. Sun, Y. B. Zheng, L.-L. Tan, P. S. Weiss, and Y.-W.
Yang, "Viologen-mediated assembly of and sensing with
carboxylatopillar[5]arene-modified gold nanoparticles.," J. Am. Chem. Soc. 135,
1570–6 (2013).
220. G. Yu, K. Jie, and F. Huang, "Supramolecular Amphiphiles Based on Host −
Guest Molecular Recognition Motifs," Chem. Rev 115, 7240–7303 (2015).
221. J. Xie, T. Zuo, Z. Huang, L. Huan, Q. Gu, C. Gao, and J. Shao, "Theoretical
study of a novel imino bridged pillar[5]arene derivative," Chem. Phys. Lett. 662,
25–30 (2016).
222. J. Lagona, P. Mukhopadhyay, S. Chakrabarti, and L. Isaacs, "The cucurbit[n]uril
family," Angew Chem Int Ed Engl 44, 4844–4870 (2005).
223. H.-J. Schneider and A. K. Yatsimirsky, "Selectivity in supramolecular host–
guest complexes," Chem. Soc. Rev. 37, 263–277 (2008).
224. E. Christoforides, A. Papaioannou, and K. Bethanis, "Crystal structure of the
inclusion complex of cholesterol in β-cyclodextrin and molecular dynamics
studies," Beilstein J. Org. Chem. 14, 838–848 (2018).
225. Y. Yu, C. Chipot, W. Cai, and X. Shao, "Molecular dynamics study of the
inclusion of cholesterol into cyclodextrins," J. Phys. Chem. B 110, 6372–6378
(2006).
226. A. Sánchez, P. Díez, R. Villalonga, P. Martínez-Ruiz, M. Eguílaz, I. Fernández,
and J. M. Pingarrón, "Seed-mediated growth of jack-shaped gold nanoparticles
from cyclodextrin-coated gold nanospheres," Dalt. Trans. 42, 14309–14314
(2013).
227. Y. Zhao, Y. Huang, H. Zhu, Q. Zhu, and Y. Xia, "Three-in-One: Sensing, Self-
Assembly, and Cascade Catalysis of Cyclodextrin Modified Gold
Nanoparticles," J. Am. Chem. Soc. 138, 16645–16654 (2016).
228. R. Kashyap, Fiber Bragg Gratings (1999), Vol. 1.
References
139
229. D. J. J. Hu, J. L. Lim, M. Jiang, Y. Wang, F. Luan, P. P. Shum, H. Wei, and W.
Tong, "Long period grating cascaded to photonic crystal fiber modal
interferometer for simultaneous measurement of temperature and refractive
index.," Opt. Lett. 37, 2283–5 (2012).
230. S. Chaubey, P. Joshi, M. Kumar, R. Arya, A. K. Nath, and S. Kher, "Design and
development of long-period grating sensors for temperature monitoring,"
Sadhana - Acad. Proc. Eng. Sci. 32, 513–519 (2007).
231. S. Pu, X. Chen, Y. Chen, Y. Xu, W. Liao, L. Chen, and Y. Xia, "Fiber-optic
evanescent field modulator using a magnetic fluid as the cladding," J. Appl. Phys.
99, (2006).
232. Y. Zhao, L. Cai, X. G. Li, and F. C. Meng, "Liquid concentration measurement
based on SMS fiber sensor with temperature compensation using an FBG,"
Sensors Actuators, B Chem. 196, 518–524 (2014).
233. Y. S. Hsu and Y. J. Chiang, "Temperature compensation of optical fiber Bragg
grating pressure sensor," IEEE Photonics Technol. Lett. 18, 874–876 (2006).
234. C.-H. Chen, R. O. Reynolds, and A. Kost, "Origin of spectral modal noise in
fiber-coupled spectrographs," Appl. Opt. 45, 519 (2006).
235. A. Orth, M. Ploschner, I. S. Maksymov, and B. C. Gibson, "Extended depth of
field imaging through multicore optical fibers," Opt. Express 26, 6407–6419
(2018).
236. M. Grabka, B. Wajnchold, S. Pustelny, W. Gawlik, K. Skorupski, and P. Mergo,
"Experimental and theoretical study of light propagation in suspended-core
optical fiber," Acta Phys. Pol. A 118, (2010).
237. L. Peng, F. Shi, G. Zhou, S. Ge, Z. Hou, and C. Xia, "A Surface Plasmon
Biosensor Based on a D-Shaped Microstructured Optical Fiber With
Rectangular Lattice," IEEE Photonics J. 7, (2015).
238. Q. Liu, S. Li, H. Li, J. Zi, W. Zhang, Z. Fan, G. An, and Y. Bao, "Broadband
Single-Polarization Photonic Crystal Fiber Based on Surface Plasmon
Resonance for Polarization Filter," Plasmonics 10, 931–939 (2015).

References
140
239. L. Zheng, X. Zhang, X. Ren, Y. Wang, X. Liu, and Y. Huang, "A comparison
of Au and Ag metalized layer in Microstructured Optical Fibers for Surface
Plasmon Resonance excitation," 7634, 1–6 (2009).
240. Z. Tan, X. Hao, Y. Shao, Y. Chen, X. Li, and P. Fan, "Phase modulation and
structural effects in a D-shaped all-solid photonic crystal fiber surface plasmon
resonance sensor," Opt. Express (2014).
241. D. L. Mills, "Attenuation of surface polaritons by surface roughness," Phys. Rev.
B 12, 4036–4046 (1975).
242. K. M. Byun, S. J. Yoon, and D. Kim, "Effect of surface roughness on the
extinction-based localized surface plasmon resonance biosensors.," Appl. Opt.
47, 5886–92 (2008).
243. X. Li, Y. Zhu, W. Cai, M. Borysiak, B. Han, D. Chen, R. D. Piner, L. Colomba,
and R. S. Ruoff, "Transfer of large-area graphene films for high-performance
transparent conductive electrodes," Nano Lett. 9, 4359–4363 (2009).
244. X. Li, W. Cai, J. An, S. Kim, J. Nah, D. Yang, R. Piner, A. Velamakanni, I. Jung,
E. Tutuc, S. K. Banerjee, L. Colombo, and R. S. Ruoff, "Large-area synthesis of
high-quality and uniform graphene films on copper foils," Science (80-. ). 324,
1312–1314 (2009).
245. S. Bhat, N. Curach, T. Mostyn, G. S. Bains, K. R. Griffiths, and K. R. Emslie,
"Comparison of methods for accurate quantification of DNA mass concentration
with traceability to the international system of units," Anal. Chem. 82, 7185–
7192 (2010).
246. A. Kumar, K. M. Pate, M. A. Moss, D. N. Dean, and V. Rangachari, "Self-
propagative replication of A?? oligomers suggests potential transmissibility in
Alzheimer disease," PLoS One 9, (2014).
247. S. Singh, A. Kumar, S. Khare, A. Mulchandani, and Rajesh, "Single-walled
carbon nanotubes based chemiresistive genosensor for label-free detection of
human rheumatic heart disease," Appl. Phys. Lett. 105, (2014).
248. M. Ootsubo, T. Shimizu, R. Tanaka, T. Sawabe, K. Tajima, M. Yoshimizu, Y.

References
141
Ezura, T. Ezaki, and H. Oyaizu, "Oligonucleotide probe for detecting
Enterobacteriaceae by in situ hybridization," J. Appl. Microbiol. 93, 60–68
(2002).
249. I. V. Wesley, L. Schroeder-Tucker, A. L. Baetz, F. E. Dewhirst, and B. J. Paster,
"Arcobacter-specific and Arcobacter butzleri-specific 16S rRNA-based DNA
probes," J. Clin. Microbiol. 33, 1691–1698 (1995).
250. M. M. Y. A. Alsaif, M. R. Field, T. Daeneke, A. F. Chrimes, W. Zhang, B. J.
Carey, K. J. Berean, S. Walia, J. Van Embden, B. Zhang, K. Latham, K.
Kalantar-Zadeh, and J. Z. Ou, "Exfoliation solvent dependent plasmon
resonances in two-dimensional sub-stoichiometric molybdenum oxide
nanoflakes," ACS Appl. Mater. Interfaces 8, 3482–3493 (2016).
251. I. Shakir, M. Shahid, H. W. Yang, and D. J. Kang, "Structural and
electrochemical characterization of ??-MoO3 nanorod-based electrochemical
energy storage devices," Electrochim. Acta 56, 376–380 (2010).
252. X. Liu, J.-H. Kang, H. Yuan, J. Park, S. J. Kim, Y. Cui, H. Y. Hwang, and M. L.
Brongersma, "Electrical tuning of a quantum plasmonic resonance," Nat.
Nanotechnol. (2017).
253. V. Prabhakaran, B. L. Mehdi, J. J. Ditto, M. H. Engelhard, B. Wang, K. D. D.
Gunaratne, D. C. Johnson, N. D. Browning, G. E. Johnson, and J. Laskin,
"Rational design of efficient electrode–electrolyte interfaces for solid-state
energy storage using ion soft landing," Nat. Commun. 7, 11399 (2016).
254. S. Balendhran, S. Walia, M. Alsaif, E. P. Nguyen, J. Z. Ou, S. Zhuiykov, S.
Sriram, M. Bhaskaran, and K. Kalantar-Zadeh, "Field effect biosensing platform
based on 2D ??-MoO3," ACS Nano 7, 9753–9760 (2013).
255. K. D. Vernon-Parry, "Scanning electron microscopy: an introduction," III-Vs
Rev. 13, 40–44 (2000).
256. J. Goldstein, D. E. Newbury, D. C. Joy, C. E. Lyman, P. Echlin, E. Lifshin, L.
Sawyer, and J. R. Michael, Scanning Electron Microscopy and X-Ray
Microanalysis (2003), Vol. 44.
References
142
257. W. Bin Ji, H. H. Liu, S. C. Tjin, K. K. Chow, and A. Lim, "Ultrahigh sensitivity
refractive index sensor based on optical microfiber," IEEE Photonics Technol.
Lett. 24, 1872–1874 (2012).
258. W. Bin Ji, Y. C. Tan, B. Lin, S. C. Tjin, and K. K. Chow, "Nonadiabatically
tapered microfiber sensor with ultrashort waist," IEEE Photonics Technol. Lett.
26, 2303–2306 (2014).
259. H.-J. Schneider, F. Hacket, V. Rüdiger, and H. Ikeda, "NMR Studies of
Cyclodextrins and Cyclodextrin Complexes," Chem. Rev. 98, 1755–1786
(1998).
260. M. Rjeb, A. Labzour, A. Rjeb, S. Sayouri, M. C. El Idrissi, S. Massey, A. Adnot,
D. Roy, and C. M. Society, "Contribution To the Study By X-Ray Photoelectron
Spectroscopy of the Natural Aging of the Polypropylene," Moroccan J. Condens.
Matter 5, 168–172 (2004).
261. M. I. Halawa, F. Wu, T. H. Fereja, B. Lou, and G. Xu, "One-pot green synthesis
of supramolecular Β-cyclodextrin functionalized gold nanoclusters and their
application for highly selective and sensitive fluorescent detection of
dopamine," Sensors Actuators, B Chem. 254, 1017–1024 (2018).
262. P. H. Chua, K. G. Neoh, E. T. Kang, and W. Wang, "Surface functionalization
of titanium with hyaluronic acid/chitosan polyelectrolyte multilayers and RGD
for promoting osteoblast functions and inhibiting bacterial adhesion,"
Biomaterials 29, 1412–1421 (2008).
263. K. M. Mayer and J. H. Hafner, "Localized surface plasmon resonance sensors,"
Chem. Rev. 111, 3828–3857 (2011).
264. M. E. Haberland and J. A. Reynolds, "Self-association of Cholesterol in
Aqueous Solution," Proc. Natl. Acad. Sci. 70, 2313–2316 (1973).
265. R. Ahmad, N. Tripathy, S. H. Kim, A. Umar, A. Al-Hajry, and Y. B. Hahn,
"High performance cholesterol sensor based on ZnO nanotubes grown on Si/Ag
electrodes," Electrochem. commun. 38, 4–7 (2014).
266. X. Lin, Y. Ni, and S. Kokot, "Electrochemical cholesterol sensor based on

References
143
cholesterol oxidase and MoS2-AuNPs modified glassy carbon electrode,"
Sensors Actuators, B Chem. 233, 100–106 (2016).
267. M. N. Roy, D. Ekka, S. Saha, and M. Chandra Roy, "Host-guest inclusion
complexes of α and β-cyclodextrins with α-amino acids," RSC Adv. 4, 42383–
42390 (2014).
268. J. Liu, X. Leng, Y. Xiao, C. Hu, and L. Fu, "3D nitrogen-doped graphene/beta-
cyclodextrin: host-guest interactions for electrochemical sensing," Nanoscale 7,
11922–11927 (2015).
269. P. Monti, G. Rocchitta, S. Marceddu, M. A. Dettori, D. Fabbri, S. Jaoua, Q.
Migheli, G. Delogu, and P. A. Serra, "Use of β-cyclodextrin as enhancer of
ascorbic acid rejection in permselective films for amperometric biosensor
applications," Talanta 186, 53–59 (2018).
270. S. Saha, A. Roy, K. Roy, and M. N. Roy, "Study to explore the mechanism to
form inclusion complexes of β-cyclodextrin with vitamin molecules," Sci. Rep.
6, 35764 (2016).
271. W. Chen, C. E. Chang, and M. K. Gilson, "Calculation of cyclodextrin binding
affinities: Energy, entropy, and implications for drug design," Biophys. J. 87,
3035–3049 (2004).
272. A. Cucinotta, S. Selleri, L. Vincetti, and M. Zoboli, "Holey fiber analysis
through the finite-element method," IEEE Photonics Technol. Lett. 14, 1530–
1532 (2002).
273. A. Vial, A. S. Grimault, D. Macías, D. Barchiesi, and M. Lamy De La Chapelle,
"Improved analytical fit of gold dispersion: Application to the modeling of
extinction spectra with a finite-difference time-domain method," Phys. Rev. B -
Condens. Matter Mater. Phys. 71, (2005).
274. S. Khan, D. Pierce, and R. D. Vale, "Interactions of the chemotaxis signal protein
CheY with bacterial flagellar motors visualized by evanescent wave
microscopy," Curr. Biol. 10, 927–930 (2000).
275. X. J. Liang, A. Q. Liu, C. S. Lim, T. C. Ayi, and P. H. Yap, "Determining

References
144
refractive index of single living cell using an integrated microchip," Sensors
Actuators, A Phys. 133, 349–354 (2007).
276. I. Meglinski and A. Doronin, "Monte Carlo Modeling of Photon Migration for
the Needs of Biomedical Optics and Biophotonics," 1–72 (2014).
277. T. T. Nguyen, S. O. Bea, D. M. Kim, W. J. Yoon, J. W. Park, S. S. A. An, and
H. Ju, "A regenerative label-free fiber optic sensor using surface plasmon
resonance for clinical diagnosis of fibrinogen," Int. J. Nanomedicine 10, 155–
163 (2015).
278. A. Psarouli, A. Salapatas, A. Botsialas, P. S. Petrou, I. Raptis, E. Makarona, G.
Jobst, K. Tukkiniemi, M. Sopanen, R. Stoffer, S. E. Kakabakos, and K. Misiakos,
"Monolithically integrated broad-band Mach-Zehnder interferometers for highly
sensitive label-free detection of biomolecules through dual polarization optics,"
Sci. Rep. 5, 17600 (2015).
279. A. Hassani and M. Skorobogatiy, "Design criteria for microstructured-optical-
fiber-based surface-plasmon-resonance sensors," J. Opt. Soc. Am. B 24, 1423
(2007).
280. H. Suzuki, M. Sugimoto, Y. Matsui, and J. Kondoh, "Effects of gold film
thickness on spectrum profile and sensitivity of a multimode-optical-fiber SPR
sensor," Sensors Actuators, B Chem. 132, 26–33 (2008).
281. R. Li, H. An, W. Huang, and Y. He, "Molybdenum oxide nanosheets meet
ascorbic acid: Tunable surface plasmon resonance and visual colorimetric
detection at room temperature," Sensors Actuators, B Chem. 259, 59–63 (2018).
282. T. Ogoshi, T. A. Yamagishi, and Y. Nakamoto, "Pillar-Shaped Macrocyclic
Hosts Pillar[n]arenes: New Key Players for Supramolecular Chemistry," Chem.
Rev. 116, 7937–8002 (2016).
283. J. Zhou, G. Yu, and F. Huang, "Supramolecular chemotherapy based on host-
guest molecular recognition: A novel strategy in the battle against cancer with a
bright future," Chem. Soc. Rev. 46, 7021–7053 (2017).
284. Y. Yu, C. Chipot, W. Cai, and X. Shao, "Molecular Dynamics Study of the

References
145
Inclusion of Cholesterol into Cyclodextrins," J. Phys. Chem. B 110, 6372–6378
(2006).


