

Proposed HCMC Flood Risk
Management Project
Ho Chi Minh City Steering
Center of the Urban Flood
Control (SCFC)
ESIA REPORT
(DRAFT)
Exp International Services Inc.
74, Thich Minh Nguyet Street
Ward 2, Tan Binh District
Ho Chi Minh City, Viet Nam
Phone: + 84.8.3845.7382
VNWC-00227753-A0
Submitted: December 2, 2015
Pub
lic D
iscl
osur
e A
utho
rized
Pub
lic D
iscl
osur
e A
utho
rized
Pub
lic D
iscl
osur
e A
utho
rized
Pub
lic D
iscl
osur
e A
utho
rized

People's Committee of Ho Chi Minh City
Ho Chi Minh City Steering Center of the Urban Flood Control Program
Preparation of Ho Chi Minh City Flood Risk Management Project
Credit No.: 4779-VN
Package FRM-PPTAF 02: Environmental and Social Impact Assessment, and
Environmental and Social Management Plan
Project Location: District 8, 12, Go Vap, Tan Binh, Tan Phu, Binh Thanh, Binh Tan, Binh
Chanh, Hoc Mon
Representing Client: Project Management Unit of Works Construction under Ho Chi Minh
City Steering Center of the Urban Flood Control Program
ESIA REPORT (DRAFT)
Project Number:
VNWC-00227753-A0
Prepared by:
Exp International Services Inc.
74, Thich Minh Nguyet Street
Ward 2, Tan Binh District
Ho Chi Minh City, Viet Nam
Phone: + 84.8.3845.7382
www.exp.com

Environmental and Social Impact Assessment, HCMC Steering Center of the Urban
and Environmental and Social Management Plan Flood Control Program
Proposed HCMC Flood Risk Management Project Date Submitted: December 2, 2015
i
Legal Notification
This report was prepared by exp International Services Inc. for the account of Ho Chi Minh City Steering
Center of the Urban Flood Control Program.
Any use which a third party makes of this report, or any reliance on or decisions to be made based on it, are the
responsibility of such third parties. Exp International Services Inc. accepts no responsibility for damages, if any,
suffered by any third party as a result of decisions made or actions based on this project.

Environmental and Social Impact Assessment, HCMC Steering Center of the Urban
and Environmental and Social Management Plan Flood Control Program
Proposed HCMC Flood Risk Management Project Date Submitted: December 2, 2015
ii
TABLE OF CONTENTS
LIST OF TABLES ix
LIST OF FIGURES xiii
Chapter 1: Introduction 1
1.1.Background and Project Objectives 1
1.1.1.Project‘s Background 1
1.1.2.Objectives of the Project 3
1.2.Policy, Legal and Institutional Framework 3
1.2.1.National Legal Obligation 4
1.2.2. World Bank‘s Safeguard Policies and Guidelines 9
1.2.3. Other international treaties and conventions 13
Chapter 2: Project description 16
2.1.Project name 16
2.1.1.Sponsor 16
2.1.2.Governing body, project owner 16
2.1.3.Estimated project duration 16
2.1.4.Project site 16
2.1.5.Project benificiaries 18
2.1.6. Description and components 18
2.2.Technical Considerations for Component 1 21
2.3.Technical Options for Component 2 23
2.3.1.Subcomponent 2.1 - Two (02) combined ship lock and tidal sluice gates: Vam Thuat
and Nuoc Len 23
2.3.2.Subcomponent 2.2 - Construction of embankments in Tham Luong - Ben Cat - Nuoc
Len canal 30
2.3.3.Subcomponent 2.3 - Selected storm and waste water systems in Go Vap District 32
2.3.4.Sub-Component 2.4 - Secondary canals improvements 36
2.4.Project area of influence 40
2.5.Linked Investments 44

Environmental and Social Impact Assessment, HCMC Steering Center of the Urban
and Environmental and Social Management Plan Flood Control Program
Proposed HCMC Flood Risk Management Project Date Submitted: December 2, 2015
iii
Chapter 3: Existing conditions of socio-economic and environmental baseline in
project area 47
3.1.Natural and socio-economic conditions of Ho Chi Minh City 47
3.1.1.Natural conditions 47
3.1.2.Socio-economic conditions 55
3.2.Socio-economic conditions of the project area 57
3.2.1.Population and labor 57
3.2.2.Agricultural activities 59
3.2.3.Industrial activities 59
3.2.4.Transport and infrastructure 59
3.2.5.Scope of Land Acquisition 62
3.2.6.Influences of Tham Luong - Ben Cat – Nuoc Len on local population 67
3.2.7.Health care and education 72
3.2.8.Historic sites in the project area 74
3.2.9.Past and on-going education and communitcation programs to raise community
awareness of environmental protection 75
3.3.Existing Environmental Quality 76
3.3.1.Environmental Quality Sampling Plan and Analytical Parameters 76
3.3.2.Results of Air Quality 77
3.3.3.Water Quality 78
3.3.4. Result of Groundwater Quality 80
3.3.5.Soil and Groundwater Quality 80
3.3.6. Sludge quality/Sediment 82
3.3.7. Aquatic and Plankton 82
3.3.8. Fishes 83
Chapter 4: Analysis of project alternatives 86
4.1.Analyses of needs of the project 86
4.2. With project alternatives 87
4.2.1. Sub-component 2.1: Construction of Nuoc Len combined tidal sluice gate and 02
ship locks 87
Environmental and Social Impact Assessment, HCMC Steering Center of the Urban
and Environmental and Social Management Plan Flood Control Program
Proposed HCMC Flood Risk Management Project Date Submitted: December 2, 2015
iv
4.2.2. Sub-component 2.1: Construction of Vam Thuat tidal sluice gate and 2 ship locks 89
4.2.3. Sub-component 2.2: Improvement/Upgrading of revetment in the main canal of
Tham Luong – Ben Cat – Nuoc Len 91
4.2.4. Sub-component 2.3: Construction of drainage culvert system in Go Vap district 92
4.2.5. Sub-component 2.3: Construction and improvement of primary and secondary
combined sewer systems and the secondary interceptor in Go Vap district 93
4.2.6. Sub-component 2.4: Improvement of secondary canals (Hy Vong, Cau Cut, Ba
Mieng, Ong Tong, Ong Bau, Chin Xieng) 95
Chapter 5: Environmental Impact Assessment 96
5.1.Environmental Impact Assessment 96
5.1.1.Expected Positive Impact 96
5.1.2.Potential Negative Impact 96
5.1.2.1.Type and Scale Of Project Impact 96
5.1.2.2.Socioeconomic Impact 101
5.1.2.3Impact to on Physical Cultural Resources (PCR) 101
5.1.2.4.Impact to Nature Habitat 101
5.1.3.Detailed environment impact assessment for component 1 on Integrated Flood Risk
Management 102
5.1.3.1.Impact assessment during pre-construction phase of component 1 102
5.1.3.2.Impact assessment during construction phase of component 105
5.1.3.3.Impact assessment during operation phase 109
5.1.4.Impact Assessment for Component 2 on Priority Flood Risk Reduction Interventions 111
5.1.4.1.Impact assessment during pre-construction phase 111
5.1.4.2.Impact assessment during construction phase 123
5.1.4.3.Impact on operation phase 133
5.1.4.4.Unplanned and accidental events 135
5.1.5.Requirement of level of assessment for FS proposed for Cay Kho va Phu Dinh 147
5.2.Proposed mitigation measures 147
5.2.1.Measure to Mitigate the Impact of Component1 147
5.2.2.Measures to Mitigate General Impacts during Construction 152
5.2.3.Measures to Mitigate Site-specific Impacts during Construction 153

Environmental and Social Impact Assessment, HCMC Steering Center of the Urban
and Environmental and Social Management Plan Flood Control Program
Proposed HCMC Flood Risk Management Project Date Submitted: December 2, 2015
v
5.2.3.1.Site-specific Measures for Construction of Nuoc Len tidal sluice gate and 2 ship
locks 153
5.2.3.2.Site-specific Measures for Construction of Vam Thuat tidal sluice gate and 2 ship
locks 153
5.2.3.3.Site-specific Measures for Dredging and construction of canal bank revetment in
the main canal of TLBCNL Canal 154
5.2.3.4.Site-specific Measures for Construction of main interceptor in Go Vap district 155
5.2.3.5.Site-specific Measures for Construction and improvement of primary and
secondary combined sewer systems and the secondary interceptor in Go Vap district 156
5.2.3.6.Site-specific Measures for Improvement of secondary canals (Hy Vong, Cau Cut,
Ba Mieng, Ong Tong, Ong Bau, Chin Xieng) 156
5.2.4.Measures to Mitigate Impacts during the Operation Phase 157
5.2.4.1.Site-specific measures for operation of Nuoc Len tidal sluice gate and 2 ship locks 157
5.2.4.2.Site-specific measures for operation of Vam Thuat tidal sluice gate and 2 ship locks 158
5.2.4.3.Site-specific measures for operation of canal bank revetment in the main canal of
TLBCNL canal 158
5.2.4.4.Site-specific measures for operation of main interceptor in Go Vap District 159
5.2.4.5.Site-specific measures for operation of primary and secondary combined sewer
systems and the secondary interceptor in Go Vap District 159
5.2.4.6.Site-specific measures for operation of secondary canals (Hy Vong, Cau Cut, Ba
Mieng, Ong Tong, Ong Bau, Chin Xieng) 159
5.3.Cumulative Impact Assessment 159
5.3.1.General approach 159
5.3.2.Determine project boundaries 161
5.3.3.Identify Valued Environmental Components (VEC) 162
5.3.4.Summarizing the past conditions of the VEC (before 2012) 162
5.3.5.Monitoring of present environmental conditions of VEC (in 2015) 166
5.3.6.Cumulative impact in 2015 171
5.3.7.Predict the cumulative impact of project development in 2035 173
5.3.8.Linked Ancillary Projects 180
5.3.9.Design mitigation measures 185
5.3.9.1.Objectives 185

Environmental and Social Impact Assessment, HCMC Steering Center of the Urban
and Environmental and Social Management Plan Flood Control Program
Proposed HCMC Flood Risk Management Project Date Submitted: December 2, 2015
vi
5.3.9.2.Cumulative impact from wastewater and drainage water pollution 185
5.3.9.3.Green Infrastructure 185
5.3.9.4.Rain Gardens 186
5.3.9.5.Street Storage 186
5.3.9.6.Bio-Retention 186
5.3.9.7.Permeable Pavements 187
5.3.9.8.Vegetated Roof Cover 187
5.3.9.9.Bioswales 187
5.3.9.10.Rainwater Harvesting 187
5.3.9.11.Tertiary treatment 189
Chapter 6: Social Impact Assessment And Mitigation Measures 189
6.1.Study approach 189
6.1.1.Data collection 189
6.1.2.Defining ‗social‘ area of influence 189
6.2.Impact assessment methodology 191
6.3.Social Positive Impacts 191
6.3.1.During project construction phase (2016-2021) 191
6.3.2.Positive impacts of the overall project 192
6.4.Social negative impacts 196
6.4.1.Land acquisition and resettlement impacts due to the project 196
6.4.2.Impacts other than those caused by land acquisition 200
6.5.Residual impacts 205
6.6.Recommended mitigation and enhancement measures 205
6.6.1.Mitigation measures for negative impacts 205
6.6.2.Enhancement measures for some positive impacts 207
7.Environmental and Social management plan (ESMP) 209
A.Environmental management plan for component 209
7.1.Basic principles 209
7.2.Key mitigation measures for Project Component 2 210

Environmental and Social Impact Assessment, HCMC Steering Center of the Urban
and Environmental and Social Management Plan Flood Control Program
Proposed HCMC Flood Risk Management Project Date Submitted: December 2, 2015
vii
7.2.1.Urban Construction Environmental Codes of Practice (ECOPs) for Project
Component 2 210
7.2.2.Site-specific Enviromental Impacts 222
7.3. Key mitigation measures for component 1 232
7.4.Environment Monitoring Program 244
7.4.1.Objective and Approach 244
7.4.2.Monitoring of Contractor‘s Safeguard Performance 244
7.4.3.Environmental Quality Monitoring of Component 2 244
7.4.4.Environmental Quality Monitoring of Component 1 248
7.4.5.Monitoring Implementation Performance of DMMP 254
7.5.Monitoring effectiveness of the EMP 256
7.5.1.Organization Arrangement 256
7.5.2.Specific Responsibilities of PMU, CSC, and IEMC 259
7.5.3.Reporting Arrangements 261
7.6.Capacity Building Program 262
7.6.1.Technical Assistance support for the implementation of safeguards 262
7.6.2.Training programs proposed 263
7.7.Estimated EMP Cost 265
B.Social management plan
Chapter 8: Public Consultation And Information Disclosure 277
8.1.Objectives and basic principles 277
8.2Consultation Process and Methodology 278
8.3.Consultation Results 278
8.4.Information Disclosure 284
ANNEX 285
ANNEX 1: MAP OF SAMPLING LOCATIONS 286
ANNEX 2: ANALYTICAL RESULTS 287
ANNEX 3: ESTIMATION OF AIR EMISSION CONCENTRATION FOR
PRECONSTRUCTION PASE AND CONSTRUCTION PHASE OF PROJECT
COMPONENT 2
291

Environmental and Social Impact Assessment, HCMC Steering Center of the Urban
and Environmental and Social Management Plan Flood Control Program
Proposed HCMC Flood Risk Management Project Date Submitted: December 2, 2015
viii
ANNEX 4: HOUSEHOLD SURVEY 292
ANNEX 5: DESCRIPTION OF SOCIAL IMPACT ASSESSMENT PROCESS 300
ANNEX 6: SUMMARY OF RESETTLEMENT ACTION PLAN 303
ANNEX 7: PICTURES OF SAMPLING 308
ANNEX 8: PICTURES OF PUBLIC CONSULTATION 312
ANNEX 9: CUMULATIVE IMPACT ASSESSMENT 317
ANNEX 10: SUMMARY OF DUE DILIGENCE REPORT ON THAM LUONG-BEN
CAT WASTEWATER TREATMENT PLANT PROJECT (PHASE 1); SUMMARY
OF DUE DILIGENCE REPORT ON DRAINAGE SYSTEM AND WATER
ENVIRONMENT IMPROVEMENT OF THE THAM LUONG-BEN CAT-NUOC
LEN MAIN CANAL PROJECT (PHASE 1)
374

Environmental and Social Impact Assessment, HCMC Steering Center of the Urban
and Environmental and Social Management Plan Flood Control Program
Proposed HCMC Flood Risk Management Project Date Submitted: December 2, 2015
ix
LIST OF TABLES
Table 1.1 Applicable WBG‘s EHS Guidelines 12
Table 2.1 Project area divided by districts 18
Table 2.2 Sum of works scale for Vam Thuat tidal sluice gates 25
Table 2.3 Sum of works scale for Nuoc Len tidal sluice gates 29
Table 2.4 Bridges on main canal 31
Table 2.5 Technical parameters of canals 38
Table 2.6 Sensitive receptors in a relation to activities of project component and
locations of environmental baseline survey 42
Table 2.7 Capacity of receiving and treating sludge 44
Table 3.1 Average monthly rainfall in the project area and the vicinity 52
Table 3.2 Population Development of Ho Chi Minh City 56
Table 3.3 Administrative units and population in the Project area (2007) 57
Table 3.4 Main income source of local population 58
Table 3.5 Number of poor and nearly poor households in the project area 58
Table 3.6 Main road and bridges crossing over Tham Luong – Ben Cat 60
Table 1.7 Scope of Project Impacts (Phase 1 64
Table 3.8 Land Acquisition Progress Up to Date 65
Table 3.9 Percentage of households directly affected by the canal system 69
Table 3.10 Influence of canal pollution on household activities 70
Table 3.11 Percentage of households having production and business activities
affected 71
Table 3.12 Summary of impacts of flooding on poor, nearly-poor households,
immigrants and vulnerable groups 71
Table 3.13 Number of people suffered from infectious diseases and serious
diseases 72
Table 3.14The number of classes, pupils and teachers in the 2009-2010
academic year of Go Vap District 73
Table 3.15 Number of schools, pupils and teachers in the 2010-2011 academic
year in the project area 74

Environmental and Social Impact Assessment, HCMC Steering Center of the Urban
and Environmental and Social Management Plan Flood Control Program
Proposed HCMC Flood Risk Management Project Date Submitted: December 2, 2015
x
Table 3.16 Examination of water quality of Tham Luong Ben Cat Nuoc Len
Canal 78
Table 3.17 The fish species composition at Tham Luong sluice - Ben Cat - Nuoc
Len canal 83
Table 4.1 Alternatives on locations of Nuoc Len combined sluice gate and ship
locks 88
Table 4.2 Alternatives on technical design of Nuoc Len combined sluice gate
and ship locks 89
Table 4.3 Alternatives on locations of Vam Thuat combined sluice gate and ship
locks 89
Table 4.4 Alternatives on technical design of Vam Thuat combined sluice gate
and ship lock 90
Table 4.5 Alternatives on technical design for the embankment of Tham Luong-
Ben Cat-Rach Nuoc Len canal 91
Table 4.6 Alternatives on technical design of drainage culvert system in Go Vap
district 92
Table 4.7 Alternatives on technical design of primary and secondary combined
sewer systems and the secondary interceptor in Go Vap district 94
Table 4.8 Alternatives on technical design of secondary canals (Hy Vong, Cau
Cut, Ba Mieng, Ong Tong, Ong Bau, Chin Xieng 95
Table 5.1 Level of Potential Negative Impacts of Project 98
Table 5.2 Overall impacts of dust generated from house demolition and waste
handling of sub-component 2.1, 2.2 and 2.4 112
Table 5.3 Overall noise levels generated by operation of machinery during pre-
construction phase of each site of subcomponent 2.1, subcomponent 2.2 and
subcomponent 2.4
115
Table 5.4 Guideline for vibration damage potential threshold criteria (Sub-
component 1) 117
Table 5.5 Vibration level for construction equipment during pre-construction
phase of each site of subcomponent 2.1, 2.2 and 2.4 117
Table 5.6 Vibration level for construction equipment at different distances for
each subcomponent 118

Environmental and Social Impact Assessment, HCMC Steering Center of the Urban
and Environmental and Social Management Plan Flood Control Program
Proposed HCMC Flood Risk Management Project Date Submitted: December 2, 2015
xi
Table 5.7 Loads And Pollutants Concentration of Domestic Wastewater
(untreated) 119
Table 5.8 Total of house demolition waste from the clearance process for three
subcomponents 121
Table 5.9 Volume of material and waste required to transport to project site and
disposal site (Da Phuoc landfill) 123
Table 5.10 Dust generation of filling and excavating soil of subcomponent 2.1,
2.2, 2.3 and 2.4 125
Table 5.11 Dust generation of filling and excavating soil of subcomponent 2.1
and 2.2 126
Table 5.12 Impact assessment for unplanned accidental events 138
Table 5.13 Mitigation measure proposed for project component 1 147
Table 5.14 The FTOX for ambient air quality 164
Table 5.15 Population forecasted to 2035 as follows 176
Table 5.16 Potential Wastewater discharging to the channel Tham Luong Ben
Cat Nuoc Len 176
Table 5.17 Pollutant Criteria for Storm Water 177
Table 5.18 Total Maximum Daily Load (TSS) 177
Table 5.19 Concentration of pollutants in Channel TL-BC-NL 2018-2035 179
Table 5.20 Cumulative impacts of Linked Ancillary Projects 181
Table 6.1 Indirect Stakeholder Groups 190
Table 6.2 Number of workers required to each sub-component of Project
Component 2 191
Table 6.3 The effects of flooding on poor and near-poor households 193
Table 6.4 Impact of flood on health of local residents 194
Table 6.5 Impact of flood on health services 194
Table 6.6 Impact of flood on daily travel 194
Table 6.7 The scale of the land acquisition by ward 197

Environmental and Social Impact Assessment, HCMC Steering Center of the Urban
and Environmental and Social Management Plan Flood Control Program
Proposed HCMC Flood Risk Management Project Date Submitted: December 2, 2015
xii
Table 6.8 Social Impact Assessment Matrix 202
Table 7.1 Mitigation Measures Extracted From the Urban Works ECOPs
applicable for Project Component 2 211
Table 7.2 Site Specific Impacts and Mitigation Measures 222
Table 7.3 An indicative Impacts Management Plan for Component 1 233
Table 7.4 Scope of environmental monitoring during construction of component
2 245
Table 7.5 Estimated number for soil, water, and air sampling and analysis for
environmental monitoring during construction 247
Table 7.6 Estimated cost for samples collection and analysis 248
Table 7.7 Environmental Monitoring Program for Component 1 249
Table 7.8 Roles and responsibilities of key parties (Description referred to
Figure 7.1) 257
Table 7.9 Training Programs for Capacity Building on Environmental
Supervision and Management 263
Table 7.10 Estimated Cost for EMP implementation (million USD) 266
Table 7.11 Estimated cost for the IEMC (Exchange rate: 1 USD = 20,800 VND) 266
Table 7.12 Mitigation measures for Social Negative Impacts 267
Table 7.13 Enhancement measures for Social Positive Impacts 272
Table 7.14 Targets of the Income Restoration Plan 274
Table 7.15 Cost estimate for implementing the Income Restoration Plan 275
Table 8.1 Venue for First Round of Public Consultations 279
Table 8.2 Summary of first round of public consultations 281

Environmental and Social Impact Assessment, HCMC Steering Center of the Urban
and Environmental and Social Management Plan Flood Control Program
Proposed HCMC Flood Risk Management Project Date Submitted: December 2, 2015
xiii
LIST OF FIGURES
Figure 2.1 Master plan of HCM City Flood Risk Management Project. 17
Figure 2.2 Location map of Vam Thuat Sluice gate with ship lock. 24
Figure 2.3 Perspective view of Vam Thuat tidal sluice gate. 25
Figure 2.4 Location map of Nuoc Len Sluice gate with ship lock. 27
Figure 2.5 Perspective view of Nuoc Len tidal sluice gate. 28
Figure 2.6 Struture of vertical embankment with slope emabankment. 31
Figure 2.7 Administrative map of Go Vap and Binh Thanh District and project‘s
border. 33
Figure 2.8 Rain and waste water collection area I. 35
Figure 2.9 Rain and waste water collection area II. 36
Figure 3.1 Map showing main river systems in Ho Chi Minh City. 49
Figure 3.2 Map showing annual rainfall in the Sai Gon - Dong Nai river basin. 50
Figure 3.3 Map of traffic planning in the area up to 2025. 62
Figure 5.1 Overall portrait of surface water characteristics along the main
channel TL-BC-NL. 164
Figure 5.2. Overall portrait of the contamination of sediment and settled sludge. 165
Figure 5.3. Overall portrait of the groundwater characteristics at private
domestic wells. 165
Figure 5. 4 Overall portrait of the groundwater characteristics at domestic wells. 166
Figure 5.5 Increase in Chemiotox Units in the sediments/settled sludge. 173
Figure 6.1 The relationship between improvement of flooding and poverty
reduction. 193
Figure 7.1 Organization Diagram for the EMP Implementation. 256
Figure 7.2 Organization chart of LRP. 275

Environmental and Social Impact Assessment, HCMC Steering Center of the Urban
and Environmental and Social Management Plan Flood Control Program
Proposed HCMC Flood Risk Management Project Date Submitted: December 2, 2015
1
CHAPTER 1: INTRODUCTION
1.1. Background and Project Objectives
1.1.1. Project‟s Background
Ho Chi Minh City (HCMC) currently has 19 urban districts and 05 rural districts with an area of
2,095.01 km2, a population of 7.995 million inhabitants and average population density of 3,401
people/km2. HCMC is the economic center of Vietnam and accounts for a large proportion of
Vietnam economy. Thanks to its favorable natural conditions HCMC became an important
traffic hub for Vietnam and Southeast Asia, including road, railway, waterway and airway.
Due to rapid population growth, inadequate and poorly functional infrastructure, low public
awareness. HCMC is challenged with environmental pollution, the causes of which include
direct discharge of untreated wastewater to canals, creeks and rivers. In recent years, HCMC has
been significantly flooded, especially during rainy season from June to November and during
flood-tide between September and December. Flooding in HCMC is caused by high intensity of
rainfall, flood-tide, poor effectiveness of wastewater drainage system in rural area, inefficient
operation of reservoirs and land subsidence due to groundwater withdraw. Heavy rainfall events
have been increased in recent centuries. Wastewater and storm water drainage systems of HCMC
have been downgraded and overloaded during heavy rainfall events while those systems have
still not been constructed in many places in HCMC. As a result, flooding due to high rainfall
intensity has been frequent. High tides in the East Sea obstruct water flow of upstream river
and the urban drainage to the sea causing flash floods. On top of improving drainage capacity of
canals and sewer systems in central areas of the city to combat flooding caused by frequent high-
intensity rainfall, HCMC is also challenged with inflow of the East Sea to canal system. This
inflow causes an increase of water level in canals and obstructs its flow from the City center to
Sai Gon River, especially during high tides.
In addition to frequent high intensity rainfall and high tides, flooding in HCMC is caused by
draining water from hydropower and irrigation reservoirs located in the upstream. HCMC, in
2000, was severely flooded due to draining water of Tri An reservoir (2,000 m3/s) and Dau Tieng
reservoir (600 m3/s). Furthermore, HCMC is affected by flooding in Mekong River through Vam
Co Dong and Vam Co Tay rivers. HCMC‘s sewer systems have been developed locally and
untreated wastewater has been discharged into rivers, creeks and canals causing severe pollution
that damages water quality.
Regarding the feasible study 2012 conducted by HCMC Government, flooding in HCMC is a
frequent event affecting an area of 5,944 ha (40% of total area of the catchment) and a
population of 700,000 inhabitants (35% of total people living in the catchment). Average flooded
depth is varied from 0.5 m to 1.2 m, where flooding duration is from 30 minutes to 150 minutes.
In addition, Hy Vong Canal (a canal connected to Tham Luong – Ben Cat – Nuoc Len canal) is

Environmental and Social Impact Assessment, HCMC Steering Center of the Urban
and Environmental and Social Management Plan Flood Control Program
Proposed HCMC Flood Risk Management Project Date Submitted: December 2, 2015
2
designed to receive water drained from Tan Son Nhat airport which is usually facing flooding
that need to be resolved.
Industrial operation along Tham Luong canal has been considered as a major source of pollutants
that cause severe damage of the canal.
Survey results indicate that wastewater flow generated from factories outside the industrial park
is ranged from 30,000 to 40,000 m3/day, in which 2.4 tons of suspended solids are comprised.
Total flow of wastewater generated from industrial parks such as Tan Tao, Tan Binh, Vinh Loc
A, Tan Thoi Hiep is estimated to be more than 32,000 m3/day. This flowrate can potentially
contribute about 6.4 tons of suspended solids into Tham Luong canal if the discharged
wastewater can meet allowable standards. In addition, the canal can be damaged severely due to
tons of air pollutants generated from stacks of textile processing factories and of waste illegally
disposed along the canal.
In recent years, climate change, including sea water rise, causes severe flooding for many areas
in the world in general and in Vietnam in particular that affects production and human well-
being. Researching to propose specific measures to mitigate effects of climate change is
essential, which requires a committed determination and coordination of the whole society (i.e.
residents, business leaders, authorities, NGOs).
As described above, HCMC residents and economy are frequently affected by flooding and
salinity intrusion becomes more severe during the past decades. Flooding in HCMC is
considered as major priority needed to be resolved not only due to the large concentrations of
people and assets in urban areas but also its direct impact on the city‘s economic growth.
On top of rapid urbanization, the major targets proposed in Resolution 16.NQ-TW of the
Politburo to sustain GDP growth at 1.5 times of national growth targets will require a serious
consideration of urban flooding, its associated impacts, and exposure to the population at risk,
economic activities, infrastructure, built-up areas and associated health issues.
Under the guidelines of Vietnamese Government, Ministries and determination of HCMC
government, several areas have been invested to reduce the effects of flooding. However, as
predicted sea water rise due to climate change will proceed more rapidly and more dangerously
that requires HCMC government to have mitigation measures. Budget required is expected
considerably to undertake this mission, but HCMC is having difficulty in mobilizing the
financial sources for the projects relating to flood mitigation measures.
Several organizations, in recent years, have supported HCMC government to construct and
operate facilities relating to drainage, flood control and pollutants removal. Some typical projects
are currently effectively operating, including irrigation facilities along Sai Gon River (AFD),
Vietnam - Ho Chi Minh City environmental sanitation (Nhieu Loc-Thi Nghe Basin) (World
Bank (WB)), urban development project (WB), and improving the quality of the water in the Tau
Hu-Ben Nghe-Doi (JICA).

Environmental and Social Impact Assessment, HCMC Steering Center of the Urban
and Environmental and Social Management Plan Flood Control Program
Proposed HCMC Flood Risk Management Project Date Submitted: December 2, 2015
3
Mitigation measures on urban flooding have been actively undertaken recently, where the
following works have been carried out: maintaining (dredging and repairing drainage pipes and
manholes), researching on alternative methods for operating 30 mobile and fixed pump stations
(44 pumps) and 2 tidal sluice gates to avoid flooding in the city center, installing 246 drainage
pipes with total length of 333.4 km, mobilizing manpower from ―Green Summer Campaign‖ and
residents to dredge 233 canals to improve the landscape, environment and sanitary, constructing
and operating 1,077 tidal valves and improving operation procedures of tidal sluice gate to
reduce flooding while waiting for projects under Plan 1574, undertaking 219 projects under
government‘s budget to reduce or delete flooding in several places.
Integrated flood risk management approach for HCMC, under support of the World Bank, is
established to continually improve drainage systems, flood control and environmental sanitation
for the City, where a focal point will be a catchment of Tham Luong - Ben Cat – Nuoc Len
canal.
1.1.2. Objectives of the Project
General Objectives
The proposed Project Development Objective is to reduce flood risk and improve drainage in
selected areas in Ho Chi Minh City
Accordingly, the general objectives of the proposed project are followings:
- Enhancing the management capability in order to prevent flooding in combination with to
improve the environment sanitation in Ho Chi Minh city.
- Coordinating with the projects of relevant plans in order to ensure tide control, drainage for
flood reduction in the core inner city (taking the climate change into account).
- Aligning with the World Bank‘s twin goal of eliminating extreme poverty and boosting
shared property.
- The aforesaid objectives are fully consistent with the World Bank Country Partnership
Strategy (CPS) for 2012-2016 in the outcomes 2.3 and 3.2, which are the enhancement of
preparedness for natural hazards and climate change, and the improvement of basic
infrastructure and public service delivery and access, respectively.
Specific Objectives
- Conducting the flood prevention and drainage plan for the Ho Chi Minh core inner city,
comprising: improvement of the drainage and storage capacity of Tham Luong - Ben Cat -
Nuoc Len main canal and secondary canals; finishing the drainage and flood prevention
systems for Go Vap district, which belongs to Tham Luong - Ben Cat - Nuoc Len basin with
total area of 14.900 ha in the 9 districts of Ho Chi Minh City.
- Conducting feasibility studies of tidal sluice gates under Plan 1547 approved by the Prime
Minister for tide control in the core inner city.

Environmental and Social Impact Assessment, HCMC Steering Center of the Urban
and Environmental and Social Management Plan Flood Control Program
Proposed HCMC Flood Risk Management Project Date Submitted: December 2, 2015
4
- Building and strengthening the capability and institution for the integrated urban flood risk
management in Ho Chi Minh city, including the execution management and operation of
drainage and flood prevention systems, early warning system, inter - reservoir operation,
ground water extraction management and urban development, etc.
- Improving the environment sanitation conditions, creating good landscape for Tham Luong
- Ben Cat - Nuoc Len basin. Improving the people‘s lives, ending extreme poverty,
increasing the income of about 2 million people in the catchment (Estimated population in
2020)
1.2. Policy, Legal and Institutional Framework
This chapter summarizes the Administrative Framework for the Project, covering national
requirements as well as applicable international treaties and conventions, and internal guidelines
and standards voluntarily committed to by the World Bank. The intent of this chapter is to lay
out the regulatory and non-regulatory performance requirements for all stages of the Project.
1.2.1. National Legal Obligation
The National Assembly is the highest legislative body in Vietnam and is responsible for enacting
framework legislation. The Government uses the legislation as a framework to develop policies,
decisions, decrees and directives. Ministries (at the National level) within their area of
competence issue guidelines and standards and ensure implementation of the same. The
guidelines and standards issued by the Ministries are in line with Government policies and
within the legislative framework issued by the National Assembly. At the provincial level,
People‘s Committees take the role of Ministries.
Summary of Applicable Legal Obligation
National environmental and social standards and targets in Vietnam are mainly derived from the
Environmental Protection Law No. 55/2014/QH13 by the National Congress of the Socialist
Republic of Vietnam adopted on June 23, 2014. Section 3 of Chapter 2 of this Law provides
related issues of environmental impact assessment for development activities. The report of
environmental impact assessment must be carried out in the project preparation stage. Objects,
conditions of implementing environmental impact assessment and evaluation and approval of
reports specified in Chapter IV, Article 12, 13 and 14 of Decree No. 18/2015/ ND-CP by the
Government dated February 14th
, 2015 provides environmental protection planning, strategic
environmental assessment, environmental impact assessment and environmental protection plan.
The LEP‘s associated Decrees, Decisions and Circulars prescribe the various environmental and
social regulations‘. Some relevant standards and targets are also contained in health and safety
legislation.
These regulations refer to the official Vietnamese standards and national technical regulations
abbreviated as TCVNs (Tieu Chuan Viet Nam) and QCVNs (Quy Chuan Viet Nam). The
national standards and technical regulations generally prescribe maximum permissible levels of

Environmental and Social Impact Assessment, HCMC Steering Center of the Urban
and Environmental and Social Management Plan Flood Control Program
Proposed HCMC Flood Risk Management Project Date Submitted: December 2, 2015
5
pollutants, such as emissions or waste streams. Individual provinces can establish their own
standards but these must be more stringent that the national standards.
This EIA has been prepared in consideration of and in compliance with the following legal
obligations which govern such development processes:
Legislation
- Law of Environmental Protection No. 55/2014/QH13, dated 23 June 2014, issued by the
National Congress of the Socialist Republic of Vietnam;
- Water Resources Law No. 17/2012/QH13, dated June 21, 2012, issued by the National
Congress of the Socialist Republic of Vietnam;
- Labour Law No. 10/2012 /QH13, dated 18 June 2012, issued by the National Congress of the
Socialist Republic of Vietnam;
- Biodiversity Law No. 20/2008/QH12, dated 13 November 2008, issued by the National
Congress of the Socialist Republic of Vietnam
- Law on Chemicals No. 06/2007/QH12, dated 21 November 2007, issued by the National
Congress of the Socialist Republic of Vietnam;
- Standards and Technical Regulations Law No. 68/2006/QH11, dated 29 June 2006, issued by
the National Congress of the Socialist Republic of Vietnam;
- The Constitution of The Socialist Republic of Vietnam 2013;
- Land Law No. 45/2013/QH13, dated 29 November 2013, issued by the National Congress of
the Socialist Republic of Vietnam; effective from 1 July 2014.
Decree
- Decree No. 19/2015/ND-CP, dated 14 February 2015, on detailed regulation for
implementing some articles of the Environmental Protection Law, issued by the
Government;
- Decree No. 18/2015/ND-CP, dated 14 February 2015, providing environmental protection
planning, strategic environmental assessment, environmental impact assessment and
environmental protection plans, issued by the Government;
- Decree No. 80/2014/ND-CP, dated 6 August 2014, on drainage and wastewater treatment,
issued by the Government;
- Decree No. 179/2013/ND-CP, dated 14 November 2013, on the handling of violations of law
in environmental protection , issued by the Government;
- Decree No. 15/2013/ND-CP, dated 6 February 2013, on the management of construction
works quality; issued by the Government;

Environmental and Social Impact Assessment, HCMC Steering Center of the Urban
and Environmental and Social Management Plan Flood Control Program
Proposed HCMC Flood Risk Management Project Date Submitted: December 2, 2015
6
- Decree No. 26/2011/ND-CP, dated 8 April 2011, amending and supplementing a number of
articles of the Government's Decree No. 108/2008/ ND-CP of October 7, 2008, detailing and
guiding a number of articles of the Chemical Law, issued by the Government;
- Decree No. 12/2009/ND-CP, dated 12 February 2009 and Decree No. 83/2009/ND-CP,
dated 15 October 2009, on the management of the construction investment project , issued
by the Government;
- Decree No. 59/2007/ND-CP, dated 9 April 2007, on Solid Waste Management, issued by the
Government;
- Decree No. 127/2007/ND-CP, dated 1 August 2007, on "detailed regulation for
implementing some articles of the Standards and Technical Regulations Law", issued by the
Government;
- Decree No. 43/2014/ND-CP dated 15/5/2014 of the Government on detailing a number of
articles of the Land Law;
- Decree No. 44/2014/ND-CP dated 15/5/2014 regulation on land price;
- Decree No. 47/2014/ND-CP dated 15/5/2014 of the Government on compensation, support
and resettlement upon land recovery by the State;
- Decree No. 38/2013/ND-CP of April 23, 2013 on management and use of official
development assistance (ODA) and concessional loans of donors;
- Decree No. 201/2013/ND-CP dated November 27, 2013 of the Government detailing the
implementation a number of articles of the Law on Water Resources.
Circular
- Circular No. 27/2015/TT-BTNMT, dated 29 May 2015, detailing a number of articles of the
Government's Decree No. 18/2015/ ND-CP on Strategic Environmental Assessment,
Environmental Impact Assessment and Environmental Protection Commitment, issued by the
Ministry of Natural Resources and Environment;
- Circular No. 27/2013/TT-BLĐTBXH, dated 18 October 2013, providing for occupational
safety and hygiene training, issued by Ministry of Labour, Invalid and Social Affairs.
- Circular No. 12/2011/TT-BTNMT, dated 14 April 2011, stipulating hazardous waste
management, issued by the Ministry of Natural Resources and Environment;
- Circular No. 28/2010/TT-BCT, dated 28 June 2010, detailing a number of articles of
Chemical Law and Decree No. 108/2008/ND-CP detailing and guiding the implementation
of a number of articles of the Chemical Law, issued by the Ministry of Industry and Trade;
- Circular No. 16/2009/TT-BTNMT, dated 7 October 2009, defining national technical
regulations on environment, issued by the Ministry of Natural Resources and Environment;

Environmental and Social Impact Assessment, HCMC Steering Center of the Urban
and Environmental and Social Management Plan Flood Control Program
Proposed HCMC Flood Risk Management Project Date Submitted: December 2, 2015
7
- Circular No. 36/2014 / TT-BTNMT dated June 30, 2014, regulating method of valuation of
land; construction, land price adjustment; specific land valuation and land valuation
advisory;
- Circular No. 37/2014/TT-BTNMT dated on June 30, 2014 regulating compensation,
assistance and resettlement when the State acquires land.
Decision
- Decision No. 16/2008/QĐ-BTNMT, dated 31 December 2008, on the promulgation of
national technical regulation on environment, issued by the Ministry of Natural Resources
and Environment;
- Decision No. 04/2008/QD-BTNMT, dated 18 July 2008, on the regulations of the National
technical standard for environment, issued by the Ministry of Natural Resources and
Environment;
- Decision No. 04/2008/QD-BXD, dated 3 April 2008, on the promulgation of national
technical regulations on building codes, issued by the Ministry of Construction;
- Decision No. 3733/2002/QD-BYT, dated 10 October 2002, promulgating hygienic standards
in workplace;
- Decision No. 1956/2009/QD-TTg, dated 17/11/2009, of GoV approving the Master Plan for
vocational training for rural workers in 2020;
- Decision No. 52/2012/QD-TTg, dated 16/11/2012, on policies to support employment and
vocational training for farmer whose land is recovered by the State;
- Decision No. 23/QĐ-UBND, issued on 15/5/2015 by Ho Chi Minh City People's Committee
on Compensation, assistance and resettlement when the State recovers land in Ho Chi Minh.
City.
Technical Standards
This EIA has also considered the following Vietnamese and other relevant environmental, safety,
social and economic standards and technical regulations that are applicable to either the
development of the Project site or the proposed activities to be conducted at the Project site.
Water quality
- QCVN 02:2009/BYT - National Technical Regulation on Domestic Water Quality;
- QCVN 01:2009/BYT - National Technical Regulation on Drinking Water Quality;
- QCVN 14:2008/BTNMT - National Technical Regulation on Domestic Wastewater;
- QCVN 09:2008/BTNMT - National technical standard on groundwater quality;
- QCVN 08:2008/BTNMT - National technical standard on surface water quality;

Environmental and Social Impact Assessment, HCMC Steering Center of the Urban
and Environmental and Social Management Plan Flood Control Program
Proposed HCMC Flood Risk Management Project Date Submitted: December 2, 2015
8
Air Quality
- QCVN 05:2013/BTNMT- Air Quality - National technical standard on Ambient Air Quality;
Noise and vibration
- QCVN 26:2010/BTNMT - National Technical Regulation on Noise;
- QCVN 27:2010/BTNMT - National Technical Regulation on Vibration;
- TCVN 6962:2001 Vibration and shock. Vibration emitted by construction works and
factories. Maximum permitted levels in the environment of public and residential areas
- QCVN 3985:1999 Acoustics. Allowable noise levels at working place
- TCVN 5948:1999 Acoustics. Noise emitted by accelerating road vehicles. Maximum
Permitted Noise Level
- TCVN 6436:1998 Acoustics. Noise emitted by stationary road vehicles. Maximum Permitted
Noise Level
Sediment
- QCVN 43:2012/BTNMT - National Technical Regulation on Sediment Quality
Solid waste and hazardous waste
- QCVN 07:2009/BTNMT - National technical standard on threshold of hazardous waste;
- TCVN 6705 : 2009 - Non-hazardous solid waste – Classification;
Other regulations
- TCVN 5507:2002 - Hazardous Chemicals - Code of practice for safety in production,
commerce, use, handling and transportation;
Legal Aspects of the Project
- Decision No. 752/QĐ-TTg, dated 19 June 2001, approving the Master Plan of drainage
system in Ho Chi Minh City to 2020, issued by the Prime of Government;
- Document No. 1131 / CP-CN, dated 13 August 2004, approving the pre-feasibility study
report of drainage and pollution treatment for Tham Luong - Ben Cat – Nuoc Len canal,
issued by the Prime of Government;
- Decision No. 2064/QĐ-UB, dated 12 February 2007, approving the project of drainage and
pollution treatment for Tham Luong - Ben Cat – Nuoc Len canal (phase 1) projects, issued
by the Ho Chi Minh City People's Committee;
- Decision No. 589/QD-TTg, dated 20 May 2008, approving the master plan on construction
of the Ho Chi Minh City region up to 2020, with a vision toward 2050, issued by the Prime
of Government;

Environmental and Social Impact Assessment, HCMC Steering Center of the Urban
and Environmental and Social Management Plan Flood Control Program
Proposed HCMC Flood Risk Management Project Date Submitted: December 2, 2015
9
- Decision No. 1547/QĐ-TTg, dated 28 October 2008, approving the master plan for flood
prevention in Ho Chi Minh City, issued by the Prime of Government;
- Decision No. 66/QĐ-UBND, dated 14 September 2009, approving the planning of the
waterway network and port system in Ho Chi Minh City from now until 2020, issued by the
the Ho Chi Minh City People's Committee;
- Decision No. 4107/QĐ-SGTVT, dated 16 December 2009, on the classification of inland
waterways system of Ho Chi Minh City, issued by Department of Transportation of Ho Chi
Minh City;
- Decision No. 853/QĐ-BNN-KHCN, dated 06 April 2010, on the promulgation of technical
standards applied in the calculation of hydraulic and hydrological irrigation against flooding
of Ho Chi Minh City project , issued by the Ministry of Agriculture and Rural Development;
- Decision No. 1600/QĐ-BNN-XDCB, dated 14 June 2010, on approving the results of
calculations of hydraulic and hydrological irrigation against flooding of Ho Chi Minh City
project , issued by the Ministry of Agriculture and Rural Development;
- Profile of geological and topographical surveys performed by TV&CGCN on April 2009;
- Evaluation Flood Risk Management Report performed by consultancy partnership Deltares,
Royal Haskoning DHV, VMEC on April 2015;
- Environmental Impact Assessment Reports of seven project components;
- Feasible Study of seven project components;
- Project Description; and
- Flood Risk Management – Ho Chi Minh City (World Bank, 2013).
1.2.2. World Bank‟s Safeguard Policies and Guidelines
The environmental impact assessment study for the sanitation project is designed to evaluate its
status with respect to all applicable World Bank Safeguard Policies as well as national
legislation. According to Operational Policy (OP)/Bank Procedure (BP) 4.01: Environmental
Assessment (http://go.worldbank.org/OSARUT0MP0), the overall project is classified as
Category A project and therefore requires the completion of full-scale EIA.
OP/BP 4.01 on Environmental Assessment
The objectives of the World Bank‘s safeguard policies OP 4.01 for Environmental Assessment
is: (i) to inform decision makers of the nature of environmental and social risks, (ii) to ensure
that projects proposed for Bank financing are environmentally and socially sound and
sustainable (promote positive impacts, avoid/mitigate negative impacts, (iii) to support
integration of environmental and social aspects of projects in the decision-making process, and

Environmental and Social Impact Assessment, HCMC Steering Center of the Urban
and Environmental and Social Management Plan Flood Control Program
Proposed HCMC Flood Risk Management Project Date Submitted: December 2, 2015
10
(iv) to increase transparency and provide mechanism for participation of stakeholders in the
decision-making process for the project (WB Safeguards Workshop 2010).
The project triggers the Bank safeguard policy on Environmental Assessment (OP/BP 4.01) and
is classified as Category A project due to significant impacts associated with the proposed
investments/activities under components 1 and 2. On the positive side, the project will help
reduce flood risk and improve environmental conditions in Tham Luong- Ben Cat basin in Ho
Chi Minh City therefore, overall the project will bring positive impacts to degraded waterways
such as Saigon River. However, there will be temporary, site-specific environmental impacts
primarily during the construction period (due to air pollution, noise and vibration due to the
operation of heavy equipment, waste generation at the construction site, and traffic
interferences),. Other key negative impacts during construction would include generation of land
acquisition for canal rehabilitation; the loss of land for affected people; the risk on landslide and
subsidence during the construction of canal embankment and from construction interceptor using
pipe jacking method; the generation of excavated soil and dredged sediments from the
rehabilition of the main canal, secondary connecting canals and construction of interceptor,
primary and secondary sewer network in Go Vap district, which would require the appropriate
disposal solution. At the operational period, the environmental concerns would include
maintenance activities and awareness raising for the local people to ensure the aesthetic, proper
functions of structural works preventing flood risks. In addition; better monitoring, evaluation
and management of pollution sources entering the rehabilitated canal are critical to the
sustainability of the project.
OP/BP 4.04 on Natural Habitat
The policies is triggered as the project interventions including dredging, canal rehabilitation, and
land clearing will be located primarily in urban area.The project is expected to have positive
impacts on natural habitats such as the rehabilitated canal and rivers.
OP/BP 4.11 on Physical Cultural Resources
The project activities take place in urban areas of OP/BP 4.11 HCMC, specifically along the TL-
BC-NC canal of 32.7 km where PCRs are unknown. However, the policy is triggered as the
Project involves excavation and dredging activities which may result in chance finds.
OP/BP 7.50 Project on International Waterways
OP 7.50 is triggered to the project since the Saigon River and its tributaries are international
waterways given the nature of project activities. The project interventions include rehabilitation,
additions, improvements and upgrading of the Tham Luong – Ben Cat– Rach Nuoc Len Canal
system.
The location of the proposed project is in HCMC in the basin of the Tham Luong-Ben Cat-Nuoc
Len (TL-BC-NC) canal which is 32.7 km long, covers an area of about 14,900 ha and occupies
30% of the HCMC inner city area. The waters of this canal are hydraulically connected with

Environmental and Social Impact Assessment, HCMC Steering Center of the Urban
and Environmental and Social Management Plan Flood Control Program
Proposed HCMC Flood Risk Management Project Date Submitted: December 2, 2015
11
Saigon River (which is an international river), Cho Dem River (national river), and several
catchments such as Tham Luong-Ben Cat, Saigon West, and Binh Tan. The relevant
characteristics of these two main rivers are:
Cho Dem River is a tributary of Saigon River and runs exclusively within Vietnam, and
Vietnam is the lowest downstream riparian of the Saigon River which is an international
waterway that eventually discharges to the South China Sea;
Saigon River originates in Cambodia and meets the Cho Dem River at the downstream, near
its confluence with the Dong Nai River after which Sai Gon River turns into Nha Be River,
which discharges to the South China Sea; and
Both Cho Dem and Saigon Rivers are part of the Dong Nai River Basin.
OP/BP 4.12 Involuntary Resettlement
The policy aims to avoid involuntary resettlement to the extent feasible, or to minimize and
mitigate its adverse social and economic impacts. It promotes participation of displaced people
in resettlement planning and implementation, and its key economic objective is to assist
displaced persons in their efforts to improve or at least restore their incomes and standards of
living after displacement. As required by the policy, a Resettlement Policy Framework (RPF)
and a Resettlement Action Plan (RAP) have been prepared for the project.
The project triggers OP4.12 on Involuntary BP 4.12 Resettlement because it will cause physical
and economic displacement of people
Public Consultation and Information Disclosure
According to WB‘s safeguard policy OP 4.01 for category A project, proposed for IBRD or IDA
financing, during the EA process, the borrower consults project-affected groups and local non-
governmental organizations (NGOs) about the project's environmental aspects and takes their
views into account. The borrower initiates such consultations as early as possible.
For Category A projects, the borrower consults these groups at least twice: (a) shortly after
environmental screening and before the terms of reference for the EA are finalized; and (b) once
a draft EA report is prepared. In addition, the borrower consults with such groups throughout
project implementation as necessary to address EA-related issues that affect them.
The document with the summary of main investment items, key environmental issues, and
environmental protection solutions associated with the project should be sent to organizations
and individuals participating in the public consultation in a timely manner, in an understandable
language and at an accessible place prior to the public consultation.
The World Bank Group‟s Environmental, Health and Safety Guidelines (WBG‟s EHS
Guidelines)
While the normal World Bank Policy for Environmental Assessment is guided by Operational
Policy/Bank Procedure (OP/BP) 4.01 represent the guidance for the ESIA and sustainable social

Environmental and Social Impact Assessment, HCMC Steering Center of the Urban
and Environmental and Social Management Plan Flood Control Program
Proposed HCMC Flood Risk Management Project Date Submitted: December 2, 2015
12
and environmental management for the Project, the IFC‘s EHS Guidelines provide guidance on
general and industry best practice as well as recommended numerical limits for emissions to the
atmosphere, noise, liquid and solid wastes, hazardous wastes, health and safety, and other
aspects of industrial facilities and other types of development projects. The EHS Guidelines are
technical reference documents with general and industry-specific examples of Good
International Industry Practice (GIIP). The World Bank group uses the EHS Guidelines as a
technical source of information during environmental assessment process
In general, where different standards are prescribed by the different agencies, the most stringent
of the national and international standards will apply to the Project:
―When host country regulations differ from the levels and measures presented in the EHS
Guidelines, projects are expected to achieve whichever is more stringent. If less stringent levels
or measures than those provided in these EHS Guidelines are appropriate, in view of specific
project circumstances, a full and detailed justification for any proposed alternatives is needed as
part of the site-specific environmental assessment. This justification should demonstrate that the
choice for any alternate performance levels is protective of human health and the environment.‖
(IFC General EHS Guidelines, page 1).
Overall, the IFC‘s EHS Guidelines are the more comprehensive and stringent. Compliance with
national standards is always required.
Table 1.1 Applicable WBG‘s EHS Guidelines
Applicable IFC‟s EHS Guidelines
General Environmental Guidelines
1. Environment
1.1 Air Emissions and Ambient Air Quality
1.2 Energy Conservation
1.3 Wastewater and Ambient Water Quality
1.4 Water Conservation
1.5 Hazardous Materials Management
1.6 Waste Management
1.7 Noise
1.8 Contaminated Land
General Occupational Health and Safety Guidelines
2. Occupational Health and Safety

Environmental and Social Impact Assessment, HCMC Steering Center of the Urban
and Environmental and Social Management Plan Flood Control Program
Proposed HCMC Flood Risk Management Project Date Submitted: December 2, 2015
13
2.1 General Facility and Design and Operation
2.2 Communications and Training
2.3 Physical Hazards
2.4 Chemical Hazards
2.5 Biological Hazards
2.6 Radiological Hazards
2.7 Personal Protective Equipment (PPE)
2.8 Special Hazards Environments
2.9 Monitoring
General Community Health and Safety
3.1 Water Quality and Availability
3.2 Structural Safety and Project Infrastructure
3.3 Life and Fire Safety (L&FS)
3.4 Traffic Safety
3.5 Transport of Hazardous Materials
3.6 Disease Prevention
3.7 Emergency Preparedness and Response
General Construction and Demolition Guidelines
4.1 Environment
4.2 Occupational Health and Safety
4.3 Community Health and Safety
Sectors Specific EHS Guidelines
1.2.3. Other international treaties and conventions
- Kyoto Protocol to the UNFCC on Climate Change (1997);
- United Nations Convention on Biological Diversity (1992);
- Basel Convention (1989);
- Ramsar Convention on Wetland (1971);
- International Union for Conservation of Nature and Natural Resources, Red List of

Environmental and Social Impact Assessment, HCMC Steering Center of the Urban
and Environmental and Social Management Plan Flood Control Program
Proposed HCMC Flood Risk Management Project Date Submitted: December 2, 2015
14
Threatened Species (1964).
The Kyoto Protocol on Climate Change (UNFCC)
Vietnam became a signatory to the UNFCC in 1998 with full accession in 2002. This obligates
Vietnam to assure that future development in the country meets the conditions of the
Convention. Relevant to this project are impacts associated with water rise resulted from climate
change and its proposed mitigation measures.
The United Nations Convention on Biodiversity 1992
This Convention seeks to conserve biodiversity and promote its sustainable use. It requires the
identification and monitoring of the biodiversity in an area and adopting the necessary
conservation measure. Vietnam became party to this Convention in 1994.
The Basel Convention 1989
This was developed under the auspices of the United Nations Environmental Programme
(UNEP) in response to the growing worldwide awareness of the problem of international traffic
in hazardous waste. The Basel Convention 1989 is the first and foremost global environmental
treaty that strictly regulates the trans-boundary movement of hazardous wastes. It obligates
parties to ensure environmentally sound management, especially during the disposal process.
The objectives of the Convention are to:
Ensure that waste is disposed of as near as possible to the place or source of its generation;
Reduce trans-boundary waste and where it cannot be avoided, to be disposed of in an
environmentally sound and efficient manner; and
Provide assistance to developing countries in the management of hazardous waste and the
generation.
The Convention places a ban on the export of hazardous waste from Organization for Economic
Cooperation and Development (OECD) countries to non-OECD countries.
The Ramsar Convention
The Ramsar Convention is an intergovernmental treaty adopted on 2 February 1971 with the
mission ―the conservation and wise use of all wetlands through local, regional and national
actions and international cooperation, as a contribution towards achieving sustainable
development throughout the world‖. In 1989, Vietnam signed on to the Ramsar Convention and
become the fifty country of this Convention. As a commitment to the Ramsar Convention,
Vietnam has committed for national action and international cooperation on conservation and
use of wetlands.
International Union for Conservation of Natural and Natural Resources, Red List of
Threatened Species

Environmental and Social Impact Assessment, HCMC Steering Center of the Urban
and Environmental and Social Management Plan Flood Control Program
Proposed HCMC Flood Risk Management Project Date Submitted: December 2, 2015
15
The IUSCN Red List, in 1964, was founded in order to provide a comprehensive inventory of the
global conservation status of biological species, and to set of precise criteria to evaluate the
extinction risk of thousands of species and subspecies. These criteria are applicable to all species
and all regions of the world. Following the guidelines of the IUSCN Red List, Vietnam‘s Red
List was produced in 1992, updated in 2007, and has been an effective guideline for conservation
of extinction species in Vietnam.

Environmental and Social Impact Assessment, HCMC Steering Center of the Urban
and Environmental and Social Management Plan Flood Control Program
Proposed HCMC Flood Risk Management Project Date Submitted: December 2, 2015
16
CHAPTER 2: PROJECT DESCRIPTION
2.1. Project name
―HO CHI MINH CITY FLOOD RISK MANAGEMENT”
2.1.1. Sponsor
World Bank (WB)
2.1.2. Governing body, project owner
Governing body: People’s Committee of Ho Chi Minh City.
- Address : 86 Le Thanh Ton, District 1, Ho Chi Minh city
- Phone number : +84 8 38226191
- Fax : +84 8 38296723
Project owner: The steering center of Urban Flood control program of Ho Chi Minh city
- Address : 10 Trần Nhật Duật, Tan Dinh Ward, District 1, Ho Chi Minh city
- Phone number : +84 8 3526 7497
- Fax : +84 8 3526 5354
The Agency performing owner tasks: Project Management Unit (PMU) of Works Contruction.
- Address : 176 Hai Bà Trưng, Đa Kao ward, District 1, Ho Chi Minh city
- Phone number : +84 8 38232119
- Fax : +84 8 38232119
2.1.3. Estimated project duration
- Project preparation stage: 2013 – 2016
- Project implementation stage: 2016 – 2021
2.1.4. Project site
ThamLuong – BenCat - NuocLen channel system is located in central of Hochiminh city (North
East – South West), which flow into Sai Gon river and Cho Dem river. Project area: 14,899
hectares (accounting of 7% of city natural area). The proposed project has construction works
which is located in nine (09) districts of HCMC such as Binh Thanh district, Go Vap district,
district 12, Tan Binh district, Tan Phu district, Binh Tan district, district 8, Binh Chanh district
and Nha Be district.

Environmental and Social Impact Assessment, HCMC Steering Center of the Urban
and Environmental and Social Management Plan Flood Control Program
Proposed HCMC Flood Risk Management Project Date Submitted: December 2, 2015
17
Figure 2.1 Master plan of HCM City Flood Risk Management Project.
Natural Area of project: 14,899 hectares, divided by district as follow

Environmental and Social Impact Assessment, HCMC Steering Center of the Urban
and Environmental and Social Management Plan Flood Control Program
Proposed HCMC Flood Risk Management Project Date Submitted: December 2, 2015
18
Table 2.1 Project area divided by districts
No District Total area (ha) Area of urban
land (ha)
Area of
Agriculture
land (ha)
Urban ratio
(%)
1 District 12 3,083.4 2,244.4 839 73
2 Go Vap District 1,915.7 1,827.5 88.2 95
3 Tan Binh District 525.1 525.1 0-0 100
4 Tan Phu Disrict 1,706.5 1,654.7 51.8 97
5 Binh Tan District 1,445.6 1,044.6 401.0 72
6 Hoc Mon District 1,526.1 584.3 914.8 41
7 Binh Chanh
District 4,589.1 2,117.1 2,472.0 46
8 District 8 93.3 93.3 0,0 100
9 Binh Thanh
District 14.2 14.2 0,0 100
Total 14,899 9,698.4 5,200.6 79
Source: Feasibility Study report, 2015.
2.1.5. Project‟s beneficiaries
Once the infrastructure works are put into use (comprising tidal sluice gates, improved canals
and sewers for flood prevention, interceptor sewers and wastewater treatment plants), flooding
caused by tide and rain would be controlled, contributing to the growth of kry services - tourism,
industries, high - tech and sustainable agriculture. The direct project beneficiaries are the
following:
(i) Close to 550,000 direct beneficiaries will be protected from flood control measures and
improved sanitation, in addition to 500,000 indirect beneficiaries living in the sub-
catchment, of which 51.9% of the population are women;
(ii) City and National level agencies involved in flood risk management who will benefit
from new equipment and capacity strengthening activities ; and
(iii) FDI and private enterprises, most of them in industrial zones, who will benefit through
improvement in infrastructure and reduced disruption due to flooding. Of this total
population, 5.6% are estimated to be in the bottom 40% of Vietnam‘s income
distribution, and 1.3% is estimated to be poor by the national poverty line of 653,000
VND per person per month in 2010.
2.1.6. Project description and components

Environmental and Social Impact Assessment, HCMC Steering Center of the Urban
and Environmental and Social Management Plan Flood Control Program
Proposed HCMC Flood Risk Management Project Date Submitted: December 2, 2015
19
This project will help reduce flood risk and improve drainage in selected areas in HCMC through
a combination of (i) institutional development measures and tools needed to enhance the
performance of relevant flood risk management agencies (SCFC, Southern Regional Center for
Hydrometeorological Forecasting, Department of Natural Resources and Environment, etc.); and
(ii) ―no/low regrets‖ structural investments to minimize flooding to the inner core area of
HCMC. The complementary nature of these two components aligns with best practices in
integrated flood risk reduction to address both structural (Component 2), non-structural and
institutional (Component 1) aspects of flood risk management process. Part of this process,
especially the structural investments, will help improve drainage in selected areas to specifically
contribute to flood risk reduction.
Component 1 - Integrated Urban Flood Risk Management (Total Cost: US$ 13 million, from
Loan Proceeds)
This component will contribute to reducing flood risk by strengthening the capacity of the
HCMC SCFC and other public institutions to better plan and implement flood risk management
measures (including disaster preparedness through flood forecasting, early warning, flood
emergency response, and risk reduction through risk sensitive spatial and sector planning), as
well as safeguard the water quality and the health of the people living along the proposed canals.
- Subcomponent 1.1 – Modernization of Hydromet Equipment and Flood Forecasting System.
Improving flood forecasting capacity of the Southern Center for Hydro-Meteorological
Forecasting (SCHMF), with specific focus on urban flooding in HCMC, including: (i)
Installation of 05 weather stations, 01 C-band bi-polar weather radar, 80 rainfall stations and
20 hydrological stations; (ii) Upgrading of the numerical weather and flood forecasting
models; (iii) Extension of the telemetry system; and (iv) Implementing a flood forecasting
system based upon a wide variety of meteorological data and the hydrological-hydrodynamic
model developed by SCFC under sub-component 1.2.
The modernization of the hydromet observation network and improvement of the flood
forecasting system for HCMC, including equipment specifications and forecasting platform,
will follow the architecture design and standards of the national hydromet equipment
upgrading and forecasting system that is being supported by the on-going Vietnam –
Managing Natural Hazards Project.
- Subcomponent 1.2 - Integrated Urban Flood Risk Management and Early Warning System.
Strengthening city‘s capacity on flood risk reduction investments planning, preparedness,
early warning dissemination and emergency response including: (i) Establishment of a city-
level Operations/Command Center at SCFC, fully equipped with hardware and software,
facilitating the collection, storage, retrieval, presentation and dissemination of flood related
information; (ii) Establishment of an Integrated Flood Information System at SCFC
connecting to the office of the HCMC People‘s Committee and other public institutions,
outreaching to flood vulnerable communities; (iii) Development of a reliable detailed
integrated hydrological – hydrodynamic model for HCMC to be used jointly for flood

Environmental and Social Impact Assessment, HCMC Steering Center of the Urban
and Environmental and Social Management Plan Flood Control Program
Proposed HCMC Flood Risk Management Project Date Submitted: December 2, 2015
20
forecasting, flood hazard mapping and the evaluation of flood protection measures; and (iv)
Production and updating of flood hazard and flood risk maps for HCMC.
- Subcomponent 1.3 - Water Quality Monitoring Equipment. Installation of 6 monitoring
stations along the Tham Luong – Ben Cat – Rach Nuoc Len canal and a study on sediment
management will be financed by the project budget, and managed by city‘s Department of
Natural Resources and Environment (DONRE). Additional strengthening of the water quality
monitoring program and improvement of local capacity for solid waste management will be
financed directly by HCMC‘s budget.
Component 2 - Priority Flood Risk Reduction Interventions (Total Cost: US$324 million, of
which US$ 304 million from loan proceeds and US$ 21 million from counterpart funds)
This component will contribute to reducing flood risks and improving drainage in the Tham
Luong –Ben Cat sub-catchment through significant prioritized no-regret structural measures
proposed in the JICA Plan (Plan 752) and MARD Plan (Plan 1547). Counterpart funding will be
used to finance land-acquisition and resettlement, while the loan proceeds will finance the
design, implementation, contingency and construction supervision costs. The scope of this
Component includes:
- Construction of two (2) combined ship lock - tidal sluice gates of Vam Thuat and Rach Nuoc
Len in Tham Luong – Ben Cat – Rach Nuoc Len canal to control tidal water inflows;
- Upgrading/Improvement of canal bank revetments in the main canal of Tham Luong – Ben
Cat – Rach Nuoc Len to improve its ability to discharge flood waters at the appropriate
designed safety level including green structures where appropriate;
- Construction of main interceptor and upgrading of primary and secondary combined storm
water drainage and waste water sewage system at the appropriate designed safety levels to
improve rainwater discharge and environmental sanitation capacity in Go Vap district;
Upgrading/Improvement of secondary canals that are connected with primary Tham Luong –
Ben Cat – Rach Nuoc Len Canal at the appropriate designed safety level to improve the
urban flood management and to reduce the pollution of the Canal and Sai Gon River with
sewage water.
Additionally, this component will finance supports to civil works implementation, including
technical, fiduciary, and safeguards aspects, as well as to the preparation of feasibility study
for two (02) other MARD Plan‘s Cay Kho and Phu Dinh tidal sluice gates.
Component 3 - Implementation Support (Total Cost: US$ 11 million, from counterpart funds)
This component will provide support SCFC for project implementation, Project Technical and
Financial Audits, Monitoring and Evaluation (M&E), and other operating costs. Training to
City‘s PMU on procurement, financial management and safeguard policies will be provided by
the World Bank in combination with other World Bank-funded projects‘ training program.

Environmental and Social Impact Assessment, HCMC Steering Center of the Urban
and Environmental and Social Management Plan Flood Control Program
Proposed HCMC Flood Risk Management Project Date Submitted: December 2, 2015
21
2.2. Technical Considerations for Component 1
Subcomponent 1.1 - Modernization of Hydromet Equipment and Flood Forecasting System.
Improving flood forecasting capacity of the Southern Center for Hydro-Meteorological
Forecasting (SCHMF), with a specific focus on urban flooding in Ho Chi Minh City.
Monitoring coverage of the flood prone areas in Ho Chi Minh City is currently insufficient in
terms of quantity and quality to support the implementation of a reliable flood forecasting
system. In addition, expansion of the water level sensors in the city canal system is also needed
for the control of the two tidal sluice gates to be constructed under this project. The project will
support the acquisition and installation of the following monitoring equipment: 5 weather
stations, 80 rainfall stations and 20 hydrological stations, the last ones distributed equally along
rivers and along city canals.
A new weather radar has been proposed to significantly increase the quality of rainfall
observations. The choice of C-band bi-polar equipment will enable the nowcasting of rainfall
impacting the city a few hours ahead. Altogether, the new weather radar is an essential
component in the forecasting system and allows for a reduction in the earlier proposed density of
the extended rainfall gauge network. Increased operation and maintenance costs associated with
the radar have been considered and will addressed in the sustainability plans for project
investments.
The significant extension of the monitoring network requires an increase in telemetry capacity.
Increased transmission of data also implies the need for more data storage capacity at SCHMF.
In addition, there is a need for extending the capacity of data transmission lines. As a
consequence, also data back-up services have to be re-assessed, in particular with the current
trend of using the cloud for such service.
Upgrading of the numerical weather models, based upon the weather modelling systems
Weather Research and Forecast (WRF) and High Resolution Regional Model (HRM),
respectively, is also essential for the reliability of flood forecasts for Ho Chi Minh City. The
model grid size will decrease from 16 km to 2 km, nearly enough to foresee the growth of
potentially damaging convective storms. The upgraded software will be supplied through the on-
going Vietnam – Managing Natural Hazards project (VN-Haz), including consultancy services to
calibrate the new models. The higher frequency of forecast simulations and the denser network
leads to the need to increase computer hardware capacity.
The flood forecasting system providing flood level forecasts for HCMC will be developed and
installed at SCHMF. Apart from the mandate SCHMF has for flood forecasting it is also the
most logical location as it is strongly connected to the quality and completeness of the incoming
monitored data and the numerical weather model results. While the flood forecasting system is
operational at SCHMF, SCFC will be guaranteed to receive instantaneously the same
information as available at SCHMF, for further actions related to early warning and flood
emergency response, and be provided with the functionality to do ―what-if‖ scenario simulations
with the system.
Environmental and Social Impact Assessment, HCMC Steering Center of the Urban
and Environmental and Social Management Plan Flood Control Program
Proposed HCMC Flood Risk Management Project Date Submitted: December 2, 2015
22
The flood forecasting system will be built upon an IT platform which allows for the processing
of all sources of meteorological data, such as satellite images, numerical weather model results,
weather radar images and ground stations. The flood forecasting platform should enable the
incoming data quality control, gap filling, rainfall data aggregation to quantify precipitation on
hydrological sub-basins, etc. It will also allow for the coupling of various hydrological and
hydrodynamic models. In particular, it will couple the integrated hydrological – hydrodynamic
model for Ho Chi Minh City to be developed by SCFC. In addition, it will couple the coastal
model for the simulation of tides and storm surges at the East Sea. The platform should also
allow for a future extension of the models to include the Dong Nai catchment upstream of the
reservoirs.
Software will be made available through the VN-Haz Project, which envisages the installation
of one common flood forecasting system over the complete area of Vietnam. For the
implementation for HCMC, the work involves the tailoring of the system by specifying and
activating the connection of data flows, connection of the models via adaptors, defining the
frequency of data refreshment and model simulations, activation of processes and processing
results for agreed dissemination. In cooperation with SCFC, this activity will be taken up by the
VN-Haz project as a pilot for the country wide flood forecasting system development. However,
the delivery of required hardware will be supported under this HCMC subcomponent.
Subcomponent 1.2 - Integrated Urban Flood Risk Management and Early Warning System.
Strengthening the city’s capacity on flood risk reduction to support: investment and spatial
planning, preparedness, early warning dissemination, and response.
The Operations Center to be established at SCFC will be much more than a platform showing
flood forecasting results. A database will be built containing a wide variety of information
relevant to floods, such as flood hazard and risk maps, web cam images, detailed information on
the flood defense system, evacuation routes and refuge accommodation, locations of public
administration, hospitals, police and fire stations, industries, etc. If development timelines allow,
the database software will be the same as the database under development for the DRM project
of VN-Haz. The need for backups of databases has been discussed and the project should
consider the choice between fixed location backup and the use of cloud services, such as
provided by Microsoft, for example. Criteria for selection will have to be reliability and costs.
Functional design and database will be developed, and should include an analysis of public
participation, line agencies to be connected and information flows have to be defined and
established. Investments in physical housing, data storage, screens, electronic billboards, etc. are
planned under this subcomponent. During implementation, specific areas like crowd-sourcing
data collection and sharing will be finalized with the City.
For flood management planning and for the flood simulations as part of the flood forecasts,
SCFC needs a reliable hydrological – hydrodynamic model, which will be built/upgraded from
the existing models. This model will have to cover the Dong Nai Basin downstream of the two
main upstream reservoirs and down to the sea, as well as the description of the primary
Environmental and Social Impact Assessment, HCMC Steering Center of the Urban
and Environmental and Social Management Plan Flood Control Program
Proposed HCMC Flood Risk Management Project Date Submitted: December 2, 2015
23
underground drainage system in the urban area. It will help improve coordination with upstream
reservoirs. Maps of flood hazards and flood risks for the city area will be produced as a result of
the model, and updated/maintained regularly by SCFC.
Subcomponent 1.3 - Water Quality Monitoring Equipment
This activity will be financed by the project budget, and managed by the city‘s Department of
Natural Resources and Environment (DONRE). It should be noted that the automatic sampling
only partly substitutes manual sampling, as there will still be a need to sample for parameters
such as heavy metals, phosphates and nitrates. Two of these stations have recently been installed
by Ho Chi Minh City. From the 39 remaining installations 6 will be financed from this project
budget. Focus is the monitoring of water quality improvements following the dredging of the
Tham Luong – Ben Cat – Rach Nuoc Len canal. In addition, a sediment management study of
Tham Luong – Ben Cat – Rach Nuoc Len canal is proposed to help the city in better managing
sedimentation and establishing a dredging plan.
Strengthening of the water quality monitoring program and improvement of local capacity for
solid waste management will be financed directly by Ho Chi Minh City‘s budget.
Maintenance
The investments in monitoring equipment, in particular the radar installation, will require future
maintenance. In addition, the installations will increase the need for staffing. It has to be realized
that non-structural flood management provisions such as a forecasting system have a high
economic rate of return. Due to the fact this value is hardly measurable, there is a tendency to
neglect its importance after installation of the services. Currently, maintenance budgets in Ho
Chi Minh City are already low. It is strongly recommended to allocate sufficient maintenance
resources for Component 1.
2.3. Technical Options for Component 2
2.3.1. Subcomponent 2.1 - Two (02) combined ship lock and tidal sluice gates: Vam Thuat
and Nuoc Len.
Vam Thuat tidal sluice gates
Location: at the Vam Thuat river mouth in District 12 and Binh Thanh, Ho Chi Minh city. At
this location, tide and flood from Saigon river into the central area through Tham Luong - Ben
Cat - Nuoc Len canal will be prevented.

Environmental and Social Impact Assessment, HCMC Steering Center of the Urban
and Environmental and Social Management Plan Flood Control Program
Proposed HCMC Flood Risk Management Project Date Submitted: December 2, 2015
24
Figure 2.2 Location map of Vam Thuat Sluice gate with ship lock.
Main technical solutions:
- Vam Thuat tidal sluice gates designed for 2 separated ship lock and sluice gate. Ship lock is
arrange two sides and priorily constructed cofferdams. Vam Thuat is designed with sluice
span of B = 52 m, bottom elevation of -4.5 m, and selected 2 lock chambers with B = 8x2 =
16 m. Its design ensures to combine with requirements of waterway trasportation such as
waterway grade V, self- propelled ship load is from 10 to 50 tons with the largest length of
17.4 m and the largest width of 4.78 m;
- Gate design options
For lock chambers, using rectangular gate;
For sluice chambers, using flap gate
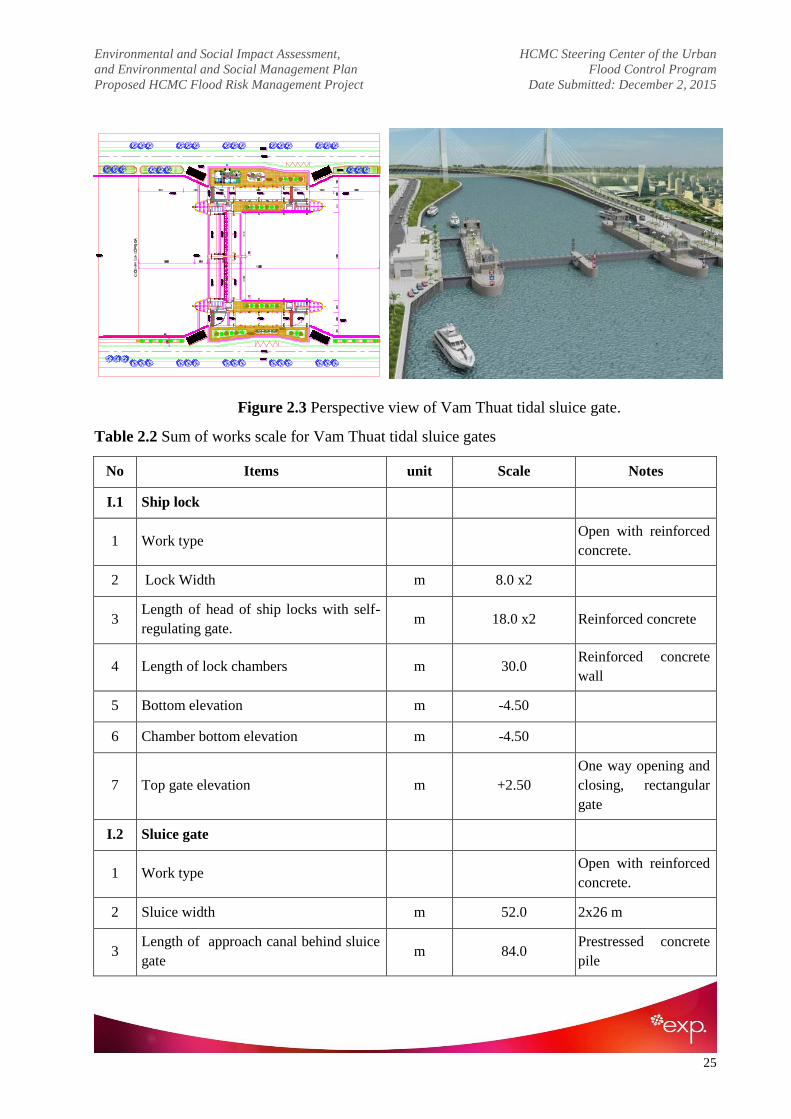
Environmental and Social Impact Assessment, HCMC Steering Center of the Urban
and Environmental and Social Management Plan Flood Control Program
Proposed HCMC Flood Risk Management Project Date Submitted: December 2, 2015
25
Figure 2.3 Perspective view of Vam Thuat tidal sluice gate.
Table 2.2 Sum of works scale for Vam Thuat tidal sluice gates
No Items unit Scale Notes
I.1 Ship lock
1 Work type Open with reinforced
concrete.
2 Lock Width m 8.0 x2
3 Length of head of ship locks with self-
regulating gate. m 18.0 x2 Reinforced concrete
4 Length of lock chambers m 30.0 Reinforced concrete
wall
5 Bottom elevation m -4.50
6 Chamber bottom elevation m -4.50
7 Top gate elevation m +2.50
One way opening and
closing, rectangular
gate
I.2 Sluice gate
1 Work type
Open with reinforced
concrete.
2 Sluice width m 52.0 2x26 m
3 Length of approach canal behind sluice
gate m 84.0
Prestressed concrete
pile

Environmental and Social Impact Assessment, HCMC Steering Center of the Urban
and Environmental and Social Management Plan Flood Control Program
Proposed HCMC Flood Risk Management Project Date Submitted: December 2, 2015
26
No Items unit Scale Notes
4 Width of approach canal behind sluice
gate m 55.50
5 Length of sluice body m 22.0
6 Sluice bottom elevation m -4.50 Reinforced by gabion
7 Top gate elevation m +2.50 Steel flap gate
II Appoach canal before and after sluice
gate.
1 Upstream approach canal
Prestressed concrete
pile
+ Span of canal bed m 55.5÷99.25 Reinforced by gabion
mattress
+ Canal slope coefficient 0
+ Canal bed elevation m -4.50÷-5.0
+Length of canal m 30.00
+ Canal bank elevation. m +2.20
2 Downstream approach canal
Prestressed concrete
pile
+ Span of canal bed m 55.5÷99.5
Reinforced by gabion
mattress
+ Canal slope coefficient 0
+ Canal bed elevation m -4.50÷-5.25
+ Canal length m 30.00
+ Canal bank elevation m +2.20
III Management building
1 Surrounding area m² Be inside sluice area
2 Construction area m² 100.0
IV Corridor
1 Length of corridor m 166
2 Span of corridor m 9&11 Left and right bank

Environmental and Social Impact Assessment, HCMC Steering Center of the Urban
and Environmental and Social Management Plan Flood Control Program
Proposed HCMC Flood Risk Management Project Date Submitted: December 2, 2015
27
No Items unit Scale Notes
3 Corridor structure Interlocking concrete
pavement
4 Park areas m² 3,320
V Internal and along canal roads
1 Length of main road m 166x2
2 Width of main road m 7.0 Asphalt lining
3 Lenghth of internal road m 230
4 Width of internal road m 5.0 Asphalt lining
Nuoc Len tidal sluice gates
Location: At the Nuoc Len canal mouth in Binh Tan District, Ho Chi Minh city. At this
location, tide and flood from Cho Dem river into the central area through Tham Luong - Ben Cat
- Nuoc Len canal will be prevented.
Figure 2.4 Location map of Nuoc Len Sluice gate with ship lock.

Environmental and Social Impact Assessment, HCMC Steering Center of the Urban
and Environmental and Social Management Plan Flood Control Program
Proposed HCMC Flood Risk Management Project Date Submitted: December 2, 2015
28
Main technical solutions:
- Nuoc Len tidal sluice gates designed for 2 separated ship lock and sluice gate. Ship lock is
arranged two sides and priorily constructed cofferdams;
- Ship lock has 2 lock chambers with 8m of width, using rectangular gates. A chamber with
gate is structured by reinforced concrete. A watertight chamber enclosed boats is 30m of
length, and structured by reinforced concrete;
- The culvert section with non waterway transport is used flap gate which opened or closed as
required. The culvert width B = 30 m. The later is 30 m length canal before leading into the
main canal which is reinforced by gabions and prestressed concrete pile wall.
Figure 2.5 Perspective view of Nuoc Len tidal sluice gate.

Environmental and Social Impact Assessment, HCMC Steering Center of the Urban
and Environmental and Social Management Plan Flood Control Program
Proposed HCMC Flood Risk Management Project Date Submitted: December 2, 2015
29
Table 2.3 Sum of works scale for Nuoc Len tidal sluice gates
No Items Unit Scale Note
I.1 Navigation locks
1 Work type
Open with reinforced
concrete
2 Lock width m 8.0x2
3 Length of head of ship lock with self-
regulating gate m
18.0 x2 Reinforced concrete
4 Length of lock chambers m 30.00 Prestressed concrete pile wall
5 Sluice bottom elevation m -4.00
6 Chamber bottom elevation m -4.00
7 Top gate elevation m +2.50
One way opening or closing,
rectangular gate
I.2 Sluice
1 Work type
Open with reinforced
concrete
2 Sluice width m 30.0
3 Length of approach canal behind sluice gate m 84.0 Prestressed concrete pile
4 Width of approach canal behind sluice gate m 30.5
5 Length of sluice body m 22.0
6 Sluice bottom elevation m -4.00 reinforced by gabions
7 Top gate elevation m +2.50 Steel flap gate
II Appoach canal before and after sluice
gate
1 Upstream approach canal Prestressed concrete pile
+ Span of canal bed m 71.25
Reinforced by gabion
mattresss
+ Canal slope coefficient 0
+ Canal bed elevation m -4.00
+ Canal length m 30.0

Environmental and Social Impact Assessment, HCMC Steering Center of the Urban
and Environmental and Social Management Plan Flood Control Program
Proposed HCMC Flood Risk Management Project Date Submitted: December 2, 2015
30
No Items Unit Scale Note
+ Canal bank elevation m +2.20
2 Downstream approach canal Prestressed concrete pile
+ Span of canal bed m 71.50
Reinforced by gabion
mattresss
+ Canal slope coefficient 0
+ Canal bed elevation m -4.50
+ Canal length m 30.0
+ Canal bank elevation m +2.20
III Management building
1 Surrounding area m² Be inside sluice area
2 Construction area m² 100.0
IV Corridor area
1 Length of corridor m 166
2 Span of corridor m 15 & 17 Left and right bank
3 Corridor structure
Interlocking concrete
pavement
V Internal and along canal roads
1 Length of main road m 166x2
2 Width of main road m 7.0 Asphalt lining
VI Work grade I
Hydological and hydraulic
features
II Stability, structural features
2.3.2. Subcomponent 2.2 - Construction of embankments in Tham Luong - Ben Cat - Nuoc
Len canal
Location: Tham - Luong - Ben Cat - Nuoc Len canal is the main south - north axis of the city
and it is one of Works under Plan 1547 for flood prevention. The canal is through the following
districts: Binh Chanh, 8, Binh Tan, Tan Phu, Tan Binh, 12, Go Vap, Binh Thanh, in Ho Chi
Minh city. This canal drains for Tham Luong - Ben Cat - Nuoc Len basin with the total area is
about 14,900 ha.

Environmental and Social Impact Assessment, HCMC Steering Center of the Urban
and Environmental and Social Management Plan Flood Control Program
Proposed HCMC Flood Risk Management Project Date Submitted: December 2, 2015
31
Main technical solutions: This is a combined option for revetment/earthwork of the full 32.7km
of length on each canal bank in its original footprint. Investments include 20.6km of concrete
piles (Km6.9 - Km27.6) and 12.2km of slope revetment (Km0.0 - Km6.9 and Km20.6-Km32.7).
These works will increase flood discharge capacity and storage capacity of the canal. The design
safety level of the canal embankment will be at 10 year return period. Various options of canal
structures and revetments were considered from economic and environmental perspectives.
Options for eco-friendly embankment designs have been recommended considering that they
improve water environment conditions, provide public recreation space and tourist attractions.
Figure 2.6 Struture of vertical embankment with slope emabankment.
Table 2.4 Bridges on main canal
No. Bridge‟s name Location Description
1 Bridge over Canal 19-5 K17+915
One span of 24.54 m length Lo Voi K27+507
2
Bridge over Canal 19-5 K13+762
Three span of 18.60 m length
Bridge over Rach Cut K24+997
K26+682 K26+682
Bridge over Rach Sau K27+244
Bridge over Rach Hai Vit K29+847
Bridge over Rach Lang K31+547

Environmental and Social Impact Assessment, HCMC Steering Center of the Urban
and Environmental and Social Management Plan Flood Control Program
Proposed HCMC Flood Risk Management Project Date Submitted: December 2, 2015
32
No. Bridge‟s name Location Description
3
K0+582 K13+762
Three span of 12.50 m length
Bridge over Rach Chia K2+423
Bridge over Rach Ba Tieng K2+606
Bridge over Rach Hung Nhon K4+079
K5+356 K5+356
Bridge over Rach Cau Kinh K6+256
K7+883 K7+883
Bridge over Rach Ba Mien K27+283
Bridge over Rach Dat Set K27+825
Bridge overa Rach Cau Mat K30+168
Bridge over Rach Cau Van K31+266
2.3.3. Subcomponent 2.3 - Selected storm and waste water systems in Go Vap District
Location: Location of the drainaige culvert system: Along the right bank of Tham Luong – Ben
Cat canal, in the defined width of the technical border (BKT) : 20.0 m counting from the edge of
the canal, and filling the ground by sand for construction road later (with the clearance border of
20 m which had been carried out in stage 1 of the project on drainage and pollution improvement
for Tham Luong – Ben Cat – Nuoc Len.
- Starting point of the drain: Cho Cau bridge - Go Vap District (K0 (m));
- Ending point of the drain: Collecting wells of the waste water treatment plan at An Phu Dong
ward, District 12 ( K0+9.073 (m)).

Environmental and Social Impact Assessment, HCMC Steering Center of the Urban
and Environmental and Social Management Plan Flood Control Program
Proposed HCMC Flood Risk Management Project Date Submitted: December 2, 2015
33
Figure 2.7 Administrative map of Go Vap and Binh Thanh District and project‘s border.
Main technical solutions: A 9km-of-length main interceptor will be constructed to cover
1,772ha in Go Vap district. The interceptor will follow the alignment of the main canal. This
main interceptor will be a deep gravity sewer which will convey the diverted wastewater flows to
the Vam Thuat waste water treatment facility to be constructed by the city. It will be constructed
of precast reinforced concrete pipe sections installed by pipe jacking. The main interceptor will
receive wastewater and rainwater from the primary and secondary combined storm water and
sewer systems to be built in Go Vap district below.
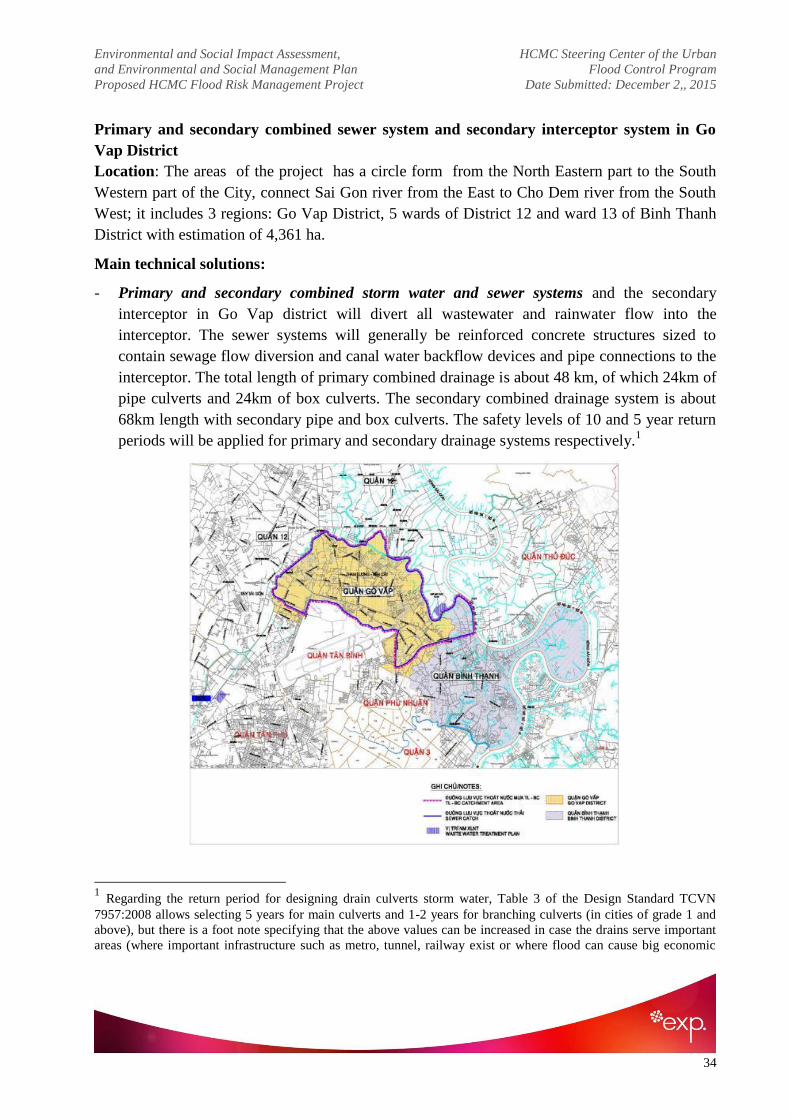
Environmental and Social Impact Assessment, HCMC Steering Center of the Urban
and Environmental and Social Management Plan Flood Control Program
Proposed HCMC Flood Risk Management Project Date Submitted: December 2,, 2015
34
Primary and secondary combined sewer system and secondary interceptor system in Go
Vap District
Location: The areas of the project has a circle form from the North Eastern part to the South
Western part of the City, connect Sai Gon river from the East to Cho Dem river from the South
West; it includes 3 regions: Go Vap District, 5 wards of District 12 and ward 13 of Binh Thanh
District with estimation of 4,361 ha.
Main technical solutions:
- Primary and secondary combined storm water and sewer systems and the secondary
interceptor in Go Vap district will divert all wastewater and rainwater flow into the
interceptor. The sewer systems will generally be reinforced concrete structures sized to
contain sewage flow diversion and canal water backflow devices and pipe connections to the
interceptor. The total length of primary combined drainage is about 48 km, of which 24km of
pipe culverts and 24km of box culverts. The secondary combined drainage system is about
68km length with secondary pipe and box culverts. The safety levels of 10 and 5 year return
periods will be applied for primary and secondary drainage systems respectively.1
1 Regarding the return period for designing drain culverts storm water, Table 3 of the Design Standard TCVN
7957:2008 allows selecting 5 years for main culverts and 1-2 years for branching culverts (in cities of grade 1 and
above), but there is a foot note specifying that the above values can be increased in case the drains serve important
areas (where important infrastructure such as metro, tunnel, railway exist or where flood can cause big economic

Environmental and Social Impact Assessment, HCMC Steering Center of the Urban
and Environmental and Social Management Plan Flood Control Program
Proposed HCMC Flood Risk Management Project Date Submitted: December 2,, 2015
35
Figure 2.8 Rain and waste water collection area I.
- Approach for water discharge at the sub-region II (includings 05 ward of District
12):Construction the separated drainage for rain water to discharge into the canal, and sewer
system for wastewater to flow into WWTP at An Phu Dong ward, District 12.
Figure 2.9 Rain and waste water collection area II.
2.3.4. Sub-Component 2.4 - Secondary canals improvements
Location
These secondary canals are connected to Tham Luong - Ben Cat - Nuoc Len main canal to drain
for the basin belongs to Go Vap and Tan Binh district. In combination with the main canal, these
secondary canals ensure drainage, tide prevention, water storing and regulating the water level in
the canals.
Main technical solutions: A total of 6.9km secondary canals system, including Hy Vong, Chin
Xieng, Ba Mieng, Ong Tong, and Ong Bau connected to main canal of Tham Luong – Ben Cat –
Rach Nuoc Len will be upgraded at the safety level of 10-year return period to reduce the
pollution with sewage water and improve the rainwater drainage capacity of about 1,000ha in Go
Vap, Binh Thanh and Tan Binh districts. Especially, flooding problem in Tan Son Nhat
International Airport will be completely addressed..
- For the secondary canals which have the existing small width, high bottom elevation, and
being polluted (usually, they are the first sections in the residential area): replacing secondary

Environmental and Social Impact Assessment, HCMC Steering Center of the Urban
and Environmental and Social Management Plan Flood Control Program
Proposed HCMC Flood Risk Management Project Date Submitted: December 2,, 2015
36
canal with box culverts with dimensions from (1.6m x 1.6m) to (3.0m x 3.0m), backfilled
with planting soil , and sidewalks are constructed along both sides.
- For the secondary canals which have the existing small width, medium bottom elevation, and
good soil condition: designing Reinforced Concrete (RC) open canals with rectangular
shape/trapezoid shape, and sidewalks are constructed along both sides.
- For the secondary canals which have the existing large width, and weak soil condition
(usually, they are the last sections closed to Tham Luong - Ben Cat - Nuoc Len main canal):
designing open canals with rectangular shape reinforced by pre-stressed RC piles, and
sidewalks are constructed along both sides.

Environmental and Social Impact Assessment, HCMC Steering Center of the Urban
and Environmental and Social Management Plan Flood Control Program
Proposed HCMC Flood Risk Management Project Date Submitted: December 2, 2015
37
Table 2.5 Technical parameters of canals
No Names of canal Section Bđ (m) Zbottom m Road
Notes B (m) Z (m)
1 Hy Vong
K0 ÷ K0+600 4.0 2.35÷2.15 0.00 2.50 +6.0 ÷ +5.4 Open canal-
reinforced Concrete
K600 ÷ K1+674 6.0÷7.5 2.15÷-1.58 0.00 2.50 +5.4 ÷ +2.5 Open canal
reinforced Concrete
K1+674 ÷ K1+821,5 10.0 -1.58÷-2.0 0.00 2.50 +2.50 pre-stressed pile
2
Chin Xieng
(Cau Van)
K0 ÷ K0+138 2.0x2.0 -0.50÷-1.15 rectangular
shaped 2.50 +2.00
rectangular shaped canal -
reinforced Concrete
K0+138 ÷K0+978 10÷18 -1.15÷-1.96 0.00 2.50 +2.00 pre-stressed pile
Chin Xieng sub-creek K0+32,2 ÷ K0+165 2.0x2.0 -0.80÷-0.90 rectangular
shaped 2.50 +2.00
rectangular shaped canal -
reinforced Concrete
3 Ong Tong + Branch 3
of Ong Tong sub-
creek
(Hai Vit creeek)
K0 ÷ K0+235 2.5x2.5 -1.00÷-1.18 rectangular
shaped 2.50 +2.00
rectangular shaped canal -
reinforced Concrete

Environmental and Social Impact Assessment, HCMC Steering Center of the Urban
and Environmental and Social Management Plan Flood Control Program
Proposed HCMC Flood Risk Management Project Date Submitted: December 2, 2015
38
No Names of canal Section Bđ (m) Zbottom m Road Notes
K0+235÷ K0+810,3 26÷35 -1.2÷-1.25 0 2.50 +2.00 pre-stressed pile
Ong Tong creek
(Dua creek)
K0 ÷ K0+200 2.0x2.0 -0.50÷-0.80 rectangular
shaped 2.50 +2.00
rectangular shaped canal -
reinforced Concrete
K0+200÷ K0+920 15÷36 -0.88÷-1.09 0 2.50 +2.00 pre-stressed pile
4 Ba Mieng
K0+160 ÷ K0+759 2.0x2.0 7.51÷2.0 rectangular
shaped 2.50 +5.3÷+11.47
rectangular shaped canal -
reinforced Concrete K0+759÷ K1+236 2x(2x2) 2.01÷1.57
rectangular
shaped 2.50 +2.00÷+5.0
K1+236÷ K1+741,8 14÷33 -1.76÷-1.90 0 2.50 +2.00 pre-stressed pile
5 Cau Cut
K0 ÷ K0+600 3.0 -0.80÷-1.03 0 2.50 +2.00 rectangular shaped open
canal-
reinforced Concrete
K0+600÷K0+940 5.0 -0.87÷-1.06 0 2.50 +2.00
K0+940÷K0+969 8,0 -1.06 0 2.50 Cau Cut
K0+969÷K1+274 17÷32 -1.06÷-2.86 0 2.50 +2.00 pre-stressed pile
6
Ong Bau creek K0+016 ÷ K0+426 1.6x2.0 -0.65÷-0.03 rectangular
shaped 2.50 +2.00
rectangular shaped canal -
reinforced Concrete
Ong Bau sub-creek K0 ÷ K0+125 1.6x1.6 -0.51÷-0.26 rectangular
shaped 2.50 +2.00
rectangular shaped canal -
reinforced Concrete

Package FRM-PPTAF 02: Environmental and Social Impact Assessment, HCMC Steering Center of the Urban
and Environmental and Social Management Plan Flood Control Program
Project Number: VNWC-00227753-A0 Date Submitted: November 27th
, 2015
40
It is to be noted that Component 2 will likely to finance detail design and feasibility studies, the
scope of which will be determined during the implementation phase. The provisions of the ESIA
will apply to detail design and feasibility studies and that the Terms of ToRs for these technical
documents will require that the studies take in consideration Bank safeguard policies provisions
when developed.
2.4. Project area of influence
From the point of view of the environmental and social assessment of a project, it is important to
define the area for that environmental and social impacts are being considered. Regarding to the
OP 4.01, Area of Influence for this project will identified to include ―all its ancillary aspects,
such as power transmission corridors, pipelines, canals, tunnels, relocation and access roads,
borrow and disposal areas, and construction camps, as well as unplanned developments induced
by the project (e.g., spontaneous settlement, logging, or shiftin g agriculture along access
roads).
On the other words, the area of influence may include, for example, “(i) the watershed within
which the project is located; (ii) any affected estuary and coastal zone; (iii) off-site areas
required for resettlement or compensatory tracts; (iv ) the airshed (e.g., where airborne
pollution such as smoke or dust may enter or leave the area of influence); (v) migratory routes of
humans, wildlife, or fish, particularly where they relate to public health, economic activities, or
environmental conservation; and (vi) areas used for livelihood activities (hunting, fishing,
grazing, gathering, agriculture, etc.) or religious or ceremonial purposes of a customary
nature”.
The area that needs to be studied in order to adequately understand and describe the Baseline
likely to be affected by the Project. At a minimum, the Study Area will encompass the Project
Footprint and the Area of Influence, and in some cases it may extend farther to further establish
the context for the Baseline.
With such definition and basing on the project description, the study area in this ESIA covers
32.7 km length of Tham Luong – Ben Cat – Nuoc Len, covering an area of about 14,900 ha,
where 9 districts in HCMC will be affected, including Go Vap District, Binh Thanh District,
District 12, Tan Binh District, Binh Tan District, Tan Phu District, District 8, Binh Chanh
District and Hoc Mon Distric. In addition to those area, Da Phuoc landfill and Tham Luong Ben
Cat Wastewater treatment plant are also identified within the studied area as employed as
disposal area for wastewater and dregged sludge and other waste types generated from
construction and operation activities of the project as disposal area for wastewater and dregged
sludge and other waste types generated from construction and operation activities of the project.
In addition, the area of influence also include the borrow pits for revertment and tour for material
transportation.
The sub-components will be undertaken at different locations along the Tham Luong Ben Cat
Nuoc Len Canal, where different sensitive receptors will be affected. In order to assess the

Package FRM-PPTAF 02: Environmental and Social Impact Assessment, HCMC Steering Center of the Urban
and Environmental and Social Management Plan Flood Control Program
Project Number: VNWC-00227753-A0 Date Submitted: November 27th
, 2015
41
significane of impacts on receptors, the environmental baseline at those receptors need to be
identified given the baseline environment will integrate with emission factors generated from
project activities that can result a top up impacts on the receptors. Section 2.3 already provides
the locations of environmental survey and those locations can be considered as sensitive
receptors that can be receive different impacts from different activities of the project
components. Table 2.6 identify sensitive receptors in a relation to activities of project component
and locations of environmental baseline survey.

Environmental and Social Impact Assessment, HCMC Steering Center of the Urban
and Environmental and Social Management Plan Flood Control Program
Proposed HCMC Flood Risk Management Project Date Submitted: December 2, 2015
42
Table 2.6 Sensitive receptors in a relation to activities of sub-components and locations of environmental baseline survey
No Sub-components Locations Potential impacts
Receptors Sensitivities
Air
quality Water quality
Groundw
ater Soil Aquatic Ecology
1
Construction of
Nuoc Len tidal
sluice gate and 2
ship locks
At Nuoc len creek, located
between Nuoc Len bridge and
An Lac bridge, being of 158m
from Nuoc Len bridge
Air quality, water
quality, water
quality, noise and
vibration and
aquatic ecology
K9, K10,
K11
SW10, SW9,
Cho Dem
River
GW8,
GW9 -
Se9, Se10, Cho
Dem River
2
Construction of
Vam Thuat tidal
sluice gate and 2
ship locks
At Vam Thuat River, located
between Vam Thuat bridge
and Tham Luong Ben Cat
Wastewater Treatment Plant,
being of 178m from Vam
Thuat birdge
Air quality, water
quality, water
quality, noise and
vibration and
aquatic ecology
K1, K2,
K3
SW1, SW2,
SW3, Sai Gon
River
GW1 S8 Se1, Se2, Se3, Sai
Gon River
3
Dredging and
construction of
canal bank
revetment in the
main canal of
Tham Luong – Ben
Cat – Nuoc Len
Undertaken on an area of
14,899 ha, covering following
districts: Go Vap, Binh Thanh,
District 12, Tan Binh District,
Binh Tan District, Tan Phu
Disitrct, District 8, Binh
Chanh District, Hoc Mon
District
Air quality, water
quality, water
quality, noise and
vibration and
aquatic ecology
K1, K2,
K3, K4,
K5, K6,
K7, K8,
K9, K10,
K11
SW1, SW2,
SW3, SW4,
SW5, SW6,
SW7, SW8,
SW9, SW10,
Sai Gon River,
Cho Dem
River
GW1,
GW2,
GW3,
GW4,
GW5,
GW6,
GW7,
GW8,
GW9
S1, S2,
S3, S4,
S5, S6,
S7, S8
Se1, Se2, Se3, Se4,
Se5, Se6, Se7, Se8,
Se9, Se10, Cho
Dem River, Sai
Gon River
4 Construction of Main interceptor is constructed Air quality, water K1, K2, SW1, SW2, GW1, S3, S4, Se1, Se2, Se3, Se4,

Environmental and Social Impact Assessment, HCMC Steering Center of the Urban
and Environmental and Social Management Plan Flood Control Program
Proposed HCMC Flood Risk Management Project Date Submitted: December 2, 2015
43
main interceptor in
Go Vap district
along Tham Luong - Ben Cat -
Nuoc Len Canal. The
interceptor will collect
wastewater generated from a
catchment being of area of
1,902 ha where 16 wards of
Go Vap District and Ward 13
in Binh Thanh District are
covered.
quality, water
quality, noise and
vibration and
aquatic ecology
K3, K5,
K6
SW3, SW4,
SW5, SW6,
SW7, SW8,
SW9, SW10,
Cho Dem
River, Sai Gon
River
GW2,
GW3
S5, S6,
S7, S8
Se5, Se6, Se7, Se8,
Se9, Se10, Cho
Dem River, Sai
Gon River
5
Construction and
improvement of
primary and
secondary
combined sewer
systems and the
secondary
interceptor in Go
Vap district
The project will be undertaken
on an area of 5 wards of
District 12, 16 wards of Go
Vap District, and ward 13 of
Binh Thanh District
Air quality, water
quality, water
quality, noise and
vibration and
aquatic ecology
K1, K2,
K3, K4,
K5, K6
SW1, SW2,
SW3, SW4,
SW5, SW6,
SW7, SW8,
SW9, SW10,
Cho Dem
River, Sai Gon
River
GW1,
GW2,
GW3
S3, S4,
S5, S6,
S7, S8
Se1, Se2, Se3, Se4,
Se5, Se6, Se7, Se8,
Se9, Se10, Cho
Dem River, Sai
Gon River
6
Improvement of
secondary canals
(Hy Vong, Cau
Cut, Ba Mieng,
Ong Tong, Ong
Bau, Chin Xieng)
Including six distributary canal
conecting to Tham Luong Ben
Cat Nuoc len Canal at Tan
Binh District and Go Vap
District, from Tham Luong
bridge to Sai Gon River, with
total length of 8,213.4
Air quality, water
quality, water
quality, noise and
vibration and
aquatic ecology
K1, K2,
K3, K4,
K5, K6,
K7
SW1, SW2,
SW3, SW4,
SW5, SW6,
SW7, SW8,
SW9, SW10,
Cho Dem
River, Sai Gon
River
GW1,
GW2,
GW3,
GW4
S1, S2,
S3, S4,
S5, S6,
S7, S8
Se1, Se2, Se3, Se4,
Se5, Se6, Se7, Se8,
Se9, Se10, Cho
Dem River, Sai
Gon River

Environmental and Social Impact Assessment, HCMC Steering Center of the Urban
and Environmental and Social Management Plan Flood Control Program
Proposed HCMC Flood Risk Management Project Date Submitted: December 2, 2015
44
2.5. Linked Investments
The EIAs conducted a thorough review of other, large completed, ongoing or planned
investments in the project cities to identify possible linkages impacts. Details of linked project
are shown in Annex 6. Following linked projects has been identified, including Da Phuoc Solid
Waste Treatment Complex, Tham Luong Ben Cat Wastewater Treatment Plan.
Da Phuoc Solid Waste Treatment Complex
The Da Phuoc Solid Waste Treatment Complex near Ho Chi Minh City is Vietnam‘s largest
solid waste processing complex. It is located in Da Phuoc Commune, Binh Chanh District, Ho
Chi Minh City. Total area of the complex is 128.22 ha, including Waste Treatment Company
(128 ha) treating municipal waste; Peace Company‘s Project managingseptic tanks sludge;
Urban Environmental Company‘s Project investing in cemetery estate and cremated services
(about 57 ha); the Green Saigon‘s company responsible for wastewater sludge treatment (47
ha) and a planned investment for hazardous waste treatment (1.7 ha).
Solid waste generated by project construction and operation, including domestic waste, dredging
sludge, construction and hazardous waste, will be disposed at the Waste Treatment Company.
Regarding to EIA approved in 2011, the Waste Treatment Company is designed to treat 3,000
tons of municipal solid waste per day. Currently, this capacity is upgraded to 10,000 tons of
municipal solid waste per day; EIA for this upgrade was approved in 2015, This capacity
designed allows the Complex to collect whole domestic solid waste generated from Ho Chi Minh
City and to partly collect the solid waste generated from Long An Province.
For dredged sludge, a first extension of Da Phuoc Landfill capacity is planned for 2018 (capacity
up to 2,600m3/day). By 2020 the Da Phuoc Landfill capacity shall be sufficient to receive
stabilized and dewatered (composted) sludge (with a maximum daily capacity of 5,200) (See
Table 2.7).
Table 2.7 Capacity of receiving and treating sludge
No.
Type of waste
Da Phuoc Sludge Treatment Plant
capacity (m3/day)
Construction phase 1
(2014 -2016)
Construction phase 2
(2017 -2020)
1 Sludge from drainage system 800 800
2 Sludge from channel dredging 800.6 1700
3 Sludge from other sources (incl sludge
from WWTPs) 500 2,200
4 Excreta from livestock and poultry 50 50
5 Sludge from septic tanks 450 450
Total capacity 2,600.6 5,200
The Complex linked to the project component 2 through receiving the dredged sludge and
construction and domestic solid waste generated from activities of construction and operation
stage of sub-components of the project. In addition to 500 m3 per day of the Binh Hung

Environmental and Social Impact Assessment, HCMC Steering Center of the Urban
and Environmental and Social Management Plan Flood Control Program
Proposed HCMC Flood Risk Management Project Date Submitted: December 2, 2015
45
WWTP‘s sludge and dredging sludge (and excavated materials) from Tan Hao-Lo Gom Canal
(WB project), the dredging sludge of XXX tons generated from the project component 2 should
be acceptable with the current and planning capacity of the Waste Treatment Company.
The Waste Treatment Company design the landfill to include main facilities as follow: (i)
spaced vertical wells to collect the biogas that is flared then; (ii) landfill cells equipped with
HDPE layer and geomembrane and collection pipe network of leachate wastewater; (iii) the
wastewater treatment plan to treat leachate wastewater and storm runoff wastewater. Operation
methods of the landfill is
The operation of the Da Phuoc landfill is monitored by the Management Board of Waste
Treatment Complexes (MBS) under DONRE in HCMC.Two specialists from MBS are
inspecting the landfill activity daily in line with the landfill managementplan.The MBS has the
mandate to carry out periodical environmental quality monitoring for surface water,
groundwater and air quality every 3 months.
Tham Luong Ben Cat Wastewater Treatment Plan
Tham Luong Ben Cat Wastewater Treatment Plan is designed to collected domestic wastewater
generated from a catchment of 5,141 ha of District 12, Go Vap District and Binh Thanh District.
It is located at An Phu Dong Ward, District 12, Ho Chi Minh City. Wastewater from the
beneficiary areas of the FRM project, especially GO vap District and Bin Thanh District, will be
collected and pumped to the Tham Luong Ben Cat wastewater treatment plant for treatment.
Following completion, this WWTP will have positive contribution to reduce the pollutants of
Tham Luong Ben Cat Canal.
Total capacity of the WWTP is 250,000 m3 per day, divided into two phases, in which 131,000
m3 per day for phase 1 and upgrading to 250,000 m
3 per day for phase 2. The EIA of the phase 1
was approved by the local authority (DONRE) of Ho Chi Minh City in 2015. The phase 1 of
project is now under construction and expected to complete at the end of 2016. The WWTP is
designed with a technology of Sequencing Batch Reactor (SBR), which is ensured to have
optimal performance by the pretreatment and tertiary treatment units. The wastewater followed
treatment meets the standards of QCVN 40:2011/BTNMT, column A. The downstream of Vam
Thuat River which is also identified as a section of Tham Luong Ben Cat Nuoc Len Canal is
designed as a receiving stream of the WWTP.
As mentioned above, the construction duration of phase 1 of this WWTP is extended from May
2015 to December 2016. If the project component 2 is launched this year, the cumulative impacts
caused from construction activities of two projects are possible. During operation, if being
operated inappropriately, the wastewater treatment plant is able to contribute the negative
cumulative impacts to the water quality of Tham Luong Ben Cat Nuoc Len Canal.
In summary, considerable information is available on possibly linked projects. All of the
potential linkages are likely to have positive impacts, such as Tham Luong Ben Cat WWTP
receiving and treating wastewater generated from a catchment of three districts before discharge
to the Tham Luong Ben Cat Nuoc Len Canal. The potential cumulative impacts caused by the

Environmental and Social Impact Assessment, HCMC Steering Center of the Urban
and Environmental and Social Management Plan Flood Control Program
Proposed HCMC Flood Risk Management Project Date Submitted: December 2, 2015
46
operation performance of those projects, can be managed with coordination of schedules at the
city level, and good construction and operation management during implementation.

Environmental and Social Impact Assessment, HCMC Steering Center of the Urban
and Environmental and Social Management Plan Flood Control Program
Proposed HCMC Flood Risk Management Project Date Submitted: December 2, 2015
47
CHAPTER 3: EXISTING CONDITIONS OF SOCIO-ECONOMIC
AND ENVIRONMENTAL BASELINE IN PROJECT AREA
3.1. Natural and socio-economic conditions of Ho Chi Minh City
3.1.1. Natural conditions
a) Location and topography
Ho Chi Minh City is located at 10°10'- 10°38'N, 106°22'- 106°54'E in the southeastern region of
Vietnam. It borders Binh Duong province to the north, Tay Ninh province to the north west,
Dong Nai province to the East and North East, Ba Ria – Vung Tau province to the south east,
and Long An and Tien Giang provinces to the west and south west. Ho Chi Minh City is 1,760
km south of Hanoi, the capital of Vietnam and is at the crossroads of international maritime
routes. The city center is 50km from the East Sea in a straight line. It is an international transport
hub of the southern region and a gateway to the world with the largest port system and airport in
Vietnam.
Ho Chi Minh City belongs to a transitional region between the southeastern and Mekong Delta
regions. The general topography is that HCM City terrain gets lower from north to south and
from east to west. There are three types of terrain.
The high terrain lies in the north-northeastern area and part of the northwestern area
encompassing northern Cu Chi, northeastern Thu Duc and District 9. This is the bending terrain
with average height of 10-25 meters. Long Binh Hill in District 9 is the highest at 32 meters.
The depression terrain lies in the southern-southwestern and southeastern part encompassing
districts 9, 8, 7, Binh Chanh, Nha Be and Can Gio. The area‘s height is in the range of 0.5 to 2
meters.
The medium-height terrain lies in the middle of the city, encompassing most old residential
areas, part of districts 2 and Thu Duc, and the whole of districts 12 and Hoc Mon. The area‘s
height is 5-10 metres.
Ho Chi Minh City has four poles, namely:
• North Pole as Phu My Hung Commune, Cu Chi District;
• West Pole as Thai My Commune, Cu Chi District;
• Sounthern Pole as Long Hoa Commune, Can Gio District;
• East Pole as Thanh An commune, Can Gio District.
b) Hydrology
Located in the downstream Dong Nai – Saigon river system, Ho Chi Minh City has a developed
network of rivers and canals. Dong Nai River originates from the plateau Langbiang (Dalat). As
it has many tributaries such as La Nga River and Be River, the basin is large, approximately

Environmental and Social Impact Assessment, HCMC Steering Center of the Urban
and Environmental and Social Management Plan Flood Control Program
Proposed HCMC Flood Risk Management Project Date Submitted: December 2, 2015
48
45,000 km2. It has an average flow of 20-500 m3/s with the highest flow during flood of up to
10,000 m3/s. Dong Nai – Saigon river system is the main supply of fresh water for Ho Chi Minh
City with an annual capacity of 15 billion m3. Saigon River originates from Hon Quan plateau,
flowing over 200 km from Thu Dau Mot to the city and flows 80 km along the city area. Saigon
river has many tributaries with an average flow of about 54 m3/s.
Width of Saigon River is 225-370 m and the depth is up to 20 m. Dong Nai River and Saigon
River are connected through the expanded urban part by Rach Chiec canal system. Nha Be River
formed by the confluence of Dong Nai and Saigon rivers, about 5km away from the city center
to the southeast. It flows to the sea through two main estuaries: Soai Rap of 59km in length, 2km
in width with dry riverbeds and slow flow rate; Long Tau flowing out to Ganh Rai Bay with
56km in length, 0.5km in width and deep riverbed, and being the main waterway for ships to
enter Saigon harbor.
In addition to the main rivers, the city also has a complicated network of canals, such as the
Saigon River system with Lang The canal, Nong Bau canal, Tra canal, Ben Cat, An Ha, Tham
Luong, Cau Bong, Nhieu Loc-Thi Nghe, Ben Nghe, Lo Gom, Te canal, Tau Hu, Doi canal. The
southern part of the city in the districts of Nha B and Can Gio has a dense canal coverage. This,
togetherwith level 3-4 canal system of Eastern Cu Chi and An Ha, and Xang canals in Binh
Chanh makes effective irrigation and favorable water exchange. The city government has also
gradually implemented projects of dredging and innovation of catchment areasto create a
beautiful urban water landscape. .
Groundwater in Ho Chi Minh City is mostly concentrated in the northern half - on sediment
Pleixtoxen; more to the south (South Binh Chanh District 7, Nha Be, Can Gio) - on Holoxen,
groundwater is often affected by acidity and salinity.
Most parts of the former urban area have significant underground water resources of which
quality is not very good. However, in this area, groundwater is often exploited in three main
levels: 0-20m, 60-90m and 170-200m. Districts 12, Hoc Mon and Cu Chi underground water
reserves are abundant with good quality and usually operated at 60-90m level. This is an
important additional water source of the city.
Hydrologically, most rivers Ho Chi Minh City are affected by semi-daily tidal oscillations of the
East Sea. Each day, the water up and down twice, the tide penetrates deeply into the city's
waterways accordingly, causing significant impacts on agricultural production and limit the
drainage in urban areas.
The highest average tide is 1.10m. Months with the highest water level are October and
November and the lowest level shall be in June & July. During the dry season, the small flow of
river source with salinity of 4% may penetrate along Saigon River to Lai Thieu (Thuan An, Binh
Duong province) , sometimes ever reaching far to Thu Dau Mot while Dong Nai River seep into
Long Dai (District 9). The rainy season with large flow rate makes salinity pushed further away
and more diluted.

Environmental and Social Impact Assessment, HCMC Steering Center of the Urban
and Environmental and Social Management Plan Flood Control Program
Proposed HCMC Flood Risk Management Project Date Submitted: December 2, 2015
49
Figure 3.1 Map showing main river systems in Ho Chi Minh City.
Since the establishment of irrigation projects such as Tri An hydroelectric dam on the Dong Nai
River in Vinh Cuu, Dong Nai and Dau Tieng Lake in Tay Ninh province, the natural flow
regime is modified by turbineswitches turbine, weirs and close-discharge sluices. Therefore, the
downstream area from Northern Nha Be upwwards become influenced by the upstream with
lower salinity level. The flow rate in the dry season tends to increase, especially during the
months from February to May, by 3-6 times compared to the natural one.
In the rainy season, water is retained in the reservoir to regulate, reducing possibility of flooding
to low-lying areas; whereas, saltwater intrusion goes deeper again. However, in general, crop
area has been expanded by increasing the cultivated crops. In addition, the development of the
canal system has the effect of raising groundwater levels on the surface to 2-3m, increasing
water supplies to serve production and daily life of the city.
c) Climate - Weather
Ho Chi Minh City is located in the equatorial monsoon tropical region. As in southern provinces,
the general characteristics of HCMC climate-weather temperature is evenly high year around
with two clear rainy and dry seasons , which impacts profoundly to the area environment. The
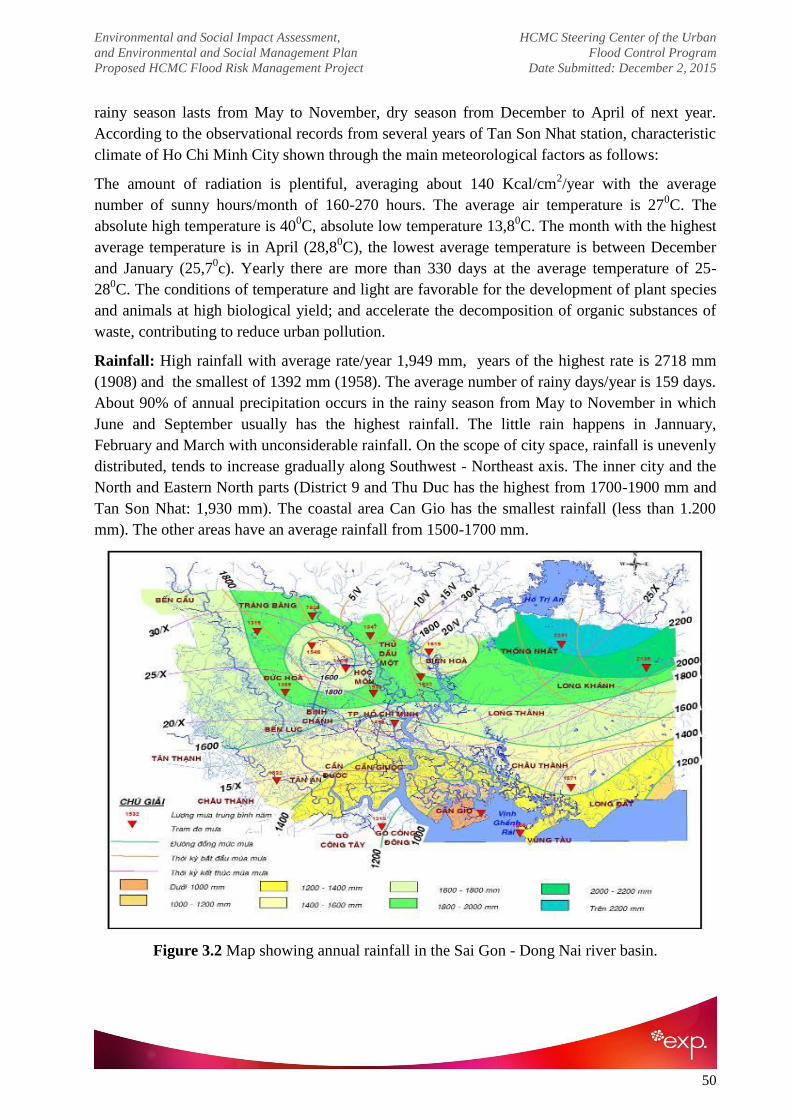
Environmental and Social Impact Assessment, HCMC Steering Center of the Urban
and Environmental and Social Management Plan Flood Control Program
Proposed HCMC Flood Risk Management Project Date Submitted: December 2, 2015
50
rainy season lasts from May to November, dry season from December to April of next year.
According to the observational records from several years of Tan Son Nhat station, characteristic
climate of Ho Chi Minh City shown through the main meteorological factors as follows:
The amount of radiation is plentiful, averaging about 140 Kcal/cm2/year with the average
number of sunny hours/month of 160-270 hours. The average air temperature is 270C. The
absolute high temperature is 400C, absolute low temperature 13,8
0C. The month with the highest
average temperature is in April (28,80C), the lowest average temperature is between December
and January (25,70c). Yearly there are more than 330 days at the average temperature of 25-
280C. The conditions of temperature and light are favorable for the development of plant species
and animals at high biological yield; and accelerate the decomposition of organic substances of
waste, contributing to reduce urban pollution.
Rainfall: High rainfall with average rate/year 1,949 mm, years of the highest rate is 2718 mm
(1908) and the smallest of 1392 mm (1958). The average number of rainy days/year is 159 days.
About 90% of annual precipitation occurs in the rainy season from May to November in which
June and September usually has the highest rainfall. The little rain happens in Jannuary,
February and March with unconsiderable rainfall. On the scope of city space, rainfall is unevenly
distributed, tends to increase gradually along Southwest - Northeast axis. The inner city and the
North and Eastern North parts (District 9 and Thu Duc has the highest from 1700-1900 mm and
Tan Son Nhat: 1,930 mm). The coastal area Can Gio has the smallest rainfall (less than 1.200
mm). The other areas have an average rainfall from 1500-1700 mm.
Figure 3.2 Map showing annual rainfall in the Sai Gon - Dong Nai river basin.

Environmental and Social Impact Assessment, HCMC Steering Center of the Urban
and Environmental and Social Management Plan Flood Control Program
Proposed HCMC Flood Risk Management Project Date Submitted: December 2, 2015
51
Due to the influence of the South-West monsoon direction - the major cause of rain in the area,
the annual rainfall also fluctuate significantly. The variation of monthly rainfall is quite large as
well. Due to larger and fairly steady rainfall over the years in the middle months of the rainy
season, the Cv coefficient is only about 0.3 ÷ 0.6, which, in which August and September are the
months with overall steady rainfall. The fluctuation is larger during the first and the last month of
the rainy season, with Cv reaching 0.5 ÷ 41.0. In the dry season, as rain is negligible, just a
heavy rain of 100 mm can cause huge volatility. The coefficient of skew Cs ranges from Cv to
2Cv.
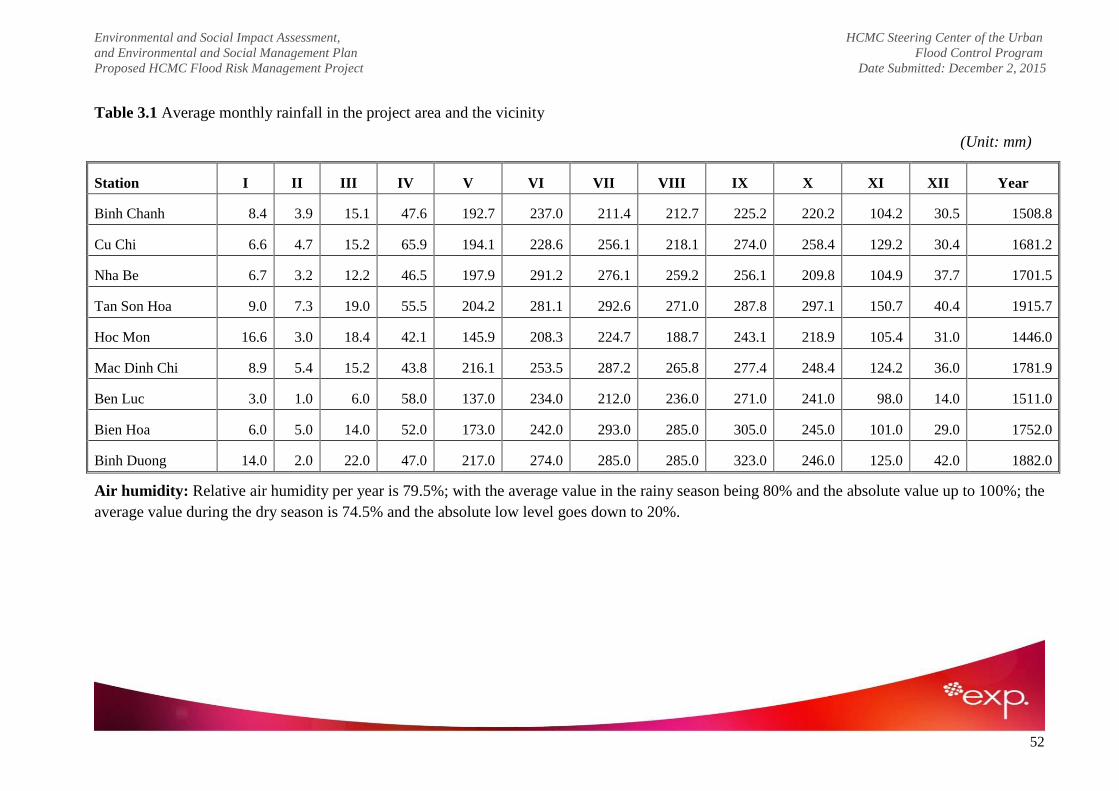
Environmental and Social Impact Assessment, HCMC Steering Center of the Urban
and Environmental and Social Management Plan Flood Control Program
Proposed HCMC Flood Risk Management Project Date Submitted: December 2, 2015
52
Table 3.1 Average monthly rainfall in the project area and the vicinity
(Unit: mm)
Station I II III IV V VI VII VIII IX X XI XII Year
Binh Chanh 8.4 3.9 15.1 47.6 192.7 237.0 211.4 212.7 225.2 220.2 104.2 30.5 1508.8
Cu Chi 6.6 4.7 15.2 65.9 194.1 228.6 256.1 218.1 274.0 258.4 129.2 30.4 1681.2
Nha Be 6.7 3.2 12.2 46.5 197.9 291.2 276.1 259.2 256.1 209.8 104.9 37.7 1701.5
Tan Son Hoa 9.0 7.3 19.0 55.5 204.2 281.1 292.6 271.0 287.8 297.1 150.7 40.4 1915.7
Hoc Mon 16.6 3.0 18.4 42.1 145.9 208.3 224.7 188.7 243.1 218.9 105.4 31.0 1446.0
Mac Dinh Chi 8.9 5.4 15.2 43.8 216.1 253.5 287.2 265.8 277.4 248.4 124.2 36.0 1781.9
Ben Luc 3.0 1.0 6.0 58.0 137.0 234.0 212.0 236.0 271.0 241.0 98.0 14.0 1511.0
Bien Hoa 6.0 5.0 14.0 52.0 173.0 242.0 293.0 285.0 305.0 245.0 101.0 29.0 1752.0
Binh Duong 14.0 2.0 22.0 47.0 217.0 274.0 285.0 285.0 323.0 246.0 125.0 42.0 1882.0
Air humidity: Relative air humidity per year is 79.5%; with the average value in the rainy season being 80% and the absolute value up to 100%; the
average value during the dry season is 74.5% and the absolute low level goes down to 20%.

Environmental and Social Impact Assessment, HCMC Steering Center of the Urban
and Environmental and Social Management Plan Flood Control Program
Proposed HCMC Flood Risk Management Project Date Submitted: December 2, 2015
53
Wind: Ho Chi Minh City is affected by two main wind directions – West-Southwest and North-
Northeast. The West-Southwest wind blowing from the Indian Ocean in the rainy season,
between June to October, with an average speed of 3.6 m/s and the strongest wind in August
with an average speed of 4.5m/s. The North-northeast wind blowing from the South China Sea in
the dry season, roughly from November to February with an average speed of 2.4 m/s. In
addition, there are monsoon winds in the south-southeast direction between March to May with
an average speed of 3.7m/s. Basically, the city is in the hurricane free zone. In 1997, fluctuations
due to El-Nino phenomenon caused Typhoon No. 5, only mildly affecting Can Gio district.
d) Environment
Due to rapid population growth rate, old-fashioned infrastructure, low population awaress…, Ho
Chi Minh City is currently facing the problem of environmental pollution. Like other big cities in
the country, untreated wastewater discharged directly into canals and rivers becomes
increasingly popular. The amount of garbage in Ho Chi Minh City is up to 6000 tons per day,
among which a large portion of solid waste is not collected. Monitoring results in 2007 showed
that, compared with 2006, organic pollution increased by 2 to 4 times. Transport vehicles,
construction and production activities also contributes to air pollution. In the suburban areas, soil
is also contaminated due to pesticides from agricultural production. According to a report from
the Ho Chi Minh City Environment Protection Agency (HEPA) (2010), with a population of
nearly 8 million people, thousands of offices, schools and more than 8,000 large, medium and
small industrial parks, approximately 6000-6500 tons of urban solid wastes are discharged
daily, among which about 4900-5200 tonnes are collected by the waste treatment companies;
700-900 tonnes are recycled, and the remaining volume are discharged into canals and the
surrounding environment. The domestic solid wastes are estimated to be around 5500 tonnes per
day; industrial solid wastes 500 tonnes per day and hospital waste 20 tonnes per day. It is
estimated that in the upcoming years, the average amount of garbage will increase by 10% per
year.
Currently, most of the solid wastes in Ho Chi Minh City are collected and transported to the
landfill, including hazardous waste. The operation of all landfills is managed by a factory under
CITENCO. The whole system of classification of solid wastes into scrap and recycling is
privatized. Part of industrial solid wastes is collected, treated and recycled at some private
companies and small enterprises. Medical wastes are collected and processed by combustion in
Binh Hung Hoa. Landfill is the only technology used to process municipal solid wastes of Ho
Chi Minh City. The capacity of landfills in Ho Chi Minh City is as follows:
- Phuoc Hiep landfill: 3,200 tonnes per day (50 km from the city centre, closed in 2014);
- Go Cat landfill: 1,200 tonnes per day (16.5 km from the city centre);
- Dong Thanh site: 1,000 tonnes per day (receive cesspoolsonly);
- Da Phuoc Solid Waste Treatment Complex in Binh Chanh District: 5000 tonnes per day and
about to increase.
Environmental and Social Impact Assessment, HCMC Steering Center of the Urban
and Environmental and Social Management Plan Flood Control Program
Proposed HCMC Flood Risk Management Project Date Submitted: December 2, 2015
54
In the recent years, heavy flooding has become common in Ho Chi Minh City, especially during
the rainy season from June to November, and during high tides from September to December.
The causes of flooding include heavy rainfall, high tides, poor drainage systems in urban areas,
inadequate coordination between the operation of reservoirs and land subsidence from
groundwater pumping. Heavy precipitaion has gradually in the past few decades. The city
drainage system has been getting old with inadequate capacity for drainage in heavy
precipitation while drain system is still unavailable in many areas of the city. Urban Flooding
due heavy rains has therefore become popular.
Tidal flow from the East Sea have hindered the flow from upstream rivers and urban drainage
systems. In addition to the importance of improving the drainage capacity of sewer and canal
systems in central urban areas to deal with the frequent downpours, HCMC also faced with the
challenges posed by sea water intrusion into the canal system. This penetration make water level
in canals increase and clog the flow from the downtown area to Saigon River, especially during
high tide season.
In addition to rain and tide, flooding status of city is also affected by the discharge of water from
the upstream irrigation and hydropower reservoirs. In 2000, the city was seriously flooded due to
discharging flow from the Tri An reservoir (2,000 m3/s) and Dau Tieng (600 m3/s), which is on
Dong Nai river.. Besides, the city is also affected by the floods from Mekong River delta through
the Vam Co Dong and Vam Co Tay river system. City sewer system was only developed locally
with large untreated wastewater volume discharging into rivers causing severe pollution and
affecting water quality.
According to a feasibility study in 2012 for sub-basin including Tham Luong - Ben Cat – Nuoc
Len conducted by HCMC, flooding has become an annual event on the catchments that affected
5944 ha (40% of the total area of sub-basin) and about 700,000 people (35% of the population
living in sub-basin). The depth of flood is from 0.5m to 1.2m on average and flooding timeis
about 30 minutes to 150 minutes. In addition, the Hy Vong l canal linking to Tham Luong-Ben
Cat – Nuoc Len) which receives drain water from the Tan Son Nhat airport is now facing flood
situation need to be resolved soon.
Indeed, industrial production along Tham Luong canal is recognized as the most serious
pollution waste and one of factor cause its canal stream as a dead channel. Survey results in 2011
recored from the basin shows that wastewater volume from enterprises outside the Industrial
Zone is 30,000 - 40.000m3/day, including more than 2.4 tons of suspended solids. At the
Industrial Parks such as Tan Tao (Binh Tan District), Tan Binh (Tan Binh District), Vinh Loc A
(Binh Chanh District), Tan Thoi Hiep (District 12), total wastewater is more than
32.000m3/day. Even ifits water treatment system is up to standards, 6.4 of suspended sediment
are still being discharged into Tham Luong canal, not to mention tons of smoke and dust
emitted from loads of chimney of dyeing facilities owned by private sector and tons of garbage
and waste illegally dumped along the canal.
During past years, the impact of climate change and rising sea levels have flooded badly for
Environmental and Social Impact Assessment, HCMC Steering Center of the Urban
and Environmental and Social Management Plan Flood Control Program
Proposed HCMC Flood Risk Management Project Date Submitted: December 2, 2015
55
many regions of the world in general and Ho Chi Minh City area in particular has strongly
influenced on production and the people's life. The study with specific solutions to cope with
climate change issues is urgently critical with the joint hands of agencies and departments and
the whole society.
3.1.2. Socio-economic conditions
a) Economic development
Ho Chi Minh City always maintained an important role in Vietnam's economy. Thanks to
favorable natural conditions, Ho Chi Minh City became an important traffic hub of Vietnam and
Southeast Asia, including road, rail, waterways and air. Economic Social results of the City in
2011 has made remarkable achievements, the majority of society economic indicators has
exceeded the proposed plans. Gross domestic product (GDP) on the city territory in 2011 is
estimated at VND 512,721 billion, accounting 20.91% GDP of the whole country and 21.42%
increase compared to 2010.
The economy of the city is in diverse sectors, from mining, fisheries, agriculture, processing
industry, construction to tourism, finance. In the economic structure of the city, State-owned
sector accounts for 33.3%, Nonstate-owned accounting for 44.6% , the rest is foreign investment
sectors. Regarding economic sectors, services account for the highest proportion: 51.1%. The
rest of industry and construction accounted for 47.7%, agriculture, forestry and fisheries
accounted for only 1.2%.
In 2011, the value of industrial production and construction reached VND 228,332 billion,
accounting for 44.5% GDP of the whole city and increased 19.39% compared to 2010. The value of
agricultural, forestry and fisheries is VND 6,308 billion accounting for 1.20% the city GDP and
increased 23.73% compared to 2010. The value of tourism and services reached VND 278,408
billion, representing 54.3% GDP of the whole city and increased 25.44% year on year 2010.
In 2011, total investment of the city is estimated at VND 201,500 billion, increased by 18.5% year
over year; exceed 0.9% of the annual plan and by 39.3% of GDP. Total investment in capital
construction in the province is estimated at VND 164,042.6 billion, compared with previous year
increased by 18.42%.
b) Population
Nowadays Ho Chi Minh City comprises of 19 inner districts and 5 subsurban districts with a
total area of approximately 2,095.01 km2. Since 1975, the population of Ho Chi Minh City
increased rapidly, especially it cannot control the number of residents who illegally immigrated
to the city and built up houses indiscriminately. According to the statistics of the General
Statistics Office of Vietnam, as of 2012, the city's total population is nearly 7,750,900
headcount, population density reaches 3,699 persons/ km², in which population lives in cities
reached nearly 6,433,200 people, the population living in rural areas reached 1,317,700 million
people. Number of Male is 3,585,000 million people while females reach 3,936,100 million

Environmental and Social Impact Assessment, HCMC Steering Center of the Urban
and Environmental and Social Management Plan Flood Control Program
Proposed HCMC Flood Risk Management Project Date Submitted: December 2, 2015
56
people. The rate of natural increase of population allocated by province has increased by 7.4‰.
In recent decades, Ho Chi Minh City always has the lowest sex ratio of Vietnam; the flow of
migrants from other provinces into Ho Chi Minh City with number of women is always more
than men.
Table 3.2 Population Development of Ho Chi Minh City
Year Population Rate
1995
1996
1997
1998
1999
4.640.400
4.747.900
4.852.300
4.957.300
5.073.100
—
+2,3%
+2,2%
+2,2%
+2,3%
2000
2001
2002
2003
2004
5.274.900
5.454.000
5.619.400
5.809.100
6.007.600
+4.0%
+3.4%
+3.0%
+3.4%
+3.4%
2005
2006
2007
2008
2009
6.230.900
6.483.100
6.725.300
6.946.100
7.196.100
+3.7%
+4.0%
+3.7%
+3.3%
+3.6%
2010
2011
2012
2013
7.378.000
7.517.900
7.663.800
7.818.200
+2.5%
+1.9%
+1.9%
—
The population distribution in Ho Chi Minh City is uneven. While some inner districts such as 4,
5,10 and 11 have a density of over 40,000 people/km², the suburban district of Can Gio relatively
low density of 98 people/km² (by Vietnam GSO in 2009). Regarding the growth rate of
population, while the natural growth rate of approximately 1.07%, the mechanical growth rate
amounted to 2.5%. Immigration status in the city continues to grow in recent years. Since 1999
up to now, the population of 8 districts within the city is decreasing while the population of
surburban districts and newly-setup districts grew rapidly. The mechanical increase of the city's
population is going strongly and difficult to control as indicated in Binh Chanh: population
increasing per year was ever up to 30,000 people, equivalent to the population of one commune.
According to facts estimated in 2005, about 1 million of non-regular visitors arrived at Ho Chi
Minh per day on average. By 2010, this figure is estimated to be 2 million (by Ho Chi Minh City

Environmental and Social Impact Assessment, HCMC Steering Center of the Urban
and Environmental and Social Management Plan Flood Control Program
Proposed HCMC Flood Risk Management Project Date Submitted: December 2, 2015
57
Institute of Economics). Problems of urbanization and migration to cities is posing significant
challenges need to be addressed in the process of sustainable development of the city, of which
the most visible is the pressure from the population to public services and urban infrastructure.
3.2. Socio-economic conditions of the project area
3.2.1. Population and labor
The project area covers approximately 14,900 hectares (7% of the city area) with a population of
about 1,108,260 people (2007 statistics). Residential component mainly workers, employees,
retailers live in personal house or collective housing which were built scatteredly across the
region. In the wet season the flooded area is about 3,714 hectares and 232,700 people live in the
flooded areas (data from the feasibility study report).
Table 3.3 Administrative units and population in the Project area (2007)
No. District
Number
of
wards
Area
(ha)
Population
(persons)
Density
(person/ha) Note
1 District 12 10 3083.4 181.127 59
Only area
and
population
within the
Project
area
2 Go Vap 11 1915.7 313.798 161
3 Binh Thanh 01 14.2 19.624 138
4 Tan Binh 01 525.1 37.244 71
5 Tan Phu 07 1706.5 218.843 128
6 Binh Tan 10 1445.6 199.316 131
7 Binh Chanh 03 4589.1 29.670 7
8 Hoc Mon 05 1526.1 99.574 65
9 District 8 01 93.3 9.054 97
Total: 9 districts 49 14.899 1.108.250 74
The main income of households are mainly from salaries, accounting for 46.82%. Their
cccupations are mostly workers of factories and plants, part of them are state employees and
officials. However, this income source is not stable, depending on the season of plants and
factories‘ production...The highest percentage of households with incomes from salary is District
12, accounting for 57.14%, followed by Tan Binh District, accounting for 47.11% and Go Vap
District, accounting for 42.56%.
In addition, some households earn incomes from business operation, mainly from small
businesses like restaurants, groceries in the markets and schools and most of them leasing space
in other areas for business operation; income from this source accounting for 15.78%,

Environmental and Social Impact Assessment, HCMC Steering Center of the Urban
and Environmental and Social Management Plan Flood Control Program
Proposed HCMC Flood Risk Management Project Date Submitted: December 2, 2015
58
concentrates most in Go Vap District, accounting for 17.44% because residents located mostly
in canalside directly affected by the pollution, the percentage of households with income from
livestock , agriculture or gardening is very small .
The proportion of households with income from gardening is very low, accounting for 1.78%
(almost in District 12). Most tree and plants here give the low yield. In recent years, some plants
have died partly due to polluted water sources, partly because of harmful emissions emitted from
factories around the region.
The rate of the main income sources of local households is listed in Table 3.4.
Table 3.4 Main income source of local population
Income source Tan Binh district Go Vap district District 12 Average
Percentage (%) Percentage (%) Percentage (%) Percentage (%)
Salary 47,11 42,56 57,14 46,82
Gardening 0,00 0,51 7,79 1,78
Breeding farm 0,00 1,54 5,19 1,78
Business 13,22 17,44 15,58 15,78
Cultivation 0,00 0,51 1,30 0,51
Others 39,67 37,44 12,99 33,33
Source: Data gathered from previous EIAs of the project.
Statistics on the number of poor and nearly poor households in nine districts within the project
area are summarized in the table below:
Table 3.5 Number of poor and nearly poor households in the project area
No Location
Total poverty
households
(Average income
less than VND
12
mil./capita/year)
(%)
Total nearly-
poverty
households
(Average income
VND 12 -16
mil./capita/year)
(%)
1 District 12 236 0.22 4060 3,71
2 Go Vap District 809 0.60 2345 1,75
3 Bình Thạnh District 0 0 4135 3,68
4 Tan Binh District 0 0 1386 1,34

Environmental and Social Impact Assessment, HCMC Steering Center of the Urban
and Environmental and Social Management Plan Flood Control Program
Proposed HCMC Flood Risk Management Project Date Submitted: December 2, 2015
59
No Location
Total poverty
households
(Average income
less than VND
12
mil./capita/year)
(%)
Total nearly-
poverty
households
(Average income
VND 12 -16
mil./capita/year)
(%)
5 Tan Phu District 0 0 1145 1,11
6 Binh Tan District 0 0 4331 2,73
7 Binh Chanh District 579 0,51 10,317 9,14
8 Hoc Mon District 1115 1,27 4,361 4,96
9 District 8 930 0,95 3098 3,16
Source: Data provided by the Project Management Unit.
3.2.2. Agricultural activities
In recent years, the Tham Luong - Ben Cat – Nuoc Len canal system has been severely polluted,
agricultural production is thus restricted. The livestock industry, agriculture or gardening are not
developed. The crops grown in this basin do not produce high yields. A number of trees and
crops are dead due to contaminated water sources and toxic gases emitted from factories around
the region.
The surveys show that the proportion of households with incomes from agriculture is very low,
accounting for only 0.51% in Go Vap District and 1.30% in District 12, although previously a
large part of this area was agricultural land. In the recent years, the rapid urbanization rate has
led to changes in land use purposes; agricultural land has been converted into residential area as
well as area for companies, plants, and enterprises.
3.2.3. Industrial activities
The industry in the region thrives with many different industries. The project area has hundreds
of establishments, industrial factories, livestock farms, including: food processing, dye-textile,
chemical, plastic and rubber processing, in which one-third located scatteredly in residential
areas and more than 60 establishments located along the two banks of the canal. These include:
- Tan Binh Industrial Zone: 179 ha with 27 industrial factories;
- VinhLoc Industrial Zone (BinhChanh District): 202 ha;
- BinhHoa Industrial Zone (BinhThanh District): 18 ha;
- Tan Tao Industrial Zone (BinhChanh District): 443 ha.
3.2.4. Transport and infrastructure

Environmental and Social Impact Assessment, HCMC Steering Center of the Urban
and Environmental and Social Management Plan Flood Control Program
Proposed HCMC Flood Risk Management Project Date Submitted: December 2, 2015
60
The transport system is quite convenient with inter-province Route 50 and Can Giuoc River.
Internal roads have not been much invested and upgraded, the project area has many trails and
waterfront, making difficult transportation.
- Transport by air: Tan Son Nhat International Airport is deep-seated within the city, the larger
operation (estimated at about 5 million passengers from the current increased to 12 million
passengers/year) requires large-scale solution for more traffic outside linking to the city
center and the districts (roads and parking terminals).
- Road transportation: road area is about 7% of on the general area with 2.48 m2/ capital.
Presently intersections are in the inner area and surburban areas. In the project area there are
16 main routes distributed as follows:
- Hoc Mon district : 5 routes , L = 24,800 m
- District 12: 4 routes, L = 16,800 m.
- Go Vap District: 3 routes, L = 15,000 m.
- Tan Binh District: 3 routes, L = 10,200 m.
- Binh Chanh District: 8 tuyến, L = 42,000 m.
On the main roads there are big bridges such as: An Loc, Ben Phan, Truong Dai, Cho Cau, Tham
Luong, Binh Thuan, Ba Hom, Lac An, An Lap. For the project area: the main roads and bridges
crossing Tham Luong - Ben Cat – Nuoc Len is listed as follows:
Table 3.6 Main road and bridges crossing over Tham Luong – Ben Cat
No. Road Name L (m) Road type Bridge Route
1
2
3
4
5
6
7
8
9
10
11
12
13
14
15
16
National route 1
National route 22
Provincal route 14
Provincal route 16
Quang Trung street
Nguyen Oanh street
Truong Chinh street
Road No 13
Tan Ky – Tan Quy street
Provincal route 10
District route 5
District route 9
District route 11
District route 2
District route 4
District route 10
24,250
7,750
8,250
1,550
9,650
6,175
4,250
3,375
2,650
4,375
11,250
4,000
5,750
3,750
3,750
2,250
Asphalted road.
-ditto-
-ditto-
-ditto-
-ditto-
-ditto-
-ditto-
-ditto-
-ditto-
-ditto-
-ditto-
Aggregate road-
ditto-
-ditto-
-ditto-
-ditto-
Binh Thuan, An Lap
Truong Dai
Cho Cau
An Loc
Tham Luong
Sewer pipeline 2100, 3100
Tan Ky – Tan Quy
Ba Hom
In which:

Environmental and Social Impact Assessment, HCMC Steering Center of the Urban
and Environmental and Social Management Plan Flood Control Program
Proposed HCMC Flood Risk Management Project Date Submitted: December 2, 2015
61
- An Loc, Ben Phan, An Lạc bridges was upgraded and expanded;
- Truong Dai, Cho Cau, Binh Thuan, An Lap Bridges are in progress of construction;
- Tham Luong, Tan Ky Tan Quy, Ba Hom bridges are in planning of upgrade and expansion.
Besides, there are some rural bridges (or culverts) crossing over canal route of on inter-
communes paths (temporary concrete bridge or wooden bridge):
- Route 19/5: 3 wooden bridges (K3+60) (1/5+60) (2/4) (8/2) v sewer 480 (K3+60);
- Rach Chua route: 2 concrete bridges (K6+760) (K10+970); 1 steel bridge (K2+700), 1
wooden bridge (K5+320); Sewer 3100 (K8);
Waterway: city waterways system is relatively well developed, with a total length of over 700
kilometers of canals, including nearly 50% of the total length of water navigation. The Project
canal route is one of the planned inner belt waterway in connection the city with the
neighborhood, namely:
- In the Southern: there are Te channel, Đoi channel, Nha Be River - Soai Rap and Long Tau
leading to East Sea;
- In the Eastern: Saigon River links with Dong Nai River;
- In the The Western: Can Giuoc, Ben Luc, An Ha rivers connecting to Vam Co Dong.
Seaway system: inflows mainly from TP. Ho Chi Minh City - Vung Tau through Long Tau -
Soai Rap river.
Canal Hub of Tham Luong - Ben Cat – Nuoc Len is the main waterway in the project area.

Environmental and Social Impact Assessment, HCMC Steering Center of the Urban
and Environmental and Social Management Plan Flood Control Program
Proposed HCMC Flood Risk Management Project Date Submitted: December 2, 2015
62
Figure 3.3 Map of traffic planning in the area up to 2025.
3.2.5. Scope of Land Acquisition
A drainage and pollution improvement project for canal Tham Luong – Ben Cat - Nuoc Len was
approved by HCMC in May 2002, and the design subsequently amended in February 2007 and
July 2012. The project covers 8 districts of HCMC, of which 7 districts were subjected to land
acquisition and resettlement impacts, including Binh Tan, Binh Chanh, Tan Phu, Tan Binh,
District 12, Go Vap and Binh Thanh. The total land area affected by the project was calculated as
153.46 ha, with a total number of 3,212 Households being affected (see details below). As these
activities are linked, a due diligence of the resettlement conducted under City-funded activities
has been prepared to ensure its consistency with the WB OP4.12 that all affected people are able
to restore or improve the lost assets and livelihood as before the project.
- The Project requires permanent acquisition of 1,534,600,000 m2
belonging to 3,212
households 2and enterprises. By land use, these comprise 309,527m
2 of residential land;
238,822m2 of specially used land, and 986,251 m
2 of agricultural land;
- 1342 households have to relocate, of which 946 households registered to receive resettlement
houses while 391 households opted to self-relocation3;
2 In fact, there is an increase in the number of PAHs as three households in Binh Tan District are separated from
HoBac Company and 13 households under the name of the Waterway Construction Company.
3 Data is based on the report by the PMU until October 22 2015 and collected from the DCARBs; however, these
figures are not complete as some districts were unable to provide these data.

Environmental and Social Impact Assessment, HCMC Steering Center of the Urban
and Environmental and Social Management Plan Flood Control Program
Proposed HCMC Flood Risk Management Project Date Submitted: December 2, 2015
63
- 1,870 households are partially affected; of which, 498 households are affected on a part of
their houses and have sufficient remaining area to reorganize (including production
establishment/business households);
- 46 enterprises are also affected by the Project.
By district, the scope of impacts of the Phase 1 are as follows:
1. District No. 8: The Tham Luong-Ben Cat-Nuoc Len Canal in the District 8 starts from the
K0+000 ÷ K0+694 (694m from Cho Dem River); site clearance was already done in this area by
PhuDinh River port project.
2. Binh Tan District: The canal section in Binh Tan starts from the K0+694 ÷ K17+115 (1,224m
from Cho Dem River to Cau Bung Sluice Gate); this section is 16,421m long, traversing
eight wards, namely An Lac, Binh Tri Dong B, Tan Tao A, Tan Tao, Binh Tri Dong A, Binh
Hung Hoa B, Binh Hung Hoa A, and Binh Hung Hoa.
The total number of households and enterprises affected by the Project in this district is
2,267. In which total, 983 households are fully affected, 498 households are partially
affected; 761 households are affected on agricultural land; and 25 enterprises are fully
affected.
3. Tan Phu District: has 5 affected enterprises.
4. Tan Binh District: The canal section in Tan Binh starts from the K18+692 ÷ K19+692 (1,000 m
from Tham Luong Bridge). With the length of 1,000m, the canal section runs through Ward
15, affecting 38 households. The total cost is 51.467 billion dong. Area acquired is 1.91 ha.
5. District No. 12: The length of the canal section in the District 12, starting from K17+115 ÷
K24+163 (from CauSa ditchto Truong Dai Bridge) is 7,048m. The canal section passes through
Tan ThoiNhat, Dong Hung Thuan, and Tan ThoiHiep wards. The total number of affected
households is 167 (including 5 enterprises). The total cost is 198.936 billion dong for an
acquired area of 19.1 ha.
6. Go Vap District: The canal section in the area of Go Vap, from K19+692 to K31+583 (from the
boundary with Binh Tan Districtto Lang canal), is 11,891m long, traversing Ward No. 5, No.
6, No. 13, No. 14, and No. 15. The total number of affected households is 670. The total
compensation cost is 421.874 billion dong with the total acquired area of 27.34 ha.
7. BinhThanh District: The canal section in BinhThanh District starts from K31+583 to K32+714
(1,131m from SaiGon River), a right bank L=1.131m, passing through the area of Ward No.
13. There are 3 PAHs in the district area.
8. BinhChanh District:A total 65 affected households in two communes, namely Tan Kien and
VinhLoc B.
The scopes of project‘s impacts are summarized in the following Table 3.7.

Environmental and Social Impact Assessment, HCMC Steering Center of the Urban
and Environmental and Social Management Plan Flood Control Program
Proposed HCMC Flood Risk Management Project Date Submitted: December 2, 2015
64
Table 2.7 Scope of Project Impacts (Phase 1)
No. District
Permanently
acquired
area
(ha)
No. of HHs affected by land
acquisition No. of PAHs affected on houses
Total
compensation
cost up to date
(bil. dong) Total
Individual
households Enterprises
Fully
affected
Partially
affected
Self-
relocated
HHs
No. of HHs
registered
for
resettlement
houses
HHs were
allocate with
resettlement
houses/ plots
1 Binh Tan D 83.62 2,267 2,242 25 983 498 359 624 530 901.09
2 BinhChanh 9.2 65 63 2 4 4 0 48.62
3 Tan Phu 9.56 5 0 5 0 0 91.57
4 Tan Binh 1.91 35 28 7 2 1 1 0 51.65
5 No. 12 19.1 167 162 5 55 27 28 28 198.94
6 Go Vap 27.34 670 669 1 298 298 200 421.87
7 BinhThanh 2.73 3 2 1 0 200 3.19
Total 153.46 3,212 3,166 46 1,342 391 951 758 1,716.93
Source: Compiled from the Report on Implementation Progress of the Drainage System and Water Environment Improvement of ThamLuong- Ben Cat- Nuoc Len
Canal Project (Phase 1) up to October 22 2015.

Environmental and Social Impact Assessment, HCMC Steering Center of the Urban
and Environmental and Social Management Plan Flood Control Program
Proposed HCMC Flood Risk Management Project Date Submitted: December 2, 2015
65
Land Acquisition Progress
So far, three districts have completed the land acquisition activities for the Project, including
BinhChanh, Tan Phu, and BinhThanh. The remaining four districts have not finished land
acquisition, namely Binh Tan, Tan Binh, District 12, and Go Vap. Details are as follows:
- Total number of PAHs: 3,212 households;
- In which total, number of PAHs who have already handed over site to the Project: 2,937
households;
- Number of PAHs who have not handed over site: 268 households. Of which, 44 households
have already received compensation. The compensation for 212 households were deposited
in the bank while the remaining 12 households are not yet provided with compensation.
Table 3.8 Land Acquisition Progress Up to Date
No. District Total PAHs
(HHs)
No. of PAHs
already handed
over site
(HHs)
No. of PAHs not yet
handed over site
(HHs)
1 Binh Tan 2,267 2,011 256
2 Binh Chanh 65 65 0
3 Binh Thanh 3 3 0
4 District 12 167 158 9
5 Go Vap 670 669 1
6 Tan Binh 38 36 2
7 Tan Phu 5 5 0
TOTAL 3,215 2,937 268
Source: Report on Implementation Progress of the Drainage System and Water Environment
Improvement of Tham Luong- Ben Cat- Nuoc Len Canal Project (Phase 1) up to November 20 2015.
Accumulated Impacts
In Binh Tan District, 19 households who are affected by the Phase 1 of the Project will continue
to be affected in the Phase 2. Of which, five households will be fully affected. This will cause
difficulties for the PAHs to restore their living standards; therefore, special policies are needed to
apply for these households. Some of the outstanding issues include:
Low compensation rates
To date, there are 268 outstanding complaints from 268 PAHs. In which total, 256 households
are in Binh Tan District, mainly in Binh Hung Hoa Ward (234 households), nine households in

Environmental and Social Impact Assessment, HCMC Steering Center of the Urban
and Environmental and Social Management Plan Flood Control Program
Proposed HCMC Flood Risk Management Project Date Submitted: December 2, 2015
66
District 12, two households are in Tan Binh, and one household in Go Vap District. Of the total
268 households, 42 households have already received compensation but not yet handed over
sites. 12 households have not been issued with compensation payment decisions yet while the
remaining 214 households refuse to receive compensation (their payment decisions are already
issued). Their compensation has been deposited into a bank by the DCARBs. The main reason
for a large number of PAHs refusing to hand over site is low compensation rates. Even combined
with the support packages, these rates still cannot meet the market prices.
PAHs whose houses are allocated by the enterprise
There is only one outstanding case in Go Vap. However, in fact, this involves 13 households
who are the employees of the Waterway Construction Company. These households were
officially allocated land by the company in 2007. To date, they households still refuse to receive
compensation and hand over site. According to them, they have resided on this area before;
however, the land allocation documents indicate the year 2007. After DMS was carried out,
according to the Directive 08/2002 by the City PC, these households are not considered as
eligible households for compensation.
There is no regulation to support the affected tenants
Among 234 PAHs in Binh Hung Hoa who were surveyed by the Ward PC, 60 households are
renting houses. Hence, most of these affected people do not have any other places to live as the
majority of them are from other provinces earning a living in Ho Chi Minh City. Therefore, as
the compensation and assistance policies of the Project do not have any provision related to the
compensation and assistance for the tenants, these households will face more difficulties.
Affected enterprises and production establishments
10 enterprises have not carried out site clearance due to overlapping in planning of the Tan Tao
Industrial Park and the land acquisition boundary of the Project.
For the registered enterprises, allowances for affected employees have been applied. However,
for the small-scale enterprise and production establishments in form of households that hired
workers, these allowances were not applied as they did not have official papers to prove the
hiring. In addition, the establishments had to relocate themselves at that time because it
coincided with the time when the City‘s decision on the removal of establishments producing
pollutant out of the city area was issued.
Directive No. 08/2002as a cut-off date to structures
The City‘s Directive 08 was issued on April 22 2002, which is considered as an important
milestone in deciding the eligibility of the APs for compensation for their affected structures.
However, this directive, in fact, was not disclosed to the local communities in the project area.
The resettlement sites are not appropriate
The RS of the Project does not meet a principle stipulated in the Decree No. 22/1998, which is
the principle of equivalent value.

Environmental and Social Impact Assessment, HCMC Steering Center of the Urban
and Environmental and Social Management Plan Flood Control Program
Proposed HCMC Flood Risk Management Project Date Submitted: December 2, 2015
67
The area of apartments in the RS is not suitable to the diversity of the households and the fact
that the apartment buildings with corrugated iron roofs are not suitable to the weather. Moreover,
the RS is too far with little opportunity for economic development. Therefore, the PAHs do not
want to receive houses in the RS.
Policy application in accordance with regulations but not a good practice
The application of the Decree No. 22/1998/ND-CP for compensation of the Project is in
compliance with the regulations stipulated in the Decree No. 197/2004/ND-CP (Item 2, Article
50)4. However, this is also the main reason for the outstanding complaints and delays of the
Project, which is costly because the project is not completed and causes adverse social impacts.
Project delays and re-encroachment
The delay of the Project for 13 years and unfinished land acquisition have given chances for the
households to reoccupy the area. To date, in the Ward No. 5 of Go Vap District, more than 50
households are reoccupying the cleared area to open coffee shops and eateries, which will cause
difficulties for the civil works of the Project in the second phase.
3.2.6. Influences of Tham Luong - Ben Cat – Nuoc Len on local population
In the context of speedy urbanization and rapid economic development, in parallel with
economic development and improving material and spiritual life of local residents,
environmental pollution is a dilemma. The improvement of economic life while creating a clean
environment and urban landscape is very essential for the surrounding residential area of Tham
Luong - Ben Cat – Nuoc len in particular and the people of the city in general.
a) Improvement from existing works
In the initial period, improvement of the Tham Luong – Ben Cat – Nuoc Len was funded by the
municipal authorities and a number of works have been implemented in the three districts: Go
Vap, District 12 and Binh Tan. Although many of the works remain at a modest scale, the
respondents highly appreciate their value in mitigating the negative impacts of the local flood
conditions. In particular, in Go Vap, the completed works includeconstruction of earth
embankments, 2-metre earth coverage of dyke embankments, and site clearance in preparation
for the upcoming worksin Wards 5, 6, 15, 14, 17 and 13. In addition, a number of drainage
works have been implemented with local funds, including the maintenance of drainage works
4Article 50. Implementation Effect
2. This Decree replaces the Government's Decree No. 22ll998lND-CP of April 24, 1998 on damage compensation
when the State recovers land for defence and security purposes, national interests, public interests. All previous
regulations on compensation, support and resettlement when the State recovers land, which are contrary to this
Decree, are hereby annulled.
For projects, project items that have completed the compensation, support and resettlement work; that have
approved the compensation, support and resettlement plans or are making payments for compensation, support and
resettlement according to the plans approved before the effective date of this Decree, the approved plans shall be
implemented without application of, or adjustment according to, the provisions of this Decree.

Environmental and Social Impact Assessment, HCMC Steering Center of the Urban
and Environmental and Social Management Plan Flood Control Program
Proposed HCMC Flood Risk Management Project Date Submitted: December 2, 2015
68
(dredging, and maintenance of the drainage system with the annual municipal budget), and
construction of a drainage system along the main roads of Pham Huy Thông, Nguyen Văn Nghi,
and Tran Quoc Tuan. The city-funded work has improved the flood conditions considerably.
In particular, Neighbourhood 1, Ward 13, Go Vap is located along the Tham Luong canal. The
flooding situation has been improved considerablly after the initial stage of the city‘s work,
together with people-funded road upgrading. However, new alphalted roads have substantial
height differences, some being heightened by 0.5 meter and others by 1 metre, due to local
residents‘ varied affordability.
In Thanh Xuan Ward, District 12, flooding used to be very common as a consequence of high
tides but respondents report that the situation has been improved considerably since the
construction of the Bo Hu Canal. Some minor rain floods happen in certain small areas, but the
rainwater is fully discharged to the canal, usually around half an hour after a rain. In
neighbourhood 1, residential units 2 and 5 remain often flooded as affected by the water flow
from the Cán Dua drainpipe. Househoolds with difficult living conditions reside alongside the
canal in temporary shelters with leaf or roofing, which have been built on dyke borderlines.
Respondents report that tidal floods in this area have been tackled (World Bank 2014).
b) Remaining constraints
However, according to the Qualitative Assessment Report of Poverty and Social Impacts of
Flooding in Selected Neighborhoods of HCMC conducted by the World Bank (2014), there
remain some issues to be addressed, as follows:
Despite road heightening, flooding as a result of combined effects of rainwater and high tides
still happens in some parts of the study sites as a result of the unsatisfactory draining system;
degraded road quality due to large traffic circulation; and drainpipes blocked with rubbish,
resulting in slow discharge of rain and wastewater;
Improper use of the sluice gates by local people for their own advantages is reported;
Maintenance of sluice gates is unsatisfactory. Some sluice gates in Ward 13, Go Vap, have
broken down, thus the water cannot push them through;
The existing earth embankment causes inconvenient transport for local residents;
The local people throw rubbish and plastic bags on the earth embankment, seriously
polluting the local environment; and
Risks for children are a concern.
The survey assessing the influence level of the canal system Tham Luong - Ben Cat – Nuoc len
to the life of local households shows that the percentage of households answering pollution of
canal system directly affecting their living activities accounted for 75.38%. Among this, the
highest rate is in Go Vap District, accounting for 97.08%; 96.77% is for District 12 (most of the
surveyed households are living along the channel or 50m away the channel). The proportion of
households who think that contamination of the canal system does not affect their daily life
activities is 24.62%, mostly those belonging to Tan Binh district (75%). This is because these
households are 300m away from the canal and therefore do not notice the impact from water

Environmental and Social Impact Assessment, HCMC Steering Center of the Urban
and Environmental and Social Management Plan Flood Control Program
Proposed HCMC Flood Risk Management Project Date Submitted: December 2, 2015
69
pollution.
Table 3.9 Percentage of households directly affected by the canal system
The factor affecting people's daily life the most are insects such as flies, mosquitoes, accounting
for 39.46%, the highest rate of which is 92.31% from Tan Binh district. The second most
important reason affecting health of the local population is the unpleasant stench emitting from
the waste ordecomposition of waste in the canal accounting for 38.56%, the highest rate of which
from District 12 accounts for 46.51% and Go Vap District being 38.50%. Also, there are some
other offensive symtoms such as headache and rhinitis occupying 12.97%. Diseases such as
malaria, dengue fever and cholera in the region are not in high portion. In addition to the above-
mentioned effects, the canal water during the rainy season overflowing into the project area
causes other diseases such as scabies and itchy feet. The results of influences from canal
pollution are shown in the following table:
Status
Tan Binh district Go Vap district District 12 Average
Number of
household (%)
Number of
household (%)
Number of
household (%)
Number of
household (%)
Affected 25 25.00 166 97.08 60 96.77 251 75.38
Non-
affected 75 75.00 5 2.92 2 3.23 82 24.62

Environmental and Social Impact Assessment, HCMC Steering Center of the Urban
and Environmental and Social Management Plan Flood Control Program
Proposed HCMC Flood Risk Management Project Date Submitted: December 2, 2015
70
Table 3.10 Influence of canal pollution on household activities
Description
Tan Binh district Go Vap district District 12 Average
Number of
Household (%)
Number of
Household (%)
Number of
Household (%)
Number of
Household (%)
Affect to living activities 0 0.00 18 4.50 3 2.33 21 3.78
Causing unpleasant stench 0 0.00 154 38.5 60 46.51 214 38.56
Causing malaria, dengue, 0 0.00 22 5.50 3 2.33 25 4.50
Causing cholera 0 0.00 4 1.00 0 0.00 4 0.72
Flies and mosquitoes 24 92.31 136 34.0 59 45.74 219 39.39
Others 2 7.69 66 16.5 4 3.10 72 12.97
Results of the survey assessing the influence of canal pollution on production activities and business operation shows that 91.59% of the surveyed
households are not affected. This is because most of them live in the area of being unable to do the business or trading due to unfavorable traffic
system, less densely populated and heavily polluted environment. The remaining 8.41% of households is affected especially in the rainy season but
not frequent as the majority of them are doing small business at home. In particular, the highest level of impact is in Go Vap district, around
14.62%. Survey results of influence from the canal system are shown in the following table:

Environmental and Social Impact Assessment, HCMC Steering Center of the Urban
and Environmental and Social Management Plan Flood Control Program
Proposed HCMC Flood Risk Management Project Date Submitted: December 2, 2015
71
Table 3.11 Percentage of households having production and business activities affected
Among the affected households, it is said that contamination to the food business accounted for
57.14%. Some small food production businesses had to stop its activities due to the quality of
products, which account for 10.71%. Some other influences include sparsely populated area and
unfavorable local for business trading account for 32.14%.
In the rainy season, households suffering from flooding caused by overflowing from the canal
account for 70.87%, mainly in Go Vap and District 12 (69.35% and 61.99% respectively).
Especially Tan Binh district, 87.00% of households are flooded during the rainy season.
Although the surveyed households live in a distance from the canal but still incur flooding from
rainwater due to clogged culvert leading no drainage to the channel or large water volume during
in-spate season backflow from canals and culverts into residential areas. According the local
households, previously there was no submerged condition, but since the canal started to receive
large amounts of industrial wastewater, and domestic discharge, especially solid waste, this has
impeded drainage, causing flooding of low-lying areas. Only 29.13% of the households are not
flooded in the rainy season because they live far away from the canal system or are protected by
river embankments. Although their houses are not flooded, the surrounding area has been
affected.
The proportion of households regularly flooded during the rainy season accounts for 58.37%.
Some residents in Go Vap district must move by boat in the flood season. The highest proportion
of households regularly incur flooding is in Tan Binh District, accounting for 68.97%; 57.28%
from Go Vap District and the lowest being 39.53% from District 12. The percentage of
households occasionally suffering from water overflowing into the house occupies 41.63%,
mostly concentrating in District 12 with 60.47% and the lowest being 31.03% in Tan Binh
District.
Table 3.12 Summary of impacts of flooding on poor, nearly-poor households, immigrants and
vulnerable groups
Indicator Description
Health - Water-borne and respiratory diseases
- High medical costs
Livelihood Reduced wages, and reduced or lost revenues from renting services.
Status
Tan Binh district Go Vap district District 12 Average
Number of
Household (%)
Number of
Household (%)
Number of
Household (%)
Number of
Household (%)
Affected 1 1.00 25 14.62 2 3.23 28 8.41
Non-
affected 99 99.00 146 85.38 60 96.77 305 91.59
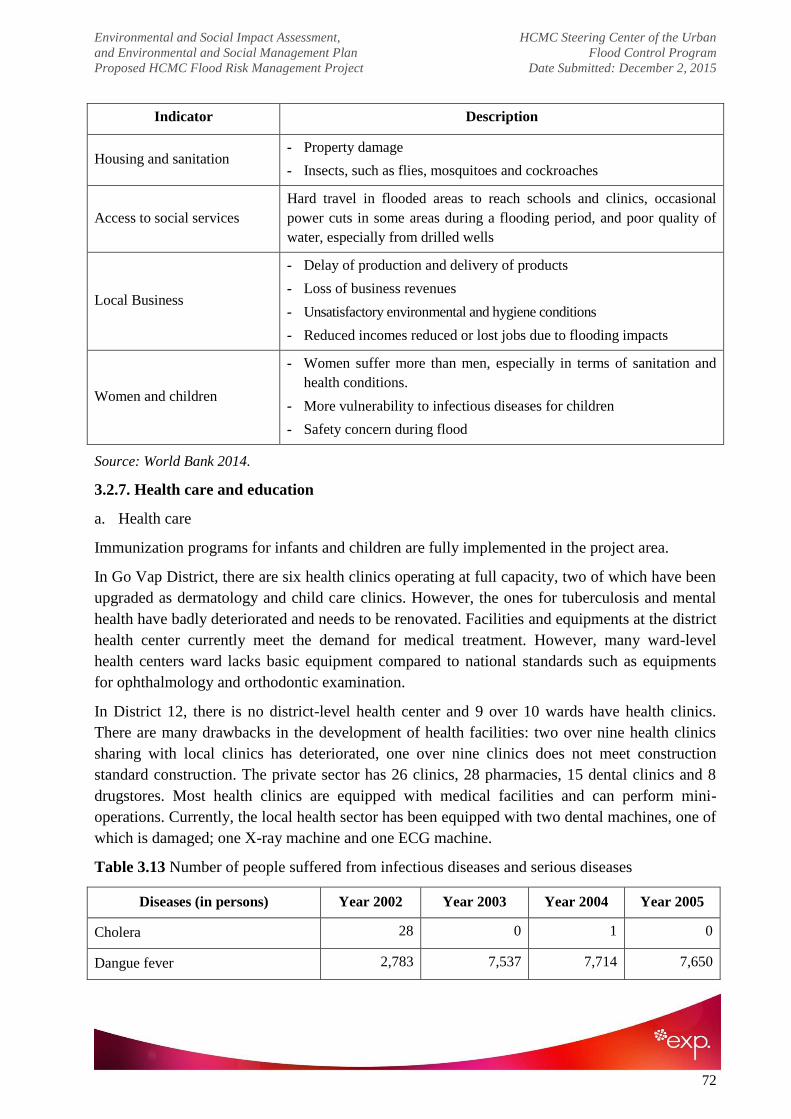
Environmental and Social Impact Assessment, HCMC Steering Center of the Urban
and Environmental and Social Management Plan Flood Control Program
Proposed HCMC Flood Risk Management Project Date Submitted: December 2, 2015
72
Indicator Description
Housing and sanitation - Property damage
- Insects, such as flies, mosquitoes and cockroaches
Access to social services
Hard travel in flooded areas to reach schools and clinics, occasional
power cuts in some areas during a flooding period, and poor quality of
water, especially from drilled wells
Local Business
- Delay of production and delivery of products
- Loss of business revenues
- Unsatisfactory environmental and hygiene conditions
- Reduced incomes reduced or lost jobs due to flooding impacts
Women and children
- Women suffer more than men, especially in terms of sanitation and
health conditions.
- More vulnerability to infectious diseases for children
- Safety concern during flood
Source: World Bank 2014.
3.2.7. Health care and education
a. Health care
Immunization programs for infants and children are fully implemented in the project area.
In Go Vap District, there are six health clinics operating at full capacity, two of which have been
upgraded as dermatology and child care clinics. However, the ones for tuberculosis and mental
health have badly deteriorated and needs to be renovated. Facilities and equipments at the district
health center currently meet the demand for medical treatment. However, many ward-level
health centers ward lacks basic equipment compared to national standards such as equipments
for ophthalmology and orthodontic examination.
In District 12, there is no district-level health center and 9 over 10 wards have health clinics.
There are many drawbacks in the development of health facilities: two over nine health clinics
sharing with local clinics has deteriorated, one over nine clinics does not meet construction
standard construction. The private sector has 26 clinics, 28 pharmacies, 15 dental clinics and 8
drugstores. Most health clinics are equipped with medical facilities and can perform mini-
operations. Currently, the local health sector has been equipped with two dental machines, one of
which is damaged; one X-ray machine and one ECG machine.
Table 3.13 Number of people suffered from infectious diseases and serious diseases
Diseases (in persons) Year 2002 Year 2003 Year 2004 Year 2005
Cholera 28 0 1 0
Dangue fever 2,783 7,537 7,714 7,650

Environmental and Social Impact Assessment, HCMC Steering Center of the Urban
and Environmental and Social Management Plan Flood Control Program
Proposed HCMC Flood Risk Management Project Date Submitted: December 2, 2015
73
Diseases (in persons) Year 2002 Year 2003 Year 2004 Year 2005
Whooping cough 85 98 38 10
Measles 449 158 10 9
HIV 13,067 17,782 22,445 27,560
AIDS 4,814 5,933 8,408 9,940
Source: Statistical Yearbook of Ho Chi Minh City 2005 – 2010.
b. Education
Education quality is quite good in the project area. Each district has enough schools at three
levels and kindergarten with experienced teachers. The number of children attending school is
quite high with significant increase in some years and insignificant increase in the others.
Table 3.14 The number of classes, pupils and teachers in the 2009-2010 academic year of Go
Vap District
Quantity
Kindergarten
Public 731
Semi-public 200
Private 82
Preschool
Public 5,399
Semi-public 755
Private 3,117
Teacher
Vocational 278
College 108
University 61
High school 274
Classroom
Public 168
Semi-public 39

Environmental and Social Impact Assessment, HCMC Steering Center of the Urban
and Environmental and Social Management Plan Flood Control Program
Proposed HCMC Flood Risk Management Project Date Submitted: December 2, 2015
74
Private 86
Primary 29,767
Secondary 20,375
High school 7.395
Source: Statistical Yearbook of Ho Chi Minh City 2010.
In Go Vap District, there is a full variety of education, from preschool to primary school, junior
high, high school, vocational education and higher education. There is one university and one
technical college which is an advantage compared to other districts. Many schools are fully
equipped with teaching equipments such as laboratories, audio-visual rooms and computer
rooms. However, only about a quarter of schools are equipped. Many schools do not have
separate labs for each subject. The provision of reference books for teachers is minimal and
library services are limited.
Table 3.15 Number of schools, pupils and teachers in the 2010-2011 academic year in the
project area
District Preschool School
Student Teacher School Student Teacher School
District 12 8,314 339 17 36,590 1,211 28
Go Vap 12,225 567 34 6,129 1,869 40
Tan Binh 9,470 444 32 68,741 2,754 53
Binh Thanh 10,731 529 34 56,200 1,975 48
Binh Tan 5,174 212 11 23,317 834 19
Binh Chanh 5,946 222 19 33,579 1,307 45
Hoc Mon 6,912 312 21 42,567 1,684 41
Source: Statistical Yearbook of Ho Chi Minh City 2010.
3.2.8. Historic sites in the project area
Ho Chi Minh City is a young city but with many resources for cultural and tourism development.
Those are ancient architectural sites such as Nha Rong, Quoc To temple, Xa Tay Palace
(headquarters of the City People's Committee), Opera House, City Post Office, a system of
ancient pagodas (Giac Lam, Ba Thien Hau, Giac Vien), and a system of ancient churches (Notre
Dame, Huyen Sy, Thong Tay Hoi, Thu Duc). As the cultural center of the country, the city
currently has 22 art units and 9 theaters, accounting for 15.5% and 18.6% of the country's art
units and theaters respectively. The City Department of Culture and Information has developed
the master plan until 2020 towards modern urban development rich in national identity.

Environmental and Social Impact Assessment, HCMC Steering Center of the Urban
and Environmental and Social Management Plan Flood Control Program
Proposed HCMC Flood Risk Management Project Date Submitted: December 2, 2015
75
The census conducted by Ho Chi Minh City Department of Culture and Information showed that
there are approximately 1,000 historic sites and landmarks in the city. Among these, there are
239 war-related historic sites, 493 architectural monuments (over 100 years), 9 historic
headstones, 34 ancient traditional houses, 102 ancient gravestone, 8 landscapes. The result of the
census is the basis for the Ministry of Culture and Information to recognize further 144
landscapes and monuments of the city. The following temples; Tan Tuc (Binh Chanh), Phan
Cong Hon, Tan Thoi Tu (Hoc Mon) and Linh Tay (Thu Duc) have just been recognized as city-
level historic and architectural cultural landmarks. Ho Chi Minh City has a total number of 260
temples, 57 of which are located in Binh Chanh District and the rest scattered in other districts.
In addition to religious purposes, some temples were used as secret shelters for the communist
soldiers during wartime such as Binh Dong Temple in District 8 and Phong Phu Temple in
District 9.
In addition, there are some city-level historic sites as follows;
- Binh Chanh District: Lang Le – Bau Co, Binh Truong Temple;
- Binh Thanh District: ancient traditional house of Vuong Hong Sen;
- Tan Binh District: Giac Lam Pagoda, Phu Tho Hoa bomb warehouse, Phan Chau Trinh
grave;
- Hoc Mon District: Tan Thoi Nhi Temple, Hoc Mon District Temple, Nga Ba Giong;
- Go Vap District: An Nhon Temple, Thong Tay Hoi Temple, Sac Tu Truong Tho Pagoda
Overall, there are many historic sites in the project area. Each citizen must be aware of
protecting and promoting these historic sites.
3.2.9. Past and on-going education and communication programs to raise community
awareness of environmental protection
Mass media
Communication measures: cooperating with radios, televisions and news to effectively raise
community awareness of environmental protection, communicating about the meaning of the
Project and project beneficiaries to build credibility with local communities and encouraging
their contribution to environmental protection by not throwing wastes into the catchment area
during construction and post-construction phases.
Social activities
Education measures: this is an important measure. Educating local communities about awareness
against environmental pollution and reducing wastes during construction phases. Wastes need to
be collected and treated to prevent environmental pollution.
Social organizations, unions and schools
Enhancing communication and encouragement of local communities to participate in
environmental protection. Organizing workshops to increase awareness of environmental

Environmental and Social Impact Assessment, HCMC Steering Center of the Urban
and Environmental and Social Management Plan Flood Control Program
Proposed HCMC Flood Risk Management Project Date Submitted: December 2, 2015
76
protection. Social unions and schools should take advantage of this communication form.
Organizing non-official meetings and group discussions in various forms.
Organizing forums, workshops and meetings with civic and social organizations to present and
announces social and environmental issues related to the project.
Organizing conferences about the project to publicly announce project benefits to encourage
community participation.
At present, in some districts such as Binh Tan and District 12, the Youth Union is organizing the
event ―Green Sunday‖ to encourage youth members to participate in collecting wastes in the
catchment area and planting trees to protect local environment. This activity should be promoted
and popularized in other districts to encourage environmental protection in these areas.
Public areas
Local governments have not developed any feasible measure to encourage community
participation in canal protection in public areas. This is because the budget of district for
environmental protection activities is inadequate. However, in the future, districts will make
efforts to develop the most effective measures for environmental protection.
Households
At present, Binh Tan and District 12 has directed the Youth Union to help local communities
have better understanding of the responsibility for environmental protection of the catchment
area. Whenever there are policies about environmental protection in the area, the Youth Union
will print flyerer with readable and easy-to-understand content to distribute to every household.
This activity helps people to update and apply policies in the fastest way.
3.3. Existing Environmental Quality
3.3.1. Environmental Quality Sampling Plan and Analytical Parameters
EXP. was in collaboration with the Environmental Technology and Management Center (ETM)
to conducted surveys, samplings, and sample analyses on 12 and 13
October 2015. The method
for evaluating environmental quality is as follows:
Air quality is assessed by micro-climate (temperature, humidity, wind direction, wind speed);
noise; suspended dust particles; exhaust gases (NO2, SO2, CO, NH3, H2S and VOC);. Air
samples are taken from the project area, at the site where the construction activities of the
project will be taken place (11 samples)
Water quality is assessed by the following criteria: pH, Total hardness, Turbidity, Color, DO,
total suspended solids, TDS, COD, BOD5, NH4+, Cl
-, F
-, N-NO2
-, SO4
2-, P-PO4
3-, heavy
metals (Arsenic, Cadmium, Lead, Chromium, Copper, Zinc, Manganese, Iron, Mercury) Oil
and grease and E.Coli; 10 samples of surface samples were analyzed included: including 02
samples at the two ends of the main canal, 06 samples at conjunction of the 06 secondary
canals with the main canal; 01 samples in tcentral section of the main canal at the An Lac
bridge near Tan Tao IZ WWTP; 01 samples near outlet of the WWTPs of Tan Binh. Samples

Environmental and Social Impact Assessment, HCMC Steering Center of the Urban
and Environmental and Social Management Plan Flood Control Program
Proposed HCMC Flood Risk Management Project Date Submitted: December 2, 2015
77
are taken during high tide and low tide. The quality of soil was assessed with the following
criteria: pH, Arsenic, Cadmium, Copper, Lead, Zinc and Mercury. There are total 08 soil
samples; taken at the bank of Tham Luong-Ben Cat canal. These soils were the dredged from
first phase of the rehabilitation of the main canal and used for making the soil embankment
along the canal.
Groundwater quality is assessed by the following criteria: pH, Turbidity, Cl-, TDS, TS, COD,
BOD5, NH4+, N-NO2
-, N-NO3
-, P-PO4
3-, heavy metals (Arsenic, Cadmium, Lead, Mercury,
Chromium, Iron) Oil and grease, E.Coli and Coliform. Ground water were taken at 9 points
along the main canal including:Thai Son football ground‘s well - Chin Xieng canal area;
household‘s well - Cau Cut canal area; Nam Bang company‘s well - Truong Dai bridge area;
well at wood shop - Hy Vong canal; store near Tham Luong bridge; household‘s well - Binh
Thuan bridge; household‘s well - Ba Hom bridge; household‘s well - from An Lac bridge to
An Lap bridge; household‘s well - from Nuoc Len bridge to Cho Dem river.
Sediment analysis is assessed by the following criteria: Organochlorine Pesticides, PAHs,
DDT, Hg, As, Fe, Cd, Pb, Cr. Sediment were taken at 12 points along the main canal
including: 02 points at the two ends Vam Thuat and Nuoc Len; 06 points at the conjunctions
of the main canal with 06 secondary canal; 02 points near outlets of the WWTPs of Tan Binh
and Tan Tao IZ; 02 points are taken at the ongoing construction packages of the project canal
improvement (first phase, financed by Gov budget). For each points, the sediments are taken
at 02 layers, at the depth of 0.1 m (surface sludge) and 0.5 m (depth layer).
Bethos and Aquatic Plancktons.
Sampling locations and analytical results on environmental quality are shown in the Annex 1 and
Annex 2.
In addition, details descriptions on sampling locations for air and water anlayses are provided in
Annex 2, respectively. Locations for sludge/soil sampling in the project study area are coincident
with locations for surface water and wastewater sampling.
3.3.2. Results of Air Quality
Surveying and sampling were conducted on 12 and 13 October 2015. The air sampling locations
were selected according to the following criteria: (1) located within the project area, (2) located
on the roads to be used for transport of building materials during construction of the project
items or situated in environmentally sensitive locations.
The air quality in Tham Luong Ben Cat Nuoc Len Canal basin is significantly affected by:
Foul odour from Tham Luong Ben Cat Nuoc Len Canal due to the presence of NH3, H2S,
VOC;
Pollutants generated from wastewater and from surrounding industries;
Air emissions from vehicles and traffic congestion; and
Air emissions from routine cooking activities, and other services.

Environmental and Social Impact Assessment, HCMC Steering Center of the Urban
and Environmental and Social Management Plan Flood Control Program
Proposed HCMC Flood Risk Management Project Date Submitted: December 2, 2015
78
The detailed results are presented in Annex 2 and summarized as follows:
NO2, SO2, and CO concentrations do not exceed threshold limit values based on ambient air
quality (TCVN 5937, 5938.2005) at the 11 monitoring locations at the different time periods;
The concentration of suspended particulates do not exceeded the air quality standard most of
the time, excepting three out of 11 monitoring location are just over the standards including
K4, K6 and K8;
NH3 and H2S concentrations are lower than the allowable standard in all monitoring
locations.
Noise: Noise level at the proposed locations of the project is from 65.1 to 81.0 dBA. Seven of
them are exceed the allowable standards value of 70dBA (QCVN 26: 2010/BTNMT). Thoes can
be due to being measured at busy traffic period.
3.3.3. Water Quality
The assessment of water quality in the project areas was based on analyses conducted by EXP.
And ETM Center on 12 and 13 October 2015. Given the Tham Luong Ben Cat Nuoc Len Canal
has been considered as inland waterway, the water quality has examined based on the level B2 of
QCVN 08:2015/BTNMT. The water sampling was undertaken at 11 locations to where the
construction activities can potentially affect. The detailed results are presented in Annex 2 and
summarized as follows:
The Canal is highly contaminated with E. Coli and Coliform at high tide and low tide;
Two end points of the Canal is slightly contaminated, where DO, NH4+, NO2
- do exceed the
allowable standards of level B of QCVN 08:2015/BTNMT at high tide and low tide;
In the middle of the Canal, it is more polluted, where DO, NH4+, NO2
-, COD, BOD5, PO4
3-,
oil and grease exceed the allowable standards of level B2 of QCVN 08:2015/BTNMT at high
tide and low tide; and
The Canal‘s water does not contains heavy metals for both of tidal regimes.
Table 3.16 Examination of water quality of Tham Luong Ben Cat Nuoc Len Canal
Codes Location Examination of water quality
High Tide Low Tide
SW1-HT
and SW1
- LT
At 200 meter from
Sai Gon river
towards the Vam
Thuat canal
Most of parameters exceed the
allowable standards of level B2
(QCVN 08:2015/BTNMT),
excepting DO and NH4+, NO2
-,
Coliform and E.coli.
Most of parameters exceed the
allowable standards of level B2
(QCVN 08:2015/BTNMT),
excepting DO and NH4+, NO2
-,
Coliform and E.coli.
SW2-HT
and SW2
At the junction of
Chin Xieng canal
with Tham Luong –
Most of parameters exceed the
allowable standards of level B2
(QCVN 08:2015/BTNMT),
Most of parameters exceed the
allowable standards of level B2
(QCVN 08:2015/BTNMT),

Environmental and Social Impact Assessment, HCMC Steering Center of the Urban
and Environmental and Social Management Plan Flood Control Program
Proposed HCMC Flood Risk Management Project Date Submitted: December 2, 2015
79
Codes Location Examination of water quality
High Tide Low Tide
- LT Ben Cat – Nuoc
Len canal
excepting DO and NH4+, NO2
-,
Coliform and E.coli.
excepting DO, TSS,
NH4+,Coliform and E.coli.
SW3-HT
and SW3
- LT
At the junction of
Ong Bau canal with
Tham Luong – Ben
Cat – Nuoc Len
canal
The water quality indicates this
location is slightly polluted,
where COD, BOD5, DO, NH4+,
PO43-
, oil and grease, coliform
and E.coli exceed the allowable
standards of level B2 (QCVN
08:2015).
The water quality indicates this
location is slightly polluted,
where COD, BOD5, DO, NH4+,
NO2-, PO4
3-, oil and grease,
coliform and E.coli exceed the
allowable standards of level B2
(QCVN 08:2015).
SW4-HT
and SW4
- LT
At the junction
between Ong Tong
canal and Tham
Luong – Ben Cat –
Nuoc Len canal
Most of parameters exceed the
allowable standards of level B2
(QCVN 08:2015/BTNMT),
excepting DO and NH4+, NO2
-,
Coliform and Ecoli.
The water quality indicates this
location is slightly polluted,
where COD, BOD5, DO, NH4+,
PO43-
, coliform and E.coli
exceed the allowable standards
of level B2 (QCVN 08:2015).
SW5-HT
and SW5
- LT
At the junction
between Ba Mien
canal and Tham
Luong – Ben Cat –
Nuoc Len canal
Most of parameters exceed the
allowable standards of level B2
(QCVN 08:2015/BTNMT),
excepting DO, COD, NH4+,
PO43-
, Coliform and Ecoli.
Most of parameters exceed the
allowable standards of level B2
(QCVN 08:2015/BTNMT),
excepting DO, TSS, COD,
NH4+, PO4
3-, Coliform and
Ecoli.
SW6-HT
and SW6
- LT
At the junction
between Cau Cut
canal and Tham
Luong – Ben Cat –
Nuoc Len canal
Most of parameters exceed the
allowable standards of level B2
(QCVN 08:2015/BTNMT),
excepting DO, COD, BOD5,
NH4+, PO4
3-, Coliform and
Ecoli.
Most of parameters exceed the
allowable standards of level B2
(QCVN 08:2015/BTNMT),
excepting DO, TSS, COD,
BOD5, NH4+, PO4
3-, oil and
grease, Coliform and Ecoli.
SW7-HT
and SW7
- LT
At the junction
between the Hy
Vong channel and
the Tham Luong –
Ben Cat – Nuoc
Len canal
Most of parameters exceed the
allowable standards of level B2
(QCVN 08:2015/BTNMT),
excepting DO, COD, BOD5,
NH4+, PO4
3-, Coliform and
Ecoli.
Most of parameters exceed the
allowable standards of level B2
(QCVN 08:2015/BTNMT),
excepting DO, COD, BOD5,
NH4+, PO4
3-, oil and grease,
Coliform and Ecoli.
SW8-HT
and SW8
- LT
At the Tham Luong
bridge where a
discharge point of
Tan Binh Industrial
Park is located.
Most of parameters exceed the
allowable standards of level B2
(QCVN 08:2015/BTNMT),
excepting DO, COD, BOD5,
NH4+, PO4
3-, Coliform and
Ecoli.
Most of parameters exceed the
allowable standards of level B2
(QCVN 08:2015/BTNMT),
excepting DO, COD, BOD5,
NH4+, PO4
3-, Coliform and
Ecoli.

Environmental and Social Impact Assessment, HCMC Steering Center of the Urban
and Environmental and Social Management Plan Flood Control Program
Proposed HCMC Flood Risk Management Project Date Submitted: December 2, 2015
80
Codes Location Examination of water quality
High Tide Low Tide
SW9-HT
and SW9
- LT
At the An Lac
bridge (Tan Tao
Industrial Park)
Most of parameters exceed the
allowable standards of level B2
(QCVN 08:2015/BTNMT),
excepting DO, COD, BOD5,
NH4+, PO4
3-, Coliform and
Ecoli.
Most of parameters exceed the
allowable standards of level B2
(QCVN 08:2015/BTNMT),
excepting DO, NH4+, NO2
-,
Coliform and Ecoli.
SW10-HT
and SW10
- LT
At 200 meter from
Cho Dem river
toward the Nuoc
Len bridge
Most of parameters exceed the
allowable standards of level B2
(QCVN 08:2015/BTNMT),
excepting DO, NH4+, Coliform
and Ecoli.
Most of parameters exceed the
allowable standards of level B2
(QCVN 08:2015/BTNMT),
excepting DO, NH4+, NO2
-,
Coliform and Ecoli.
3.3.4. Result of Groundwater Quality
Ground water quality survey for the Canal was done by Exp. and ETM Center. All drilled wells
surveyed are depth layer drilled wells, above 20m. Many wells have high concentration of NH4
(GW1, GW2, GW3, GW4, GW8 and GW9) and low pH (GW1, GW2, GW3, GW4, GW7, GW8
and GW9). Other parameters of groundwater do not exceed the allowable value of QCVN
09:2008/ BTNMT. It means that the water in all the surveyed wells has been just slightly
polluted.
3.3.5. Result of Soil quality
Surveying and sampling were conducted on 12 and 13 October 2015. The soil sampling locations
were selected at positions covered by sludge of 4 packages in phase 1. Soil were taken at 8 points
including:
- From Tham Luong bridge to Cho Cau bridge, at the Tham Luong canal that distance from the
Hy Vong cannal 500m (Soil was covered from 2013);
- From Tham Luong bridge to Cho Cau bridge, the Hy Vong cannal;
- From Cho Cau bridge to Truong Dai bridge, at Cho Cau bridge area;
- From Cho Cau bridge to Truong Dai bridge, at Truong Dai bridge area (Soil was covered
from 2012-2013);
- From Truong Dai to An Loc bridge, at Cau Cut canal area (Soil was covered from 2013);
- From Truong Dai to An Loc bridge. at Ba Mien canal area (Soil was covered from 09/2015);
- From An Loc bridge to Sai Gon river, at Ong Tong canal area (Soil was covered from 2012
to2013);
- From An Loc bridge to Sai Gon river, at Ong Bau canal area (Soil was covered from
08/2015).

Environmental and Social Impact Assessment, HCMC Steering Center of the Urban
and Environmental and Social Management Plan Flood Control Program
Proposed HCMC Flood Risk Management Project Date Submitted: December 2, 2015
81
All most parameters of soil do not exceed the allowable value of QCVN 03:2008/ BTNMT for
residental and commercial land. Cu concentration of S7 - from An Loc bridge to Sai Gon river,
at Ong Tong canal area (Soil was covered from 2012-2013) exceed the allowable value of
QCVN 09:2008/ BTNMT for residental land.
3.3.6. Sludge quality/Sediment
Surveying and sampling were conducted on 12 and 13 October 2015. Sediment samples were
taken at 12 points (see Annex 2). For each points, the sediments are taken at 02 layers, at the
depth of 0.1 m (surface sludge) and 0.5 m (depth layer).
All parameters of sediment samples do not exceed the allowable value of QCVN 43:2012/
BTNMT – National technical regulation on sediment quality.
3.3.7. Aquatic and Plankton
Surveying and sampling were conducted on 12 and 13 October 2015. The Aquatic and Plankton
sampling were taken at 10 points for two tide (high tide and low tide) including 02 samples at the
two ends of the main canal, 06 samples at conjunction of the 06 secondary canals with the main
canal; 01 samples in central section of the main canal at the An Lac bridge near Tan Tao IZ
WWTP; 01 samples near outlet of the WWTPs of Tan Binh.
Phytoplankton
Species composition
According to the results of the study on community structure, a total 31 species belonged to 4
class including Cyanophyceae, Chlorophyceae, Euglenophyceae và Bacillariophyceae were
distinguished. Among them, species of Bacillariophyceae (Pennales), Chlorophyceae and
Euglenophyceae had the highest species number fluctuating from 7 to 9 species. All of
phytoplankton species in the project area were originated from fresh water.
Most species of Cyanophyceae, Chlorophyceae and Euglenophyceae indicated for the rich
nutrient water and organic pollution.
Lowest number of species (5 species) are recorded in SW3-LT, whereas SW2-HT and SW9-HT
are recognized position with the highest number of species (17-18 species). Most of the other
samples had 8-12 species.
Phytoplankton abundance and Indices
Quantity of phytoplankton in the project area highly fluctuated from 3,380,000 to 25,250,000
organisms/m3. Phytoplankton abundance at SW10-HT is the highest value and lowest value at
SW1-LT.
The results show that most species of Cyanophyceae, Chlorophyceae and Euglenophycea are
pollution indicator species for mesosaprobic level to polysaprobic level such as Oscillatoria sp.1,
Oscillatoria sp.2, Nitzschia sigma, Nitzschia vitrea, Actinastrum hantzschii, Ankistrodesmus
gracilis, Ankistrodesmus spiralis, Pediastrum duplex, Pediastrum tetras, Scenedesmus

Environmental and Social Impact Assessment, HCMC Steering Center of the Urban
and Environmental and Social Management Plan Flood Control Program
Proposed HCMC Flood Risk Management Project Date Submitted: December 2, 2015
82
accuminatus, Scenedesmus quadricauda, Euglena acus, Euglena oxyuris, Lepocinclis fusiformis,
Phacus pleuronectes.
Biodiversity index H‘: biodiversity index H‘ of phytoplankton had a value from 0.94 to 2.42.
Among them, most of the monitoring positions have the average H‘ value from 1 to 2, indicating
for low biodiversity.
Dominant index D: dominant index D of phytoplankton had a value from 0.24 to 0.75. There‘s
over 65% samples with D index value approximately 0.5 or higher. This suggests the stability is
not high in phytoplankton community. Additionally, most dominant species in these samples are
pollution indicator species, except in SW1, SW2 and SW4.
Zooplankton
Species composition
Based on the analysis, 15 species and 1 larva of zooplankton were recorded in the project area.
The number of Cladocera species prevails in species composition but not dominant high (5
Cladocera species/total 16 species).
All of zooplankton species in the project area were originated from fresh water. There were low
species in each sample ranging from 1 species to 7 species. Lowest number of species (1-2
species) are recorded in SW5 and SW8, whereas SW10 are recognized position with the highest
number of species (5-7 species).
Zooplankton abundance and Indices
Quantity of zooplankton in the project area highly fluctuated from 300 organisms/m3 (at SW5-
HT) to 4,300 organisms/m3
(at SW7-HT). The dominant species were Paramoecium putrinum,
Philodina roseola, Scaridium longicaudum, Pristina longiseta, Moina dubia, Thermocyclops
hyalinus.
Biodiversity index H‘: biodiversity index H‘ of zooplankton had a value from 0 to 1.68. H‘ of
SW10-HT is the highest zooplankton biodiversity index, whereas H‘ of SW3-HT, SW5, SW8
are recorded as the lowest zooplankton biodiversity indices (H‘ from 0 to 0.67).
Dominant index D: dominant index D of zooplankton had a value from 0.29 to 1. The highest D
value, the highest instability in aquatic organisms. Thus, the results show that the highest
stability of zooplankton recorded at SW2-LT, SW3-LT and SW9; the lowest stability of
zooplankton recorded at SW5-HT, SW8-HT with maximun D value.
Benthic macroinvertebrates
Species composition
The results show that only 3 species of Oligochaeta Limnodrilus hoffmeisteri, Branchiura
sowerbyi and Aulodrilus pluriseta were recorded in the project area. These species indicated for
the rich nutrient water and organic pollution from mesosaprobic level to polysarprobic level.
Benthic macroinvertebrates abundance and Indices
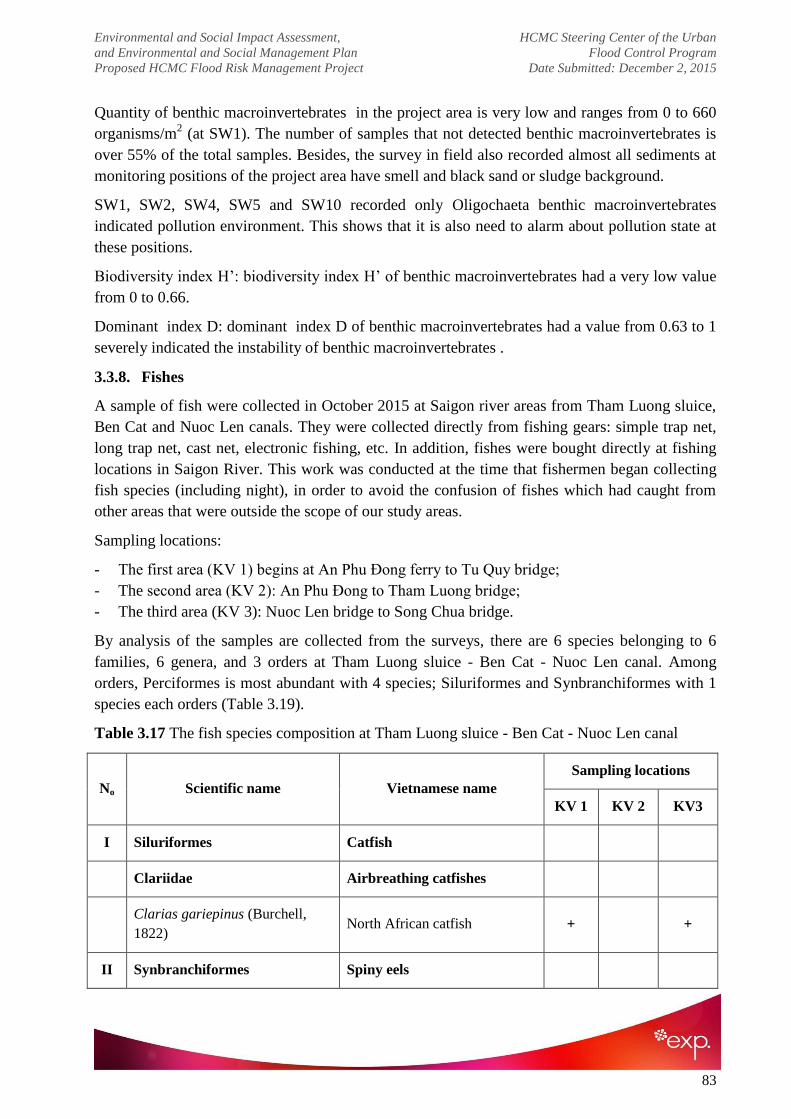
Environmental and Social Impact Assessment, HCMC Steering Center of the Urban
and Environmental and Social Management Plan Flood Control Program
Proposed HCMC Flood Risk Management Project Date Submitted: December 2, 2015
83
Quantity of benthic macroinvertebrates in the project area is very low and ranges from 0 to 660
organisms/m2 (at SW1). The number of samples that not detected benthic macroinvertebrates is
over 55% of the total samples. Besides, the survey in field also recorded almost all sediments at
monitoring positions of the project area have smell and black sand or sludge background.
SW1, SW2, SW4, SW5 and SW10 recorded only Oligochaeta benthic macroinvertebrates
indicated pollution environment. This shows that it is also need to alarm about pollution state at
these positions.
Biodiversity index H‘: biodiversity index H‘ of benthic macroinvertebrates had a very low value
from 0 to 0.66.
Dominant index D: dominant index D of benthic macroinvertebrates had a value from 0.63 to 1
severely indicated the instability of benthic macroinvertebrates .
3.3.8. Fishes
A sample of fish were collected in October 2015 at Saigon river areas from Tham Luong sluice,
Ben Cat and Nuoc Len canals. They were collected directly from fishing gears: simple trap net,
long trap net, cast net, electronic fishing, etc. In addition, fishes were bought directly at fishing
locations in Saigon River. This work was conducted at the time that fishermen began collecting
fish species (including night), in order to avoid the confusion of fishes which had caught from
other areas that were outside the scope of our study areas.
Sampling locations:
- The first area (KV 1) begins at An Phu Đong ferry to Tu Quy bridge;
- The second area (KV 2): An Phu Đong to Tham Luong bridge;
- The third area (KV 3): Nuoc Len bridge to Song Chua bridge.
By analysis of the samples are collected from the surveys, there are 6 species belonging to 6
families, 6 genera, and 3 orders at Tham Luong sluice - Ben Cat - Nuoc Len canal. Among
orders, Perciformes is most abundant with 4 species; Siluriformes and Synbranchiformes with 1
species each orders (Table 3.19).
Table 3.17 The fish species composition at Tham Luong sluice - Ben Cat - Nuoc Len canal
No Scientific name Vietnamese name
Sampling locations
KV 1 KV 2 KV3
I Siluriformes Catfish
Clariidae Airbreathing catfishes
Clarias gariepinus (Burchell,
1822) North African catfish + +
II Synbranchiformes Spiny eels

Environmental and Social Impact Assessment, HCMC Steering Center of the Urban
and Environmental and Social Management Plan Flood Control Program
Proposed HCMC Flood Risk Management Project Date Submitted: December 2, 2015
84
No Scientific name Vietnamese name
Sampling locations
KV 1 KV 2 KV3
Synbranchidae Swamp-eels
Monopterus albus (Zuiew, 1793) Asian swamp eel +
III Perciformes Perch-likes
1 Anabantidae Climbing gouramies
Anabas testudineus (Bloch, 1792) Climbing perch
2 Helostomatidae Kissing gourami
Helostoma temminkii Cuvier, 182
9 Kissing gourami
3 Osphronemidae Gouramies
Trichopodus trichopterus (Pallas,
1770) Three spot gourami
4 Channidae Snakeheads
Channa striata (Bloch, 1793) Striped snakehead
Total 5 0 2
There are 5 fish species, such as Clarias gariepinus, Anabas testudineus, Helostoma temminkii,
Trichopodus trichopterus, Channa striata at the near An Phu Đong ferry areas, form Mieu Noi to
the junction of Saigon river. Often found in areas with dense vegetation (as water hyacinth) and
closing to the riverside. These fish have very small size. They are sold to farmers who feed them
in the ponds near Saigon river or made cattle food.
Average fishing production of long trap net about 2-5kg/per day. Anabas testudineus making up
of 32% of the total species number, Clarias gariepinus: 20%, Trichopodus trichopterus: 5%, the
remaining fish species make up rather low rate. Large size species are released into the river for
religion purpose, they make up 43% of the total species number.
Results record that these fish species have high fishing production in the rainy season, their
production can estimate 10-30 kg/per day for long trap net and electronic scoop net.
Clarias gariepinus and Monopterus albus are main species that are caught by cast net and long
trap net with the number of the number of individuals are very few at the Nuoc Len bridge areas.
They concentrate mainly in close to shore but almost totally absent in the river bed.

Environmental and Social Impact Assessment, HCMC Steering Center of the Urban
and Environmental and Social Management Plan Flood Control Program
Proposed HCMC Flood Risk Management Project Date Submitted: December 2, 2015
85
The remaining areas (from An Lac bridge to Tham Luong-Nuoc Len bridges) aren‘t almost
recorded and collected fish sampling. Consultative results of fishermen who are living along the
riverside, show that fish species can‘t afford to live in these areas, as well as the fishemen can‘t
catch any fish in here.

Environmental and Social Impact Assessment, HCMC Steering Center of the Urban
and Environmental and Social Management Plan Flood Control Program
Proposed HCMC Flood Risk Management Project Date Submitted: December 2, 2015
86
CHAPTER 4: ANALYSIS OF PROJECT ALTERNATIVES
4.1. Analyses Of Needs Of The Project
Ho Chi Minh City (HCMC) is the economic centre of Vietnam and accounts for a large
proportion of Vietnam economy. Thanks to its favourable natural conditions HCMC became an
important traffic hub for Vietnam and Southeast Asia, including road, railway, waterway and
airway. However, due to rapid population growth, inadequate and poorly
functional infrastructure, low public awareness. HCMC is challenged with significant flood and
environmental pollution.
HCMC, in recent years, has been significantly flooded, especially during rainy season from June
to November and during flood-tide between September and December. Flooding in HCMC is
caused by high intensity of rainfall, flood-tide, poor effectiveness of wastewater drainage system
in rural area, inefficient operation of reservoirs and land subsidence due to groundwater
withdraw. Heavy rainfall events have been increased in recent centuries. Wastewater and storm
water drainage systems of HCMC have been downgraded and overloaded during heavy rainfall
events while those systems have still not been constructed in many places in HCMC. As a result,
flooding due to high rainfall intensity has been frequent. High tides in the East Sea obstruct
water flow of upstream river and the urban drainage to the sea causing flash floods. On top of
these, HCMC is also challenged with inflow of the East Sea to canal system. This inflow causes
an increase of water level in canals and obstructs its flow from the City centre to Sai Gon River,
especially during high tides.
In addition to frequent high intensity rainfall and high tides, flooding in HCMC is caused by
draining water from hydropower and irrigation reservoirs located in the upstream. HCMC, in
2000, was severely flooded due to draining water of Tri An reservoir (2.000 m3/s) and Dau Tieng
reservoir (600 m3/s). Furthermore, HCMC is affected by flooding in Mekong River through Vam
Co Dong and Vam Co Tay rivers.
Regarding the feasible study 2012 conducted by HCMC Government, flooding in HCMC is a
frequent event affecting an area of 5,944 ha (40% of total area of the catchment) and a
population of 700,000 inhabitants (35% of total people living in the catchment).
In addition to the flooding, the causes of which include direct discharge of untreated wastewater
to canals, creeks and rivers. Industrial operation along canals and discharge of community
activities has been considered as major source of pollutants that cause severe damage of them.
Ho Chi Minh City has five large Canals, including Nhieu Loc Thi Nghe Canal, Tau Hu Ben
Nghe Canal, Doi Te Canal, Tan Hoa Lo Gom Canal and Tham Luong Ben Cat Canal. Excepting
Tham Luong Ben Cat Nuoc Len Canal, the other have been supported by international
organisations to construct and operate facilities relating to drainage, flood control and pollutants
removal, such as World Bank for Nhieu Loc Thi Nghe Canal and Tan Hoa Lo Gom Canal, JICA
for Tau Hu Ben Nghe Canal and Doi Te Canal.

Environmental and Social Impact Assessment, HCMC Steering Center of the Urban
and Environmental and Social Management Plan Flood Control Program
Proposed HCMC Flood Risk Management Project Date Submitted: December 2, 2015
87
In fact, the upgrading of Tham Luong Ben Cat Nuoc Len Canal and its associated facilities and
infrastructures requires many of construction works that requires the HCM City Government to
call for budget for this investment and potentially affect to environment and socioeconomics
along the Canal and at area within the catchment area of the Canal. For social impact, the
upgrading of main Canal will require land acquisition where affected people will need to relocate
to resettlement sites. Consequently, their livelihood and culture and social relations will be
affected accordingly. For environment, the construction and operation works will cause negative
impacts to local residents and environmental receptors (ambient air, surface water, soil and
groundwater, terrestrial and aquatic ecology).
However, if compared to negative impacts of upgrading the canal and its associated facilities, the
negative impacts of floodwater and pollution from no upgrading those is much more substantial,
relating to human health, livelihood, transportation, infrastructure and water sanitation. An
upgrading the Canal and its associated facilities and infrastructures are highly important that will
bring many of benefits on significant improvement of environment performance and drainage
capacity, from where HCMC residents, entrepreneurs and functional departments are ensured to
be beneficial including:
For HCMC residents:
Being able to live in improved environmental and living condition, whereby they can
improve their health, security and safety;
Reducing poverty and having more opportunities to develop their own business (i.e. tourism
activities, restaurants, shop) to increase their income;
For entrepreneurs
Domestic and international manufacturing enterprises and companies located in the drainage
catchment will be no longer challenged with vicious cycle of flooding and environmental
pollution, whereby, their business can be developed stably and their economic growth target can
be achieved, positively contributing to the economic growth of HCMC and stabilising the
income of their labour.
Government department
Being provided professional training relating to operation of modern system, programs and
facilities of flood risk management.
4.2. With Project Alternatives
4.2.1. Sub-component 2.1: Construction of Nuoc Len combined tidal sluice gate and 02
ship locks
Nuoc Len tidal sluice gate and ship locks are proposed to be located in Nuoc Len Creek to
enhance the capacity of draining rainwater, prevent inundation due to rain and tidal flood and sea
level rise for now and for the future and ensure water navigation in case sluice closed and
establishing bus routes in the Canal. This sub-component is proposed two options of locations

Environmental and Social Impact Assessment, HCMC Steering Center of the Urban
and Environmental and Social Management Plan Flood Control Program
Proposed HCMC Flood Risk Management Project Date Submitted: December 2, 2015
88
and two technical designs whose impacts analyses on environment, socioeconomic, engineering
and economic are shown in Table 4.1.
Table 4.1 Alternatives on locations of Nuoc Len combined sluice gate and ship locks
Alternatives Options 1 Option 2
Description The combined sluice gate and ship
locks is located 400 m distant from
Cho Dem river side, near the Phu
Dinh Port
The combined sluice gate and ship
locks are located 1,740m distant from
Cho Dem river side, near the Nuoc
Len bridge.
Technical More difficult
Construction is more complex as the
inland waterway is more condensed
than option 2. The width of the river
section is larger than option 2 (50
compared to 40m) and the river
section is more winding.
Less difficult.
Environment During construction, the cumulative
impacts on air emission, noise, water
quality is higher as the location is
already condensed with other
emission sources
During construction, the cumulative
impacts on air emission, noise, water
quality is lower than option 1 as the
location is more remote than the
option 1
Social Risk on waterway traffic congestion
and accidents is higher than option 1
Land acquisition and resettlement is
not required
Risk on waterway traffic congestion
and accidents is lower than option 1
Land acquisition and resettlement is
required
Cost Lower cost due to no requirement of
land acquisition and resettlement
Higher cost due to land acquisition
and resettlement
Conclusion:
Even having lower investment cost, the location at 400m from Cho Dem riverside was rejected
given construction method of this sub-component at this site is more complicated and
construction at this site will bring more cumulative impacts on environmental and social
receptors (air quality, surface water and groundwater, soil, terrestrial and aquatic ecology, inland
waterway traffic) than that at 1,740 m distant from Cho Dem Riverside.

Environmental and Social Impact Assessment, HCMC Steering Center of the Urban
and Environmental and Social Management Plan Flood Control Program
Proposed HCMC Flood Risk Management Project Date Submitted: December 2, 2015
89
Table 4.2 Alternatives on technical design of Nuoc Len combined sluice gate and ship locks
Alternatives Options 1 Option 2
Description Sluice gates and two chambers of
ship lock arranged at same side of
the sluice gate
The sluice gate and two chambers of
ship lock arranged at both side of the
sluice gate
Technical Construction is less completed Construction is more complex
Social The likelihood of inland waterway
congestion and even accidents
during operation phase is higher.
During operation phase, it is expected
low marine traffic congestion or even
accidents
Environment Due to the higher likelihood of
traffic congestion, cumulative impact
on air emission, noise, water quality
at the site of investment will higher
Due to the higher likelihood of traffic
congestion, cumulative impact on air
emission, noise, water quality at the
site of investment will less
Cost Lower Higher
Conclusion:
The generated environmental impacts are not very much different between two options during
construction phase, but are relatively different during operation phase, where the likelihood of
inland waterway congestion and even accidents resulted from option 1 will be higher, which
likely leads to cumulative impacts on environmental (air emission, noise, water quality) and social
receptors (inland waterway traffic). Even having higher investment cost, the option 2 was
selected as it bring less environmental and social impacts.
4.2.2. Sub-component 2.1: Construction of Vam Thuat tidal sluice gate and 2 ship locks
Similar to the sub-component 1, two options of location and technical designs were proposed for
sub-component 2, Vam Thuat tidal sluice gate and 2 ship locks. Table 4.3 presents an analysis
of impacts on environment, socioeconomic, engineering and economic aspects for those options.
Table 4.3 Alternatives on locations of Vam Thuat combined sluice gate and ship locks
Alternatives Options 1 Option 2
Description The combined sluice gate and ship
locks is located 200 m distant from
Sai Gon river side
The combined sluice gate and ship
locks is located 600 m distant from Sai
Gon river side
Technical More difficult
Construction is more complex as the
inland waterway is deeper and more
Less difficult.

Environmental and Social Impact Assessment, HCMC Steering Center of the Urban
and Environmental and Social Management Plan Flood Control Program
Proposed HCMC Flood Risk Management Project Date Submitted: December 2, 2015
90
Alternatives Options 1 Option 2
widening than option 2.
Environment During construction, environmental
impact significance is more given
the residents located nearby the site.
During construction, environmental
impact significance is less given the
residents nearby are fewer.
Social More residents are affected by the
project construction and operation
Land acquisition and resettlement is
required
Fewer residents are affected by the
project construction and operation
Land acquisition and resettlement is
not required
Cost Higher cost due to requirement of
land acquisition and resettlement
and more complex method of
construction
Lower cost due to no requirement of
land acquisition and resettlement and
simple method of construction
Conclusion:
Due to having fewer impacts on environmental and social receptors together with lower cost of
no land acquisition and resettlement and simple method of construction, option 2 was selected.
Table 4.4 Alternatives on technical design of Vam Thuat combined sluice gate and ship locks
Alternatives Options 1 Option 2
Description Sluice gates and two chambers of
ship lock arranged at same side of
the sluice gate
The sluice gate and two chambers of
ship lock arranged at both side of the
sluice gate
Technical Construction is less completed Construction is more complex
Social The likelihood of inland waterway
congestion and even accidents
during operation phase is higher.
During operation phase, it is expected
low marine traffic congestion or even
accidents
Environment Due to the higher likelihood of
traffic congestion, cumulative impact
on air emission, noise, water quality
at the site of investment will higher
Due to the higher likelihood of traffic
congestion, cumulative impact on air
emission, noise, water quality at the
site of investment will less
Cost Lower Higher

Environmental and Social Impact Assessment, HCMC Steering Center of the Urban
and Environmental and Social Management Plan Flood Control Program
Proposed HCMC Flood Risk Management Project Date Submitted: December 2, 2015
91
Conclusion:
The generated environmental impacts are not very much different between two options during
construction phase, but are relatively different during operation phase, where the likelihood of
inland waterway congestion and even accidents resulted from option 1 will be higher, which
likely leads to cumulative impacts on environmental (air emission, noise, water quality) and social
receptors (inland waterway traffic). Even having higher investment cost, the option 2 was
selected as it bring less environmental and social impacts.
4.2.3. Sub-component 2.2: Improvement/Upgrading of revetment in the main canal of
Tham Luong – Ben Cat – Nuoc Len
The location of this sub-component was assigned by the local government, at Tham Luong Ben
Cat Nuoc Len Canal. Therefore, alternative for locations is not analysed. For technical design,
two technical designs were proposed as presented in Table 4.5 that shows an analyses of
alternative options.
Table 4.5 Alternatives on technical design for the embankment of Tham Luong-Ben Cat-Rach
Nuoc Len canal
Alternatives Options 1 Option 2
Description Combined slope revetment at the two
ends (at the end of Vam Thuat and
Nuoc Len canals) and vertical
revetment (the centre section).
Building vertical embankment for the
whole Canal.
Technical Less complicated as the slope
embankment does not require
installation of vertical pile to prevent
subsidence.
Need less mobilization of heavy
equipment for piling work.
The topographic elevation of the Canal was
affected by accumulation of sediment. In
order to install vertical piles, the
construction procedure is more complicated
as requiring additional technical solution to
deal with subsidence.
In addition, given the sub-component is
wholly constructed with vertical roof
embankment, this needs more heavy
equipment for pilling works.
Social Land acquisition at the two ends is
higher, as the slope embankment will
require more land.
Land acquisition at the two ends is less.

Environmental and Social Impact Assessment, HCMC Steering Center of the Urban
and Environmental and Social Management Plan Flood Control Program
Proposed HCMC Flood Risk Management Project Date Submitted: December 2, 2015
92
Alternatives Options 1 Option 2
Environment Lower impacts on noise and
vibration during construction.
Fewer dredging works generate
fewer sludge amounts, reducing
negative impacts on air emission
from sludge transportation.
Lower risk on subsidence of houses.
Higher impacts on noise and vibration
during construction period due to piling
work.
More dredging works generate more sludge
amounts, increasing negative impacts on air
emission from sludge transportation.
Higher risk on subsidence of houses.
Cost - For land acquisition higher
- For construction, lower as it
required less complex construction
method for the slope revetment
section.
In total, this option result is lower
cost.
- Cost for land acquisition is lower
- Cost for construction is higher as it
required more complex construction
method.
In total, this option result in higher cost.
Conclusion:
Even requiring land acquisition, the option 1 was selected due to having fewer impacts on
environmental during construction phase together with lower cost and simple method of
construction.
4.2.4. Sub-component 2.3: Construction of drainage culvert system in Go Vap district
Location of the drainage culvert system is along the right bank of Tham Luong – Ben Cat canal
where starting point of the drain is Cho Cau bridge - Go Vap District and ending point of the
drain is collecting wells of the waste water treatment plan at An Phu Dong ward, District 12.
Two options of constructing the drainage culvert system are: (i) constructing interceptors with
installation of pumping stations; and (ii) constructing interceptors without installation of
pumping stations. Table 4.4 presents analyses of impacts on environment, socioeconomic,
engineering and economic aspects for those options.
Table 4.6 Alternatives on technical design of drainage culvert system in Go Vap district
Alternatives Options 1 Option 2
Description Constructing interceptors by
excavation of soil.
Constructing interceptors by hydraulic jack.
Technical Being simpler as requiring excavation
equipment to make trenches.
Being more complicated as requiring high-
tech equipment and well trained employees

Environmental and Social Impact Assessment, HCMC Steering Center of the Urban
and Environmental and Social Management Plan Flood Control Program
Proposed HCMC Flood Risk Management Project Date Submitted: December 2, 2015
93
Alternatives Options 1 Option 2
Social Large occupation of land leads to
more impacts on the livelihood of
nearby residents.
The likelihood of traffic congestion
and even accidents during
construction phase is higher.
Less occupation of land leads to fewer
impacts on the livelihood of nearby residents.
The likelihood of traffic congestion and even
accidents during construction phase is lower.
Environment Due to the higher likelihood of
traffic congestion, cumulative
impact on air emission, noise, water
quality at the site of investment will
higher.
The volume of soil generated is
higher due to excavation to make
trenches. The vehicles that are
required to transport soil to disposal
site potentially affect to air quality
and ambient noise.
Due to the lower likelihood of traffic
congestion, cumulative impact on air
emission, noise, water quality at the site of
investment will less.
Impacts on air quality and ambient noise are
fewer.
Cost Lower cost due to low-tech
equipment and unskilled labour
Higher cost due to high-tech equipment and
skilled employees
Conclusion: Even having higher cost of construction and more complex method, it was selected
due to being of significantly lower impacts on environmental and social receptors.
4.2.5. Sub-component 2.3: Construction and improvement of primary and secondary
combined sewer systems and the secondary interceptor in Go Vap district
The scope of works of this project is to construct and improve primary and secondary combined
sewer systems and the secondary interceptor in Go Vap District. The areas of the project has a
circle form from the North Eastern part to the South Western part of the City, connecting Sai
Gon river from the East to Cho Dem river from the South West. It includes three regions: Go
Vap District, 5 wards of District 12 and ward 13 of Binh Thanh District with estimation of 4,361
ha. The sub-component 5 requires an application of semi-separate sewer system for Binh Thanh
District and Go Vap District and separate sewer system for District 12. Table 4.5 presents
analyses of impacts on environment, socioeconomic, engineering and economic aspects for those
options.

Environmental and Social Impact Assessment, HCMC Steering Center of the Urban
and Environmental and Social Management Plan Flood Control Program
Proposed HCMC Flood Risk Management Project Date Submitted: December 2, 2015
94
Table 4.7 Alternatives on technical design of primary and secondary combined sewer systems
and the secondary interceptor in Go Vap district
Alternatives Options 1 Option 2
Description - Semi-separate sewer system
- Trench technology
- Separate sewer system
- Hydraulic jack
Technical Semi-separate sewer system
Under the existing sewer system of Go
Vap District, the construction design of
semi-separate sewer system is more
complex given the it is more
complicated, in which some sections
were damaged that need to be replaced
Trench technology
This technology is simpler as it only
requires excavation equipment to make
trenches.
Separate sewer system
Under the existing sewer system of
District 12, the system construction is
simpler because it is likely remote are,
where the sewer system has been not
fully developed.
Hydraulic Jack
This technology is more complicated
given it requires high-tech equipment
and well skilled employees.
Social Trench technology
Large occupation of land leads to more
impacts on the livelihood of nearby
residents.
The likelihood of traffic congestion and
even accidents during construction
phase is higher.
Hydraulic Jack
Less occupation of land leads to fewer
impacts on the livelihood of nearby
residents.
The likelihood of traffic congestion
and even accidents during
construction phase is lower.
Environment Due to the higher likelihood of traffic
congestion, cumulative impact on air
emission, noise, water quality at the
site of investment will higher.
The volume of soil generated is higher
due to excavation to make trenches.
The vehicles that are required to
transport soil to disposal site
potentially affect to air quality and
ambient noise.
Due to the lower likelihood of traffic
congestion, cumulative impact on air
emission, noise, water quality at the
site of investment will less.
Impacts on air quality and ambient
noise are fewer.
Cost Lower cost due to low-tech equipment
and unskilled labour
Higher cost due to high-tech
equipment and skilled employees

Environmental and Social Impact Assessment, HCMC Steering Center of the Urban
and Environmental and Social Management Plan Flood Control Program
Proposed HCMC Flood Risk Management Project Date Submitted: December 2, 2015
95
Conclusion: Even having higher cost of construction and more complex method, it was selected
due to being of significantly lower impacts on environmental and social receptors.
4.2.6. Sub-component 2.4: Improvement of secondary canals (Hy Vong, Cau Cut, Ba
Mieng, Ong Tong, Ong Bau, Chin Xieng)
The sub-component 6 is undertaken with six canals, creeks connected with the main canal of
Tham Luong – Ben Cat – Nuoc Len in Tan Binh and Go Vap district from Tham Luong bridge
to Sai Gon river with total length 8.213,4m (consist of: Hy Vong canal, Cau Cut creek, Ba Mieng
creeek, Ong Tong creek, Ong Bau creeek, Chin Xieng creek).
Table 4.8 Alternatives on technical design of secondary canals (Hy Vong, Cau Cut, Ba Mieng,
Ong Tong, Ong Bau, Chin Xieng)
Alternatives Options 1 Option 2
Description Culvert box is proposed for canals at
where cross section is narrow and its
surface water is heavily polluted
Open canal – It is used for canals
with large existing cross-sections.
Technical Being more complex due to
transporting and laying the culvert
box into trench
Being more simple
Social Transporting and laying the culvert
box to the project site can affect to
safety of local residents given those
can be collapsed.
Fewer impacts on safety of local
residents
Environment Potential impacts on environment and
social receptors generated from
upgrading the canal to be open canals
are impacts on land acquisition,
odours, water quality, solid waste,
noise and vibration.
Not different
Cost Lower due to no land acquisition Higher due to land acquisition
CHAPTER 5: ENVIRONMENTAL IMPACT ASSESSMENT

Environmental and Social Impact Assessment, HCMC Steering Center of the Urban
and Environmental and Social Management Plan Flood Control Program
Proposed HCMC Flood Risk Management Project Date Submitted: December 2, 2015
96
AND PROPOSED MITIGATION MEASURES
5.1. Environmental Impact Assessment
5.1.1. Expected Positive Impact
Component 1: Integrated Urban Flood Risk Management
Densification and modernization of monitoring equipment widens the coverage, reliability
and quality of rainfall observations and flood forecasting;
Enhanced technical and scientific capacity of staff involved in flood forecasting, flood
management and development planning, and disaster risk reduction management;
Instantaneous receipt of information between agencies and the ability to do ―what-if‖ scenario
simulations with the system.
Strengthening the capacity of agency involved in water quality monitoring;
Improvement of the local capacity and awareness for better solid waste management.
Component 2: Priority Flood Risk Reduction Interventions
For HCMC residents:
Being able to live in improved environmental and living condition, whereby the community
can improve their health, security and safety;
Reducing poverty and having more opportunities to develop their own business (i.e. tourism
activities, restaurants, shop) to increase their income;
For entrepreneurs
Domestic and international manufacturing enterprises and companies located in the drainage
catchment will be no longer challenged with vicious cycle of flooding and environmental
pollution, whereby, their business can be developed stably and their economic growth target
can be achieved, positively contributing to the economic growth of HCMC and stabilizing the
income of their labors.
Government department
Being provided professional training relating to operation of modern system, programs and
facilities of flood risk management. Overall, the government capacity can be strengthened
effectively.
5.1.2. Potential Negative Impact
5.1.2.1.Type and Scale Of Project Impact
Potential impacts have been identified through a systematic process whereby the features and
activities (both planned and unplanned) associated with the pre-construction, construction, and
operation of the Project components have been considered with respect to their potential to interact
with resources/receptors. Potential impacts have each been classified in one of three categories:

Environmental and Social Impact Assessment, HCMC Steering Center of the Urban
and Environmental and Social Management Plan Flood Control Program
Proposed HCMC Flood Risk Management Project Date Submitted: December 2, 2015
97
No interaction: where the Project component‘s activities are unlikely to interact with the
resource/receptor;
Interaction likely, but not likely to be significant: where there is likely to be an interaction,
but the resultant impact is unlikely to change baseline conditions in an appreciable/detectable
way; and
Significant interaction: where there is likely to be an interaction, and the resultant impact
has a reasonable potential to cause a significant effect on the resource/receptor.
As a tool for conducting scoping, the various component features and activities that could
reasonably act as a source of impact were identified, and these have been listed down the vertical
axis of a Potential Interactions Matrix. The resources/receptors relevant to the Baseline
environment have been listed across the horizontal axis of the matrix. Each resulting cell on the
Potential Interactions Matrix thus represents a potential interaction between a Project
feature/activity and a resource/ receptor. The completed Potential Interactions Matrix is
presented in Table 5.1.
Those cells that are coloured white are ‗scoped out‘ of further consideration in the IA Process.
Those interactions that are shaded black are retained for further consideration in the IA Process.
It should be noted that the list of Project activities is not intended to be exhaustive but rather an
identification of key aspects of the operations that have the potential to interact with the
environment and cause environmental impacts. The list of resources/receptors is also a focused
list of the key aspects of the environment that are considered vulnerable or important in the
context of the project‘s construction and operation activities.
Cumulative impacts will be presented in a section 5.3 in which the cumulative impact assessment
will linked to impacts assessment of for activities of the project component 1 and component 2.
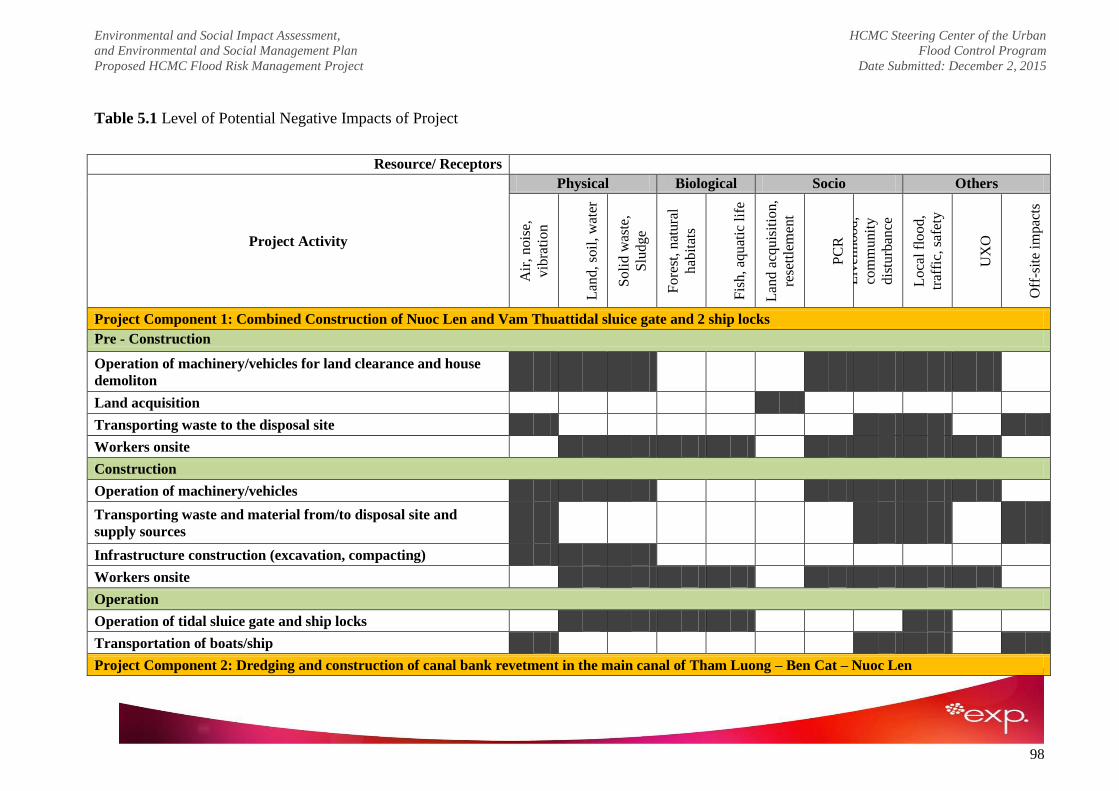
Environmental and Social Impact Assessment, HCMC Steering Center of the Urban
and Environmental and Social Management Plan Flood Control Program
Proposed HCMC Flood Risk Management Project Date Submitted: December 2, 2015
98
Table 5.1 Level of Potential Negative Impacts of Project
Resource/ Receptors
Project Activity
Physical Biological Socio Others
Air
, nois
e,
vib
rati
on
Lan
d,
soil
, w
ater
Soli
d w
aste
,
Slu
dge
Fore
st,
nat
ura
l
hab
itat
s
Fis
h, aq
uat
ic l
ife
Lan
d a
cquis
itio
n,
rese
ttle
men
t
PC
R
Liv
elih
ood,
com
munit
y
dis
turb
ance
Loca
l fl
ood,
traf
fic,
saf
ety
UX
O
Off
-sit
e im
pac
ts
Project Component 1: Combined Construction of Nuoc Len and Vam Thuattidal sluice gate and 2 ship locks
Pre - Construction
Operation of machinery/vehicles for land clearance and house
demoliton
Land acquisition
Transporting waste to the disposal site
Workers onsite
Construction
Operation of machinery/vehicles
Transporting waste and material from/to disposal site and
supply sources
Infrastructure construction (excavation, compacting)
Workers onsite
Operation
Operation of tidal sluice gate and ship locks
Transportation of boats/ship
Project Component 2: Dredging and construction of canal bank revetment in the main canal of Tham Luong – Ben Cat – Nuoc Len

Environmental and Social Impact Assessment, HCMC Steering Center of the Urban
and Environmental and Social Management Plan Flood Control Program
Proposed HCMC Flood Risk Management Project Date Submitted: December 2, 2015
99
Pre - Construction
Operation of machinery/vehicles for land clearance and house
demoliton
Land acquisition
Transporting waste to the disposal site
Workers onsite Construction
Operation of machinery/vehicles Transporting waste and material from/to disposal site and
supply sources
Workers onsite
Operation
Operation of the rehabiliateted canal
Transportation of boats/ship
Activities of visitor at the project site
Project Component 3: Selected storm and waste water systems in Go Vap District
Construction
Operation of machinery/vehicles
Transporting waste and material from/to disposal site and
supply sources
Workers onsite
Operation
Operation of sewage pipes
Project Component 6: Improvement of secondary canals (Hy Vọng, Cầu Cụt, Bà Miêng, Ông Tổng, Ông Bầu, Chín Xiểng).
Pre - Construction
Operation of machinery/vehicles for land clearance and house
demoliton

Environmental and Social Impact Assessment, HCMC Steering Center of the Urban
and Environmental and Social Management Plan Flood Control Program
Proposed HCMC Flood Risk Management Project Date Submitted: December 2, 2015
100
Land acquisition
Transporting waste to the disposal site
Workers onsite Construction
Operation of machinery/vehicles
Transporting waste and material from/to disposal site and
supply sources
Workers onsite
Operation
Operation of the rehabiliateted canal
Transportation of boats/ship
Activities of visitor at the project site

Environmental and Social Impact Assessment, HCMC Steering Center of the Urban
and Environmental and Social Management Plan Flood Control Program
Proposed HCMC Flood Risk Management Project Date Submitted: December 2, 2015
101
5.1.2.2.Socioeconomic Impact
(i) Land Acquisition and Resettlement
Involuntary Resettlement is the inevitable relocation affects in the process of implementing the
project, including affected people (PAP) to rebuild their homes, property and income restoration.
The affected include those subject to compulsory land acquisition by the projects financed by the
World Bank and lead to: Must relocate or be homeless; Lose assets or ability to access to assets;
Lose income sources or means of livelihood, whether people affected should or not to move to
another location; and be restricted access to the area is required by law or protected areas
detrimental to the livelihoods of those affected.
(ii) Potential differential impacts on women and vulnerable in particular landless HH to be
relocated
No differential adverse impacts were identified on any vulnerable households. In almost all such
cases there was other earning members in the households. However, with disabled persons the
households face higher expenditures on medical treatment and loss of productive members. For
single women with dependents tend to have unstable income from professions like making nail,
selling lottery tickets, hairdressing and making-up, propose to building small credit program
suitably for this group may develop household economy.
(iii) Other social impacts
Component 2: Priority Flood Risk Reduction Interventions
Affect the movement of people during construction;
The risk of impoverishment for occupied households living in the TLBCNL canals and river
embankments;
The risk of accidents on workplace safety without adequate warning systems;
Increase social ills without suitable livelihood recovery programs;
Loss of family income for those traders and some business households along the Canal
The relocation of the former residence to the new place will affect people with incomes from
motorcycle/car patch, motorbikes, manicure, hairdressing, etc.
5.1.2.3.Impact to on Physical Cultural Resources (PCR)
PCR includes archaeological, paleontological, architecturally significant, and religious sites
including graveyards, burial sites, and sites of unique natural value. Initial indications are that
no observed physical or cultural resources will be affected by the project. Nevertheless, the
Contractor is responsible for familiarizing themselves with the following ―Chance Finds
Procedures‖, in case culturally valuable materials are uncovered during excavation.
5.1.2.4.Impact to Nature Habitat

Environmental and Social Impact Assessment, HCMC Steering Center of the Urban
and Environmental and Social Management Plan Flood Control Program
Proposed HCMC Flood Risk Management Project Date Submitted: December 2, 2015
102
In the project area, no rare species plants were protected as it is mainly in urban area and
agricultural land was used for resettlement purposes, there was no natural conservation area.
Therefore, project implementation and operation will bring no impact to wildlife and natural
ecosystems.
5.1.3. Detailed environment impact assessment for component 1 on Integrated Flood Risk
Management
The proposed number of weather stations, rainfall stations and hydrological stations including
the new weather radar and operations center to house equipment and other support facilities will
require land acquisition, and construction activities that will have physical impacts to the
environment.
Although information on locational as well as area requirements are not available at this time,
potential impacts can be predicted and these may include but not necessarily be limited to
involuntary resettlement; and impacts to ambient air, noise, water quality, soil and groundwater,
waste, terrestrial ecology, and noise and vibration during the pre-construction, construction and
operational phases of Component 1.
These are however anticipated to be small-scale in nature, and of shorter lifespan for each
installation sites commensurate to the duration of the construction activities of each installations,
and building requirements.
Quantitative and/or modeling requirements had not been attempted at this time due to the non-
availability of information but this can be done at a later time following the content for each of
the impacts identified and quantified for the priority infrastructures for Component 2 discussed
in the appropriate sub-sections of this report.
It is however noteworthy to mention major pre-construction activities that may have to be
undertaken and necessary to discuss the impacts associated with each development phase (pre-
construction, construction and operation) for purposes of planning, consultation and disclosure to
potential directly affected project stakeholders.
5.1.3.1.Impact assessment during pre-construction phase of component 1
a) Air quality
During site preparation, the activities of machinery and equipment may result in dust generation
and re-suspension, and emissions.
(i) Dust generated by soil disturbance from site preparation and waste handling of component
1
The site from which the installations will be placed will require preparation by way of land
disturbance and excavations that may be necessary. Wastes generated from these activities may
also require removal of vegetation, structures and other assets depending on the preferred site.
These information are not yet available at this time but it is anticipated that regardless of the site

Environmental and Social Impact Assessment, HCMC Steering Center of the Urban
and Environmental and Social Management Plan Flood Control Program
Proposed HCMC Flood Risk Management Project Date Submitted: December 2, 2015
103
circumstances, dusts maybe generated and excavated construction wastes may have to be
handled.
(ii) Transportation of construction wastes of component 1
The assessment had not determined the transportation requirements for waste handling to the
disposal site. However, it is anticipated that vehicles transporting these materials will generate
emissions from running engine, including NO2, SO2, CO, particulate matter and VOC. Given
that this emission source is mobile, the effect to the community living along the road where the
trucks will travel through to the disposal site will be expected. Unprotected waste materials in
the vehicles may be also dumped along the way.
(iii) Operation of machinery during site preparation phase of component 1
Site preparation may use equipment and machineries. Although the number and type had not
been determined for such activity, their use may generate exhaust gases from fuel burning
containing fine particle matter and other gaseous pollutants including carbon monoxide (CO),
nitrogen oxide (NO2), carbon dioxide (CO2), and sulfur dioxide (SO2). No estimate had been
made but it is expected that emissions shall meet both government and international standards
owing to the small-scale nature of the site installation activities.
The impacts of the activity are anticipated to be localized, and limited only to the local
community surrounding installation sites and communities along the transportation routes. The
impact of magnitude of the air emission is anticipated to be Small. In the absence of site-specific
baseline air quality and adopting precaution, the sensitivity of the air quality at project site and
surrounding area is High. Overall, the significance of impacts should be assigned as Moderate.
b) Noise and vibration
Noise and vibration result from the operation of machinery and vehicles during site clearing and
transportation of wastes to the disposal site. At the time of writing, the number and types of
equipment and machineries has been not defined yet, but it is anticipated that regardless of the
site circumstances, noise and vibration impacts maybe generated from site preparation. Given the
construction is undertaken within temporary duration and locally, the magnitude of the impact
can be considered as Medium. In the absence of baseline noise levels, the sensitivity of the
receptors is Medium adopting precaution against IFC standards of daytime noise levels. Overall,
significance of the impact is considered Moderate.
c) Wastewater
Wastewater including domestic wastewater and storm runoff water will be generated during land
preparation phase. At the time of writing, the number of workers, area and duration of site
preparation have been not defined yet, but it is anticipated that regardless of the site
circumstances, wastewater impacts maybe generated from site preparation. Pollutants
concentration in untreated domestic wastewater and storm runoff water are expected to be over
the QCVN 14:2008, Column B, but the magnitude of those types of wastewater is considered

Environmental and Social Impact Assessment, HCMC Steering Center of the Urban
and Environmental and Social Management Plan Flood Control Program
Proposed HCMC Flood Risk Management Project Date Submitted: December 2, 2015
104
Small given number of workers and disturbed site area is limited. Sensitivity of the receiving
stream (TLBCNL Canal, Sai Gon River and Cho Dem River) is Medium in accordance with
Decision No. 16/2014/QĐ-UBND of HCMC. Therefore, significance of the impacts is estimated
Minor.
d) Solid waste
Solid waste generated during pre-construction phase includes demolition waste, domestic waste
and hazardous waste. Given this phase may mainly include the house demolition works, the
volume of demolition waste is expected to be significantly higher than domestic waste and
hazardous waste, which is considered minor volume. At the time of writing, the workloads have
been not defined yet, but those waste types can be predicted to potentially cause environmental
impacts such as (i) generating unpleasant odor from decomposition of organic solid waste; (ii)
impact to the aesthetics of the local area surrounding each of the installation sites; (iii) blocking
of the walking pathways of local communities; (iv) increasing the concentration of suspended
solid if washed out to the adjacent waterways, for example, TLBCNL Canal; and (v)
contaminating soil, groundwater, and surface water if the oil-contaminated rags are not properly
managed.
Magnitude of those impacts are expected to be Small given the site clearance works is
undertaken at local site in anticipated temporary duration and generate small volume of solid
waste. For precaution purpose, the sensitivity of the receptor is estimated Medium. Overall, the
impact significance is ranked as Minor.
e) Traffic management
Land clearance phase will require a mobilization of machineries and equipment to undertake the
house demolition and transport the demolition waste to the disposal site. Those activities will
increase the number of vehicles on local roads and affect the normal traffic flow, may diminish
or interrupt access to properties, and can increase the number of traffic accidents, incidents and
congestion. Traffic issues tend to be the most serious at rush hours on the crowded roads. Given
the duration of land clearance phase is temporary, magnitude of those impacts are expected to be
Small. For precaution purpose, the sensitivity of the receptor is estimated Medium. Overall, the
impact significance is ranked as Minor.
f) Social disturbance
Generally, the camping site is not required during land clearance phase; therefore, its impact to
surrounding residents can be rejected. The activities of construction equipment, machinery, open
holes, transport vehicles could lead to social disturbance, risks and noise. Detail of this impact
can be referred to Chapter 7.
g) Biodiversity
The scope of land preparation has been not defined yet, but clearance of vegetation may be
required. Although there is lack of information of terrestrial ecosystem, the terrestrial wildlife is

Environmental and Social Impact Assessment, HCMC Steering Center of the Urban
and Environmental and Social Management Plan Flood Control Program
Proposed HCMC Flood Risk Management Project Date Submitted: December 2, 2015
105
defined low value of conservation based on the common information on the project site.
Consequently, the magnitude of impacts and sensitivity of the receptors are considered Small.
and Low. Overall, significance of the impacts on biodiversity is defined as Negligible.
5.1.3.2.Impact assessment during construction phase of component 1
a) Air quality
Construction activities generating the air emission include operation of machineries and
equipment, material and waste transportation, installation site soil excavation and access road
construction.
(i) Operation of machineries and equipment
Depending on the area and location, the installation sites may require heavy machinery and
vehicles in several of its activities (i.e. activities of vehicles and machinery to undertake the site
works).
The implementation schedule for Component 1 is from 2016 to 2021 (Source: Feasibility Study
2015). However, the schedules of the installation activities of all and each of the equipment have
not been established. The impacts under each of the site installations shall therefore be
considered on a per site basis which would then be short-term in duration. The extent of its
impacts is anticipated to be highly localized covering only the immediate surroundings of the
local communities. There are no baseline air qualities for each of the sites; therefore, the
sensitivity of the air quality at each site and surrounding areas is impossible to be identified.
However, for purposes of precaution, the impact of magnitude of the air emission and sensitivity
of ambient air are Medium and High. Under this circumstance, the significance of the impacts
is estimated as Major.
(ii) Transportation
The volume of materials and construction wastes to be generated has yet to be estimated for each
of the installation sites. Although the pollutants emitted by transportation vehicles also needs to
be estimated during the construction phase, it is anticipated that it will consist of carbon
monoxide, particulates, nitrogen oxide, sulfur dioxide, and hydrocarbon. The volume and
composition of these pollutants are dependent on fuel composition, level of engine maintenance,
engine temperature, and emission control technology. During the construction period,
construction materials such as cement, steel, sand etc. will be transported to the site by trucks.
The exhaust gas from these trucks may cause impacts to the communities along the route.
The assessment has indicated that impacts to air quality from machineries and vehicles used
during construction are expected to be localized, and of short-term duration. At the time of
writing, the numbers and types of vehicles have been not finalized yet; therefore, it is impossible
to correctly identify the magnitude if the impacts. However, for precaution purpose, the impact
magnitude can be considered as Medium.

Environmental and Social Impact Assessment, HCMC Steering Center of the Urban
and Environmental and Social Management Plan Flood Control Program
Proposed HCMC Flood Risk Management Project Date Submitted: December 2, 2015
106
Receptors that are expected to receive the impacts are those living along the routes where
vehicles passes through and in residential areas that maybe adjacent to the installation sites.
Although baseline air quality is not available for each of the installation sites, precaution shall
assign sensitivity of the air quality at the installation sites and surrounding areas as maybe High.
Therefore, significance of the impacts is estimated Major.
(iii) Soil excavations at installation site
The volume of potential excavated and/or filling soils for each of the installation sites have not
yet been estimated. However, it is anticipated that the concentration of TSP below the Vietnam
Standards.
The assessment anticipates that impacts to air quality from soil excavations are expected to be
localized and temporary in nature occurring over the duration of construction. The magnitude of
dust impacts is determined as Negligible based on guidance from IFC. There are no available
baselines for each of the installation sites. As a precaution, the sensitivity of the air quality at
each of the installation sites and surrounding areas is assigned High. Overall, significance of the
impacts is estimated Negligible.
(iv) Access road construction
It is not yet certain if each installation sites may need new access road or avail existing roads
(which are ideal since this will further minimize or avoid right of way concerns). If access road
maybe necessary to be constructed, dusts will be generated from loading sand and macadam into
trucks and dumping these materials onto these roads. It is expected that total dust emission
(TSP) can be estimated to be below the Vietnam standards compared.
The assessment anticipated that impacts to air quality from road construction are expected to be
localized, temporary occurring over the construction period. The magnitude of dust impacts is
determined as Negligible based on guidance from IFC. There are no baseline air qualities for
each of the installation sites. As a precaution, the sensitivity of the air quality at the installation
sites and surrounding areas is assigned High. Overall, significance of the impacts is estimated
Negligible.
b) Noise and vibration
During the construction period, noise and vibration will primarily be generated by various
vehicles and construction equipment (i.e. engines and mobile equipment). It is not certain how
many of the equipment installations will be located near residential areas, but is expected that
those can potentially generate the noise impacts to surrounding residents at least 90m (as
compared to QCVN 26:2010/BTNMT) and 600m (as compared to IFC EHS Guideline). Given
the construction is undertaken within short duration and locally, the magnitude of the impact can
be considered as Medium. In the absence of baseline noise and vibration levels, the sensitivity of
the receptors is Medium adopting precaution against IFC standards of daytime noise levels.
Overall, significance of the impact is considered Moderate.

Environmental and Social Impact Assessment, HCMC Steering Center of the Urban
and Environmental and Social Management Plan Flood Control Program
Proposed HCMC Flood Risk Management Project Date Submitted: December 2, 2015
107
c) Wastewater
The different activities during construction have the potential to generate wastewater which,
upon discharge, could lead to impacts on the quality of the adjacent and/or surrounding water
bodies. Water quality may be influenced from domestic wastewater, construction wastewater and
contaminated surface water runoff discharges. Given the construction works are mainly related
to installation and undertaken in short duration, the latter two are expected to contribute limited
pollutant loading to receiving stream.
For domestic wastewater, even the information of number of labor undertaking the installation is
unknown, domestic wastewater is usually characterized as having significant pollutant loading.
The discharge of domestic effluent varies with the implementation of each installation sites,
where the extent of the impact extent is highly localized and impact scale is estimated to be
point-based. In the absence of information about peak manpower demand for each installation
site during construction, the magnitude of this impact is anticipated to be Medium as a
precaution. In line with Decision No. 16/2014/QĐ-UBND of HCM, the sensitivity of receiving
stream (TLBCNL Canal, Sai Gon River, and Cho Dem River) is considered as Medium. For
precaution owing to lack of other attributable information, overall, significance of the impacts is
estimated Moderate.
d) Solid waste
The generation of wastes will occur in all areas associated with the construction activities and
workers facilities during the construction phase. These include domestic solid waste,
construction waste and hazardous waste.
The generation of domestic solid waste from worker activities is estimated based on the
workforce estimations during the construction phase and the likely domestic solid waste
generation rate. It is estimated that the total domestic solid waste generation rate will be between
0.3 and 0.5 kg/person/day. However, the total number of workers required for each installation
site had not yet been estimated. Therefore, the total volume cannot be also estimated but the
impact can be estimated using the per capita generation discussed above.
Building and construction wastes from construction activities especially for the Operations
Center will be generated. The waste composition mainly includes excavated soils generated from
preparation of the equipment and building foundation. On top of this waste, generation of other
wastes (i.e. packing waste, steel, rock, and cement and many others) can be considered, but may
not be significant in amount for each installation sites.
Hazardous liquid wastewater and hazardous solid wastes will be generated during construction.
These may include oily wastes from machinery and vehicles, liquid waste residuals, oily and
chemical containers/drums, used batteries cartridges/fluorescent tubes, other contaminated
materials

Environmental and Social Impact Assessment, HCMC Steering Center of the Urban
and Environmental and Social Management Plan Flood Control Program
Proposed HCMC Flood Risk Management Project Date Submitted: December 2, 2015
108
The discharge of those types of waste varies with the implementation of each installation sites,
where the extent of the impact extent is highly localized and impact scale is estimated to be
point-based. In the absence of information about peak manpower demand and volume of
construction waste and hazardous waste for each installation site during construction, the
magnitude of this impact is anticipated to be Medium as a precaution. The sensitivity of
environmental receptors is also anticipated to be Medium. Overall, the significance of the
impacts is Moderate.
e) Traffic management
Land transportation for material and solid waste will increase the number of vehicles on the local
road and affect the normal traffic flow may diminish or interrupt access to properties, and can
increase the number of traffic accidents, incidents and congestion. Da Phuoc landfill is assigned
as disposal site of solid waste where the routes of transportation designed to reach include:
(i) Scenario 1: All excavated material transported by barge (the transfer site inside project
area) follows the waterway transportation route option 1 (Nuoc Len Creek to Can Giuoc
River to Da Phuoc Site) in which the traffic flow is characterized low
(ii) Scenario 2: All excavated material transported by barge (the transfer site inside project
area) follows the waterway transportation route option 2 (Vam Thuat end to Sai Gon River
to Tau Hu Ben Nghe Canal to Ong Lon Creek to Da Phuoc Site) in which the traffic flow
is characterized low.
(iii) Scenario 3: All excavated material transported by barge to the transfer site inside project
area) follows the land transportation route option 3 (Nuoc Len Creek to Nguyen Van Linh
street to Highway 50 to Da Phuoc Site) in which the traffic flow of inland waterway and
land is respectively characterized low and high.
Related to material required for project construction, it is potentially imported from surrounding
province/city including Ho Chi Minh, Ba Ria Vung Tau, Long An, Binh Duong and Dong Nai to
the project site through either inland waterway or road. Being similar to routes of waste disposal,
traffic flow of inland waterway is often lower than that of road transportation.
Impact magnitude on inland waterway and land traffic flow is assigned as Small and Medium
given the flow of the second is significantly higher than land traffic flow. For precaution
purpose, the sensitivity of the receptor is estimated Medium. Overall, the impact significance is
ranked as Minor and Moderate for inland waterway traffic and land traffic respectively.
f) Social disturbance
Following activities cause social disturbance on human health and livelihood, including: (i)
activities of the project cause air emission, noise, vibration, domestic wastewater and solid waste
at the project site; (ii) transportation through the roads causing noise and vibration and traffic
congestion and accidents; and (iii) material exporting facilities located in Ho Chi Minh, Ba Ria
Vung Tau, Long An, Binh Duong and Dong Nai. More details are presented in Chapter 7.

Environmental and Social Impact Assessment, HCMC Steering Center of the Urban
and Environmental and Social Management Plan Flood Control Program
Proposed HCMC Flood Risk Management Project Date Submitted: December 2, 2015
109
g) Biodiversity
The aquatic ecosystem is potentially affected from discharging the untreated domestic
wastewater, run-off storm water, solid waste and oil spill. If those cannot be control properly, it
will potentially significantly cause the negative impacts on environment whose magnitude is
expected to be Large. The data of ecology baseline survey indicate that value of aquatic
biodiversity is low. Overall, the significance of the impacts on biodiversity is considered
Moderate.
5.1.3.3.Impact assessment during operation phase
a) Impacts on hydro-meteorological data gathering and water quality monitoring
The positive and negative impacts of Component 1 during its operation include the following:
Positive impacts
Monitoring coverage of the flood prone areas in Ho Chi Minh City in terms of quantity and
quality will be sufficiently addressed to develop a reliable flood forecasting system;
Coverage of water level sensors for the city canal system will be likewise increased, partly
because some will be needed for the control of the two gates constructed under this project;
The new weather radar will significantly increase the quality of rainfall observations and will
also enable the now casting of rainfall a few hours ahead;
Water quality monitoring sampling will be automated albeit partly as there will still be a need
to sample for parameters such as heavy metals, phosphates and nitrates;
Better flood management and development planning; and disaster risk reduction
management.
Negative impacts
Data collected might not be properly managed and used in achieving better flood
management and disaster risk reduction management outcomes.
Turnover of technical as well as scientific staff will hamper the sustained capacity of the
Government to address disaster risk reduction management problems.
If the installations and equipment including the database assets are not operated properly, it will
defeat the expected outcomes for better disaster risk reduction management. The operation phase
is permanent that can affect flood management and development planning as well as water
quality monitoring of the waterways of the city. Scale of the impact can be estimated as large
area, including related drainage catchments and distributary canals. Magnitude of the impacts is
expected to be Large. Sensitivity of the receptors is High. Overall, the significance of the
impacts is Major.
b) Impact on technical and scientific capacity of the government for integrated flood risk
management of component 1

Environmental and Social Impact Assessment, HCMC Steering Center of the Urban
and Environmental and Social Management Plan Flood Control Program
Proposed HCMC Flood Risk Management Project Date Submitted: December 2, 2015
110
Following the completion of the project, the technical as well as the scientific capacity of the
Government for integrated flood risk management will be enhanced with suitably qualified
candidates able to plan and manage disaster risk reduction management outcomes. In this regard,
better and suitably qualified staffs able to competently collect, process, analyse and advice
Government policy- and decision makers plays a significant role in sustainable development
efforts of the country.
Magnitude of the impact is expected to be Large. The sensitivity of surrounding environment
should be High. Overall, it is estimated that the significance of impact is Major.
c) Security of hydromet equipment and flood forecasting system and water quality
monitoring equipment
Some of hydromet equipment and flood forecasting system and water quality monitoring
equipment will be installed outdoor; therefore, the risks of that equipment are stolen are high. In
addition, the safety of security guy can be threatened due to presence of the robber. However, the
likelihood of these incidents is unlikely and magnitude of these impacts is Medium. Overall, the
significance of the impact is Minor.
d) Equipment safety
Component 1 will install the following monitoring stations: 5 weather stations, 80 rainfall
stations and 20 hydrological stations distributed equally along rivers and along city canals. In
addition, a new C-band bi-polar weather radar has been proposed to be placed at a new location.
Information in regard to the specific Component 1 rainfall and hydrologic stations are not
specified in the available feasibility study report. It is however anticipated that these installations
will have the following typical instruments:
Thermometer for measuring air and sea surface temperature
Barometer for measuring atmospheric pressure
Hygrometer for measuring humidity
Anemometer for measuring wind speed
Pyranometer for measuring solar radiation
Rain gauge for measuring precipitation over a set period of time
Runoff samplers
Tide gauges
Sensors
In addition, additional instruments that may be installed include but not necessarily limited to the
following:
Weather/precipitation identification sensors for identifying falling precipitation
Disdrometer for measuring drop size distribution
Transmissometer for measuring visibility

Environmental and Social Impact Assessment, HCMC Steering Center of the Urban
and Environmental and Social Management Plan Flood Control Program
Proposed HCMC Flood Risk Management Project Date Submitted: December 2, 2015
111
Ceilometer for measuring cloud ceiling
It is anticipated that based on the profile of these instruments where the operational requirements
are small-scale (with the exception of the weather radar where the operation may be highly
technical and scientific), no occupational or operational safety risks to people are imminent.
5.1.4. Impact Assessment for Component 2 on Priority Flood Risk Reduction
Interventions
5.1.4.1.Impact assessment during pre-construction phase
During pre-construction phase, the project component 2 will affect to environment and
socioeconomic by following activities: rehabilitation, clearance, worker activities, maintenance
of vehicle and machinery.
a) Land acquisition
The residential land acquisition and relocation of affected households cause more impacts on the
physical and spiritual lives of the people, even to create social problems and prolonged litigation.
The relocation to a new place also creates a strong impact on people and to emerge issues related
to social living conditions of the resettled households will be changed dramatically, keep them
away with the familiar relationship of the surrounding villages, social amenities and living
conditions which they are enjoyed, even convenient business opportunities, they will take a long
time to adapt to the new location. Further detail of this impact can be referred to Chapter 7.
b) Air
Air pollution from pre-construction activities/sites has many sources: (i) Dust generated from
ground clearance; (ii) Emissions generated from transportation; (iii) Emission generated from
machinery.
(i) Dust generated by soil disturbance from house demolition and waste handling
Waste generated from house demolition is mainly structures of houses such as roofs, walls,
floors and ceilings, and foundation and basement. The house demolition will be undertaken for
sub-component 2.1, 2.2 and 2.4 where dust generation for each is estimated based on the
Emission Factor (EF) from AP-42: Compilation of Air Pollution Emission Factors Fifth edition
developed by USEPA (USEPA, 1995) and BOX model as below.
E = k x 0.0016 x (U/2.2)1.3
/(M/2)1.4
(kg/tons) Equation 5.1
In which:
– E: Emission factor (kg dust/tons of waste)
– K: Particle size multiplier (K for TSP is 0.74) (USEPA, 1998)
– U: Average wind speed (m/s), (U = 4.5 m/s for peak annual wind speed as worse case).
– M: Material Moisture Content (%), M = 2% (referred from a Petrochemical project in South
of Vietnam, 2014)

Environmental and Social Impact Assessment, HCMC Steering Center of the Urban
and Environmental and Social Management Plan Flood Control Program
Proposed HCMC Flood Risk Management Project Date Submitted: December 2, 2015
112
BOX model, a simplest type of model (Norazian Mohamed Noor), is applied to estimate the dust
concentration at the project sites. The model is represented in Equation 5.2.
Equation 5.2
Where
– PC Concentration of the pollutant (mg/m3)
– B Background pollution concentration (mg/m3)
– q Emission loading (mg/s.m2)
– u Wind speed (m/s)
– L Length of site (m)
– H Mixing Height (m)
Table 5.2 Overall impacts of dust generated from house demolition and waste handling of sub-
component 2.1, 2.2 and 2.4
Subcomponent
Number of
house
demolished
Volume
of waste
(tons)
Baseline
(mg/l)
Dust concentration top
up (mg/l) QCVN
05:2013/BTNMT
for dust House
demolition
Waste
handling
Subcomponent
2.1 Combined
ship lock and
tidal sluice
gates: Nuoc
Len.
6 67.32 0.1-0.14 0.18-0.22 0.3-0.41 0.3
Sub-
Component
2.2: Canal
embankments in
the main Tham
Luong – Ben
Cat – Rach
Nuoc Len canal.
77 864 0.1-0.23 0.2-0.33 0.37-0.5 0.3
Sub-
Component
2.4: Secondary
canals systems.
356 4000 0.1-0.33 0.2-0.42 0.3-0.53 0.3
Duration of the land clearance phase of above sub-components are three days, thirty days and
forty days respectively that are considered as temporary duration. The extent of its impacts is
localized, just covering the local community surrounding project area and community along the

Environmental and Social Impact Assessment, HCMC Steering Center of the Urban
and Environmental and Social Management Plan Flood Control Program
Proposed HCMC Flood Risk Management Project Date Submitted: December 2, 2015
113
transportation routes. Based on the estimated dust concentration (Table 5.2), the magnitude of
dust impacts is determined as Small for house demolition and Large for waste handling based on
guidance from IFC (ERM 2012). Baseline air quality results at the project sites indicate that the
sensitivity of the air quality at project site and surrounding area is Medium to High. Therefore,
significance of the impacts is estimated Minor to Major.
(ii) Emissions generated from transportation
For each sub-component, 10-tons trucks will be mobilized in order to transport the demolition
waste to the disposal site. During operating, those vehicles will generate the polluted air from
running engine, including NO2, SO2, CO, particle and VOC. Given this emission source is
mobile, it will effect to community living along the road where the trucks will travel through to
the disposal site. The distance from the project site to the disposal site is estimated to be 50km.
The emission factor emitted from vehicle movement and air emission concentration referred
from Department of Infrastructure, Planning and Natural Resources, Australia (2004) for land
transportation (Table 3.1 and Table 3.2 in Annex 3).
The assessment has indicated that impacts to air quality from transportation of machinery and
vehicles are expected to be localized at the project sites, temporary occurring over three days,
thirty days and sixty days for subcomponent 2.1, 2.2 and 2.4 respectively of construction period.
Based on the guideline of IFC, the impact magnitude of NO2 is large while the other has
negligible impacts magnitude. Overall, the impact of magnitude of the air emission is Small.
Baseline air quality indicates that the sensitivity of the air quality at project site and surrounding
area is High. Therefore, significance of the impacts is estimated Moderate.
(iii) Emission generated from operation of machinery
During house demolition, one excavator, one bulldozer and two 10-tons trucks will be mobilized
to demolish the houses and loading the waste to the truck for each sub-component. The exhaust
gases from fuel burning by these machines/ vehicles contain fine particle matter and other
gaseous pollutants including carbon monoxide (CO), nitrogen oxide (NO2), carbon dioxide
(CO2), and sulfur dioxide (SO2). The ―Worst case scenario‖ for an estimation of pollutants from
diesel exhaust is undertaken, where those vehicles‘ activities occur concurrently. The emission
factors of NO2, SO2, TSP, and CO are referred from Southern California International Gateway
Project (Table 3.3 in Annex 3). Using Equation 5.2, the results of estimation are presented in
Table 3.4 (see Annex 3).
For each sub-component, excepting CO and SO2 parameters within QCVN 05: 2013/BTNMT at
all sampling locations, NO2 and TSP parameters at sampling locations exceed QCVN 05:
2013/BTNMT. Based on the guideline of IFC, the impact magnitude of NO2 and TSP is large
while others have negligible impacts magnitude. Overall, the impact of magnitude of the air
emission is Large. Receptors that are expected to receive the impacts are living in along the
routes where vehicles travel through and from residential area nearby the project site. Baseline

Environmental and Social Impact Assessment, HCMC Steering Center of the Urban
and Environmental and Social Management Plan Flood Control Program
Proposed HCMC Flood Risk Management Project Date Submitted: December 2, 2015
114
air quality indicates that the sensitivity of the air quality at project site and surrounding area is
almost High. Therefore, significance of the impacts is estimated Major.
c) Noise and vibration
Noise
During land clearance, each component is expected to employ 1 excavator, 1 bulldozer and 2
trucks to undertake the house demolition and waste handling and transportation. Noise impacts
are mainly resulted from operation of machinery and vehicles during house demolition and cause
negative impacts to surrounding receptors. Noise health effects are the consequences of exposure
to elevated sound levels and can include hearing impairment, hypertension, ischemic heart
disease, annoyance, and sleep disturbance. Changes in the immune system and birth defects can
also be attributed to high noise exposure.
Noise level will be decreased in accordance with the distance and can be estimated based on the
following formula:
LP(x) = LP(xo) + 20 x log10(xo/x) Equation 5.3
LP(x): noise level at l5m (dBA)
xo = 15m
Lp(x): Noise level at calculation site (dBA)
x: calculation site from noise generated source (m).
For the each subcomponet, it is necessary to calculate the overall noise level produced by the
simultaneous operation of several pieces of equipment. The overall noise level at a receptor is
simply the sum (on an energy basis) of the individual contributions of each piece of equipment.
Mathematically, the overall noise level at a receptor from several sources can be calculated using
Equation 5.2.8:
L∑ = 10 x lg ∑
0,1Li Equation 5.4
In which:
- LΣ : Total noise level
- Li : noise level of source i
- n : number of noise source
The distances to estimate the effects of the noise generated by individual equipment and by
combined equipment are from 100m to 800m that fully covers the receptors, including workers
and nearby local residents. It is noted that these distances are accounted from the project
boundary to the receptors nearby the project site. Based on the above, the total overall noise level
expected at various sensitive receptors during the pre-construction phase due to Project activities
is shown in Table 5.3.

Environmental and Social Impact Assessment, HCMC Steering Center of the Urban
and Environmental and Social Management Plan Flood Control Program
Proposed HCMC Flood Risk Management Project Date Submitted: December 2, 2015
115
Table 5.3 Overall noise levels generated by operation of machinery during pre-construction
phase of each site of subcomponent 2.1, subcomponent 2.2 and subcomponent 2.4
Machineries
number Machineries
Noise level at 15
m (dBA)
Noise levels at distances (m)
Lp (x) (dBA)
100 200 400 600 800
1 Excavator 85 69 63 56 53 50
1 Bulldozer 85 69 63 56 53 50
2 Truck 85 69 63 56 53 50
Overall noise levels generated by operation of
machinery during pre-construction phase (Lp (x)
(dBA))
75 69 63 59 56
QCVN 26:2010/BTNMT
National Technical Regulation on Noise
(daytime)
70
IFC‟s General EHS Guidelines (daytime) 55
The noise levels indicate that for distances at 100m and further, noise level emitted from
individual equipment/machinery is below the Vietnam standards (QCVN 26:2010/BTNMT) and
exceed the IFC standards until at a distance of 600m.
In order to fully cover noise impacts, the worst-case scenario, where all equipment and
machineries are working concurrently, is proposed. On the other words, the combined noise level
will be assessed to examine the impacts to the receptors. The combined noise levels only meets
the Vietnamese Standard at 200m to further and IFC Standard at from 1000m to further.
For all receptors living within the distance from 15 m to 75m, the magnitude impact of combined
noise level is assessed to be medium given combined daytime noise level greater than 75-80
dBA (ERM, 2014). The sensitivity of the receptors at each project site is medium based on the
baseline noise results against to IFC standards of noise level for daytime (ERM 2012). Overall,
significance of the impact is considered Moderate.
Vibration
Construction activity can result in varying degrees of ground vibration, depending on the
equipment and methods employed. Operation of construction equipment causes ground
vibrations that spread through the ground and diminish in strength with distance. Buildings
founded on the soil in the vicinity of the construction site respond to these vibrations, with
varying results ranging from no perceptible effects at the lowest levels, low rumbling sounds and
perceptible vibrations at moderate levels, and slight damage at the highest levels.

Environmental and Social Impact Assessment, HCMC Steering Center of the Urban
and Environmental and Social Management Plan Flood Control Program
Proposed HCMC Flood Risk Management Project Date Submitted: December 2, 2015
116
The assessment for vibration impacts is undertaken on two types, including damage assessment
and annoyance assessment. The following procedure is used to assess those impacts, including:
Damage Assessment:
In order to assess the damage caused by vibration impacts, PPVequip should be estimated based on
Equation 5.5, then compared to the vibration damage criteria from Table 5.6 to examine
significance of impacts.
PPVequip = PPVmf x (25/D)1.5
Equation 5.5
where:
- PPVequip: is the peak particle velocity in second of the equipment adjusted for distance
- PPVref is the reference vibration level in m/sec at 7.62m (25 feet) from Table 5.5
- D is the distance from the equipment to the receiver.
Annoyance Assessment:
If desired for consideration of annoyance or interference with vibration-sensitive
activities, estimate the vibration level Lv at any distance D from the following equation:
Lv(D) = Lv(7.62 m) – 301og(D/25) Equation 5.6
Where:
- Lv(D): Vibration level at D m;
- Lv(7.62 m): Vibration level at 7.62 m from Table 5.5.
- D: distance from vibration to receiver.
Using above methodology, the estimated peak particle velocity levels at the sensitive receptors
nearest to the Project are shown in Table 5.5. When comparing the calculated with the Vibration
Damage Potential Threshold Criteria (PPV) and the Vibration Annoyance Potential Criteria
(VdB) (Table 5.4), it is found that the vibration levels of bulldozer and excavator are not likely to
cause harm to building structures and human annoyance. It is slightly different for truck as it will
affect to building and be perceptible by humans within 10ft (3m) from truck.
Vibration from construction activities is likely to impact the nearby residential areas within 3m
from the project boundary. Vibration caused by construction activities will occur only
temporarily during demolition works, for only approximately three days and will only occur
when such machinery is being operated. Therefore, the impact magnitude is considered
Negligible. The sensitivity of the local residents is High. Based on these criteria, significance of
potential vibration impacts during the construction phase is assessed to be Negligible.

Environmental and Social Impact Assessment, HCMC Steering Center of the Urban
and Environmental and Social Management Plan Flood Control Program
Proposed HCMC Flood Risk Management Project Date Submitted: December 2, 2015
117
Table 5.4 Guideline for vibration damage potential threshold criteria (Sub-component 1)
No. Building Category PPV (in/s) Approximate Lv (VdB)
1 Reinforced-concrete, steel or timber (no plaster) 0.5 102
2 Engineered concrete and masonry (no plaster) 0.3 94
3 Non-engineered timber and masonry buildings 0.2 98
4 Buildings extremely susceptible to vibration
damage 0.12 90
Source: Swiss Consultants for Road Construction Association, "Effects of Vibration on Construction" VSS-SN640-312a, Zurich, Switzerland, April 1992.
Table 5.5 Vibration level for construction equipment during pre-construction phase of each site of subcomponent 2.1, 2.2 and 2.4
No. Vehicles PPVequip (D) at 7.62m
(in/sec)
Lv (D) at 7.62m
(m/sec)
1 Bulldozer 0.003 58
2 Truck 0.076 86
3 Excavator 0.003 58

Environmental and Social Impact Assessment, HCMC Steering Center of the Urban
and Environmental and Social Management Plan Flood Control Program
Proposed HCMC Flood Risk Management Project Date Submitted: December 2, 2015
118
Table 5.6 Vibration level for construction equipment at different distances for each subcomponent
No. Vehicles
PPVequip (D) (in/sec) (in ft) Lv (D) (ft)
10 17 34 66 75 10 17 34 66 75
1 Bulldozer 0.01186 0.00535 0.00189 0.00070 0.00058 69.9 63.0 54.0 45.4 43.7
2 Truck 0.300 0.136 0.048 0.018 0.015 97.9 91.0 82.0 73.4 71.7
3 Truck 0.300 0.136 0.048 0.018 0.015 97.9 91.0 82.0 73.4 71.7
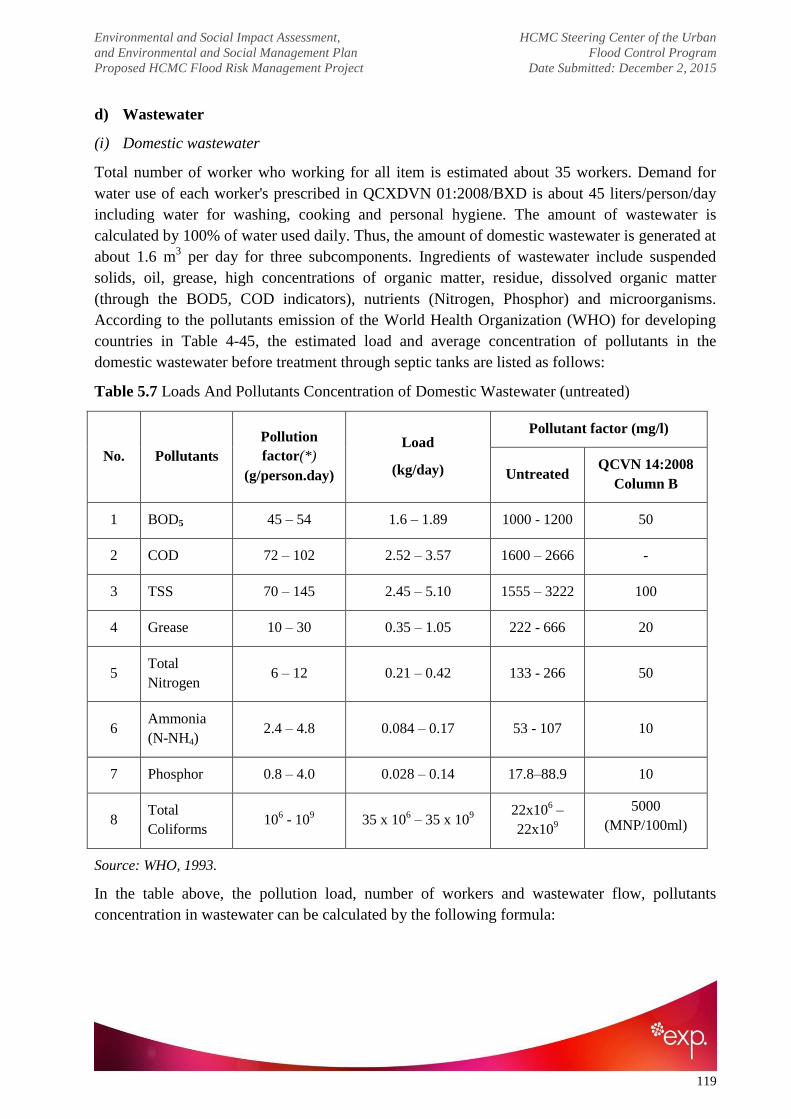
Environmental and Social Impact Assessment, HCMC Steering Center of the Urban
and Environmental and Social Management Plan Flood Control Program
Proposed HCMC Flood Risk Management Project Date Submitted: December 2, 2015
119
d) Wastewater
(i) Domestic wastewater
Total number of worker who working for all item is estimated about 35 workers. Demand for
water use of each worker's prescribed in QCXDVN 01:2008/BXD is about 45 liters/person/day
including water for washing, cooking and personal hygiene. The amount of wastewater is
calculated by 100% of water used daily. Thus, the amount of domestic wastewater is generated at
about 1.6 m3 per day for three subcomponents. Ingredients of wastewater include suspended
solids, oil, grease, high concentrations of organic matter, residue, dissolved organic matter
(through the BOD5, COD indicators), nutrients (Nitrogen, Phosphor) and microorganisms.
According to the pollutants emission of the World Health Organization (WHO) for developing
countries in Table 4-45, the estimated load and average concentration of pollutants in the
domestic wastewater before treatment through septic tanks are listed as follows:
Table 5.7 Loads And Pollutants Concentration of Domestic Wastewater (untreated)
No. Pollutants
Pollution
factor(*)
(g/person.day)
Load
(kg/day)
Pollutant factor (mg/l)
Untreated QCVN 14:2008
Column B
1 BOD5 45 – 54 1.6 – 1.89 1000 - 1200 50
2 COD 72 – 102 2.52 – 3.57 1600 – 2666 -
3 TSS 70 – 145 2.45 – 5.10 1555 – 3222 100
4 Grease 10 – 30 0.35 – 1.05 222 - 666 20
5 Total
Nitrogen 6 – 12 0.21 – 0.42 133 - 266 50
6 Ammonia
(N-NH4) 2.4 – 4.8 0.084 – 0.17 53 - 107 10
7 Phosphor 0.8 – 4.0 0.028 – 0.14 17.8–88.9 10
8 Total
Coliforms 10
6 - 10
9 35 x 10
6 – 35 x 10
9
22x106 –
22x109
5000
(MNP/100ml)
Source: WHO, 1993.
In the table above, the pollution load, number of workers and wastewater flow, pollutants
concentration in wastewater can be calculated by the following formula:

Environmental and Social Impact Assessment, HCMC Steering Center of the Urban
and Environmental and Social Management Plan Flood Control Program
Proposed HCMC Flood Risk Management Project Date Submitted: December 2, 2015
120
C = Q
C .0
Equation 5.7
In which:
- C: Pollutant concentration, (mg/L)
- C0: Pollutant load, (g/day)
- Q: Wastewater flow, (m3/day)
Comparing to the pollutants concentration in untreated domestic wastewater with the QCVN
14:2008, Column B, most of the parameters are over the standards. Duration of the pre-
construction phase is sixty days, considered as temporary duration. The extent of its impacts is
localized, potentially effecting to water quality of receiving receptors (TLBCNL Canal, Sai Gon
River, Cho Dem River). The magnitude of impact can be considered medium. Receiving
receptors includes TLBCNL Canal, Sai Gon River, and Cho Dem River that are considered to
have medium sensitivity. Overall, significance of the impacts is estimated Moderate.
(ii) Runoff storm water
During the construction phase, storm water run-off from the Project site will be potentially
contaminated by soil particles, solid waste, organic matters, oil, and grease. Based on the
meteorological baseline data, peak rainy is happened from May to November annually. At the
time of writing this report, a detailed schedule of deployment of the project has been not
provided. Therefore, the peak rainy intensity will be selected to estimate run-off water flow
based on the following equation:
Q = C x I x A/1000 (Source: Storm water Management for Construction Activities: Developing
Pollution Prevention Plans and Best Management Practices, EPA, 2005) (Equation 5.8)
In which:
– Q: flow of storm water run-off (m3/day);
– C: run-off factor, depending on the surface characteristic; (1 for paved area, and 0.7 for
unpaved area)
– I: maximum rainfall (mm/h); (I peak = 50 mm/day)
– A: Demolition area (m2)
With 8780 m2 of house demolition for three subcomponents, flowrate of storm water is estimated
at 439 m3 per day. Surface runoff from the exposed soil surface stockpiling etc. can be expected
to contain elevated suspended sediments (SS) and may also contain debris (discarded
construction material, vegetation) and other contaminants (e.g. oils, fuel, grease etc.).
The assessment has indicated that impacts to water quality as a result of stormwater runoff
discharge are expected to be localized, periodic, temporary duration occurring over sixty days of
the land development period. The magnitude of the impacts is considered Medium. The
sensitivity of those sensitive receptors (TLBCNL Canal, Sai Gon River, and Cho Dem River)

Environmental and Social Impact Assessment, HCMC Steering Center of the Urban
and Environmental and Social Management Plan Flood Control Program
Proposed HCMC Flood Risk Management Project Date Submitted: December 2, 2015
121
based on Decision No. 16/2014/QĐ-UBND of HCM is considered Medium. Overall, the
negative impact is ranked of Moderate significance.
e) Solid waste
(i) Domestic Solid waste
Solid waste coming from workers in pre-construction phase discharged about 0.35kg/person/day.
With the number of workers is estimated about 35 people for three subcomponents, the amount
of solid waste should generate around 12.25 kg/day. This solid waste contains 60-70% organic
ingredient and 30-40% other substances, and may contains many bacteria, pathogens. These
solid wastes would be collected and processed in order to limit the negative impact on human
health and the local environment. The number of workers in the pre-construction phase is not too
much, so the amount of solid waste generating from construction area is insignificant. However,
investors should also take some measures to collect and ensure environmental hygiene of
working areas.
(ii) Construction solid waste by clearance process
Site clearance: Vegetation is removed during clearance phase, but generated with limited
volume.
Demolition of existing structures: Materials in existing structures may include bricks, tiles,
concrete waste, steel, soil, waste rock, wood, etc. The demolition process will create noise and
dust. However, the volume of dust and waste and the period of demolition are very limited.
Impacts will be localized and of small scale. Table below present the total of solid waste from
the clearance process.
Table 5.8 Total of house demolition waste from the clearance process for three subcomponents
Subcomponent Number of demolished house Estimated amount of
solid waste (tons)
Subcomponent 2.1 Combined ship lock
and tidal sluice gates: Nuoc Len. 6 67.32
Sub-Component 2.2: Canal embankments
in the main Tham Luong – Ben Cat – Rach
Nuoc Len canal.
77 864
Sub-Component 2.4: Secondary canals
systems. 356 4000
Total 4931
(iii) Waste oil
After operating, the machinery and construction vehicles using on site must be maintained to
avoid damage and ensure the stable operation. This process will generate an amount of Waste oil
from machinery and vehicles. The amount of oil for once change is estimated about 16
liters/truck. The changing cycle is about 3-6 months, depending on the working time of
machinery. The amount of hazardous waste generated from cleaning rags, oil machinery, oil

Environmental and Social Impact Assessment, HCMC Steering Center of the Urban
and Environmental and Social Management Plan Flood Control Program
Proposed HCMC Flood Risk Management Project Date Submitted: December 2, 2015
122
tanks, etc. in this phase is minimal. The estimated amount of Waste oil for once change is 10
liters.
The amount of waste generated during land clearance phase is significance, especially
demolition waste. The solid waste is generated during sixty days, considered a temporary
duration; the extent of its impacts is localized. Therefore, the magnitude of the impact is
Medium. The sensitivity of the environmental and social receptors surrounding the
subcomponents sites are estimated Medium. Consequently, the overall significance of impacts is
Moderate.
f) Traffic management
Total estimated trips of waste transportation will be 20 trips. Land transportation for solid waste
will increase the number of vehicles on the local road and affect the normal traffic flow may
diminish or interrupt access to properties, and can increase the number of traffic accidents,
incidents and congestion. Da Phuoc landfill is assigned as disposal site of solid waste where the
routes of transportation designed to reach include:
(i) Scenario 1: All excavated material transported by barge (the transfer site inside project
area) follows the waterway transportation route option 1 (Nuoc Len Creek to Can Giuoc
River to Da Phuoc Site) in which the traffic flow is characterized low.
(ii) Scenario 2: All excavated material transported by barge (the transfer site inside project
area) follows the waterway transportation route option 2 (Vam Thuat end to Sai Gon River
to Tau Hu Ben Nghe Canal to Ong Lon Creek to Da Phuoc Site) in which the traffic flow
is characterized low.
(iii) Scenario 3: All excavated material transported by barge to the transfer site inside project
area) follows the land transportation route option 3 (Nuoc Len Creek to Nguyen Van Linh
street to Highway 50 to Da Phuoc Site) in which the traffic flow of inland waterway and
land is respectively characterized low and high.
Impact magnitude on inland waterway and land traffic flow is assigned as Small and Medium
given the flow of the second is significantly higher than land traffic flow. For precaution
purpose, the sensitivity of the receptor is estimated Medium. Overall, the impact significances
are ranked as Minor and Moderate for inland waterway traffic and land traffic respectively.
g) Social disturbance
It is estimated that there will be one worker camps established with 35 workers for three
subcomponents during the land clearance period. The activities of construction equipment,
machinery, open holes, transport vehicles could lead to social disturbance, risks and noise during
nighttime.
The main social problems could be listed as the below:
Potential impact of spreading infectious disease from employees to local communities and
vice versa.

Environmental and Social Impact Assessment, HCMC Steering Center of the Urban
and Environmental and Social Management Plan Flood Control Program
Proposed HCMC Flood Risk Management Project Date Submitted: December 2, 2015
123
Potential impact of prostitution, drugs and gambling.
Potential conflict between workers and local communities because of differences of culture,
behavior.
Potential impacts on local businesses, for example restaurants, shops etc. could be temporary
closed or disadvantaged because of project activities and pollution.
Cultural values could be potentially impacted but because all these values are distanced from
project construction areas hence will not be significantly impacted. However, the
concentration of huge amount of employees could potentially undesirable conflict with local
communities including cultural values;
Communities could be at risk if they travel around or are close to the construction sites and
potentially exposed to accidents.
h) UXO (Unexploded ordnance)
UXO removal is important so as to avoid any potential threat to works and safety for local
people and workers. For sub-components, UXO needs to be carefully considered and removed
before construction activities can commence. The impacts of UXO in the project area represent
significant negative impacts if mitigation measures are not applied, with high risk to human
health, life, and also infrastructure. UXO removal must be completed before starting civil works.
5.1.4.2.Impact assessment during construction phase
a) Air emission
The emissions including dust and air emission generated from construction activities include fuel
combustion from mobile heavy-duty diesel, gasoline-powered equipment, mobility of
construction materials, soil excavation and road construction.
(i) Transportation
The volume of material and waste to be transported to and from the construction site by road is
approximately 10,459,800 tons in which detail of material and waste and round trips per day are
presented in Table 5.9. The transportation of waste and material can use road or inland
waterway, but for conservative approach, the estimation will be estimated for road
transportation. In this regard, trucks of 30 tons will be used. Given the construction durations of
some of subcomponents are different, the estimated trips are different. The distance for the
transportation is approximately estimated 50km from the project site to Da Phuoc landfill or
material supplying sources in Dong Nai, Binh Duong, Long An and Vung Tau.
Table 5.9 Volume of material and waste required to transport to project site and disposal site (Da
Phuoc landfill)
Component 2 Volume of material
and waste (tons)
Round trips per
day (trips)
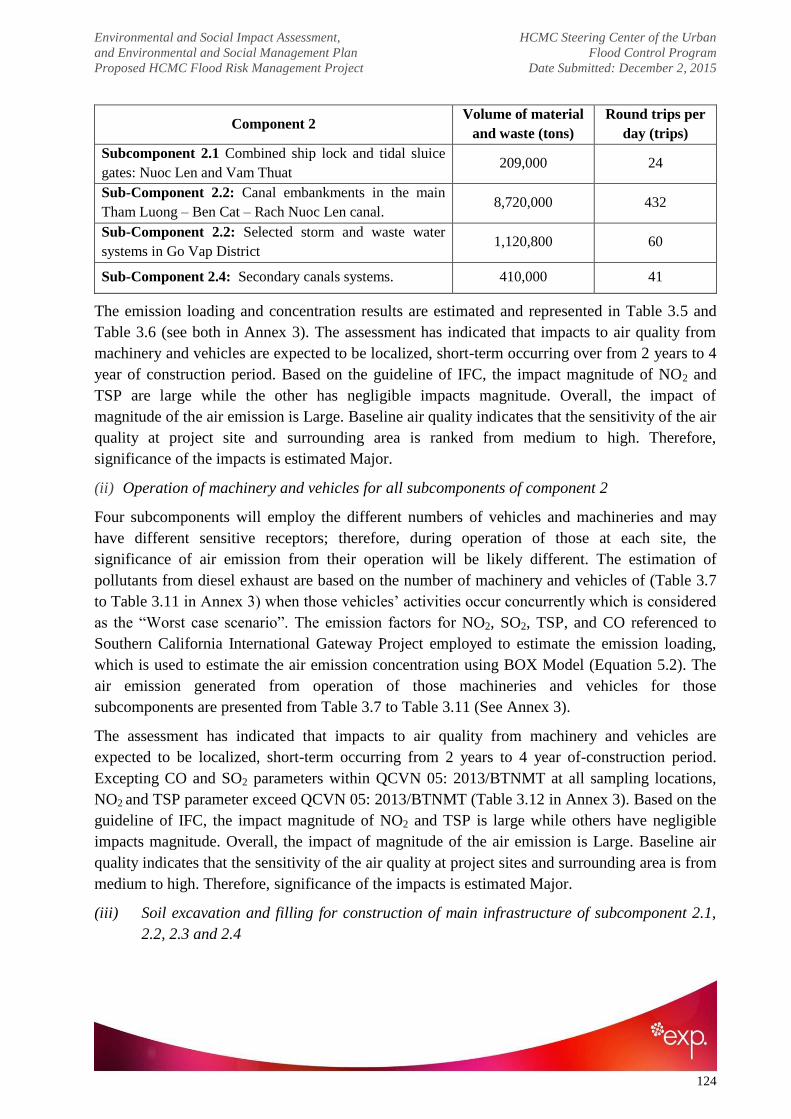
Environmental and Social Impact Assessment, HCMC Steering Center of the Urban
and Environmental and Social Management Plan Flood Control Program
Proposed HCMC Flood Risk Management Project Date Submitted: December 2, 2015
124
Component 2 Volume of material
and waste (tons)
Round trips per
day (trips)
Subcomponent 2.1 Combined ship lock and tidal sluice
gates: Nuoc Len and Vam Thuat 209,000 24
Sub-Component 2.2: Canal embankments in the main
Tham Luong – Ben Cat – Rach Nuoc Len canal. 8,720,000 432
Sub-Component 2.2: Selected storm and waste water
systems in Go Vap District 1,120,800 60
Sub-Component 2.4: Secondary canals systems. 410,000 41
The emission loading and concentration results are estimated and represented in Table 3.5 and
Table 3.6 (see both in Annex 3). The assessment has indicated that impacts to air quality from
machinery and vehicles are expected to be localized, short-term occurring over from 2 years to 4
year of construction period. Based on the guideline of IFC, the impact magnitude of NO2 and
TSP are large while the other has negligible impacts magnitude. Overall, the impact of
magnitude of the air emission is Large. Baseline air quality indicates that the sensitivity of the air
quality at project site and surrounding area is ranked from medium to high. Therefore,
significance of the impacts is estimated Major.
(ii) Operation of machinery and vehicles for all subcomponents of component 2
Four subcomponents will employ the different numbers of vehicles and machineries and may
have different sensitive receptors; therefore, during operation of those at each site, the
significance of air emission from their operation will be likely different. The estimation of
pollutants from diesel exhaust are based on the number of machinery and vehicles of (Table 3.7
to Table 3.11 in Annex 3) when those vehicles‘ activities occur concurrently which is considered
as the ―Worst case scenario‖. The emission factors for NO2, SO2, TSP, and CO referenced to
Southern California International Gateway Project employed to estimate the emission loading,
which is used to estimate the air emission concentration using BOX Model (Equation 5.2). The
air emission generated from operation of those machineries and vehicles for those
subcomponents are presented from Table 3.7 to Table 3.11 (See Annex 3).
The assessment has indicated that impacts to air quality from machinery and vehicles are
expected to be localized, short-term occurring from 2 years to 4 year of-construction period.
Excepting CO and SO2 parameters within QCVN 05: 2013/BTNMT at all sampling locations,
NO2 and TSP parameter exceed QCVN 05: 2013/BTNMT (Table 3.12 in Annex 3). Based on the
guideline of IFC, the impact magnitude of NO2 and TSP is large while others have negligible
impacts magnitude. Overall, the impact of magnitude of the air emission is Large. Baseline air
quality indicates that the sensitivity of the air quality at project sites and surrounding area is from
medium to high. Therefore, significance of the impacts is estimated Major.
(iii) Soil excavation and filling for construction of main infrastructure of subcomponent 2.1,
2.2, 2.3 and 2.4
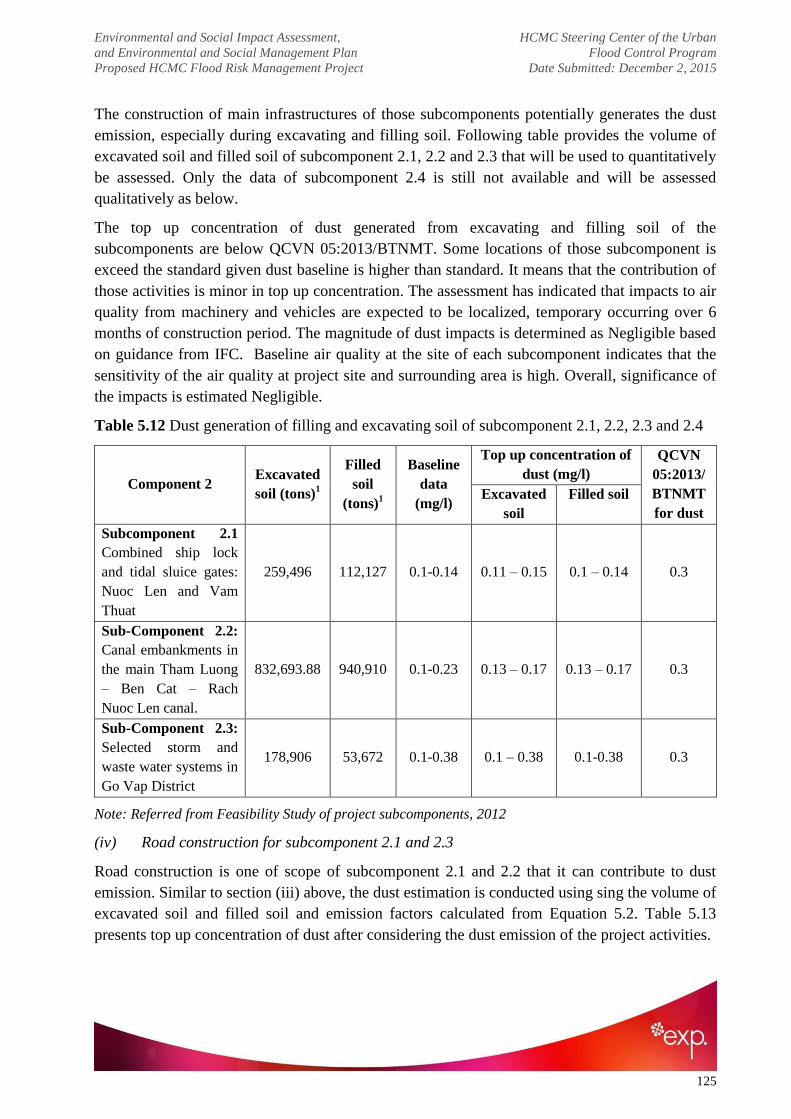
Environmental and Social Impact Assessment, HCMC Steering Center of the Urban
and Environmental and Social Management Plan Flood Control Program
Proposed HCMC Flood Risk Management Project Date Submitted: December 2, 2015
125
The construction of main infrastructures of those subcomponents potentially generates the dust
emission, especially during excavating and filling soil. Following table provides the volume of
excavated soil and filled soil of subcomponent 2.1, 2.2 and 2.3 that will be used to quantitatively
be assessed. Only the data of subcomponent 2.4 is still not available and will be assessed
qualitatively as below.
The top up concentration of dust generated from excavating and filling soil of the
subcomponents are below QCVN 05:2013/BTNMT. Some locations of those subcomponent is
exceed the standard given dust baseline is higher than standard. It means that the contribution of
those activities is minor in top up concentration. The assessment has indicated that impacts to air
quality from machinery and vehicles are expected to be localized, temporary occurring over 6
months of construction period. The magnitude of dust impacts is determined as Negligible based
on guidance from IFC. Baseline air quality at the site of each subcomponent indicates that the
sensitivity of the air quality at project site and surrounding area is high. Overall, significance of
the impacts is estimated Negligible.
Table 5.12 Dust generation of filling and excavating soil of subcomponent 2.1, 2.2, 2.3 and 2.4
Component 2 Excavated
soil (tons)1
Filled
soil
(tons)1
Baseline
data
(mg/l)
Top up concentration of
dust (mg/l)
QCVN
05:2013/
BTNMT
for dust
Excavated
soil
Filled soil
Subcomponent 2.1
Combined ship lock
and tidal sluice gates:
Nuoc Len and Vam
Thuat
259,496 112,127 0.1-0.14
0.11 – 0.15
0.1 – 0.14 0.3
Sub-Component 2.2:
Canal embankments in
the main Tham Luong
– Ben Cat – Rach
Nuoc Len canal.
832,693.88 940,910 0.1-0.23 0.13 – 0.17 0.13 – 0.17 0.3
Sub-Component 2.3:
Selected storm and
waste water systems in
Go Vap District
178,906 53,672 0.1-0.38 0.1 – 0.38 0.1-0.38 0.3
Note: Referred from Feasibility Study of project subcomponents, 2012
(iv) Road construction for subcomponent 2.1 and 2.3
Road construction is one of scope of subcomponent 2.1 and 2.2 that it can contribute to dust
emission. Similar to section (iii) above, the dust estimation is conducted using sing the volume of
excavated soil and filled soil and emission factors calculated from Equation 5.2. Table 5.13
presents top up concentration of dust after considering the dust emission of the project activities.

Environmental and Social Impact Assessment, HCMC Steering Center of the Urban
and Environmental and Social Management Plan Flood Control Program
Proposed HCMC Flood Risk Management Project Date Submitted: December 2, 2015
126
The top up concentration of dust generated from excavating and filling soil of the
subcomponents are below QCVN 05:2013/BTNMT. It means that the contribution of those
activities is minor in top up concentration. The assessment has indicated that impacts to air
quality from machinery and vehicles are expected to be localized, temporary occurring over 6
months of construction period. The magnitude of dust impacts is determined as Negligible based
on guidance from IFC. Baseline air quality at the site of each subcomponent indicates that the
sensitivity of the air quality at project site and surrounding area is high. Overall, significance of
the impacts is estimated Negligible.
Table 5.11 Dust generation of filling and excavating soil of subcomponent 2.1 and 2.2
Component 2 Macadam
(tons)
Sand
(tons)
Baseline
data (mg/l)
Top up
concentration
of dust (mg/l)
QCVN
05:2013/BTNMT
for dust
Subcomponent 2.1
Combined ship lock
and tidal sluice gates:
Nuoc Len and Vam
Thuat
3,519.2 6,860.56 0.1-0.14 0.1-0.14 0.3
Sub-Component 2.2:
Canal embankments in
the main Tham Luong
– Ben Cat – Rach Nuoc
Len canal.
660,734 317, 340 0.1-0.23 0.1-0.23 0.3
(v) Odors from dredging process of subcomponent 4
Dredged material is mainly sediments coming from wastewater and surface runoff accumulated
at the bottom of the canal. Such sludge contains many complex organic compounds which
are biologically degraded in anaerobic condition and release odorous compounds. Types of
odorous compounds created by anaerobic decomposition include inorganic gases, mercaptans
and other compounds such as organic acids, phenol, and p-cresol. During dredging process,
odorous compounds can be released and cause nuisance odor problems in nearby community.
This impact mainly occurs in transfer site, where dredged materials are gathered and prepared to
water way transport for treatment. Dredging activities take place in a short time and cause the
nuisance locally. As a result, the magnitude of odour impacts is Medium. Given the sensitivity of
local residents is Medium, the overall significance of impacts is Moderate.
b) Noise and vibration
Noise
During the construction period, noise will primarily be generated by operation of vehicles and
equipment (i.e. engines and mobile equipment). The level of noise depends on the types and
numbers of vehicles and equipment subcomponent are going to employ during construction
phase. In order to assess the noise impact, the individual noise of each equipment and overall
noise of all needs to determined. The assessment is examined at different distances, from 100m

Environmental and Social Impact Assessment, HCMC Steering Center of the Urban
and Environmental and Social Management Plan Flood Control Program
Proposed HCMC Flood Risk Management Project Date Submitted: December 2, 2015
127
to 1200m to fully cover the noise impacts on sensitive receptors. Out of four subcomponents, the
noise impacts of subcomponent 2 and subcomponent 4 will be similar given they both use the
same types and numbers of equipment. This is similar to each investment items within
subcomponent 1 (Vam Thuat and Nuoc Len) and subcomponent 3 (the interceptor and primary
and secondary combined storm water and sewer systems).
Individual noise levels are constant at a defined distance that is estimated for all subcomponents
(see Table 3.13. 3.14 and 3.15 in Annex 3). The result indicates that the noise levels, excepting
noise level emitted from hammer, of other indicate that individual noise level at distances from
100m to further is below the Vietnam Standards (QCVN 26:2010/BTNMT), but higher than IFC
from 600m to further. The individual noise level of hammer only meets the Vietnamese Standard
at 600m and IFC Standard at 3000m while cutter suction dredger (for subcomponent 2) is below
the Vietnamese Standard at 200m and IFC Standard at 800m.
In order to fully cover noise impacts, the worst-case scenario, where all equipment and
machineries are working concurrently, is proposed. The results are presented in Table 3.13. 3.14
and 3.15 in Annex 3 and interpreted as follow:
(i) Noise impacts from machineries operation of subcomponent 1
The combined noise levels only meets the Vietnamese Standard at 800m to further and IFC
Standard at from 4000m to further.
For all receptors living within the distance from 15 m to 2000m, the magnitude impact of
combined noise level is assessed to be medium given combined daytime noise level greater than
60 dBA (ERM, 2014). The sensitivity of the receptors is Medium based on the baseline noise
results against to IFC standards of noise level for daytime. Overall, significance of the impact is
considered Moderate.
(ii) Noise impacts from machineries operation of subcomponent 2 and 4
The combined noise levels only meets the Vietnamese Standard at 1200m to further and IFC
Standard at from 7,500m to further.
For all receptors living within the distance from 15 m to 4,500m, the magnitude impact of
combined noise level is assessed to be medium given combined daytime noise level greater than
60 dBA (ERM, 2014). The sensitivity of the receptors is medium based on the baseline noise
results (K1 to K11) against to IFC standards of noise level for daytime. Overall, significance of
the impact is considered Major.
(iii) Noise impacts from machineries operation of subcomponent 3
The combined noise levels only meets the Vietnamese Standard at 600m to further and IFC
Standard at from 1000m to further.
For all receptors living within the distance from 15 m to 2000m, the magnitude impact of
combined noise level is assessed to be medium given combined daytime noise level greater than
60 dBA (ERM 2012). The sensitivity of the receptors is medium based on the baseline noise
Environmental and Social Impact Assessment, HCMC Steering Center of the Urban
and Environmental and Social Management Plan Flood Control Program
Proposed HCMC Flood Risk Management Project Date Submitted: December 2, 2015
128
results against to IFC standards of noise level for daytime. Overall, significance of the impact is
considered Moderate.
Vibration
The assessments for damage assessment and annoyance assessment are undertaken for four
subcomponents based on the Equation 5.5 and Equation 5.6 in which the results are presented in
Table 3.16 (see Annex 3). Comparing the calculated with the Vibration Damage Potential
Threshold Criteria (PPV) and the Vibration Annoyance Potential Criteria (VdB) (Table 5.6), it is
found that the vibration levels of bulldozer, excavator, crane, concrete mixer and pile jack are
not likely to cause harm to building structures and human annoyance. In contrast, building is
affected within 5m from truck and drilling operation; human is perceptible with vibration within
10m from those operation. The most severe impact of vibration comes from the operation of
piling work given it will cause structures damage and human annoyance within 23m radius.
c) Wastewater
Wastewater generated during this phase includes domestic wastewater, construction wastewater
and storm water.
(i) Domestic wastewater
There will be domestic wastewater stream originating from the area of office, toilets and washing
facilities from the construction workforce and visitors. With the peak number of construction
workers about 25 residents, the domestic wastewater can be estimated around 1,125 m3 per day
(45 liters per person per shift) for water consumption of one person). If this wastewater types is
not well managed, the surface water will be potentially contaminated with high concentration of
solids (suspended and dissolved), biochemical oxygen demand (BOD) and chemical oxygen
demand (COD), nutrients (nitrogen, ammonia) and faecal coliform counts.
The discharge of domestic effluent is within 2 -4 years, where impact extent is local and impact
scale is estimated to be point-based sources from the project area. In addition, the domestic
wastewater is significant in pollutant loading. The magnitude of this impact is expected to be
Large. Sensitivity of receiving receptors includes TLBCNL Canal, Sai Gon River, and Cho Dem
River is considered Medium. Overall, significance of the impacts is estimated Major.
(ii) Construction wastewater
Wastewater generated from construction works include foundation, piling concrete mixing,
washing of workplace and tools. If this wastewater type cannot be controlled properly, it will
effect to water quality of TLBCNL Canal, Sai Gon River and Cho Dem River by elevating the
suspended solid and other contaminants (i.e. debris, oils, fuel, and grease)
The magnitude of impacts is considered Medium. The sensitivity of receiving stream (TLBCNL
Canal, Sai Gon River and Cho Dem River) is considered Medium. The significance of potential
impacts to surface water quality is considered Moderate.
(iii) Runoff water

Environmental and Social Impact Assessment, HCMC Steering Center of the Urban
and Environmental and Social Management Plan Flood Control Program
Proposed HCMC Flood Risk Management Project Date Submitted: December 2, 2015
129
The facilities construction activities may result in loosened top soil at some areas, resulting in
increased runoff to adjacent water bodies. Surface runoff from the exposed soil surface
stockpiling, backfilling, etc. can be expected to contain elevated suspended sediments (SS) and
may also contain debris (discarded construction material, vegetation) and other contaminants
(e.g. oils, fuel, grease etc.). Increasing SS in the canal is enabling to change water characteristics
where some organism in the canal can be negative influenced.
The assessment has indicated that impacts to water quality as a result of stormwater runoff
discharge are expected to be localized, periodic, short-duration occurring over 2 years of the
construction period. The magnitude of the impacts is considered medium. Receiving receptors
includes TLBCNL Canal, Sai Gon River, and Cho Dem River. Regarding to Decision No.
16/2014/QĐ-UBND of HCM, the water quality of those receptors will classified B level
meaning that their water quality is not concern for water supply or any entertainment purposes.
Therefore, the sensitivity of those sensitive receptors is considered Medium. Overall, the
negative impact is ranked of Moderate significance.
d) Solid waste
Solid waste generated from activities of four sub-components comprise of domestic solid waste,
construction waste and hazardous waste.
(i) Domestic solid waste
Solid domestic waste includes paper, cardboard, unused food, metal, wood, etc. A worker
produces about 0.35 kg of waste per day . With the number of workers is estimated about 80
people for each item, the amount of solid waste should generate around 28 kg/day/work. This
solid waste contains 60-70% organic ingredient and 30-40% other substances, and may contains
many bacteria, pathogens. These solid wastes would be collected and processed in order to limit
the negative impact on human health and the local environment. The number of workers in the
construction phase is not too much, so the amount of solid waste generating from construction
area is insignificant. However, inappropriate waste disposal can cause environmental impacts on
hygiene, human health and aesthetic qualities as well as provide habitats for disease vectors.
Quality of land, air and water can be adversely affected.
(ii) Construction waste
Construction-generated solid waste causing by drainage pipeline installation, dredging process.,
The soil excavated is 1,271,095 tons as estimated in Table 5.12. Assuming 50% of that will be
reused for refilling, total soil volume transported to disposal site should be 635,547.5 tons. At the
time of writing this report, the amount of dredged sludge of subcomponent 4 cannot be defined
due to limited information of dredging plan. However, it is anticipated that the volume of
dredged sludge should be significant.
(iii) Hazardous waste
After operating, the machinery and construction vehicles using on site must be maintained to
avoid damage and ensure the stable operation. This process will generate an amount of waste oil

Environmental and Social Impact Assessment, HCMC Steering Center of the Urban
and Environmental and Social Management Plan Flood Control Program
Proposed HCMC Flood Risk Management Project Date Submitted: December 2, 2015
130
and cleaning rags, oil machinery, oil tanks, etc., but the volume of waste oil is expected to be the
most. The amount of oil for once change is estimated about 16 liters/truck. The changing cycle
is about 3-6 months, depending on the working time of machinery. The estimated amount of
Waste oil for once change is 10 liters.
The amount of waste generated during construction phase is significance, especially construction
waste and dredged sludge. The solid waste is generated during 2 years to 4 years, considered a
short-term duration; the extent of its impacts is localized. Therefore, the magnitude of the impact
is Large. The sensitivity of the environmental and social receptors surrounding the
subcomponents sites are estimated Medium. Consequently, the overall significance of impacts is
Major.
e) Soil and groundwater
Soil and groundwater contamination during the construction phase may result from leaks and
spills of oil, lubricants, or fuel from heavy equipment, improper handling of sanitary effluent and
waste or chemical/fuel storage.
Oil, lubricants and fuels are used by the vehicles and heavy equipment operating during the
construction phase. Spills and leaks may occur during vehicle/equipment operation, fuelling, and
maintenance. Temporary storage of fuels/oil/lubricants is also a potential source of spills/leaks.
The construction of the project may involve the temporary use of various chemicals. Accidental
releases of these chemicals may result in a sub-surface impact.
The construction activities will generate various types of hazardous wastes (e.g. waste oils, oily
rags and containers, chemical-stained containers, batteries, discarded fluorescent bulbs, etc).
Construction workers working on-site will also generate domestic waste and wastewater. These
waste streams, if not properly managed, will be released to the ground and have the potential to
impact the subsurface environment.
Contaminated or polluted soil can directly affect human health through direct contact with soil or
via the infiltration of soil contamination into groundwater aquifers, sometimes in areas far from
apparent sources of above ground contamination.
Extent and scale of the impacts are dependent on the magnitude of the spills or leaks. It may
transport further downstream if those incidents are significant. The permeability of soil at the
project site is ranged from 3x10⁻⁶
to 8.8x10⁻⁴
, indicating a medium vulnerability of
contaminating the soil and groundwater. Sensitivity of soil and groundwater is considered High
based on the surveyed results. Overall, the sensitivity of soil and groundwater is ranked High.
The magnitude of such impacts is considered Low based on characterizes of works. Overall, the
significance of the impacts is Moderate.
f) Traffic management
Total estimated trips of material and waste transportation is 557 trips per day, considered as
considerable trips, potentially significantly increasing the number of vehicles on the local road

Environmental and Social Impact Assessment, HCMC Steering Center of the Urban
and Environmental and Social Management Plan Flood Control Program
Proposed HCMC Flood Risk Management Project Date Submitted: December 2, 2015
131
and inland waterway and affect the normal traffic flow. For inland waterway, the traffic can be
disturbed from blockage of waterway to constructing the sluice gate and ship locks and dredging
in the secondary canal. For road transportation, traveling to the roads directly connect to the
project site, such as Nguyen Oanh, Nguyen Kiem, Truong Chinh, Cach Mang Thang 8, Cong
Hoa, etc. will make the traffic congestion more visible.
With waste transportation, the destination should be Da Phuoc Landfill that will potentially be
assigned as disposal site of the project. In order to travel to Da Phuoc Landill, following routes
should be considered:
(i) Scenario 1: All excavated material transported by barge (the transfer site inside project area)
follows the waterway transportation route option 1 (Nuoc Len Creek to Can Giuoc River to
Da Phuoc Site) in which the traffic flow is characterized low.
(ii) Scenario 2: All excavated material transported by barge (the transfer site inside project area)
follows the waterway transportation route option 2 (Vam Thuat end to Sai Gon River to Tau
Hu Ben Nghe Canal to Ong Lon Creek to Da Phuoc Site) in which the traffic flow is
characterized low.
(iii) Scenario 3: All excavated material transported by barge to the transfer site inside project
area) follows the land transportation route option 3 (Nuoc Len Creek to Nguyen Van Linh
street to Highway 50 to Da Phuoc Site) in which the traffic flow of inland waterway and
land is respectively characterized low and high.
For material transportation, the material providing sources can be at surrounding provinces, such
as Long An, Tien Giang, Dong Nai, Vung Tau and Binh Duong. Those provinces are also
connected to Ho Chi Minh City through inland waterway network; therefore, in addition to road
transport option, the inland waterway should be a potential alternative. As mentioned above, the
roads to project site are almost crowded and potentially congested if the project transport enters
to in the rush hours.
In summary, the traffic flow on roads is more crowded than that on inland waterway. Therefore,
impact magnitude on traffic flow is assigned as Small for inland waterway and Large for road
transportation during the rush hours. The sensitivity of the receptor is estimated Medium.
Overall, the impact significances are ranked as Minor and Major for inland waterway traffic and
land traffic.
g) Social disturbance
Contact between constructions workers and the local residents are expected to be significant. As
a result of migrant influx, the non-local workforce will bring along with it its own behavioural
traits, habits and lifestyle which may at times be alien to the local community. These behavioural
traits may cause discomfort/ inconvenience to the community resulting in disagreement and at
times conflicts. There are some potential impacts between local community and construction
workers include risk of prostitution, increased tension between local between local men and the
contractors in question, and increased alcohol and drug abuse. Further assessments are referred
from Chapter 6.

Environmental and Social Impact Assessment, HCMC Steering Center of the Urban
and Environmental and Social Management Plan Flood Control Program
Proposed HCMC Flood Risk Management Project Date Submitted: December 2, 2015
132
h) Biodiversity
The wealthy of the Canal biodiversity will be affected by many of different activities of the
subcomponents including:
Reduced mixing between the water of Canal and Cho Dem river/Sai Gon River will enhance
the settlement of suspended solid, where the sediment thickness will be increased, that alters
the ambient environment of the benthic organism, particularly nearby the sluice gates. In
addition, slightly saline water of Cho Dem River/Sai Gon River will potentially increase
salinity of the Canal water, where the salt resistant organism can potentially be dominant,
instead of the native organism.
Dredging sludge in the secondary canal will make the water more turbid that reduce sunlight
to photosynthetic organism in water column and in bottom. However, this is often a
temporary problem lasting only as long as the dredging activities: the weeks or months.
Domestic wastewater and solid waste generated from activities of subcomponents discharged
to the Canal will greatly negatively change the water quality and then the wealthy of aquatic
ecosystem.
If those issues cannot be controlled properly, the magnitude of the impacts is expected to be
Large. Ecology baseline survey indicates that value of aquatic biodiversity is low with low
conservation interest. Overall, the significance of the impacts on biodiversity is considered
Moderate.
i) Risk on subsidence during construction of embankment, interceptor, sluice gate
During construction of facilities for component 2, following activities can cause the risk on
subsidence:
Embankment: Pilling is one of stage required for embankment process. As estimated in
Section b) Noise and vibration, this machine can cause harm to building structures located
within 23m radius. If the piling process is undertaken near the house, the cracks/collapse of
the surrounding houses is visible.
Interceptor: Pile Jack is mainly designed to minimize the social impacts during installation of
sewage pipes. However, it can cause risks of subsidence if the process is not controlled well.
Sluice gate and ship locks: given the units is located in the water, the risk of subsidence is
potentially highly occurred, especially at two side of sluice gates and ship locks and the
approach canal before and after sluice gate.
The incidents of broke embankment will directly affect the life of people living near the
embankment system, affect the quality of houses, buildings and structures that located on
protection range of embankment system. If no mitigation measures to control the subsidence are
proposed, the likelihood of those incidents is high. The sensitivity of surrounding residents is
high. Consequently, the overall significance of impacts is Major.
j) Disruption of navigation during rehabilitation of main canal and construction of tidal
sluice gate

Environmental and Social Impact Assessment, HCMC Steering Center of the Urban
and Environmental and Social Management Plan Flood Control Program
Proposed HCMC Flood Risk Management Project Date Submitted: December 2, 2015
133
Currently, the inland waterway traffic has been still progressed in the Canal, but will be
potentially affected from rehabilitation of main canal and construction of tidal sluice gate. The
water will be diverted so as to allow installation of stalling 02 tidal gates and 05 shiplocks. In
addition, a certain wet area of the canal will be occupied to undertake the pilling works. The
impacts extent is localized at construction site from 2 to 4 years. As a result, magnitude of the
impact is assigned Medium. The sensitivity of the waterway traffic should be assigned Medium
for precaution purpose. Overall, the impact significance of those impacts is Moderate.
k) Impact on flooding
Flooding is potentially occurred when the construction works of those components affects to
existing drainage capacity (i.e. replacing the existing sewage pipes, temporarily blocking the
drainage to install new pipes, unintentionally blocking the sewage pipes following completion,
change the slope or elevation of roads affecting the flow direction of storm water). However, the
likelihood of those is generally low. The impacts of flooding are localized in temporary duration
(i.e. a few hours). The magnitude of this is considered Small. The sensitivity of the local
residents is assigned High. Overall, the impact significance is ranked Moderate.
5.1.4.3.Impact on operation phase
a) Impacts on hydrology regime and water quality of TLBCNL Canal
As the tidal sluice gate and ship locks enter operation, it will change the hydrologic regime and
water quality of TLBCNL Canal whose positive and negative impact are presented as follow.
Positive impacts
Water levels in TLBCNL Canal and its distributary canals can be controlled with the
appropriate operation of the tidal sluice gate.
Opening the tidal sluice gates at high tide will enhance a dilution of treated wastewater
discharged from Tan Tao Industrial Park (IP), Tan Binh IP, Tham Luong Ben Cat
Wastewater Treatment Plant and other small scale factories located in the catchment area of
TLBCNL Canal.
Negative impacts
As improperly being operated, the tidal sluice gate will reduce the dilution of Sai Gon River
to the water of the TLBCNL Canal. In addition, improper operation can result the flooding
for TLBCNL Canal distributary canals and drainage catchment, affecting to living condition
of the local community.
The operation phase is permanent that can affect to flooding equalization and water quality of the
canal if the operation is not undertaken properly. Scale of the impact can be estimated to include
the drainage basin and distributary canals of TLBCNL Canal. Magnitude of the impacts is
expected to be Medium. Sensitivity of the receptors, including affected residents and water
quality of the Canal, is Medium. Overall, the significance of the impacts is Moderate.
b) Impacts on water quality

Environmental and Social Impact Assessment, HCMC Steering Center of the Urban
and Environmental and Social Management Plan Flood Control Program
Proposed HCMC Flood Risk Management Project Date Submitted: December 2, 2015
134
In the operation phase, the water quality of TLBCNL, Sai Gon River, and Cho Dem River will
be improved; however, the water body can be re-polluted by the illegal wastewater discharging
from both domestic and industrial wastewater, especially in dry weather. Even the TLBC
Wastewater Treatment Plan are constructing to collect all wastewater generated from industrial
and domestic activities, the water of the Canal is still re-contaminated occasionally if those
contributors do not tightly legally committed to the government. In addition, the Canal water can
be contaminated by residents discharging the solid waste and domestic wastewater to the Canal.
Furthermore, the water quality can be affected from poor dilution with Sai Gon river due to
inappropriate program of tidal sluice gates.
If those cannot controlled closely, the magnitude of the impacts on water quality can be Large.
Receiving receptors includes TLBCNL Canal, Sai Gon River, and Cho Dem River. Regarding to
Decision No. 16/2014/QĐ-UBND of HCM, the water quality of those receptors will classified B
level meaning that their water quality is not concern for water supply or any entertainment
purposes. Therefore, the sensitivity of those sensitive receptors is considered Medium. Overall,
the impacts on water quality is identified Major.
c) Impact of solid waste
In a case that community awareness in environmental protection is not improved, throwing
municipal solid waste into the canal may be frequently happened in operation phase. This makes
the canal more polluted. In order to assess the magnitude of this impact, impacts of solid waste to
Nhieu Loc Thi Nghe Canal should be referred. Regarding to the Environmental Information
(2015) (a member of Foundation of Natural and Environmental Protection), the solid waste
generation has been from 5 tons to 14 tons daily, mainly by the local community, including
households along the Canal, residents and public bars.
Another aspect of impacts from solid waste to environment is sludge accumulated in the sewage
system during operation phase and dredging sludge generated from maintenance program of the
main and distributary canal and tidal sluice gate.
If those waste cannot controlled closely, corresponding impacts on environment is expected to be
significant. The magnitude of the impacts on environment (i.e. water quality, soil and
groundwater, air, public health) from solid waste discharge is Large. The sensitivity of the
terrestrial and aquatic environment and residents at the Canal is Medium. Overall, the sensitivity
of the impacts is ranked Major.
d) Impacts on biodiversity
The wealthy of the Canal biodiversity will be dependent on its water quality. As mentioned
above, the water can be polluted due to the discharge of domestic and industrial wastewater and
solid waste into the Canal. In addition, the inappropriate operation programs of tidal sluice gate
also potentially increase the salinity and reduce the water quality of canal with poor dilution. If
those cannot control properly, the wealthy of the Canal habitat can be threaten. Such potential
issues indicate the large magnitude of the impacts on aquatic ecology. The value of ecology is

Environmental and Social Impact Assessment, HCMC Steering Center of the Urban
and Environmental and Social Management Plan Flood Control Program
Proposed HCMC Flood Risk Management Project Date Submitted: December 2, 2015
135
expected to be Low due to its low conservation interest. Overall, the significance of the impacts
on biodiversity is considered to be Moderate.
e) Impacts by odour
Odor is generated from sludge and solid waste accumulated in the sewage pipes and from
dredging works under maintenance program of the main, secondary canals and tidal sluice gates.
Inadequate operation and maintenance of drainage system could cause odor in local area.
However, the level of impact will not be significant and easily managed by the proper operation
and maintenance of the Ho Chi Minh City
Ineffective operation of sewerage and wastewater collection facilities, especially for interceptors
and pumping, if can create excessive odor, flooding in the area, and potentially serious health
impacts. Blocking of garbage, soil, and other solid wastes could exacerbate the situation.
The impact extent of odor is localized, but may progress for a long time if no any measures to
remove odor is proposed. The magnitude of those impacts is considered Medium. The sensitivity
of the local residents is Medium. Overall, the impact significance is ranked Moderate.
5.1.4.4.Unplanned and accidental events
This section presents the probable impacts of unplanned events associated with construction and
operation of the project component 1 and component 2. The unplanned events are considered
separately from routine and non-routine activities as they arise as a result of a technical failure,
human error, or as a result of natural phenomena. The unplanned events considered include:
Occupation accidents
Oil spill Incident;
Vessel Collision;
Fire, Explosion, and Toxic Release;
Flood; and
Cyclone/storm
Traffic accidents
Failure of system operation
The assessment of significant impact of unplanned events considers the probability of event
occurring and estimates the severity of the consequences of the events. In assessment of severity
of impact due to oil spill incident, fire, explosion, and toxic release, qualitative assessment was
undertaken to predict the extent of the resulting impact. Following is an analysis of potential
cause that can lead to those unplanned events.
Occupation accidents
High density of construction equipment in the construction site will lead to risks and
hazards such as physical contact, spills, dust, emissions, and noise. Noise from these
vehicles is also a hazard that the worker will have to bear. Slip and fall injuries are caused by

Environmental and Social Impact Assessment, HCMC Steering Center of the Urban
and Environmental and Social Management Plan Flood Control Program
Proposed HCMC Flood Risk Management Project Date Submitted: December 2, 2015
136
working at height, working over water as well as poor housekeeping such as excessive waste
debris, loose construction materials, liquid spills, etc. During construction phase, lack of good
management and training for Workers might be high potential risk of slips and fall accidents. On
the other hand, large construction area and the long construction period are also a factor for the
risk of slip and fall occurring.
Struck by Objects is a hazard involved in construction and demolition activities. The hazards
come from falling material or tools, ejection of solid particles, etc. and may cause injuries in the
head, eyes, and extremities. Fatalities due to vehicle accidents are one of the main causes of
fatality in the Construction Industry in general. The risks associated with transportation are
exacerbated in congested areas like the Worksite. In particular, information suggests that the
combination of poor drivers, poor vehicles and poor roads are significant contributory factors.
The long construction period (48 months) and the hard work involved in operating the
construction equipment will cause over-exertion and ergonomic injuries and illnesses to
the workers on the construction site due to repetitive motion, falls, over-exertion, and
constant manual handling, among others.
Oil spill Incident
The transportation of fuel oil by road may cause a risk of spillage and fire/explosion when fuel
lorry gets an accident on the road. It may causes risks to people who are traveling on and live
near the road. The risks are inhalation of toxic chemical, fire, explosion and contamination
of the environment to community.
Vessel Collision
Project activities including importation of construction materials, disposal of dredged materials
during construction and operation of project port require inland waterway transportation. There
will be an increase in the number of vessels navigating in-out the port as a result of the project
that will increase the risk of collision or maritime incident. Project activities including the
construction of port structure and dredging may obstruct the navigation of ships including. These
activities may increase the risk of vessel collisions.
Fire, Explosion, and Toxic Release
The operation of the project involves certain dangerous substances that have potential to cause
serious danger to person or damage to properties due to the fire, explosion, and toxic release or
known as ―Major Hazards‖. The occurrences that are classified as a major hazard incident
include: (i) Fire (loss of containment which could lead to fire, jet fire, fireball etc.); (ii)
Explosion (Boiling Liquid Expanding Vapour Explosion (BLEVE), Vapour Cloud Explosion
(VCE), dust explosion etc.); (iii) Implosion (for example, vacuum from steam condensation etc.);
and (iv) Escape, spillage or leakage.
Flood

Environmental and Social Impact Assessment, HCMC Steering Center of the Urban
and Environmental and Social Management Plan Flood Control Program
Proposed HCMC Flood Risk Management Project Date Submitted: December 2, 2015
137
The underlying causes of flooding, heavy rain and high sea levels, are, essentially,
uncontrollable. Flooding may post environmental and health impacts both construction and
operation period. Flooding in the project area can be caused by heavy and extensive rainfall,
coastal flooding for instance large wave, tide, and storm.
During construction, flood can mobilize pollutants such as sediment, oil, chemical and other
building materials onsite into surface water and causing harm to aquatic animals. For Operation,
the water can cause structural damage to equipment and building. Flood may trigger the
secondary impacts if water can reach to the water reactive chemicals and result in fire, explosion,
and toxic cloud.
Traffic congestion and accidents
During construction phase, a part of road will be occupied to undertake the construction of the
project components. Reducing the road space will highly increase potential traffic congestion
and accidents if the traffic flow through this area cannot be equalized. Traffic congestion will
increase number of vehicles at certain space where can be polluted by air emission and noise
generated from traffic vehicles. Local residents who have endured this impact for a long time
will potentially challenge with respiratory sickness.
Cyclone/storm
Tropical storm is natural phenomenon that could result in severe property damage and
potentially injury to personnel. The employees working at the sites are at risk due to severe
condition and may lead to injury or fatalities. Run-off from the plant may contaminate surface
water and soil. For the sites, storms may damage equipment or structures. Strong winds allegedly
blew or bring down the facilities of projects whose movement can injure the workers onsite and
local residents
Failure of system operation
During operation, facilities of the projects can fail in their operation and lead to error function
that leads to negative results, such as flooding from error operation of tidal sluice gate or clogged
sewer pipes due to solid waste. Some operation failures are objective, such as discharging solid
waste to the Canal by the local community that is a hardship to deal with.
Following the analyzing the potential unplanned events, each project will be assessed impact
magnitude and receptor sensitivity to identify the impacts significance of each unplanned events.
The results of assessment are shown in Table 5.12.

Environmental and Social Impact Assessment, HCMC Steering Center of the Urban
and Environmental and Social Management Plan Flood Control Program
Proposed HCMC Flood Risk Management Project Date Submitted: December 2, 2015
138
Table 5.12 Impact assessment for unplanned accidental events
Unplanned
and
accidental
events
Impacts
Assessment Component 1 Sub-component 2.1
Sub-
subcomponent 2.2
Sub-
subcomponent 2.3
Sub-
subcomponent 2.4
Occupationa
l accidents
Magnitude
of the
impacts
The project is mainly
related to equipment
installation that can
potentially expose to
electric shock. The
installation requires
well trained
employees. Therefore,
the likelihood is
unlikely. The
magnitude of impact is
small
The project utilizes the heavy
machineries to undertake the
work. Most of workers hired for
this project are generally not fully
educated. Therefore, if they
cannot access the proper training
to understand the scope of works
and EHS policy and procedure,
the occupational accident are
visibly happened. Therefore, the
likelihood is seen likely. The
magnitude of the impacts is
considered as medium.
Similar to Project
subsubcomponent2.
1. The magnitude
of the impacts is
considered as
medium.
Similar to
subcomponent2.1,
but given the
duration of the
project is more
extended and the
scope of works is
more complicated,
the magnitude of
the impacts is
considered major.
Similar to Project
subcomponent2.1.
The magnitude of
the impacts is
considered as
medium.
Receptor
Sensitivity
Sensitivity of the
employees onsite is
ranked high
Sensitivity of the workers onsite
is ranked high High High High
Impact
significance Moderate Major Major Major Major
Fire
explosion
and toxic
release
Magnitude
of the
impacts
Given there are a
number of heavy
machineries utilized,
chemical, such as fuel
Similar to component 1. In
addition, any chemical spill or
leakage will be able to release the
toxic to surrounding environment,
Similar to Project
subcomponent1,
the magnitude of
the impacts is
Similar to Project
subcomponent 2.1,
but given the
duration of the
Similar to Project
subcomponent 2.1,
the magnitude of
the impacts is

Environmental and Social Impact Assessment, HCMC Steering Center of the Urban
and Environmental and Social Management Plan Flood Control Program
Proposed HCMC Flood Risk Management Project Date Submitted: December 2, 2015
139
Unplanned
and
accidental
events
Impacts
Assessment Component 1 Sub-component 2.1
Sub-
subcomponent 2.2
Sub-
subcomponent 2.3
Sub-
subcomponent 2.4
oil, cleaning agents,
are required. The use
of those chemical can
potentially cause fire
and exploration. Given
the likelihood of this
incident is unlikely,
the magnitude is
classified medium.
where worker onsite and local
resident can expose by inhaling or
digestion pathway and where
ambient environment can be
contaminated. Given the
likelihood of this incident is
unlikely, the magnitude is
classified medium.
considered as
medium.
project is more
extended and the
scope of works is
more complicated,
the magnitude of
the impacts is
considered as
major.
considered as
medium.
Receptor
Sensitivity
Sensitivity of the
employees onsite and
local residents is
ranked high
Receptors are workers onsite,
local residents, ambient
environment (surface water,
groundwater, air, ecology). The
sensitivity of these receptors is
High.
High High High
Impact
significance Major Major Major Major Major
Oil spill
Magnitude
of the
impacts
During construction
phase, oil spill can be
happened anytime if
they are not stored
properly and can be
induced by the
Similar to Project component 1,
the magnitude of the impacts is
considered as medium.
Similar to Project
subcomponent1,
the magnitude of
the impacts is
considered as
medium.
Similar to Project
subcomponent 2.1,
but given the
duration of the
project is more
extended and the
Similar to Project
subcomponent 2.1,
the magnitude of
the impacts is
considered as
medium.

Environmental and Social Impact Assessment, HCMC Steering Center of the Urban
and Environmental and Social Management Plan Flood Control Program
Proposed HCMC Flood Risk Management Project Date Submitted: December 2, 2015
140
Unplanned
and
accidental
events
Impacts
Assessment Component 1 Sub-component 2.1
Sub-
subcomponent 2.2
Sub-
subcomponent 2.3
Sub-
subcomponent 2.4
external factors, such
as influence of
workers, storm, and
flood. The extend of
this impact is on the
ambient environment
(surface water,
groundwater, aquatic
and terrestrial ecology
and soil), local
residents and workers
onsite. However, this
incident likelihood is
expected unlikely.
Therefore, the
magnitude of the
impact is Small.
scope of works is
more complicated,
the magnitude of
the impacts is
considered as
major.
Receptor
Sensitivity
Sensitivity of the
employees onsite and
local residents is
ranked high
Receptors are workers onsite,
local residents, ambient
environment (surface water,
groundwater, air, ecology). The
sensitivity of these receptors is
High.
High High High

Environmental and Social Impact Assessment, HCMC Steering Center of the Urban
and Environmental and Social Management Plan Flood Control Program
Proposed HCMC Flood Risk Management Project Date Submitted: December 2, 2015
141
Unplanned
and
accidental
events
Impacts
Assessment Component 1 Sub-component 2.1
Sub-
subcomponent 2.2
Sub-
subcomponent 2.3
Sub-
subcomponent 2.4
Impact
significance Moderate Major Major Major Major
Traffic
accident
Magnitude
of the
impacts
Traffic accidents can
be potentially occurred
during transportation
of waste to disposal
site and material to the
project site. The
likelihood of these
should be unlikely.
Magnitude of the
impact is Low
This project site is at river bank,
located at Nuoc Len creek, where
the residents are not populated.
The roads have not been through
this site; therefore the impacts on
land traffic are not significant.
Even for inland waterway traffic,
undertaking the construction
works at this location will not
raise many of traffic issues given
the inland waterway traffic flow
through this site has been also
limited. The magnitude of the
impacts is ranked Small.
Similar to Project
subcomponent1,
the magnitude of
the impacts is
considered as
Small.
Given the project
will occupy a
portion of road to
undertake the
construction works,
the movement of
the traffic flow will
be reduced, leading
to traffic
congestion, or even
traffic accident. It
is visible that traffic
impact is the most
concerned issue of
this project when it
enters to
construction phase.
The likelihood of
this impact is
likely. Therefore,
the magnitude of
Similar to Project
subcomponent3,
the magnitude of
the impacts is
considered as
Large.

Environmental and Social Impact Assessment, HCMC Steering Center of the Urban
and Environmental and Social Management Plan Flood Control Program
Proposed HCMC Flood Risk Management Project Date Submitted: December 2, 2015
142
Unplanned
and
accidental
events
Impacts
Assessment Component 1 Sub-component 2.1
Sub-
subcomponent 2.2
Sub-
subcomponent 2.3
Sub-
subcomponent 2.4
this impact is
Large.
Receptor
Sensitivity
Sensitivity of the local
residents and workers
are High.
High. High High High
Impact
significance Moderate Moderate Moderate Major Major
Flooding
Magnitude
of the
impacts
In HCMC, the
flooding is formed due
to failure of sewer
system operation and
high tidal period. The
construction site may
be challenged with
flood with high tide
period, where they can
expose to the difficulty
in the construction of
tidal sluice gate and
ship lock. However,
this challenge is much
belonged to technical
solution. The
Similar to Project component1,
the magnitude of the impacts is
considered as low.
Similar to Project
component1, the
magnitude of the
impacts is
considered as low.
Similar to Project
component1, the
magnitude of the
impacts is
considered as low.
The project site is
located in the Go
Vap District where
is considered less
exposure with
flood. However,
when the rain is
heavy, the potential
flood may be
visible, especially
at area where the
sewer system has
been not operated
well. The
livelihood of the
impact is likely.

Environmental and Social Impact Assessment, HCMC Steering Center of the Urban
and Environmental and Social Management Plan Flood Control Program
Proposed HCMC Flood Risk Management Project Date Submitted: December 2, 2015
143
Unplanned
and
accidental
events
Impacts
Assessment Component 1 Sub-component 2.1
Sub-
subcomponent 2.2
Sub-
subcomponent 2.3
Sub-
subcomponent 2.4
likelihood for this
impact is unlikely. As
a result, the magnitude
can be classified Low.
Consequently, the
magnitude is seen
Medium.
Receptor
Sensitivity
The receptors are
worker onsite, project
facilities, ambient
environment (surface
water, soil and
groundwater,
terrestrial and aqautic
widlife). Its sensitivity
is medium.
Medium Medium Medium Medium
Impact
significance Minor Minor Minor Minor Moderate
Storm
Magnitude
of the
impacts
Recently, HCMC has
some weather spell
including high rain
intensity, strong wind
and cyclone. The
appearance frequency
of this is unpredictable
at certain place, but
Recently, HCMC has some
weather spell including high rain
intensity, strong wind and
cyclone. The appearance
frequency of this is unpredictable
at certain place, but visible to be
occurring. The project is located
along river bank, where is
Similar to Project
subcomponent1,
the magnitude of
the impacts is
considered as
medium.
Similar to Project
subcomponent1.
However, given the
location of the
project is less
exposure with the
storm, the
magnitude of the
Similar to Project
subcomponent3,
the magnitude of
the impacts is
considered as
medium.

Environmental and Social Impact Assessment, HCMC Steering Center of the Urban
and Environmental and Social Management Plan Flood Control Program
Proposed HCMC Flood Risk Management Project Date Submitted: December 2, 2015
144
Unplanned
and
accidental
events
Impacts
Assessment Component 1 Sub-component 2.1
Sub-
subcomponent 2.2
Sub-
subcomponent 2.3
Sub-
subcomponent 2.4
visible to be occurring.
The project is located
along river bank,
where is extremely
feasible to be exposed
by strong wind or
cyclone. The
likelihood of this
impact is likely. As a
result, this impact
magnitude is
considered Large.
extremely feasible to be exposed
by strong wind or cyclone. The
likelihood of this impact is likely.
As a result, this impact magnitude
is considered Large.
impacts is
considered as
medium.
Receptor
Sensitivity
The receptor is local
community, worker
onsite, project
facilities. Its sensitivity
is medium.
The receptor is local community,
worker onsite, project facilities.
Its sensitivity is medium.
Medium Medium Medium
Impact
significance Major Major Moderate Moderate Moderate
Failure of
operation
Magnitude
of the
impacts
During operation, the
inappropriate
operation of
equipment can lead to
During operation, the
inappropriate operation of sluice
gate can lead to failure of flooding
prevention, particularly in high
Similar to
subcomponent 2.1,
the magnitude of
the impact is
Following the
completion of the
Canal, it will attract
more resident to
The operation of
sewer system can
be failed if those
system are clogged

Environmental and Social Impact Assessment, HCMC Steering Center of the Urban
and Environmental and Social Management Plan Flood Control Program
Proposed HCMC Flood Risk Management Project Date Submitted: December 2, 2015
145
Unplanned
and
accidental
events
Impacts
Assessment Component 1 Sub-component 2.1
Sub-
subcomponent 2.2
Sub-
subcomponent 2.3
Sub-
subcomponent 2.4
failure of flooding
forecast. This
likelihood is likely. As
a result, the magnitude
of the impact is
Medium.
tide period. This frequency
becomes more practical in the
severe weather, including high
tide regime, heavy rain together
with inappropriate operation of
the sluice gate. This likelihood is
likely. As a result, the magnitude
of the impact is Medium.
Medium. visit due to its
upgrading facilities
service. However,
experience
indicates that some
of them will
discharge the solid
waste into canal. In
addition, local
community living
along the canal,
especially in bar
shop, may
discharge the
wastewater into the
canal. Another
pollutant
contributor is
industrial park,
factories and many
of restaurant and
business center
located in
by solid waste and
sediment
discharged by the
residents. It will
reduce the drainage
capacity of water
that then leads to
flooding. The
likelihood of these
impacts is likely.
The magnitude is
Large.

Environmental and Social Impact Assessment, HCMC Steering Center of the Urban
and Environmental and Social Management Plan Flood Control Program
Proposed HCMC Flood Risk Management Project Date Submitted: December 2, 2015
146
Unplanned
and
accidental
events
Impacts
Assessment Component 1 Sub-component 2.1
Sub-
subcomponent 2.2
Sub-
subcomponent 2.3
Sub-
subcomponent 2.4
TLBCNL
Catchment. The
likelihood of these
impacts is likely.
The magnitude is
Large.
Receptor
Sensitivity
Local residents. Their
sensitivity is Medium.
Local residents. Their sensitivity
is Medium. Medium
Water quality of
TLBCNBLC Canal
and local resident.
Their sensitivity is
medium.
Local residents.
Their sensitivity is
medium.
Impact
significance Moderate Moderate Moderate Major Major

Environmental and Social Impact Assessment, HCMC Steering Center of the Urban
and Environmental and Social Management Plan Flood Control Program
Proposed HCMC Flood Risk Management Project Date Submitted: December 2, 2015
147
5.1.5. Requirement of level of assessment for FS proposed for Cay Kho va Phu Dinh
The FS proposed for Cay Kho va Phu Dinh needs to imply TOR that is designed to include
environmental and social requirement to meet the OP4.01 - WB‘s policy on Environmental
Assessment.
5.2. Proposed mitigation measures
There are several strategies (avoidance, minimization, rectification, and/or compensation) that have
been applied to mitigate the potential negative impacts identified in above sections of this chapter.
During the preparation of the project, effort has been made to avoid potential adverse impacts on
resettlement and land acquisition by reducing scope and/or modification of the basic design of the
project investment. In developing the mitigation measures the strategies to minimize and/or rectify
the impacts have been applied and where appropriate compensation has been incorporated. The
proposed mitigation measures to reduce the impacts due to land acquisition and resettlement are
described in the RP and RPF.
This chapter identifies mitigation measures of the key project impacts during the construction
(which include site clearance, ground leveling, and construction) and operation phases. Given that
most of the key impacts will occur due to civil works and transportation of construction/waste
materials, many of the potential negative impacts on physical, biological, and social environment
could be mitigated through a set of general measures that are typically applied to most of
construction projects to minimize impacts such as noise, dust, water, waste, etc. As part of the
Environmental Management Plan (EMP) for the project these general measures have been
translated into a standard environmental specification to be incorporated into the bidding and
contract documents. These are referred to as Environmental Codes of Practice (ECOPs) and it will
be applied to mitigate typical impacts of the project‘s civil works. Section 5.8.1 briefly explains
the scope and content of the ECOPs, which are presented in Chapter 7.
However, for those project components there are site-specific impacts that require site-specific
measures both during the construction and operation phases. Section 5.8.2 discusses site-specific
measures during construction for the subcomponents that require mitigation measures beyond
those identified in ECOPs. Section 5.8.3 describes site-specific measures to mitigate impacts of
the key subcomponents during the operation phase. These measures are incorporated into the EMP
of the project (Chapter 7).
5.2.1. Measure to Mitigate the Impact of Component 1
Based on the environmental impact assessment for component 1, the following table is provided to
list out the mitigation measure.
Table 5.13 Mitigation measure proposed for project component 1

Environmental and Social Impact Assessment, HCMC Steering Center of the Urban
and Environmental and Social Management Plan Flood Control Program
Proposed HCMC Flood Risk Management Project Date Submitted: December 2, 2015
148
Project Phase/Environment
Aspect (Project Activity
Which will Likely Impact the
Environmental Component)
Options for Prevention or Mitigation or Enhancement
1. Pre-construction Phase
Installation location
identification and planning
Formulate installation site selection criteria for additional stations;
utilize existing stations currently being utilized; conduct baselining
activities for each station to mitigate impacts associated with new
installations; select the best locations with the least impacts.
Property/land acquisition
Utilize public lands, and river easements as much as possible;
thoroughly verify ownership documents with responsible
government agencies if areas to be acquired for locations of
ancillary facilities are privately-owned; compensate privately-
owned lands in accordance with applicable Vietnamese Law.
Planning and detailed
engineering design
Verify with the responsible agencies; comply with local zoning and
building laws of the Vietnamese Government
Permit acquisition Identify, secure, and comply with all permitting requirements
associated with the project.
Procurement and selection of
civil works Contractor(s)
Strict monitoring of Contractor(s) performance and compliance
with established minimum performance standards and
specifications by SRHMC, SCFC and/or DONRE‘
Civil works Contractor(s),
Mobilization
Provide a professional with experience in the implementation of
environmental, occupational, health and safety requirements.
Hire as many qualified locals within the immediate vicinity of the
installation sites or those living within a reasonable commuting
distance; otherwise provide temporary bunkhouses on-site or rent
houses in neighboring areas if housing requirements cannot be
accommodated in the project site.
Encourage patronage for local goods and services; priority of hiring
will be those that will be economically-displaced; hire as many
qualified locals within the immediate vicinity of the installation site
or those living within a reasonable commuting distance of the
project site.
Use only properly maintained and third party-inspected equipment;
noise generating equipment to be provided with noise abatement
attachments such as mufflers; work area properly barricaded with
high walled fence; workers working with noise generating
equipment provided with ear muffs.
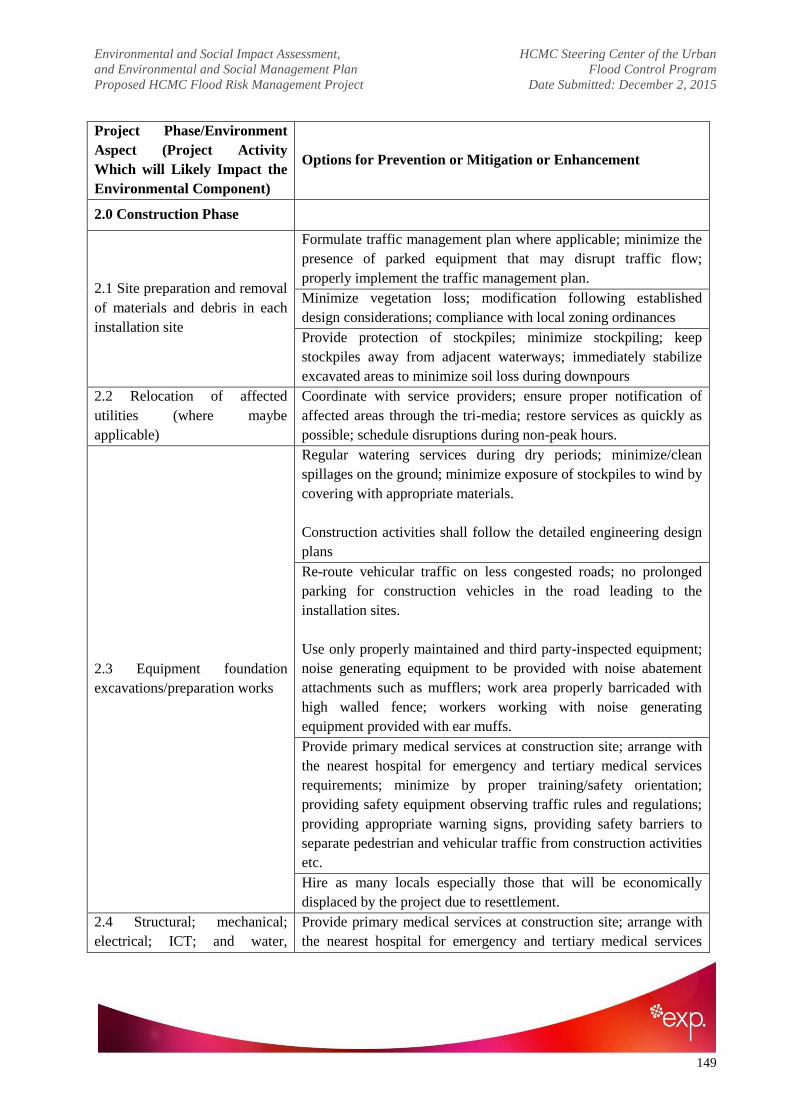
Environmental and Social Impact Assessment, HCMC Steering Center of the Urban
and Environmental and Social Management Plan Flood Control Program
Proposed HCMC Flood Risk Management Project Date Submitted: December 2, 2015
149
Project Phase/Environment
Aspect (Project Activity
Which will Likely Impact the
Environmental Component)
Options for Prevention or Mitigation or Enhancement
2.0 Construction Phase
2.1 Site preparation and removal
of materials and debris in each
installation site
Formulate traffic management plan where applicable; minimize the
presence of parked equipment that may disrupt traffic flow;
properly implement the traffic management plan.
Minimize vegetation loss; modification following established
design considerations; compliance with local zoning ordinances
Provide protection of stockpiles; minimize stockpiling; keep
stockpiles away from adjacent waterways; immediately stabilize
excavated areas to minimize soil loss during downpours
2.2 Relocation of affected
utilities (where maybe
applicable)
Coordinate with service providers; ensure proper notification of
affected areas through the tri-media; restore services as quickly as
possible; schedule disruptions during non-peak hours.
2.3 Equipment foundation
excavations/preparation works
Regular watering services during dry periods; minimize/clean
spillages on the ground; minimize exposure of stockpiles to wind by
covering with appropriate materials.
Construction activities shall follow the detailed engineering design
plans
Re-route vehicular traffic on less congested roads; no prolonged
parking for construction vehicles in the road leading to the
installation sites.
Use only properly maintained and third party-inspected equipment;
noise generating equipment to be provided with noise abatement
attachments such as mufflers; work area properly barricaded with
high walled fence; workers working with noise generating
equipment provided with ear muffs.
Provide primary medical services at construction site; arrange with
the nearest hospital for emergency and tertiary medical services
requirements; minimize by proper training/safety orientation;
providing safety equipment observing traffic rules and regulations;
providing appropriate warning signs, providing safety barriers to
separate pedestrian and vehicular traffic from construction activities
etc.
Hire as many locals especially those that will be economically
displaced by the project due to resettlement.
2.4 Structural; mechanical;
electrical; ICT; and water,
Provide primary medical services at construction site; arrange with
the nearest hospital for emergency and tertiary medical services
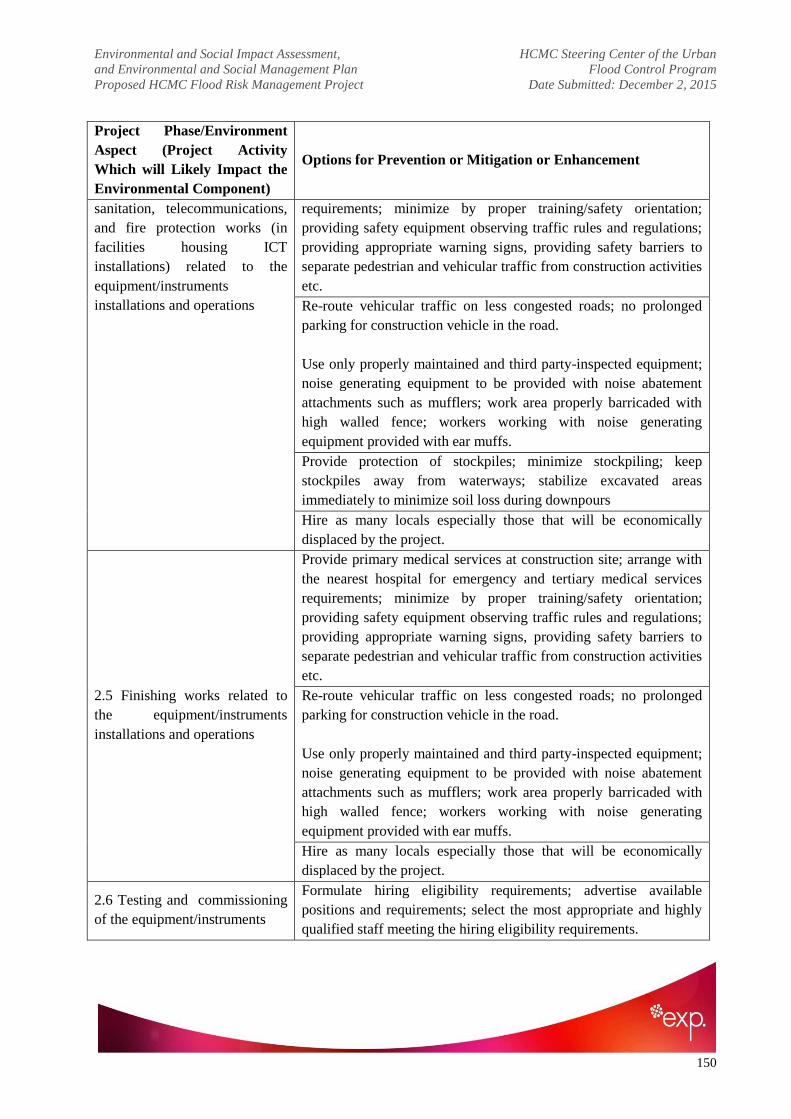
Environmental and Social Impact Assessment, HCMC Steering Center of the Urban
and Environmental and Social Management Plan Flood Control Program
Proposed HCMC Flood Risk Management Project Date Submitted: December 2, 2015
150
Project Phase/Environment
Aspect (Project Activity
Which will Likely Impact the
Environmental Component)
Options for Prevention or Mitigation or Enhancement
sanitation, telecommunications,
and fire protection works (in
facilities housing ICT
installations) related to the
equipment/instruments
installations and operations
requirements; minimize by proper training/safety orientation;
providing safety equipment observing traffic rules and regulations;
providing appropriate warning signs, providing safety barriers to
separate pedestrian and vehicular traffic from construction activities
etc.
Re-route vehicular traffic on less congested roads; no prolonged
parking for construction vehicle in the road.
Use only properly maintained and third party-inspected equipment;
noise generating equipment to be provided with noise abatement
attachments such as mufflers; work area properly barricaded with
high walled fence; workers working with noise generating
equipment provided with ear muffs.
Provide protection of stockpiles; minimize stockpiling; keep
stockpiles away from waterways; stabilize excavated areas
immediately to minimize soil loss during downpours
Hire as many locals especially those that will be economically
displaced by the project.
2.5 Finishing works related to
the equipment/instruments
installations and operations
Provide primary medical services at construction site; arrange with
the nearest hospital for emergency and tertiary medical services
requirements; minimize by proper training/safety orientation;
providing safety equipment observing traffic rules and regulations;
providing appropriate warning signs, providing safety barriers to
separate pedestrian and vehicular traffic from construction activities
etc.
Re-route vehicular traffic on less congested roads; no prolonged
parking for construction vehicle in the road.
Use only properly maintained and third party-inspected equipment;
noise generating equipment to be provided with noise abatement
attachments such as mufflers; work area properly barricaded with
high walled fence; workers working with noise generating
equipment provided with ear muffs.
Hire as many locals especially those that will be economically
displaced by the project.
2.6 Testing and commissioning
of the equipment/instruments
Formulate hiring eligibility requirements; advertise available
positions and requirements; select the most appropriate and highly
qualified staff meeting the hiring eligibility requirements.

Environmental and Social Impact Assessment, HCMC Steering Center of the Urban
and Environmental and Social Management Plan Flood Control Program
Proposed HCMC Flood Risk Management Project Date Submitted: December 2, 2015
151
Project Phase/Environment
Aspect (Project Activity
Which will Likely Impact the
Environmental Component)
Options for Prevention or Mitigation or Enhancement
Formulate a Health, Safety and Environment Manual or Plan
prescribing organizational and resource requirements, as well as
compliance with Vietnamese Government Occupational Safety and
Health Standards; hire qualified staff; comply with international
standards in the absence of specific requirements; work areas where
testing shall be done shall be properly barricaded and provided with
warning signs to keep nearby residents from venturing into the
work areas; follow manufacturer‘ manual of instructions.
2.7 Construction debris disposal
and management
(demobilization of Contractor)
Cover debris during transport operations; re-route transport traffic
on less congested roads; no prolonged parking for construction
vehicle in the road.
Use only properly maintained and third party-inspected equipment;
noise generating equipment to be provided with noise abatement
attachments such as mufflers; work area properly barricaded with
high walled fence; workers working with noise generating
equipment provided with ear muffs.
Coordinate with land owners or companies requiring reclamation/
fill materials; coordinate with PCs with regard to approved disposal
sites within their territory; coordinate with national government
agencies that have on-going reclamation activities
Formulate traffic management plan; re-route transport operations in
less congested roads; coordinate with PCs in regard to traffic
management requirements
3.1 Installation operation and
maintenance
Arrange with the nearest hospital for emergency and tertiary
medical services requirements; minimize by proper training/safety
orientation; providing safety equipment
Prepare preventive maintenance schedule; identify and repair causes
of malfunction
Provide backup generator; identify and repair cause of failure;
prepare preventive maintenance schedule; report power loss to
Service Provider.
Identify and repair cause of failure; report telecommunications loss
to Service Provider.
Provide backup systems; identify and repair cause of failure;

Environmental and Social Impact Assessment, HCMC Steering Center of the Urban
and Environmental and Social Management Plan Flood Control Program
Proposed HCMC Flood Risk Management Project Date Submitted: December 2, 2015
152
Project Phase/Environment
Aspect (Project Activity
Which will Likely Impact the
Environmental Component)
Options for Prevention or Mitigation or Enhancement
prepare preventive maintenance schedule; report failure to fire
protection installation company.
Provide backup water storage system; prepare preventive
maintenance schedule; report water interruptions with the Service
Provider
Formulate a human resource management plan; provide training
and educational scholarships with fixed tenure bonding as may be
allowed under Vietnamese regulations (i.e. for every year of
scholarship, the staff will stay for 3 years of service. Otherwise,
staff will pay for the full cost of the scholarship expenses.); provide
industry-competitive salaries and incentives.
3.2 Field data acquisition, data
processing and information
management
Formulate field data acquisition protocols; provide training to staff;
provide quality control checks
5.2.2. Measures to Mitigate General Impacts during Construction
The ECOPs describe typical requirements to be undertaken by contractors and supervised by the
construction supervision consultant during construction. The final ECOPs will be incorporated into
the bidding and contract documents (BD/CD) during the detailed design stage. Scope and content
of the ECOPs is as follows:
Scope: Construction activities for small works governed by these ECOPs are those whose impacts
are of limited extent, temporary and reversible, and readily managed with good construction
practices.
The measures identify typical mitigation measures for the following aspects:
– Dust generation
– Air pollution
– Impacts from noise and vibration
– Water pollution
– Drainage and sedimentation control
– Management of stockpiles, quarries, and borrow pits
– Solid waste
– Management of dredged materials
– Disruption of ecological resources
– Traffic management
– Interruption of utility services
– Restoration of affected areas

Environmental and Social Impact Assessment, HCMC Steering Center of the Urban
and Environmental and Social Management Plan Flood Control Program
Proposed HCMC Flood Risk Management Project Date Submitted: December 2, 2015
153
– Worker and public safety
– Communication with local communities
5.2.3. Measures to Mitigate Site-specific Impacts during Construction
5.2.3.1. Site-specific Measures for Construction of Nuoc Len tidal sluice gate and 2 ship
locks
The subcomponents impacts are considered to be major, short term and localized and most of them
can be mitigated through the typical mitigation measures identified in ECOPs. Key site-specific
impacts include risks due to land clearance, including house, trees and other vegetation, undertaken
indiscriminately, without reference to construction site boundaries, UXO, blocking the water flow
of the Canal at construction site, contaminating surface water due to waste discharge (i.e. oil spill,
run-off storm water, domestic wastewater, construction wastewater), inland waterway traffic
incidents (i.e. congestion, accident) at construction site, noise and vibration from the extensive pile
driving required for constructing the tidal sluice gate and ship lock, dust and VOC (asphalt)
emission from road construction works
To mitigate impacts of the project construction, following measures will be carried out by the
PMU:
– Clear the area before construction by qualified and licensed UXO clearance experts;
– Ensure that there is no land clearance outside defined construction site boundaries;
– Ensure also that the contract requires the contractor, before he commences work, to provides a
construction plan that sets out how he will maintain the flow in the channel and protect the
works from flooding during construction;
– Ensure the contract for the works requires the contractor to prepare a plan for working at site to
manage the waste generated from construction activities to prevent the contamination of water
at area surrounding the construction site, to fully implement health and safety policy to prevent
the any incidents affect to workers onsite and surrounding community;
– Assigning the flagman to control the inland waterway traffic flow through the construction site;
and
– Ensure that pile driving work is carried out only during daylight hours, on normal working
days.
5.2.3.2. Site-specific Measures for Construction of Vam Thuat tidal sluice gate and 2 ship
locks
The subcomponents impacts are considered to be major, short term and localized and most of them
can be mitigated through the typical mitigation measures identified in ECOPs. Key site-specific
impacts are identical to those for the Nuoc Len tidal sluice gate and locks referred to above. To

Environmental and Social Impact Assessment, HCMC Steering Center of the Urban
and Environmental and Social Management Plan Flood Control Program
Proposed HCMC Flood Risk Management Project Date Submitted: December 2, 2015
154
mitigate the impacts the following measures will be carried out by PMU: As for the Nuoc Len
works above.
5.2.3.3. Site-specific Measures for Dredging and construction of canal bank revetment in
the main canal of TLBCNL Canal
The subcomponent impacts are considered to be major, long term and localized and most of them
can be mitigated through the typical mitigation measures identified in ECOPs.
For dredging sludge and upgrading the embankment of the Canal, key site-specific impacts include
risks due to UXO; odor and other contamination resulting from the excavation, transport, and
disposal of approximately 1,778,701.45 m3 of wet sludge with a high organic; noise and vibration
from the extensive pile driving required by the design for the channel protection works.
For constructing the roads along the Canal, key site-specific impacts include risks due to land
clearance, including house, trees and other vegetation, undertaken indiscriminately, without
reference to construction site boundaries construction, traffic causing danger within the
construction site and also to residential and other areas outside the site; vibration from construction
equipment damaging buildings in close proximity to the construction site; and dust and VOC
(asphalt) emission from road construction works.
To mitigate impacts of dredging sludge and upgrading the embankment of the Canal, following
measures will be carried out by the PMU:
– Clear the area before construction by qualified and licensed UXO clearance experts;
– Ensure that the detailed design for the canal rehabilitation works explicitly provides for all
aspects of the sludge management process: excavation, transport in leak proof and covered
trucks, and deposit into suitably prepared sites (landfills for material that testing shows is not
contaminated beyond specified limits, and prepared sanitary landfills – for example the
existing site at Da Phuoc Landfill – for material that is contaminated beyond specified limits);
– In the case of dredged sludge transported to Da Phuoc Landill, the PMU needs to ensure a legal
commitment between Da Phuoc Landfill, HCMC DONRE and PMU, whereby the Da Phuoc
Landfill must ensure an availability of capacity for disposing the dredged sludge and
construction waste.
– Ensure the contract for the works requires the contractor to prepare a plan for working in the
densely habituated section of the channel in particular, to include how they will organize the
works to minimize disruption to the traffic and community lives in term of environmental
issues such as noise, air emission, wastewater and security;
– Ensure also that the contract requires the contractor, before he commences work, to provides a
construction plan that sets out how he will maintain the flow in the channel and protect the
works from flooding during construction; and

Environmental and Social Impact Assessment, HCMC Steering Center of the Urban
and Environmental and Social Management Plan Flood Control Program
Proposed HCMC Flood Risk Management Project Date Submitted: December 2, 2015
155
– Ensure that pile driving work is carried out only during daylight hours, on normal working
days.
To mitigate impacts of road construction of the Canal, following measures will be carried out by
the PMU:
– Ensure that the contractor prepares and implements a site specific environmental management
plans (as required by the contract) for each aspect of the works – site clearance, earthworks,
temporary and permanent drainage, pavement works, and traffic and site safety. Specifically,
and addition to the general requirements set out in the ECOPs:
o Ensure that there is no land clearance outside defined construction site boundaries;
o Ensure that, from the commencement of construction, site drainage is a priority activity,
to include channels, silt traps, flow abatement structures, etc.;
o Ensure that borrow areas are developed, operated, closed, and restored in the same
manner as earthworks sites for the project works, and that are subject to the same EMP
and other contractual requirements;
o Ensure that temporary culverts are installed in any natural waterways that are to be
crossed by construction traffic;
o Ensure that equipment repair facilities, material stockpiles for example – are set up away
from streams, residential areas, and other sensitive sites;
o Ensure that all drivers, equipment operators, etc., are qualified for their respective tasks
and are trained in, and required to adhere to, the site‘s traffic management plan; and
o Ensure that all equipment are operated in appropriate manners; whereby they can reduce
the impacts to surrounding environment and local people
5.2.3.4. Site-specific Measures for Construction of main interceptor in Go Vap district
The subcomponent impacts are considered to be major, short-term and localized and most of them
can be mitigated through the typical mitigation measures identified in ECOPs. Key site-specific
impacts are identical to those for the Canal upgrading works referred to above, including UXO,
noise and vibration from the extensive pile driving required by the operation of tunnel boring
machine, dust and VOC (asphalt) emission from road construction works. However, there will be
impacts for traffic disruption and site safety issues where the interceptors need to be taken across
roads in deep trenches.
To mitigate the impacts the following measures will be carried out by PMU:
– Clear the area before construction by qualified and licensed UXO clearance experts;
– Ensure an appropriate traffic management plan that will be committed to implement by the
PMU and their subcontractors to minimize the traffic congestion at and surrounding project
site;
Environmental and Social Impact Assessment, HCMC Steering Center of the Urban
and Environmental and Social Management Plan Flood Control Program
Proposed HCMC Flood Risk Management Project Date Submitted: December 2, 2015
156
– Ensure the contract for the works requires the contractor to prepare a plan for working in the
densely habituated section of sewage pipes in particular, to include how they will organize the
works to minimize disruption to the traffic and community lives in term of environmental
issues and social issues.
– Ensure also that the contract requires the contractor, before he commences work, to provide a
construction plan that sets out how the contactor will organize and maintain the EHS policy,
schedule, workforces and facilities to complete the work within the requirement of EMP for
this project proposed in Chapter 7; and
– Ensure that pile driving work is carried out only during daylight hours, on normal working
days.
5.2.3.5. Site-specific Measures for Construction and improvement of primary and
secondary combined sewer systems and the secondary interceptor in Go Vap
district
The subcomponent impacts are considered to be major, short-term and localized and most of them
can be mitigated through the typical mitigation measures identified in ECOPs. Key site-specific
impacts include risk due to UXO; odor and spillage resulting from the excavation, transport and
disposal of wet, contaminated sludge accumulated in the existing sewer system, traffic disruption
and site safety issues where the interceptors need to be taken across roads in deep trenches.
To mitigate the impacts the following measures will be carried out by the PMU:
– Clear the area before construction by qualified and licensed UXO clearance experts;
– Ensure that the contract requires the contractor to prepare a detailed work methodology, prior
to commencing work, for excavation, transport, and disposal of sludge accumulated in existing
sewer system;
– Ensure an appropriate traffic management plan that will be committed to implement by the
PMU and their subcontractors to minimize the traffic congestion at and surrounding project
site;
– Ensure the contract for the works requires the contractor to prepare a plan for working in the
densely habituated section of sewage pipes in particular, to include how they will organize the
works to minimize disruption to the traffic and community lives in term of environmental
issues and social issues.
– Ensure also that the contract requires the contractor, before he commences work, to provide a
construction plan that sets out how the contactor will organize and maintain the EHS policy,
schedule, workforces and facilities to complete the work within the requirement of EMP for
this project proposed in Chapter 7; and
5.2.3.6. Site-specific Measures for Improvement of secondary canals (Hy Vong, Cau Cut,
Environmental and Social Impact Assessment, HCMC Steering Center of the Urban
and Environmental and Social Management Plan Flood Control Program
Proposed HCMC Flood Risk Management Project Date Submitted: December 2, 2015
157
Ba Mieng, Ong Tong, Ong Bau, Chin Xieng)
Similar to the Canal upgrading works, the subcomponent impacts are considered to be major,
short-term and localized and most of them can be mitigated through the typical mitigation
measures identified in ECOPs. Key site-specific impacts include risk due to UXO; odor and other
contamination resulting from the excavation, transport, and disposal of wet sludge with a high
organic
To mitigate these impacts the following measures will be carried out by the PMU:
– Clear the area before construction by qualified and licensed UXO clearance experts;
– Ensure that the detailed design for the canal rehabilitation works explicitly provides for all
aspects of the sludge management process: excavation, transport in leak proof and covered
trucks, and deposit into suitably prepared sites (landfills for material that testing shows is not
contaminated beyond specified limits, and prepared sanitary landfills – for example the
existing site at Da Phuoc Landfill – for material that is contaminated beyond specified limits);
– In the case of dredged sludge transported to Da Phuoc Landill, the PMU needs to ensure a legal
commitment between Da Phuoc Landfill, HCMC DONRE and PMU, whereby the Da Phuoc
Landfill must ensure an availability of capacity for disposing the dredged sludge and
construction waste.
– Ensure the contract for the works requires the contractor to prepare a plan for working in the
densely habituated section of the channel in particular, to include how they will organize the
works to minimize disruption to the traffic and community lives in term of environmental
issues such as noise, air emission, wastewater and security;
– Ensure also that the contract requires the contractor, before he commences work, to provides a
construction plan that sets out how he will maintain the flow in the channel and protect the
works from flooding during construction; and
– Ensure that pile driving work is carried out only during daylight hours, on normal working
days.
5.2.4. Measures to Mitigate Impacts during the Operation Phase
5.2.4.1. Site-specific measures for operation of Nuoc Len tidal sluice gate and 2 ship locks
Inappropriate operation program of tidal sluice gate and ship locks can affect the tidal regime of
TLBCN Canal and its dilution capacity that leads to low performance of the water quality
improvement and flooding abatement of whole canal. It is proposed a scientific development of
the operation program of tidal sluice gate and ship locks in the regard of tidal regime related to
water quarter dilution and flooding abatement, where technical professional expert must be
included.
Environmental and Social Impact Assessment, HCMC Steering Center of the Urban
and Environmental and Social Management Plan Flood Control Program
Proposed HCMC Flood Risk Management Project Date Submitted: December 2, 2015
158
5.2.4.2. Site-specific measures for operation of Vam Thuat tidal sluice gate and 2 ship locks
Measures for the Vam Thuat tidal sluice gate and locks are similar to that for the Nuoc Len;
therefore, they are referred to above.
5.2.4.3. Site-specific measures for operation of canal bank revetment in the main canal of
TLBCNL canal
Following the completion of the canal bank revetment and associated facilities (i.e. park, light,
upgraded pavement), more residents will visit this place, contributing the high potential of waste
generation, such as solid waste and wastewater, which affects the water quality of the Canal. In
addition, the water quality can be re-contaminated by the illegal discharge effluent from
discharge contributors (Industrial parks, factories, local community). Furthermore, after the canal
habitat is rehabilitated, fish community may grow up and attract hunting activities of local fisher.
If this activity cannot be balanced, it may affect the aquatic ecosystem the Canal. On top of this,
after road construction is completed, there will be operations of various vehicles on the new
road. Key short term impacts would include an increase in traffic and pedestrian accidents, due
to higher standard road allowing more and faster traffic; premature failure of pavements,
embankment or cut slopes, and drainage structures due to inadequate maintenance.
To mitigate these impacts the following measures will be carried out by PMU:
– Organizing a campaign of increasing awareness of local community toward environmental
protection for TLBCNL Canal, where authorities, NGOs and community living along the
Canal should be involved.
– Other measures include: (i) applying financial penalties for who intentionally discharges
waste into the Canal or hunts fish, (ii) regularly collecting solid waste and sediment in the
Canal by an assigned sanitary team, (iii) more frequent monitoring of water quality of
discharge contributors, especially at industrial park and factories.
Moreover, in order to control the traffic flow on the new roads, following measures will be
implemented by the city road maintenance agency:
– Ensure that traffic safety provisions, including signs, lights, and pavement markings, that
were installed during construction are permanently and effectively maintained, and renewed
as necessary;
– Ensure the city‘s operations and maintenance plan, and related budget, includes the work and
resources required to maintain the road in its as-completed condition;
– Ensure, with the assistance of the traffic control authority, that overloaded vehicles do not use
the road.

Environmental and Social Impact Assessment, HCMC Steering Center of the Urban
and Environmental and Social Management Plan Flood Control Program
Proposed HCMC Flood Risk Management Project Date Submitted: December 2, 2015
159
5.2.4.4. Site-specific measures for operation of main interceptor in Go Vap District
Ineffective operation of sewerage and wastewater collection facilities, especially for interceptors
and pumping, if can create excessive odor, flooding in the area, and potentially serious health
impacts. Blocking of garbage, soil, and other solid wastes could exacerbate the situation. In
order to resolve these issues, the maintenance program should be proposed, financed and ensured
to be implemented by the City‘s/Drainage Company. In addition, the issues of solid waste
discharge from local community should be integrated in the increasing awareness campaign
proposed in Section 5.8.4.3.
5.2.4.5. Site-specific measures for operation of primary and secondary combined sewer
systems and the secondary interceptor in Go Vap District
Measures for this project component are similar to those for main interceptor in Go Vap District;
therefore, they are referred to above.
5.2.4.6. Site-specific measures for operation of secondary canals (Hy Vong, Cau Cut, Ba
Mieng, Ong Tong, Ong Bau, Chin Xieng)
Given the issues generated from this project component during operation phase is identical with
the project of upgrading the TLBCNL Canal, mitigation measures proposed will also be identical
with those of project component 3.
5.3. Cumulative Impact Assessment
5.3.1. General approach
International Finance Corporation proposed a Good Practice Handbook to assess cumulative
impact of a project. Good practice requires that sponsors assess if project may contribute to
cumulative impact on VEC‘s (valued environment components). When there is a lack of
baseline data the handbook propose to develop a Rapid Cumulative Impact Assessment
Approach. The Good Practice Handbook, also proposing a logical framework with six
interactive steps. Figure 1 below illustrates this approach.
The sequence of activities is:
1) Determine project boundaries
2) Identify Valued Environmental Components (VEC)
3) Determine present conditions of VEC
4) Assess the contribution of project
5) Predict the cumulative impact of project
6) Design mitigation measures.
Indicators for five VECs were identified and required a model depicting the change in
watershed conditions. We used a map describing the zone of influence (ref to sampling
section). A variety of data was used from previous studies. Project development scenarios for

Environmental and Social Impact Assessment, HCMC Steering Center of the Urban
and Environmental and Social Management Plan Flood Control Program
Proposed HCMC Flood Risk Management Project Date Submitted: December 2, 2015
160
20 years into the future are using a combination of trend analysis. The model selected is
evaluated with the Chemiotox Index tool
Once the cumulative impacts are determined, their significance must be considered relative to
an established threshold limit, an established legal guideline or policy, or a qualitative
assessment based on professional opinion and consultation. In any case, the significance of
the cumulative impacts must be defensible. The significance of the cumulative impacts and
the contribution of the project must be subsequently evaluated by project decision makers.
The consultant needs to define the level of ―significance‖ or scale and apply it consistently.
The significance should be assessed across past, present and future projects on the trends of
each VEC. The significance of the project interventions‘ contribution to the cumulative
impacts should be defined in one of the following ways:
The project has a measurable effect on the resource;
The project acts in conjunction with the effects of past present or future projects and
activities; and
The project in conjunction with other projects and activities shifts the resource to an
unacceptable level or exceeds a threshold such that the impact is considered significant, in
that:
– The project‘s contribution to cumulative effects is responsible for exceeding or not the
threshold and therefore is significant or,
– The project is contributing with the effects of other projects and activities and the
project contribution may or may not be significant, depending on the level of the
contribution.
The Chemiotox Index model is a mathematical tool for evaluating the overall picture of the
toxic substances discharged into the environment. This evaluation is based on the chemical
characterization results of toxic substances (mg/L), following the weighting (FTOX) of the
relative toxic potential of each substance present in the waste discharged. For practical
purposes, partial indicators (Chemiotox unit, CU) are calculated on the basis of individual
results of each toxic substance in order to integrate these and obtain an overall indicator
(Chemiotox Index, CI = Σ CU). These indicators allow the comparison and integration of
important quantities of characterization data.
The toxicity weighting methodology is quite simple and, serves uniquely environmental
management purposes. Water quality criteria represent an exhaustive census of toxicological
information on pollutants (persistence, bio-accumulation and part of the food chain). This
census aims to define the acceptable concentration limit (mg/L) for the protection of human
life and aquatic ecosystems. The more toxic the substance, the smaller the criterion. In the
CHEMIOTOX model, two water quality criteria were retained, that is the chronic toxicity
Environmental and Social Impact Assessment, HCMC Steering Center of the Urban
and Environmental and Social Management Plan Flood Control Program
Proposed HCMC Flood Risk Management Project Date Submitted: December 2, 2015
161
criteria (CTC, mg/L) and those pertaining to the contamination of aquatic organisms (CAOC,
mg/L).
With these two types of criteria, the toxic effects of chronic exposure to a substance and its
bio-concentration capacity in the food chain are both taken into account. The toxic weighting
factor, FTOX-I related to each substance I, could be arbitrary by defined as proportional to the
inverse of the most stringent water quality criterion for each substance (MSCI):
Or:
Then, for purposes of managerial communications, the FTOX-I could be arbitrarily defined as
the ratio of MSCREFERENCE of a reference substance to the MSCI of the concerned priority
pollutant I.
This is a dimensionless number that represents the toxic potential of a pollutant I in
comparison to the toxicity of a reference contaminant. Generally it is recommended to select
as reference a well-known contaminant. It has to be assigned to a given pollutant to evaluate
its relative importance in the global discharge of a list of priority (selected) pollutants.
The reference substance could be the well-known parameter FeTOT whose most stringent
criteria is equal to 0,3 mg/L (CAOC). In this case, the FTOX-I of a substance i becomes as
follows:
Let remind that it is necessary to select a well-known reference contaminant for environment
management and large communication purposes. Illustrate the usefulness of the tool with the
data and results gathered for the channel THAMLUONG – BENCAT –NUOCLEN in order to
summarize the state of the situation in some simple figures that should be understood for most
of project stakeholders.
5.3.2. Determine project boundaries
It is noted that environmental impact assessment for the project is conducted based on the
guidelines of OP4.01. PMU and exp agreed on a Sampling Program which was conducted
from June 2015 to September 2015. For deserving the design works, it is necessary to
determine boundaries of zone of influence. As proposed in feasibility study, it is
recommended by the Consultant to divide the zone of influence into 9 large drainage basins.

Environmental and Social Impact Assessment, HCMC Steering Center of the Urban
and Environmental and Social Management Plan Flood Control Program
Proposed HCMC Flood Risk Management Project Date Submitted: December 2, 2015
162
Some data were collected from previous monitoring data, available from the PMU, SCFC and
DONRE (Department of Natural Resources and the Environment). However, in order to
obtain sufficient baseline data for ESIA, exp carried out the required additional sampling and
testing work for surface water, groundwater, sediment/sludge, soil, air quality, plankton &
phytoplankton. Details on the Plan for measurement, sampling, collecting information,
including information on: environmental monitoring, the number of sampling locations,
monitoring parameters, sampling frequency and quality standards applied for result analysis
are summarized in Annex.
Meanwhile, existing data were analysed and compilation was done and calculation were done
with Chemiotox index analysis. The sampling point were completed at the stations identified
with PMU. The next map show these sample point stations. Existing data referring to these
sampling points were extracted to calculate the existing Chemiotox Index and to evaluate a
cumulative impact of contamination before 2012 and in 2015.
5.3.3. Identify Valued Environmental Components (VEC)
The environmental components that will be considered and assessed are: air, climate and noise; soil
and groundwater; water and aquatic resources (fauna and flora), sediment and settled sludge. For
modeling and impact evaluation, impact on five VEC‘s will be measured. Information is
collected to ensure a prediction of environmental quality of the following:
- Surface Water Quality – in the main TL-BC-NL canal and the secondary canals;
Plankton & Phytoplankton in surface water
- Sediment and Sludge characterization including waste classification for hazardous
waste;
- Groundwater Quality;
- Soil quality;
- Ambient air quality
5.3.4. Summarizing the past conditions of the VEC (before 2012)
In the preliminary step, it is necessary to produce the synthesis of previous results and data
gathered during the feasibility studies (Components 1, 2, 4A, 4B, 6A and 6B) and from
various environment monitoring reports in order to avoid the replication of future project
monitoring activities.
Summary of results (before 2012) on surface water
For defining the quality of surface water the MoNRE has established the QCVN
08:2008/BTNMT. While it is not a complete and sufficient tool for managing and controlling
the quality of rivers and other water bodies that must deserve simultaneous multiple purposes
(supply water, supply water in case of available treatment plant, irrigation and fluvial
navigation), one should rely at least on its quality criteria and add adequate other ones
depending on each situation (spatial and temporal).

Environmental and Social Impact Assessment, HCMC Steering Center of the Urban
and Environmental and Social Management Plan Flood Control Program
Proposed HCMC Flood Risk Management Project Date Submitted: December 2, 2015
163
The details of calculations are presented in Appendices for interested lectors. The available
results, one can preliminary estimate that the Environment Monitoring report (July 2011)
reveals a greater level of cumulative environ impact (due to various discharge) within the
central area, approximately close to CAUBUNG area. The situation should be worse
approximately at the junction of the sewer CAUBUNG and the main channel. At this location
the daily hydraulic tidal effects would be low and could not contribute to the purge-mix of
surface water toward directly the Saigon River (at VAMTHUAT) and indirectly the CHODEM
channel.
Summary of results (before 2012) on sediment/sludge
The QCVN 43:2012/BTNMT has been published in 2012. It can be serves as a technical
explanation why monitoring campaigns aiming sediments & settled sludge had not focused
enough on complete lists of heavy metals and other such organic toxic pollutants as
pesticides. Hover on the basis of incomplete useful results the CHEMIOTOX INDEX
methodology has produced a meaningful overview of the state on contamination and buildup
of pollutants in the bottom volume on sediments along the main channel TL-BC-NL. The
CHEMIOTOX calculations have been based on a mix of data from QCVN 43:2012/BTNMT and
QCVN 03:2008/BTNMT, its equivalent for soils. Most of the monitoring activities before
2012 have been based on contaminants listed in the latter that includes the heavy metals Cu
and Zn. The more recent QCVN 43:2012/BTNMT does not include these metals and Fe.
Summary of results (before 2012) on groundwater
Previous results (before 2012) are the less significant because water samples were not taken
for piezometers (observation wells) implemented accordingly to a scientific method based at
least on the knowledge of underground soil and aquifer layers. The water samples seem be
randomly taken at available inhabitant wells. The inhabitants would find themselves the best
locations for implementing useful wells offering suitable service water (domestic purposes)
and avoid the contaminated locations. So we should give less attention to the previous results.
Summary of results (before 2012) on ambient air quality
The QCVN 05:2013/BTNMT and QCVN 06:2009/BTNMT together deserve the assessment
of ambient air quality according the CHEMIOTOX INDEX methodology. The reference
contaminant will be the well-known CO whose MAC is 30 000 μg/m3 or 30 mg/m
3. Most of
parameters listed in the QCVN 05:2013/BTNMT should be related to air contaminants due to
local traffic or industrial combustion while the gaseous contaminants NH3 and H2S should be
due to emanations from anaerobic biodegradation within the liquid body of the main channel
or due to savage solid waste dumping along the banks of the main channel.
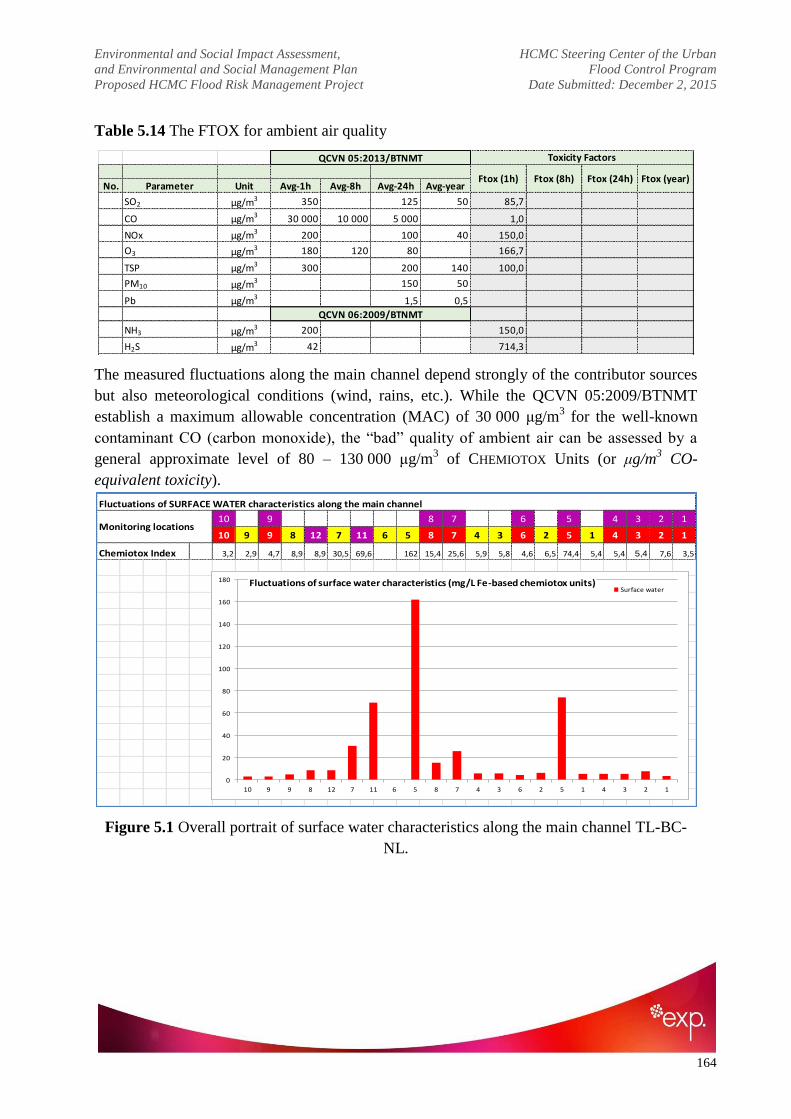
Environmental and Social Impact Assessment, HCMC Steering Center of the Urban
and Environmental and Social Management Plan Flood Control Program
Proposed HCMC Flood Risk Management Project Date Submitted: December 2, 2015
164
Table 5.14 The FTOX for ambient air quality
The measured fluctuations along the main channel depend strongly of the contributor sources
but also meteorological conditions (wind, rains, etc.). While the QCVN 05:2009/BTNMT
establish a maximum allowable concentration (MAC) of 30 000 μg/m3 for the well-known
contaminant CO (carbon monoxide), the ―bad‖ quality of ambient air can be assessed by a
general approximate level of 80 – 130 000 μg/m3 of CHEMIOTOX Units (or μg/m
3 CO-
equivalent toxicity).
Figure 5.1 Overall portrait of surface water characteristics along the main channel TL-BC-
NL.
No. Parameter Unit Avg-1h Avg-8h Avg-24h Avg-year
SO2 μg/m3 350 125 50 85,7
CO μg/m3 30 000 10 000 5 000 1,0
NOx μg/m3 200 100 40 150,0
O3 μg/m3 180 120 80 166,7
TSP μg/m3 300 200 140 100,0
PM10 μg/m3 150 50
Pb μg/m3 1,5 0,5
NH3 μg/m3 200 150,0
H2S μg/m3 42 714,3
QCVN 06:2009/BTNMT
Ftox (year)
QCVN 05:2013/BTNMT Toxicity Factors
Ftox (1h) Ftox (8h) Ftox (24h)
10 9 8 7 6 5 4 3 2 1
10 9 9 8 12 7 11 6 5 8 7 4 3 6 2 5 1 4 3 2 1
Chemiotox Index 3,2 2,9 4,7 8,9 8,9 30,5 69,6 162 15,4 25,6 5,9 5,8 4,6 6,5 74,4 5,4 5,4 5,4 7,6 3,5
Monitoring locations
Fluctuations of SURFACE WATER characteristics along the main channel
0
20
40
60
80
100
120
140
160
180
10 9 9 8 12 7 11 6 5 8 7 4 3 6 2 5 1 4 3 2 1
Fluctuations of surface water characteristics (mg/L Fe-based chemiotox units)Surface water

Environmental and Social Impact Assessment, HCMC Steering Center of the Urban
and Environmental and Social Management Plan Flood Control Program
Proposed HCMC Flood Risk Management Project Date Submitted: December 2, 2015
165
Figure 5.2. Overall portrait of the contamination of sediment and settled sludge.
Figure 5.3. Overall portrait of the groundwater characteristics at private domestic wells.
10 9 8 7 6 5 4 3 2 1
10 9 9 8 12 7 11 6 5 8 7 4 3 6 2 5 1 4 3 2 1
139,
9
98,3
119,
2
Fluctuations of SEDIMENT characteristics along the main channel
Monitoring locations
Chemiotox Index
136,
2
128,
1
124,
6
98,2
147,
8
153,
6
202,
6
186,
6
183,
1
241,
8
0,0
50,0
100,0
150,0
200,0
250,0
300,0
10 9 9 8 12 7 11 6 5 8 7 4 3 6 2 5 1 4 3 2 1
Sediment/Sludge characteristics (mg/kg Pb-based chemiotox index)
Sediment/Sludge
10 9 8 7 6 5 4 3 2 1
10 9 9 8 12 7 11 6 5 8 7 4 3 6 2 5 1 4 3 2 1
0,40
0
0,35
7
0,45
6
Fluctuations of GROUNDWATER characteristics along the main channel
Monitoring locations
Chemiotox Index
1,39
2
1,21
9
1,41
9
0,96
0
0,50
4
0,89
6
0,51
7
0,38
9
1,50
0
1,64
5
0,000
0,500
1,000
1,500
2,000
2,500
3,000
3,500
4,000
4,500
5,000
9 9 8 12 7 11 6 5 8 7 4 3 6 2 5 1 4 3 2 1
Groundwater characteristics (mg/L Fe-based chemiotox index)
Groundwater

Environmental and Social Impact Assessment, HCMC Steering Center of the Urban
and Environmental and Social Management Plan Flood Control Program
Proposed HCMC Flood Risk Management Project Date Submitted: December 2, 2015
166
Figure 5. 4 Overall portrait of the groundwater characteristics at domestic wells.
5.3.5. Monitoring of present environmental conditions of VEC (in 2015)
The present environmental conditions of VEC (the state of the existing environment) have
been consolidated by field monitoring campaigns completed in September 2015. This section
present results screening of that campaign. Raw results will be gathered in the Appendices.
The maximum allowable concentrations listed on the QCVN 08:2008/BTNMT (surface
water) under the column B2 (fluvial navigation purposes) have been considered for the
calculations of the toxicity factors FTOX related to each contaminant. The surface water has
been characterized during the both conditions of low and high tide in order to understand the
potential influence of hydraulic tidal effects. Traces of heavy metals have been largely
analyzed (As, Cd, Pb, Cr, Cu, Zn, Fe and Hg). As usual, the MAC for the main contaminant
Fe (2 mg/L) has been considered as reference for the calculation of FTOX. For instance, in the
case of the contaminant Hg, the calculation is as follows:
FTOX-Hg = MAC of Fe / MAC of Hg = 2 mg/L / 0,002 mg/L = 1 000
Surface Water monitoring along the ThamLuong–BenCat–NuocLen channel
The analytical results are compared to the maximum allowable concentrations (MAC) of
QCVN 08:2008/BTNMT. For the assessment of the cumulative impact of most of all the
considered contaminants, the CHEMIOTOX model uses the MAC for the parameter
FeTOTAL: 2 mg/L (column B2: case of fluvial transportation). According to the calculations:
o At low tide, there is a build-up of the presence of contaminants if during this period,
discharges of the latter continue on a regular or permanent basis (e.g. continuous
discharge (24/7) of the final effluent of the wastewater treatment plant of BinhHungHoa,
10 9 8 7 6 5 4 3 2 1
10 9 9 8 12 7 11 6 5 8 7 4 3 6 2 5 1 4 3 2 1
92 7
25
96 2
49
90 4
17
Fluctuations of AMBIENT AIR characteristics along the main channel
Monitoring locations
Chemiotox Index
83 1
83
130
063
104
086
110
356
113
393
136
183
88 1
07
83 1
83
101
857
136
154
119
497
112
046
97 6
27
101
673
75 6
05
0
20 000
40 000
60 000
80 000
100 000
120 000
140 000
160 000
10 9 9 8 12 7 11 6 5 8 7 4 3 6 2 5 1 4 3 2 1
Ambient Air characteristics (μg/m3 CO-based chemiotox units)Ambient Air

Environmental and Social Impact Assessment, HCMC Steering Center of the Urban
and Environmental and Social Management Plan Flood Control Program
Proposed HCMC Flood Risk Management Project Date Submitted: December 2, 2015
167
150 000 m3/d, continuous free discharge of raw wastewater through combined domestic
sewers, etc.)
o Build-up of contaminants seems more higher at monitoring locations where hydraulic tidal
effects would be less important (from OngBau Canal/SW3 to ThamLuong Bridge/SW8)
o From a managerial point of view, the cumulative effects on aquatic fauna (plankton) and
flora (phytoplankton) would be far greater than the ones due to the sole MAC of 2 mg/L
of Fe toxicity equivalent.
The sediment/sludge along the TL-BC-NL canal
Sediments have been largely monitored along the main channel. During the present mandate,
EXP has focused on the potential effects of high and low tide, at some monitoring locations
near the junction with Saigon River. The reference for Chemiotox calculations has been the
QCVN 43:2012/BTNMT and the pollutant of reference is Pb. Its MAC is 91,3 mg/kg DW. A
summary of results has been gathered on the Table 5.9.2. We can notice a build-up of
concentrations at the locations where hydraulic tidal effects are the less important: central
areas and in the deep layer of sediment.
The analytical results are compared to the maximum allowable concentrations (MAC) of
QCVN 43:2012/BTNMT. For the assessment of the cumulative impact of most of all the
considered contaminants, the Chemiotox model uses the MAC for the parameter PbTOTAL:
91,3 mg/kg DW. According to the calculations:
o Along the main channel ThamLuong-BenCat-NuocLen, the results gathered during the
previous project steps demonstrate a cumulative impact at the locations where hydraulic
tidal effects would be less important.

Environmental and Social Impact Assessment, HCMC Steering Center of the Urban
and Environmental and Social Management Plan Flood Control Program
Proposed HCMC Flood Risk Management Project Date Submitted: December 2, 2015
168
o For a fixed area, three would be a progressive build-up of pollutants contents (heavy
metals) at deep layers of sediment / sludge.
o The recent results indicate an absence of PAHs and pesticides in the sediments. There
would be present under dissolved forms (in surface water).
The groundwater along the TL-BC-NL canal
The analytical results are compared to the MAC of QCVN 09:2008/BTNMT and the MAC of
the parameter FeTOTAL: 5 mg/L has been taken in consideration for applying the Chemiotox
Index methodology. The results are summarized on the Table 5.9.3. While most of the
groundwaters are moderately contaminated, the first monitoring location (near the Saigon
River, at Chin Xieng canal junction area) indicates a case of strong contamination by NH4-N
and Fe.
The analytical results are compared to the maximum allowable concentrations (MAC) of
QCVN 09:2008/BTNMT. For the assessment of the cumulative impact of most of all the
considered contaminants, the Chemiotox model uses the MAC for the parameter FeTOTAL: 5
mg/L. According to the calculations:
There should be 2 monitoring locations where contamination of groundwater is very high
(Chinh Xieng canal area, TrungDai to ChoCau area). The main pollutant would be NH4-N
and Fe.
The pH would be often low (acid, less than 5,5)

Environmental and Social Impact Assessment, HCMC Steering Center of the Urban
and Environmental and Social Management Plan Flood Control Program
Proposed HCMC Flood Risk Management Project Date Submitted: December 2, 2015
169
The soil along the TL-BC-NL canal
The soil along the main channel area is moderately contaminated by heavy metals. The
reference is the QCVN: 03:2008/BTNMT and the MAC of Pb contaminant has been taken in
consideration: 200 mg/kg DW. At several locations, the cumulative impact due the aimed
heavy metals has demonstrated a value of Chemiotox Units greater than the MAC.
The analytical results are compared to the maximum allowable concentrations (MAC) of
QCVN 03:2008/BTNMT. For the assessment of the cumulative impact of the considered
heavy metals, the Chemiotox model uses the MAC for the parameter PbTOTAL: 200 mg/kg
DW (commercial uses of land). According to the calculations: At almost 50% of monitoring
locations the contents in aimed heavy metals are greater than 200 mg/kg DW Pb toxicity
equivalent. The use of sediment/sludge as cover soil without preliminary treatment would
increase the contents in heavy metals
The characteristics of ambient air along the TL-BC-NL canal

Environmental and Social Impact Assessment, HCMC Steering Center of the Urban
and Environmental and Social Management Plan Flood Control Program
Proposed HCMC Flood Risk Management Project Date Submitted: December 2, 2015
170
Characteristics of ambient air can be altered by both local traffic (TSP, CO & CO2, SO2,
NO2, etc.) and emission for aquatic environment (mainly NH3, H2S and VOCs). Both QCVN
related to the two series of contaminants are considered: QCVN 05:2013/BTNMT (average 1
hour) and QCVN 06:2009/BTNMT (average 1 hour). The well-known CO contaminant
(MAC = 30 mg/m3) is taken in consideration for the calculations of Chemiotox Units.
Monitoring activities have focused on air contaminants aimed by QCVN 05:2013/BTNMT,
QCVN 06:2009/BTNMT and QCVN 26:2010/BTNMT. Detailed results shown low levels of
air contaminants (NH3, H2S and VOCs) due to the anaerobic biodegradation within the main
water receiving body. Local traffic seems be the main cause of monitored results: TSP, NO2,
SO2, CO & Pb. For measuring the cumulative impact, the MAC of CO has been considered.
At the majority of monitoring locations, the MAC of 30 mg/m3 CO (Avg-1h) is largely
overpassed.
Plankton and Phytoplankton
Biological inventories of plankton and phytoplankton have been organized in order to support
the state of aquatic environment along the main channel. Preliminary conclusions would be:
in way of eutrophication. The direct Plankton counting (biological inventory) in surface water
indicates a living water receiving body including microbiological pathogen species from
protozoa to larva. Biodegradable organic matters should be abundant to allow such living
conditions. The over-polluted ChoDem canal should contribute to an increase on plankton
population at high tide while the less polluted Saigon River contribute to the dilution of
identified microorganism species.

Environmental and Social Impact Assessment, HCMC Steering Center of the Urban
and Environmental and Social Management Plan Flood Control Program
Proposed HCMC Flood Risk Management Project Date Submitted: December 2, 2015
171
5.3.6. Cumulative impact in 2015
In order to avoid duplicate, the field monitoring activities have focused in areas where
previous studies had not sufficient results. Again lab results confirm a build-up of pollutant
concentrations in the central areas where we should observe a low level of hydraulic tidal
effects. We can observe that the pollutant contents gradually increase in the deeper layer of
sediments.
Comparison of 2015‟s monitoring results and data from the period before 2012
2015 Monitoring locations for surface water
SW1 Location 200 meter from Sai Gon river towards the Vam Thuat canal.(0603441;1197897)
SW2 Location at the junction between the Chin Xieng canal and the Tham Luong – Ben Cat – Nuoc Len channels.(0602849;1197393)
SW3 Location at the junction between the Ong Bau canal and the Tham Luong – Ben Cat – Nuoc Len channels.(0602742;1197488)
SW4 Location at the junction between the Ong Tong canal and the Tham Luong – Ben Cat – Nuoc Len channels.(0602361;1198764)
SW5 Location at the junction between the Ba Mien canal and the Tham Luong – Ben Cat – Nuoc Len channels.(0601002;1199835)
SW6 Location at the junction between the Cau Cut canal and the Tham Luong – Ben Cat – Nuoc Len channels (0598939;1200474)
SW7 Location at the junction between the Hy Vong channel and the Tham Luong – Ben Cat – Nuoc Len channels.(0596170;1197484)
SW8 Location at the Tham Luong bridge, after the discharging point of Tan Binh Industrial Park.(0595884;1196999)
SW9 Location at the An Lac bridge.(0593163;1186046)
SW10 Location 200 meter from Cho Dem river toward the Nuoc Len bridge.(0593205;1184253)
SW10 SW9 SW8 SW7 SW6 SW5 SW4 SW3 SW2 SW1
3,2 4,7 15,4 25,6 4,6 74,4 5,4 5,4 7,6 3,5
SW10 SW9 SW8 SW7 SW6 SW5 SW4 SW3 SW2 SW1
19,67 21,10 41,09 42,04 54,62 65,87 23,69 61,74 21,08 18,27
Monitoring locations
Chemiotox Units (mg/L Fe tox eq.)
Chemiotox Units (mg/L Fe tox eq.)
Monitoring locations
2015 Monitoring
Monitoring < 2012

Environmental and Social Impact Assessment, HCMC Steering Center of the Urban
and Environmental and Social Management Plan Flood Control Program
Proposed HCMC Flood Risk Management Project Date Submitted: December 2, 2015
172
In order to improve the comparison of previous results (before 2012) and recent data (2015)
gathered during the monitoring activities a limitative list of monitoring locations has been
selected. They are called SW1 to SW10 (from 200-m close to SAIGON River to 200-m close to
CHODEM Channel). Except for the monitoring location SW5 (at the junction of BaMien Canal
and the main channel) there is an general increase of CHEMIOTOX UNITS (mg/L Fe tox. Eq.).
Globally for qualitative assessment, there is an evidence of attended decline of surface water
characteristics.
Increase of eco-toxic contents in Sediments / Settled sludge
Monitoring locations in 2015 for sediments characterization < 2012 2015
Sed1 Location 200 meter from Sai Gon river towards the Vam Thuat
canal (0603441;1197897). 119,2 154,8
Sed2 Location at the junction between the Chin Xieng canal and the
Tham Luong – Ben Cat- Nuoc Len channels (0602849;1197393) 98,3 160,5
Sed3 Location at the junction between the Ong Bau canal and the
Tham Luong – Ben Cat- Nuoc Len channels (0602742;1197488) - 125,0
Sed4 Location at the junction between the Ong Tong canal and the
Tham Luong – Ben Cat- Nuoc Len channels (0602361;1198764) - 114,3
0
10
20
30
40
50
60
70
80
SW10 SW9 SW8 SW7 SW6 SW5 SW4 SW3 SW2 SW1
SURFACE WATERCHEMIOTOX Units (mg/L Fe tox.eq.)
Data of 2015 monitoring & previous results (before 2012)
Data of 2015
Data < 2012
QCVN 08:2008/BTNMT:
2 mg/L Fe

Environmental and Social Impact Assessment, HCMC Steering Center of the Urban
and Environmental and Social Management Plan Flood Control Program
Proposed HCMC Flood Risk Management Project Date Submitted: December 2, 2015
173
Figure 5.5 Increase in Chemiotox Units in the sediments/settled sludge.
The sediments/settled sludge in the main channel come from a cumulative effect of the
sedimentation of total suspended solids (TSS). In the present case, it should be due to the
pollutant solids discharged from urban areas (including stand-alone industries), effluents of
industrial parks and surely various run-off rainwater materials. The recent (2015) lab chemical
characterization of sediments within two different layers has shown a progressive build-up of
CHEMIOTOX UNITS (mg/kg DW Pb tox. Eq.) in the deeper layer. The comparison between
previous (before 2012) and recent results at the same monitoring locations (relatively deeper
bottoms) has indicated a general progressive build-up of pollutant contents. At lower deeps in
the central areas, it should be more cumulative effects and build-up of CHEMIOTOX UNITS
despite an absence of recent planned monitoring activities. The sedimentation phenomena are
more important in the lower-depth sections of the main channel.
5.3.7. Predict the cumulative impact of project development in 2035
0,0
50,0
100,0
150,0
200,0
250,0
300,0
10 9 9 8 12 7 11 6 5 8 7 4 3 6 2 5 1 4 3 2 1
Sediments characteristicsCHEMIOTOX Units (mg/kg DW Pb tox. eq.)
Data < 2012 & Data of 2015
Data < 2012
Data 2015
Recommended by QCVN 43:2012 /BTNMT : 91,3
mg/kg DW Pb
10 9 8 7 6 5 4 3 2 1
10 9 9 8 12 7 11 6 5 8 7 4 3 6 2 5 1 4 3 2 1
98,3
147,
8
153,
6
202,
6
186,
6
183,
1
241,
8
139,
9
119,
2
Fluctuations of SEDIMENT characteristics along the main channel
Monitoring locations
Chemiotox Index
136,
2
128,
1
124,
6
98,2

Environmental and Social Impact Assessment, HCMC Steering Center of the Urban
and Environmental and Social Management Plan Flood Control Program
Proposed HCMC Flood Risk Management Project Date Submitted: December 2, 2015
174
The whole investment project comprises 2 components:
Component 1: Integrated management of urban flood risk. Within this component one
can expect an improvement of the capacity of environmental management by the
implementation of environmental monitoring locations that will allow direct and rapid flows
of information on the fluctuating quality of the environment (air and surface water) in order to
implement adequate mitigation measures.
Component 2: Priority flood risk reduction interventions. This component includes:
- Construction of 2 tidal sluice gates at the end of VamThuat and NuocLen
canals in order to control tidal inflows.
- Improving the whole ThamLuong - BenCat - NuocLen Channel system through
dredging works and embankment construction in order to improve its ability to
discharge flood waters at the safe level of frequency of 10 years.
- Construction of the main interceptor system in GoVap District.
- Construction and improvement of a primary and secondary combined sewer
system for reaching the appropriate safety level, and construction of the secondary
interceptor system in GoVap District
Wastewater Collection, Drainage and Sanitation
With rapid population growth and improvement of functional infrastructure, HCMC will be
challenged with environmental pollution. The major sources of pollution would directly
discharge untreated wastewater or partially treated wastewater to canals, creeks and rivers.
The population growth in the zone of influence could increase the densities of all district up to
139 people per hectare which could result in population of 2 000 000 inhabitants or more. The
wastewater flow will generate pollution in the drainage network and at the end into the
ThamLuong-BenCat-NuocLen Channel. The wastewater flow generated from factories
outside the industrial parks is ranged from 30 to 40 000 m3/day, in which 2.4 tons of pollutant
suspended solids are comprised. Total flow of wastewater generated from industrial parks
such as TanTao, TanBinh, VinhLoc A, TanThoiHiep is estimated to be more than 32 000
m3/day. This flowrate can potentially contribute about 6.4 tons of pollutant suspended solids
into ThamLuong Canal if the discharged wastewater could meet allowable standards.
Within the limits of GoVap District, the common technical solution to the drainage of
domestic wastewater for the City is using combined or separated drainage system for both
run-off rainwater and domestic wastewater collection, depending on the stages of
urbanization, economic conditions and environmental sanitation. Box culverts, manholes and
pumping stations will deserves the collection and the transfer to the planned wastewater
treatment plant (a built-transfer project) that will be located at AnPhuDong Ward, District 12,

Environmental and Social Impact Assessment, HCMC Steering Center of the Urban
and Environmental and Social Management Plan Flood Control Program
Proposed HCMC Flood Risk Management Project Date Submitted: December 2, 2015
175
close to the Saigon River. The main projected interceptor would collect and transfer the mixed
wastewater from HyVong Canal area (deserving the TanSonNhat Airport) to the ChinXieng
area, close to the location planned for the construction of the tidal sluice gate (VamThuat).
Collected wastewater will be pumped to the planned treatment plant (AnPhuDong Ward). The
final treated effluent would be discharged at a location downstream the tidal sluice gate or
directly into the Saigon River current flow. According to internal regulations of industrial
parks, raw wastewaters discharged by industries should be treated (first step) separately by
preliminary and primary processes prior to their pumping towards the centralized secondary
treatment for a second ―finishing‖ step in order to be compliant with the maximum allowable
concentrations of QCVN 24:2009/BTNMT. Then the final effluent would be legally
discharged into the main channel.
In the South-West area, a call for investment has been planned for the implementation of
canal dredging projects and construction of a centralized wastewater treatment (―Nha May Xu
Ly Nuoc Thai, Tay SaiGon‖). With this expected project the coverage for wastewater
collection and drainage component will be limited to 9 urban districts: District 12, GoVap,
BinhThanh, TanBinh, TanPhu, BinhTan, BinhChanh, HocMon, and District 8. For
determining the impact due to the increase in population within the 9 covered districts, let us
propose to assess a scenario for only one phase with the hypothesis of 139,5 person/ha as
density in the horizon of 2035.
Demography
The population distribution in Ho Chi Minh City is uneven. Regarding the growth rate of
population, while the natural growth rate reaches approximately 1.07%, the mechanical
growth rate amounted to 2.5%. Immigration status in the city continues to grow in recent
years. Since 1999 up to now, the population of 8 districts within the city is decreasing while
the population of suburban districts and newly-setup districts grew rapidly. The mechanical
increase of the city's population is going strongly and difficult to control as indicated in
BINHCHANH: population increasing per year was ever up to 30,000 people, equivalent to the
population of one commune. (ref: FS Study 2012)
In 2007 the estimated population of Ho Chi Minh City was over 6.5 million, growing at
around 2.9% per year. It is forecasted that the Study Area population will reach over 13.8
million by 2025, with 10 million people in HCMC. Most of the population growth is projected
to happen in outer areas (the urban fringe, suburban and other outlying communities), while
the inner core areas are projected either to decrease their populations (in high density areas)
or increase moderately (in medium/low density areas). (Ref: Preparing the Ho Chi Minh City
Metro Rail System Project, ADB, Project number 39500, Feb 2010)
At the United Nations Conference on Trade and Development conference (on Investment
Policy Review 2007), it was noted that a new airport and training and research facilities will

Environmental and Social Impact Assessment, HCMC Steering Center of the Urban
and Environmental and Social Management Plan Flood Control Program
Proposed HCMC Flood Risk Management Project Date Submitted: December 2, 2015
176
be built outside Ho Chi Minh City. As a population growth scenario, we are assuming that the
airport will delocalized and that districts will be constructed with new development. With a
population growth of 2.5%, total population of zone of influence should reach 2 000 000 latest
2038. We will assume that density will equalized at the average density of 139.5 persons per
hectare. The table 5.15 represent population forecast in each district (zone of influence only)
for year 2035 with that density.
Table 5.15 opulation forecasted to 2035 as follows
No. District
Area Population
2015
Actual
Density
Population
2035
(ha) (persons) (person/ha) Density
139,5
1 District 12 3 083,4 181 127 59 430 134
2 Go Vap 1 915,7 313 798 161 308 427
3 Binh Thanh 142 19 624 138 19 809
4 Tan Binh 525,1 37 244 71 73 251
5 Tan Phu 1 706,5 218 843 128 238 056
6 Binh Tan 1 445,6 199 316 131 201 661
7 Binh
Chanh 4 589,1 29 670 7 640 179
8 Hoc Mon 1 526,1 99 574 65 212 890
9 District 8 93,3 9 054 97 13 015
Total: 9
districts 14 899 1 108 250 74 2 137 426
Calculation of Wastewater Flows
Within the Phase I (to 2035), the Project aim at limiting the wastewater at these figures and
propose Design References for 2035 as:
Flow of domestic wastewater: 180 L/capita/day in 2035.
Flow of wastewater from Industries, Commerce and Institutional (ICI): 30% Qdomestic;
Irregular coefficient of day max: KDAY-MAX = 1,25;
Known flow from two industrial zones will be added separately.
The table 5.16 is presenting calculation for wastewater daily flow in each district, if all the
outfalls are captured and drained to the channel TL-BC-NL.
Table 5.16 Potential Wastewater discharging to the channel Tham Luong Ben Cat Nuoc Len
Year 2015 Year 2018 Year 2035
No.
AREA 120l/p/day 120l/p/day 180l/p/day
District ha m3/day WWTP m3/day

Environmental and Social Impact Assessment, HCMC Steering Center of the Urban
and Environmental and Social Management Plan Flood Control Program
Proposed HCMC Flood Risk Management Project Date Submitted: December 2, 2015
177
Year 2015 Year 2018 Year 2035
No.
AREA 120l/p/day 120l/p/day 180l/p/day
1 District 12 3083,4 21735 23365 77424
2 Go Vap 1915,7 37656 40480 55517
3 Binh Thanh 142 2355 2531 3566
4 Tan Binh 525,1 4469 4804 13185
5 Tan Phu 1706,5 26261 28231 42850
6 Binh Tan 1445,6 23918 25712 36299
7 Binh Chanh 4589,1 3560 3827 115232
8 Hoc Mon 1526,1 11949 12845 38320
9 District 8 93,3 1086 1168 2343
Total: 9
districts 15026.8 132990 142964 384737
Strom water pollutant
Urban storm water runoff has been the subject of intensive research since the inception of the
Water Quality Act of 1965 in USA. The most comprehensive study of urban runoff was
NURP, conducted by EPA between 1978 and 1983. NURP was conducted in order to
examine the characteristics of urban runoff and similarities or differences between urban land
uses, the extent to which urban runoff is a significant contributor to water quality problems
nationwide, and the performance characteristics and effectiveness of management practices to
control pollution loads from urban runoff (US EPA 1983).
Table 5.17 Pollutant Criteria for Storm Water
BOD mg/l 10 COD mg/l 73 73
TSS mg/l 101 Total Lead μg/l 144 144
Total Copper μg/l 33 Total Zinc μg/l 135 135
Total Kjeldahl Nitrogen μg/l 1900 Nitrate + Nitrite μg/l 736
Total Phosphorus μg/l 383 Soluble Phosphorous μg/l 143
Contamination in Tham Luong Ben Cat Nuoc Len Channel system
Table 5.18 Total Maximum Daily Load (TSS)
No. District 2015 2018 2035 total
kg/day kg/day kg/d tons
20 years
1 District 12 15802 5592 9560 18394
2 Go Vap 17546 4772 6311 17519
3 Binh Thanh 1161 330 440 1113
4 Tan Binh 2937 2937 1628 7626
5 Tan Phu 13300 13300 5291 38493
6 Binh Tan 11801 11801 4482 1099

Environmental and Social Impact Assessment, HCMC Steering Center of the Urban
and Environmental and Social Management Plan Flood Control Program
Proposed HCMC Flood Risk Management Project Date Submitted: December 2, 2015
178
No. District 2015 2018 2035 total
kg/day kg/day kg/d tons
7 Binh Chanh 14306 14306 14229 25188
8 Hoc Mon 8202 8202 4732 20950
9 District 8 615 615 289 1697
Total: 9
districts 78137 54321 45330 132079
Table 5.19 illustrates the cumulative impact of Suspended Solids that may be discharged in
the channel system if WWTP are in operation or not. This situation propose that in 2038 all
WWTP will be in operation. According to this hypothesis, there will 132 079 tons of dry
sludge in the channel in 2035. The volume of sludge may be 3 301 987 m3 at 4% dryness.
After dredging the channel assuming that bottom will be at -4 meter and top average water
level will be at +1 meter over the sea level, total effective volume of channel will be 6
060 612 m3. This indicates that the canal will be filled up to 55% if no sludge is removed
within 20 years.
To evaluate the contamination of channel, it will be divided in three sections
1) From Cho Dem River to Bridge Ba Hom: 1 273 100m3
2) From Bridge Ba Hom to Bridge Cho Cau: 2 189 700 m3
3) From Bridge Cho Cau to Saigon River: 2,597,812 m3
Section 1 will receive 50% of District Binh Tan, District 8 and part of District Huyen Binh
Chanh.
Section 2 will receive district Hoc Mon, 50% of Districts 12, 50% of districts Binh Tan,
District Tan Phu, District Tan Binh with the catchment of WWTP Binh Hung Hoa. The
treatment plant used aerated lagoon and stabilization pond technology to treat wastewater
from nearby Den canal. Den canal has an area of 785 ha and population in the area is around
120.000 (1999). The canal is also received untreated wastewater from surrounding industrial
activities, creating black colour and bad odour in the water with physico-chemical parameters
as follow: SS 250mg/L, BOD5 200mg/L, COD 300mg/L, NH3-N 25mg/L, and pH 6.5 - 7
(Smet et al.,2006). It will also receive effluent of 2 industrial zone. This treatment is very
effective reduce BOD to 5 mg/L.
Section 3 will receive 50% of District 12, District Go Vap and part of District Binh Thanh
Four scenarios were evaluated.
1) Rainy Season after modifications occurring in 2018
2) Dry Season after modifications occurring in 2018
3) Rainy Season in 2035 expecting that all WWTP will be completed
4) Dry Season in 2035 expecting that all WWTP will be completed

Environmental and Social Impact Assessment, HCMC Steering Center of the Urban
and Environmental and Social Management Plan Flood Control Program
Proposed HCMC Flood Risk Management Project Date Submitted: December 2, 2015
179
According to statistic 85% of rain is falling from May to October and 15% from December to
April.
The next table present concentration of pollutant in the channel in 2018 and in 2038 if
mitigation measure are applied and if WWTP are in operation. This situation suppose that
there will be no water coming from outside the channel system other than rain water drainage
and wastewater.
Table 5.19 Concentration of pollutants in Channel TL-BC-NL 2018-2035
TSS TSS TSS TSS COD COD COD COD
Dry WET DRY WET Dry WET DRY WET
2018+ 2018+ 2035 2035 2018+ 2018+ 2035 2035
mg/L mg/L mg/L mg/L mg/L mg/L mg/L mg/L
1 91 25 96 52 137 38 144 78
2 99 40 96 52 148 60 144 78
3 54 27 98 55 81 40 147 82
The channel may become an anaerobic pond in these conditions. In the dry season the sluice
gates will have to be open at high tide to dilute the water in the channel.
Feasibility study also proposed two important measures that could improve the situation.
1) Constructing a retention pond at Go Vap park (available in the planning of control
reservoir in HCMC) and to propose size of the reservoir to reduce water level in main canal
and reduce inundation for the basin at the head route, nearby Sai Gon river (mainly An Phu
Dong ward, Thanh Xuan ward - district 12)
2) Constructing Tan Tao retention pond for climate change by 2100.
These two measures would have a direct impact to reduce and eliminate contamination
coming from storm water. Mitigation measure like application of Low Impact Development
Technic would also reduce the load. In these case the load would be limited to wastewater
contamination. The WWTP Binh Hung Hoa is already in operation and discharge to Kenh
Nuoc Den Canal. This effluent is providing a good quality water. Construction of other
Wastewater Treatment plant would also have a positive impact.
The situation in 2035

Environmental and Social Impact Assessment, HCMC Steering Center of the Urban
and Environmental and Social Management Plan Flood Control Program
Proposed HCMC Flood Risk Management Project Date Submitted: December 2, 2015
180
As earlier mentioned, dredging embankment construction works will modify the hydraulic
volumes of the three sections of the main channel. Calculations taking in consideration an
increase in population (and pollution discharge into sewerage networks) and an achievement of
wastewater treatment plants would allow assessing the pollutant contents in terms of Chemiotox
Units in the three sections of the main channel as follow:
2018 2035
Dry
Seasons
Wet
Seasons
Dry
Seasons
Wet
Seasons
Section 1: ChoDem Channel (or NuocLen
Sluice Gate) to BaHom Bridge 70,0 19,4 73,5 39,8
Section 2: BaHom Bridge to ChoCau Bridge 75,6 30,6 73,5 39,8
Section 3: ChoCau Bridge to Saigon River (or
VamThuat Sluice Gate) 41,4 20,4 75,1 41,9
If the operation strategy in the future remains mainly in hydraulic factors (strictly in favor of
fluvial navigation) we can again face to a progressive build-up in pollutant contents. The
following Figure illustrates the progressive increase in CHEMIOTOX UNITS along the 3 sections of
the main channel during wet seasons.
5.3.8. Linked Ancillary Projects
Following table presents a summary of current and future projects whose impacts can be
negative, neutral or positive to the factors identified previously. Each project is described with
0
10
20
30
40
50
60
70
80
SW10 SW9 SW8 SW7 SW6 SW5 SW4 SW3 SW2 SW1
SURFACE WATERCHEMIOTOX Units (mg/L Fe tox.eq.)
Data of 2012, 2015, 2018 & 2035
Data of 2012
Data of 2015
Data of 2018
Data of 2035
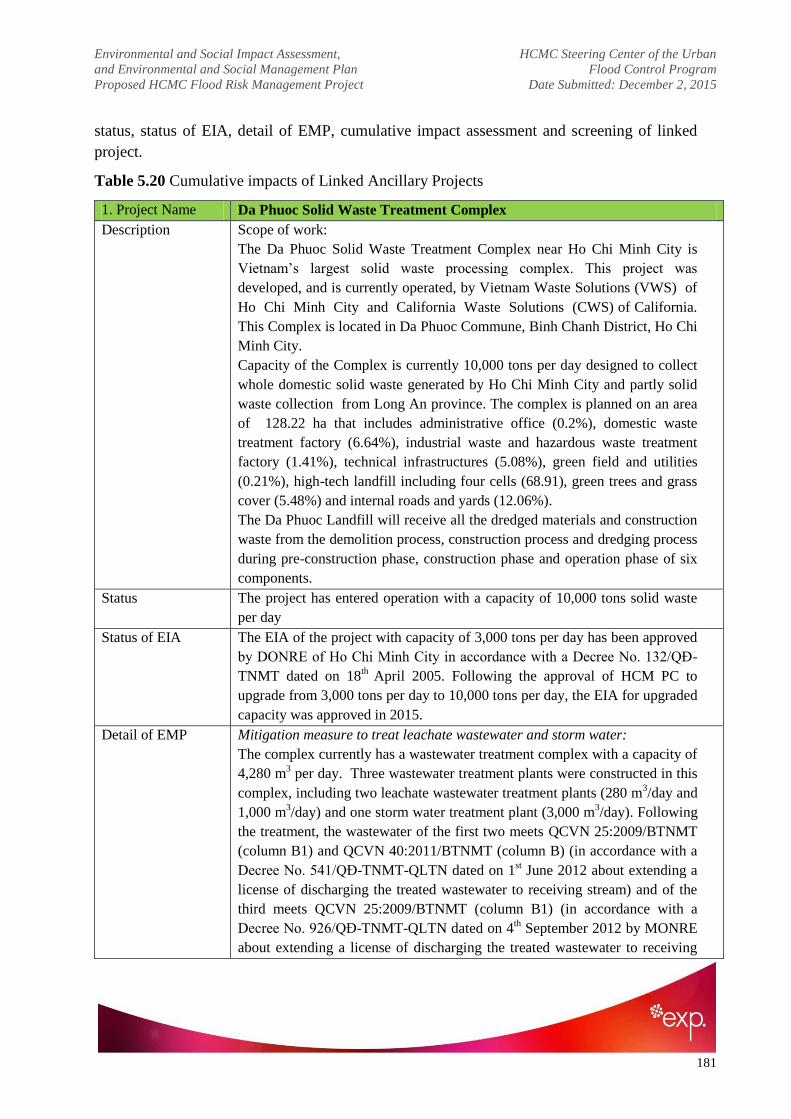
Environmental and Social Impact Assessment, HCMC Steering Center of the Urban
and Environmental and Social Management Plan Flood Control Program
Proposed HCMC Flood Risk Management Project Date Submitted: December 2, 2015
181
status, status of EIA, detail of EMP, cumulative impact assessment and screening of linked
project.
Table 5.20 Cumulative impacts of Linked Ancillary Projects
1. Project Name Da Phuoc Solid Waste Treatment Complex
Description Scope of work:
The Da Phuoc Solid Waste Treatment Complex near Ho Chi Minh City is
Vietnam‘s largest solid waste processing complex. This project was
developed, and is currently operated, by Vietnam Waste Solutions (VWS) of
Ho Chi Minh City and California Waste Solutions (CWS) of California.
This Complex is located in Da Phuoc Commune, Binh Chanh District, Ho Chi
Minh City.
Capacity of the Complex is currently 10,000 tons per day designed to collect
whole domestic solid waste generated by Ho Chi Minh City and partly solid
waste collection from Long An province. The complex is planned on an area
of 128.22 ha that includes administrative office (0.2%), domestic waste
treatment factory (6.64%), industrial waste and hazardous waste treatment
factory (1.41%), technical infrastructures (5.08%), green field and utilities
(0.21%), high-tech landfill including four cells (68.91), green trees and grass
cover (5.48%) and internal roads and yards (12.06%).
The Da Phuoc Landfill will receive all the dredged materials and construction
waste from the demolition process, construction process and dredging process
during pre-construction phase, construction phase and operation phase of six
components.
Status The project has entered operation with a capacity of 10,000 tons solid waste
per day
Status of EIA The EIA of the project with capacity of 3,000 tons per day has been approved
by DONRE of Ho Chi Minh City in accordance with a Decree No. 132/QĐ-
TNMT dated on 18th
April 2005. Following the approval of HCM PC to
upgrade from 3,000 tons per day to 10,000 tons per day, the EIA for upgraded
capacity was approved in 2015.
Detail of EMP Mitigation measure to treat leachate wastewater and storm water:
The complex currently has a wastewater treatment complex with a capacity of
4,280 m3 per day. Three wastewater treatment plants were constructed in this
complex, including two leachate wastewater treatment plants (280 m3/day and
1,000 m3/day) and one storm water treatment plant (3,000 m
3/day). Following
the treatment, the wastewater of the first two meets QCVN 25:2009/BTNMT
(column B1) and QCVN 40:2011/BTNMT (column B) (in accordance with a
Decree No. 541/QĐ-TNMT-QLTN dated on 1st June 2012 about extending a
license of discharging the treated wastewater to receiving stream) and of the
third meets QCVN 25:2009/BTNMT (column B1) (in accordance with a
Decree No. 926/QĐ-TNMT-QLTN dated on 4th September 2012 by MONRE
about extending a license of discharging the treated wastewater to receiving

Environmental and Social Impact Assessment, HCMC Steering Center of the Urban
and Environmental and Social Management Plan Flood Control Program
Proposed HCMC Flood Risk Management Project Date Submitted: December 2, 2015
182
stream). Following increasing up to 10,000 tons of solid waste per day, total
capacity will be increased from 4,280 m3
per day to 4,510 m3 per day. In this
case, the leachate wastewater treatment plant will be upgraded to meet the
increased capacity.
Mitigation measure to treat gas emission from landfill:
Gas emissions from landfill revenues are collected by spaced vertical wells.
All the collected gas is flared.
Mitigation measures to treat odor and pathogens microorganisms:
In addition to the daily soil cover layer to prevent odors, spraying is also done
regularly, especially during the time after the rain.
In addition, planting of trees is also done to create buffer areas.
Limitations of the residents scavenging and require workers to user PPE when
working at the landfill.
Assessment of
cumulative
impact
Given the Complex has now received a half of 10,000 tons of solid waste per
day, it still has enough area and capacity to receive the solid waste generated
from the HCM – FRM project. Therefore, negative cumulative impact is
assessed to be minimal. WW is discharged in Nga Cay creek which do not
directly reach the channel TL-BC-NL.
OP 4.12:
Screening of
linked project
The Da Phuoc landfill is to accommodate sludge from dredging operation to
be supported by HCM – FRM project. This is existing landfill built 10 years
ago and it will not require any further civil works or any involuntary land
acquisition. Therefore it is noted that this is not considered as linked project,
but is considered as ancillary activities.
2. Project Name Tham Luong Ben Cat Wastewater Treatment Plant
Description The project of wastewater treatment plant for a catchment of Tham Luong
Ben Cat Nuoc Len, phase 1, with a total capacity of 131,000 m3 per day. It is
scoped in a project ―Wastewater collection system and wastewater treatment
plant for a catchment of Tham Luong Ben Cat Nuoc Len‖, where the Prime
Minister approved a pre-feasible study regarding to a document No. 1131/CP-
CN dated on 13th August 2014 and investment policy under forms of Building
and Transfer (BT) regarding to a document No. 383/QĐ-UBND-DT dated on
8th October 2010.
The catchment area where wastewater will be collected for treatment by the
Tham Luong Ben Cat WWTP is of 5,141 ha of District 12, Go Vap District
and Binh Thanh District. It is located at An Phu Dong Ward, District 12, Ho
Chi Minh City.
Diagram of wastewater treatment technology processing:
Wastewater from sewage system Screen bar Sand sediment tank
Selector C-Tech (biological tank) UV disinfaction tank Lagoon
Discharge to Vam Thuat River using pump.
In addition to those major treatment units, the WWTP also comprise of units
to treat gas and sludge (sludge holding tank, belt press, gas collection and

Environmental and Social Impact Assessment, HCMC Steering Center of the Urban
and Environmental and Social Management Plan Flood Control Program
Proposed HCMC Flood Risk Management Project Date Submitted: December 2, 2015
183
treatment). Following treatment, treated wastewater will meet QCVN 40:
2011/BTNMT (column A).
Status The project is under construction and expected to be completed on May 2017.
Status of EIA The EIA of project has been approved by the local authority (DONRE) of Ho
Chi Minh City. Below is a summary of impact evaluation for each project
components:
Waste water treatment plant:
- Location is An Phu Dong Ward, District 12, Ho Chi Minh City. Point for
discharge is Vam Thuat River and the treated wastewater will meet the Viet
Nam environmental standard of type A, QCVN 40: 2011/BTNMT (column A)
before discharge.
- Option technology is Sequencing Batch Reactor. The treatment is activated
sludge.
- Per EIA, most of the negative environmental impacts are short-term and
mitigated. Mitigation measures have been properly proposed in EMP,
including institutional arrangement for environmental management,
monitoring and capacity building program. Community consultation has been
conducted during project preparation. Most of the participants raised their
concerns on compensation prices, construction-caused disturbance and
pollution generated during construction and operation phase and requested
PMU to comply with the mitigation measures proposed.
Detail of EMP Proposed mitigation measures on approved EIA report of WWTP project are :
Mitigation measures to treat sludge out of WWTP processing:
Sludge out of WWTP processing will be treated by following process:
Activated sludge sludge holding tank Sludge pump Centrifuge
Fertilized or disposed to landfill.
Controlling the treated wastewater quality out of WWTP:
According to an approved decision of an EIA report by Ho Chi Minh City
People‘s Committee - Department of Natural Resources and Environment
(DONRE), quality of treated wastewater must satisfy the Viet Nam
environmental standard of type A, QCVN 40: 2011/BTNMT (column A)
before discharge.
Environmental monitoring program also included in the EIA report.
Assessment of
cumulative
impact
Impacts will be positive as wastewater effluent quality will be improve but
there will be cumulative impact over time.
OP 4.12:
Screening of
linked project
The project has been constructed to collect the domestic wastewater generated
from local community located in the Tham Luong ben Cat Nuoc Len
Catchment. It is scoped in a project ―Wastewater collection system and
wastewater treatment plant for a catchment of Tham Luong Ben Cat Nuoc
Len‖ and constructed to serve the outcomes of project component 4.
Therefore, it is considered as a linked project.

Environmental and Social Impact Assessment, HCMC Steering Center of the Urban
and Environmental and Social Management Plan Flood Control Program
Proposed HCMC Flood Risk Management Project Date Submitted: December 2, 2015
184
3. Project Name Tan Tao Industrial Park
Description Tan Tao IP is located in Binh Tan District, Ho Chi Minh City with total area
of 380.15ha. It was established on 30th November 1996 following a Decision
906/TTg and 978/QĐ-MT.
In 2008, Tan Tao Investment Industry Corporation constructed a WWTP,
which has a capacity of 3,000 m3 per day for extension of Tan Tao IP, and
completed that in 2010. This WWTP for Tan Tao IP extension was provided
completion certification issued a documents No. 171/BQL-KCN-HCM-
QLMT dated 14/01/2010. In addition, DONRE of Ho Chi Minh City also
issued a document No. 373/GP-TNMT-QLTN dated 23rd
April 2012 to
provide a discharge license where the project can discharge 3,000 m3 of
wastewater per day to receiving stream.
This flowrate together with flowrate of the original Tan Tao IP contribute to
generate up to 12,000 m3 per day.
Major industry sectors invested in this IP comprise of textile, leather, rubber,
plastic, mechanics, electronics, wood, food. Regarding to document No.
137/CV-ITACO-10, all investors must ensure the wastewater generated from
their factories must meet the parameters concentration developed by Tan Tao
IP owner before discharging to the central wastewater treatment plant in Tan
Tao IP.
Currently, approximate 107 business sectors has invested in Tan Tao IP and
contribute a total of wastewater flow ranged from 2,300 to 2,400 m3
per day.
Wastewater following pretreatment stage undertaken in each factory is
permitted to discharge to central wastewater treatment plant of Tan Tao IP for
further treatment to meet the QCVN 40: 2011/BTNMT (Column B). Treated
wastewater effluent then enters to sewage system to discharge to Nuoc Len
Creek, which is connected to Cho Dem River and Vam Co Dong River.
Status The project has entered operation, where a WWTP was constructed with a
capacity of 12,000 m3 per day.
Status of EIA The EIA of project has been approved by the local authority (DONRE) of Ho
Chi Minh City.
Detail of EMP The business sectors must commit to preliminary treat raw wastewater to meet
the influent discharge requirement of central WWTP of Tan Tao IP.
Mitigation measures to treat wastewater generated from factories in Tan Tao
IP:
Tan Tao IP (Original):
Wastewater from sewage system Collection tank Screen bar
Equalization Tank Aeration tank (biological tank) Clarifier
Discharge to Nuoc Len Creek
Tan Tao IP (Extension):
Wastewater from sewage system Collection tank Fine screen
Equalization Tank Neutralization tank Coagulation and flocculation

Environmental and Social Impact Assessment, HCMC Steering Center of the Urban
and Environmental and Social Management Plan Flood Control Program
Proposed HCMC Flood Risk Management Project Date Submitted: December 2, 2015
185
tank Physical sedimentation tank Mutech tank (activated sludge)
Disinfection tank Discharge to Nuoc Len Creek
According to the approved decision of the EIA report by Ho Chi Minh City
People‘s Committee - Department of Natural Resources and Environment
(DONRE), quality of treated wastewater must satisfy the Viet Nam
environmental standard of type A, QCVN 40: 2011/BTNMT (column A)
before discharge.
Assessment of
cumulative
impact
Negative cumulative impact is assessed to be limited as the WWTP can
accommodate wastewater generated from factories located in Tan Tao IP to
meet QCVN 40: 2011/BTNMT (column A) before discharge. However, if the
discharge cannot be monitored well in term of treatment performance, it can
cause negative impacts to receiving streams. There will be cumulative impact
over time
5.3.9. Design mitigation measures
5.3.9.1.Objectives
The main goal of the in the Tham Luong Ben Cat Nuoc Len Channel restoration is to restore
the degraded reservoir to a level that can be permanently sustained through protection and
conservation. The water quality target should be in accordance with the quality of natural
water and without stresses that cause degradation, i.e. with a good ecosystem health, long-
term stability and sustainability.
The water quality management of the channel must be at first oriented to control
eutrophication and the external factors causing the increase of nutrient load. Restoration
program is also oriented to enhance the biodiversity of the channel. Fortunately, in the last
decade, many good experiments have been realized and many solutions are now available to
control the eutrophication by minimizing the nutrient inflows from the point sources and from
the non-point sources (NPS).
5.3.9.2.Cumulative impact from wastewater and drainage water pollution
Wastewater treatment engineering design has to bring solutions for the 3 issues with equal
emphasis: odour removal, main influent treatment and sludge disposal. Referring to the results
obtained in the previous section, we can conclude that by installing barriers at each end of the
channel, it will become a closed tank. Previously the rising and falling tide of the Saigon
River and Cho Dem River had a washing effect and allow a dilution of pollution in the
channel. Tests show that the central portion of the channel is much more contaminated than
the remainder of the channel. By closing the channel, this washing effect will disappear. An
alternative water management solution will be needed. A strategic sanitation and drainage
plan would conduct to implement long term measures.
5.3.9.3.Green Infrastructure

Environmental and Social Impact Assessment, HCMC Steering Center of the Urban
and Environmental and Social Management Plan Flood Control Program
Proposed HCMC Flood Risk Management Project Date Submitted: December 2, 2015
186
PMU should propose a strategic sanitation and drainage plan with Green Infrastructure. PMU
should establish what level of sanitation exists in each district, in terms of facilities, in terms
of institutions and in terms of the people‘s perspectives and the level of service expected.
PMU should proposed green approach in designing services. By introducing Green
Infrastructures the quality of storm water will be improved by a pre-filtration effect. LID
(Low Impact Development) measures are proposed.
LID is a multi-barrier approach that uses features at the lot, neighborhood, and watershed
level to maintain the on-site water balance (Gyurek, 2009). The proposed plan must integrate
this multi-barrier approach to reduce the water footprint in the development. This involves:
Designing strategies to provide quantity and quality control and enhancement of groundwater
recharge (through infiltration of runoff into the soil), retention or detention of runoff for
permanent storage or for later release, and pollutant settling and entrapment (by conveying
runoff slowly through vegetated swales and buffer strips or small wetlands). (Gyurek, 2009)
In the proposed approach, all LID features are introduced to maximize water quality. The
concept includes features such as rain gardens, bio-retention, and bio-swales. To integrate all
systems, it is necessary to protect canals on-site and to link all parts of the system with that
water body as the core.
LID Features are local infrastructures. There are numerous features to consider in the layout
of a LID, with features typically selected and arranged according to the topography and
landscape of the site. The LIDC proposes that the following features be incorporated into
design.
5.3.9.4.Rain Gardens
Rain Gardens enhance local water quality by allowing water to be filtered naturally by soil
instead of being piped untreated into large bodies of water (LIDC 2011). A rain garden is a
landscaped garden in a shallow depression that receives the storm water from nearby
impervious surfaces, thereby recharging it (Dussailsant 2004). Beyond its environmental use,
rain gardens provide attractive landscaping and a natural habitat for birds, bees, and
butterflies, while encouraging environmental stewardship and community pride (LIDC 2011).
5.3.9.5.Street Storage
Street storage refers to the technology of temporarily storing storm water (in densely
populated urban areas) on the surface — on- and off-street — and, as needed, below the
surface, close to the source (Carr, Esposito & Walsh 2000). The use of street storage and
catchment basins reduces the rate of runoff entering storm sewer systems, reducing the
required minimum size of water mains conveying storm water pipes (LIDC 2011).
5.3.9.6.Bio-Retention

Environmental and Social Impact Assessment, HCMC Steering Center of the Urban
and Environmental and Social Management Plan Flood Control Program
Proposed HCMC Flood Risk Management Project Date Submitted: December 2, 2015
187
Bio-retention is an alternative to runoff treatment, acting on storm water before it is
discharged into waterways (Hsieh & Davis 2003). A landscaped island containing a curb inlet
drains a large area or street, channeling rainwater through a small pipe into a municipal storm
drain system. Bio-retention consists of porous media layers that can remove pollutants by
infiltrating runoff through mechanisms that include adsorption, precipitation, and filtration
(Hsieh & Davis 2003).
5.3.9.7.Permeable Pavements
Permeable pavement systems restore soil infiltration functions in the urban landscape. These
systems are mainly composed of porous pavement systems in parking areas (LIDC).
Permeable pavements offer one solution to the problem of increased storm water runoff and
the decreased stream water quality associated with automobile usage (Brattebo & Booth
2003). Permeable pavements with reservoir structures consisting of concrete paving stones
offer the possibility for decentralized, sustainable storm water management and source control
in urban areas. Runoff from streets and parking areas with low traffic densities can be
infiltrated to support groundwater recharge and to reduce hydraulic stress in sewer systems.
Infiltration can help to return the urban water cycle to its natural condition, increasing the
level of groundwater (Dierkes et al. 2002).
5.3.9.8.Vegetated Roof Cover
Green roofs (roofs with a vegetated surface and substrate) provide ecosystem services in
urban areas, including improved storm water management, better regulation of building
temperatures, reduced urban heat island effects, and increased urban wildlife habitat
(Oberndoofer et al. 2007). The use of vegetation on a rooftop as an alternative to traditional
roofing materials is an increasingly utilized example of GI practice. The vegetation and
growing media perform a number of functions that improve environmental performance,
including absorption of rainfall, reduction of roof temperatures, improvement in ambient air
quality, and the provision of urban habitat (Carter & Keeler 2007).
5.3.9.9.Bioswales
Bioswales are broad ditches with gentle slopes. Swales are vegetated open channels designed
to accept sheet flow runoff and convey it in a broad shallow flow. Swales are used to reduce
storm water volume through infiltration, improve water quality through vegetative and soil
filtration, and reduce flow velocity by increasing channel roughness (Lukes & Kloss 2008).
Bioswales can take many forms. Generally, bioswales can be contained in approximately one
per cent of the land area draining into them. Since bioswales are linear, they work well along
impermeable surfaces such as roads and sidewalks (Wahl 2009).
5.3.9.10. Rainwater Harvesting
Environmental and Social Impact Assessment, HCMC Steering Center of the Urban
and Environmental and Social Management Plan Flood Control Program
Proposed HCMC Flood Risk Management Project Date Submitted: December 2, 2015
188
Rainwater harvesting, which involves the collection of rainwater from impervious surfaces
and storing it for later use, is a technique that has been used for millennia. Although,
rainwater harvesting has not been widely employed in industrialized societies, which rely
primarily on centralized water distribution systems, with the increasing recognition of the
need to address the problems of limited water resources and storm water pollution, and the
emergence of green building design, the role of rainwater harvesting in water supply is being
reassessed (Kloss 2009).
5.3.9.11. Tertiary treatment
In addition to the site consideration, sizing the facility need to physically accommodate future
treatment plant expansions; it is necessary for the designer to include provisions to
accommodate the future expansion and/or process changes. Onsite sewage additional
treatment should be designed such that their capacity can be increased and/or parallel facilities
constructed without the need for major disruption of plant operation. The layout and sizing of
channels and plant piping should be such that additional treatment units can be added in the
future or increases in loading rates can be accommodated hydraulically. The location of
buildings and tanks should allow for the location of the next stages of expansion. Buffer areas
should be provided.
Treatment beyond the norm of secondary or equivalent level for various watersheds may be
necessary due to limited assimilation capacity and/or critical downstream uses being made of
the receiving body of water. Some sewage treatment plants are required to meet more
stringent effluent quality requirements than associated with secondary treatment. The
receiving water-based effluent requirements are incorporated into the A and B QCVN
40:2011 and QCVN 14: 2008, as effluent compliance limits with appropriate effluent quality
objectives in terms of concentrations and loadings. Depending on the effluent requirements,
there are a number of suitable alternative sewage treatment processes that can be considered.
In this case to mitigate cumulative impact of Load discharged into the Channel TL-BC-NL, a
tertiary treatment should be added to the proposed process.
Granular media filters may be used as an advanced treatment process for the removal of
residual TSS and TP from secondary effluent. Filters may be necessary where effluent
concentrations of less than 15 mg/L of TSS and/or 0.5 mg/L of TP need to be achieved. A
pre-treatment process such as chemical coagulation and sedimentation or other acceptable
process should precede the granular media filter units where effluent suspended solids
requirements are less than 10 mg/L.
In this case, provision for Continuous backwashing up flow sand filters should be planned to
eliminate Suspended Solids in the effluent of futur WWTP.
Environmental and Social Impact Assessment, HCMC Steering Center of the Urban
and Environmental and Social Management Plan Flood Control Program
Proposed HCMC Flood Risk Management Project Date Submitted: December 2, 2015
189
CHAPTER 6: SOCIAL IMPACT ASSESSMENT AND MITIGATION MEASURES
6.1. Study approach
The approach and methodology employed during the social impact assessment is outlined in the
following sub-sections. The SIA was conducted through a combination of qualitative research
methods, quantitative household surveys, and desk study.
6.1.1. Data collection
Relevant recent information from the Project Feasibility Study Report, Assessment of Poverty
and Social Impacts of Flooding in Selected Neighborhoods of HCMC, statistical reports from
statistical offices, and existing EIA reports was used to inform the impact assessment. A
quantitative household survey was also conducted in September 2015 on more than 500
households in the project area to collect further information for baseline study as well as public
opinions of the project.
Desk review of relevant documentation
The following documents were reviewed at a desk level:
- Project Feasibility Study Report;
- Assessment Report of Poverty and Social Impacts of Flooding in Selected Neighborhoods of
HCMC prepared by the World Bank consultant team in 2014;
- Environmental Impact Assessment of the Project conducted in 2007 (including all the EIA
reports of 7 components of the Project);
- Involuntary Resettlement Assessment Report prepared by Consultant for Resettlement Plan
of the Project;
- Policy for Resettlement and Rehabilitation provided by the Project Management Unit.
Field work
A preliminary site visit to the project area was conducted in July 2015. Primary data collection
was subsequently undertaken during August and September 2015. This included a survey on
household composition, education levels, general health status, employment, income,
expenditure, the impacts of flooding on household level and their opinions of the project.
The first public consultation on the project was conducted in the 9 districts of the project area in
August and September 2015. The public consultation meetings helped the Consultant gain deeper
contextual understanding of the social environment and public attitudes towards the project.
6.1.2. Defining „social‟ area of influence
Defining a ‗social area of influence‘ does not necessarily require the articulation of a geographic

Environmental and Social Impact Assessment, HCMC Steering Center of the Urban
and Environmental and Social Management Plan Flood Control Program
Proposed HCMC Flood Risk Management Project Date Submitted: December 2, 2015
190
boundary. Instead, the social extent of the project can be determined through a combination of
stakeholder analysis and social mapping, and through an iterative process of understanding the
social, economic, political and environmental changes induced by the project and the livelihoods
and networks of potentially impacted people.
Stakeholder analysis
Direct stakeholders include:
- Physically and economically displaced people;
- People living in communities close to the Project area;
- Local labour pools for job seekers;
- Local women‘s groups;
- Local business owners, such as fish farmers;
- Local social and community service providers (e.g. health and education);
- Local governmental bodies related to public welfare, environmental protection and permitting
for the Project;
- Neighbouring and supply chain industries and businesses including livestock owners.
Indirect stakeholders can be defined as those persons or organizations that may be interested in or
able to influence the outcome of the Project, either because they can contribute knowledge or
improve Project design or mitigate social and/or environmental impacts, or because they have
political influence in the Project that needs to be considered. All of these stakeholders are
considered to be ‗interest-based‘. Indirect stakeholders relevant to the Project are identified in
Table 6.1.
Table 6.1 Indirect Stakeholder Groups
No. Stakeholder
Group Reasons for Inclusion within the Consultation Process
1
International
Bodies (e.g. the
World Bank)
Interest-based: The World Bank influence government policy
which affects the Project, including funding, resettlement plan
and environment, health and safety policies during project
construction and operation.
2 National
Government
Interest-based: Meeting the requirements of country‘s EIA
process before project construction, setting national policies,
providing project approvals.
3
Provincial/Local
Government
Departments
Impact-based and Interest-based: Managing local impacts,
facilitating project implementation and consultation.

Environmental and Social Impact Assessment, HCMC Steering Center of the Urban
and Environmental and Social Management Plan Flood Control Program
Proposed HCMC Flood Risk Management Project Date Submitted: December 2, 2015
191
4
Civil
Society,
NGOs,
Research
Bodies
Interest-based: Protection of rights of residents of the local
communities during the project implementation; should be
involved in external monitoring and identification of
environmental and social issues.
5 Press and
Media
Interest-based: Informing residents living in HCMC and in the
Project affected area about the planned activities, reporting
Project activities.
6.2. Impact assessment methodology
Please check Annex 5 for the description of our social impact assessment methodology and
process.
6.3. Social Positive Impacts
6.3.1. During project construction phase (2016-2021)
Potential positive impacts anticipated during this phase include the followings:
- Creation of employment opportunities
- Increase in business opportunities in local services
Creation of employment opportunities
The construction sector is one of the largest single contributors to employment. It can be
expected that opportunities will be available for unskilled, semi-skilled and skilled employment
of the local population during the construction. The following table estimates the number of
workers required for each stage of the project.
Table 6.2 Number of workers required to each sub-component of Project Component 2
Preparation
(persons)
Construction (persons) Operation
(persons) Total
Total
Unskilled
workers
Sub-component 2.1 5 25 10 3 33
Sub-component 2.2 0 25 10 3 28
Sub-component 2.3 5 50 20 0 55
Sub-component 2.4 0 50 25 0 50
Sub-component 2.5 0 50 20 0 50
Sub-component 2.6 5 50 25 0 55

Environmental and Social Impact Assessment, HCMC Steering Center of the Urban
and Environmental and Social Management Plan Flood Control Program
Proposed HCMC Flood Risk Management Project Date Submitted: December 2, 2015
192
Total 15 250 110 6 271
Source: previous EIA report.
It is roughly estimated that the construction phase of the project will require the recruitment of
around 250 persons for the 7 components, of which 110 are unskilled workers. The construction
is preliminarily estimated to be 18 months. This will create jobs and attract a group of local
population who are seasonal workers, especially the male ones.
The nature of this impact is considered to be positive. However, the magnitude of the impact is
minor as the local working age population is many times larger than the employment demand of
the project. The impact significance is minor.
Increase in business opportunities in local services
During the construction phase of the project, there is expected to be migrant workforce in the
project area in addition to the number of workers that might be employed from the local
population. This will create more demand for goods and local services such as food,
accommodation and health care.
The nature of this impact is positive but the magnitude of the impact is minor as the required
number of construction workers is only around 250 and concentrating mainly around the
construction site. The impact significance is therefore minor.
6.3.2. Positive impacts of the overall project
When the construction is finished, Project Component 2 is expected to bring about the following
positive impacts:
- Poverty reduction;
- Improvement of living conditions;
- Improvement of transport conditions/ accessibility;
- Improvement of work environment;
- Improvement of social security;
- Leisure and tourism;
- Increase in property prices;
- Increase in business opportunities.
Poverty reduction
According to the final report of Ho Chi Minh City's Poverty Reduction Programme for phase
2014-2015, the poverty rate of the city is 0.89%. Compared to this rate, the project area has 04
wards with a higher poverty rate than the city's average rate. 2 over 4 wards are located in Ward
14 and Ward 5 of Go Vap District. The Poverty Assessment and Social Impact Report prepared
by the World Bank consultant team in 2014 showed that urban flooding strongly affected
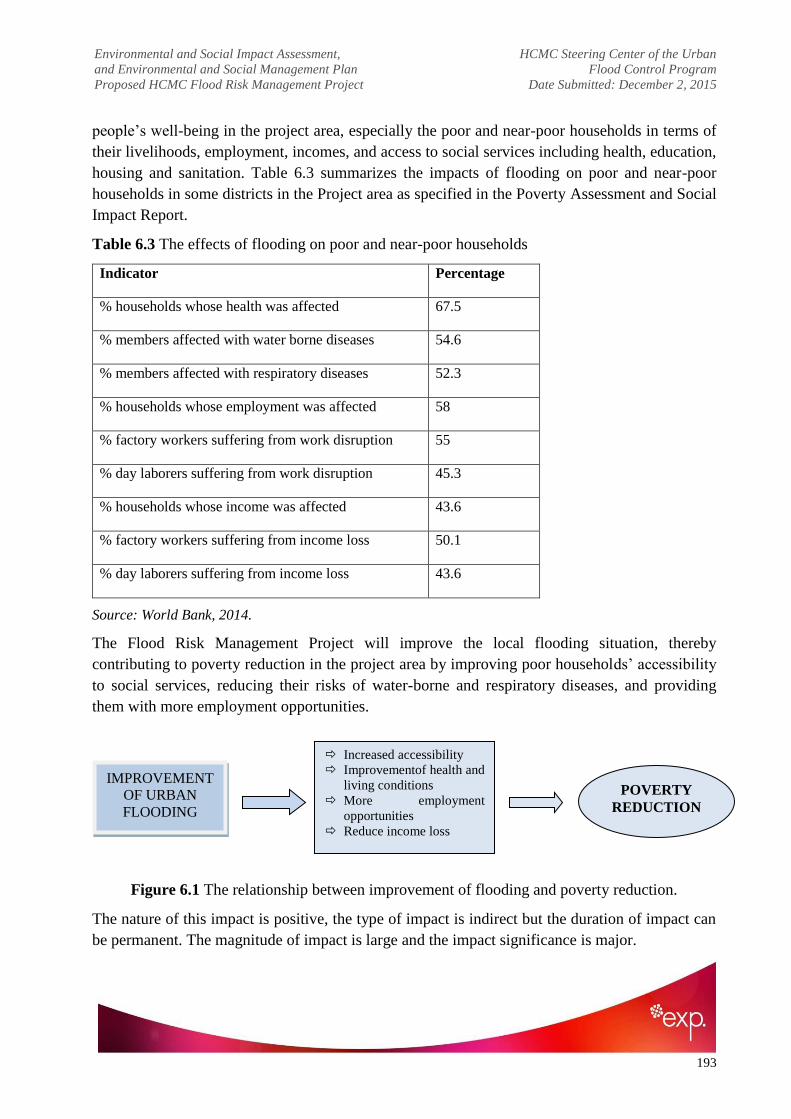
Environmental and Social Impact Assessment, HCMC Steering Center of the Urban
and Environmental and Social Management Plan Flood Control Program
Proposed HCMC Flood Risk Management Project Date Submitted: December 2, 2015
193
people‘s well-being in the project area, especially the poor and near-poor households in terms of
their livelihoods, employment, incomes, and access to social services including health, education,
housing and sanitation. Table 6.3 summarizes the impacts of flooding on poor and near-poor
households in some districts in the Project area as specified in the Poverty Assessment and Social
Impact Report.
Table 6.3 The effects of flooding on poor and near-poor households
Indicator Percentage
% households whose health was affected 67.5
% members affected with water borne diseases 54.6
% members affected with respiratory diseases 52.3
% households whose employment was affected 58
% factory workers suffering from work disruption 55
% day laborers suffering from work disruption 45.3
% households whose income was affected 43.6
% factory workers suffering from income loss 50.1
% day laborers suffering from income loss 43.6
Source: World Bank, 2014.
The Flood Risk Management Project will improve the local flooding situation, thereby
contributing to poverty reduction in the project area by improving poor households‘ accessibility
to social services, reducing their risks of water-borne and respiratory diseases, and providing
them with more employment opportunities.
Figure 6.1 The relationship between improvement of flooding and poverty reduction.
The nature of this impact is positive, the type of impact is indirect but the duration of impact can
be permanent. The magnitude of impact is large and the impact significance is major.
IMPROVEMENT
OF URBAN
FLOODING
Increased accessibility
Improvementof health and
living conditions
More employment
opportunities
Reduce income loss
POVERTY
REDUCTION

Environmental and Social Impact Assessment, HCMC Steering Center of the Urban
and Environmental and Social Management Plan Flood Control Program
Proposed HCMC Flood Risk Management Project Date Submitted: December 2, 2015
194
Improvement of health and living conditions
The HCMC Flood Risk Management Project can contribute to the quality of life and the social
underpinnings of communities. The Jacobs report, The Benefits of Inland Waterways, published
in 2009, highlighted many positive benefits of waterway restorations, including significant
community improvements and cohesion benefits, which they argue can be sufficient justification
for investment in such restoration. In the survey assessing the influence of Tham Luong–Ben
Cat–Nuoc Len sub-catchment on living conditions of local households, 75.38% of the respondent
households answered that their daily life was directly affected by pollution of the sub-catchment
and flood in the area. 90% of the respondent said that flooding affects their health at different
levels. This included insects transmitting diseases such as flies and mosquitos, untreated wastes
in the sub-catchment and floods during the rainy seasons. Other impacts of flood include access
to health services, daily travel and housing quality (see Table 6.4, Table 6.5 and Table 6.6).
Table 6.4 Impact of flood on health of local residents
Level of impact on health Percentage
Extremely serious impact 32.4%
Serious impact 29.7%
Impact but not serious 29.0%
No impact 8.9%
Total 100.0%
Table 6.5 Impact of flood on health services
Impact to health services Percentage
Impact means of travel 51.2%
Impact travel costs 12.1%
Impact travel time 28.1%
No impact 8.6%
Total 100.0%
Table 6.6 Impact of flood on daily travel
Level of impact on daily travel Percentage
Extremely serious impact 23.8%
Serious impact 37.3%
Impact but not serious 32.7%
No impact 6.2%
Total 100.0%
Environmental and Social Impact Assessment, HCMC Steering Center of the Urban
and Environmental and Social Management Plan Flood Control Program
Proposed HCMC Flood Risk Management Project Date Submitted: December 2, 2015
195
When the construction is finished, it is expected that the whole community in the project area
will experience significant positive changes in their living conditions such as better health and
environmental conditions, air and water quality, more open public spaces, less flooding and less
risks of diseases caused by pollution of the sub-catchment area.
The nature of this impact is positive, the magnitude of impact is large and the impact significance
is major.
Improvement of infrastructure and accessibility
The project will significantly improve road conditions in the sub-catchment area by making roads
clearer and more spacious, thereby reducing journey time and traffic congestion. This will also
means less flooded roads in the rainy seasons. Therefore, the accessibility of local households to
health care, social services, education and entertainment will be greatly improved.
The project is also expected to improve inland waterway transport activities in the area as the
waterway is expanded.
The nature of this impact is positive, the magnitude of impact is large and the impact significance
is major.
Improvement of work environment
The existing conditions of Tham Luong – Ben Cat – Nuoc Len sub-catchment area have little
impacts on the industrial parks in the project area. However, pollution and flooding exert many
influences on local small-scale businesses in terms of production, revenue, work environment as
well as worker incomes and employment (World Bank 2014).
The Project is expected to reduce flooding and pollution in the area and improve infrastructure
conditions in the area, thereby contributing to improve the work environment, production,
income and revenue of local small-scale businesses and casual workers. The improvement of
infrastructure conditions will also attract more investment in the area, leading to further
development of the industry and business sectors.
The nature of this impact is positive, the type of impact is indirect, the magnitude of impact is
moderate and the impact significance is moderate.
Leisure and tourism
One of the main impacts identified in the restoration of canals, is forecast to be leisure and
tourism. According to Ho Chi Minh City Department of Tourism (2015), the city has focused on
developing waterway tourism over the past two years. The boat tour on the Nhieu Loc – Thi
Nghe canal which had been restored under a project funded by World Bank, was launched by the
city government in early September 2015. Similarly, the restoration of the Tham Luong – Ben
Cat canal has the potential to generate high levels of recreational use. The canal-side areas will
become open places for public gathering, sport and children playground.

Environmental and Social Impact Assessment, HCMC Steering Center of the Urban
and Environmental and Social Management Plan Flood Control Program
Proposed HCMC Flood Risk Management Project Date Submitted: December 2, 2015
196
The previous environmental impact assessment report forecast that the revenue from economic,
commercial, services and tourism would increase by 3-5% after completion of the project
construction.
The nature of this impact is positive, the extent is regional, and the magnitude of impact is major,
as not only the local population but also people in the city also enjoy the restored canal as a new
place for leisure. The impact significance is major.
Increase in property prices
Research from previous canal restoration projects such as Nhieu Loc – Thi Nghe, Tan Hoa – Lo
Gom and Tau Hu – Ben Nghe shows that the restoration canal projects have brought a life-
changing event to thousands of households living along the canal when their houses suddenly
become street-front, which significantly increases prices of their properties.
In the route Tan Hoa - Lo Gom of Tan Phu District, many household owners are preparing to
increase their rental prices by 10-15% from May 2015 with the reason that the streets have
become more spacious and more convenient for transportation.
It is expected that the restoration of Tham Luong – Ben Cat – Nuoc Len sub-catchment area will
also increase the price of surrounding properties.
The nature of this impact is positive. The magnitude of impact is moderate and the impact
significance is moderate.
Increase in business opportunities
The restoration of the Tham Luong – Ben Cat – Nuoc Len sub-catchment area is expected to
open up new opportunities for home-based food businesses such as cafes, pubs and food stalls
long the canal routes. This would provide local households with more opportunities for income
generation, especially those whose houses become street-front.
However, there is possibility that local businesses along the canal routes and their customers will
not put garbage in the right places, causing pollution in the canal. The mitigation measure for this
potential negative consequence will be proposed in the next part for mitigation measures.
Overall, the nature of this impact is positive, the extent is local, and the magnitude of impact is
moderate. The impact significance is moderate.
6.4. Social negative impacts
Potential negative impacts are divided into two groups: impacts resulting from land acquisition
and resettlement, and impacts other than those caused by land acquisition.
6.4.1. Land acquisition and resettlement impacts due to the project
The implementation of the project require permanent land acquisition of 159,945 m2. This land
area is under the land use right of 717 households and organizations, including 697 households,

Environmental and Social Impact Assessment, HCMC Steering Center of the Urban
and Environmental and Social Management Plan Flood Control Program
Proposed HCMC Flood Risk Management Project Date Submitted: December 2, 2015
197
10 companies and 10 other organizations (including ward level People's Committee) and is under
the management of 15 wards and communes in the project area.
The composition of acquired land is as follows:
- Housing land: 24,205m2, accounting for 15.1%;
- Agricultural land: 84,388m2, accounting for 52.8%;
- Garden land: 18,094 m2, accounting for 11.3%;
- Land for non-agriculture business (renting houses, local food store, etc): 9,457 m2
, accounting
for 5.9%;
- Catchment land: 18,645m2, accounting for 11.7%;
- Other land (including land for transport and office buildings under state management): 23,801
m2, accounting for 14.9 %;
The levels of impacts due to land acquisition are summarized as follows
- There are 65 heavily affected households, in which 60 households are affected from 20% and 5
households are affected from 10% of their agricultural land (including garden land).
- There are 481 affected households in terms of housing, in which 74 households are completely
affected and 392 households are totally partly affected. Among these 299 households can
renovate their houses and continue to live.
- There are 157 affected household in terms of business, with 78/157 households having business
registration. Of these, 2 households have income generate from business operation being
completely affected.
- There are 38 out of 697 affected households due to land acquisition identified to be in the
vulnerable group. Among these, 17 are female household head with dependents, ethnic minorities
2 households, 2 are ethnic minorities, 7 are poor households, 8 are households under preferential
treatment policies and 8 households with disabled people.
The area of land acquisition and scale of influence to households and organization by
administrative boundaries are shown in the following table:
Table 6.7 The scale of the land acquisition by ward
No. Ward/
district
Area/
household
Urban
housing
land
Agricultural
land
Garden
land
Aquaculture
land
Land for
non-
agricultural
business
Canal
Other
land
type
Total
I Go Vap
district
m² 9,522 1,618 - - - 18,645 638 11,778
household 303 21
- - - 8 424
1 Ward 5 m² 1,563 99 - - - - 94 1,756

Environmental and Social Impact Assessment, HCMC Steering Center of the Urban
and Environmental and Social Management Plan Flood Control Program
Proposed HCMC Flood Risk Management Project Date Submitted: December 2, 2015
198
household 77 7 - - - - 2 156
2 Ward 6
m² 290 - - - - - - 290
household 9 - - - - - - 9
3 Ward 13
m² 2,350 1,012 - - - - 505 3,867
household 7 7 - - - - 3 17
4 Ward 14
m² 516 404 - - - - - 920
household 5 4 - - - - - 9
5 Ward 15
m² 2,187
- - 18,645 - 2,178
household 33
- - - - 33
6 Ward 16
m² 1,243 103
- - - - 1,346
household 46 3 - - - - - 49
7 Ward 17
m² 1,373 - - - - - 39 1,412
household 126 - - - - - 3 129
II District
12
m² 5,804 81,466 16,095 - 9,457 - 21,825 134,647
household 34 113 9 - 2 - 10 168
1 Thoi An
m² 2,134 15,509 9,598 - 2,396 - 21,825 51,462
household 24 6 3 - - - 10 43
2 Thanh
Loc
m² 2,974 2,985 - - 7,061 - - 13,020
household 2 1 - - 2 - - 5
3 Thanh
Xuan
m² 470 1,788 6,371 - - - - 8,629
household 5 7 5 - - - - 17
4 An Phu
Dong
m² 226 61,184 126 - - - - 61,536
household 3 99 1 - - - - 103
III
Binh
Tan
district
m² 3,603 1,147 1,999 - - - 1,119 7,868
household 26 4 5 - - - 3 38

Environmental and Social Impact Assessment, HCMC Steering Center of the Urban
and Environmental and Social Management Plan Flood Control Program
Proposed HCMC Flood Risk Management Project Date Submitted: December 2, 2015
199
1 An Lac
ward
m² 3,459 951 1,999 - - - 1,119 7,528
household 25 3 5 - - - 3 36
2
Binh
Hung
Hoa
ward
m² 144 - - - - - - 144
household(1) 1 - - - - - - 1
3
Binh
Hung
Hoa B
ward
m² - 196 - - - - - 196
household(1) - 1 - - - - - 1
IV
Tan
Binh
district
m² 5,276 157 - - - - 219 5,652
household 118 5 - - - - 6 129
1 Ward 15
m² 5,276 157 - - - - 219 5,652
household 118 5 - - - - 6 129
Total
m² 24,205 84,388 18,094 - 9,457 18,645 23,801 159,945
household 481 143 14 - 2 - 27 759
Potential negative consequences resulting from land acquisition include:
- Loss of sense of place due to physical displacement: Displaced households may find it hard
to get adapted to the new neighborhood and potential conflicts with the new neighbors might
occur. They may also need to find new schools for their children and travel longer distances to
workplace;
- Unemployment risks: In 2013, a survey conducted by Ho Chi Minh City Institute for
Development Studies on livelihood of people who had been displaced to new areas for
construction of new infrastructure projects showed that only 57.1% of people in the working
age found a new job when they moved to the new place. They also encountered many
challenges in their new places. This led to the situation in which thousands of apartments for
resettlement were abandoned while people had to make both end meets for jobs and
accommodation. The development of alternative livelihood strategies should be the preferred
mitigation measure, maximizing all possibilities for involvement in employment.
Results of the Social Economic Study (SES) conducted by the RAP consultant team shows that
most households live in poor sanitary conditions and are subject to high risk of flooding. The
SES survey also showed that some affected households who do not have legal document to be
able to receive full compensation for land acquisition are largely households living on
encroached land and catchment area. They are not eligible to be granted a land use right

Environmental and Social Impact Assessment, HCMC Steering Center of the Urban
and Environmental and Social Management Plan Flood Control Program
Proposed HCMC Flood Risk Management Project Date Submitted: December 2, 2015
200
certificate. Many of these households have income generated from activities on the affected land.
The survey results also show that a great part of the affected population (34%) is doing some
business activities, largely house or rooms for rent. 29% of the affected population due to land
acquisition in the working age are unemployed or casual laborers.Of the 717 households affected
by land acquisition, 60 households have over 20% of their productive land s impacted. The SES
result show that in most cases, income loss per person ranges from 5 million VND to 80 million
VND per month (data provided by the RAP consultant team).
6.4.2. Impacts other than those caused by land acquisition
Impacts other than those caused by land acquisition include the followings:
- Influx of temporary workers
- Increase in traffic and safety hazards
- Impacts on agriculture
- Construction safety hazards
Influx of temporary workers
Based on the rough estimate of construction workers required for the project, it is anticipated that
there will be a buildup of migrant construction workforce in the project area. These new residents
may create a strain on community infrastructure, as well as creating social stresses due to
changing patterns of social interaction. The local communities may have difficulties in
responding to the increased demands on school, health facilities, housing and other social
services. Further stresses may be created by resentments between newcomers and long-time
residents.
However, the influx of temporary workers during the construction phase of the project may
create more demand for local services such as food and accommodation, thus creating more
opportunities for local business arising from spending power of construction workers.
As this impact creates both negative and positive consequences, the nature of this impact type is
considered to be neutral. The magnitude of impact is medium, given the influx of workers is
temporary. The vulnerability of household is medium and the impact significance is therefore
Moderate.
Increase in traffic and safety hazards
Construction activities will lead to a significant increase in vehicular traffic. The project location
stretches across 9 districts which are inhabited by a large population. During the construction
phase, trucks constantly transporting construction materials in and out of the construction sites
must go through roads in residential areas. The risks of accidents between construction vehicles
and other vehicles are quite high. Increased traffic will also lead to the creation of dust and noise.
Environmental and Social Impact Assessment, HCMC Steering Center of the Urban
and Environmental and Social Management Plan Flood Control Program
Proposed HCMC Flood Risk Management Project Date Submitted: December 2, 2015
201
Furthermore, the renovation of the roads along the Tham Luong canal, to some extent, will affect
traffic in the area. Although the roads under renovation are not the main route with low traffic
density, the prolonged construction process will present as traffic obstacles to local people,
affecting their daily travel and their access to some social services
The construction phase will also impede inland waterway transport in river sections under
construction. In addition, as the construction process takes long time, the project owners should
have arrange reasonable construction time to minimize negative impacts on waterway transport.
The nature of this impact is negative, the magnitude of impact is medium, the vulnerability is
medium and the impact significance is moderate.
Impacts on agriculture
During the construction phase, the water in the canal will be cut-off, causing water depletion.
This will affect agricultural activities along the sub-catchment area. Agricultural land accounts
for 30% (5,200 ha) of the project total area. Nevertheless, the proportion of households with
incomes from agriculture in the project area is very low, accounting for only 0.51% in Go Vap
District and 1.30% in District 12. Therefore the project construction will have negligible impact
on agricultural activities.
The nature of this impact is negative, the magnitude of impact is negligible, the vulnerability is
low and the impact significance is minor.
Construction safety hazards
Occupational accidents may occur due to negligence or non-compliance with operation
regulations. The probability of occurrence depends on how strictly workers follow regulations
and safety rules. The level of impact ranged from personal injury to casualty. The causes of
occupational accidents are:
Overwork causing dizziness, fatigue and faint;
During the rainy days, the possibility of occupational accidents may increase due to
landslides, slippery ground, and electrical issues;
High piles of construction materials can endanger workers in case of spilling.
Problems that may occur during construction include:
Electrical problems during the construction of power lines and electricity use during the
construction project;
Fire accidents that might result from the use of combustible materials and from temporary
houses of workers inside the construction site.
Creation of haven for homeless people and possibility of social evils when the construction
is finished

Environmental and Social Impact Assessment, HCMC Steering Center of the Urban
and Environmental and Social Management Plan Flood Control Program
Proposed HCMC Flood Risk Management Project Date Submitted: December 2, 2015
202
Experiences from Tan Hoa – Lo Gom, Tau Hu – Ben Nghe and Nhieu Loc - Thi Nghe indicate
that the parks along the new restored canals can become a haven for homeless people and drug
addicts which will possibly lead to the occurrence of many social evils and threaten local social
security.
The nature of this impact is negative, the type of impact is indirect, the extent is local, and the
magnitude of impact is moderate. The impact significance is moderate. Mitigation measures will
be proposed in the next part.
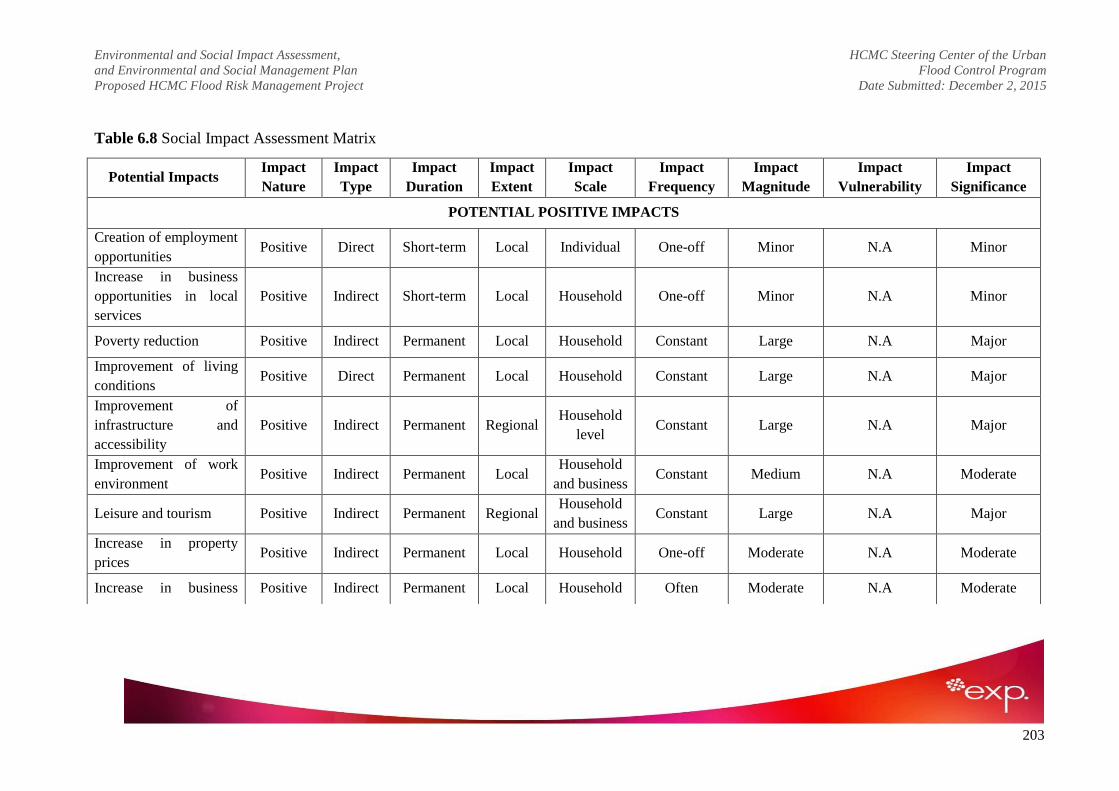
Environmental and Social Impact Assessment, HCMC Steering Center of the Urban
and Environmental and Social Management Plan Flood Control Program
Proposed HCMC Flood Risk Management Project Date Submitted: December 2, 2015
203
Table 6.8 Social Impact Assessment Matrix
Potential Impacts Impact
Nature
Impact
Type
Impact
Duration
Impact
Extent
Impact
Scale
Impact
Frequency
Impact
Magnitude
Impact
Vulnerability
Impact
Significance
POTENTIAL POSITIVE IMPACTS
Creation of employment
opportunities Positive Direct Short-term Local Individual One-off Minor N.A Minor
Increase in business
opportunities in local
services
Positive Indirect Short-term Local Household One-off Minor N.A Minor
Poverty reduction Positive Indirect Permanent Local Household Constant Large N.A Major
Improvement of living
conditions Positive Direct Permanent Local Household Constant Large N.A Major
Improvement of
infrastructure and
accessibility
Positive Indirect Permanent Regional Household
level Constant Large N.A Major
Improvement of work
environment Positive Indirect Permanent Local
Household
and business Constant Medium N.A Moderate
Leisure and tourism Positive Indirect Permanent Regional Household
and business Constant Large N.A Major
Increase in property
prices Positive Indirect Permanent Local Household One-off Moderate N.A Moderate
Increase in business Positive Indirect Permanent Local Household Often Moderate N.A Moderate

Environmental and Social Impact Assessment, HCMC Steering Center of the Urban
and Environmental and Social Management Plan Flood Control Program
Proposed HCMC Flood Risk Management Project Date Submitted: December 2, 2015
204
opportunities
POTENTIAL NEGATIVE IMPACTS
Physical
displacement of
households
along the sub-
catchment area
Negative Direct Permanent Local Household One-off Medium High Major
Influx of temporary
workers Neutral Direct Short-term Local Household One-off Medium Medium Moderate
Increase in traffic and
safety hazards Negative Direct Short-term Local Individual One-off Medium Medium Moderate
Impacts on agriculture Negative Indirect Short-term Local Household One-off Negligible Low Minor
Creation of haven for
homeless people and
possibility of social
evils
Negative Indirect Medium-
term Local Individual Often Moderate Medium Moderate

Environmental and Social Impact Assessment, HCMC Steering Center of the Urban
and Environmental and Social Management Plan Flood Control Program
Proposed HCMC Flood Risk Management Project Date Submitted: December 2, 2015
205
6.5. Residual impacts
For the purposes of this assessment, residual impacts are those that remain significant following
the application of mitigation measures.
The majority of impacts identified during the impact assessment can be reduced to low
significance following the implementation of mitigation measures. However, impacts of physical
displacement remain of moderate significance, even with mitigation, due to their permanent
nature. As such, monitoring and management measures should extend throughout the life of the
project in order to ensure that the quality of life of displaced persons is equal to or better than
prior to displacement.
6.6. Recommended mitigation and enhancement measures
This section identifies the mitigation measures for the anticipated negative impacts as well as
enhancement measures for positive impacts where these are likely to occur. Each of these
measures (to be implemented either at the pre-construction, construction or operational stage) are
listed and then cost as appropriate in Section 7 of this report (the Environmental and Social
Management Plan) and responsibilities for their implementation assigned.
6.6.1. Mitigation measures for negative impacts
Physical displacement of households along the sub-catchment area
The objective of the mitigation measure for physical displacement is to ensure that the quality of
life of displaced households is equal to or better than prior to displacement. The physical
displacement of households will require a Resettlement Action Plan (RAP) (please see Annex 6
for a summary of the RAP) . The plan include compensation for structures and loss of assets and
support with moving to a new location and establishing a new home.
Alternative livelihood strategies developed as a mitigation measure to maximize all possibilities
for involvement in employment opportunities are available. The establishment of appropriate
training and skills development at an early stage will allow displaced people to benefit from
employment opportunities in their new places, especially displaced people who are occasional
workers. Poor and near-poor households in the displaced group should be provided with
information about NGOs and organizations supporting poor people such as the Capital Aid Fund
for Employment of the Poor (CEP) which is a non-profit Vietnamese microfinance institution
that provides microfinance services to the poor and poorest, enabling them to begin and develop
small businesses.
A Income Restoration Plan (IRP) should be developed to ensure households are not left worse
off following displacement. Furthermore, it is necessary to establish a grievance mechanism
prior to project implementation to facilitate the resolution of affected community concerns and
grievances, ensuring ongoing interaction with the community in order to build trust and maintain
relationships throughout the life of the project.

Environmental and Social Impact Assessment, HCMC Steering Center of the Urban
and Environmental and Social Management Plan Flood Control Program
Proposed HCMC Flood Risk Management Project Date Submitted: December 2, 2015
206
Influx of temporary workers
The objective of the mitigation measure for influx of temporary workers is to reduce population
influx, minimize the possibility of conflicts between workers and the local community and
preserve social security in the area.
To minimize the strain on community infrastructure and social stresses due to changing patterns
of social interaction, positions for unskilled workers should preferably be employed from the
local population to minimize population influx. Furthermore, a dispute prevention and
management plan should be developed with an aim to manage conflict and bring about positive
change through conflict resolution processes. This will be assisted by ongoing community
engagement and stakeholder involvement throughout the process. In addition, the contracts for
civil works should include legal covenant requiring priority to be given to local residents for
project employment.
Increase in traffic and safety hazards
The objective of the mitigation measure for traffic and safety hazards is to maintain the health
and safety of local population.
A detailed health and safety plan must be developed to mitigate construction risks of the
proposed project on the surrounding communities. This plan must take into consideration of the
following:
- Increased risk of traffic through built-up areas;
- The risk that increased traffic volumes will pose to people;
- Appropriate construction arrangement to minimize influences on inland waterway transport
To minimize the risks of traffic congestion and accidents, it is recommended that the Investor
will adopt a number of measures as follows:
- Periodic inspection and maintenance of vehicles; in the event of dangerous incidents during
the construction process, investor should not allow the use of these vehicles on the roads until
the problem has been resolved;
- Drivers of construction vehicles must be selected carefully, especially in terms of experience,
age and level of understanding of traffic rules;
- Drivers who fail to follow traffic rules will receive fines as regulated by law. In addition the
Contractor will adopt disciplinary measures such as pay cut or redundancy.
- Assignment of responsibilities in the implementation of measures to strictly control inland
waterway transport;
- Limit overloaded shipping boats;
- Place traffic signs on the route;

Environmental and Social Impact Assessment, HCMC Steering Center of the Urban
and Environmental and Social Management Plan Flood Control Program
Proposed HCMC Flood Risk Management Project Date Submitted: December 2, 2015
207
- Promote the use of lifeboats to minimize damage in the event of emergency and accidents;
- Limit traffic flow during rush hours.
In the event of traffic congestion and accidents within the project construction area, Investor
should timely report the issue to relevant authorities.
Impacts on agriculture
Although the impact significance is minor, the affected households with main income from
agricultural activities should be engaged in the development of alternative livelihood strategies.
Creation of haven for homeless people and possibility of social evils
This is an indirect induced impact and not easy to evaluate as homeless people can come from
other areas in the city. The objective of the mitigation measure is to minimize the disturbance
and threats that homeless people and drug addicts pose to the local people. It is important that
there is enough security staff in the public parks along the canal area during day and night time
to maintain security and prevent crime. Surveillance cameras should also be installed in public
places to timely protect against property theft and prevent crime.
6.6.2. Enhancement measures for some positive impacts
Creation of employment opportunities in construction phase
The objective of the enhancement measure for this impact is local population are offered
employment opportunities where possible.
It is recommended that a "local labour" desk at the contractor offices should be established to
identify a local labour pool. Information about recruitment of employers and workers for the
project should be spread widely to local people.
Skill development programs should be implemented to ensure support for local population in
obtaining employment opportunities.
Increase in business opportunities in operation phase
The objective of the enhancement measure for this impact is to minimize pollution to the canals
resulting from the local food and beverage businesses.
It is the responsibility of the local authority and relevant units to regularly check whether
restaurants and cafes allocate enough trash bins to dispose of wastes when customers need and
whether there is enough toilets for customers. Restaurants and shops that perform well in doing
this should be given some economic incentive.
Leisure and tourism
The objective of enhancement measures of this impact is to maximize its potential as a leisure
place and for tourism development.

Environmental and Social Impact Assessment, HCMC Steering Center of the Urban
and Environmental and Social Management Plan Flood Control Program
Proposed HCMC Flood Risk Management Project Date Submitted: December 2, 2015
208
The public areas along the sub-catchment area will become ideal places for public gathering and
recreational activities. However, littering along the restored canals has become an issue in Nhieu
Loc - Thi Nghe, Tan Hoa - Lo Gom and Tau Hu - Ben Nghe. It is forecast that Tham Luong -
Ben Cat - Nuoc Len sub-catchment area would face the same problem when the construction is
finished. A real green, clean and beautiful Tham Luong - Ben Cat canal requires strong
cooperation between the local authority and local communities in protecting the canal from
untreated wastes.
Local government can work with the retired and the elderly who have a reputation in the
community to discourage people in the area from throwing garbage into the canal. Besides,
placing additional trash bins and warning signs is another effective way to reduce throwing
wastes down into the canal. The trash cans must always be kept clean and convenient for people
to dispose of waste. People who fail to follow regulations should receive a fine.

Environmental and Social Impact Assessment, HCMC Steering Center of the Urban
and Environmental and Social Management Plan Flood Control Program
Proposed HCMC Flood Risk Management Project Date Submitted: December 2, 2015
209
CHAPTER 7: ENVIRONMENTAL AND SOCIAL MANAGEMENT PLAN (ESMP)
Based on the assessment of the potential negative impacts discussed and the mitigation measures
proposed in Chapter 5, this chapter presents the Environmental Management Plan (EMP) for the
The project of ―Priority Flood Risk Reduction Investments in Tham Luong – Ben Cat –Nuoc Len
(TLBCNL) sub-catchment” The EMP identifies actions to be carried out under the subproject to
reduce and/or avoid impacts including the environmental monitoring program and the
implementation arrangements, taken into account the need to comply with the Government‘s EIA
regulations and the World Bank Group (WBG)‘s safeguard policies, including those of the World
Bank Group‘s Environmental, Health, and Safety Guidelines.
A. Environmental management plan for component
7.1. Basic principles
As a part of the EIA, an Environmental Management Plan (EMP) is a safeguards instrument that
is typically used in many projects and which consists of information on and guidance for the
process of mitigating and managing adverse environmental impacts throughout project
implementation. Typically in Vietnam, an EMP comprises a list of typical mitigation measures
to be carried out by contractors, an environmental monitoring program, organization
arrangements, and an estimated monitoring cost.
There is a comprehensive regulatory framework in Vietnam related to EIA preparation,
environmental standards, protection and management of forest and cultural property, and other
aspects related to construction and operation of facilities and infrastructures in Vietnam. This
EMP in consistent with these regulations.
To facilitate effective implementation of the EMP, the PMU will: (a) Establish an Environment
and Social Unit (ESU) responsible for ensuring timely implementation of the EMP, including
monitoring, reporting, and capacity building related to safeguards; (b) Assign the Construction
Supervision Consultant (CSC) to also be responsible for supervision of the contractor‘s safeguard
performance as part of the construction contract and this requirement will be included in the CSC‘s
terms of reference; and (c) Hire qualified national consultants as the Independent Environmental
Monitoring Consultant (IEMC) to assist the ESU in performing its task.
URENCO, and the Department of Transport will be responsible for implementation of the
mitigation measures during the operation stage of the project and they will ensure that the
mitigation measures are implemented and adequate budget is provided. The HCMC People
Committee (PSC) chaired by the Chairman or Vice Chairman will provide the overall policy
guidance and oversight of the project implementation. Roles and responsibilities of the specialized
agencies and the Departments of Planning and Investment and Natural Resources and Environment
(DONRE) will also be critical.

Environmental and Social Impact Assessment, HCMC Steering Center of the Urban
and Environmental and Social Management Plan Flood Control Program
Proposed HCMC Flood Risk Management Project Date Submitted: December 2, 2015
210
In terms of laying out the mitigation measures of the EMP, there are two fundamental parts to this
EMP. Firstly, the City has developed and will use Urban Construction Environmental Codes of
Practice (ECOPs). These ECOPs outline typical generic low-level impacts that can be expected to
occur in a wide range of construction activities of the project. They include mitigation measures for
these impacts and a process for including them in the construction contracts of contractors. During
the detailed design of technical specifications for each contract, the technical design consultant will
incorporate into the contract the parts of the ECOPs specific to that contract, as well as the specific
measures identified in the EMP.
Secondly, all site-specific impacts that are either not covered in the general ECOPs or which are of
an order of magnitude that require mitigation measures not covered in the ECOPs, are described in
more detail in the EMP. The mitigation measures are derived from the more detailed analysis of
Chapter 5.
Activities to be carried out to mitigate impacts due to land acquisition and resettlement are
presented separately (RAP and RPF) and they will be carried out and monitored separately.
7.2. Key mitigation measures for component 2
7.2.1. Urban Construction Environmental Codes of Practice (ECOPs) for Project
Component 2
Types of impacts covered in this document are:
Dust generation;
Air pollution;
Impacts from noise and vibration;
Water pollution;
Drainage and sedimentation control;
Management of stockpiles, quarries, and borrow pits;
Solid waste management;
Management of dredged materials;
Disruption of vegetative covers and ecological resources;
Traffic management;
Interruption of utility services;
Restoration of affected areas;
Worker and public safety;
Communication with local communities.

Environmental and Social Impact Assessment, HCMC Steering Center of the Urban
and Environmental and Social Management Plan Flood Control Program
Proposed HCMC Flood Risk Management Project Date Submitted: December 2, 2015
211
Table 7.1 Mitigation Measures Extracted From the Urban Works ECOPs applicable for Project Component 2
Environmental –
Social issues Mitigation measure
Vietnam
code/regulation
1. Dust generation The Contractor is responsible for compliance with relevant Vietnamese legislation with respect to
ambient air quality.
The Contractor shall ensure that the generation of dust is minimized and is not perceived as a nuisance
by local residents and shall implement a dust control plan to maintain a safe working environment and
minimize disturbances for surrounding residential areas/dwellings.
The Contractor shall implement dust suppression measures (e.g. use water spraying vehicles to water
roads, covering of material stockpiles, etc.) as required.
Contractual provisions to be included with all material suppliers (e.g. quarries and haulage contractors)
to ensure that the above management measures are implemented throughout the supply chain.
Control speed limit of the trucks and other vehicles not to exceed than 10 km/h within the Project
boundary;
Coordination of the construction schedule to minimize dust emissions during peak times of the
construction phase throughout utilizing knowledge of meteorological conditions e.g. rainfall periods
and prevailing wind patterns
Material loads shall be suitably covered and secured during transportation to prevent the scattering of
soil, sand, materials, or dust.
Exposed soil and material stockpiles shall be protected against wind erosion and the location of
stockpiles shall take into consideration the prevailing wind directions and locations of sensitive
receptors.
Dust masks should be used by workers where dust levels are excessive
Develop and use of the grievance mechanism to record complains from affected stakeholders such that
nuisance dust impacts can be identified and rectification measures implemented.
QCVN 05:
2009/BTNMT:
National technical
regulation on
ambient air quality

Environmental and Social Impact Assessment, HCMC Steering Center of the Urban
and Environmental and Social Management Plan Flood Control Program
Proposed HCMC Flood Risk Management Project Date Submitted: December 2, 2015
212
Environmental –
Social issues Mitigation measure
Vietnam
code/regulation
2. Air pollution All vehicles must comply with Vietnamese regulations controlling allowable emission limits of exhaust
gases.
Vehicles in Vietnam must undergo a regular emissions check and get certified named: ―Certificate of
conformity from inspection of quality, technical safety and environmental protection” following
Decision No. 35/2005/QD-BGTVT;
There should be no burning of waste or construction materials (eg. Bitumen, etc.) on site.
Install wheel washing facilities at appropriate positions from the site entrance
Use low sulfur fuels for machinery and vehicle;
Undertake scheduled maintenance to reduce fuel use and poor air quality.
TCVN 6438-2005:
Road vehicles.
Maximum permitted
emission limits of
exhaust gas.
No. 35/2005/QD-
BGTVT on
inspection of quality,
technical safety and
environmental
protection;
QCVN
05:2009/BTNMT:
National technical
regulation on
ambient air quality
3. Impacts from
noise and
vibration
The contractor is responsible for compliance with the relevant Vietnamese legislation with respect to
noise and vibration.
All vehicles must have appropriate ―Certificate of conformity from inspection of quality, technical
safety and environmental protection” following Decision No. 35/2005/QD-BGTVT; to avoid
exceeding noise emission from poorly maintained machines.
When needed, measures to reduce noise to acceptable levels must be implemented and could include
silencers, mufflers, acoustically dampened panels or placement of noisy machines in acoustically
QCVN
26:2010/BTNMT:
National technical
regulation on noise
QCVN
27:2010/BTNMT:
National technical

Environmental and Social Impact Assessment, HCMC Steering Center of the Urban
and Environmental and Social Management Plan Flood Control Program
Proposed HCMC Flood Risk Management Project Date Submitted: December 2, 2015
213
Environmental –
Social issues Mitigation measure
Vietnam
code/regulation
protected areas.
Avoiding or minimizing transportation though community areas and avoiding as well as material
processing areas (such as cement mixing).
regulation on
vibration
4. Water pollution The Contractor must be responsible for compliance with the relevant Vietnamese legislation relevant to
wastewater discharges into watercourses.
Portable or constructed toilets must be provided on site for construction workers. Wastewater from
toilets as well as kitchens, showers, sinks, etc. shall be discharged into a conservancy tank for removal
from the site or discharged into municipal sewerage systems; there should be no direct discharges to
any water body.
Wastewater over standards set by relevant Vietnam technical standards/regulations must be collected in
a conservancy tank and removed from site by licensed waste collectors.
Make appropriate arrangements for collecting, diverting or intercepting wastewater from households to
ensure minimal discharge or local clogging and flooding.
Before construction, all necessary wastewater disposal permits/licenses and/or wastewater disposal
contract have been obtained.
At completion of construction works, wastewater collection tanks and septic tanks shall be safely
disposed or effectively sealed off.
QCVN
09:2008/BTNMT:
National Technical
Standard on
underground water
Quality
QCVN
14:2008/BTNMT:
National technical
regulation on
domestic
wastewater;
QCVN 24:
2009/BTNMT:
National technical
regulation on
industrial
wastewater;
TCVN 7222: 2002:
General

Environmental and Social Impact Assessment, HCMC Steering Center of the Urban
and Environmental and Social Management Plan Flood Control Program
Proposed HCMC Flood Risk Management Project Date Submitted: December 2, 2015
214
Environmental –
Social issues Mitigation measure
Vietnam
code/regulation
requirements on
centralized
wastewater
treatment plant;
5. Drainage and
sedimentation
control
The Contractor shall follow the detailed drainage design included in the construction plans, intended to
prevent storm water from causing local flooding or scouring slopes and areas of unprotected soil
resulting in heavy sediment loads affecting local watercourses.
Ensure drainage system is always maintained cleared of mud and other obstructions.
Areas of the site not disturbed by construction activities shall be maintained in their existing
conditions.
Earthworks, cuts, and fill slopes shall be properly maintained, in accordance with the construction
specifications, including measures such as installation of drains, use of plant cover.
To avoid sediment-laded runoff that could adversely impact watercourses, install sediment control
structures where needed to slow or redirect runoff and trap sediment until vegetation is established.
Sediment control structures could include windrows of logging slash, rock berms, sediment catchment
basins, straw bales, storm drain inlet protection systems, or brush fences.
Site de-watering and water diversions: In the case that construction activities require that work be
carried out within the watercourse (e.g. culvert or bridge crossing construction, retaining wall
construction, erosion protection works), the work area must be dewatered to provide for construction in
dry conditions. The sediment laden water pumped from the work area must be discharged to an
appropriate sediment control measure for treatment before re-release to the stream.
Use techniques such as berming or diversion during construction to limit the exposure of disturbed
sediments to moving water
TCVN 4447:1987:
Earth works-Codes
for construction
Decree No.
22/2010/TT-BXD on
regulation of
construction safety
QCVN
08:2008/BTNMT –
National technical
regulation on quality
of surface water

Environmental and Social Impact Assessment, HCMC Steering Center of the Urban
and Environmental and Social Management Plan Flood Control Program
Proposed HCMC Flood Risk Management Project Date Submitted: December 2, 2015
215
Environmental –
Social issues Mitigation measure
Vietnam
code/regulation
Stream diversions or construction of cofferdams would require site-specific mitigation measures in the
EMP.
6. Management of
stockpiles,
quarries, and
borrow pits
Large-scale borrow pits or stockpiles will need site-specific measures that go beyond those in these
ECOPs.
All locations to be used must be previously identified in the approved construction specifications.
Sensitive sites such as scenic spots, areas of natural habitat, areas near sensitive receptors, or areas near
water should be avoided.
An open ditch shall be built around the stockpile site to intercept wastewater.
Stockpile topsoil when first opening a borrow pit and use it later to restore the area to near natural
conditions.
If needed, disposal sites shall include a retaining wall.
If the need for new sites arises during construction, they must be pre-approved by the Construction
Engineer.
If landowners are affected by use of their areas for stockpiles or borrow pits, they must be included in
the project resettlement plan.
If access roads are needed, they must have been considered in the environmental assessment.
7. Solid waste
management
Hazardous wastes are not covered by these ECOPs and would require specific mitigation measures.
Before construction, a solid waste control procedure (storage, provision of bins, site clean-up schedule,
bin clean-out schedule, etc.) must be prepared by Contractors and it must be carefully followed during
construction activities.
Before construction, all necessary waste disposal permits or licenses must be obtained.
Measures shall be taken to reduce the potential for litter and negligent behavior with regard to the
disposal of all refuse. At all places of work, the Contractor shall provide litter bins, containers and
Decree No.
59/2007/ND-CP on
solid waste
management
Decision No.
23/2006/QD-
BTNMT with list of

Environmental and Social Impact Assessment, HCMC Steering Center of the Urban
and Environmental and Social Management Plan Flood Control Program
Proposed HCMC Flood Risk Management Project Date Submitted: December 2, 2015
216
Environmental –
Social issues Mitigation measure
Vietnam
code/regulation
refuse collection facilities.
Solid waste may be temporarily stored on site in a designated area approved by the Construction
Supervision Consultant and relevant local authorities prior to collection and disposal through a licensed
waste collector, for example, URENCO.
Waste storage containers shall be covered, tip-proof, weatherproof and scavenger proof.
No burning, on-site burying or dumping of solid waste shall occur.
Recyclable materials such as wooden plates for trench works, steel, scaffolding material, site holding,
packaging material, etc shall be collected and separated on-site from other waste sources for reuse, for
use as fill, or for sale.
If not removed off site, solid waste or construction debris shall be disposed of only at sites identified
and approved by the Construction Supervision Consultant and included in the solid waste plan. Under
no circumstances shall the contractor dispose of any material in environmentally sensitive areas, such
as in areas of natural habitat or in watercourses.
Chemical waste of any kind shall be disposed of at an approved appropriate landfill site and in
accordance with local legislative requirements. The Contractor shall obtain needed disposal
certificates.
The removal of asbestos-containing materials or other toxic substances shall be performed and
disposed of by specially trained and certified workers.
Used oil and grease shall be removed from site and sold to an approved used oil recycling company.
Used oil, lubricants, cleaning materials, etc. from the maintenance of vehicles and machinery shall be
collected in holding tanks and removed from site by a specialized oil recycling company for disposal at
an approved hazardous waste site.
Used oil or oil-contaminated materials that could potentially contain PCBs shall be securely stored to
hazardous substance
Circular No.
12/2011/TT-
BTNMT on
management of
hazardous substance

Environmental and Social Impact Assessment, HCMC Steering Center of the Urban
and Environmental and Social Management Plan Flood Control Program
Proposed HCMC Flood Risk Management Project Date Submitted: December 2, 2015
217
Environmental –
Social issues Mitigation measure
Vietnam
code/regulation
avoid any leakage or affecting workers. The local DONRE must be contacted for further guidance.
8. Management of
dredged
materials
Large quantities of dredged materials, or materials that are contaminated would require mitigation
measures not covered in these ECOPs.
Dredging plan should be established including time schedule, method statement to meet the
requirements of traffic safety, public health and environmental sanitation. In order to ensure dredging
that is consistent with environmental regulations, key decision makers (local authority, DONRE, utility
company, CSC, etc.) must be involved and concur in each key decision point in the process leading to
preparation and implementation of a plan.
Characteristics of sediment should be determined by sampling and analysis if not already fully
evaluated during the EIA. Dredge material that is contaminated would require special mitigation
measures..
Ensure that dredged material management plans incorporate environmental considerations in the
identification of short-term and long-term disposal alternatives, consider methods to reduce dredging,
and maximize the beneficial use of dredged materials.
Lixiviate from dredged materials should not be allowed to enter watercourses without appropriate
filtering or treatment.
Collected dredged materials have to be processed, as per Vietnamese regulations on waste collection,
to ensure safe and environmentally secure transportation, storage, treatment and management.
Those involved in handling of dredged materials should be specialized and be certified.
Sanitary landfill site should meet technical requirements, based on level of potential contamination. In
the case of disposal at a dumpsite, a hazardous cell may need to be constructed if dredged material is
contaminated by heavy metals.
Decision No.
23/2006/QD-
BTNMT with list of
hazardous substance
Decree No.
59/2007/ND-CP on
solid waste
management
Circular No.
12/2011/TT-
BTNMT on
management of
hazardous substance

Environmental and Social Impact Assessment, HCMC Steering Center of the Urban
and Environmental and Social Management Plan Flood Control Program
Proposed HCMC Flood Risk Management Project Date Submitted: December 2, 2015
218
Environmental –
Social issues Mitigation measure
Vietnam
code/regulation
9. Traffic
management
Before construction, carry out consultations with local government and community and with traffic
police.
Significant increases in number of vehicle trips must be covered in a construction plan previously
approved. Routing, especially of heavy vehicles, needs to take into account sensitive sites such as
schools, hospitals, and markets.
Installation of lighting at night must be done if this is necessary to ensure safe traffic circulation.
Place signs around the construction areas to facilitate traffic movement, provide directions to various
components of the works, and provide safety advice and warning.
Employing safe traffic control measures, including road/rivers/canal signs and flag persons to warn of
dangerous conditions.
Avoid material transportation for construction during rush hour.
Passageways for pedestrians and vehicles within and outside construction areas should be segregated
and provide for easy, safe, and appropriate access. Signpost shall be installed appropriately in both
water-ways and roads where necessary.
Law on traffic and
transportation No.
23/2008/QH12
Law on construction
No. 16/2003/QH11
Decree No.
22/2010/TT-BXD on
regulation of
construction safety
10. Interruption of
utility services
Planned and unplanned interruptions to water, gas, power, internet services: the Contractor must
undertake prior consultation and contingency planning with local authorities about the consequences of
a particular service failure or disconnection.
Coordinate with relevant utility providers to establish appropriate construction schedules.
Provide information to affected households on working schedules as well as planned disruptions (at
least 5 days in advance).
Interruptions of water supply to agricultural areas must also be avoided.
The contractor should ensure alternative water supply to affected residents in the event of disruptions
lasting more than one day.
Decree No.
73/2010/ND-CP on
administrative
penalization security
and society isues

Environmental and Social Impact Assessment, HCMC Steering Center of the Urban
and Environmental and Social Management Plan Flood Control Program
Proposed HCMC Flood Risk Management Project Date Submitted: December 2, 2015
219
Environmental –
Social issues Mitigation measure
Vietnam
code/regulation
Any damages to existing utility systems of cable shall be reported to authorities and repaired as soon as
possible.
11. Restoration of
affected areas
Cleared areas such as borrow pits which are no longer in use, disposal areas, site facilities, workers‘
camps, stockpiles areas, working platforms and any areas temporarily occupied during construction of
the project works shall be restored using landscaping, adequate drainage and revegetation.
Start revegetation at the earliest opportunity. Appropriate local native species of vegetation shall be
selected for the planting and restoration of the natural landforms.
Spoil heaps and excavated slopes shall be re-profiled to stable batters, and grassed to prevent erosion;
All affected areas shall be landscaped and any necessary remedial works shall be undertaken without
delay, including green-spacing, roads, bridges and other existing works
Trees shall be planted at exposed land and on slopes to prevent or reduce land collapse and keep
stability of slopes
Soil contaminated with chemicals or hazardous substances shall be removed and transported and buried
in waste disposal areas.
Restore all damaged road and bridges caused by project activities
Law on
Environment
protection No.
52/2005/QH11
12. Worker and
public Safety
Contractor shall comply with all Vietnamese regulations regarding worker safety.
Prepare and implement action plan to cope with risk and emergency
Preparation of emergency aid service at construction site
Training workers on occupational safety regulations
If blasting is to be used, additional mitigation measures and safety precautions must be outlined in the
EMP.
Ensure that ear pieces are provided to and used by workers who must use noisy machines such as
piling, explosion, mixing, etc., for noise control and workers protection.
Decree No.
22/2010/TT-BXD on
regulation of
construction safety
Instruction No. 02
/2008/CT-BXD on
safety and sanitation
issues in

Environmental and Social Impact Assessment, HCMC Steering Center of the Urban
and Environmental and Social Management Plan Flood Control Program
Proposed HCMC Flood Risk Management Project Date Submitted: December 2, 2015
220
Environmental –
Social issues Mitigation measure
Vietnam
code/regulation
During demolition of existing infrastructure, workers and the general public must be protected from
falling debris by measures such as chutes, traffic control, and use of restricted access zones.
Install fences, barriers, dangerous warning/prohibition site around the construction area which showing
potential danger to public people
The contractor shall provide safety measures as installation of fences, barriers warning signs, lighting
system against traffic accidents as well as other risk to people and sensitive areas.
If previous assessments indicate there could be unexploded ordnance (UXO), clearance must be done
by qualified personnel and as per detailed plans approved by the Construction Engineer.
construction
agencies
TCVN 5308-91:
Technical regulation
on safety in
construction
Decision No.
96/2008/QD-TTg on
clearance of UXO.
13. Communication
with local
communities
Maintain open communications with the local government and concerned communities; the contractor
shall coordinate with local authorities (leaders of local wards or communes, leader of villages) for
agreed schedules of construction activities at areas nearby sensitive places or at sensitive times (e.g.,
religious festival days).
Copies in Vietnamese of these ECOPs and of other relevant environmental safeguard documents shall
be made available to local communities and to workers at the site.
Reduced playground space, loss of playing fields and car parking: The loss of amenities during the
construction process is often an unavoidable source of inconvenience to users in sensitive areas.
However, early consultation with those affected, provides the opportunity to investigate and implement
alternatives.
Disseminate project information to affected parties (for example local authority, enterprises and
affected households, etc) through community meetings before construction commencement;
Provide a community relations contact from whom interested parties can receive information on site
activities, project status and project implementation results;
Decree No.
73/2010/ND-CP on
administrative
penalization security
and society issues

Environmental and Social Impact Assessment, HCMC Steering Center of the Urban
and Environmental and Social Management Plan Flood Control Program
Proposed HCMC Flood Risk Management Project Date Submitted: December 2, 2015
221
Environmental –
Social issues Mitigation measure
Vietnam
code/regulation
Provide all information, especially technical findings, in a language that is understandable to the
general public and in a form of useful to interested citizens and elected officials through the preparation
of fact sheets and news release, when major findings become available during project phase;
Monitor community concerns and information requirements as the project progresses;
Respond to telephone inquiries and written correspondence in a timely and accurate manner;
Inform local residents about construction and work schedules, interruption of services, traffic detour
routes and provisional bus routes, blasting and demolition, as appropriate;
Provide technical documents and drawings to PC‘s community, especially a sketch of the construction
area and the EMP of the construction site;
Notification boards shall be erected at all construction sites providing information about the project, as
well as contact information about the site managers, environmental staff, health and safety staff,
telephone numbers and other contact information so that any affected people can have the channel to
voice their concerns and suggestions.

Environmental and Social Impact Assessment, HCMC Steering Center of the Urban
and Environmental and Social Management Plan Flood Control Program
Proposed HCMC Flood Risk Management Project Date Submitted: December 2, 2015
222
7.2.2. Site-specific Enviromental Impacts
Table 7.2 presents site-specific impacts and mitigation measures that are not fully addressed
through the application of ECOPs5. This may be because the impact is not a typical one and is
not included in the ECOPs, because the severity of the impact goes beyond the scope of the
mitigation measures in the ECOPs, or because simply of the very specific nature of the
mitigation measure that is needed.
Table 7.2 Site Specific Impacts and Mitigation Measures
SUB-COMPONENT 1: CONSTRUCTION OF NUOC LEN TIDAL SLUICE GATE AND 2 SHIP
LOCKS
Pre-Construction
Impact: Demolition of houses along the central road to be constructed in the site
Mitigation: Ensure demolition work is carried out safely, in accordance with contract conditions
Implementation
mechanisms:
Contract conditions, supplementing those of the ECOPs
Responsibility: Contractor
Fund source: IDA Credit
Monitoring: Supervision Consultant/PMU
Construction
Impacts Land clearance, including house, trees and other vegetation, undertaken
indiscriminately, without reference to construction site boundaries, UXO, blocking
the water flow of the Canal at construction site, contaminating surface water due to
waste discharge (i.e. oil spill, run-off storm water, domestic wastewater,
construction wastewater), marine traffic incidents (i.e. congestion, accident) at
construction site, noise and vibration from the extensive pile driving required for
constructing the tidal sluice gate and ship lock, dust and VOC (asphalt) emission
from road construction works
Mitigation: Clear the area before construction by qualified and licensed UXO clearance
experts;
Ensure that there is no land clearance outside defined construction site boundaries;
Ensure also that the contract requires the contractor, before he commences work, to
5 ECoPs will be suitable for investments under Component 1 (hydromet network expansion; monitoring stations
installation, etc.)

Environmental and Social Impact Assessment, HCMC Steering Center of the Urban
and Environmental and Social Management Plan Flood Control Program
Proposed HCMC Flood Risk Management Project Date Submitted: December 2, 2015
223
provides a construction plan that sets out how he will maintain the flow in the
channel and protect the works from flooding during construction;
Ensure the contract for the works requires the contractor to prepare a plan for
working at site to manage the waste generated from construction activities to
prevent the contamination of water at area surrounding the construction site, to
fully implement health and safety policy to prevent the any incidents affect to
workers onsite and surrounding community;
Assigning the flagman to control the marine traffic flow through the construction
site; and
Ensure that pile driving work is carried out only during daylight hours, on normal
working days.
Implementation
mechanisms:
Contract conditions, supplementing those of the ECOPs
Responsibility: Contractor
Fund source: IDA Credit
Monitoring: Supervision Consultant/PMU
Operation
Impacts Inadequate operation of tidal sluice gate affecting the tidal regimes of the Canal
that can result flooding to the catchment, especially during the rainy seasons, and
resulting traffic congestion/accidents to boat travel through the ship lock
Mitigation: Develop a scientific tidal sluice gate and ship locks operation that must be fully
implemented by operation employees to ensure a minimizing impacts of flooding
and controlling the traffic flow through the ship locks
Implementation
mechanisms:
Infrastructure Operations and Maintenance Plan
Responsibility: City
Fund source: IDA Credit
Monitoring: City
SUB-COMPONENT 2: CONSTRUCTION OF VAM THUAT TIDAL SLUICE GATE AND 2
SHIP LOCKS

Environmental and Social Impact Assessment, HCMC Steering Center of the Urban
and Environmental and Social Management Plan Flood Control Program
Proposed HCMC Flood Risk Management Project Date Submitted: December 2, 2015
224
Construction
Impacts Land clearance, including house, trees and other vegetation, undertaken
indiscriminately, without reference to construction site boundaries, UXO, blocking
the water flow of the Canal at construction site, contaminating surface water due to
waste discharge (i.e. oil spill, run-off storm water, domestic wastewater,
construction wastewater), marine traffic incidents (i.e. congestion, accident) at
construction site, noise and vibration from the extensive pile driving required for
constructing the tidal sluice gate and ship lock, dust and VOC (asphalt) emission
from road construction works
Mitigation: Clear the area before construction by qualified and licensed UXO clearance
experts;
Ensure that there is no land clearance outside defined construction site boundaries;
Ensure also that the contract requires the contractor, before he commences work, to
provides a construction plan that sets out how he will maintain the flow in the
channel and protect the works from flooding during construction;
Ensure the contract for the works requires the contractor to prepare a plan for
working at site to manage the waste generated from construction activities to
prevent the contamination of water at area surrounding the construction site, to
fully implement health and safety policy to prevent the any incidents affect to
workers onsite and surrounding community;
Assigning the flagman to control the marine traffic flow through the construction
site; and
Ensure that pile driving work is carried out only during daylight hours, on normal
working days.
Implementation
mechanisms:
Contract conditions, supplementing those of the ECOPs
Responsibility: Contractor
Fund source: IDA Credit
Monitoring: Supervision Consultant/PMU
Operation
Impacts Inadequate operation of tidal sluice gate affecting the tidal regimes of the Canal
that can result flooding to the catchment, especially during the rainy seasons, and
resulting traffic congestion/accidents to boat travel through the ship lock
Mitigation: Develop a scientific tidal sluice gate and ship locks operation that must be fully
implemented by operation employees to ensure a minimizing impacts of flooding

Environmental and Social Impact Assessment, HCMC Steering Center of the Urban
and Environmental and Social Management Plan Flood Control Program
Proposed HCMC Flood Risk Management Project Date Submitted: December 2, 2015
225
and controlling the traffic flow through the ship locks
Implementation
mechanisms:
Infrastructure Operations and Maintenance Plan
Responsibility: City
Fund source: City
Monitoring: City
SUB-COMPONENT 3: IMPROVEMENT/UPGRADING OF CANAL BANK REVETMENT IN
THE MAIN CANAL OF TLBCNL CANAL
Pre-Construction
Impact: Demolition of houses along the central road to be constructed in the site
Mitigation: Ensure demolition work is carried out safely, in accordance with contract conditions
Implementation
mechanisms:
Contract conditions, supplementing those of the ECOPs
Responsibility: Contractor
Fund source: IDA Credit
Monitoring: Supervision Consultant/PMU
Construction
Impacts For dredging sludge and upgrading the embankment of the Canal, key site-specific
impacts include risks due to UXO; odor and other contamination resulting from the
excavation, transport, and disposal of approximately 1,778,701.45 m3 of wet sludge
with a high organic; noise and vibration from the extensive pile driving required by
the design for the channel protection works.
For constructing the roads along the Canal, key site-specific impacts include risks due
to land clearance, including house, trees and other vegetation, undertaken
indiscriminately, without reference to construction site boundaries construction,
traffic causing danger within the construction site and also to residential and other
areas outside the site; vibration from construction equipment damaging buildings in
close proximity to the construction site; and dust and VOC (asphalt) emission from
road construction works.
Mitigation: To mitigate impacts of dredging sludge and upgrading the embankment of the Canal,

Environmental and Social Impact Assessment, HCMC Steering Center of the Urban
and Environmental and Social Management Plan Flood Control Program
Proposed HCMC Flood Risk Management Project Date Submitted: December 2, 2015
226
following measures will be carried out by the PMU:
Clear the area before construction by qualified and licensed UXO clearance
experts;
Ensure that the detailed design for the canal rehabilitation works explicitly
provides for all aspects of the sludge management process: excavation, transport
in leak proof and covered trucks, and deposit into suitably prepared sites (landfills
for material that testing shows is not contaminated beyond specified limits, and
prepared sanitary landfills – for example the existing site at Da Phuoc Landfill –
for material that is contaminated beyond specified limits);
In the case of dredged sludge transported to Da Phuoc Landill, the PMU needs to
ensure a legal commitment between Da Phuoc Landfill, HCMC DONRE and
PMU, whereby the Da Phuoc Landfill must ensure an availability of capacity for
disposing the dredged sludge and construction waste.
Ensure the contract for the works requires the contractor to prepare a plan for
working in the densely habituated section of the channel in particular, to include
how they will organize the works to minimize disruption to the traffic and
community lives in term of environmental issues such as noise, air emission,
wastewater and security;
Ensure also that the contract requires the contractor, before he commences work,
to provides a construction plan that sets out how he will maintain the flow in the
channel and protect the works from flooding during construction; and
Ensure that pile driving work is carried out only during daylight hours, on normal
working days.
To mitigate impacts of road construction of the Canal, following measures will be
carried out by the PMU:
Ensure that the contractor prepares and implements a site specific environmental
management plans (as required by the contract) for each aspect of the works – site
clearance, earthworks, temporary and permanent drainage, pavement works, and
traffic and site safety. Specifically, and addition to the general requirements set
out in the ECOPs:
o Ensure that there is no land clearance outside defined construction site
boundaries;
o Ensure that, from the commencement of construction, site drainage is a
priority activity, to include channels, silt traps, flow abatement structures,
etc.;
o Ensure that borrow areas are developed, operated, closed, and restored in the
same manner as earthworks sites for the project works, and that are subject
to the same EMP and other contractual requirements;
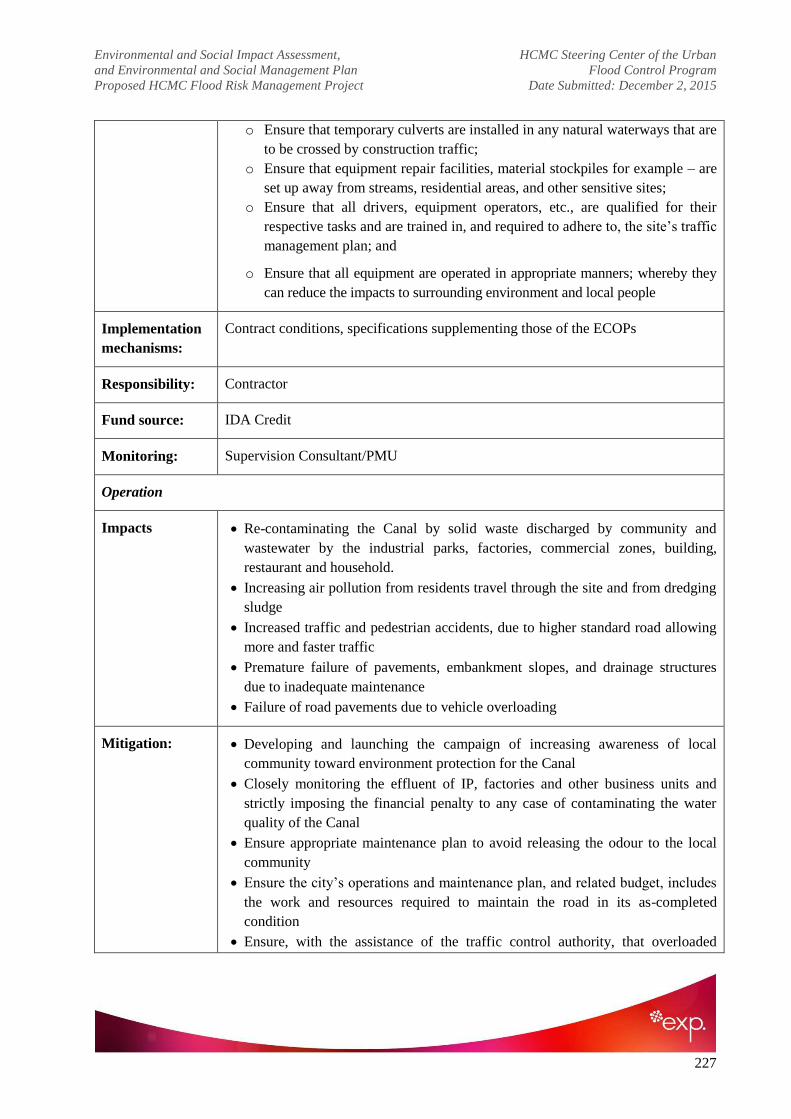
Environmental and Social Impact Assessment, HCMC Steering Center of the Urban
and Environmental and Social Management Plan Flood Control Program
Proposed HCMC Flood Risk Management Project Date Submitted: December 2, 2015
227
o Ensure that temporary culverts are installed in any natural waterways that are
to be crossed by construction traffic;
o Ensure that equipment repair facilities, material stockpiles for example – are
set up away from streams, residential areas, and other sensitive sites;
o Ensure that all drivers, equipment operators, etc., are qualified for their
respective tasks and are trained in, and required to adhere to, the site‘s traffic
management plan; and
o Ensure that all equipment are operated in appropriate manners; whereby they
can reduce the impacts to surrounding environment and local people
Implementation
mechanisms:
Contract conditions, specifications supplementing those of the ECOPs
Responsibility: Contractor
Fund source: IDA Credit
Monitoring: Supervision Consultant/PMU
Operation
Impacts Re-contaminating the Canal by solid waste discharged by community and
wastewater by the industrial parks, factories, commercial zones, building,
restaurant and household.
Increasing air pollution from residents travel through the site and from dredging
sludge
Increased traffic and pedestrian accidents, due to higher standard road allowing
more and faster traffic
Premature failure of pavements, embankment slopes, and drainage structures
due to inadequate maintenance
Failure of road pavements due to vehicle overloading
Mitigation: Developing and launching the campaign of increasing awareness of local
community toward environment protection for the Canal
Closely monitoring the effluent of IP, factories and other business units and
strictly imposing the financial penalty to any case of contaminating the water
quality of the Canal
Ensure appropriate maintenance plan to avoid releasing the odour to the local
community
Ensure the city‘s operations and maintenance plan, and related budget, includes
the work and resources required to maintain the road in its as-completed
condition
Ensure, with the assistance of the traffic control authority, that overloaded

Environmental and Social Impact Assessment, HCMC Steering Center of the Urban
and Environmental and Social Management Plan Flood Control Program
Proposed HCMC Flood Risk Management Project Date Submitted: December 2, 2015
228
vehicles do not use the road
Implementation
mechanisms:
City operations and maintenance plan
Responsibility: DONRE, CITENCO and City Road Maintenance Company
Fund source: IDA Credit
Monitoring: City
SUB-COMPONENT 4: CONSTRUCTION OF MAIN INTERCEPTOR IN GO VAP DISTRICT
Construction
Impacts Canal upgrading works referred to above, including UXO, noise and vibration from
the extensive pile driving required by the operation of tunnel boring machine, dust
and VOC (asphalt) emission from road construction works. However, there will be
impacts for traffic disruption and site safety issues where the interceptors need to
be taken across roads in deep trenches
Mitigation: Clear the area before construction by qualified and licensed UXO clearance
experts;
Ensure an appropriate traffic management plan that will be committed to
implement by the PMU and their subcontractors to minimize the traffic
congestion at and surrounding project site;
Ensure the contract for the works requires the contractor to prepare a plan for
working in the densely habituated section of sewage pipes in particular, to include
how they will organize the works to minimize disruption to the traffic and
community lives in term of environmental issues and social issues.
Ensure also that the contract requires the contractor, before he commences work,
to provide a construction plan that sets out how the contactor will organize and
maintain the EHS policy, schedule, workforces and facilities to complete the
work within the requirement of EMP for this project proposed in Chapter 7; and
Ensure that pile driving work is carried out only during daylight hours, on normal
working days.
Implementation
mechanisms:
Contract conditions, specifications supplementing those of the ECOPs
Responsibility: Contractor
Fund source: IDA Credit
Monitoring: Supervision Consultant/PMU

Environmental and Social Impact Assessment, HCMC Steering Center of the Urban
and Environmental and Social Management Plan Flood Control Program
Proposed HCMC Flood Risk Management Project Date Submitted: December 2, 2015
229
Operation
Impacts Releasing odor to ambient air from the maintenance of sewer system, flooding can
be happened due to the accumulation of sludge and solid waste in the sewage pipe
network.
Mitigation: Developing the scientific maintenance program for sewer system and ensuring
this program must be checked by related experts before entering implementation
Ensure the city‘s operations and maintenance plan, and related budget, includes
the work and resources required to maintain the sewer system
Implementation
mechanisms:
City operations and maintenance plan
Responsibility: City Road Maintenance Company
Fund source: IDA Credit
Monitoring: City
SUB-COMPONENT 5: CONSTRUCTION AND IMPROVEMENT OF PRIMARY AND
SECONDARY COMBINED SEWER SYSTEMS AND THE SECONDARY INTERCEPTOR IN
GO VAP DISTRICT
Construction
Impacts Canal upgrading works referred to above, including UXO, noise and vibration from
the extensive pile driving required by the operation of tunnel boring machine, dust
and VOC (asphalt) emission from road construction works. However, there will be
impacts for traffic disruption and site safety issues where the interceptors need to
be taken across roads in deep trenches
Mitigation: Clear the area before construction by qualified and licensed UXO clearance
experts;
Ensure an appropriate traffic management plan that will be committed to
implement by the PMU and their subcontractors to minimize the traffic
congestion at and surrounding project site;
Ensure the contract for the works requires the contractor to prepare a plan for
working in the densely habituated section of sewage pipes in particular, to include
how they will organize the works to minimize disruption to the traffic and
community lives in term of environmental issues and social issues.
Ensure also that the contract requires the contractor, before he commences work,
to provide a construction plan that sets out how the contactor will organize and
maintain the EHS policy, schedule, workforces and facilities to complete the
work within the requirement of EMP for this project proposed in Chapter 7; and
Ensure that pile driving work is carried out only during daylight hours, on normal

Environmental and Social Impact Assessment, HCMC Steering Center of the Urban
and Environmental and Social Management Plan Flood Control Program
Proposed HCMC Flood Risk Management Project Date Submitted: December 2, 2015
230
working days.
Implementation
mechanisms:
Contract conditions, specifications supplementing those of the ECOPs
Responsibility: Contractor
Fund source: IDA Credit
Monitoring: Supervision Consultant/PMU
Operation
Impacts Releasing odor to ambient air from the maintenance of sewer system, flooding can
be happened due to the accumulation of sludge and solid waste in the sewage pipe
network.
Mitigation: Developing the scientific maintenance program for sewer system and ensuring
this program must be checked by related experts before entering implementation
Ensure the city‘s operations and maintenance plan, and related budget, includes
the work and resources required to maintain the sewer system
Implementation
mechanisms:
City operations and maintenance plan
Responsibility: City Road Maintenance Company
Fund source: City
Monitoring: City
SUB-COMPONENT 6: IMPROVEMENT OF SECONDARY CANALS (HY VONG, CAU CUT,
BA MIENG, ONG TONG, ONG BAU, CHIN XIENG)
Pre-Construction
Impact: Demolition of houses along the central road to be constructed in the site
Mitigation: Ensure demolition work is carried out safely, in accordance with contract conditions
Implementation
mechanisms:
Contract conditions, supplementing those of the ECOPs
Responsibility: Contractor
Fund source: IDA Credit

Environmental and Social Impact Assessment, HCMC Steering Center of the Urban
and Environmental and Social Management Plan Flood Control Program
Proposed HCMC Flood Risk Management Project Date Submitted: December 2, 2015
231
Monitoring: Supervision Consultant/PMU
Construction
Impacts UXO; odor and other contamination resulting from the excavation, transport, and
disposal of wet sludge with a high organic
Mitigation: To mitigate impacts of dredging sludge and upgrading the embankment of the Canal,
following measures will be carried out by the PMU:
Clear the area before construction by qualified and licensed UXO clearance
experts;
Ensure that the detailed design for the canal rehabilitation works explicitly
provides for all aspects of the sludge management process: excavation, transport
in leak proof and covered trucks, and deposit into suitably prepared sites (landfills
for material that testing shows is not contaminated beyond specified limits, and
prepared sanitary landfills – for example the existing site at Da Phuoc Landfill –
for material that is contaminated beyond specified limits);
In the case of dredged sludge transported to Da Phuoc Landill, the PMU needs to
ensure a legal commitment between Da Phuoc Landfill, HCMC DONRE and
PMU, whereby the Da Phuoc Landfill must ensure an availability of capacity for
disposing the dredged sludge and construction waste.
Ensure the contract for the works requires the contractor to prepare a plan for
working in the densely habituated section of the channel in particular, to include
how they will organize the works to minimize disruption to the traffic and
community lives in term of environmental issues such as noise, air emission,
wastewater and security;
Ensure also that the contract requires the contractor, before he commences work,
to provides a construction plan that sets out how he will maintain the flow in the
channel and protect the works from flooding during construction; and
Ensure that pile driving work is carried out only during daylight hours, on normal
working days.
Implementation
mechanisms:
Contract conditions, specifications supplementing those of the ECOPs
Responsibility: Contractor
Fund source: IDA Credit
Monitoring: Supervision Consultant/PMU
Operation

Environmental and Social Impact Assessment, HCMC Steering Center of the Urban
and Environmental and Social Management Plan Flood Control Program
Proposed HCMC Flood Risk Management Project Date Submitted: December 2, 2015
232
Impacts Re-contaminating the Canal by solid waste discharged by community and
wastewater by the industrial parks, factories, commercial zones, building,
restaurant and household.
Increasing air pollution from residents travel through the site and from dredging
sludge
Mitigation: Developing and launching the campaign of increasing awareness of local
community toward environment protection for the Canal
Closely monitoring the effluent of IP, factories and other business units and
strictly imposing the financial penalty to any case of contaminating the water
quality of the Canal
Ensure appropriate maintenance plan to avoid releasing the odour to the local
community
Implementation
mechanisms:
City operations and maintenance plan
Responsibility: DONRE, CITENCO and City Road Maintenance Company
Fund source: IDA Credit
Monitoring: City
7.3. Key mitigation measures for component 1
As discussed elsewhere in this report, Component 1 impacts most especially during construction
are anticipated to be small-scale in nature, and of shorter lifespan for each installation sites
commensurate to the duration of the construction activities of each installations, and building
requirements. Although information on location as well as area requirements are not available at
this time, potential impacts can be predicted and these may include but not necessarily be limited
to involuntary resettlement; and temporary impacts to ambient air, noise, water quality, soil and
groundwater, waste, terrestrial ecology, and noise and vibration during its pre-construction,
construction and operational phases.
Most impacts are anticipated to be short-term and/or co-terminus with the construction activities.
Some impacts are unavoidable but could be properly managed together with stricter and closer
monitoring during construction by the PMU. During construction, occupational safety and health
shall be also given primordial consideration. This shall be in compliance with international
standards as well as the GoV‘ Occupational Safety and Health Standards. Following completion
of construction activities, some impacts will sustain because of the operational and maintenance
requirements of the project.
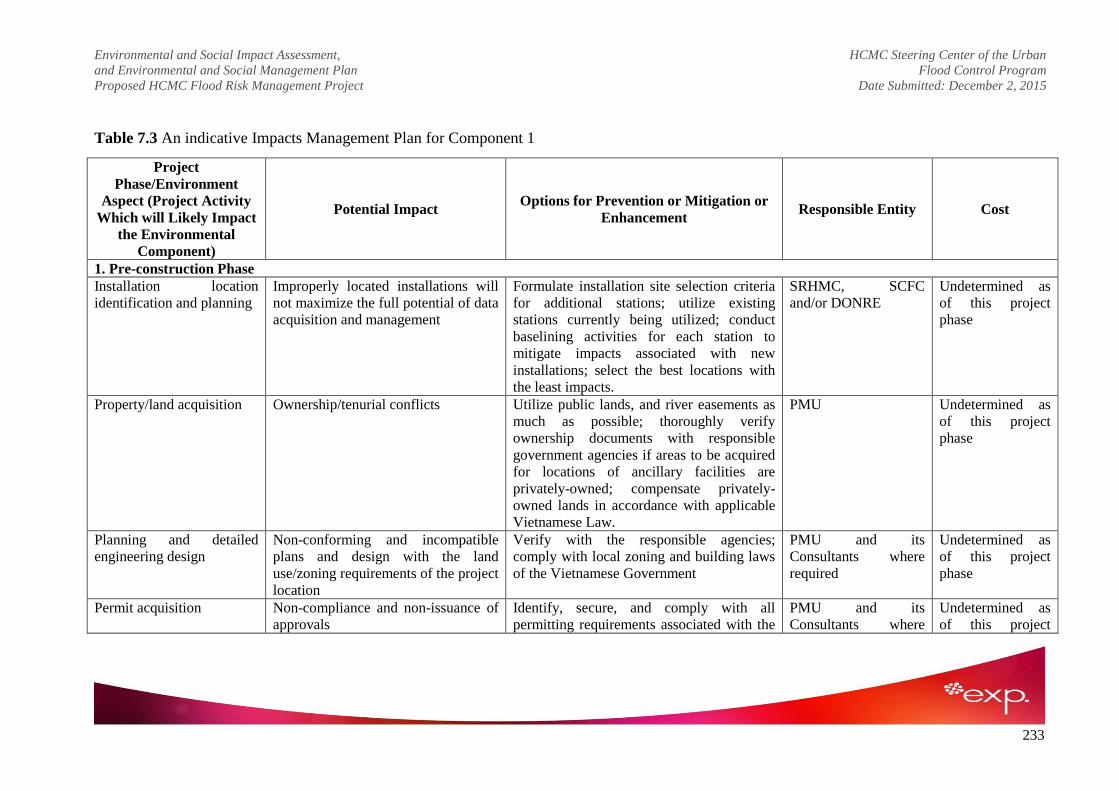
Environmental and Social Impact Assessment, HCMC Steering Center of the Urban
and Environmental and Social Management Plan Flood Control Program
Proposed HCMC Flood Risk Management Project Date Submitted: December 2, 2015
233
Table 7.3 An indicative Impacts Management Plan for Component 1
Project
Phase/Environment
Aspect (Project Activity
Which will Likely Impact
the Environmental
Component)
Potential Impact Options for Prevention or Mitigation or
Enhancement Responsible Entity Cost
1. Pre-construction Phase
Installation location
identification and planning
Improperly located installations will
not maximize the full potential of data
acquisition and management
Formulate installation site selection criteria
for additional stations; utilize existing
stations currently being utilized; conduct
baselining activities for each station to
mitigate impacts associated with new
installations; select the best locations with
the least impacts.
SRHMC, SCFC
and/or DONRE
Undetermined as
of this project
phase
Property/land acquisition Ownership/tenurial conflicts Utilize public lands, and river easements as
much as possible; thoroughly verify
ownership documents with responsible
government agencies if areas to be acquired
for locations of ancillary facilities are
privately-owned; compensate privately-
owned lands in accordance with applicable
Vietnamese Law.
PMU
Undetermined as
of this project
phase
Planning and detailed
engineering design
Non-conforming and incompatible
plans and design with the land
use/zoning requirements of the project
location
Verify with the responsible agencies;
comply with local zoning and building laws
of the Vietnamese Government
PMU and its
Consultants where
required
Undetermined as
of this project
phase
Permit acquisition Non-compliance and non-issuance of
approvals
Identify, secure, and comply with all
permitting requirements associated with the
PMU and its
Consultants where
Undetermined as
of this project

Environmental and Social Impact Assessment, HCMC Steering Center of the Urban
and Environmental and Social Management Plan Flood Control Program
Proposed HCMC Flood Risk Management Project Date Submitted: December 2, 2015
234
Project
Phase/Environment
Aspect (Project Activity
Which will Likely Impact
the Environmental
Component)
Potential Impact Options for Prevention or Mitigation or
Enhancement Responsible Entity Cost
project. required phase
Procurement and selection
of civil works Contractor(s)
Poor quality work or services that
might render the installations
inadequate in providing the required
data acquisition requirements.
Strict monitoring of Contractor(s)
performance and compliance with
established minimum performance standards
and specifications by SRHMC, SCFC
and/or DONRE‘
PMU and its
Consultants where
required
Undetermined as
of this project
phase
Civil works Contractor(s),
Mobilization
Non-observance of regulatory
requirements including those relating
to environmental management and
occupational safety and health.
Housing requirement for transient
workers and project management and
support staff
Elevated purchases of local goods and
services for the preparation of the
construction staging are and project
offices.
Provide a professional with experience in
the implementation of environmental,
occupational, health and safety
requirements.
Hire as many qualified locals within the
immediate vicinity of the installation sites or
those living within a reasonable commuting
distance; otherwise provide temporary
bunkhouses on-site or rent houses in
neighboring areas if housing requirements
cannot be accommodated in the project site.
Encourage patronage for local goods and
services; priority of hiring will be those that
will be economically-displaced; hire as
many qualified locals within the immediate
vicinity of the installation site or those
Civil Works
Contractor(s) and
Consultant as maybe
required
Contractor(s) and
Consultant
Undetermined as
of this project
phase

Environmental and Social Impact Assessment, HCMC Steering Center of the Urban
and Environmental and Social Management Plan Flood Control Program
Proposed HCMC Flood Risk Management Project Date Submitted: December 2, 2015
235
Project
Phase/Environment
Aspect (Project Activity
Which will Likely Impact
the Environmental
Component)
Potential Impact Options for Prevention or Mitigation or
Enhancement Responsible Entity Cost
Elevated air quality and noise level
during mobilization of Contractor(s)
equipment
living within a reasonable commuting
distance of the project site.
Use only properly maintained and third
party-inspected equipment; noise generating
equipment to be provided with noise
abatement attachments such as mufflers;
work area properly barricaded with high
walled fence; workers working with noise
generating equipment provided with ear
muffs.
Undetermined as
of this project
phase
2.0 Construction Phase
2.1 Site preparation and
removal of materials and
debris in each installation
site
Traffic build-up and congestion
during hauling operations
Formulate traffic management plan where
applicable; minimize the presence of parked
equipment that may disrupt traffic flow;
properly implement the traffic management
plan.
Contractor(s) and
Consultant
Incorporated in the
civil works
construction
budget
Removal of vegetation, structures and
other unnecessary obstructions;
modification of topography and soil
disturbance; non-compliance with
local zoning ordinances
Minimize vegetation loss; modification
following established design considerations;
compliance with local zoning ordinances Contractor(s) and
Consultant
Incorporated in the
civil works
construction
budget
Contribution of sedimentation to
adjacent waterways/outfalls/sewer or
Provide protection of stockpiles; minimize
stockpiling; keep stockpiles away from

Environmental and Social Impact Assessment, HCMC Steering Center of the Urban
and Environmental and Social Management Plan Flood Control Program
Proposed HCMC Flood Risk Management Project Date Submitted: December 2, 2015
236
Project
Phase/Environment
Aspect (Project Activity
Which will Likely Impact
the Environmental
Component)
Potential Impact Options for Prevention or Mitigation or
Enhancement Responsible Entity Cost
drainage lines adjacent waterways; immediately stabilize
excavated areas to minimize soil loss during
downpours
2.2 Relocation of affected
utilities (where maybe
applicable)
Disruption of services Coordinate with service providers; ensure
proper notification of affected areas through
the tri-media; restore services as quickly as
possible; schedule disruptions during non-
peak hours.
2.3 Equipment foundation
excavations/preparation
works
Dust generation and re-suspension
during dry construction days
Regular watering services during dry
periods; minimize/clean spillages on the
ground; minimize exposure of stockpiles to
wind by covering with appropriate
materials.
Construction activities shall follow the
detailed engineering design plans
Elevated concentration of air
pollutants related to traffic slow down
and congestion.
Elevated noise level due to the use of
machineries
Re-route vehicular traffic on less congested
roads; no prolonged parking for construction
vehicles in the road leading to the
installation sites.
Use only properly maintained and third
party-inspected equipment; noise generating
equipment to be provided with noise

Environmental and Social Impact Assessment, HCMC Steering Center of the Urban
and Environmental and Social Management Plan Flood Control Program
Proposed HCMC Flood Risk Management Project Date Submitted: December 2, 2015
237
Project
Phase/Environment
Aspect (Project Activity
Which will Likely Impact
the Environmental
Component)
Potential Impact Options for Prevention or Mitigation or
Enhancement Responsible Entity Cost
abatement attachments such as mufflers;
work area properly barricaded with high
walled fence; workers working with noise
generating equipment provided with ear
muffs.
Construction accidents Provide primary medical services at
construction site; arrange with the nearest
hospital for emergency and tertiary medical
services requirements; minimize by proper
training/safety orientation; providing safety
equipment observing traffic rules and
regulations; providing appropriate warning
signs, providing safety barriers to separate
pedestrian and vehicular traffic from
construction activities etc.
Contractor(s) and
Consultant
Incorporated in the
civil works
construction
budget
Local employment generation Hire as many locals especially those that
will be economically displaced by the
project due to resettlement.
2.4 Structural; mechanical;
electrical; ICT; and water,
sanitation,
telecommunications, and
fire protection works (in
facilities housing ICT
Construction accidents Provide primary medical services at
construction site; arrange with the nearest
hospital for emergency and tertiary medical
services requirements; minimize by proper
training/safety orientation; providing safety
equipment observing traffic rules and

Environmental and Social Impact Assessment, HCMC Steering Center of the Urban
and Environmental and Social Management Plan Flood Control Program
Proposed HCMC Flood Risk Management Project Date Submitted: December 2, 2015
238
Project
Phase/Environment
Aspect (Project Activity
Which will Likely Impact
the Environmental
Component)
Potential Impact Options for Prevention or Mitigation or
Enhancement Responsible Entity Cost
installations) related to the
equipment/instruments
installations and operations
regulations; providing appropriate warning
signs, providing safety barriers to separate
pedestrian and vehicular traffic from
construction activities etc.
Elevated concentration of air
pollutants related to traffic slow down
and congestion due to deliveries of
construction materials and installation
equipment/instruments.
Elevated noise level due to the use of
machineries
Re-route vehicular traffic on less congested
roads; no prolonged parking for construction
vehicle in the road.
Use only properly maintained and third
party-inspected equipment; noise generating
equipment to be provided with noise
abatement attachments such as mufflers;
work area properly barricaded with high
walled fence; workers working with noise
generating equipment provided with ear
muffs.
Contractor(s) and
Consultant
Incorporated in the
civil works
construction
budget
Contribution of sedimentation to
adjacent water bodies/outfalls/sewer-
drainage lines
Provide protection of stockpiles; minimize
stockpiling; keep stockpiles away from
waterways; stabilize excavated areas
immediately to minimize soil loss during
downpours
Local employment generation Hire as many locals especially those that

Environmental and Social Impact Assessment, HCMC Steering Center of the Urban
and Environmental and Social Management Plan Flood Control Program
Proposed HCMC Flood Risk Management Project Date Submitted: December 2, 2015
239
Project
Phase/Environment
Aspect (Project Activity
Which will Likely Impact
the Environmental
Component)
Potential Impact Options for Prevention or Mitigation or
Enhancement Responsible Entity Cost
will be economically displaced by the
project.
2.5 Finishing works related
to the
equipment/instruments
installations and operations
Construction accidents Provide primary medical services at
construction site; arrange with the nearest
hospital for emergency and tertiary medical
services requirements; minimize by proper
training/safety orientation; providing safety
equipment observing traffic rules and
regulations; providing appropriate warning
signs, providing safety barriers to separate
pedestrian and vehicular traffic from
construction activities etc.
Elevated concentration of air
pollutants related to traffic slow down
and congestion.
Elevated noise level due to the use of
machineries
Re-route vehicular traffic on less congested
roads; no prolonged parking for construction
vehicle in the road.
Use only properly maintained and third
party-inspected equipment; noise generating
equipment to be provided with noise
abatement attachments such as mufflers;
work area properly barricaded with high
walled fence; workers working with noise
generating equipment provided with ear
muffs.

Environmental and Social Impact Assessment, HCMC Steering Center of the Urban
and Environmental and Social Management Plan Flood Control Program
Proposed HCMC Flood Risk Management Project Date Submitted: December 2, 2015
240
Project
Phase/Environment
Aspect (Project Activity
Which will Likely Impact
the Environmental
Component)
Potential Impact Options for Prevention or Mitigation or
Enhancement Responsible Entity Cost
Local employment generation Hire as many locals especially those that
will be economically displaced by the
project.
2.6 Testing and
commissioning of the
equipment/instruments
Hiring of non-qualified technical and
scientific staff
Formulate hiring eligibility requirements;
advertise available positions and
requirements; select the most appropriate
and highly qualified staff meeting the hiring
eligibility requirements.
PMU, SRHMC, SCFC
and/or DONRE
Incorporate in the
budget
Exposure to accidents; equipment
malfunction
Formulate a Health, Safety and
Environment Manual or Plan prescribing
organizational and resource requirements, as
well as compliance with Vietnamese
Government Occupational Safety and
Health Standards; hire qualified staff;
comply with international standards in the
absence of specific requirements; work
areas where testing shall be done shall be
properly barricaded and provided with
warning signs to keep nearby residents from
venturing into the work areas; follow
manufacturer‘ manual of instructions.
2.7 Construction debris
disposal and management
(demobilization of
Dust generation; elevated
concentration of air pollutants related
to traffic slow down and congestion
Cover debris during transport operations; re-
route transport traffic on less congested
roads; no prolonged parking for construction
Contractor(s) and
Consultant
Incorporated in the
civil works
construction

Environmental and Social Impact Assessment, HCMC Steering Center of the Urban
and Environmental and Social Management Plan Flood Control Program
Proposed HCMC Flood Risk Management Project Date Submitted: December 2, 2015
241
Project
Phase/Environment
Aspect (Project Activity
Which will Likely Impact
the Environmental
Component)
Potential Impact Options for Prevention or Mitigation or
Enhancement Responsible Entity Cost
Contractor) during loading, transport, and
unloading to the disposal site.
Elevated noise level at the debris and
disposal sites due to the use of
machineries and transport vehicles
vehicle in the road.
Use only properly maintained and third
party-inspected equipment; noise generating
equipment to be provided with noise
abatement attachments such as mufflers;
work area properly barricaded with high
walled fence; workers working with noise
generating equipment provided with ear
muffs.
budget
Non-availability of disposal sites Coordinate with land owners or companies
requiring reclamation/ fill materials;
coordinate with PCs with regard to
approved disposal sites within their
territory; coordinate with national
government agencies that have on-going
reclamation activities
Contractor(s) and
Consultant
Incorporated in the
civil works
construction
budget
Traffic congestion Formulate traffic management plan; re-route
transport operations in less congested roads;
coordinate with PCs in regard to traffic
management requirements
Contractor(s) and
Consultant
Incorporated in the
civil works
construction
budget
3.0 Operation Phase
3.1 Installation operation
and maintenance
Accidents
Arrange with the nearest hospital for
emergency and tertiary medical services
SRHMC, SCFC
and/or DONRE
Incorporate in the
project budget

Environmental and Social Impact Assessment, HCMC Steering Center of the Urban
and Environmental and Social Management Plan Flood Control Program
Proposed HCMC Flood Risk Management Project Date Submitted: December 2, 2015
242
Project
Phase/Environment
Aspect (Project Activity
Which will Likely Impact
the Environmental
Component)
Potential Impact Options for Prevention or Mitigation or
Enhancement Responsible Entity Cost
Equipment (field and data processing)
malfunction
Power interruption
Telecommunications (SCADA)
disruption
Fire protection system disruption in
the data management center
(Operation Center)
requirements; minimize by proper
training/safety orientation; providing safety
equipment
Prepare preventive maintenance schedule;
identify and repair causes of malfunction
Provide backup generator; identify and
repair cause of failure; prepare preventive
maintenance schedule; report power loss to
Service Provider.
Identify and repair cause of failure; report
telecommunications loss to Service
Provider.
Provide backup systems; identify and repair
cause of failure; prepare preventive
maintenance schedule; report failure to fire
protection installation company.
Water Supply disruption in the data
management center (Operation
Center)
Provide backup water storage system;
prepare preventive maintenance schedule;
report water interruptions with the Service
Provider
SRHMC, SCFC
and/or DONRE
Incorporate in the
project budget

Environmental and Social Impact Assessment, HCMC Steering Center of the Urban
and Environmental and Social Management Plan Flood Control Program
Proposed HCMC Flood Risk Management Project Date Submitted: December 2, 2015
243
Project
Phase/Environment
Aspect (Project Activity
Which will Likely Impact
the Environmental
Component)
Potential Impact Options for Prevention or Mitigation or
Enhancement Responsible Entity Cost
Technical and scientific staff turnover Formulate a human resource management
plan; provide training and educational
scholarships with fixed tenure bonding as
may be allowed under Vietnamese
regulations (i.e. for every year of
scholarship, the staff will stay for 3 years of
service. Otherwise, staff will pay for the full
cost of the scholarship expenses.); provide
industry-competitive salaries and incentives.
3.2 Field data acquisition,
data processing and
information management
Poor quality data acquired; inaccurate
information generated for policy- and
decision-making
Formulate field data acquisition protocols;
provide training to staff; provide quality
control checks
SRHMC, SCFC
and/or DONRE
Incorporate in the
project budget
Environmental and Social Impact Assessment, HCMC Steering Center of the Urban
and Environmental and Social Management Plan Flood Control Program
Proposed HCMC Flood Risk Management Project Date Submitted: December 2, 2015
244
7.4. Environment Monitoring Program
7.4.1. Objective and Approach
Main objective of the Environment Monitoring program is to ensure that (a) the potential
negative impacts of the project are minimized; (b) the EMP is effectively implemented; and (c)
the EMP is adequate to mitigate the potential negative impacts. Given that monitoring the
implementation of the RP will be conducted separately, the environmental monitoring program
will comprise (a) monitoring the safeguard performance of the contractor during site clearance
and construction, (b) environmental quality monitoring, (c) monitoring effectiveness of the EMP.
7.4.2. Monitoring of Contractor‟s Safeguard Performance
Three levels of safeguard monitoring will be implemented: routine monitoring, periodic
monitoring, and community monitoring as follows:
– Routine monitoring: The routine monitoring will be made by the Construction Supervision
Consultant (CSC) as assigned by PMU. The CSC will include the monitoring results in the
project progress reports;
– Periodic monitoring (every six months): As part of the overall monitoring of the EMP, the
ESU assisted by the Independent Environmental Monitoring Consultant (IEMC) will also
monitor the contractor performance every 6 months and the results will be reported to the
PMU and the WB;
– Community monitoring: Monitoring by local communities will be conducted following the
Government practices with the technical and management support from the PMU.
7.4.3. Environmental Quality Monitoring of Component 2
To ensure an acceptable level of environmental quality, monitoring of dust, noise, vibration, air
quality, and water quality will be made at project specific locations that are likely to be
significantly affected by the construction activities, or requested by local authorities and
communities for specific purposes. ESU/IEMC will be responsible for the monitoring of the
program.
Below is a list of the key issues and scope of monitoring that will be considered in the
implementation of the monitoring program:
– Implementation of the Dredge Material Management Plan (DMMP) for all sludge and
similar material excavated from the project work sites: Amount, level of heavy metals,
locations and performance at disposal sites, and impacts on local residents will be
monitored. Outline DMMPs will be prepared during detailed design, and will be used as the
basis for contractors‘ dredged materials management plans;
– General Construction Impacts: To include local flooding; traffic management especially in
residential areas; air, noise, and dust levels in residential areas; and water quality upstream

Environmental and Social Impact Assessment, HCMC Steering Center of the Urban
and Environmental and Social Management Plan Flood Control Program
Proposed HCMC Flood Risk Management Project Date Submitted: December 2, 2015
245
and downstream of construction sites, with specific attention paid and impact on local
residents;
– Others: As agreed with local agencies and communities during the preparation of the
monitoring program.
Tables 7.4, 7.5, 7.6, and 7.7 provide general guidance on the monitoring program and estimated
cost considering that the activities will be carried out before construction (project baseline
environment), during construction (assumed 4 years), and during the first year of operation.
Detailed monitoring programs will be prepared during the detailed design stage. An estimated cost
for monitoring is incorporated into the EMP cost (Section 6.6). Many of these measurements are
required by Vietnamese regulations and would need to be done even if not directly related to
expected project impacts.
Table 7.4 Scope of environmental monitoring during construction of component 2
No. Monitoring items Before construction Construction Phase Standards
I Air quality
1. Parameters Temperature, Wind
velocity, Humidity,
Particulates (dust),
Noise, Pb, NH3,
SO2, NO2, CO, H2S,
VOCs.
Temperature, Wind
velocity, Humidity,
Particulates (dust),
Noise, Pb, NH3,
SO2, NO2, CO, H2S,
VOCs.
QCVN
05 :2009/BTNMT,
QCVN
06:2009/BTNMT
2. Frequency 1 location/day Once per 3 months
3. Location Baseline environmental locations should be established in line with
the construction sites at the time of monitoring
II Surface water/waste water quality monitoring
1. Parameters
pH, Hardness,
Chromaticity, TDS,
Cl-, F-, NO2-, NO3-,
SO42-, Fe, As, Cd,
Pb, Cu, Zn, Mn,
Coliform, DO,
BOD5, COD,
Turbidity, E.Coli, Oil
and Grease.
pH, Hardness,
Chromaticity, TDS,
Cl-, F-, NO2-, NO3-,
SO42-, Fe, As, Cd,
Pb, Cu, Zn, Mn,
Coliform, DO,
BOD5, COD,
Turbidity, E.Coli, Oil
and Grease.
QCVN
08:2008/BTNMT;
QCVN
14:2008/BTNMT;
QCVN
24:2009/BTNMT
2. Frequency 1 location/day Once per 03 months
3. Location Baseline environmental locations should be established in line with
the construction sites at the time of monitoring
III Groundwater

Environmental and Social Impact Assessment, HCMC Steering Center of the Urban
and Environmental and Social Management Plan Flood Control Program
Proposed HCMC Flood Risk Management Project Date Submitted: December 2, 2015
246
No. Monitoring items Before construction Construction Phase Standards
1. Parameters
pH, DO, Turbidity,
Salinity, SS, BOD5,
COD, NO2-, NO3-,
PO43-, Cr, Hg, Oil
and Grease, E. Coli,
Colifform.
pH, Hardness,
Chromaticity, TDS,
Cl-, F-, NO2-, NO3-,
SO42-, Fe, As, Cd, Pb,
Cu, Zn, Mn, Coliform,
DO, BOD5, COD,
Turbidity, E.Coli, Oil
and Grease.
QCVN
08:2008/BTNMT;
QCVN
14:2008/BTNMT;
QCVN
24:2009/BTNMT
2. Frequency 1 location/day Once per 03 months
3. Location Baseline environmental locations should be established in line with
the construction sites at the time of monitoring
VI Dredged sludge: If required as indicated in the dredge material management plan
1. Parameters Cu, Pb, Zn, Cd, As Cu, Pb, Zn, Cd, As QCVN
03:2008/BTNMT 2. Frequency As needed As needed
3. Location Baseline environmental locations should be established in line with
the construction sites at the time of monitoring
V Aquatic Plankton and Benthos
1. Parameters
Species,
Communities and
Diversity, and
Counts per cubic
metre, fish
Species,
Communities and
Diversity, and
Counts per cubic
metre, fish
NA
2. Frequency As needed As needed
3. Location
Baseline environmental locations should be established in line with
the construction sites at the time of monitoring

Environmental and Social Impact Assessment, HCMC Steering Center of the Urban
and Environmental and Social Management Plan Flood Control Program
Proposed HCMC Flood Risk Management Project Date Submitted: December 2, 2015
247
Table 7.5 Estimated number for soil, water, and air sampling and analysis for environmental monitoring during construction
Construction Items Component 1 Component 2 Component 3 Component 4 Component 5 Component 6
Total time of Construction 24 months 24 months 48 months 18 months 48 months 24 months
Waste/Surface water sample (1 time) 20 20 20 20 20 20
Sludge sample (1 time) 24 24 24 24 24 24
Air sample (1 time) 11 11 11 11 11 11
Groundwater (1 time) 8 8 8 8 8 8
Total monitoring Times 8 8 16 6 16 8
Total surface water samples 160 160 320 120 320 160
Total sediment samples 192 192 384 144 384 192
Total groundwater samples 64 64 128 48 128 64
Total air samples 88 88 176 66 176 88
Note: Component (i): Construction of Nuoc Len tidal sluice gate and 2 ship locks, (ii) Construction of Vam Thuat tidal sluice gate and 2 ship locks; (iii)
Improvement and upgrading of canal bank revetment in the main canal of TLBCNL Canal; (iv) Construction of main interceptor in Go Vap district; (v)
Construction and improvement of primary and secondary combined sewer systems and the secondary interceptor in Go Vap district; (vi) Improvement of
secondary canals (Hy Vong, Cau Cut, Ba Mieng, Ong Tong, Ong Bau, Chin Xieng).

Environmental and Social Impact Assessment, HCMC Steering Center of the Urban
and Environmental and Social Management Plan Flood Control Program
Proposed HCMC Flood Risk Management Project Date Submitted: December 2, 2015
248
Table 7.6 Estimated cost for samples collection and analysis
No Content Unit Quantity Price (VND) Total (VND) Total (USD)
1 Water sample Sample 1240 5,000,000 6,200,000,000
2 Sludge sample Sample
1488 5,000,000 7,440,000,000
3 Air sample Sample
682 3,500,000 2,387,000,000
4 Groundwater Sample 496 3,500,000 1,736,000,000
Total 17,763,000,000 796,547.1
Total cost (after being rounded-up) 800,000
7.4.4. Environmental Quality Monitoring of Component 1
The environmental monitoring plan prepared for this project as shown in Table 7.6 is highly
indicative and shall be treated as general guidance only. A monitoring program will be further
prepared in detail and shall be based on the assessment of the individual installation site
requirements prior to the commencement of pre-construction, construction, and operation
responsibilities. The primary purpose of the monitoring, validation and evaluation/audits is to
ensure that sound environmental management occurs. Specifically, it aims to ensure the
following:
Compliance with the conditions set in DONRE‘ requirements;
Compliance with the EMP;
Effectiveness of environmental measures on prevention or mitigation of actual project
impacts compared with the predicted impacts used as basis for the EMP design; and
Continual updating of the EMP for sustained responsiveness to project operations and
project impacts.

Environmental and Social Impact Assessment, HCMC Steering Center of the Urban
and Environmental and Social Management Plan Flood Control Program
Proposed HCMC Flood Risk Management Project Date Submitted: December 2, 2015
249
Table 7.7 Environmental Monitoring Program for Component 1
Key Environmental Aspects
per Project Phase Potential Impact
Parameter to be
Monitored
Sampling and Measurement Plan Responsible
Entity
Annual
Estimated
Cost
Method Frequency Location
1. Pre-construction Phase
1.1 Installation location
identification and planning
Improperly located
installations will not
maximize the full potential
of data acquisition and
management
Appropriate
location for the
stations
Selection
criteria and
field
validation
During
planning
Each of the
individual
installation
sites and
their
alternatives
if there are
any.
PMU, SRHMC,
SCFC and
DONRE
Undertermi
ned but
should be
included in
the Project
Cost
1.2 Property acquisition Ownership conflict Property Title Inspection and
verification Once
Lands
Office of the
Vietnamese
Government
PMU
Incorporate
d in Project
Cost
1.3 Planning and detailed
engineering design
Non-conformance to
standards Design standards
Due
diligence/Clie
nt Quality
Control
From
project
concept to
final
acceptance
Design/cons
ultant‘s
office
1.4 Permit acquisition Non-compliance to
regulations
Regulatory
requirements
Due
diligence/Clie
nt Quality
Control
Each
application
Regulatory
Offices
1.5 Procurement and selection of
Contractor(s) Competence Track record
Pre-
qualification
During
selection
PMU
Offices

Environmental and Social Impact Assessment, HCMC Steering Center of the Urban
and Environmental and Social Management Plan Flood Control Program
Proposed HCMC Flood Risk Management Project Date Submitted: December 2, 2015
250
Key Environmental Aspects
per Project Phase Potential Impact
Parameter to be
Monitored
Sampling and Measurement Plan Responsible
Entity
Annual
Estimated
Cost
Method Frequency Location
requirements process
1.6 Contractor(s) Mobilization
Ambient Air Quality TSP, Sox, NOx,
Applicable
Vietnamese
Regulations
and Standards
Once prior
to civil
works
Installation
Sites
Noise Noise level (dBA)
Noise meter-
direct
measurement
Housing requirements Size of temporary
accommodation
Engineer‘s
estimate
Employment Number hired
Head count
from
employee
roster
2. Construction Phase
2.1 Site preparation and removal
of materials and debris in each
installation site Ambient Air Quality TSP, Sox, NOx,
Applicable
Vietnamese
Regulations
and Standards
Once
during the
on-going
civil work
Installation
Sites
Contractor(s) and
Consultant(s)
Incorporate
d in Project
Cost
Dust Generation TSP Visual
Observation Daily
Noise
Employment generation
Noise level (dBA)
Number hired
Noise meter
measurement
Head count
from
Prior to
civil works
Monthly

Environmental and Social Impact Assessment, HCMC Steering Center of the Urban
and Environmental and Social Management Plan Flood Control Program
Proposed HCMC Flood Risk Management Project Date Submitted: December 2, 2015
251
Key Environmental Aspects
per Project Phase Potential Impact
Parameter to be
Monitored
Sampling and Measurement Plan Responsible
Entity
Annual
Estimated
Cost
Method Frequency Location
employee
roster
Siltation Turbidity level Visual
Daily
during the
activity
Incorporate
d in Project
Cost
2.2 Relocation of affected
utilities (where maybe
applicable)
Service disruption Duration of
disruption
Actual
observation
Daily
during the
disruption
2.3 Equipment foundation
excavations/preparation works
2.4 Structural; mechanical;
electrical; ICT; and water,
sanitation, telecommunications,
and fire protection works (in
facilities housing ICT
installations) related to the
equipment/instruments
installations and operations
2.5 Finishing works related to the
equipment/instruments
installations and operations
2.6 Testing and commissioning
of the equipment/instruments
Ambient Air Quality
Dust Generation
Noise
Employment generation
Accidents and exposure
Debris disposal
TSP, Sox, NOx,
TSP
Noise level (dBA)
Number hired
Number
Volume and
Applicable
Vietnamese
Regulations
and Standards
Quarterly
during the
work
Visual
Observation Daily
Noise meter –
direct
measurement
Head count
from
employee
roster
Headcount
Truckload
Quarterly
during the
work
Monthly
Daily
Daily
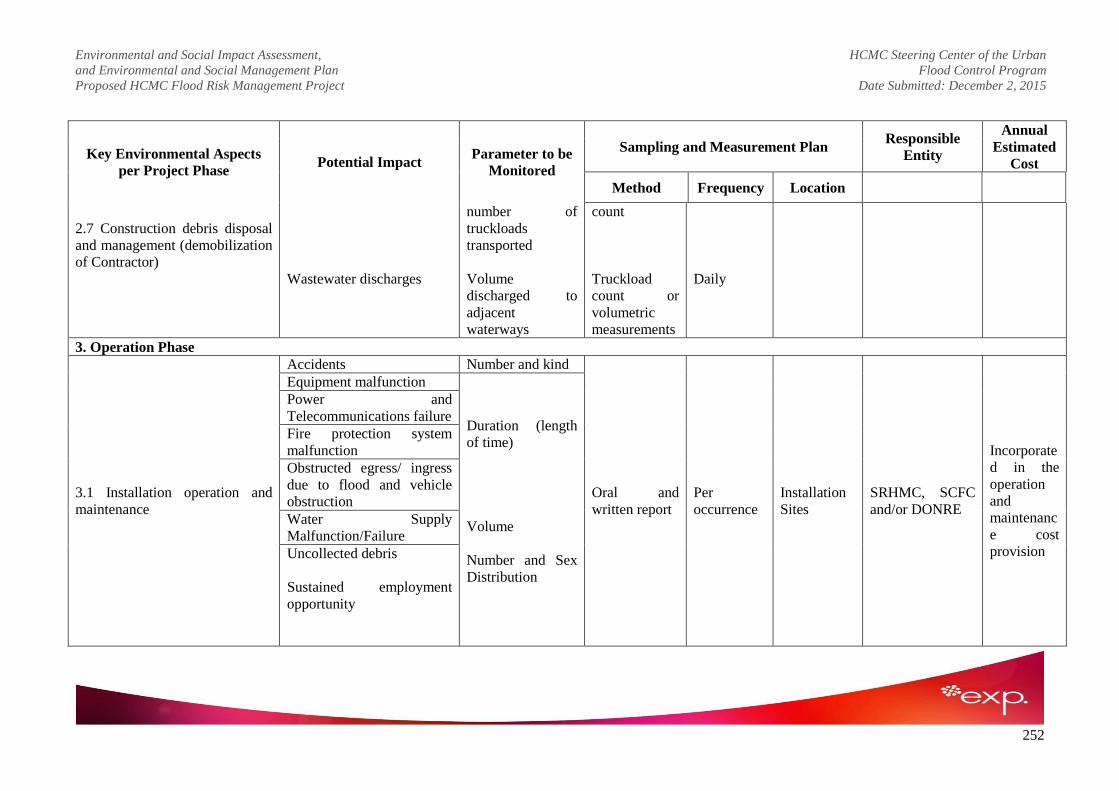
Environmental and Social Impact Assessment, HCMC Steering Center of the Urban
and Environmental and Social Management Plan Flood Control Program
Proposed HCMC Flood Risk Management Project Date Submitted: December 2, 2015
252
Key Environmental Aspects
per Project Phase Potential Impact
Parameter to be
Monitored
Sampling and Measurement Plan Responsible
Entity
Annual
Estimated
Cost
Method Frequency Location
2.7 Construction debris disposal
and management (demobilization
of Contractor)
Wastewater discharges
number of
truckloads
transported
Volume
discharged to
adjacent
waterways
count
Truckload
count or
volumetric
measurements
Daily
3. Operation Phase
3.1 Installation operation and
maintenance
Accidents Number and kind
Oral and
written report
Per
occurrence
Installation
Sites
SRHMC, SCFC
and/or DONRE
Incorporate
d in the
operation
and
maintenanc
e cost
provision
Equipment malfunction
Duration (length
of time)
Volume
Number and Sex
Distribution
Power and
Telecommunications failure
Fire protection system
malfunction
Obstructed egress/ ingress
due to flood and vehicle
obstruction
Water Supply
Malfunction/Failure
Uncollected debris
Sustained employment
opportunity
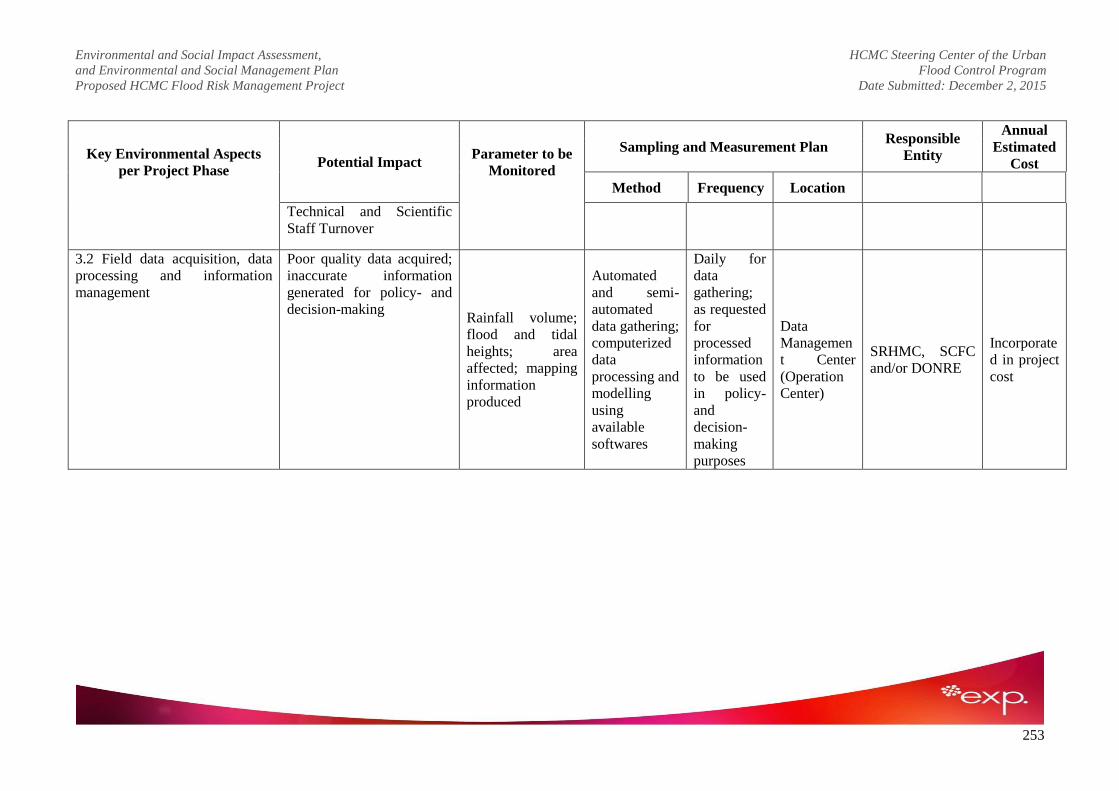
Environmental and Social Impact Assessment, HCMC Steering Center of the Urban
and Environmental and Social Management Plan Flood Control Program
Proposed HCMC Flood Risk Management Project Date Submitted: December 2, 2015
253
Key Environmental Aspects
per Project Phase Potential Impact
Parameter to be
Monitored
Sampling and Measurement Plan Responsible
Entity
Annual
Estimated
Cost
Method Frequency Location
Technical and Scientific
Staff Turnover
3.2 Field data acquisition, data
processing and information
management
Poor quality data acquired;
inaccurate information
generated for policy- and
decision-making Rainfall volume;
flood and tidal
heights; area
affected; mapping
information
produced
Automated
and semi-
automated
data gathering;
computerized
data
processing and
modelling
using
available
softwares
Daily for
data
gathering;
as requested
for
processed
information
to be used
in policy-
and
decision-
making
purposes
Data
Managemen
t Center
(Operation
Center)
SRHMC, SCFC
and/or DONRE
Incorporate
d in project
cost

Environmental and Social Impact Assessment, HCMC Steering Center of the Urban
and Environmental and Social Management Plan Flood Control Program
Proposed HCMC Flood Risk Management Project Date Submitted: December 2, 2015
254
7.4.5. Monitoring Implementation Performance of DMMP
To ensure that dredging, transportation, and disposal activities will not create adverse impacts on
local residents and environment, a guideline for preparation and monitoring of the DMMP is
provided in box below. Accordingly, the detailed design will include a comprehensive testing
program and the development of a DMMP, reflecting the guidelines below as appropriate.
A guideline for preparation and monitoring of a DMMP
Main environmental and social issues related to contaminated dredge materials are: (a) Pollution
during the transport of the dredged soil from the dredging site to the disposal area; (b) Potential
increase in turbidity and pollution of the water in the canals during dredging; (c) Odor and other
disturbance to local residents; (d) and Potential misuse of the contaminated dredged materials for
public infrastructure and households. To facilitate the preparation of a DMMP given that the
activities will be carried out in an existing water body that may be used by other water users, the
following aspects should also be considered:
Assessing the quality of the sediments. The assessment will be carried out to confirm that the
sediments will not include large amount of environmentally harmful materials such as heavy
metals and/or other toxic substance. If these materials are found to be more than the
thresholds stipulated by the national standards, a special disposal plan should be prepared
with a monitoring plan. The special disposal plan should also set out a program to protect
the nearby community residents from using the disposed dredged materials for house
construction or gardening. The bottom sediment/sludge samples will be undertaken for
analysis for key pollutants according to the national standards. The sampling and analytical
methods should be in line with the Government regulations while the sampling locations will
depend on the risk level for each specific site:
Identifying the available land for disposing the dredged materials. The plan should identify
the landfill sites and/or land that could be appropriate for the disposal of dredged materials in
line with the level of risk associated with it. Public land, land for construction of rural roads,
public works, private land, etc. may be used, with an agreement with the project affected
Volume of Spoils in cubic m No of Sediment Samples
Up to 25,000 3
25,000 to 100,000 4-6
100,000 to 500,000 6-10
500,000 to 2,000,000 10-20
For each 1,000,000 above 2,000,000 Additional 10

Environmental and Social Impact Assessment, HCMC Steering Center of the Urban
and Environmental and Social Management Plan Flood Control Program
Proposed HCMC Flood Risk Management Project Date Submitted: December 2, 2015
255
households. If the risk due to contamination of sludge is high the sludge materials will be
disposed of at Da Phuoc sanitary landfill which has been in operation.
Preparing for a dredging and transportation plan. Dredging procedures and transportation
plan will be prepared outlining: (a) methods of dredging (pipeline, water pumping before
digging, etc.) and uploading to the disposal area and/or transportation vehicles, and/or
temporary storage site. If trucks are used, indicate proposed route of the transport from the
dredged site to the disposal area, (b) time of operation, (c) type of vehicles/trucks and
proposed measures to reduce the leakage of the dredged materials from the transport trucks,
(d) contractors‘ responsibilities for cleaning the roads and carry out remedial works if
necessary, and (e) a communication plan for the nearby communities including contact
number for possible complaints.
Temporary storage/disposal for uncontaminated sediment/mud. As the dredged materials are
in the state of mud at first before settled for 24 to 48 hours. All drainage water from disposal
land shall be driven to the drains and discharged back to the canal. For areas with highly
contaminated with organic material and create odor, dredge material/sludge should be hauled
by close tanker outside the construction site as soon as possible. For bottom sediment with
low contamination of organic materials, the dredged sediment will be transported to a
containing area which is appropriately located and properly design with an adequate size. A
monitoring plan for tracking the disposal of high contaminated materials will also be
prepared.
Identifying key area and/or receptacles (business, schools, public services, etc.) that are
sensitive to dredging and transportation. The DMMP shall carry out an inventory analysis
on the possible affected local businesses, access to water, and transportation (mainly due to
the dredging) and provide a plan to mitigate and/or compensate for the disturbances. The
plan should include all measures necessary to avoid impacts on local transportation and water
supply access to local residents as much as possible.
Identify other key water users. If dredging occur in water bodies (such as lakes,
rivers/stream) where there are potential other water users that may be affected by dredging,
prepare a water quality monitoring plan with specific stations and parameters that could be
used to monitor the potential impacts to the water users. Priority should be given to monitor
the areas that are sensitive to change in water quality (high suspended solid (SS), low pH,
high BOD or COD, high salinity, etc.) especially where the water is used as a source of water
supply for domestic and agricultural uses. In areas where dredging may cause negative
impacts to these water users, respective subproject owner is required to inform/consult them
and develop a series of actions to address their concerns, including conduct water quality
monitoring in the DMMP.

Environmental and Social Impact Assessment, HCMC Steering Center of the Urban
and Environmental and Social Management Plan Flood Control Program
Proposed HCMC Flood Risk Management Project Date Submitted: December 2, 2015
256
7.5. Monitoring effectiveness of the EMP
The ESU assisted by IEMC will monitor performance of the EMP implementation during the
detailed design/bidding stage as well as during construction and first year operation of the facilities
to ensure that (a) appropriate dredging and disposal of drainage sludge is properly carried out, in
accordance with the DMMP, 9b) other impacts identified in the EMP are effectively managed and
mitigated; and (c) traffic management is adequate and the level of impacts are acceptable (no
complaints or outstanding cases. Results/are to be properly kept in the project file for possible
review by PMU and the WB. Cost for the monitoring will be part of the PMU cost.
7.5.1. Organization Arrangement
Table 7.6 and Figure 7.1 below summarizes roles and responsibilities of the key parties and their
relationships regarding the implementation of the EMP while those for the PMU, CSC, and
IEMC are highlighted below while more details are provided in Section 7.4.2.
– Contractors are responsible for implementing mitigation measures. Measures will be included
in bidding documents and costs are to be included in construction bids;
– CSC is responsible for monitoring the day-to-day implementation of mitigation measures.
Cost included in CSC service contract;
– IEMC will be responsible for environmental monitoring which includes support to the PMU
for implementing supervision and monitoring, and reporting on the implementation through
monitoring reports.
Figure 7.1 Organization Diagram for the EMP Implementation.
(5)
(1c)
PMU‟s Environmental Staff (s)
CSC Contractor Communities
IEMC
WB DONRE PMU
(1a))
(1b)
(2a)
(3a)
(4a)
(2b)
(3b)
(4b)
(2c)
(4c)
City Sub-
DONRE
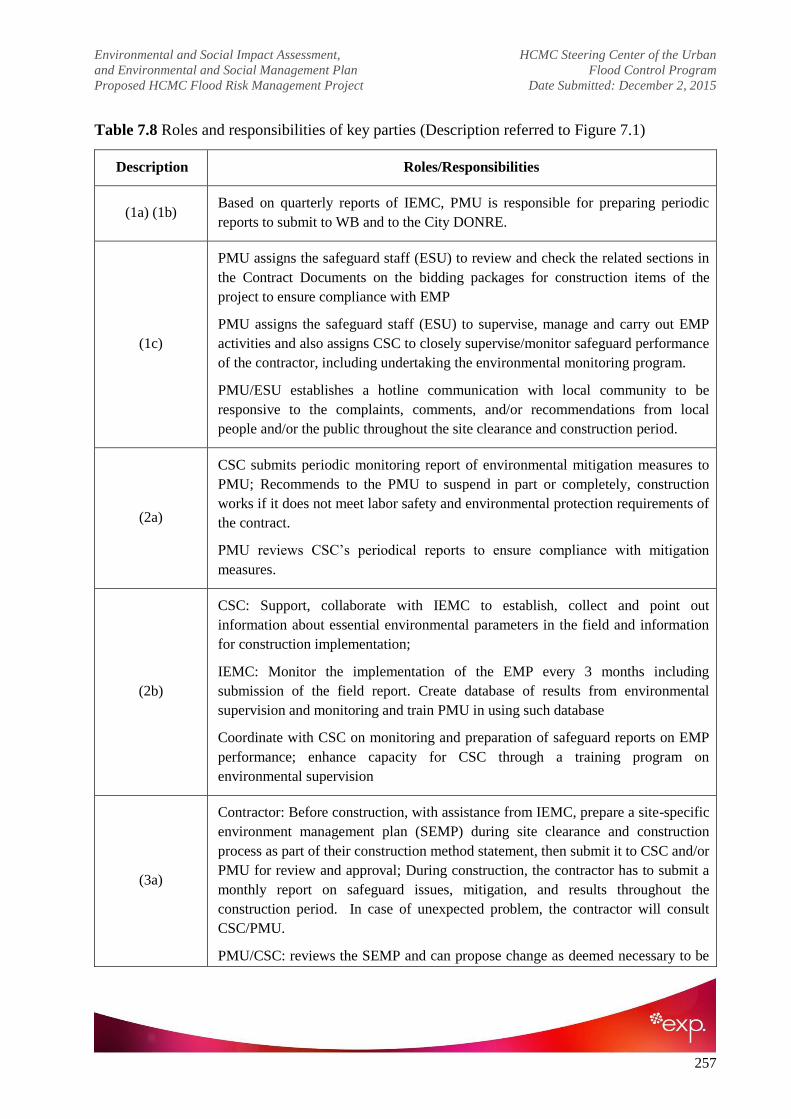
Environmental and Social Impact Assessment, HCMC Steering Center of the Urban
and Environmental and Social Management Plan Flood Control Program
Proposed HCMC Flood Risk Management Project Date Submitted: December 2, 2015
257
Table 7.8 Roles and responsibilities of key parties (Description referred to Figure 7.1)
Description Roles/Responsibilities
(1a) (1b) Based on quarterly reports of IEMC, PMU is responsible for preparing periodic
reports to submit to WB and to the City DONRE.
(1c)
PMU assigns the safeguard staff (ESU) to review and check the related sections in
the Contract Documents on the bidding packages for construction items of the
project to ensure compliance with EMP
PMU assigns the safeguard staff (ESU) to supervise, manage and carry out EMP
activities and also assigns CSC to closely supervise/monitor safeguard performance
of the contractor, including undertaking the environmental monitoring program.
PMU/ESU establishes a hotline communication with local community to be
responsive to the complaints, comments, and/or recommendations from local
people and/or the public throughout the site clearance and construction period.
(2a)
CSC submits periodic monitoring report of environmental mitigation measures to
PMU; Recommends to the PMU to suspend in part or completely, construction
works if it does not meet labor safety and environmental protection requirements of
the contract.
PMU reviews CSC‘s periodical reports to ensure compliance with mitigation
measures.
(2b)
CSC: Support, collaborate with IEMC to establish, collect and point out
information about essential environmental parameters in the field and information
for construction implementation;
IEMC: Monitor the implementation of the EMP every 3 months including
submission of the field report. Create database of results from environmental
supervision and monitoring and train PMU in using such database
Coordinate with CSC on monitoring and preparation of safeguard reports on EMP
performance; enhance capacity for CSC through a training program on
environmental supervision
(3a)
Contractor: Before construction, with assistance from IEMC, prepare a site-specific
environment management plan (SEMP) during site clearance and construction
process as part of their construction method statement, then submit it to CSC and/or
PMU for review and approval; During construction, the contractor has to submit a
monthly report on safeguard issues, mitigation, and results throughout the
construction period. In case of unexpected problem, the contractor will consult
CSC/PMU.
PMU/CSC: reviews the SEMP and can propose change as deemed necessary to be
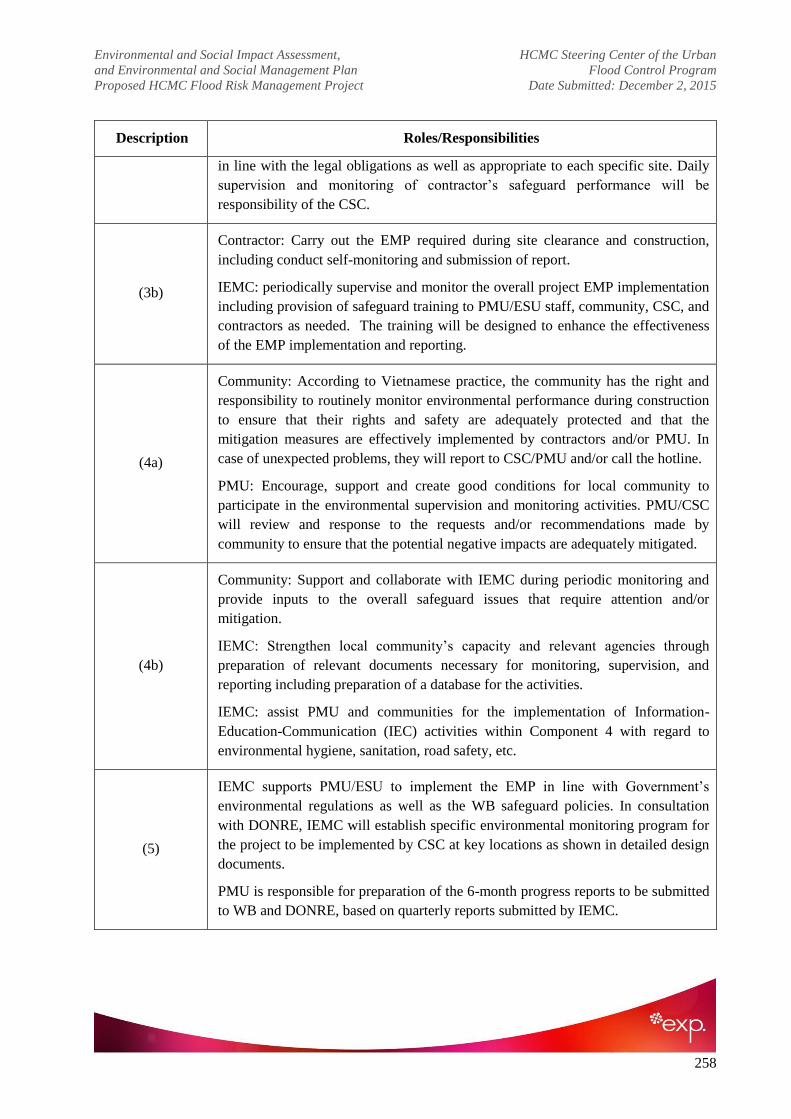
Environmental and Social Impact Assessment, HCMC Steering Center of the Urban
and Environmental and Social Management Plan Flood Control Program
Proposed HCMC Flood Risk Management Project Date Submitted: December 2, 2015
258
Description Roles/Responsibilities
in line with the legal obligations as well as appropriate to each specific site. Daily
supervision and monitoring of contractor‘s safeguard performance will be
responsibility of the CSC.
(3b)
Contractor: Carry out the EMP required during site clearance and construction,
including conduct self-monitoring and submission of report.
IEMC: periodically supervise and monitor the overall project EMP implementation
including provision of safeguard training to PMU/ESU staff, community, CSC, and
contractors as needed. The training will be designed to enhance the effectiveness
of the EMP implementation and reporting.
(4a)
Community: According to Vietnamese practice, the community has the right and
responsibility to routinely monitor environmental performance during construction
to ensure that their rights and safety are adequately protected and that the
mitigation measures are effectively implemented by contractors and/or PMU. In
case of unexpected problems, they will report to CSC/PMU and/or call the hotline.
PMU: Encourage, support and create good conditions for local community to
participate in the environmental supervision and monitoring activities. PMU/CSC
will review and response to the requests and/or recommendations made by
community to ensure that the potential negative impacts are adequately mitigated.
(4b)
Community: Support and collaborate with IEMC during periodic monitoring and
provide inputs to the overall safeguard issues that require attention and/or
mitigation.
IEMC: Strengthen local community‘s capacity and relevant agencies through
preparation of relevant documents necessary for monitoring, supervision, and
reporting including preparation of a database for the activities.
IEMC: assist PMU and communities for the implementation of Information-
Education-Communication (IEC) activities within Component 4 with regard to
environmental hygiene, sanitation, road safety, etc.
(5)
IEMC supports PMU/ESU to implement the EMP in line with Government‘s
environmental regulations as well as the WB safeguard policies. In consultation
with DONRE, IEMC will establish specific environmental monitoring program for
the project to be implemented by CSC at key locations as shown in detailed design
documents.
PMU is responsible for preparation of the 6-month progress reports to be submitted
to WB and DONRE, based on quarterly reports submitted by IEMC.

Environmental and Social Impact Assessment, HCMC Steering Center of the Urban
and Environmental and Social Management Plan Flood Control Program
Proposed HCMC Flood Risk Management Project Date Submitted: December 2, 2015
259
7.5.2. Specific Responsibilities of PMU, CSC, and IEMC
Project Management Unit (PMU)
– PMU is responsible for implementing the EMP during the detailed design and construction
stages. EMP implementation during operation stage is the responsibility of the facilities
operators. PMU will set up an Environmental and Social Unit (ESU) to ensure timely and
effective implementation of the EMP, including preparation of reports on safeguard
compliance as required by Government and WB.
– PMU/ESU is responsible for ensuring that the related sections in the Contract Documents
on the bidding packages for construction items of the project are in compliance with the
EMP.
– PMU/ESU is responsible for communicating with relevant local, provincial and national
departments; and with parties responsible for implementing and supervising EMP,
especially with the provincial Department of Natural Resources and Environment
(DONRE) and the concerned wards/communes during planning, monitoring, operation,
and management.
– PMU/ESU will coordinate with community organizations to encourage them to actively
participate in the planning, management, and implementation of the project, including
monitoring of the contractor‘s performance.
– To ensure effective monitoring and timely implementation of the EMP, PMU/ESU will
hire national environmental consultants to assist in carrying out and monitoring the EMP
implementation. Responsibilities of the Independent Environmental Monitoring Consultant
(IEMC) will be described below.
– For supervision and monitoring of contractor‘s performance, PMU will be responsible for:
(a) Checking project implementation indicators relating to environment; (b) Unannounced
inspections to ensure that mitigation measures are being implemented as presented in
construction contract by contractor; (c) Reviewing periodic report of construction
supervision consultant (CSC) to ensure compliance with mitigation measures; and (d)
Based on the periodic reports by CSC and IEMC, PMU will prepare report on
environmental compliance of subproject to submit to WB and DONRE (This is part of the
submission of a 6-month progress report to WB).
– PMU will coordinate closely with relevant enterprises on water supply, environmental
sanitation, solid waste collection and to monitor operation and maintenance during project
implementation.
Independent Environmental Monitoring Consultant (IEMC)
The IEMC will be responsible for assisting the PMU in EMP implementation. This also includes
advising the CSC, contractors and communities on environmental compliance, and carrying out

Environmental and Social Impact Assessment, HCMC Steering Center of the Urban
and Environmental and Social Management Plan Flood Control Program
Proposed HCMC Flood Risk Management Project Date Submitted: December 2, 2015
260
the monitoring program in accordance with regulations and procedures of the Government and
World Bank. Once the detailed operational implementation of the environmental monitoring
program is discussed by PMU and World Bank, the IEMC will be responsible for quarterly
checking, and supporting the PMU staff to supervise overall project activities to ensure that
unified environmental protection policies of the Government and World Bank are applied and
supervised during project implementation. The IEMC will be responsible to: (1) provide training
and capacity building for construction management for PMU/ESU staff, including field
engineers and/or consultants (CSC) in supervising the EMP implementation of the contractor; (2)
ensure active participation of the local communities and schools in the project areas, (3) monitor
environmental parameters to assess the overall impacts of the project, and (4) establish
environmental training program.
Specifically, the IEMC‘s responsibilities include:
– Ensuring that the approved EMP and all project loan agreements related to environmental
safeguards are fully applied and complied during project implementation.
– Assessing the effectiveness of mitigation measures which are provided by contractor and
CSC in implementation process; providing proposals and recommendations to the PMU on
necessary improvement and supplementation to meet the safeguard requirements.
– Reporting periodically (every 3 months) to the PMU on actual EMP performance during
project implementation.
– Establishing standard procedures, methods and forms to assist the PMU and CSC to assess
contractors‘ progress in implementing required impact mitigation and monitoring
measures.
– Assisting the PMU‘s environmental staff to review and check the related sections in the
Contract Documents on the bidding packages for construction items of the project to
ensure compliance with environmental protection policies and impact mitigation and
monitoring requirements.
– Measuring, taking samples and monitoring periodically environmental parameters (once
per 3 months) during the time of environmental monitoring contract.
– Assistance in the preparation of documents and implementation of training program on
environmental monitoring and supervision for contractors, CSC and relevant staffs of PMU
(environmental staffs and coordinators of packages).
– Via PMU, discussing with relevant enterprises (if necessary) to find suitable solutions for
unexpected risks relating to environmental sanitation.
Construction Supervision Consultant (CSC)
The CSC is responsible for monitoring the safeguard performance of the contractor during site
clearance and construction, including oversight of the self-monitoring to be conducted by

Environmental and Social Impact Assessment, HCMC Steering Center of the Urban
and Environmental and Social Management Plan Flood Control Program
Proposed HCMC Flood Risk Management Project Date Submitted: December 2, 2015
261
contractor. With regard to safeguards, the CSC‘s main responsibility will include, but not be
limited to, the following:
– Assist IEMC to establish, collect and provide information about both essential
environmental indicators on-site and construction work.
– Ensure that construction work complies with approved EMP, relevant indicators and
standardized operation in documents for environmental impact mitigation and monitoring.
– Monitor the mitigation measure implementation of contractor, propose and deploy
supplementary measures in time to complete mitigation measures and to meet the
environmental management safety requirements of project.
– Make action plans/urgent solutions to cope with environmental problems, urgent situation
and damages happening in construction
– Recommend PMU to suspend partially or completely construction work if labor safety and
environmental protection requirements of the contract are not complied with.
– Organize regularly discussions with relevant enterprises and other stakeholders to provide
information about implementation plans and necessary working program to enhance
people‘s awareness of environmental protection during construction process.
Construction Contractor
– The construction contractor‘s responsibilities in respects of all aspects of the works,
including the environmental aspects, are set out in the contract between it and the PMU.
– Construction contractors have their own responsibilities for both carrying out
environmental impact mitigation measures and compliance with approved EMP during
assembling construction of project packages. In the preparation of technical method
statement, contractor will study the project‘s approved EIA report and propose a
construction method that includes environmental mitigation and protection measures that
are aligned with the recommendations of the approved EMP.
– Contractor‘s method statement will be submitted to PMU and CSC for review, as well as to
IEMC as deemed necessary. Changes, if there are any, will be evaluated for feasibility and
for legal issues (laws, decrees, circulars and other regulations) before suitable adjustments
are approved for specific cases on-site.
– During construction work, construction contractor will be closely supervised by PMU,
CSC, IEMC, environmental authorities and local community on EMP observation.
7.5.3. Reporting Arrangements
The PMU will prepare reports twice per year for submission to the World Bank including the
compliance with the EMP. The report will contain the monitoring results and assessments of the

Environmental and Social Impact Assessment, HCMC Steering Center of the Urban
and Environmental and Social Management Plan Flood Control Program
Proposed HCMC Flood Risk Management Project Date Submitted: December 2, 2015
262
IEMC that show project progress and the status of implementation of the EMP. The reports will
cover, among other matters as appropriate, the following:
– Contractor‘s compliance with mitigation measures
– Wastewater and environmental sanitation issues
– Existing flood situation where relevant
– Traffic and water supply conditions
– Quality of waste-water receiving water bodies
– Potential project-related risks and risk management issues
– Consultation with local communities in key project areas
7.6. Capacity Building Program
7.6.1. Technical Assistance support for the implementation of safeguards
An assessment of safeguards implementation capacity of existing PMU staff indicates that PMU
staffs have limited knowledge on WB safeguard requirements as well as limited knowledge of
environment and social issues. Such lack of capacity represents a risk to project implementation
of safeguards requirements contained in the EMP and, as required by the WB policy, is to be
addressed through capacity building. Therefore it is proposed to provide capacity building
through technical assistance that will support the PMU during the implementation of the
safeguards requirements. The technical assistance will provide the necessary technical support
the PMU in its work with contractors as well as other entities involved in the implementation of
the EMP.
The scope of the technical assistance would cover support from experts and training that would
cover both the knowledge on safeguards requirements and procedures for the project as well as
training that covers both specific knowledge on safeguard procedures and requirement for the
project staff, consultants, and national contractor would be important. This would include, for
example, assistance in the preparation of documents and implementation of training program on
environmental management and environmental monitoring for contractors, CSC and relevant
staffs of PMU (environmental staffs and coordinators of packages) to do their tasks. It would
also include assisting the PMU‘s environmental staffs with the review of contract documents on
the bidding packages for construction items of the project to ensure compliance with
environmental protection policies and impact mitigation and monitoring requirements as well as
provide general environmental guidance as requested by the PMU to enhance overall project
implementation and performance.
Given the nature, locations, and scale of construction, it is anticipated that the safeguard
technical assistance support and training will be provided at least during the first 3 years of the
project implementation. The WB safeguard specialists will participate in the capacity building in
particular in the training activities as appropriate.

Environmental and Social Impact Assessment, HCMC Steering Center of the Urban
and Environmental and Social Management Plan Flood Control Program
Proposed HCMC Flood Risk Management Project Date Submitted: December 2, 2015
263
7.6.2. Training programs proposed
Table 7.9 below provides examples of the basic trainings for safeguards during project
implementation. The training programs will be developed and delivered by the Technical
Assistance team for the implementation of safeguards for the PMU training. The PMU/IEMC
with the support of the Technical Assistance team for the implementation of safeguards will
provide the training to contractors, CSC and other groups.
Other more specific and tailored training will be developed and agreed upon between PMU,
IEMC and the Technical Assistance team for the implementation of safeguards during project
implementation based upon a reassessment of needs and the status of safeguards implementation.
– Target groups for the training: include PMU staff, ESU staff, field engineers, CSC,
construction contractors, local authorities and community representatives in the project
area. Training of workers and drivers is the responsibility of the contractor;
– Training schedule: At least 1 month before the construction of the first contract. The
training can be adjusted in line with the implementation schedule of the
subproject/contracts;
– Training frequency: The basic training programs proposed in Table 7.7 will take place
every six months on a yearly basis and its content updated and adapted to implementation
issues. Training frequency and content will be reassessed during implementation
depending on needs. It is foreseen that the training program for PMU staff will continue
until year three of implementation. Three days of training for CSC and contractors are also
planned to take place twice a year on an annual basis for at least two years.
Table 7.9 Training Programs (to be financed by the project and the client) for Capacity
Building on Environmental Supervision and Management
I. OBJECTS PROJECT MANAGEMENT UNIT
Training course Environmental supervision, monitoring and reporting
Participators Environmental staff and technical staff
Training
Frequency
Soon after project effectiveness but at least 1 month before the construction
of the first contract. The follow-up training will be scheduled as needed.
Time Four days of training twice a year to be repeated on a yearly basis until year
three of implementation.
Content General environmental management relating to project including
requirements of WB, DONRE, cooperating with relevant enterprises
Requirements on environmental supervision;

Environmental and Social Impact Assessment, HCMC Steering Center of the Urban
and Environmental and Social Management Plan Flood Control Program
Proposed HCMC Flood Risk Management Project Date Submitted: December 2, 2015
264
Supervision and implementation of mitigation measures;
Community participation in environmental supervision.
Guide and supervise contractor, CSC and community representatives in
implementation of environmental supervision.
Forms used in environmental supervision;
Risk response and control;
Other areas to be determined;
Receiving approach and submit forms.
Responsibilities PMU, IEMC with support of the Technical Assistance team for the
implementation of safeguards.
II. OBJECTS CSC, CONTRACTOR, COMMUNE/WARDS AUTHORITIES,
COMMUNITY REPRESENTATIVES
Training course Implementation of mitigation measures
Participators CSC; on-site construction management staff; environmental staff of
contractor; commune/ward/group authorities.
Training
frequency
After bidding, update based on requirements
Time Three days of training for CSC and contractors and two days of training for
other also to be repeated twice a year on an annual basis depending on
needs
Content Overview of environmental monitoring;
Requirements of environmental monitoring;
Role and responsibilities of contractors and CSC
Content and methods of environmental monitoring;
Response and risk control;
Propagate monitoring forms and guide how to fill in the forms and risk
report;
Other areas to be determined;
Preparation and submission of report.
Responsibilities PMU, IEMC with support of the Technical Assistance team for the
implementation of safeguards

Environmental and Social Impact Assessment, HCMC Steering Center of the Urban
and Environmental and Social Management Plan Flood Control Program
Proposed HCMC Flood Risk Management Project Date Submitted: December 2, 2015
265
III. OBJECTS COMMUNITIES AND WORKERS
Training course Environmental sanitation and safety
Participators Representatives of community and/or worker leaders (as appropriate)
Training
frequency
As appropriate
Time One-day presentation and one-day on-the job training twice a year to be
repeated on a per needs basis
Content Preliminary presentation on environmental protection and environmental
overview
Key issues that require community and workers attention to minimize
safety risks (roads, waterways, equipment, machines, etc.) as well as reduce
pollution (dust, fume gases, oil/grease spill, waste management, etc.)
Management of environmental safety and sanitation in work sites and
worker camps;
Mitigation measures at construction site and work camps;
Safety measures on electricity, mechanical, transportation, air pollution;
Other areas to be determined;
Procedures to deal with emergency situation.
Responsibilities Contractor, PMU, with support from IEMC
7.7. Estimated EMP Cost
Table 7.8 provides an estimated cost for EMP implementation (excluding the resettlement cost and
RP and EMDP independent monitoring). The EMP cost6 will comprise (i) cost for implementation
of the mitigation measures by contractor, (ii) cost for supervision by the CSC, (iii) cost for
environmental monitoring consultant (IEMC) (iv) monitoring of environmental quality (v) PMU
safeguard management costs, including technical assistance support for the implementation of
safeguards and training. Costs for the implementation of the mitigation measures during
construction will be part of the contract cost while cost for monitoring of SEMP by the CSC is
provided for in the construction supervision contracts. Costs for PMU operations related to EMP
are provided for in the project management budget of the PMU, including basic safeguards training
and allowances for people who participate in the monitoring program. After project completion,
2 Excluding cost for implementation of the RP and EMDP and the independent monitoring of the
RP/EMP implementation.

Environmental and Social Impact Assessment, HCMC Steering Center of the Urban
and Environmental and Social Management Plan Flood Control Program
Proposed HCMC Flood Risk Management Project Date Submitted: December 2, 2015
266
the cost for environmental monitoring of the constructed facilities will be funded by the cities‘
operations and maintenance budgets.
It is noted that the attendance of community representatives in EMP implementation is voluntary,
and without salary. Hence, to encourage the participation of community members, the cost for
materials, equipment used for monitoring and rewards for people who are voted to implement
monitoring are taken into account. Following decision No. 80/2005/QĐ-TTg dated 18/4/2005 of
Prime Minister on regulations of community investment monitoring and joint circular for
guidelines of decision implementation No. 80/2005/QĐ-TTg ―cost for supporting the investment
monitoring of community in commune/ward are calculated in cost estimation of commune/ward
fatherland front and are guaranteed by commune/ward people‘s committee budget; cost for
propagation, training courses, guiding, closing of community investment monitoring at district and
provincial level are calculated in cost estimation of commune/ward Fatherland Front and are
guaranteed by commune/ ward people‘s committee budget‖.
Table 7.10 provides an estimated IEMC and environmental quality monitoring cost in line with the
country practices for reference. However the final cost will be updated during the detailed design.
Table 7.10 Estimated Cost for EMP implementation (million USD)
Cost (millions of $US) Source of funds
(a) Mitigation during construction Part of contracts WB
(b) Supervision of safeguards during construction Part of CSC costs in
Comp. 4
WB
(c) Environmental Safeguards unit (ESU) of PMU Part of PMU costs in
Comp. 4
WB
(d) Environmental quality monitoring 0.03 WB
(e) Independent Environmental Monitoring Consultant
(IEMC)
0.08 WB
(f) Safeguards capacity building program 0.25 WB
Table 7.11 Estimated cost for the IEMC (Exchange rate: 1 USD = 20,800 VND)
No. Content Unit Quantity Price
(VND)
Total
(VND)
Total
(USD)
1 Specialist salary Month 33.5 30,680,000 1,027,780,000 50,250
2 Local stays and allowance Day 720 520,000 374,400,000 18,000

Environmental and Social Impact Assessment, HCMC Steering Center of the Urban
and Environmental and Social Management Plan Flood Control Program
Proposed HCMC Flood Risk Management Project Date Submitted: December 2, 2015
267
No. Content Unit Quantity Price
(VND)
Total
(VND)
Total
(USD)
3 Travelling expenses Turn-person 90 832,000 74,880,000 3,600
4 Training course Overall 8 5,720,000 45,760,000 2,200
5 Office supply Overall 18 6,240,000 112,320,000 5,400
6 Office and communication Overall 18 4,992,000 89,856,000 4,320
Total 83,770
B. Social management plan
This Section presents the mitigation measures for impacts other than those caused by land
acquisition which have been identified and assessed in the previous section in Chapter 6 and
summarizes the Income Restoration Plan (IRP) which has been developed in the report for
Resettlement Action Plan of the Project.

Environmental and Social Impact Assessment, HCMC Steering Center of the Urban
and Environmental and Social Management Plan Flood Control Program
Proposed HCMC Flood Risk Management Project Date Submitted: December 2, 2015
268
Table 7.12 Mitigation measures for Social Negative Impacts
Pote
nti
al
imp
act
Man
agem
ent/
mit
igati
on
ob
ject
ives
Imp
act
sig
nif
ican
ce b
efore
mit
igati
on
Imp
act
sig
nif
ican
ce a
fter
mit
igati
on
Mit
igati
on
mea
sure
s
Tim
ing,
freq
uen
cy a
nd
du
rati
on
of
mit
igati
on
mea
sure
s
Res
pon
sib
le p
erso
n/
au
thori
ty
Key
per
form
an
ce
ind
icato
rs
Land
acquisition of
households
along the sub-
catchment area
To ensure that the
quality of life of
displaced
households is equal
to or better than
prior to
displacement.
Major Moderate - Mitigation measures
for land acquisition
have been prepared
separately in the
Report for
Resettlement Action
Plan (RAP) of the
Project. A summary of
the Income
Restoration Plan (IRP)
as part of the RAP is
provided in the next
section.
Please refer to the
RAP for details of
this part.
Please refer to
the RAP for
details of this
part.
- Please refer to the RAP for
details of this part.

Environmental and Social Impact Assessment, HCMC Steering Center of the Urban
and Environmental and Social Management Plan Flood Control Program
Proposed HCMC Flood Risk Management Project Date Submitted: December 2, 2015
269
Influx of
temporary
workers
To reduce
population influx,
minimize the
possibility of
conflicts between
workers and the
local community
and preserve social
security in the area.
Moderate Minor - Positions for unskilled
workers should be
employed from the
local population to
minimize population
influx.
- A dispute prevention
and management plan
should be developed
with an aim to manage
conflict and bring
about positive change
through conflict
resolution processes.
- Ongoing community
engagement and
stakeholder
involvement
throughout the process.
Prior to
construction,
construction and
operation
PMU and
construction
units
- Dispute prevention and
management plan established
- Monitoring of stakeholder
engagement
Increase in
traffic and
safety hazards
To maintain the
health and safety of
local population.
Moderate Minor - Development of a
detailed health and
safety plan to mitigate
construction risks of the
proposed project on the
surrounding
Construction and
operation phase.
PMU and
construction
units
- Health and safety plan
developed
- Traffic signs on the route
placed in time
- Monthly health and safety
monitoring and reporting

Environmental and Social Impact Assessment, HCMC Steering Center of the Urban
and Environmental and Social Management Plan Flood Control Program
Proposed HCMC Flood Risk Management Project Date Submitted: December 2, 2015
270
communities.
- Periodic inspection
and maintenance of
construction vehicles
- Place traffic signs on
the route
- Use of lifeboats
- Limit traffic flow
during rush hours
Construction
safety hazards
To maintain the
health and safety of
workers and other
staff in the
construction site.
Moderate Minor - Develop a health and
safety plan for
construction which
specifies measures for
risk management,
emergency and incident
response, prevention
and control of fire
explosion
- Develop fire safety
education and training
programs for workers
- Carry out regular
check fire detection
and alarm equipment.
Prior to
construction and
construction
PMU and
construction
units
- Health and safety plan
developed
- Health and safety officer
appointed
- Fire safety education and
training programs for
workers developed and
implemented
- Monthly checkup of fire
detection and alarm
equipment

Environmental and Social Impact Assessment, HCMC Steering Center of the Urban
and Environmental and Social Management Plan Flood Control Program
Proposed HCMC Flood Risk Management Project Date Submitted: December 2, 2015
271
Creation of
haven for
homeless
people and
possibility of
social evils
To minimize the
disturbance and
threats that
homeless people
and drug addicts
pose to the local
people.
Moderate Minor - Ensure enough
security staff in the
public parks along the
canal area during day
and night time to
maintain security and
prevent crime.
- Installment of
surveillance cameras in
public areas to timely
protect against property
theft and prevent crime.
Operation Local
government
- Creation of haven for
homeless people and
possibility of social evils

Environmental and Social Impact Assessment, HCMC Steering Center of the Urban
and Environmental and Social Management Plan Flood Control Program
Proposed HCMC Flood Risk Management Project Date Submitted: December 2, 2015
272
Table 7.13 Enhancement measures for Social Positive Impacts
Pote
nti
al
imp
act
Man
agem
ent/
mit
igati
on
ob
ject
ives
Imp
act
sig
nif
ican
ce b
efore
mit
igati
on
Imp
act
sig
nif
ican
ce a
fter
mit
igati
on
Mit
igati
on
mea
sure
s
Tim
ing,
freq
uen
cy a
nd
du
rati
on
of
mit
igati
on
mea
sure
s
Res
pon
sib
le p
erso
n/
au
thori
ty
Creation of
employment
opportunities
Local population are offered
employment opportunities where
possible.
Minor Minor - A "local labour" desk at the
contractor offices should be
established to identify a local
labour pool. Information about
recruitment of employers and
workers for the project should
be spread widely to local
people.
- Skill development
programs should be
implemented to ensure
support for local
population in obtaining
employment
opportunities.
Prior to
construction
and
construction
PMU and construction
units

Environmental and Social Impact Assessment, HCMC Steering Center of the Urban
and Environmental and Social Management Plan Flood Control Program
Proposed HCMC Flood Risk Management Project Date Submitted: December 2, 2015
273
Increase in
business
opportunities
Minimize pollution to the canals
resulting from the local food and
beverage businesses.
Moderate Minor - Regularly check whether
restaurants and cafes
allocate enough trash bins
to dispose of wastes when
customers need and
whether there is enough
toilets for customers.
Operation Department of Planning
and Investment and local
government
Leisure and
tourism
Maximize its potential as a
leisure place and for tourism
development.
Major Major - Work with the retired and
the elderly who have a
reputation in the community
to discourage people in the
area from throwing garbage
into the canal.
- Place additional trash bins
and warning signs
Operation City government (e.g.
Department of Culture,
Sports and Tourism) and
local government
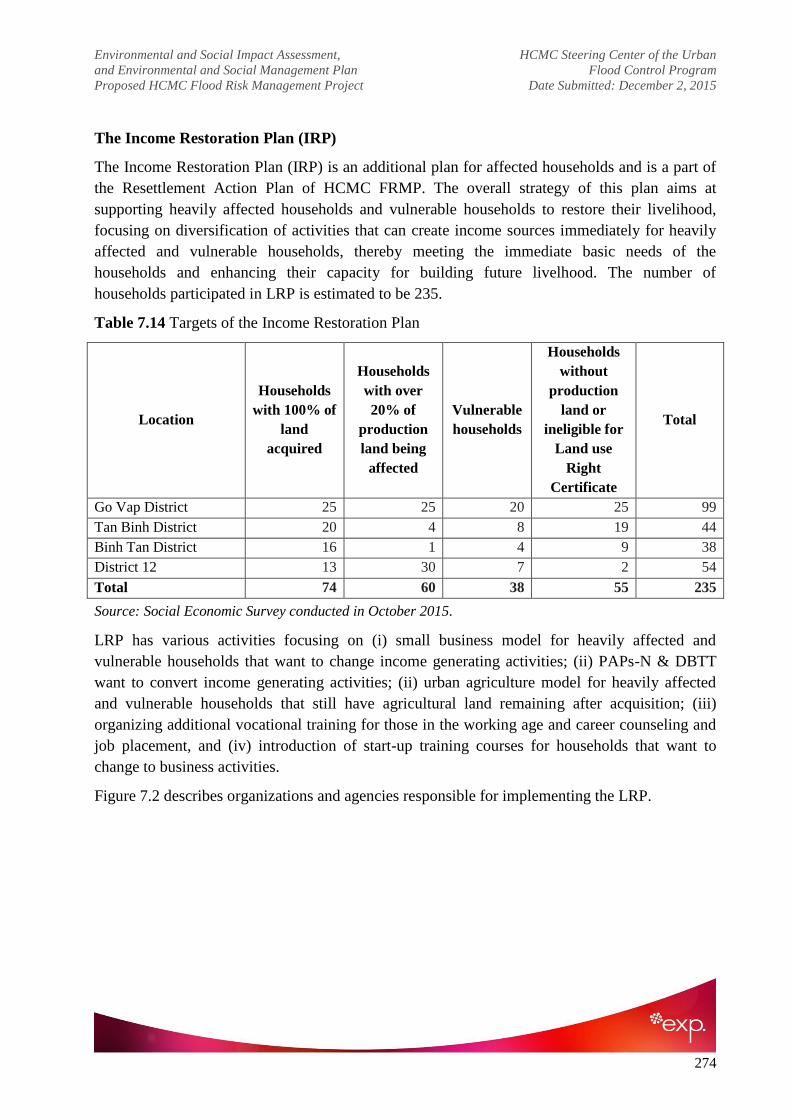
Environmental and Social Impact Assessment, HCMC Steering Center of the Urban
and Environmental and Social Management Plan Flood Control Program
Proposed HCMC Flood Risk Management Project Date Submitted: December 2, 2015
274
The Income Restoration Plan (IRP)
The Income Restoration Plan (IRP) is an additional plan for affected households and is a part of
the Resettlement Action Plan of HCMC FRMP. The overall strategy of this plan aims at
supporting heavily affected households and vulnerable households to restore their livelihood,
focusing on diversification of activities that can create income sources immediately for heavily
affected and vulnerable households, thereby meeting the immediate basic needs of the
households and enhancing their capacity for building future livelhood. The number of
households participated in LRP is estimated to be 235.
Table 7.14 Targets of the Income Restoration Plan
Location
Households
with 100% of
land
acquired
Households
with over
20% of
production
land being
affected
Vulnerable
households
Households
without
production
land or
ineligible for
Land use
Right
Certificate
Total
Go Vap District 25 25 20 25 99
Tan Binh District 20 4 8 19 44
Binh Tan District 16 1 4 9 38
District 12 13 30 7 2 54
Total 74 60 38 55 235
Source: Social Economic Survey conducted in October 2015.
LRP has various activities focusing on (i) small business model for heavily affected and
vulnerable households that want to change income generating activities; (ii) PAPs-N & DBTT
want to convert income generating activities; (ii) urban agriculture model for heavily affected
and vulnerable households that still have agricultural land remaining after acquisition; (iii)
organizing additional vocational training for those in the working age and career counseling and
job placement, and (iv) introduction of start-up training courses for households that want to
change to business activities.
Figure 7.2 describes organizations and agencies responsible for implementing the LRP.

Environmental and Social Impact Assessment, HCMC Steering Center of the Urban
and Environmental and Social Management Plan Flood Control Program
Proposed HCMC Flood Risk Management Project Date Submitted: December 2, 2015
275
Figure 7.2 Organization chart of LRP.
Total cost for the LRP of the HCMC FRMP is estimated to be around 5.4 billion VND,
equivalent to 244,000 USD.
Table 7.15 Cost estimate for implementing the Income Restoration Plan
No. Cost item Quantity
Price per
unit
(million
VND)
Total cost (millionVND)
I Direct investment for households
1 Households losing over 20% of
production land 60 20 1.200
2 Households losing front land for
business and vulnerable households 113 20 2.260
3 Additional vocational training 136 5 680
4 Support for trainees 136 2 272
5 Career consulting 136 0.5 68
Total cost I 4.480
II Implementation and management cost 448
PMU
LRP Consultant Independent
Monitoring Agency
District People's
Committee
LRP Management Unit
Ward People's
Committee
Heavily affected and
vulnerable households
HCMC People's
Committee

Environmental and Social Impact Assessment, HCMC Steering Center of the Urban
and Environmental and Social Management Plan Flood Control Program
Proposed HCMC Flood Risk Management Project Date Submitted: December 2, 2015
276
No. Cost item Quantity
Price per
unit
(million
VND)
Total cost (millionVND)
(10%)
III Provisional cost (10%) 448
Total 5.376
LRP monitoring program
Internal monitoring
- Technical Consultant will develop monitoring indicators.
- District and ward level Project Management Unit will prepare quarterly progress reports on the
implementation of the LRP depending on the areas they are in charge of.
- PMU will conduct independent monitoring of these units and submit progress reports to the
World Bank.
Independent monitoring
An independent monitoring unit has been hired by PMU to monitor and evaluate the
effectiveness of LRP. After one year of implementation, the effectiveness of LRP will be
evaluated to determine the socio-economic status of households to see whether they have
recovered at least equal to the pre-construction phase of the project.
Environmental and Social Impact Assessment, HCMC Steering Center of the Urban
and Environmental and Social Management Plan Flood Control Program
Proposed HCMC Flood Risk Management Project Date Submitted: December 2, 2015
277
CHAPTER 8: PUBLIC CONSULTATION AND INFORMATION DISCLOSURE
8.1. Objectives and basic principles
During the course of carrying out the environmental assessment, public consultation is a basic
condition to ensure public acceptance of the project as well as to limit adverse impacts and
surface issues not being realized by the implementation team. In fact, if the community
participates in the early stage of the project preparation, then it is able to build up a close
relationship between the community and the project team, and they can give valued proposals for
before the project implementation.
The public consultation process in EIA report preparation for the HCMC Flood Risk
Management Project is designed to:
- Achieve compliance with the requirements in clause 8, article 20 in Environmental protection
law No. 52/2005/QH11 dated 29/11/2005;
- Meet requirements in circular No. 05/2008/TT-BTNMT dated 08/12/2008 of Minister of
Ministry of Natural resources and environment. The circular provides guidelines on strategic
environmental impact assessment, EIA reporting, and environmental protection commitment.
- In addition, public consultation for the EIA report needs to include Environmental safeguard
policies of WB (follow OP4.01).
Objectives of public consultation are:
- To share information about project components and proposed project activities with the
community at project area and relevant stakeholders.
- To collect opinions; understand the concerns and sensitivities of local authorities and
community on environmental problems created in project area; especially problems which are
not recognized by EIA team.Based on this, public cares can be resoanably settled during the
course of setting up the Project, and selection of designing solutions
- To perform thorough and comprehensive evaluation of all environmental impacts and propose
the most effective mitigation measures that exactly address the adverse environmental
impacts.
The basic principles of public consultation are to:
- Facilitate local people and authorities‘ participation in project area as soon as possible;
- For project group A, the consultation need to conduct public consultation two times:
o First time: As soon as environmental screening is completed and TOR draft on
environmental impact assessment is ready.
o Second time: After having EIA draft prepared.

Environmental and Social Impact Assessment, HCMC Steering Center of the Urban
and Environmental and Social Management Plan Flood Control Program
Proposed HCMC Flood Risk Management Project Date Submitted: December 2, 2015
278
8.2. Consultation Process and Methodology
This is a Category A project, thus the WB requires that at least two public consultations are
carried out during the EA process. For this specific project, the first public consultation was done
shortly after environmental screening and before the terms of reference for the EA are finalized;
and the second will be carried out following this draft ESIA is prepared. The public consultations
are carried out in the format of open forum under the following process:
Notification of the requirements and plan to organize public consultation was sent by the
PMU and EXP consultant to the relevant districts and agencies for their endorsement,
following which invitations were sent from the districts to affected households, Women
Union, Youth Union, Veterans, Vietnamese Fatherland Front of the districts, as well as
NGOs. In addition, representatives from PMU and FS consultant were invited to attend the
meetings to assist EXP as required.
Printed brochures summarizing basic project information and survey questionnaires were
prepared ahead of the consultation, as well as a Power Point presentation and a video on
similar projects in the city (Nhieu Loc – Thi Nghe, Tan Hoa – Lo Gom, Tau Hu – Ben Nghe)
prepared by PMU for the consultation. The printed brochures were distributed to the district
authority one week prior to the consultation, and were included in the invitations. Additional
copies of the brochures were also available at the consultation for distribution. The
presentation and video were presented at the consultation to give the public a sense of how
the final project outcomes could be.
During the open forum, the participants were given the opportunity to raise their questions
and concerns either orally or in writing (through the questionnaire). The open forum enabled
direct communication and exchange of information between PMU, FS and EXP consultant,
concerned or relevant HCMC District PCs, affected households, and relevant agencies. The
issues raised verbally or in the questionnaires were addressed directly at the open forum by
the relevant authority and PMU. They were also recorded in this report for reference.
During the Public Consultation Meeting, the participants were also informed of the PMU‘s
contact information (office address and contact numbers) to which they could send further
questions, issues and concerns regarding to the project.
Issues raised during the consultation were integrated into the terms of reference for the ESIA
(first round of consultations) and into the final draft ESIA (second round of consultations).
8.3. Consultation Results
The first round of public consultations was carried out from August 25th
to October 29, 2015
at the PC office of different wards in the relevant 9 districts (including Tan Phu District, Binh
Thanh District, Tan Binh District, Go Vap District, District 12, Binh Chanh District, District 8
Hoc Mon District, Binh Tan District – Specific locations are included in the table below).
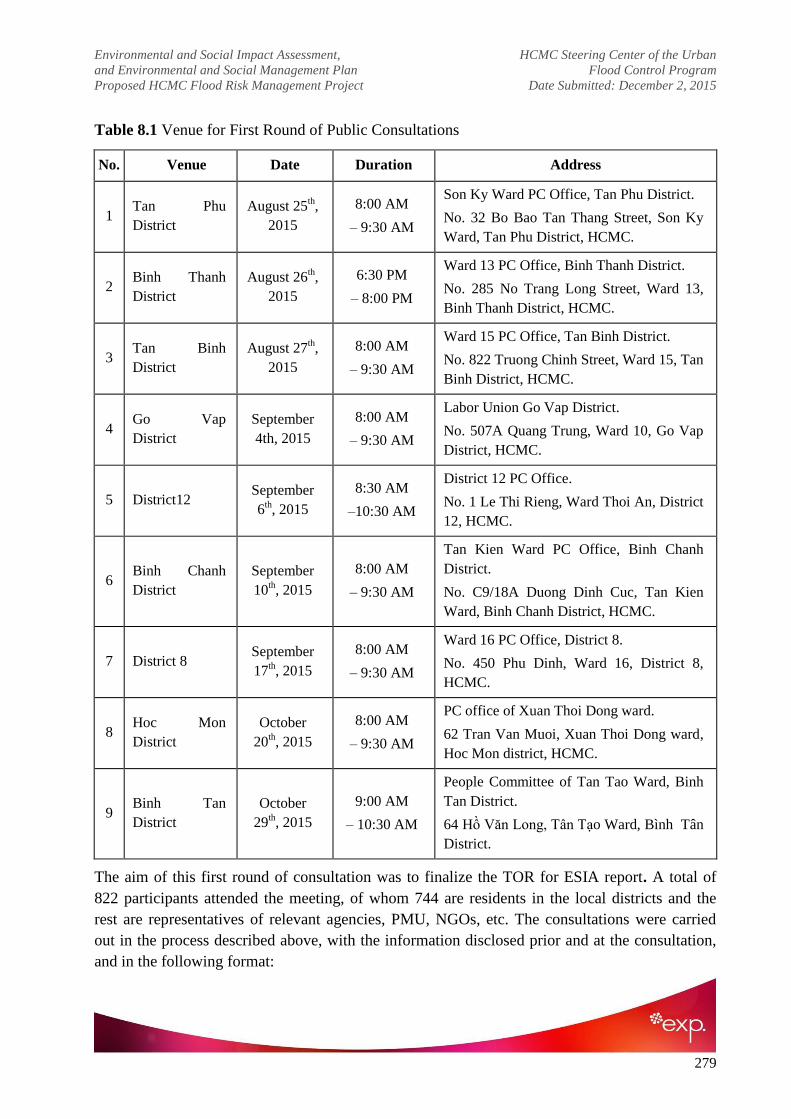
Environmental and Social Impact Assessment, HCMC Steering Center of the Urban
and Environmental and Social Management Plan Flood Control Program
Proposed HCMC Flood Risk Management Project Date Submitted: December 2, 2015
279
Table 8.1 Venue for First Round of Public Consultations
No. Venue Date Duration Address
1 Tan Phu
District
August 25th,
2015
8:00 AM
– 9:30 AM
Son Ky Ward PC Office, Tan Phu District.
No. 32 Bo Bao Tan Thang Street, Son Ky
Ward, Tan Phu District, HCMC.
2 Binh Thanh
District
August 26th,
2015
6:30 PM
– 8:00 PM
Ward 13 PC Office, Binh Thanh District.
No. 285 No Trang Long Street, Ward 13,
Binh Thanh District, HCMC.
3 Tan Binh
District
August 27th,
2015
8:00 AM
– 9:30 AM
Ward 15 PC Office, Tan Binh District.
No. 822 Truong Chinh Street, Ward 15, Tan
Binh District, HCMC.
4 Go Vap
District
September
4th, 2015
8:00 AM
– 9:30 AM
Labor Union Go Vap District.
No. 507A Quang Trung, Ward 10, Go Vap
District, HCMC.
5 District12 September
6th, 2015
8:30 AM
–10:30 AM
District 12 PC Office.
No. 1 Le Thi Rieng, Ward Thoi An, District
12, HCMC.
6 Binh Chanh
District
September
10th, 2015
8:00 AM
– 9:30 AM
Tan Kien Ward PC Office, Binh Chanh
District.
No. C9/18A Duong Dinh Cuc, Tan Kien
Ward, Binh Chanh District, HCMC.
7 District 8 September
17th, 2015
8:00 AM
– 9:30 AM
Ward 16 PC Office, District 8.
No. 450 Phu Dinh, Ward 16, District 8,
HCMC.
8 Hoc Mon
District
October
20th, 2015
8:00 AM
– 9:30 AM
PC office of Xuan Thoi Dong ward.
62 Tran Van Muoi, Xuan Thoi Dong ward,
Hoc Mon district, HCMC.
9 Binh Tan
District
October
29th, 2015
9:00 AM
– 10:30 AM
People Committee of Tan Tao Ward, Binh
Tan District.
64 Hồ Văn Long, Tân Tạo Ward, Bình Tân
District.
The aim of this first round of consultation was to finalize the TOR for ESIA report. A total of
822 participants attended the meeting, of whom 744 are residents in the local districts and the
rest are representatives of relevant agencies, PMU, NGOs, etc. The consultations were carried
out in the process described above, with the information disclosed prior and at the consultation,
and in the following format:

Environmental and Social Impact Assessment, HCMC Steering Center of the Urban
and Environmental and Social Management Plan Flood Control Program
Proposed HCMC Flood Risk Management Project Date Submitted: December 2, 2015
280
(i) Registration, distribution of brochures, questionnaires, and gifts (raincoat, pen) to
participants;
(ii) Welcome and Opening remarks by representative of EXP consultants;
(iii) Overview of the project by representative of PMU;
(iv) Brief TOR and missions of the ESIA by EXP consultant;
(v) Open Forum for Public Question and Answer session by PMU, EXP Consultants, and FS
Consultants;
(vi) Consultation closing speech by representative of PMU/District‘s representative and EXP.
In total, 323 questions, issues and concerns as well as recommendations and suggestions were
raised by the participants during the first round of consultations in four main categories: (1)
Support for the project, (2) current issues on environment and flooding, (3) clarification of
project information, and (4) suggestions and recommendations. Summary of the issues raised are
in the table below.

Environmental and Social Impact Assessment, HCMC Steering Center of the Urban
and Environmental and Social Management Plan Flood Control Program
Proposed HCMC Flood Risk Management Project Date Submitted: December 2, 2015
281
Table 8.2 Summary of first round of public consultations
No Location Number of
Participants Opinion PMU‟s reponse
1 Tan Phu
District
63
54 residents
9 PMU and
consultants
Complaints on the consequences of the canal pollution
and general environment pollution on residents‘ health
and wish the project rapid completion to address these
issues
Support project but request clarification on the project
design and how it contributes to addressing flood risks,
implementation schedule and risk of inflation.
Comments were noted and integrated into the TOR for
the ESIA.
Clarification were provided on the project design and
how it is expected to address flood risk in the project
area. The implementation schedule was explained, as
well as how contingencies have been allocated to take
into account risk of inflation.
2 Binh Thanh
District
179
170 residents
9 PMU and
consultants
Complaints on the consequences of the canal pollution
on residents‘ health and wish the project rapid
completion to address these issues
Support project but request clarification on the project
design, especially waste collection and treatment,
drainage, inclusion of Lang Canal.
Request clarification on the clearance area and project
support for relocated residents.
Comments were noted and integrated into the TOR for
the ESIA.
Clarification was provided on the project design, with
regards to waste water collection and treatment. Lang
Canal is not included in the project scope.
Area of concern by the residents will not be subject for
clearance in the project.
3 Tan Binh
District
66
55 residents
11 PMU and
consultants
Complaints on the consequences of the canal pollution
and general environment pollution on residents‘ health
and wish the project rapid completion to address these
issues
Support project but request clarification on the project
design to treat pollution in Hy Vong Canal, project
Comments were noted and integrated into the TOR for
the ESIA.
Clarification was provided on the design of Hy Vong
Canal, and project implementation schedule.

Environmental and Social Impact Assessment, HCMC Steering Center of the Urban
and Environmental and Social Management Plan Flood Control Program
Proposed HCMC Flood Risk Management Project Date Submitted: December 2, 2015
282
No Location Number of
Participants Opinion PMU‟s reponse
implementation schedule.
Express desire for the CPC to quickly resolve the
clearance and resettlement issues.
4 Go Vap
District
36
28 residents
8 PMU and
consultants
Complaints on the consequences of the canal pollution
and general environment pollution on residents‘ health
and wish the project rapid and high quality completion
to address these issues.
Support project but request clarification on the project
design to treat solid waste.
Express concerns on the households who have received
compensation are now encroaching and polluting the
canal, and on the operations of canal when completed.
Comments were noted and integrated into the TOR for
the ESIA.
Clarification was provided on the project design that
would not be included in the project scope.
Information was provided on efforts of the authority to
address re-encroachment of the canal by compensated
households.
5 District12
138
129 residents
9 PMU and
consultants
Complain about the drainage capacity leading to flood
and pollution in the area. Support addressing flood in
the central core first.
Request clarification on project design, inclusion of Cai
Liem Sluice Gate in the project, impacts of the project
when completed, relation with the TLBC Wastewater
Treatment Plant operations, and possibility to use pumps
for flood reduction. Suggest careful survey and
information dissemination before implementation.
Request clarification on the timing of the consultation
and project compensation packages
Comments were noted and integrated into the TOR for
the ESIA.
Clarification was provided on the existing investment in
Cai Liem Sluice Gate by Department of Transport, as
well as aspects of project designs and expected impacts.
Clarification was provided on the consultation schedule
and how additional information will be provided directly
to the affected households by the PMU and authority.

Environmental and Social Impact Assessment, HCMC Steering Center of the Urban
and Environmental and Social Management Plan Flood Control Program
Proposed HCMC Flood Risk Management Project Date Submitted: December 2, 2015
283
No Location Number of
Participants Opinion PMU‟s reponse
6 Binh Chanh
District
61
53 residents
8 PMU and
consultants
Complain about pollution due to industrial zones and
flooding due to underdeveloped economy, public
awareness, encroaching the river, etc.
Support project but express concerns about the long
duration of project implementation. Suggest better
design for ship-locks to facilitate traffic.
Comments were noted and integrated into the TOR for
the ESIA.
Clarification was provided on the design of the ship lock
to avoid flooding in the relevant areas.
7 District 8
104
98 residents
6 PMU and
consultants
Complain about flood situation despite previous
upgrading projects.
Request clarification on project design of embankment,
ship lock and request careful study and design for high
impact.
Suggest close coordination and information
dissemination for city residents on environment
protection.
Comments were noted and integrated into the TOR for
the ESIA.
Clarification was provided on the technical design of the
project.
8 Hoc Mon
District
110
101 residents
9 PMU and
consultants
Complain about the flooding situation in selected areas,
and consequences due to pollution, and wish the project
rapid completion to address these issues.
Comments were noted and integrated into the TOR for
the ESIA.
9 Binh Tan
District
65
57 residents
8 PMU and
consultants
Request clarification on project implementation
schedule
Propose that the sluice gate moved from Nuoc Len
bridge to the mouth of Nuoc Len Canal.
Clarification was provided on the project implementation
schedule, and on the location of the sluice gate under the
Nuoc Len bridge, assuring them that the sluice gate will
contribute to address flood risk in the area.

Environmental and Social Impact Assessment, HCMC Steering Center of the Urban
and Environmental and Social Management Plan Flood Control Program
Proposed HCMC Flood Risk Management Project Date Submitted: December 2, 2015
284
The second public consultation is planned to be carried out mid December 2015 following the
completion of this draft ESIA. The results from this consultation will be summarized into the
final version of the ESIA.
8.4. Information Disclosure
Outside the country, this draft of the ESIA report will be disclosed at the World Bank‘s InfoShop
in Washington DC by December 3, 2015. In country, ESIA report in Vietnamese will be
disclosed at the office of the relevant District People‘s Committees and on the project website.

Environmental and Social Impact Assessment, HCMC Steering Center of the Urban
and Environmental and Social Management Plan Flood Control Program
Proposed HCMC Flood Risk Management Project Date Submitted: December 2, 2015
285
ANNEX

Environmental and Social Impact Assessment, HCMC Steering Center of the Urban
and Environmental and Social Management Plan Flood Control Program
Proposed HCMC Flood Risk Management Project Date Submitted: December 2, 2015
286
ANNEX 1
MAP OF SAMPLING LOCATIONS
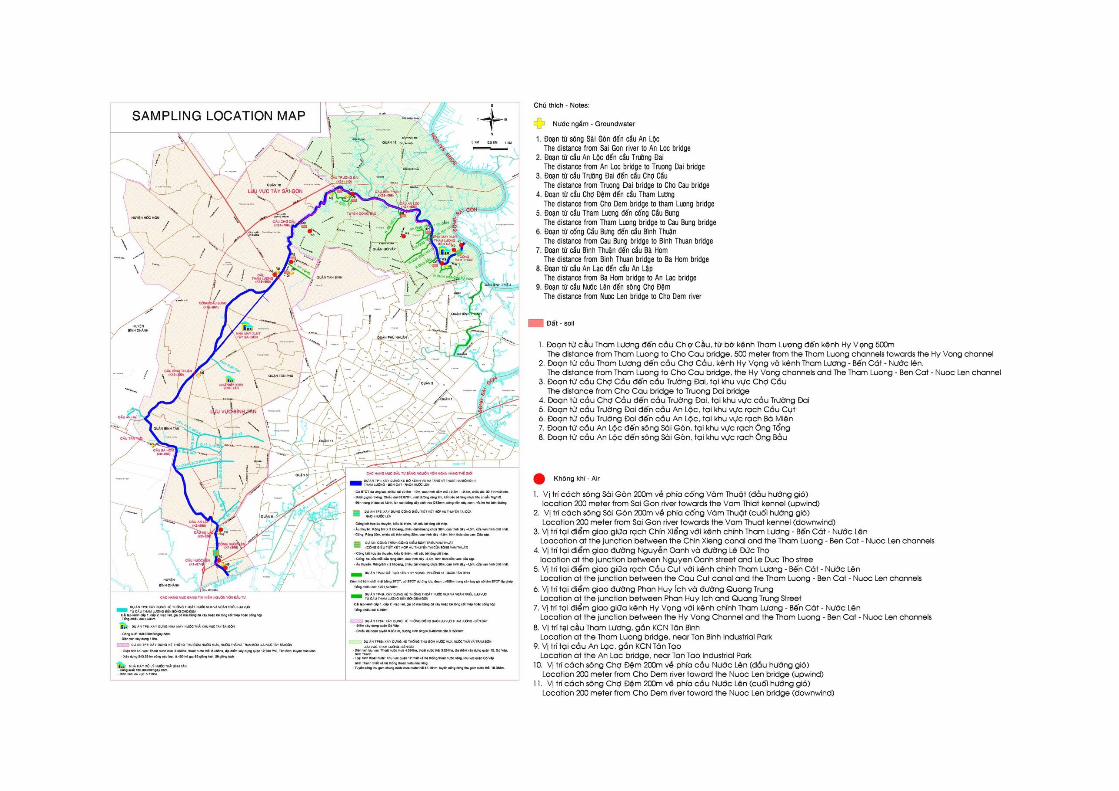

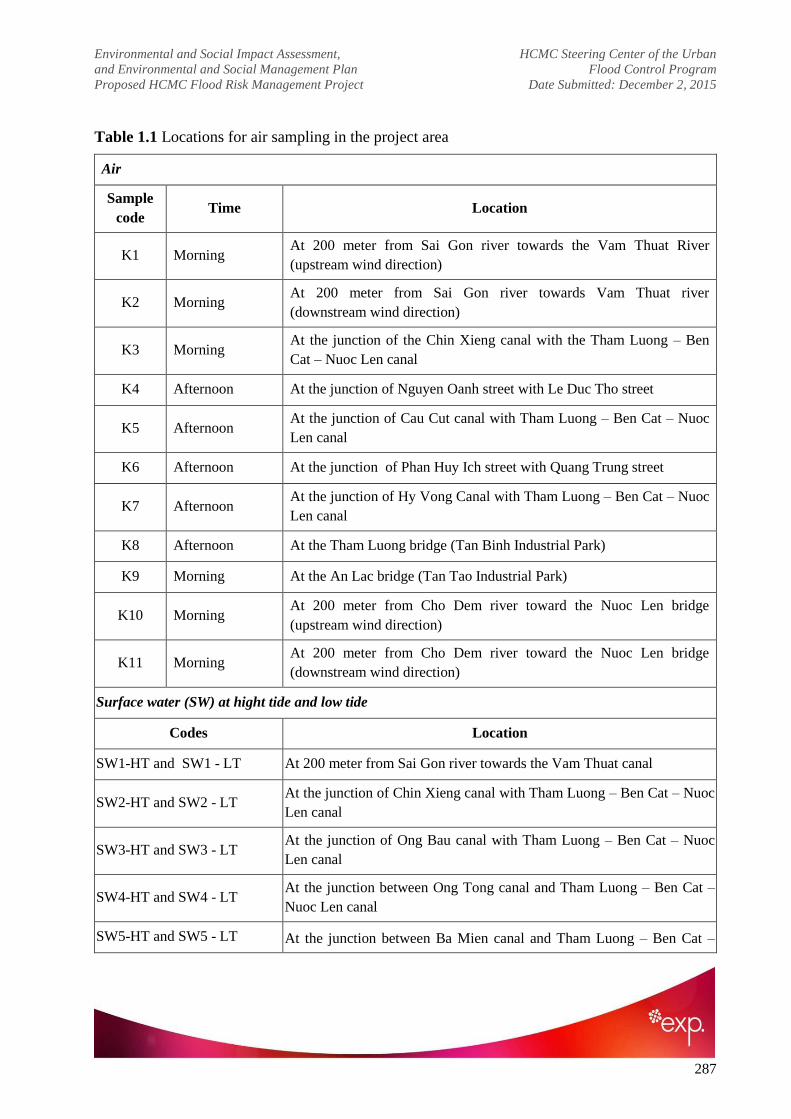
Environmental and Social Impact Assessment, HCMC Steering Center of the Urban
and Environmental and Social Management Plan Flood Control Program
Proposed HCMC Flood Risk Management Project Date Submitted: December 2, 2015
287
Table 1.1 Locations for air sampling in the project area
Air
Sample
code Time Location
K1 Morning At 200 meter from Sai Gon river towards the Vam Thuat River
(upstream wind direction)
K2 Morning At 200 meter from Sai Gon river towards Vam Thuat river
(downstream wind direction)
K3 Morning At the junction of the Chin Xieng canal with the Tham Luong – Ben
Cat – Nuoc Len canal
K4 Afternoon At the junction of Nguyen Oanh street with Le Duc Tho street
K5 Afternoon At the junction of Cau Cut canal with Tham Luong – Ben Cat – Nuoc
Len canal
K6 Afternoon At the junction of Phan Huy Ich street with Quang Trung street
K7 Afternoon At the junction of Hy Vong Canal with Tham Luong – Ben Cat – Nuoc
Len canal
K8 Afternoon At the Tham Luong bridge (Tan Binh Industrial Park)
K9 Morning At the An Lac bridge (Tan Tao Industrial Park)
K10 Morning At 200 meter from Cho Dem river toward the Nuoc Len bridge
(upstream wind direction)
K11 Morning At 200 meter from Cho Dem river toward the Nuoc Len bridge
(downstream wind direction)
Surface water (SW) at hight tide and low tide
Codes Location
SW1-HT and SW1 - LT At 200 meter from Sai Gon river towards the Vam Thuat canal
SW2-HT and SW2 - LT At the junction of Chin Xieng canal with Tham Luong – Ben Cat – Nuoc
Len canal
SW3-HT and SW3 - LT At the junction of Ong Bau canal with Tham Luong – Ben Cat – Nuoc
Len canal
SW4-HT and SW4 - LT At the junction between Ong Tong canal and Tham Luong – Ben Cat –
Nuoc Len canal
SW5-HT and SW5 - LT At the junction between Ba Mien canal and Tham Luong – Ben Cat –

Environmental and Social Impact Assessment, HCMC Steering Center of the Urban
and Environmental and Social Management Plan Flood Control Program
Proposed HCMC Flood Risk Management Project Date Submitted: December 2, 2015
288
Nuoc Len canal
SW6-HT and SW6 - LT At the junction between Cau Cut canal and Tham Luong – Ben Cat –
Nuoc Len canal
SW7-HT and SW7 - LT At the junction between the Hy Vong channel and the Tham Luong –
Ben Cat – Nuoc Len canal
SW8-HT and SW8 - LT At the Tham Luong bridge where a discharge point of Tan Binh
Industrial Park is located.
SW9-HT and SW9 - LT At the An Lac bridge (Tan Tao Industrial Park)
SW10-HT and SW10 - LT At 200 meter from Cho Dem river toward the Nuoc Len bridge
Groundwater
GW1 At Chin Xieng canal area (well (35m depth) - at Thai Son football ground – 566/45
Nguyen Thai Son Street – drilled in 2012)
GW2 At Cau Cut canal area. (household well (30m depth) at Cau Cut canal – 1396/76 Le Duc
Tho, Ward 13, Go Vap district - drilled in 1997)
GW3 At Truong Dai bridge area (well at Nam Bang company (100m depth) drilled in 2005)
GW4 At Hy Vong canal (well at wood shop (30m depth), drilled in 2012)
GW5
At Tham Luong bridge (store near Tham Luong bridge (20m depth), drilled in 2000)
GW6
At Binh Thuan bridge (well at Ms. Nguyen Thi Viet house (80m depth) – 839/5,
National Highway No.1A, Town 1, Binh Hung Hoa ward, Binh Tan District - drilled
between 2000 and 2003)
GW7
At ba Hom bridge (well at Ms.Thuan house (120m depth) – 35 Bo Song street, Town 2,
Tan Tao A ward, Binh Tan District – drilled more than 10 years ago)
GW8
An area from An Lac bridge to An Lap bridge (well at household No.1233, National
Highway No.1, An Lac ward, Binh Tan District – drilled in 2011, 140m depth)
GW9
An area from Nuoc Len bridge to Cho Dem river (well at Le Tan Be household, drilled
in 08/2015, 150m depth)
Soil
S1 At the Tham Luong canal where is of 500m from Hy Vong cannal 500m (Soil was
covered from 2013)
S2 An area from Tham Luong bridge to Cho Cau bridge, the Hy Vong canal
S3 At Cho Cau bridge area

Environmental and Social Impact Assessment, HCMC Steering Center of the Urban
and Environmental and Social Management Plan Flood Control Program
Proposed HCMC Flood Risk Management Project Date Submitted: December 2, 2015
289
S4 At Truong Dai bridge area (Soil was covered from 2012-2013)
S5 At Cau Cut canal area (Soil was covered from 2013)
S6 At Ba Mien canal area (Soil was covered from 09/2015)
S7 At Ong Tong canal area (Soil was covered from 2012-2013)
S8 At Ong Bau canal area (Soil was covered from 08/2015)
Sediment
Sed1.1(0.2m)
and Sed 1.2
(0.5m)
At 200 meter from Sai Gon river towards the Vam Thuat canal
Sed2.1, Sed2.2 At the junction of Chin Xieng canal with Tham Luong – Ben Cat – Nuoc Len canal
S3 At the junction of Ong Bau canal with Tham Luong – Ben Cat – Nuoc Len canal
S4 At the junction between Ong Tong canal and Tham Luong – Ben Cat – Nuoc Len canal
S5 At the junction between Ba Mien canal and Tham Luong – Ben Cat – Nuoc Len canal
S6 At the junction between Cau Cut canal and Tham Luong – Ben Cat – Nuoc Len canal
S7 At the junction between the Hy Vong channel and the Tham Luong – Ben Cat – Nuoc
Len canal
S8 At the Tham Luong bridge where a discharge point of Tan Binh Industrial Park is
located.
S9 At the An Lac bridge (Tan Tao Industrial Park)
S10 At 200 meter from Cho Dem river toward the Nuoc Len bridge
S11 Location of tender package 4A
S12 Location of tender package 6A
Environmental and Social Impact Assessment, HCMC Steering Center of the Urban
and Environmental and Social Management Plan Flood Control Program
Proposed HCMC Flood Risk Management Project Date Submitted: December 2, 2015
290
ANNEX 2
ANALYTICAL RESULTS
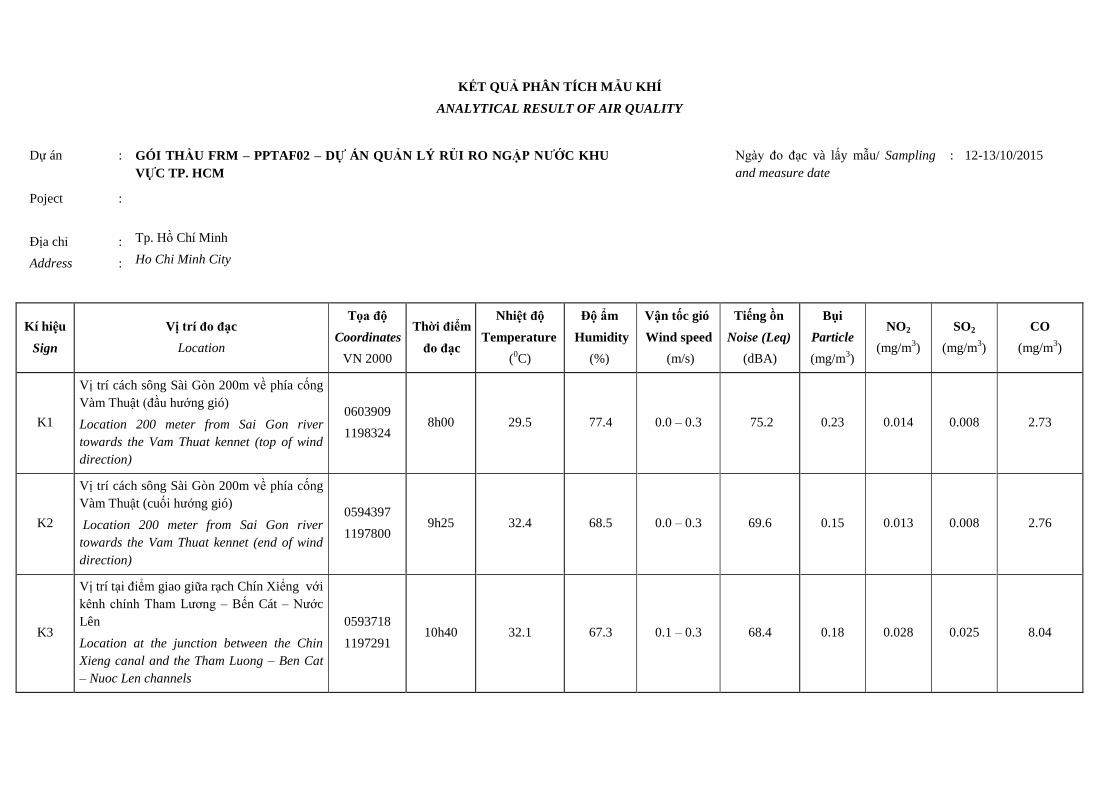
KẾT QUẢ PHÂN TÍCH MẪU KHÍ
ANALYTICAL RESULT OF AIR QUALITY
Dự án
Poject
Địa chỉ
Address
:
:
:
:
GÓI THẦU FRM – PPTAF02 – DỰ ÁN QUẢN LÝ RỦI RO NGẬP NƯỚC KHU
VỰC TP. HCM
Tp. Hồ Chí Minh
Ho Chi Minh City
Ngày đo đạc và lấy mẫu/ Sampling
and measure date
:
12-13/10/2015
Kí hiệu
Sign
Vị trí đo đạc
Location
Tọa độ
Coordinates
VN 2000
Thời điểm
đo đạc
Nhiệt độ
Temperature
(0C)
Độ ẩm
Humidity
(%)
Vận tốc gió
Wind speed
(m/s)
Tiếng ồn
Noise (Leq)
(dBA)
Bụi
Particle
(mg/m3)
NO2
(mg/m3)
SO2
(mg/m3)
CO
(mg/m3)
K1
Vị trí cách sông Sài Gòn 200m về phía cống
Vàm Thuật (đầu hướng gió)
Location 200 meter from Sai Gon river
towards the Vam Thuat kennet (top of wind
direction)
0603909
1198324 8h00 29.5 77.4 0.0 – 0.3 75.2 0.23 0.014 0.008 2.73
K2
Vị trí cách sông Sài Gòn 200m về phía cống
Vàm Thuật (cuối hướng gió)
Location 200 meter from Sai Gon river
towards the Vam Thuat kennet (end of wind
direction)
0594397
1197800 9h25 32.4 68.5 0.0 – 0.3 69.6 0.15 0.013 0.008 2.76
K3
Vị trí tại điểm giao giữa rạch Chín Xiểng với
kênh chính Tham Lương – Bến Cát – Nước
Lên
Location at the junction between the Chin
Xieng canal and the Tham Luong – Ben Cat
– Nuoc Len channels
0593718
1197291 10h40 32.1 67.3 0.1 – 0.3 68.4 0.18 0.028 0.025 8.04

Kí hiệu
Sign
Vị trí đo đạc
Location
Tọa độ
Coordinates
VN 2000
Thời điểm
đo đạc
Nhiệt độ
Temperature
(0C)
Độ ẩm
Humidity
(%)
Vận tốc gió
Wind speed
(m/s)
Tiếng ồn
Noise (Leq)
(dBA)
Bụi
Particle
(mg/m3)
NO2
(mg/m3)
SO2
(mg/m3)
CO
(mg/m3)
K4
Vị trí tại điểm giao đường Nguyễn Oanh và
đường Lê Đức Thọ
Location at the junction between Nguyen
Oanh street anh Le Duc Tho street
0601090
1198763 14h05 31.2 67.9 0.1 – 0.2 81.3 0.33 0.047 0.026 9.78
K5
Vị trí tại điểm giao giữa rạch Cầu Cụt với
kênh chính Tham Lương – Bến Cát – Nước
Lên
Location at the junction between the cau Cut
canal and the Tham Luong – Ben Cat – Nuoc
Len channels
0589803
1200432 15h40 30.2 65.7 0.0 – 0.3 65.1 0.12 0.026 0.019 6.24
K6
Vị trí tại điểm giao đường Phan Huy Ích và
đường Quang Trung
Location at the junction between Phan Huy
Ich and Quang Trung street
0597149
1198972 16h40 31.2 62.7 0.1 – 0.2 81.0 0.31 0.053 0.043 15.05
K7
Vị trí tại điểm giao giữa kênh Hy Vọng với
kênh chính Tham Lương – Bến Cát – Nước
Lên
Location at the junction between the Hy
Vong Channal and the Tham Luong – Ben
Cat – Nuoc Len
0596141
1197414 17h30 31.2 65.1 0.1 – 0.3 72.0 0.10 0.014 0.013 3.63
K8
Vị trí tại cầu Tham Lương (KCN Tân Bình)
Location at the Tham Luong bridge (Tan
Binh Industrial Park)
0595788
1196897 16h00 30.4 67.2 0.1 – 0.4 77.9 0.38 0.028 0.023 8.00
K9
Vị trí tại cầu An Lạc (KCN Tân Tạo)
Location at the An Lac bridge (Tan Tao
Industrial Park)
0593008
1186082 10h05 30.3 69.4 0.0 – 0.3 75.0 0.14 0.028 0.022 7.12
K10 Vị trí cách sông Chợ Đệm 200m về phía cầu 0593218 7h15 29.9 67.4 0.0 – 0.4 70.1 0.10 0.023 0.020 7.11

Kí hiệu
Sign
Vị trí đo đạc
Location
Tọa độ
Coordinates
VN 2000
Thời điểm
đo đạc
Nhiệt độ
Temperature
(0C)
Độ ẩm
Humidity
(%)
Vận tốc gió
Wind speed
(m/s)
Tiếng ồn
Noise (Leq)
(dBA)
Bụi
Particle
(mg/m3)
NO2
(mg/m3)
SO2
(mg/m3)
CO
(mg/m3)
Nước Lên (đầu hướng gió)
Location 200 meter from Cho Dem river
toward the Nuoc Len bridge (top of wind
direction)
1185401
K11
Vị trí cách sông Chợ Đệm 200m về phía cầu
Nước Lên (cuối hướng gió)
Location 200 meter from Cho Dem river
toward the Nuoc Len bridge (end of wind
direction)
0593237
1184978 8h25 29.8 65.7 0.1 – 0.2 70.0 0.14 0.025 0.024 7.11
QCVN 05:2013/BTNMT (trung bình 1 giờ)
QCVN 05:2013/BTNMT (average 1 hour) - - - - 0,3 0,2 0,35 30
QCVN 26:2010/BTNMT (từ 6h - 21h)
QCVN 26:2010/BTNMT (from 6h to 21h) - - - 70 - - - -
Phương pháp đo đạc/phân tích
Measuring/Analyzing methods
TCVN
5508:2009 ()
Đo bằng máy
đo vận tốc gió
Tubor, Mỹ
TCVN
7878-
2:2010 ()
TCVN
5067 –
1995 ()
MASA
406
(1988)
()
MASA
704A
(1988)
()
52TCN
352 – 89
Ghi chú/Note:
() phương pháp đo đạc/phân tích được VILAS công nhận/() measuring/analyzing method is accredited by VILAS.
QCVN 05:2013/BTNMT (Quy chuẩn kỹ thuật quốc gia về chất lượng không khí xung quanh)/QCVN 05:2013/BTNMT (National technical regulation on ambient air quality).
QCVN 26:2010/BTNMT (Quy chuẩn kỹ thuật quốc gia về tiếng ồn)/QCVN 26:2010 /BTNMT (National technical regulation on noise).
KPH: không phát hiện/ND: not delected.
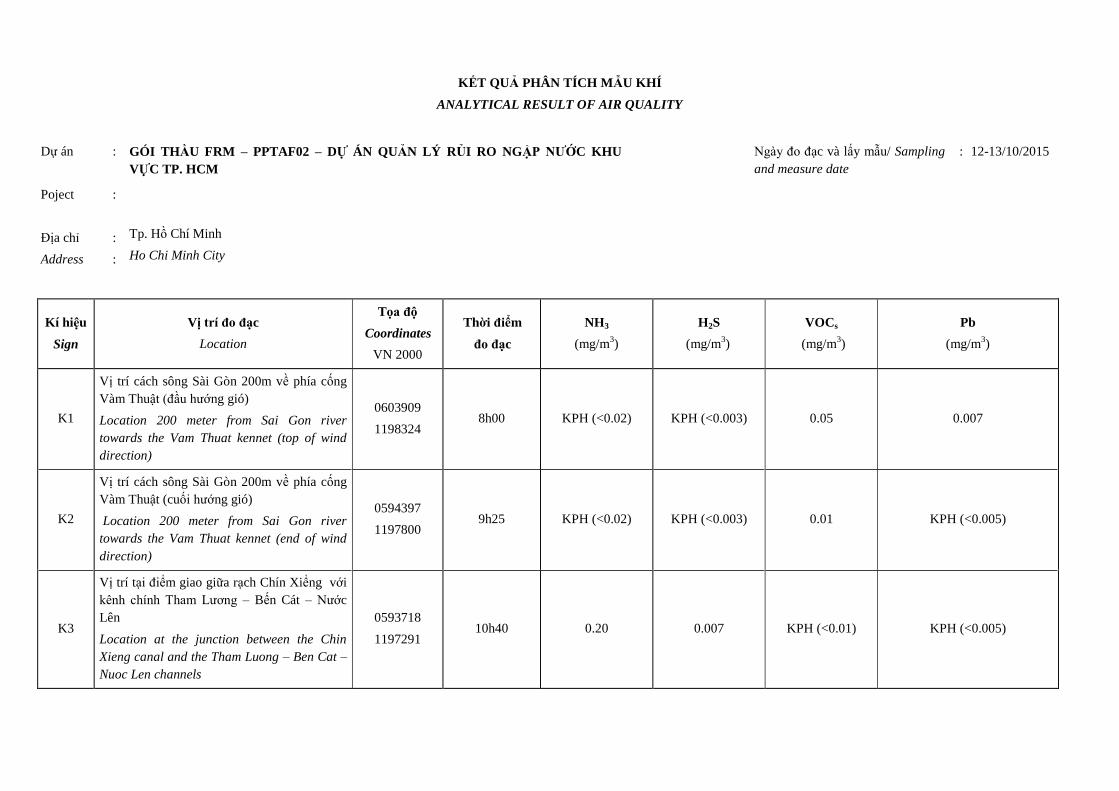
KẾT QUẢ PHÂN TÍCH MẪU KHÍ
ANALYTICAL RESULT OF AIR QUALITY
Dự án
Poject
Địa chỉ
Address
:
:
:
:
GÓI THẦU FRM – PPTAF02 – DỰ ÁN QUẢN LÝ RỦI RO NGẬP NƯỚC KHU
VỰC TP. HCM
Tp. Hồ Chí Minh
Ho Chi Minh City
Ngày đo đạc và lấy mẫu/ Sampling
and measure date
:
12-13/10/2015
Kí hiệu
Sign
Vị trí đo đạc
Location
Tọa độ
Coordinates
VN 2000
Thời điểm
đo đạc
NH3
(mg/m3)
H2S
(mg/m3)
VOCs
(mg/m3)
Pb
(mg/m3)
K1
Vị trí cách sông Sài Gòn 200m về phía cống
Vàm Thuật (đầu hướng gió)
Location 200 meter from Sai Gon river
towards the Vam Thuat kennet (top of wind
direction)
0603909
1198324 8h00 KPH (<0.02) KPH (<0.003) 0.05 0.007
K2
Vị trí cách sông Sài Gòn 200m về phía cống
Vàm Thuật (cuối hướng gió)
Location 200 meter from Sai Gon river
towards the Vam Thuat kennet (end of wind
direction)
0594397
1197800 9h25 KPH (<0.02) KPH (<0.003) 0.01 KPH (<0.005)
K3
Vị trí tại điểm giao giữa rạch Chín Xiểng với
kênh chính Tham Lương – Bến Cát – Nước
Lên
Location at the junction between the Chin
Xieng canal and the Tham Luong – Ben Cat –
Nuoc Len channels
0593718
1197291 10h40 0.20 0.007 KPH (<0.01) KPH (<0.005)

Kí hiệu
Sign
Vị trí đo đạc
Location
Tọa độ
Coordinates
VN 2000
Thời điểm
đo đạc
NH3
(mg/m3)
H2S
(mg/m3)
VOCs
(mg/m3)
Pb
(mg/m3)
K4
Vị trí tại điểm giao đường Nguyễn Oanh và
đường Lê Đức Thọ
Location at the junction between Nguyen
Oanh street anh Le Duc Tho street
0601090
1198763 14h05 0.03 KPH (<0.003) KPH (<0.01) KPH (<0.005)
K5
Vị trí tại điểm giao giữa rạch Cầu Cụt với
kênh chính Tham Lương – Bến Cát – Nước
Lên
Location at the junction between the cau Cut
canal and the Tham Luong – Ben Cat – Nuoc
Len channels
0589803
1200432 15h40 0.06 KPH (<0.003) KPH (<0.01) KPH (<0.005)
K6
Vị trí tại điểm giao đường Phan Huy Ích và
đường Quang Trung
Location at the junction between Phan Huy
Ich and Quang Trung street
0597149
1198972 16h40 0.02 KPH (<0.003) KPH (<0.01) KPH (<0.005)
K7
Vị trí tại điểm giao giữa kênh Hy Vọng với
kênh chính Tham Lương – Bến Cát – Nước
Lên
Location at the junction between the Hy Vong
Channal and the Tham Luong – Ben Cat –
Nuoc Len
0596141
1197414 17h30 KPH (<0.02) KPH (<0.003) 0.03 KPH (<0.005)
K8
Vị trí tại cầu Tham Lương (KCN Tân Bình)
Location at the Tham Luong bridge (Tan Binh
Industrial Park)
0595788
1196897 16h00 0.02 KPH (<0.003) 0.02 KPH (<0.005)
K9
Vị trí tại cầu An Lạc (KCN Tân Tạo)
Location at the An Lac bridge (Tan Tao
Industrial Park)
0593008
1186082 10h05 0.02 KPH (<0.003) 0.02 KPH (<0.005)
K10 Vị trí cách sông Chợ Đệm 200m về phía cầu 0593218 7h15 KPH (<0.02) KPH (<0.003) 0.02 KPH (<0.005)

Kí hiệu
Sign
Vị trí đo đạc
Location
Tọa độ
Coordinates
VN 2000
Thời điểm
đo đạc
NH3
(mg/m3)
H2S
(mg/m3)
VOCs
(mg/m3)
Pb
(mg/m3)
Nước Lên (đầu hướng gió)
Location 200 meter from Cho Dem river
toward the Nuoc Len bridge (top of wind
direction)
1185401
K11
Vị trí cách sông Chợ Đệm 200m về phía cầu
Nước Lên (cuối hướng gió)
Location 200 meter from Cho Dem river
toward the Nuoc Len bridge (end of wind
direction)
0593237
1184978 8h25 0.14 0.005 0.02 KPH (<0.005)
QCVN 06:2009/BTNMT (trung bình 1 giờ)
QCVN 06:2009/BTNMT (average 1 hour) 0,20 0,042 - -
Phương pháp đo đạc/phân tích
Measuring/Analyzing methods MASA 401 MASA 701 NIOSH 1501
Technical normal rule &
SMEWW 3120 B (2012)
Ghi chú/Note:
() phương pháp đo đạc/phân tích được VILAS công nhận/() measuring/analyzing method is accredited by VILAS.
QCVN 06:2009/BTNMT (Quy chuẩn kỹ thuật quốc gia về một số chất độc hại trong không khí xung quanh)/QCVN 06:2009/BTNMT (National technical regulation on hazardous
substances in ambient air).
KPH: không phát hiện/ ND: not delected.

KẾT QUẢ PHÂN TÍCH MẪU
ANALYZING RESULT OF SAMPLE
Số phiếu/ No: BN1041015 – MS/Code 1510.0318-0320-0322-0324-0326
Dự án
Project
Ký hiệu mẫu
Type of sample
:
:
:
:
GÓI THẦU FRM – PPTAF02 – DỰ ÁN QUẢN LÝ RỦI RO NGẬP NƯỚC
CHO KHU VỰC TP.HCM
Nước mặt – Triều cường
Surface water – High tide
Ngày lấy mẫu/
Sampling date
:
12-13/10/2015
Stt
No.
Chỉ tiêu
Parameter
Đơn vị
Unit
SW1-HT
1510.0318
SW2-HT
1510.0320
SW3-HT
1510.0322
SW4-HT
1510.0324
SW5-HT
1510.0326
QCVN
08:2008/BTNMT
Phương pháp đo đạc/
phân tích
Measuring/Analyzing
method Level B1 Level B2
1 pH, at 25oC - 6.61 6.63 6.63 6.35 7.06 5.5 – 9 5.5 – 9
TCVN 6492:2011 ()
(ISO 10523:2008)
2 Độ cứng tổng/
Total hardness mgCaCO3/l 6 6 8 8 36 - - SMEWW 2340 C (2012)
3 Độ đục/
Turbidity NTU 57.6 33.9 51.9 45.0 49.9 - -
SMEWW 2130 B (2012)
()
4 Độ màu/ Color Pt-Co 39 32 97 41 69 - - SMEWW 2120 C (2012)
5 DO mgO2/l 1.02 0.58 0.20 1.20 0.14 ≥ 4 ≥ 2 SMEWW 4500-O.G
(2012) ()
6 TSS mg/l 68 35 53 50 53 ≤ 50 ≤ 100 SMEWW 2540 D
(2012) ()
7 TDS mg/l 90 85 300 80 280 - - SMEWW 2540 C (2012)

Stt
No.
Chỉ tiêu
Parameter
Đơn vị
Unit
SW1-HT
1510.0318
SW2-HT
1510.0320
SW3-HT
1510.0322
SW4-HT
1510.0324
SW5-HT
1510.0326
QCVN
08:2008/BTNMT
Phương pháp đo đạc/
phân tích
Measuring/Analyzing
method Level B1 Level B2
8 COD mgO2/l 21 16 161 14 52 ≤ 30 ≤ 50 SMEWW 5220C (2012)
9 BOD5 mgO2/l 14 5 126 5 24 ≤ 15 ≤ 25 SMEWW 5210 B (2012)
()
10 N-NH4+ mg/l 1.5 1.4 13.4 1.2 14.0 ≤ 0.5 ≤ 1
SMEWW 4500-NH4+
.C
(2012) () &
SMEWW 4500-NH4+
.F
(2012) ()
11 Cl-
mg/l 21.1 18.8 61.9 17.5 51.6 ≤ 600 - SMEWW 4110 B (2012)
()
12 F-
mg/l 0.31 0.13 0.23 0.16 0.31 ≤ 1.5 ≤ 2 SMEWW 4110 B (2012)
()
13 N-NO2-
mg/l 0.23 0.13
KPH/ND
(LOD =
0.003)
0.15
KPH/ND
(LOD =
0.003)
≤ 0.04 ≤ 0.05 SMEWW 4110 B (2012)
()
14 N-NO3-
mg/l 0.38 0.36
KPH/ND
(LOD =
0.015)
0.37
KPH/ND
(LOD =
0.015)
≤ 10 ≤ 15 SMEWW 4110 B (2012)
()
15 SO42-
mg/l 34.4 33.8 38.1 33.5 63.3 - - SMEWW 4110 B (2012)
()
16 P-PO43-
mg/l 0.07 0.08 0.79 0.11 0.72 ≤ 0.3 ≤ 0.5 SMEWW 4500-P&D
(2012) ()
17 As mg/l
KPH/ND
(LOD =
0.004)
KPH/ND
(LOD =
0.004)
KPH/ND
(LOD =
0.004)
KPH/ND
(LOD =
0.004)
KPH/ND
(LOD =
0.004)
≤ 0.05 ≤ 0.1 SMEWW 3120 B (2012)
()
18 Cd mg/l KPH/ND KPH/ND KPH/ND KPH/ND KPH/ND ≤ 0.01 ≤ 0.01 SMEWW 3120 B (2012)

Stt
No.
Chỉ tiêu
Parameter
Đơn vị
Unit
SW1-HT
1510.0318
SW2-HT
1510.0320
SW3-HT
1510.0322
SW4-HT
1510.0324
SW5-HT
1510.0326
QCVN
08:2008/BTNMT
Phương pháp đo đạc/
phân tích
Measuring/Analyzing
method Level B1 Level B2
(LOD =
0.003)
(LOD =
0.003)
(LOD =
0.003)
(LOD =
0.003)
(LOD =
0.003)
()
19 Pb mg/l
KPH/ND
(LOD =
0.005)
KPH/ND
(LOD =
0.005)
KPH/ND
(LOD =
0.005)
KPH/ND
(LOD =
0.005)
KPH/ND
(LOD =
0.005)
≤ 0.05 ≤ 0.05 SMEWW 3120 B (2012)
()
20 Cr
mg/l
KPH/ND
(LOD =
0.003)
KPH/ND
(LOD =
0.003)
KPH/ND
(LOD =
0.003)
KPH/ND
(LOD =
0.003)
0.005 - - SMEWW 3120 B (2012)
()
21 Cu mg/l 0.011 0.004 0.094
KPH/ND
(LOD =
0.005)
0.011 ≤ 0.5 ≤ 1 SMEWW 3120 B (2012)
()
22 Zn mg/l
KPH/ND
(LOD =
0.005)
KPH/ND
(LOD =
0.005)
KPH/ND
(LOD =
0.005)
KPH/ND
(LOD =
0.005)
KPH/ND
(LOD =
0.005)
≤ 1.5 ≤ 2 SMEWW 3120 B (2012)
()
23 Mn mg/l 0.127 0.109 0.092 0.116 0.247 - - SMEWW 3120 B (2012)
()
24 Fe mg/l 2.02 1.59 1.13 2.29 2.26 ≤ 1.5 ≤ 2 SMEWW 3120 B (2012)
()
25 Hg mg/l
KPH/ND
(LOD =
0.001)
KPH/ND
(LOD =
0.001)
KPH/ND
(LOD =
0.001)
KPH/ND
(LOD =
0.001)
KPH/ND
(LOD =
0.001)
≤ 0.001 ≤ 0.002 SMEWW 3120 B (2012)
26 Dầu. mỡ/
Oil & grease mg/l
KPH/ND
(LOD = 0.1)
KPH/ND
(LOD = 0.1) 0.5
KPH/ND
(LOD = 0.1) 0.2 ≤ 0.1 ≤ 0.3 SMEWW 5520 C (2012)
27 E. Coli MPN/100ml 9300 24×103
93×104
24×103 93×10
3 ≤ 100 ≤ 200 SMEWW 9221 F (2012)
28 Coliform MPN/100ml 24×103
93×103
43×105
43×103 24×10
5 ≤ 7500 ≤ 10000 SMEWW 9221 D

Stt
No.
Chỉ tiêu
Parameter
Đơn vị
Unit
SW1-HT
1510.0318
SW2-HT
1510.0320
SW3-HT
1510.0322
SW4-HT
1510.0324
SW5-HT
1510.0326
QCVN
08:2008/BTNMT
Phương pháp đo đạc/
phân tích
Measuring/Analyzing
method Level B1 Level B2
(2012)
Ghi chú/Note:
Phương pháp lấy mẫu nước mặt/Surface sampling: TCVN 6663-6:2008 (ISO 5667-
6:2005)
() Phương pháp đo đạc/phân tích được VILAS công nhận/ Measuring/analyzing method
is accredited by VILAS.
QCVN 08:2008/BTNMT: Quy chuẩn kỹ thuật quốc gia về chất lượng nước mặt/ National
technical regulation on surface water quality.
KPH: Không phát hiện. LOD: Giới hạn phát hiện của phương pháp đo đạc/phân tích./
ND: Not detected. LOD: Limit of detection
SW1-HT: Vị trí cách sông Sài Gòn 200m về phía cống Vàm Thuật/ Location 200 meter
from Sai Gon river towards the Vam Thuat canal.(0603441;1197897)
SW2-HT: Vị trí tại điểm giao giữa rạch Chín Xiểng với kênh chính Tham Lương – Bến
Cát – Nước Lên/ Location at the junction between the Chin Xieng canal and the Tham
Luong – Ben Cat – Nuoc Len channels (0602849;1197393)
SW3-HT: Vị trí tại điểm giao giữa rạch Ông Bầu với kênh chính Tham Lương – Bến Cát –
Nước Lên/ Location at the junction between the Ong Bau canal and the Tham Luong –
Ben Cat – Nuoc Len channels (0602742;1197488)
SW4-HT: Vị trí tại điểm giao giữa rạch Ông Tổng với kênh chính Tham Lương – Bến Cát
– Nước Lên/ Location at the junction between the Ong Tong canal and the Tham Luong –
Ben Cat – Nuoc Len channels (0602361;1198764)
SW5-HT: Vị trí tại điểm giao giữa rạch Bà Miên với kênh chính Tham Lương – Bến Cát –
Nước Lên/ Location at the junction between the Ba Mien canal and the Tham Luong – Ben
Cat – Nuoc Len channels (0601002;1199835)
HT: Triều cường/ High tide

KẾT QUẢ PHÂN TÍCH MẪU
ANALYZING RESULT OF SAMPLE
Số phiếu/ No: BN1041015-1151015 – MS/Code 1510.0328-0330-0332-0380-0382
Dự án
Project
Ký hiệu mẫu
Type of sample
:
:
:
:
GÓI THẦU FRM – PPTAF02 – DỰ ÁN QUẢN LÝ RỦI RO NGẬP NƯỚC
CHO KHU VỰC TP.HCM
Nước mặt – Triều cường
Surface water – High tide
Ngày lấy mẫu/
Sampling date
:
12-13/10/2015
Stt
No.
Chỉ tiêu
Parameter
Đơn vị
Unit
SW6-HT
1510.0328
SW7-HT
1510.0330
SW8-HT
1510.0332
SW9-HT
1510.0382
SW10-HT
1510.0380
QCVN
08:2008/BTNMT
Phương pháp đo đạc/
phân tích
Measuring/Analyzing
method Level B1 Level B2
1 pH, at 25oC - 7.12 7.08 7.24 6.99 7.00 5.5 – 9 5.5 – 9
TCVN 6492:2011 ()
(ISO 10523:2008)
2 Độ cứng tổng/
Total hardness mgCaCO3/l 68 36 56 120 118 - - SMEWW 2340 C (2012)
3 Độ đục/
Turbidity NTU 66.3 55.6 41.2 43.4 65.4 - -
SMEWW 2130 B (2012)
()
4 Độ màu/ Color Pt-Co 95 106 125 34 29 - - SMEWW 2120 C (2012)
5 DO mgO2/l 0.07 0.08 0.09 0.35 0.08 ≥ 4 ≥ 2 SMEWW 4500-O.G
(2012) ()
6 TSS mg/l 93 38 28 42 59 ≤ 50 ≤ 100 SMEWW 2540 D
(2012) ()
7 TDS mg/l 310 350 470 380 490 - - SOP-HTN06
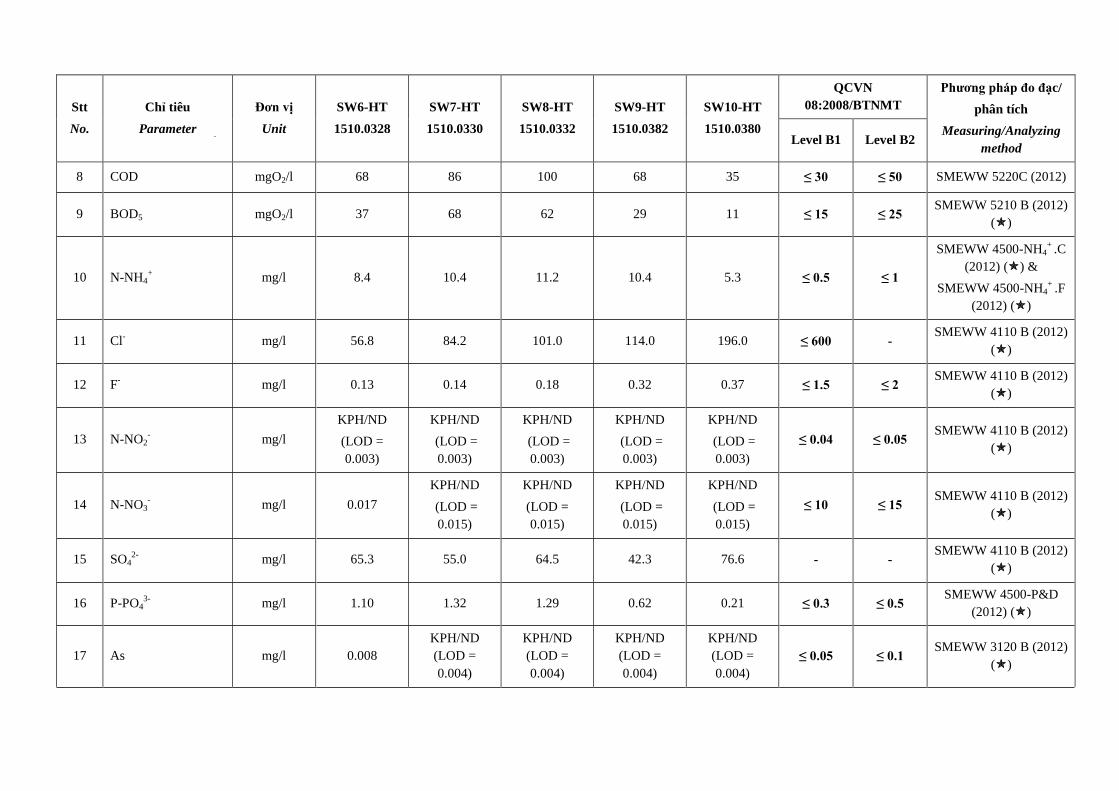
Stt
No.
Chỉ tiêu
Parameter
Đơn vị
Unit
SW6-HT
1510.0328
SW7-HT
1510.0330
SW8-HT
1510.0332
SW9-HT
1510.0382
SW10-HT
1510.0380
QCVN
08:2008/BTNMT
Phương pháp đo đạc/
phân tích
Measuring/Analyzing
method Level B1 Level B2
8 COD mgO2/l 68 86 100 68 35 ≤ 30 ≤ 50 SMEWW 5220C (2012)
9 BOD5 mgO2/l 37 68 62 29 11 ≤ 15 ≤ 25 SMEWW 5210 B (2012)
()
10 N-NH4+ mg/l 8.4 10.4 11.2 10.4 5.3 ≤ 0.5 ≤ 1
SMEWW 4500-NH4+
.C
(2012) () &
SMEWW 4500-NH4+
.F
(2012) ()
11 Cl-
mg/l 56.8 84.2 101.0 114.0 196.0 ≤ 600 - SMEWW 4110 B (2012)
()
12 F-
mg/l 0.13 0.14 0.18 0.32 0.37 ≤ 1.5 ≤ 2 SMEWW 4110 B (2012)
()
13 N-NO2-
mg/l
KPH/ND
(LOD =
0.003)
KPH/ND
(LOD =
0.003)
KPH/ND
(LOD =
0.003)
KPH/ND
(LOD =
0.003)
KPH/ND
(LOD =
0.003)
≤ 0.04 ≤ 0.05 SMEWW 4110 B (2012)
()
14 N-NO3-
mg/l 0.017
KPH/ND
(LOD =
0.015)
KPH/ND
(LOD =
0.015)
KPH/ND
(LOD =
0.015)
KPH/ND
(LOD =
0.015)
≤ 10 ≤ 15 SMEWW 4110 B (2012)
()
15 SO42-
mg/l 65.3 55.0 64.5 42.3 76.6 - - SMEWW 4110 B (2012)
()
16 P-PO43-
mg/l 1.10 1.32 1.29 0.62 0.21 ≤ 0.3 ≤ 0.5 SMEWW 4500-P&D
(2012) ()
17 As mg/l 0.008
KPH/ND
(LOD =
0.004)
KPH/ND
(LOD =
0.004)
KPH/ND
(LOD =
0.004)
KPH/ND
(LOD =
0.004)
≤ 0.05 ≤ 0.1 SMEWW 3120 B (2012)
()

Stt
No.
Chỉ tiêu
Parameter
Đơn vị
Unit
SW6-HT
1510.0328
SW7-HT
1510.0330
SW8-HT
1510.0332
SW9-HT
1510.0382
SW10-HT
1510.0380
QCVN
08:2008/BTNMT
Phương pháp đo đạc/
phân tích
Measuring/Analyzing
method Level B1 Level B2
18 Cd mg/l
KPH/ND
(LOD =
0.003)
KPH/ND
(LOD =
0.003)
KPH/ND
(LOD =
0.003)
KPH/ND
(LOD =
0.003)
KPH/ND
(LOD =
0.003)
≤ 0.01 ≤ 0.01 SMEWW 3120 B (2012)
()
19 Pb mg/l
KPH/ND
(LOD =
0.005)
KPH/ND
(LOD =
0.005)
KPH/ND
(LOD =
0.005)
KPH/ND
(LOD =
0.005)
KPH/ND
(LOD =
0.005)
≤ 0.05 ≤ 0.05 SMEWW 3120 B (2012)
()
20 Cr
mg/l 0.010 0.010 0.023 0.028 0.005 - - SMEWW 3120 B (2012)
()
21 Cu mg/l 0.013 0.014 0.012 0.038
KPH/ND
(LOD =
0.005)
≤ 0.5 ≤ 1 SMEWW 3120 B (2012)
()
22 Zn mg/l 0.020
KPH/ND
(LOD =
0.005)
0.015 0.034
KPH/ND
(LOD =
0.005)
≤ 1.5 ≤ 2 SMEWW 3120 B (2012)
()
23 Mn mg/l 0.279 0.258 0.293 0.477 0.557 - - SMEWW 3120 B (2012)
()
24 Fe mg/l 3.81 1.92 1.89 2.47 3.81 ≤ 1.5 ≤ 2 SMEWW 3120 B (2012)
()
25 Hg mg/l
KPH/ND
(LOD =
0.001)
KPH/ND
(LOD =
0.001)
KPH/ND
(LOD =
0.001)
KPH/ND
(LOD =
0.001)
KPH/ND
(LOD =
0.001)
≤ 0.001 ≤ 0.002 SMEWW 3120 B (2012)
26 Dầu. mỡ/
Oil & grease mg/l 0.2 0.3 0.3 0.2
KPH/ND
(LOD = 0.1) ≤ 0.1 ≤ 0.3 SMEWW 5520 C (2012)
27 E. Coli MPN/100ml 24×103 93×10
4 24×10
5 24×10
4 9300 ≤ 100 ≤ 200 SMEWW 9221 F (2012)
28 Coliform MPN/100ml 24×104 93×10
5 93×10
5 93×10
4 43×10
3 ≤ 7500 ≤ 10000 SMEWW 9221 D

Stt
No.
Chỉ tiêu
Parameter
Đơn vị
Unit
SW6-HT
1510.0328
SW7-HT
1510.0330
SW8-HT
1510.0332
SW9-HT
1510.0382
SW10-HT
1510.0380
QCVN
08:2008/BTNMT
Phương pháp đo đạc/
phân tích
Measuring/Analyzing
method Level B1 Level B2
(2012)
Ghi chú/Note:
Phương pháp lấy mẫu nước mặt/Surface sampling: TCVN 6663-6:2008 (ISO 5667- 6:2005
() Phương pháp đo đạc/phân tích được VILAS công nhận/ Measuring/analyzing method
is accredited by VILAS.
QCVN 08:2008/BTNMT: Quy chuẩn kỹ thuật quốc gia về chất lượng nước mặt/ National
technical regulation on surface water quality.
KPH: Không phát hiện. LOD: Giới hạn phát hiện của phương pháp đo đạc/phân tích./
ND: Not detected. LOD: Limit of detection
SW6-HT: Vị trí tại điểm giao giữa rạch Cầu Cụt với kênh chính Tham Lương – Bến Cát –
Nước Lên/ Location at the junction between the Cau Cut canal and the Tham Luong – Ben
Cat – Nuoc Len channels (0598939;1200474)
SW7-HT: Vị trí tại điểm giao giữa kênh Hy Vọng với kênh chính Tham Lương – Bến Cát –
Nước Lên/ Location at the junction between the Hy Vong channel and the Tham Luong –
Ben Cat – Nuoc Len channels.(0596170;1197484)
SW8-HT: Vị trí tại cầu Tham Lương. sau điểm xả nước thải của KCN Tân Bình/ Location
at the Tham Luong bridge, after the discharging point of Tan Binh Industrial
Park.(0595884;1196999)
SW9-HT: Vị trí tại cầu An Lạc / Location at the An Lac bridge.(0593163;1186046)
SW10-HT: Vị trí cách sông Chợ Đệm 200m về phía cầu Nước Lên/ Location 200 meter
from Cho Dem river toward the Nuoc Len bridge.(0593205;1184253)
HT: Triều cường/ High tide

KẾT QUẢ PHÂN TÍCH MẪU
ANALYZING RESULT OF SAMPLE
Số phiếu/ No: BN1041015 – MS/Code 1510.0319-0321-0323-0325-0327
Dự án
Project
Ký hiệu mẫu
Type of sample
:
:
:
:
GÓI THẦU FRM – PPTAF02 – DỰ ÁN QUẢN LÝ RỦI RO NGẬP NƯỚC
CHO KHU VỰC TP.HCM
Nước mặt – Triều kiệt
Surface water – Low tide
Ngày lấy mẫu/
Sampling date
:
12-13/10/2015
Stt
No.
Chỉ tiêu
Parameter
Đơn vị
Unit
SW1-LT
1510.0319
SW2-LT
1510.0321
SW3-LT
1510.0323
SW4-LT
1510.0325
SW5-LT
1510.0327
QCVN
08:2008/BTNMT
Phương pháp đo đạc/
phân tích
Measuring/Analyzing
method Level B1 Level B2
1 pH, at 25oC - 6.60 6.89 6.60 7.05 7.07 5.5 – 9 5.5 – 9
TCVN 6492:2011 ()
(ISO 10523:2008)
2 Độ cứng tổng/
Total hardness mgCaCO3/l 6 24 24 44 52 - - SMEWW 2340 C (2012)
3 Độ đục/
Turbidity NTU 65.9 96.8 83.1 57.2 201 - -
SMEWW 2130 B (2012)
()
4 Độ màu/ Color Pt-Co 36 33 98 84 119 - - SMEWW 2120 C (2012)
5 DO mgO2/l 0.89 0.28 0.15 0.45 0.04 ≥ 4 ≥ 2 SMEWW 4500-O.G
(2012) ()
6 TSS mg/l 74 112 57 61 163 ≤ 50 ≤ 100 SMEWW 2540 D
(2012) ()
7 TDS mg/l 110 205 425 290 320 - - SOP-HTN06

Stt
No.
Chỉ tiêu
Parameter
Đơn vị
Unit
SW1-LT
1510.0319
SW2-LT
1510.0321
SW3-LT
1510.0323
SW4-LT
1510.0325
SW5-LT
1510.0327
QCVN
08:2008/BTNMT
Phương pháp đo đạc/
phân tích
Measuring/Analyzing
method Level B1 Level B2
8 COD mgO2/l 20 37 253 53 116 ≤ 30 ≤ 50 SMEWW 5220C (2012)
9 BOD5 mgO2/l 8 21 200 26 70 ≤ 15 ≤ 25 SMEWW 5210 B (2012)
()
10 N-NH4+ mg/l 2.2 5.6 20.2 7.0 20.2 ≤ 0.5 ≤ 1
SMEWW 4500-NH4+
.C
(2012) () &
SMEWW 4500-NH4+.F
(2012) ()
11 Cl-
mg/l 20.7 36.9 94.0 54.8 55.9 ≤ 600 - SMEWW 4110 B (2012)
()
12 F-
mg/l 0.19 0.15 KPH/ND
(LOD = 0.03) 0.12 0.12 ≤ 1.5 ≤ 2
SMEWW 4110 B (2012)
()
13 N-NO2-
mg/l 0.23 0.04 0.15
KPH/ND
(LOD =
0.003)
KPH/ND
(LOD =
0.003)
≤ 0.04 ≤ 0.05 SMEWW 4110 B (2012)
()
14 N-NO3-
mg/l 0.31
KPH/ND
(LOD =
0.015)
KPH/ND
(LOD =
0.015)
0.02
KPH/ND
(LOD =
0.015)
≤ 10 ≤ 15 SMEWW 4110 B (2012)
()
15 SO42-
mg/l 39.8 45.9 49.1 82.3 24.8 - - SMEWW 4110 B (2012)
()
16 P-PO43-
mg/l 0.15 0.25 1.40 0.86 1.63 ≤ 0.3 ≤ 0.5 SMEWW 4500-P&D
(2012) ()
17 As mg/l 0.009 0.005
KPH/ND
(LOD =
0.004)
KPH/ND
(LOD =
0.004)
KPH/ND
(LOD =
0.004)
≤ 0.05 ≤ 0.1 SMEWW 3120 B (2012)
()
18 Cd mg/l KPH/ND KPH/ND KPH/ND KPH/ND KPH/ND ≤ 0.01 ≤ 0.01 SMEWW 3120 B (2012)

Stt
No.
Chỉ tiêu
Parameter
Đơn vị
Unit
SW1-LT
1510.0319
SW2-LT
1510.0321
SW3-LT
1510.0323
SW4-LT
1510.0325
SW5-LT
1510.0327
QCVN
08:2008/BTNMT
Phương pháp đo đạc/
phân tích
Measuring/Analyzing
method Level B1 Level B2
(LOD =
0.003)
(LOD =
0.003)
(LOD =
0.003)
(LOD =
0.003)
(LOD =
0.003)
()
19 Pb mg/l
KPH/ND
(LOD =
0.005)
0007
KPH/ND
(LOD =
0.005)
KPH/ND
(LOD =
0.005)
0.011 ≤ 0.05 ≤ 0.05 SMEWW 3120 B (2012)
()
20 Cr
mg/l
KPH/ND
(LOD =
0.003)
0.009
KPH/ND
(LOD =
0.003)
0.006 0.015 - - SMEWW 3120 B (2012)
()
21 Cu mg/l
KPH/ND
(LOD =
0.005)
0.022 0.169 0.018 0.056 ≤ 0.5 ≤ 1 SMEWW 3120 B (2012)
()
22 Zn mg/l
KPH/ND
(LOD =
0.005)
0.033 0.030
KPH/ND
(LOD =
0.005)
0.081 ≤ 1.5 ≤ 2 SMEWW 3120 B (2012)
()
23 Mn mg/l 0.128 0.235 0.075 0.287 0.364 - - SMEWW 3120 B (2012)
()
24 Fe mg/l 2.79 4.97 0.677 2.54 7.39 ≤ 1.5 ≤ 2 SMEWW 3120 B (2012)
()
25 Hg mg/l
KPH/ND
(LOD =
0.001)
KPH/ND
(LOD =
0.001)
KPH/ND
(LOD =
0.001)
KPH/ND
(LOD =
0.001)
0.005 ≤ 0.001 ≤ 0.002 SMEWW 3120 B (2012)
()
26 Dầu. mỡ/
Oil & grease mg/l
KPH/ND
(LOD = 0.1)
KPH/ND
(LOD = 0.1) 0.5 0.2 0.3 ≤ 0.1 ≤ 0.3 SMEWW 5520 (2012)
27 E. Coli MPN/100ml 24×103 24×10
4 93×10
4 24×10
4 93×10
4 ≤ 100 ≤ 200 SMEWW 9221 F (2012)
28 Coliform MPN/100ml 93×103 24×10
5 93×10
5 93×10
4 43×10
5 ≤ 7500 ≤ 10000 SMEWW 9221 D

Stt
No.
Chỉ tiêu
Parameter
Đơn vị
Unit
SW1-LT
1510.0319
SW2-LT
1510.0321
SW3-LT
1510.0323
SW4-LT
1510.0325
SW5-LT
1510.0327
QCVN
08:2008/BTNMT
Phương pháp đo đạc/
phân tích
Measuring/Analyzing
method Level B1 Level B2
(2012)
Ghi chú/Note:
Phương pháp lấy mẫu nước mặt/Surface sampling: TCVN 6663-6:2008 (ISO 5667-
6:2005)/
() Phương pháp đo đạc/phân tích được VILAS công nhận/ Measuring/analyzing
method is accredited by VILAS.
QCVN 08:2008/BTNMT: Quy chuẩn kỹ thuật quốc gia về chất lượng nước mặt/
National technical regulation on surface water quality.
KPH: Không phát hiện. LOD: Giới hạn phát hiện của phương pháp đo đạc/phân tích./
ND: Not detected. LOD: Limit of detection
SW1-LT: Vị trí cách sông Sài Gòn 200m về phía cống Vàm Thuật/ Location 200 meter from
Sai Gon river towards the Vam Thuat canal.(0603441;1197897)
SW2-LT: Vị trí tại điểm giao giữa rạch Chín Xiểng với kênh chính Tham Lương – Bến Cát –
Nước Lên/ Location at the junction between the Chin Xieng canal and the Tham Luong –
Ben Cat – Nuoc Len channels.(0602849;1197393)
SW3-LT: Vị trí tại điểm giao giữa rạch Ông Bầu với kênh chính Tham Lương – Bến Cát –
Nước Lên/ Location at the junction between the Ong Bau canal and the Tham Luong – Ben
Cat – Nuoc Len channels.(0602742;1197488)
SW4-LT: Vị trí tại điểm giao giữa rạch Ông Tổng với kênh chính Tham Lương – Bến Cát –
Nước Lên/ Location at the junction between the Ong Tong canal and the Tham Luong – Ben
Cat – Nuoc Len channels.(0602361;1198764)
SW5-LT: Vị trí tại điểm giao giữa rạch Bà Miên với kênh chính Tham Lương – Bến Cát –
Nước Lên/ Location at the junction between the Ba Mien canal and the Tham Luong – Ben
Cat – Nuoc Len channels.(0601002;199835)
LT: Triều kiệt/ Low tide

KẾT QUẢ PHÂN TÍCH MẪU
ANALYZING RESULT OF SAMPLE
Số phiếu/ No: BN1041015-1151015 – MS/Code 1510.0329-0331-0333-0381-0383
Dự án
Project
Ký hiệu mẫu
Type of sample
:
:
:
:
GÓI THẦU FRM – PPTAF02 – DỰ ÁN QUẢN LÝ RỦI RO NGẬP NƯỚC
CHO KHU VỰC TP.HCM
Nước mặt – Triều kiệt
Surface water – Low tide
Ngày lấy mẫu/
Sampling date
:
12-13/10/2015
Stt
No.
Chỉ tiêu
Parameter
Đơn vị
Unit
SW6-LT
1510.0329
SW7-LT
1510.0331
SW8-LT
1510.0333
SW9-LT
1510.0383
SW10-LT
1510.0381
QCVN
08:2008/BTNMT
Phương pháp đo đạc/
phân tích
Measuring/Analyzing
method Level B1 Level B2
1 pH, at 25oC - 6.99 6.83 7.28 6.98 6.89 5.5 – 9 5.5 – 9
TCVN 6492:2011 ()
(ISO 10523:2008)
2 Độ cứng tổng/
Total hardness mgCaCO3/l 64 40 56 118 114 - - SMEWW 2340 C (2012)
3 Độ đục/
Turbidity NTU 57.6 30.1 38.6 65.1 81.6 - -
SMEWW 2130 B (2012)
()
4 Độ màu/ Color Pt-Co 115 82 145 31 28 - - SMEWW 2120 C (2012)
5 DO mgO2/l 0.07 0.04 0.08 0.32 0.08 ≥ 4 ≥ 2 SMEWW 4500-O.G
(2012) ()
6 TSS mg/l 119 17 40 64 80 ≤ 50 ≤ 100 SMEWW 2540 D (2012)
()
7 TDS mg/l 435 270 455 420 455 - - SOP-HTN06

Stt
No.
Chỉ tiêu
Parameter
Đơn vị
Unit
SW6-LT
1510.0329
SW7-LT
1510.0331
SW8-LT
1510.0333
SW9-LT
1510.0383
SW10-LT
1510.0381
QCVN
08:2008/BTNMT
Phương pháp đo đạc/
phân tích
Measuring/Analyzing
method Level B1 Level B2
8 COD mgO2/l 144 112 93 48 43 ≤ 30 ≤ 50 SMEWW 5220C (2012)
()
9 BOD5 mgO2/l 93 76 60 15 13 ≤ 15 ≤ 25 SMEWW 5210 B (2012)
()
10 N-NH4+ mg/l 19.0 15.7 12.3 5.9 5.6 ≤ 0.5 ≤ 1
SMEWW 4500-NH4+
.C
(2012) ()
11 Cl-
mg/l 87.9 53.3 113.3 123.0 174.7 ≤ 600 - SMEWW 4110 B (2012)
()
12 F-
mg/l 0.12 0.09 0.21 0.39 0.44 ≤ 1.5 ≤ 2 SMEWW 4110 B (2012)
()
13 N-NO2-
mg/l
KPH/ND
(LOD =
0.003)
KPH/ND
(LOD =
0.003)
KPH/ND
(LOD =
0.003)
KPH/ND
(LOD =
0.003)
KPH/ND
(LOD =
0.003)
≤ 0.04 ≤ 0.05 SMEWW 4110 B (2012)
()
14 N-NO3-
mg/l
KPH/ND
(LOD =
0.015)
KPH/ND
(LOD =
0.015)
KPH/ND
(LOD =
0.015)
0.16 0.17 ≤ 10 ≤ 15 SMEWW 4500-NO3
-.B
(2012) ()
15 SO42-
mg/l 41.0 25.2 62.6 68.6 72.4 - - SMEWW 4110 B (2012)
()
16 P-PO43-
mg/l 1.62 1.08 1.61 0.25 0.17 ≤ 0.3 ≤ 0.5 SMEWW 4500-P&D
(2012) ()
17 As mg/l
KPH/ND
(LOD =
0.004)
KPH/ND
(LOD =
0.004)
KPH/ND
(LOD =
0.004)
KPH/ND
(LOD =
0.004)
KPH/ND
(LOD =
0.004)
≤ 0.05 ≤ 0.1 SMEWW 3120 B (2012)
()
18 Cd mg/l KPH/ND
(LOD =
KPH/ND
(LOD =
KPH/ND
(LOD =
KPH/ND
(LOD =
KPH/ND
(LOD = ≤ 0.01 ≤ 0.01
SMEWW 3120 B (2012)
()

Stt
No.
Chỉ tiêu
Parameter
Đơn vị
Unit
SW6-LT
1510.0329
SW7-LT
1510.0331
SW8-LT
1510.0333
SW9-LT
1510.0383
SW10-LT
1510.0381
QCVN
08:2008/BTNMT
Phương pháp đo đạc/
phân tích
Measuring/Analyzing
method Level B1 Level B2
0.003) 0.003) 0.003) 0.003) 0.003)
19 Pb mg/l
KPH/ND
(LOD =
0.005)
KPH/ND
(LOD =
0.005)
0.010
KPH/ND
(LOD =
0.005)
0.006 ≤ 0.05 ≤ 0.05 SMEWW 3120 B (2012)
()
20 Cr
mg/l 0.007
KPH/ND
(LOD =
0.003)
0.019 0.015 0.011 - - SMEWW 3120 B (2012)
()
21 Cu mg/l 0.015 0.006 0.023 0.015 0.006 ≤ 0.5 ≤ 1 SMEWW 3120 B (2012)
()
22 Zn mg/l 0.037
KPH/ND
(LOD =
0.005)
0.063
KPH/ND
(LOD =
0.005)
KPH/ND
(LOD =
0.005)
≤ 1.5 ≤ 2 SMEWW 3120 B (2012)
()
23 Mn mg/l 0.197 0.086 0.394 0.485 0.559 - - SMEWW 3120 B (2012)
()
24 Fe mg/l 3.60 0.965 3.86 3.62 3.98 ≤ 1.5 ≤ 2 SMEWW 3120 B (2012)
()
25 Hg mg/l
KPH/ND
(LOD =
0.001)
KPH/ND
(LOD =
0.001)
KPH/ND
(LOD =
0.001)
KPH/ND
(LOD =
0.001)
KPH/ND
(LOD =
0.001)
≤ 0.001 ≤ 0.002 SMEWW 3120 B (2012)
26 Dầu. mỡ/
Oil & grease mg/l 0.4 0.4 0.3 0.2
KPH/ND
(LOD = 0.1) ≤ 0.1 ≤ 0.3 SMEWW 5520 C (2012)
27 E. Coli MPN/100ml 24×105 24×10
5 24×10
5 93×10
3 24×10
3 ≤ 100 ≤ 200 SMEWW 9221 F (2012)
28 Coliform MPN/100ml 93×105 24×10
6 24×10
6 43×10
4 24×10
4 ≤ 7500 ≤ 10000 SMEWW 9221 D (2012)

Ghi chú/Note:
Phương pháp lấy mẫu nước mặt/ Surface sampling: TCVN 6663-6:2008 (ISO 5667- 6:2005
() Phương pháp đo đạc/phân tích được VILAS công nhận/ Measuring/analyzing method is
accredited by VILAS.
QCVN 08:2008/BTNMT: Quy chuẩn kỹ thuật quốc gia về chất lượng nước mặt/ National
technical regulation on surface water quality.
KPH: Không phát hiện. LOD: Giới hạn phát hiện của phương pháp đo đạc/phân tích./
ND: Not detected. LOD: Limit of detection
SW6-LT: Vị trí tại điểm giao giữa rạch Cầu Cụt với kênh chính Tham Lương – Bến Cát –
Nước Lên/ Location at the junction between the Cau Cut canal and the Tham Luong – Ben
Cat – Nuoc Len channels (0598939;1200474)
SW7-LT: Vị trí tại điểm giao giữa kênh Hy Vọng với kênh chính Tham Lương – Bến Cát –
Nước Lên/ Location at the junction between the Hy Vong channel and the Tham Luong –
Ben Cat – Nuoc Len channels.(0596170;1197484)
SW8-LT: Vị trí tại cầu Tham Lương. sau điểm xả nước thải của KCN Tân Bình/ Location at
the Tham Luong bridge. after the discharging point of Tan Binh Industrial
Park.(0595884;1196999)
SW9-LT: Vị trí tại cầu An Lạc, KCN An Lac / Location at the Tham Luong bridge, Tan Tao
Industrial Park. (0593163;1186046)
SW10-LT: Vị trí cách sông Chợ Đệm 200m về phía cầu Nước Lên/ Location 200 meter
from Cho Dem river toward the Nuoc Len bridge.(0593205;1184253)
LT: Triều kiệt/ Low tide
.

KẾT QUẢ PHÂN TÍCH PHIÊU SINH ĐỘNG VẬT
ANALYZING RESULT OF AQUATIC PLANKTON
Số phiếu/ No: BN1041015 – MS/Code 1510.0318-0320-0322-0324-0326
Stt
No
Tên khoa học
Science name
Vị trí lấy mẫu
Location
SV1-HT SV2-HT SV3-HT SV4-HT SV5-HT
PROTOZOA
Paramoecidae
1 Paramoecium putrinum Clap. &
Lach.
ROTATORIA
Philodinidae
2 Philodina roseola (Ehrenberg) 100
3 Rotaria rotaria (Pallas) 200
Notommatidae
4 Scaridium longicaudum (O.F. Muller) 400
OLIGOCHAETA
Naididae
5 Pristina longiseta Ehrenberg 200
CLADOCERA
Sididae
6 Diaphanosoma excisum Sars
7 Diaphanosoma leuchtenbergianum
Fischer
Daphniidae
8 Ceriodaphnia rigaudi Richard 200
9 Moina dubia de Guerne et Richard 400 300
Dự án
Project
Ngày lấy mẫu/
Sampling date
:
:
GÓI THẦU FRM – PPTAF02 – DỰ ÁN QUẢN LÝ RỦI RO NGẬP NƯỚC
CHO KHU VỰC TP.HCM
12-13/10/2015

Stt
No
Tên khoa học
Science name
Vị trí lấy mẫu
Location
SV1-HT SV2-HT SV3-HT SV4-HT SV5-HT
Chydoridae
10 Euryalona orientalis (Dalay) 100
COPEPODA
Diaptomidae
11 Eodiaptomus draconisignivomi
Brehm
Cyclopidae
12 Mesocyclops leickarti (Claus)
13 Thermocyclops hyalinus (Rehberg) 200
OSTRACODA
Cypridae
14 Heterocypris anomala Klie 200 100 100
INSECTA
Tomoceridae
15 Tomocerus sp.
LARVA
16 Nauplius copepoda
Số lượng (cá thể/m3) 500 700 600 400 300
Ghi chú/Note:
SW1-HT: Vị trí cách sông Sài Gòn 200m về phía cống Vàm Thuật/ Location 200 meter from Sai Gon river towards the Vam
Thuat canal.(0603441;1197897)
SW2-HT: Vị trí tại điểm giao giữa rạch Chín Xiểng với kênh chính Tham Lương – Bến Cát – Nước Lên/ Location at the junction
between the Chin Xieng canal and the Tham Luong – Ben Cat – Nuoc Len channels (0602849;1197393)
SW3-HT: Vị trí tại điểm giao giữa rạch Ông Bầu với kênh chính Tham Lương – Bến Cát – Nước Lên/ Location at the junction
between the Ong Bau canal and the Tham Luong – Ben Cat – Nuoc Len channels (0602742;1197488)
SW4-HT: Vị trí tại điểm giao giữa rạch Ông Tổng với kênh chính Tham Lương – Bến Cát – Nước Lên/ Location at the junction
between the Ong Tong canal and the Tham Luong – Ben Cat – Nuoc Len channels (0602361;1198764)
SW5-HT: Vị trí tại điểm giao giữa rạch Bà Miên với kênh chính Tham Lương – Bến Cát – Nước Lên/ Location at the junction
between the Ba Mien canal and the Tham Luong – Ben Cat – Nuoc Len channels (0601002;1199835)
HT: Triều cường/ High tide

KẾT QUẢ PHÂN TÍCH PHIÊU SINH ĐỘNG VẬT
ANALYZING RESULT OF AQUATIC PLANKTON
Số phiếu/ No: BN1041015 – MS/Code 1510.0319-0321-0323-0325-0327
Stt
No
Tên khoa học
Science name
Vị trí lấy mẫu
Location
SV1-LT SV2-LT SV3-LT SV4-LT SV5-LT
PROTOZOA
Paramoecidae
1 Paramoecium putrinum Clap. &
Lach. 200
ROTATORIA
Philodinidae
2 Philodina roseola (Ehrenberg) 400 200 100
3 Rotaria rotaria (Pallas) 200
Notommatidae
4 Scaridium longicaudum (O.F. Muller) 100
OLIGOCHAETA
Naididae
5 Pristina longiseta Ehrenberg 100
CLADOCERA
Sididae
6 Diaphanosoma excisum Sars
7 Diaphanosoma leuchtenbergianum
Fischer
Daphniidae
8 Ceriodaphnia rigaudi Richard 400
9 Moina dubia de Guerne et Richard 400 500
Dự án
Project
Ngày lấy mẫu/
Sampling date
:
:
GÓI THẦU FRM – PPTAF02 – DỰ ÁN QUẢN LÝ RỦI RO NGẬP NƯỚC
CHO KHU VỰC TP.HCM
12-13/10/2015

Stt
No
Tên khoa học
Science name
Vị trí lấy mẫu
Location
SV1-LT SV2-LT SV3-LT SV4-LT SV5-LT
Chydoridae
10 Euryalona orientalis (Dalay) 200
COPEPODA
Diaptomidae
11 Eodiaptomus draconisignivomi
Brehm
Cyclopidae
12 Mesocyclops leickarti (Claus)
13 Thermocyclops hyalinus (Rehberg) 100 300
OSTRACODA
Cypridae
14 Heterocypris anomala Klie 200 200 100
INSECTA
Tomoceridae
15 Tomocerus sp.
LARVA
16 Nauplius copepoda 100
Số lượng (cá thể/m3) 800 700 1.100 600 600
Ghi chú/Note:
SW1-LT: Vị trí cách sông Sài Gòn 200m về phía cống Vàm Thuật/ Location 200 meter from Sai Gon river towards the Vam Thuat
canal.(0603441;1197897)
SW2-LT: Vị trí tại điểm giao giữa rạch Chín Xiểng với kênh chính Tham Lương – Bến Cát – Nước Lên/ Location at the junction
between the Chin Xieng canal and the Tham Luong – Ben Cat – Nuoc Len channels.(0602849;1197393)
SW3-LT: Vị trí tại điểm giao giữa rạch Ông Bầu với kênh chính Tham Lương – Bến Cát – Nước Lên/ Location at the junction
between the Ong Bau canal and the Tham Luong – Ben Cat – Nuoc Len channels.(0602742;1197488)
SW4-LT: Vị trí tại điểm giao giữa rạch Ông Tổng với kênh chính Tham Lương – Bến Cát – Nước Lên/ Location at the junction
between the Ong Tong canal and the Tham Luong – Ben Cat – Nuoc Len channels.(0602361;1198764)
SW5-LT: Vị trí tại điểm giao giữa rạch Bà Miên với kênh chính Tham Lương – Bến Cát – Nước Lên/ Location at the junction
between the Ba Mien canal and the Tham Luong – Ben Cat – Nuoc Len channels.(0601002;199835)
LT: Triều kiệt/ Low tide

KẾT QUẢ PHÂN TÍCH PHIÊU SINH ĐỘNG VẬT
ANALYZING RESULT OF AQUATIC PLANKTON
Số phiếu/ No: BN1041015-1151015 – MS/Code 1510.0328-0330-0332-0380-0382
Stt
No
Tên khoa học
Science name
Vị trí lấy mẫu
Location
SV6-HT SV7-HT SV8-HT SV9-HT SV10-HT
PROTOZOA
Paramoecidae
1
Paramoecium putrinum Clap. &
Lach. 600
ROTATORIA
Philodinidae
2 Philodina roseola (Ehrenberg) 200
3 Rotaria rotaria (Pallas) 200
Notommatidae
4 Scaridium longicaudum (O.F. Muller)
OLIGOCHAETA
Naididae
5 Pristina longiseta Ehrenberg
CLADOCERA
Sididae
6 Diaphanosoma excisum Sars 500
7
Diaphanosoma leuchtenbergianum
Fischer 300
Daphniidae
8 Ceriodaphnia rigaudi Richard 100
9 Moina dubia de Guerne et Richard 200 200 300 600
Chydoridae
10 Euryalona orientalis (Dalay)
COPEPODA
Dự án
Project
Ngày lấy mẫu/
Sampling date
:
:
GÓI THẦU FRM – PPTAF02 – DỰ ÁN QUẢN LÝ RỦI RO NGẬP NƯỚC
CHO KHU VỰC TP.HCM
12-13/10/2015

Stt
No
Tên khoa học
Science name
Vị trí lấy mẫu
Location
SV6-HT SV7-HT SV8-HT SV9-HT SV10-HT
Diaptomidae
11
Eodiaptomus draconisignivomi
Brehm 100
Cyclopidae
12 Mesocyclops leickarti (Claus) 100 100
13 Thermocyclops hyalinus (Rehberg) 2.800 200 1.200
OSTRACODA
Cypridae
14 Heterocypris anomala Klie 100 400
INSECTA
Tomoceridae
15 Tomocerus sp. 100
LARVA
16 Nauplius copepoda 300 200 400
Số lượng (cá thể/m3) 400 4.300 600 800 3.100
Ghi chú/Note:
SW6-HT: Vị trí tại điểm giao giữa rạch Cầu Cụt với kênh chính Tham Lương – Bến Cát – Nước Lên/ Location at the junction
between the Cau Cut canal and the Tham Luong – Ben Cat – Nuoc Len channels (0598939;1200474)
SW7-HT: Vị trí tại điểm giao giữa kênh Hy Vọng với kênh chính Tham Lương – Bến Cát – Nước Lên/ Location at the
junction between the Hy Vong channel and the Tham Luong – Ben Cat – Nuoc Len channels.(0596170;1197484)
SW8-HT: Vị trí tại cầu Tham Lương. sau điểm xả nước thải của KCN Tân Bình/ Location at the Tham Luong bridge, after the
discharging point of Tan Binh Industrial Park.(0595884;1196999)
SW9-HT: Vị trí tại cầu An Lạc / Location at the An Lac bridge.(0593163;1186046)
SW10-HT: Vị trí cách sông Chợ Đệm 200m về phía cầu Nước Lên/ Location 200 meter from Cho Dem river toward the Nuoc
Len bridge.(0593205;1184253)
HT: Triều cường/ High tide
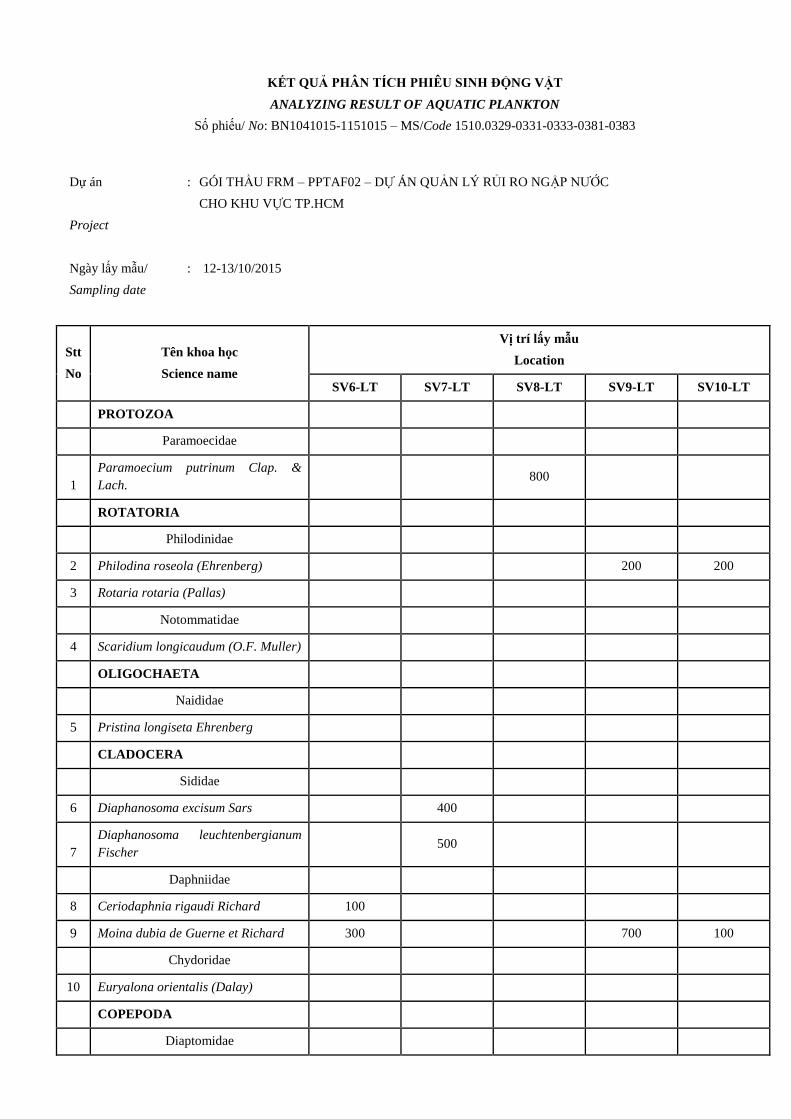
KẾT QUẢ PHÂN TÍCH PHIÊU SINH ĐỘNG VẬT
ANALYZING RESULT OF AQUATIC PLANKTON
Số phiếu/ No: BN1041015-1151015 – MS/Code 1510.0329-0331-0333-0381-0383
Stt
No
Tên khoa học
Science name
Vị trí lấy mẫu
Location
SV6-LT SV7-LT SV8-LT SV9-LT SV10-LT
PROTOZOA
Paramoecidae
1
Paramoecium putrinum Clap. &
Lach. 800
ROTATORIA
Philodinidae
2 Philodina roseola (Ehrenberg) 200 200
3 Rotaria rotaria (Pallas)
Notommatidae
4 Scaridium longicaudum (O.F. Muller)
OLIGOCHAETA
Naididae
5 Pristina longiseta Ehrenberg
CLADOCERA
Sididae
6 Diaphanosoma excisum Sars 400
7
Diaphanosoma leuchtenbergianum
Fischer 500
Daphniidae
8 Ceriodaphnia rigaudi Richard 100
9 Moina dubia de Guerne et Richard 300 700 100
Chydoridae
10 Euryalona orientalis (Dalay)
COPEPODA
Diaptomidae
Dự án
Project
Ngày lấy mẫu/
Sampling date
:
:
GÓI THẦU FRM – PPTAF02 – DỰ ÁN QUẢN LÝ RỦI RO NGẬP NƯỚC
CHO KHU VỰC TP.HCM
12-13/10/2015

Stt
No
Tên khoa học
Science name
Vị trí lấy mẫu
Location
SV6-LT SV7-LT SV8-LT SV9-LT SV10-LT
11
Eodiaptomus draconisignivomi
Brehm
Cyclopidae
12 Mesocyclops leickarti (Claus) 200 300 100
13 Thermocyclops hyalinus (Rehberg) 1.000 500 800 900
OSTRACODA
Cypridae
14 Heterocypris anomala Klie 200 100
INSECTA
Tomoceridae
15 Tomocerus sp. 100
LARVA
16 Nauplius copepoda 100
Số lượng (cá thể/m3) 700 2.100 1.300 2.100 1.400
Ghi chú/Note:
SW6-LT: Vị trí tại điểm giao giữa rạch Cầu Cụt với kênh chính Tham Lương – Bến Cát – Nước Lên/ Location at the junction
between the Cau Cut canal and the Tham Luong – Ben Cat – Nuoc Len channels (0598939;1200474)
SW7-LT: Vị trí tại điểm giao giữa kênh Hy Vọng với kênh chính Tham Lương – Bến Cát – Nước Lên/ Location at the junction
between the Hy Vong channel and the Tham Luong – Ben Cat – Nuoc Len channels.(0596170;1197484)
SW8-LT: Vị trí tại cầu Tham Lương. sau điểm xả nước thải của KCN Tân Bình/ Location at the Tham Luong bridge. after the
discharging point of Tan Binh Industrial Park.(0595884;1196999)
SW9-LT: Vị trí tại cầu An Lạc, KCN An Lac / Location at the Tham Luong bridge, Tan Tao Industrial Park.
(0593163;1186046)
SW10-LT: Vị trí cách sông Chợ Đệm 200m về phía cầu Nước Lên/ Location 200 meter from Cho Dem river toward the Nuoc
Len bridge.(0593205;1184253)
LT: Triều kiệt/ Low tide
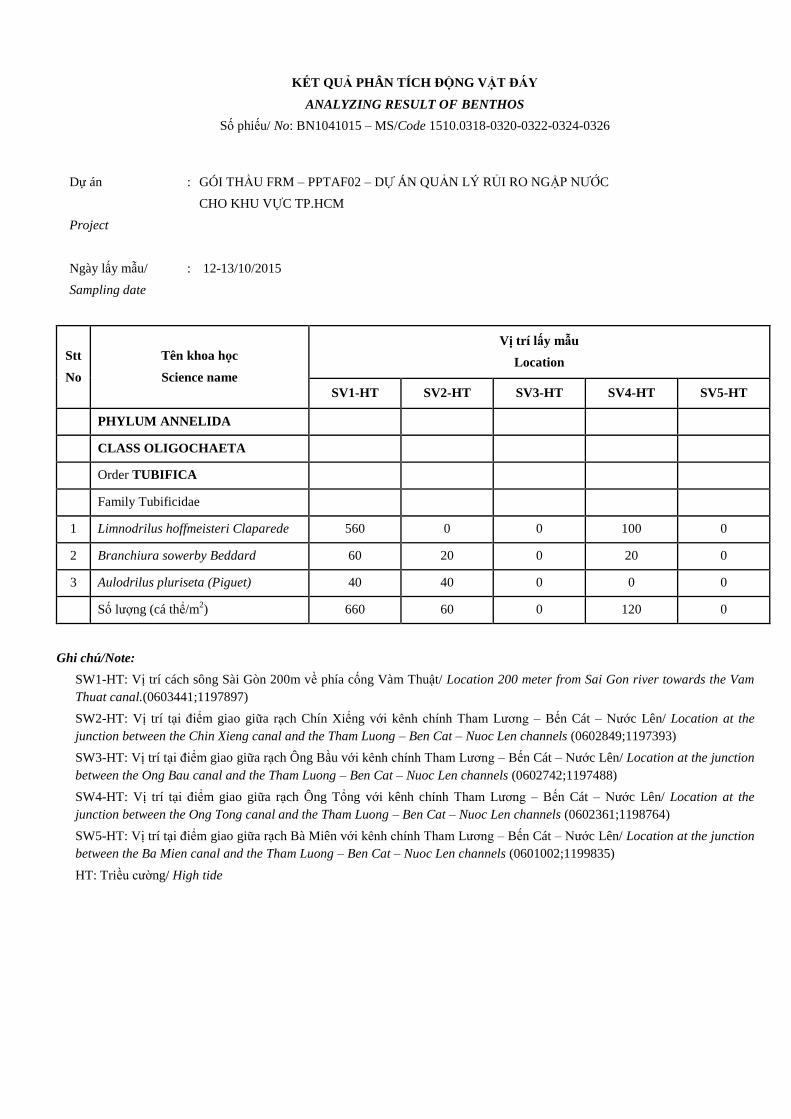
KẾT QUẢ PHÂN TÍCH ĐỘNG VẬT ĐÁY
ANALYZING RESULT OF BENTHOS
Số phiếu/ No: BN1041015 – MS/Code 1510.0318-0320-0322-0324-0326
Stt
No
Tên khoa học
Science name
Vị trí lấy mẫu
Location
SV1-HT SV2-HT SV3-HT SV4-HT SV5-HT
PHYLUM ANNELIDA
CLASS OLIGOCHAETA
Order TUBIFICA
Family Tubificidae
1 Limnodrilus hoffmeisteri Claparede 560 0 0 100 0
2 Branchiura sowerby Beddard 60 20 0 20 0
3 Aulodrilus pluriseta (Piguet) 40 40 0 0 0
Số lượng (cá thể/m2) 660 60 0 120 0
Ghi chú/Note:
SW1-HT: Vị trí cách sông Sài Gòn 200m về phía cống Vàm Thuật/ Location 200 meter from Sai Gon river towards the Vam
Thuat canal.(0603441;1197897)
SW2-HT: Vị trí tại điểm giao giữa rạch Chín Xiểng với kênh chính Tham Lương – Bến Cát – Nước Lên/ Location at the
junction between the Chin Xieng canal and the Tham Luong – Ben Cat – Nuoc Len channels (0602849;1197393)
SW3-HT: Vị trí tại điểm giao giữa rạch Ông Bầu với kênh chính Tham Lương – Bến Cát – Nước Lên/ Location at the junction
between the Ong Bau canal and the Tham Luong – Ben Cat – Nuoc Len channels (0602742;1197488)
SW4-HT: Vị trí tại điểm giao giữa rạch Ông Tổng với kênh chính Tham Lương – Bến Cát – Nước Lên/ Location at the
junction between the Ong Tong canal and the Tham Luong – Ben Cat – Nuoc Len channels (0602361;1198764)
SW5-HT: Vị trí tại điểm giao giữa rạch Bà Miên với kênh chính Tham Lương – Bến Cát – Nước Lên/ Location at the junction
between the Ba Mien canal and the Tham Luong – Ben Cat – Nuoc Len channels (0601002;1199835)
HT: Triều cường/ High tide
Dự án
Project
Ngày lấy mẫu/
Sampling date
:
:
GÓI THẦU FRM – PPTAF02 – DỰ ÁN QUẢN LÝ RỦI RO NGẬP NƯỚC
CHO KHU VỰC TP.HCM
12-13/10/2015

KẾT QUẢ PHÂN TÍCH ĐỘNG VẬT ĐÁY
ANALYZING RESULT OF BENTHOS
Số phiếu/ No: BN1041015 – MS/Code 1510.0319-0321-0323-0325-0327
Stt
No
Tên khoa học
Science name
Vị trí lấy mẫu
Location
SV1-LT SV2-LT SV3-LT SV4-LT SV5-LT
PHYLUM ANNELIDA
CLASS OLIGOCHAETA
Order TUBIFICA
Family Tubificidae
1 Limnodrilus hoffmeisteri Claparede 300 40 0 60 0
2 Branchiura sowerby Beddard 40 0 0 0 0
3 Aulodrilus pluriseta (Piguet) 40 0 0 0 40
Số lượng (cá thể/m2) 380 40 0 60 40
Ghi chú/Note:
SW1-LT: Vị trí cách sông Sài Gòn 200m về phía cống Vàm Thuật/ Location 200 meter from Sai Gon river towards the Vam
Thuat canal.(0603441;1197897)
SW2-LT: Vị trí tại điểm giao giữa rạch Chín Xiểng với kênh chính Tham Lương – Bến Cát – Nước Lên/ Location at the
junction between the Chin Xieng canal and the Tham Luong – Ben Cat – Nuoc Len channels (0602849;1197393)
SW3-LT: Vị trí tại điểm giao giữa rạch Ông Bầu với kênh chính Tham Lương – Bến Cát – Nước Lên/ Location at the junction
between the Ong Bau canal and the Tham Luong – Ben Cat – Nuoc Len channels (0602742;1197488)
SW4-LT: Vị trí tại điểm giao giữa rạch Ông Tổng với kênh chính Tham Lương – Bến Cát – Nước Lên/ Location at the
junction between the Ong Tong canal and the Tham Luong – Ben Cat – Nuoc Len channels (0602361;1198764)
SW5-LT: Vị trí tại điểm giao giữa rạch Bà Miên với kênh chính Tham Lương – Bến Cát – Nước Lên/ Location at the junction
between the Ba Mien canal and the Tham Luong – Ben Cat – Nuoc Len channels (0601002;1199835)
LT: Triều kiệt/ Low tide
Dự án
Project
Ngày lấy mẫu/
Sampling date
:
:
GÓI THẦU FRM – PPTAF02 – DỰ ÁN QUẢN LÝ RỦI RO NGẬP NƯỚC
CHO KHU VỰC TP.HCM
12-13/10/2015

KẾT QUẢ PHÂN TÍCH ĐỘNG VẬT ĐÁY
ANALYZING RESULT OF BENTHOS
Số phiếu/ No: BN1041015-1151015 – MS/Code 1510.0328-0330-0332-0380-0382
Stt
No
Tên khoa học
Science name
Vị trí lấy mẫu
Location
SV6-HT SV7-HT SV8-HT SV9-HT SV10-HT
PHYLUM ANNELIDA
CLASS OLIGOCHAETA
Order TUBIFICA
Family Tubificidae
1 Limnodrilus hoffmeisteri Claparede 0 0 0 0 0
2 Branchiura sowerby Beddard 0 0 0 0 40
3 Aulodrilus pluriseta (Piguet) 0 0 0 0 20
Số lượng (cá thể/m2) 0 0 0 0 60
Ghi chú/Note:
SW6-HT: Vị trí tại điểm giao giữa rạch Cầu Cụt với kênh chính Tham Lương – Bến Cát – Nước Lên/ Location at the junction
between the Cau Cut canal and the Tham Luong – Ben Cat – Nuoc Len channels (0598939;1200474)
SW7-HT: Vị trí tại điểm giao giữa kênh Hy Vọng với kênh chính Tham Lương – Bến Cát – Nước Lên/ Location at the
junction between the Hy Vong channel and the Tham Luong – Ben Cat – Nuoc Len channels.(0596170;1197484)
SW8-HT: Vị trí tại cầu Tham Lương. sau điểm xả nước thải của KCN Tân Bình/ Location at the Tham Luong bridge, after the
discharging point of Tan Binh Industrial Park.(0595884;1196999)
SW9-HT: Vị trí tại cầu An Lạc / Location at the An Lac bridge.(0593163;1186046)
SW10-HT: Vị trí cách sông Chợ Đệm 200m về phía cầu Nước Lên/ Location 200 meter from Cho Dem river toward the Nuoc
Len bridge.(0593205;1184253)
HT: Triều cường/ High tide
Dự án
Project
Ngày lấy mẫu/
Sampling date
:
:
GÓI THẦU FRM – PPTAF02 – DỰ ÁN QUẢN LÝ RỦI RO NGẬP NƯỚC
CHO KHU VỰC TP.HCM
12-13/10/2015

KẾT QUẢ PHÂN TÍCH ĐỘNG VẬT ĐÁY
ANALYZING RESULT OF BENTHOS
Số phiếu/ No: BN1041015-1151015 – MS/Code 1510.0329-0331-0333-0381-0383
Stt
No
Tên khoa học
Science name
Vị trí lấy mẫu
Location
SV6-LT SV7-LT SV8-LT SV9-LT SV10-LT
PHYLUM ANNELIDA
CLASS OLIGOCHAETA
Order TUBIFICA
Family Tubificidae
1 Limnodrilus hoffmeisteri Claparede 0 0 0 0 40
2 Branchiura sowerby Beddard 0 0 0 0 20
3 Aulodrilus pluriseta (Piguet) 0 0 0 0 100
Số lượng (cá thể/m2) 0 0 0 0 160
Ghi chú/Note:
SW6-LT: Vị trí tại điểm giao giữa rạch Cầu Cụt với kênh chính Tham Lương – Bến Cát – Nước Lên/ Location at the junction
between the Cau Cut canal and the Tham Luong – Ben Cat – Nuoc Len channels (0598939;1200474)
SW7-LT: Vị trí tại điểm giao giữa kênh Hy Vọng với kênh chính Tham Lương – Bến Cát – Nước Lên/ Location at the junction
between the Hy Vong channel and the Tham Luong – Ben Cat – Nuoc Len channels.(0596170;1197484)
SW8-LT: Vị trí tại cầu Tham Lương. sau điểm xả nước thải của KCN Tân Bình/ Location at the Tham Luong bridge, after the
discharging point of Tan Binh Industrial Park.(0595884;1196999)
SW9-LT: Vị trí tại cầu An Lạc / Location at the An Lac bridge.(0593163;1186046)
SW10-LT: Vị trí cách sông Chợ Đệm 200m về phía cầu Nước Lên/ Location 200 meter from Cho Dem river toward the Nuoc
Len bridge.(0593205;1184253)
LT: Triều kiệt/ Low tide
Dự án
Project
Ngày lấy mẫu/
Sampling date
:
:
GÓI THẦU FRM – PPTAF02 – DỰ ÁN QUẢN LÝ RỦI RO NGẬP NƯỚC
CHO KHU VỰC TP.HCM
12-13/10/2015

KẾT QUẢ PHÂN TÍCH PHIÊU SINH THỰC VẬT
ANALYZING RESULT OF PHYTOPLANKTON
Số phiếu/ No: BN1041015 – MS/Code 1510.0318-0320-0322-0324-0326
Stt
No
Tên khoa học
Science name
Vị trí lấy mẫu
Location
SV1-HT SV2-HT SV3-HT SV4-HT SV5-HT
Lớp Cyanophyceae
1 Oscillatoria sp.1 50.000 560.000 1.130.000 820.000 2.920.000
2 Oscillatoria sp.2 0 0 490.000 430.000 1.630.000
Lớp Bacillariophyceae (bộ Centrales) 0 0 0 0 0
3 Coscinodiscus radiatus 150.000 90.000 0 0 40.000
4 Coscinodiscus sp.1 0 35.000 0 0 0
5 Coscinodiscus sp.2 0 15.000 0 0 0
6 Cyclotella meneghiniana 400.000 630.000 30.000 1.240.000 330.000
7 Melosira grannulata 14.060.000 2.710.000 1.800.000 4.530.000 5.750.000
Lớp Bacillariophyceae (bộ Pennales) 0 0 0 0 0
8 Cymbella sp. 0 0 0 0 0
9 Eunotia major 0 90.000 0 40.000 0
10 Gyrosigma balticum 0 0 0 0 0
11 Navicula pusilla 0 140.000 0 40.000 0
12 Nitzschia sigma 0 40.000 0 0 30.000
13 Nitzschia vitrea 0 0 0 0 0
14 Pleurosigma sinensis 0 0 0 0 0
Lớp Chlorophyceae 0 0 0 0 0
15 Actinastrum hantzschii 940.000 80.000 0 0 0
16 Ankistrodesmus gracilis 0 0 0 0 0
17 Ankistrodesmus spiralis 0 0 0 0 0
18 Crucigenia lauterbonei 410.000 20.000 0 0 0
19 Pandorina morum 0 0 0 0 0
20 Pediastrum duplex 120.000 160.000 10.000 130.000 0
Dự án
Project
Ngày lấy mẫu/
Sampling date
:
:
GÓI THẦU FRM – PPTAF02 – DỰ ÁN QUẢN LÝ RỦI RO NGẬP NƯỚC
CHO KHU VỰC TP.HCM
12-13/10/2015

Stt
No
Tên khoa học
Science name
Vị trí lấy mẫu
Location
SV1-HT SV2-HT SV3-HT SV4-HT SV5-HT
21 Pediastrum tetras 0 50.000 20.000 0 70.000
22 Scenedesmus accuminatus 2.280.000 170.000 0 440.000 310.000
23 Scenedesmus quadricauda 190.000 180.000 0 160.000 120.000
Lớp Euglenophyceae 0 0 0 0 0
24 Euglena acus 0 30.000 50.000 40.000 0
25 Euglena oxyuris 0 40.000 20.000 0 0
26 Lepocinclis fusiformis 0 0 0 0 0
27 Lepocinclis ovum 0 0 0 0 0
28 Phacus curvicauda 0 0 0 0 0
29 Phacus longicauda 0 0 0 30.000 40.000
30 Phacus pleuronectes 80.000 110.000 0 0 0
31 Phacus tortus 0 0 0 20.000 0
Số lượng (cá thể/m3) 18.680.000 5.150.000 3.550.000 7.920.000 11.240.000
Ghi chú/Note:
SW1-HT: Vị trí cách sông Sài Gòn 200m về phía cống Vàm Thuật/ Location 200 meter from Sai Gon river towards the Vam
Thuat canal.(0603441;1197897)
SW2-HT: Vị trí tại điểm giao giữa rạch Chín Xiểng với kênh chính Tham Lương – Bến Cát – Nước Lên/ Location at the
junction between the Chin Xieng canal and the Tham Luong – Ben Cat – Nuoc Len channels (0602849;1197393)
SW3-HT: Vị trí tại điểm giao giữa rạch Ông Bầu với kênh chính Tham Lương – Bến Cát – Nước Lên/ Location at the junction
between the Ong Bau canal and the Tham Luong – Ben Cat – Nuoc Len channels (0602742;1197488)
SW4-HT: Vị trí tại điểm giao giữa rạch Ông Tổng với kênh chính Tham Lương – Bến Cát – Nước Lên/ Location at the
junction between the Ong Tong canal and the Tham Luong – Ben Cat – Nuoc Len channels (0602361;1198764)
SW5-HT: Vị trí tại điểm giao giữa rạch Bà Miên với kênh chính Tham Lương – Bến Cát – Nước Lên/ Location at the junction
between the Ba Mien canal and the Tham Luong – Ben Cat – Nuoc Len channels (0601002;1199835)
HT: Triều cường/ High tide

KẾT QUẢ PHÂN TÍCH PHIÊU SINH THỰC VẬT
ANALYZING RESULT OF PHYTOPLANKTON
Số phiếu/ No: BN1041015 – MS/Code 1510.0319-0321-0323-0325-0327
Stt
No
Tên khoa học
Science name
Vị trí lấy mẫu
Location
SV1-LT SV2-LT SV3-LT SV4-LT SV5-LT
Lớp Cyanophyceae
1 Oscillatoria sp.1 110.000 0 1.840.000 270.000 1.920.000
2 Oscillatoria sp.2 0 0 620.000 125.000 985.000
Lớp Bacillariophyceae (bộ Centrales) 0 0 0 0 0
3 Coscinodiscus radiatus 130.000 0 0 0 0
4 Coscinodiscus sp.1 0 0 0 0 0
5 Coscinodiscus sp.2 0 180.000 0 0 0
6 Cyclotella meneghiniana 380.000 400.000 0 725.000 1.425.000
7 Melosira grannulata 2.400.000 2.100.000 1.175.000 1.770.000 2.985.000
Lớp Bacillariophyceae (bộ Pennales) 0 0 0 0 0
8 Cymbella sp. 40.000 10.000 0 25.000 0
9 Eunotia major 30.000 100.000 0 0 0
10 Gyrosigma balticum 0 0 0 0 0
11 Navicula pusilla 80.000 0 0 45.000 50.000
12 Nitzschia sigma 0 125.000 0 0 0
13 Nitzschia vitrea 20.000 0 0 0 0
14 Pleurosigma sinensis 0 0 0 0 0
Lớp Chlorophyceae 0 0 0 0 0
15 Actinastrum hantzschii 50.000 225.000 0 0 0
16 Ankistrodesmus gracilis 0 0 0 0 0
17 Ankistrodesmus spiralis 0 0 0 0 0
18 Crucigenia lauterbonei 0 0 0 0 0
19 Pandorina morum 0 0 0 0 0
20 Pediastrum duplex 20.000 120.000 0 60.000 0
Dự án
Project
Ngày lấy mẫu/
Sampling date
:
:
GÓI THẦU FRM – PPTAF02 – DỰ ÁN QUẢN LÝ RỦI RO NGẬP NƯỚC
CHO KHU VỰC TP.HCM
12-13/10/2015

Stt
No
Tên khoa học
Science name
Vị trí lấy mẫu
Location
SV1-LT SV2-LT SV3-LT SV4-LT SV5-LT
21 Pediastrum tetras 0 125.000 0 20.000 0
22 Scenedesmus accuminatus 80.000 740.000 0 140.000 795.000
23 Scenedesmus quadricauda 0 105.000 0 295.000 240.000
Lớp Euglenophyceae 0 0 0 0 0
24 Euglena acus 20.000 10.000 75.000 40.000 0
25 Euglena oxyuris 0 0 125.000 0 0
26 Lepocinclis fusiformis 0 0 0 0 0
27 Lepocinclis ovum 0 0 0 0 0
28 Phacus curvicauda 0 0 0 0 0
29 Phacus longicauda 20.000 25.000 0 0 60.000
30 Phacus pleuronectes 0 75.000 0 0 0
31 Phacus tortus 0 0 0 50.000 0
Số lượng (cá thể/m3) 3.380.000 4.340.000 3.835.000 3.565.000 8.460.000
Ghi chú/Note:
SW1-LT: Vị trí cách sông Sài Gòn 200m về phía cống Vàm Thuật/ Location 200 meter from Sai Gon river towards the Vam
Thuat canal.(0603441;1197897)
SW2-LT: Vị trí tại điểm giao giữa rạch Chín Xiểng với kênh chính Tham Lương – Bến Cát – Nước Lên/ Location at the
junction between the Chin Xieng canal and the Tham Luong – Ben Cat – Nuoc Len channels (0602849;1197393)
SW3-LT: Vị trí tại điểm giao giữa rạch Ông Bầu với kênh chính Tham Lương – Bến Cát – Nước Lên/ Location at the junction
between the Ong Bau canal and the Tham Luong – Ben Cat – Nuoc Len channels (0602742;1197488)
SW4-LT: Vị trí tại điểm giao giữa rạch Ông Tổng với kênh chính Tham Lương – Bến Cát – Nước Lên/ Location at the
junction between the Ong Tong canal and the Tham Luong – Ben Cat – Nuoc Len channels (0602361;1198764)
SW5-LT: Vị trí tại điểm giao giữa rạch Bà Miên với kênh chính Tham Lương – Bến Cát – Nước Lên/ Location at the junction
between the Ba Mien canal and the Tham Luong – Ben Cat – Nuoc Len channels (0601002;1199835)
LT: Triều kiệt/ Low tide
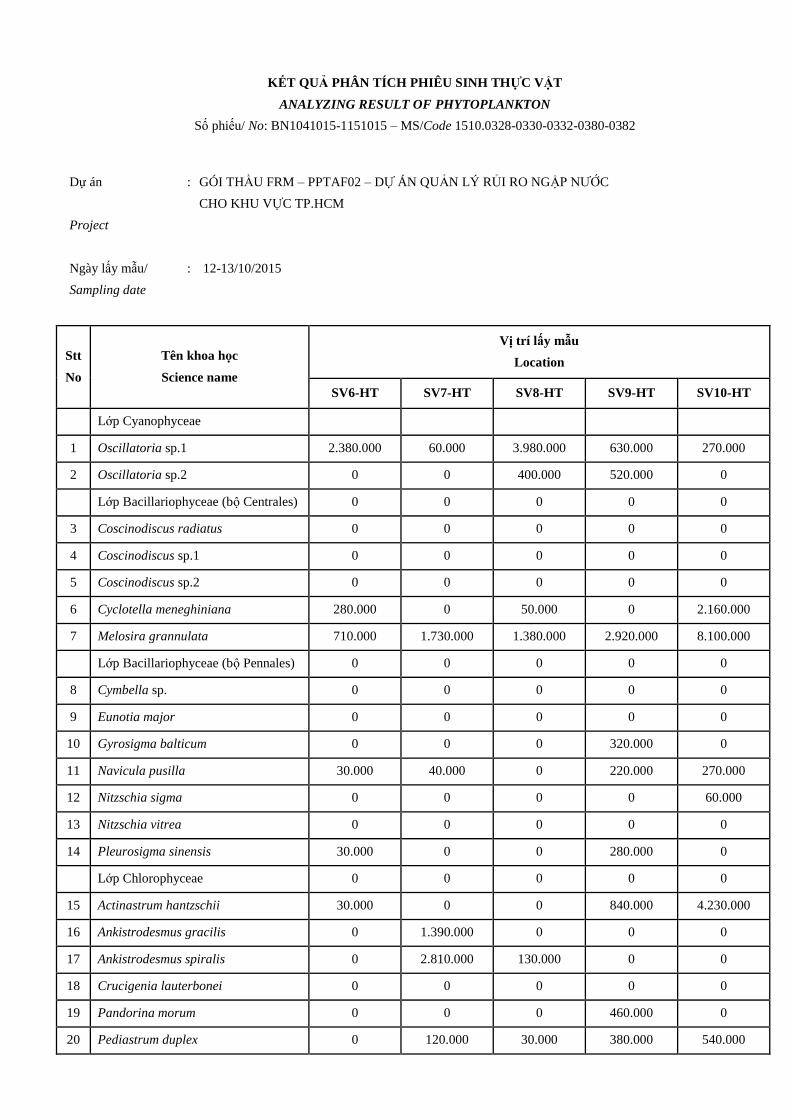
KẾT QUẢ PHÂN TÍCH PHIÊU SINH THỰC VẬT
ANALYZING RESULT OF PHYTOPLANKTON
Số phiếu/ No: BN1041015-1151015 – MS/Code 1510.0328-0330-0332-0380-0382
Stt
No
Tên khoa học
Science name
Vị trí lấy mẫu
Location
SV6-HT SV7-HT SV8-HT SV9-HT SV10-HT
Lớp Cyanophyceae
1 Oscillatoria sp.1 2.380.000 60.000 3.980.000 630.000 270.000
2 Oscillatoria sp.2 0 0 400.000 520.000 0
Lớp Bacillariophyceae (bộ Centrales) 0 0 0 0 0
3 Coscinodiscus radiatus 0 0 0 0 0
4 Coscinodiscus sp.1 0 0 0 0 0
5 Coscinodiscus sp.2 0 0 0 0 0
6 Cyclotella meneghiniana 280.000 0 50.000 0 2.160.000
7 Melosira grannulata 710.000 1.730.000 1.380.000 2.920.000 8.100.000
Lớp Bacillariophyceae (bộ Pennales) 0 0 0 0 0
8 Cymbella sp. 0 0 0 0 0
9 Eunotia major 0 0 0 0 0
10 Gyrosigma balticum 0 0 0 320.000 0
11 Navicula pusilla 30.000 40.000 0 220.000 270.000
12 Nitzschia sigma 0 0 0 0 60.000
13 Nitzschia vitrea 0 0 0 0 0
14 Pleurosigma sinensis 30.000 0 0 280.000 0
Lớp Chlorophyceae 0 0 0 0 0
15 Actinastrum hantzschii 30.000 0 0 840.000 4.230.000
16 Ankistrodesmus gracilis 0 1.390.000 0 0 0
17 Ankistrodesmus spiralis 0 2.810.000 130.000 0 0
18 Crucigenia lauterbonei 0 0 0 0 0
19 Pandorina morum 0 0 0 460.000 0
20 Pediastrum duplex 0 120.000 30.000 380.000 540.000
Dự án
Project
Ngày lấy mẫu/
Sampling date
:
:
GÓI THẦU FRM – PPTAF02 – DỰ ÁN QUẢN LÝ RỦI RO NGẬP NƯỚC
CHO KHU VỰC TP.HCM
12-13/10/2015

Stt
No
Tên khoa học
Science name
Vị trí lấy mẫu
Location
SV6-HT SV7-HT SV8-HT SV9-HT SV10-HT
21 Pediastrum tetras 310.000 3.480.000 190.000 60.000 0
22 Scenedesmus accuminatus 90.000 70.000 20.000 1.120.000 5.850.000
23 Scenedesmus quadricauda 220.000 540.000 70.000 540.000 990.000
Lớp Euglenophyceae 0 0 0 0 0
24 Euglena acus 0 0 60.000 360.000 630.000
25 Euglena oxyuris 0 0 0 40.000 80.000
26 Lepocinclis fusiformis 0 0 0 0 450.000
27 Lepocinclis ovum 0 0 0 0 180.000
28 Phacus curvicauda 0 0 0 360.000 540.000
29 Phacus longicauda 0 40.000 0 140.000 540.000
30 Phacus pleuronectes 60.000 0 0 340.000 90.000
31 Phacus tortus 0 0 0 80.000 270.000
Số lượng (cá thể/m3) 4.140.000 10.280.000 6.310.000 9.610.000 25.250.000
Ghi chú/Note:
SW6-HT: Vị trí tại điểm giao giữa rạch Cầu Cụt với kênh chính Tham Lương – Bến Cát – Nước Lên/ Location at the junction
between the Cau Cut canal and the Tham Luong – Ben Cat – Nuoc Len channels (0598939;1200474)
SW7-HT: Vị trí tại điểm giao giữa kênh Hy Vọng với kênh chính Tham Lương – Bến Cát – Nước Lên/ Location at the
junction between the Hy Vong channel and the Tham Luong – Ben Cat – Nuoc Len channels.(0596170;1197484)
SW8-HT: Vị trí tại cầu Tham Lương. sau điểm xả nước thải của KCN Tân Bình/ Location at the Tham Luong bridge, after the
discharging point of Tan Binh Industrial Park.(0595884;1196999)
SW9-HT: Vị trí tại cầu An Lạc / Location at the An Lac bridge.(0593163;1186046)
SW10-HT: Vị trí cách sông Chợ Đệm 200m về phía cầu Nước Lên/ Location 200 meter from Cho Dem river toward the Nuoc
Len bridge.(0593205;1184253)
HT: Triều cường/ High tide

KẾT QUẢ PHÂN TÍCH PHIÊU SINH THỰC VẬT
ANALYZING RESULT OF PHYTOPLANKTON
Số phiếu/ No: BN1041015-1151015 – MS/Code 1510.0329-0331-0333-0381-0383
Stt
No
Tên khoa học
Science name
Vị trí lấy mẫu
Location
SV6-LT SV7-LT SV8-LT SV9-LT SV10-LT
Lớp Cyanophyceae
1 Oscillatoria sp.1 1.290.000 900.000 6.270.000 140.000 180.000
2 Oscillatoria sp.2 610.000 0 290.000 0 0
Lớp Bacillariophyceae (bộ Centrales) 0 0 0 0 0
3 Coscinodiscus radiatus 0 0 0 0 0
4 Coscinodiscus sp.1 0 0 0 0 0
5 Coscinodiscus sp.2 0 0 0 0 0
6 Cyclotella meneghiniana 1.900.000 750.000 0 775.000 740.000
7 Melosira grannulata 4.705.000 1.420.000 240.000 2.820.000 800.000
Lớp Bacillariophyceae (bộ Pennales) 0 0 0 0 0
8 Cymbella sp. 0 0 0 0 0
9 Eunotia major 0 0 0 0 0
10 Gyrosigma balticum 0 0 0 0 0
11 Navicula pusilla 0 0 0 290.000 40.000
12 Nitzschia sigma 0 0 0 90.000 0
13 Nitzschia vitrea 0 0 0 0 0
14 Pleurosigma sinensis 0 0 0 0 0
Lớp Chlorophyceae 0 0 0 0 0
15 Actinastrum hantzschii 0 0 0 3.240.000 1.020.000
16 Ankistrodesmus gracilis 0 1.770.000 620.000 0 0
17 Ankistrodesmus spiralis 0 1.425.000 0 0 0
18 Crucigenia lauterbonei 0 0 0 0 0
19 Pandorina morum 0 0 0 0 130.000
Dự án
Project
Ngày lấy mẫu/
Sampling date
:
:
GÓI THẦU FRM – PPTAF02 – DỰ ÁN QUẢN LÝ RỦI RO NGẬP NƯỚC
CHO KHU VỰC TP.HCM
12-13/10/2015

Stt
No
Tên khoa học
Science name
Vị trí lấy mẫu
Location
SV6-LT SV7-LT SV8-LT SV9-LT SV10-LT
20 Pediastrum duplex 0 0 75.000 290.000 40.000
21 Pediastrum tetras 0 4.915.000 240.000 0 0
22 Scenedesmus accuminatus 0 70.000 700.000 1.835.000 780.000
23 Scenedesmus quadricauda 125.000 295.000 125.000 125.000 90.000
Lớp Euglenophyceae 0 0 0 0 0
24 Euglena acus 70.000 0 25.000 470.000 170.000
25 Euglena oxyuris 60.000 0 90.000 110.000 110.000
26 Lepocinclis fusiformis 0 0 0 290.000 0
27 Lepocinclis ovum 0 0 0 60.000 160.000
28 Phacus curvicauda 0 0 0 0 20.000
29 Phacus longicauda 0 0 0 180.000 60.000
30 Phacus pleuronectes 0 0 0 1.400.000 0
31 Phacus tortus 0 0 0 110.000 0
Số lượng (cá thể/m3) 8.760.000 11.545.000 8.675.000 12.225.000 4.340.000
Ghi chú/Note:
SW6-LT: Vị trí tại điểm giao giữa rạch Cầu Cụt với kênh chính Tham Lương – Bến Cát – Nước Lên/ Location at the
junction between the Cau Cut canal and the Tham Luong – Ben Cat – Nuoc Len channels (0598939;1200474)
SW7-LT: Vị trí tại điểm giao giữa kênh Hy Vọng với kênh chính Tham Lương – Bến Cát – Nước Lên/ Location at the
junction between the Hy Vong channel and the Tham Luong – Ben Cat – Nuoc Len channels.(0596170;1197484)
SW8-LT: Vị trí tại cầu Tham Lương. sau điểm xả nước thải của KCN Tân Bình/ Location at the Tham Luong bridge,
after the discharging point of Tan Binh Industrial Park.(0595884;1196999)
SW9-LT: Vị trí tại cầu An Lạc / Location at the An Lac bridge.(0593163;1186046)
SW10-LT: Vị trí cách sông Chợ Đệm 200m về phía cầu Nước Lên/ Location 200 meter from Cho Dem river toward the
Nuoc Len bridge.(0593205;1184253)
LT: Triều kiệt/ Low tide

KẾT QUẢ PHÂN TÍCH MẪU
ANALYZING RESULT OF SAMPLE
Số phiếu/No: BN1041015-1151015 – MS/Code1510.0299-0301.0377
Dự án
Project
Ký hiệu mẫu
Type of sample
:
:
:
GÓI THẦU FRM – PPTAF02 – DỰ ÁN QUẢN LÝ RỦI RO NGẬP NƯỚC
CHO KHU VỰC TP.HCM
Nước ngầm
Groundwater
Ngày lấy mẫu/
Sampling date
:
12-13/10/2015
Stt
No.
Chỉ tiêu
Parameter
Đơn vị
Unit
GW1
1510.0299
GW2
1510.0300
GW3
1510.0301
GW4
1510.0377
QCVN 09:2008/
BTNMT
Phương pháp đo đạc/phân
tích
Measuring/Analyzing method
1 pH, at 25oC - 4.41 4.18 4.25 3.65 5.5 – 8.5
TCVN 6492:2011 ()
ISO 10523:2008
2 Độ đục/
Turbidity NTU
KPH/ND
(LOD = 0.5)
KPH/ND
(LOD = 0.5)
KPH/ND
(LOD = 0.5) 31.9 - SMEWW 2130 B (2012) ()
3 Cl- mg/l 81.1 101.9 56.7 93.0 ≤ 250 SMEWW 4110 B (2012) ()
4 TDS mg/l 269 254 179 668 - SOP-HTN06
5 TS mg/l 269 254 179 673 ≤ 1500 SMEWW 2540 B (2012)
6 COD (KMnO4) mgO2/l KPH/ND
(LOD = 0.5)
KPH/ND
(LOD = 0.5)
KPH/ND
(LOD = 0.5) 0.8 ≤ 4
TCVN 6186 :1996
ISO 8467:1993 (E)
7 BOD5 mgO2/l KPH/ND
(LOD = 2)
KPH/ND
(LOD = 2)
KPH/ND
(LOD = 2)
KPH/ND
(LOD = 2) - SMEWW 5210 B (2012) ()
8 N-NH4+ mg/l 9.3 0.14 1.87 0.14 ≤ 0.1
TCVN SMEWW 4500-NH4+
.F
(2012) ()

Stt
No.
Chỉ tiêu
Parameter
Đơn vị
Unit
GW1
1510.0299
GW2
1510.0300
GW3
1510.0301
GW4
1510.0377
QCVN 09:2008/
BTNMT
Phương pháp đo đạc/phân
tích
Measuring/Analyzing method
9 N-NO2-
mg/l KPH/ND
(LOD = 0.003)
KPH/ND
(LOD = 0.003)
KPH/ND
(LOD = 0.003)
KPH/ND
(LOD = 0.003) ≤ 1.0 SMEWW 4110 B (2012) ()
10 N-NO3- mg/l 10.5 0.78 9.09 0.17 ≤ 15 SMEWW 4110 B (2012) ()
11 P-PO43-
mg/l KPH/ND
(LOD = 0.01)
KPH/ND
(LOD = 0.01)
KPH/ND
(LOD = 0.01)
KPH/ND
(LOD = 0.01) - SMEWW 4500-P.D (2012) ()
12 As mg/l KPH/ND
(LOD = 0.004)
KPH/ND
(LOD = 0.004)
KPH/ND
(LOD = 0.004)
KPH/ND
(LOD = 0.004) ≤ 0.05 SMEWW 3120 B (2012) ()
13 Cd mg/l KPH/ND
(LOD = 0.003)
KPH/ND
(LOD = 0.003)
KPH/ND
(LOD = 0.003)
KPH/ND
(LOD = 0.003) ≤ 0.005 SMEWW 3120 B (2012) ()
14 Pb mg/l KPH/ND
(LOD = 0.005) 0.006
KPH/ND
(LOD = 0.005) 0.010 ≤ 0.01 SMEWW 3120 B (2012) ()
15 Hg mg/l KPH/ND
(LOD = 0.001)
KPH/ND
(LOD = 0.001)
KPH/ND
(LOD = 0.001)
KPH/ND
(LOD = 0.001) ≤ 0.001 SMEWW 3120 B (2012)
16 Cr
mg/l KPH/ND
(LOD = 0.003)
KPH/ND
(LOD = 0.003)
KPH/ND
(LOD = 0.003)
KPH/ND
(LOD = 0.003) - SMEWW 3120 B (2012) ()
17 Fe mg/l 0.017 0.023 0.008 17.64 ≤ 5 SMEWW 3120 B (2012) ()
18 Dầu mỡ/
Oil & grease mg/l
KPH/ND
(LOD = 0.1)
KPH/ND
(LOD = 0.1)
KPH/ND
(LOD = 0.1)
KPH/ND
(LOD = 0.1) - SMEWW 5520 C (2012)
19 E.Coli MPN/100ml KPH/ND KPH/ND KPH/ND KPH/ND
Không phát
hiện thấy/ Not
detected
SMEWW 9221 F (2012)
20 Coliform MPN/100ml KPH/ND KPH/ND KPH/ND KPH/ND ≤ 3 SMEWW 9221 D (2012)

Stt
No.
Chỉ tiêu
Parameter
Đơn vị
Unit
GW1
1510.0299
GW2
1510.0300
GW3
1510.0301
GW4
1510.0377
QCVN 09:2008/
BTNMT
Phương pháp đo đạc/phân
tích
Measuring/Analyzing method
Ghi chú/Note:
() Phương pháp đo đạc/phân tích được VILAS công
nhận/Measuring/analyzing method is accredited by VILAS.
Phương pháp lấy mẫu nước ngầm/ Groudwater samling: TCVN 6663-
11:2011 (ISO 5667-11:1992).
QCVN09:2008/BTNMT: Quy chuẩn kỹ thuật quốc gia về chất lượng nước
ngầm/ National technical regulation underground water quality.
KPH: Không phát hiện. LOD: Giới hạn phát hiện của phương pháp đo
đạc/phân tích./
ND: Not detected. LOD: Limit of detection
GW1: Đoạn từ sông Sài Gòn đến cầu An Lộc, tại khu vực rạch Chín Xiểng (giếng tại sân bóng đá Thái Sơn
– 566/45 Nguyễn Thái Sơn - khoan năm 2012. sâu 35m)/ The distance from Sai Gon river to An Loc bridge,
at Chin Xieng canal area (well at Thai Son football ground – 566/45 Nguyen Thai Son Street – drilled in
2012, 35m depth).(0602939;1197249)
GW2: Đoạn từ cầu An Lộc đến cầu Trường Đại, tại khu vực rạch Cầu Cụt (giếng tại nhà ông cụ tại rạch Cầu
Cụt – 1396/76 Lê Đức Thọ, phường 13, quận Gò Vấp - khoan năm 1997. sâu 30m )/ The distance from An
Loc bridge to Truong Dai bridge, at Cau Cut cannal area. (well at household at Cau Cut cannal – 1396/76
Le Duc Tho, Ward 13, Go Vap district - drilled in 1997, 30m depth) (0589803;1200432)
GW3: Đoạn từ cầu Trường Đại đến cầu Chợ Cầu.,tại khu vực cầu Trường Đai (giếng tại Công ty Nam
Bang.khoan năm 2005. sâu 100m)/ The distance from Truong Dai bridge to Cho Cau bridge, at Truong Dai
bridge area (well at Nam Bang company, drilled in 2005,100m depth) (0598243;1200684).
GW4: Đo3;1từ cầu Chợ Đệm đến cầu Tham Lương, tại kênh Hy Vọng (giếng tại xưởng mộc, khoan năm
2012, sâu 30m)/The distance from Cho Dem bridge to Tham Luong bridge, at Hy Vong canal ( well at
woodshop, drilled in 2012. 30m depth)(0596049;1197162)

KẾT QUẢ PHÂN TÍCH MẪU
ANALYZING RESULT OF SAMPLE
Số phiếu/No: BN1151015 – MS/Code1510.0372-0376
Dự án
Project
Ký hiệu mẫu
Type of sample
:
:
:
:
GÓI THẦU FRM – PPTAF02 – DỰ ÁN QUẢN LÝ RỦI RO NGẬP NƯỚC
CHO KHU VỰC TP.HCM
Nước ngầm
Groundwater
Ngày lấy mẫu/
Sampling date
:
12-13/10/2015
Stt
No.
Chỉ tiêu
Parameter
Đơn vị
Unit
GW5
1510.0376
GW6
1510.0375
GW7
1510.0374
GW8
1510.0373
GW9
1510.0372
QCVN 09:2008/
BTNMT
Phương pháp đo đạc/phân tích
Measuring/Analyzing method
1 pH - 4.59 5.20 6.04 5.84 6.17 5.5 – 8.5 TCVN 6492:2011 ()
ISO 10523:2008
2 Độ đục/
Turbidity NTU
KPH/ND
(LOD = 0.5) 2.34
KPH/ND
(LOD = 0.5) 28.3 58.7 - SMEWW 2130 B (2012) ()
3 Cl- mg/l 170.0 18.0 143.0 19 41.0 ≤ 250 SMEWW 4110 B (2012) ()
4 TDS mg/l 316 48.9 249 78.5 138.8 - SOP-HTN06
5 TS mg/l 316 48.9 249 83 149 ≤ 1500 SMEWW 2540 B (2012)
6 COD (KMnO4) mgO2/l KPH/ND
(LOD = 0.5)
KPH/ND
(LOD = 0.5)
KPH/ND
(LOD = 0.5)
KPH/ND
(LOD = 0.5)
KPH/ND
(LOD = 0.5) ≤ 4
TCVN 6186 :1996
ISO 8467:1993 (E)
7 BOD5 mgO2/l KPH/ND
(LOD =2)
KPH/ND
(LOD =2)
KPH/ND
(LOD =2)
KPH/ND
(LOD =2)
KPH/ND
(LOD =2) - SMEWW 5210 B (2012) ()
8 N-NH4+ mg/l 0.04 0.06 0.05 0.17 0.12 ≤ 0.1
TCVN SMEWW 4500-NH4+
.F
(2012) ()
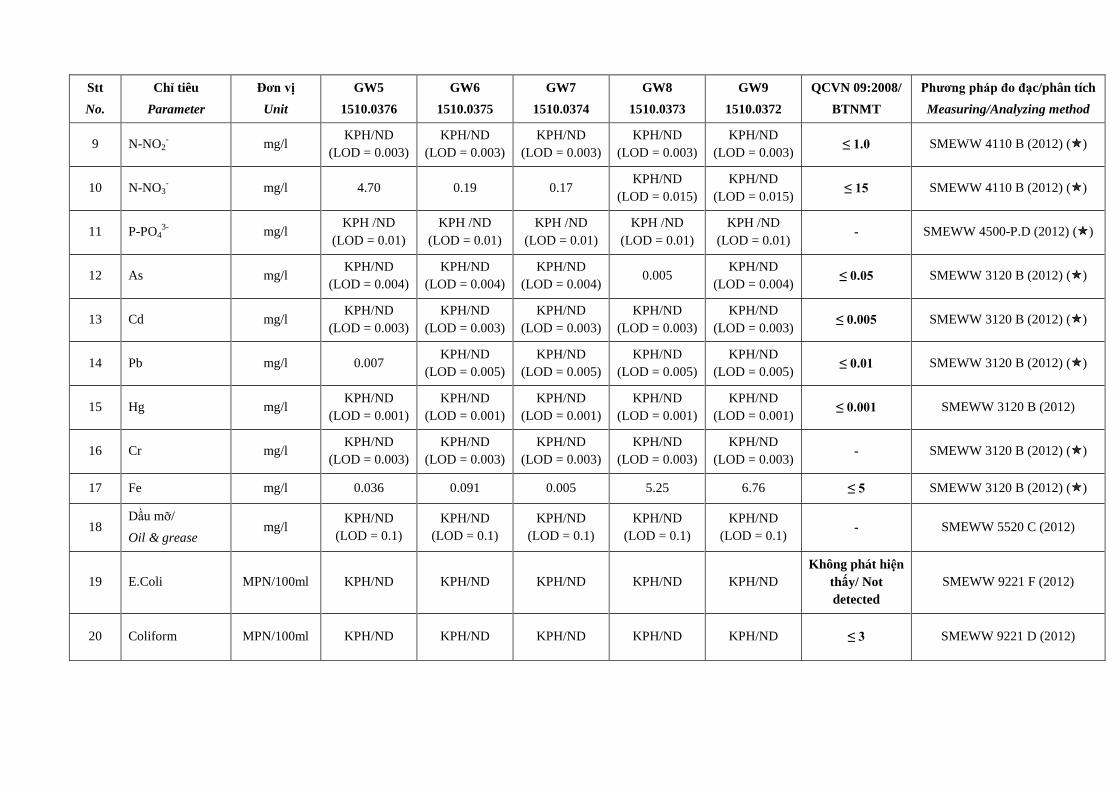
Stt
No.
Chỉ tiêu
Parameter
Đơn vị
Unit
GW5
1510.0376
GW6
1510.0375
GW7
1510.0374
GW8
1510.0373
GW9
1510.0372
QCVN 09:2008/
BTNMT
Phương pháp đo đạc/phân tích
Measuring/Analyzing method
9 N-NO2-
mg/l KPH/ND
(LOD = 0.003)
KPH/ND
(LOD = 0.003)
KPH/ND
(LOD = 0.003)
KPH/ND
(LOD = 0.003)
KPH/ND
(LOD = 0.003) ≤ 1.0 SMEWW 4110 B (2012) ()
10 N-NO3- mg/l 4.70 0.19 0.17
KPH/ND
(LOD = 0.015)
KPH/ND
(LOD = 0.015) ≤ 15 SMEWW 4110 B (2012) ()
11 P-PO43-
mg/l KPH /ND
(LOD = 0.01)
KPH /ND
(LOD = 0.01)
KPH /ND
(LOD = 0.01)
KPH /ND
(LOD = 0.01)
KPH /ND
(LOD = 0.01) - SMEWW 4500-P.D (2012) ()
12 As mg/l KPH/ND
(LOD = 0.004)
KPH/ND
(LOD = 0.004)
KPH/ND
(LOD = 0.004) 0.005
KPH/ND
(LOD = 0.004) ≤ 0.05 SMEWW 3120 B (2012) ()
13 Cd mg/l KPH/ND
(LOD = 0.003)
KPH/ND
(LOD = 0.003)
KPH/ND
(LOD = 0.003)
KPH/ND
(LOD = 0.003)
KPH/ND
(LOD = 0.003) ≤ 0.005 SMEWW 3120 B (2012) ()
14 Pb mg/l 0.007 KPH/ND
(LOD = 0.005)
KPH/ND
(LOD = 0.005)
KPH/ND
(LOD = 0.005)
KPH/ND
(LOD = 0.005) ≤ 0.01 SMEWW 3120 B (2012) ()
15 Hg mg/l KPH/ND
(LOD = 0.001)
KPH/ND
(LOD = 0.001)
KPH/ND
(LOD = 0.001)
KPH/ND
(LOD = 0.001)
KPH/ND
(LOD = 0.001) ≤ 0.001 SMEWW 3120 B (2012)
16 Cr
mg/l KPH/ND
(LOD = 0.003)
KPH/ND
(LOD = 0.003)
KPH/ND
(LOD = 0.003)
KPH/ND
(LOD = 0.003)
KPH/ND
(LOD = 0.003) - SMEWW 3120 B (2012) ()
17 Fe mg/l 0.036 0.091 0.005 5.25 6.76 ≤ 5 SMEWW 3120 B (2012) ()
18 Dầu mỡ/
Oil & grease mg/l
KPH/ND
(LOD = 0.1)
KPH/ND
(LOD = 0.1)
KPH/ND
(LOD = 0.1)
KPH/ND
(LOD = 0.1)
KPH/ND
(LOD = 0.1) - SMEWW 5520 C (2012)
19 E.Coli MPN/100ml KPH/ND KPH/ND KPH/ND KPH/ND KPH/ND
Không phát hiện
thấy/ Not
detected
SMEWW 9221 F (2012)
20 Coliform MPN/100ml KPH/ND KPH/ND KPH/ND KPH/ND KPH/ND ≤ 3 SMEWW 9221 D (2012)

Ghi chú/Note:
() Phương pháp đo đạc/phân tích được VILAS công
nhận/Measuring/analyzing method is accredited by VILAS.
Phương pháp lấy mẫu nước ngầm/ Groudwater samling: TCVN 6663-
11:2011 (ISO 5667-11:1992).
QCVN09:2008/BTNMT: Quy chuẩn kỹ thuật quốc gia về chất lượng nước
ngầm/ National technical regulation underground water quality.
KPH: Không phát hiện, LOD: Giới hạn phát hiện của phương pháp đo
đạc/phân tích./
ND: Not detected. LOD: Limit of detection
GW5: Đoạn từ cầu Tham Lương đến cống Cầu Bưng, tại cầu Tham Lương (quán nước mía cạnh cầu Tham
Lương, khoan năm 2000, sâu 20m)/ The distance from Tham Luong to Cau Bung bridge, at Tham Luong
bridge (store near Tham Luong bridge, drilled in 2000, 20m depth) (0595775;1196964).
GW6: Đoạn từ cống Cầu Bưng đến cầu Bình Thuận, tại cầu Bình Thuận (hộ dân Nguyễn Thị Viết – 839/5
QL1A, khu phố 1, phường Bình Hưng Hòa, Bình Tân - khoan khoảng từ 2000-2003, sâu 80m)/ The distance
from Cau Bung bridge to Binh Thuan bridge, at Binh Thuan bridge (well at Nguyen Thi Viet household –
839/5, National Highway No.1A, Town 1, Binh Hung Hoa ward, Binh Tan District - drilled between in 2000-
2003, 80m depth) (0592222;1192541).
GW7: Đoạn từ cầu Bình Thuận đến cầu Bà Hom, tại cầu Bà Hom (Chị Thuận – 35 đường Bờ Sông, khu phố
2, phường Tân Tạo A, Quận Bình Tân - khoan đã hơn 10 năm, sâu 120m)/ The distance from Binh Thuan
bridge to Ba Hom bridge, at ba Hom bridge (well at Ms.Thuan household – 35 Bo Song street, Town 2, Tan
Tao A ward, Binh Tan District - drilled more than 10 years, 120m depth) (0591433;1189178).
GW8: Đoạn từ cầu An Lạc đến cầu An Lập (tại số nhà 1233 QL1, phường An Lạc, Q. Bình Tân- khoan năm
2011, sâu 140m)/ The distance from An Lac bridge to An Lap bridge (well at household No.1233, National
Highway No.1, An Lac ward, Binh Tan District – drilled in 2011, 140m depth) (0592998;1186074).
GW9: Đoạn từ cầu Nuoc Len đến sông Chợ Đệm (tại hộ dân Lê Tấn Bê, khoan tháng 08/2015, sâu 150m)/
The distance from Nuoc Len bridge to Cho Dem river (well at Le Tan Be household, drilled in 08/2015, 150m
depth) (0593359;1185030)

KẾT QUẢ PHÂN TÍCH MẪU
ANALYZING RESULT OF SAMPLE
Số phiếu/No: BN1041015-1151015 – MS/Code 1510.0293-0294.0378-0379
Dự án
Project
Ký hiệu mẫu
Type of sample
:
:
:
:
GÓI THẦU FRM – PPTAF02 – DỰ ÁN QUẢN LÝ RỦI RO NGẬP NƯỚC
CHO KHU VỰC TP.HCM
Đất
Soil
Ngày lấy mẫu/
Sampling date
:
12-13/10/2015
Stt
No.
Chỉ tiêu
Parameter
Đơn vị
Unit
S1
1510.0379
S2
1510.0378
S3
1510.293
S4
1510.0294
QCVN 03:2008/
BTNMT
Phương pháp đo đạc/phân
tích
Measuring/Analyzing
method Residental land Commercial
land
1 pH - 3.08 3.47 5.86 3.93 - - TCVN 6649:2000,
SMEWW 3120 B (2012) ()
2 As mg/kgDW 2.37 4.12 1.66 3.00 ≤ 12 ≤ 12 TCVN 6649:2000,
SMEWW 3120 B (2012) ()
3 Cd mg/kgDW KPH/ND
(LOD = 0.5) 0.51
KPH/ND
(LOD = 0.5)
KPH/ND
(LOD = 0.5) ≤ 5 ≤ 5
TCVN 6649:2000,
SMEWW 3120 B (2012) ()
4 Cu mg/kgDW 28.8 91.7 48.5 22.8 ≤ 70 ≤ 100 TCVN 6649:2000,
SMEWW 3120 B (2012) ()
5 Pb mg/kgDW 21.0 59.8 16.4 16.3 ≤ 120 ≤ 200 TCVN 6649:2000,
SMEWW 3120 B (2012) ()
6 Zn mg/kgDW 59.4 189 119 28.9 ≤ 200 ≤ 300 TCVN 6649:2000,

Stt
No.
Chỉ tiêu
Parameter
Đơn vị
Unit
S1
1510.0379
S2
1510.0378
S3
1510.293
S4
1510.0294
QCVN 03:2008/
BTNMT
Phương pháp đo đạc/phân
tích
Measuring/Analyzing
method Residental land Commercial
land
SMEWW 3120 B (2012) ()
7 Hg mg/kgDW KPH/ND
(LOD = 0.5)
KPH/ND
(LOD = 0.5)
KPH/ND
(LOD = 0.5)
KPH/ND
(LOD = 0.5) - -
TCVN 6649:2000,
SMEWW 3120 B (2012) ()
Ghi chú/ Note:
() Phương pháp đo đạc/phân tích được VILAS công nhận/Measuring/analyzing method is
accredited by VILAS.
KPH: Không phát hiện. LOD: Giới hạn phát hiện của phương pháp đo đạc/phân tích.
ND: Not detected. LOD: Limit of detection.
DW: Dry weight.
QCVN 03:2008/BTNMT: Quy chuẩn kỹ thuật quốc gia về giới hạn cho phép của kim loại
nặng trong đất./National technical regulation on the allowable limits of heavy metals in the
soils.
S1: Đoạn từ cầu Tham Lương đến cầu Chợ Cầu, từ bờ kênh Tham Lương cách kênh Hy Vọng
500m về phía Tham Lương (đất đắp khoảng từ năm 2013)/ The distance from Tham Luong
bridge to Cho Cau bridge, at the Tham Luong canal that distance from the Hy Vong cannal
500m( Soil was covered from 2013) (0596032;1197167)
S2: Đoạn từ cầu Tham Lương đến cầu Chợ Cầu, kênh Hy Vong (đất đắp khoảng từ năm 2012-
2013)/ The distance from Tham Luong bridge to Cho Cau bridge, the Hy Vong cannal
(0596141;1197414)
S3: Đoạn từ cầu Chợ Cầu đến cầu Trường Đai, tại khu vực cầu Chợ Cầu (đất đang đắp - tháng
10/2015)/ The distance from Cho Cau bridge to Truong Dai bridge, at Cho Cau bridge
area.(0587890;1199263)
S4: Đoạn từ cầu Chợ Cầu đến cầu Trường Đai, tại khu vực cầu Trường Đai (đất đắp khoảng từ
năm 2012-2013)/ The distance from Cho Cau bridge to Truong Dai bridge, at Truong Dai
bridge area (Soil was covered from 2012-2013) (0588784;1200502)

KẾT QUẢ PHÂN TÍCH MẪU
ANALYZING RESULT OF SAMPLE
Số phiếu/No: BN1041015 – MS/Code1510.0293-0298
Dự án
Project
Ký hiệu mẫu
Type of sample
:
:
:
:
GÓI THẦU FRM – PPTAF02 – DỰ ÁN QUẢN LÝ RỦI RO NGẬP NƯỚC
CHO KHU VỰC TP.HCM
Đất
Soil
Ngày lấy mẫu/
Sampling date
:
12/10/2015
Stt
No.
Chỉ tiêu
Parameter
Đơn vị
Unit
S5
1510.0295
S6
1510.0296
S7
1510.0297
S8
1510.0298
QCVN 03:2008/
BTNMT Phương pháp đo đạc/phân tích
Measuring/Analyzing method Residental
land
Commercial
land
1 pH - 3.20 2.55 2.99 2.86 - - TCVN 5979 : 2007
(ISO 10390 : 2005)
2 As mg/kgDW 3.34 4.00 6.7 8.19 ≤ 12 ≤ 12 TCVN 6649:2000,
SMEWW 3120 B (2012) ()
3 Cd mg/kgDW KPH/ND
(LOD = 0.5)
KPH/ND
(LOD = 0.5)
KPH/ND
(LOD = 0.5)
KPH/ND
(LOD = 0.5) ≤ 5 ≤ 5
TCVN 6649:2000,
SMEWW 3120 B (2012) ()
4 Cu mg/kgDW 27.7 22.8 85.5 26.3 ≤ 70 ≤ 100 TCVN 6649:2000,
SMEWW 3120 B (2012) ()
5 Pb mg/kgDW 22.5 20.0 27.0 24.3 ≤ 120 ≤ 200 TCVN 6649:2000,
SMEWW 3120 B (2012) ()
6 Zn mg/kgDW 71.8 48.1 46.3 46.2 ≤ 200 ≤ 300 TCVN 6649:2000,
SMEWW 3120 B (2012) ()

Stt
No.
Chỉ tiêu
Parameter
Đơn vị
Unit
S5
1510.0295
S6
1510.0296
S7
1510.0297
S8
1510.0298
QCVN 03:2008/
BTNMT Phương pháp đo đạc/phân tích
Measuring/Analyzing method Residental
land
Commercial
land
7 Hg mg/kgDW KPH/ND
(LOD = 0.5)
KPH/ND
(LOD = 0.5)
KPH/ND
(LOD = 0.5)
KPH/ND
(LOD = 0.5) - -
TCVN 6649:2000,
SMEWW 3120 B (2012) ()
Ghi chú/Note:
() Phương pháp đo đạc/phân tích được VILAS công nhận/Measuring/analyzing method
is accredited by VILAS.
KPH: Không phát hiện. LOD: Giới hạn phát hiện của phương pháp.
ND: Not detected. LOD: Limit of detection.
DW: Dry weight.
QCVN 03:2008/BTNMT: Quy chuẩn kỹ thuật quốc gia về giới hạn cho phép của kim
loại nặng trong đất./National technical regulation on the allowable limits of heavy metals
in the soils.
S5: Đoạn từ cầu Trường Đai đến cầu An Lộc, tại khu vực rạch Cầu Cụt (đất đắp được
khoảng từ năm 2013)/ The distance from Truong Dai to An Loc bridge, at Cau Cut canal
area (Soil was covered from 2013) (0589816;1200448)
S6: Đoạn từ cầu Trường Đai đến cầu An Lộc, tại khu vực rạch Bà Miên (đất đắp từ
09/2015)/ The distance from Truong Dai to An Loc bridge. at Ba Mien canal area (Soil
was covered from 09/2015) (0591895;1199754)
S7: Đoạn từ cầu An Lộc đến sông Sài Gòn, tại khu vực rạch Ông Tổng (đất đắp khoảng từ
năm 2012-2013)/ The distance from An Loc bridge to Sai Gon river, at Ong Tong canal
area (Soil was covered from 2012-2013)(0593267;1192758)
S8: Đoạn từ cầu An Lộc đến sông Sài Gòn, tại khu vực rạch Ông Bầu (đất đắp từ tháng
08/2015)/ The distance from An Loc bridge to Sai Gon river, at Ong Bau canal area (Soil
was covered from 08/2015) (0602746;1197511)

KẾT QUẢ PHÂN TÍCH MẪU
ANALYZING RESULT OF SAMPLE
Số phiếu/No: BN1041015 – MS/Code 1510.0303-0305-0307-0309
Dự án
Project
Ký hiệu mẫu
Type of sample
:
:
:
GÓI THẦU FRM – PPTAF02 – DỰ ÁN QUẢN LÝ RỦI RO NGẬP NƯỚC
CHO KHU VỰC TP.HCM
Bùn đáy – Tầng sâu (0,5m)
Sediment – Depth layer (0.5m)
Ngày lấy mẫu/
Sampling date
:
12-13/10/2015
Stt
No.
Chỉ tiêu
Parameter
Đơn vị
Unit
Sed1
1510.0303
Sed2
1510.0305
Sed3
1510.0307
Sed4
1510.0309
QCVN
43:2012/
BTNMT
Phương pháp đo đạc/
phân tích
Measuring/Analyzing method
1 As mg/kgDW 4.84 5.25 3.48 4.75 ≤ 17.0 TCVN 6649:2000,
SMEWW 3120 B (2012) ()
2 Cd mg/kgDW KPH/ND
(LOD = 0.5)
KPH/ND
(LOD = 0.5)
KPH/ND
(LOD = 0.5)
KPH/ND
(LOD = 0.5) ≤ 3.5
TCVN 6649:2000,
SMEWW 3120 B (2012) ()
3 Cr mg/kgDW 87.3 68.6 72.8 62.5 ≤ 90 TCVN 6649:2000,
SMEWW 3120 B (2012) ()
4 Hg mg/kgDW KPH/ND
(LOD = 0.5)
KPH/ND
(LOD = 0.5)
KPH/ND
(LOD = 0.5)
KPH/ND
(LOD = 0.5) ≤ 0.5
TCVN 6649:2000,
SMEWW 3120 B (2012) ()
5 Pb mg/kgDW 40.2 62.7 32.5 25.4 ≤ 91.3 TCVN 6649:2000,
SMEWW 3120 B (2012) ()
6 Fe mg/kgDW 46364 42583 25578 26302 - TCVN 6649:2000,
SMEWW 3120 B (2012) ()
7 PAHs µg/kg KPH/ND KPH/ND KPH/ND KPH/ND -
Ref. EPA 8272
Acenaphthen µg/kg KPH/ND
(LOD = 20)
KPH/ND
(LOD = 20)
KPH/ND
(LOD = 20)
KPH/ND
(LOD = 20) ≤ 88.9

Acenaphthylen µg/kg KPH/ND
(LOD = 10)
KPH/ND
(LOD = 10)
KPH/ND
(LOD = 10)
KPH/ND
(LOD = 10) ≤ 128
Anthracen µg/kg KPH/ND
(LOD = 10)
KPH/ND
(LOD = 10)
KPH/ND
(LOD = 10)
KPH/ND
(LOD = 10) ≤ 245
Benzo(a) anthracen µg/kg KPH/ND
(LOD = 10)
KPH/ND (
LOD = 10)
KPH/ND (
LOD = 10)
KPH/ND (
LOD = 10) ≤ 385
Benzo(e) pyren µg/kg KPH/ND
(LOD = 50)
KPH/ND
(LOD = 50)
KPH/ND
(LOD = 50)
KPH/ND
(LOD = 50) ≤ 782
Chrysen µg/kg KPH/ND
(LOD = 10)
KPH/ND
(LOD = 10)
KPH/ND
(LOD = 10)
KPH/ND
(LOD = 10) ≤ 862
Dibenzo (a.h) anthracen µg/kg KPH/ND
(LOD = 10)
KPH/ND
(LOD = 10)
KPH/ND
(LOD = 10)
KPH/ND
(LOD = 10) ≤ 135
Fluoranthen µg/kg KPH/ND
(LOD = 20)
KPH/ND
(LOD = 20)
KPH/ND
(LOD = 20)
KPH/ND
(LOD = 20) ≤ 2355
Fluoren µg/kg KPH/ND
(LOD = 20)
KPH/ND
(LOD = 20)
KPH/ND
(LOD = 20)
KPH/ND
(LOD = 20) ≤ 144
2-Methylnapthalen µg/kg KPH/ND
(LOD = 50)
KPH/ND
(LOD = 50)
KPH/ND
(LOD = 50)
KPH/ND
(LOD = 50) ≤ 201
Ref. EPA 8272
Naphthalen µg/kg KPH/ND
(LOD = 50)
KPH/ND
(LOD = 50)
KPH/ND
(LOD = 50)
KPH/ND
(LOD = 50) ≤ 391
Phenanthren µg/kg KPH/ND
(LOD = 10)
KPH/ND
(LOD = 10)
KPH/ND
(LOD = 10)
KPH/ND
(LOD = 10) ≤ 515
Pyren µg/kg KPH/ND
(LOD = 10)
KPH/ND
(LOD = 10)
KPH/ND
(LOD = 10)
KPH/ND
(LOD = 10) ≤ 875
8 DDT µg/kg KPH/ND
(LOD = 3)
KPH/ND
(LOD = 3)
KPH/ND
(LOD = 3)
KPH/ND
(LOD = 3) ≤ 4.8
Ref. EPA 1699 &
AOAC 2007.01

9 Thuốc trừ sâu gốc clo/
Organochlorine pesticides µg/kg KPH/ND KPH/ND KPH/ND KPH/ND -
Ref. EPA 1699 &
AOAC 2007.01
a-lindane µg/kg KPH/ND
(LOD = 1)
KPH/ND
(LOD = 1)
KPH/ND
(LOD = 1)
KPH/ND
(LOD = 1) -
b-lindane µg/kg KPH/ND
(LOD = 1)
KPH/ND
(LOD = 1)
KPH/ND
(LOD = 1)
KPH/ND
(LOD = 1) -
Lindane µg/kg KPH/ND
(LOD = 1)
KPH/ND
(LOD = 1)
KPH/ND
(LOD = 1)
KPH/ND
(LOD = 1) ≤ 1.4
g-lindane µg/kg KPH/ND
(LOD = 1)
KPH/ND
(LOD = 1)
KPH/ND
(LOD = 1)
KPH/ND
(LOD = 1) -
Heptachlor µg/kg KPH/ND
(LOD = 1)
KPH/ND
(LOD = 1)
KPH/ND
(LOD = 1)
KPH/ND
(LOD = 1) -
Aldrin µg/kg KPH/ND
(LOD = 5)
KPH/ND
(LOD = 5)
KPH/ND
(LOD = 5)
KPH/ND
(LOD = 5) -
Ref. EPA 1699 &
AOAC 2007.01
Heptachlor epoxide µg/kg KPH/ND
(LOD = 1)
KPH/ND
(LOD = 1)
KPH/ND
(LOD = 1)
KPH/ND
(LOD = 1) ≤ 2.7
a-chlordane µg/kg KPH/ND
(LOD = 5)
KPH/ND
(LOD = 5)
KPH/ND
(LOD = 5)
KPH/ND
(LOD = 5) -
g-chlordane µg/kg KPH/ND
(LOD = 5)
KPH/ND
(LOD = 5)
KPH/ND
(LOD = 5)
KPH/ND
(LOD = 5) -
Chlordane µg/kg KPH/ND
(LOD = 5)
KPH/ND
(LOD = 5)
KPH/ND
(LOD = 5)
KPH/ND
(LOD = 5) ≤ 8.9
Endosulfan I µg/kg KPH/ND
(LOD = 5)
KPH/ND
(LOD = 5)
KPH/ND
(LOD = 5)
KPH/ND
(LOD = 5) -
DDE µg/kg KPH/ND
(LOD = 5)
KPH/ND
(LOD = 5)
KPH/ND
(LOD = 5)
KPH/ND
(LOD = 5) ≤ 6.8

Deildrine µg/kg KPH/ND
(LOD = 5)
KPH/ND
(LOD = 5)
KPH/ND
(LOD = 5)
KPH/ND
(LOD = 5) ≤ 6.7
Endrine µg/kg KPH/ND
(LOD = 5)
KPH/ND
(LOD = 5)
KPH/ND
(LOD = 5)
KPH/ND
(LOD = 5) ≤ 62.4
DDD µg/kg KPH/ND
(LOD = 5)
KPH/ND
(LOD = 5)
KPH/ND
(LOD = 5)
KPH/ND
(LOD = 5) ≤ 8.5
Endosulfan II µg/kg KPH/ND
(LOD = 5)
KPH/ND
(LOD = 5)
KPH/ND
(LOD = 5)
KPH/ND
(LOD = 5) -
Endrine aldehyde µg/kg KPH/ND
(LOD = 5)
KPH/ND
(LOD = 5)
KPH/ND
(LOD = 5)
KPH/ND
(LOD = 5) -
Endosulfan sulfate µg/kg KPH/ND
(LOD = 5)
KPH/ND
(LOD = 5)
KPH/ND
(LOD = 5)
KPH/ND
(LOD = 5) -
Ref. EPA 1699 &
AOAC 2007.01 Methoxychlor µg/kg
KPH/ND
(LOD = 5)
KPH/ND
(LOD = 5)
KPH/ND
(LOD = 5)
KPH/ND
(LOD = 5) -
Endrine keton µg/kg KPH/ND
(LOD = 5)
KPH/ND
(LOD = 5)
KPH/ND
(LOD = 5)
KPH/ND
(LOD = 5) -
Ghi chú/Note:
() Phương pháp đo đạc/phân tích được VILAS công
nhận/Measuring/analyzing method is accredited by VILAS
KPH: Không phát hiện. LOD: Giới hạn phát hiện của phương pháp đo
đạc/phân tích./
ND: Not detected. LOD: Limit of detection.
DW: Dry weight.
QCVN 43:2012/BTNMT: Quy chuẩn kỹ thuật quốc gia về chất lượng trầm
tích/ National technical regulation on sediment quality
Sed1: Vị trí cách sông Sài Gòn 200 về phía cống Vàm Thuật/ Location 200 meter from Sai Gon river towards
the Vam Thuat kennel.(0603441;1197897).
Sed2: Vị trí tại điểm giao giữa rạch Chín Xiểng với kênh chính Tham Lương – Bến Cát – Nước Lên/ Location
at the junction between the Chin Xieng canal and the Tham Luong – Ben Cat- Nuoc Len
channels.(0602849;1197393)
Sed3: Vị trí tại điểm giao giữa rạch Ông Bầu với kênh chính Tham Lương – Bến Cát – Nước Lên/ Location at
the junction between the Ong Bau canal and the Tham Luong – Ben Cat- Nuoc Len
channels.(0602742;1197488)
Sed4: Vị trí tại diểm giao giữa rạch Ông Tổng với kênh chính Tham Lương – Bến Cát – Nước Lên/ Location at
the junction between the Ong Tong canal and the Tham Luong – Ben Cat- Nuoc Len
channels.(0602361;1198764)

KẾT QUẢ PHÂN TÍCH MẪU
ANALYZING RESULT OF SAMPLESố phiếu/No: BN1041015 – MS/ Code 1510.0302-0304-0306-0308
Dự án
Project
Ký hiệu mẫu
Type of sample
:
:
:
:
GÓI THẦU FRM – PPTAF02 – DỰ ÁN QUẢN LÝ RỦI RO NGẬP NƯỚC
CHO KHU VỰC TP.HCM
Bùn đáy – Tầng mặt
Sediment – Surface layer
Ngày lấy mẫu/
Sampling date
:
12-13/10/2015
Stt
No.
Chỉ tiêu
Parameter
Đơn vị
Unit
Sed1
1510.0302
Sed2
1510.0304
Sed3
1510.0306
Sed4
1510.0308
QCVN
43:2012/
BTNMT
Phương pháp đo đạc/
phân tích
Measuring/Analyzing method
1 As mg/kgDW 4.44 2.57 5.21 4.77 ≤ 17.0 TCVN 6649:2000,
SMEWW 3120 B (2012) ()
2 Cd mg/kgDW KPH/ND
(LOD = 0.5)
KPH/ND
(LOD = 0.5)
KPH/ND
(LOD = 0.5)
KPH/ND
(LOD = 0.5) ≤ 3.5
TCVN 6649:2000,
SMEWW 3120 B (2012) ()
3 Cr mg/kgDW 68.6 65.0 60.9 55.4 ≤ 90 TCVN 6649:2000,
SMEWW 3120 B (2012) ()
4 Hg mg/kgDW KPH/ND
(LOD = 0.5)
KPH/ND
(LOD = 0.5)
KPH/ND
(LOD = 0.5)
KPH/ND
(LOD = 0.5) ≤ 0.5
TCVN 6649:2000,
SMEWW 3120 B (2012) ()
5 Pb mg/kgDW 28.9 46.3 24.5 23.7 ≤ 91.3 TCVN 6649:2000,
SMEWW 3120 B (2012) ()
6 Fe mg/kgDW 35369 33359 30770 28508 - TCVN 6649:2000,
SMEWW 3120 B (2012) ()
7 PAHs µg/kg KPH/ND KPH/ND KPH/ND KPH/ND - Ref. EPA 8272
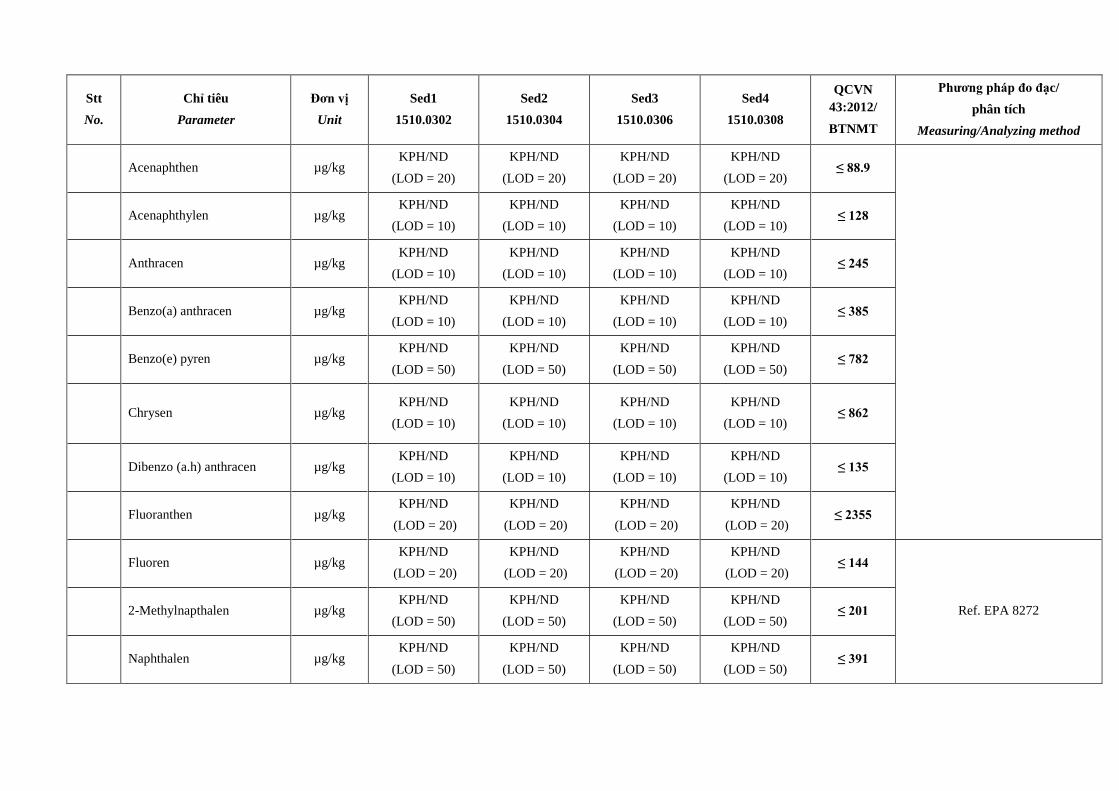
Stt
No.
Chỉ tiêu
Parameter
Đơn vị
Unit
Sed1
1510.0302
Sed2
1510.0304
Sed3
1510.0306
Sed4
1510.0308
QCVN
43:2012/
BTNMT
Phương pháp đo đạc/
phân tích
Measuring/Analyzing method
Acenaphthen µg/kg KPH/ND
(LOD = 20)
KPH/ND
(LOD = 20)
KPH/ND
(LOD = 20)
KPH/ND
(LOD = 20) ≤ 88.9
Acenaphthylen µg/kg KPH/ND
(LOD = 10)
KPH/ND
(LOD = 10)
KPH/ND
(LOD = 10)
KPH/ND
(LOD = 10) ≤ 128
Anthracen µg/kg KPH/ND
(LOD = 10)
KPH/ND
(LOD = 10)
KPH/ND
(LOD = 10)
KPH/ND
(LOD = 10) ≤ 245
Benzo(a) anthracen µg/kg KPH/ND
(LOD = 10)
KPH/ND
(LOD = 10)
KPH/ND
(LOD = 10)
KPH/ND
(LOD = 10) ≤ 385
Benzo(e) pyren µg/kg KPH/ND
(LOD = 50)
KPH/ND
(LOD = 50)
KPH/ND
(LOD = 50)
KPH/ND
(LOD = 50) ≤ 782
Chrysen µg/kg KPH/ND
(LOD = 10)
KPH/ND
(LOD = 10)
KPH/ND
(LOD = 10)
KPH/ND
(LOD = 10) ≤ 862
Dibenzo (a.h) anthracen µg/kg KPH/ND
(LOD = 10)
KPH/ND
(LOD = 10)
KPH/ND
(LOD = 10)
KPH/ND
(LOD = 10) ≤ 135
Fluoranthen µg/kg KPH/ND
(LOD = 20)
KPH/ND
(LOD = 20)
KPH/ND
(LOD = 20)
KPH/ND
(LOD = 20) ≤ 2355
Fluoren µg/kg KPH/ND
(LOD = 20)
KPH/ND
(LOD = 20)
KPH/ND
(LOD = 20)
KPH/ND
(LOD = 20) ≤ 144
Ref. EPA 8272 2-Methylnapthalen µg/kg KPH/ND
(LOD = 50)
KPH/ND
(LOD = 50)
KPH/ND
(LOD = 50)
KPH/ND
(LOD = 50) ≤ 201
Naphthalen µg/kg KPH/ND
(LOD = 50)
KPH/ND
(LOD = 50)
KPH/ND
(LOD = 50)
KPH/ND
(LOD = 50) ≤ 391

Stt
No.
Chỉ tiêu
Parameter
Đơn vị
Unit
Sed1
1510.0302
Sed2
1510.0304
Sed3
1510.0306
Sed4
1510.0308
QCVN
43:2012/
BTNMT
Phương pháp đo đạc/
phân tích
Measuring/Analyzing method
Phenanthren µg/kg KPH/ND
(LOD = 10)
KPH/ND
(LOD = 10)
KPH/ND
(LOD = 10)
KPH/ND
(LOD = 10) ≤ 515
Pyren µg/kg KPH/ND
(LOD = 10)
KPH/ND
(LOD = 10)
KPH/ND
(LOD = 10)
KPH/ND
(LOD = 10) ≤ 875
8 DDT µg/kg KPH/ND
(LOD = 3)
KPH/ND
(LOD = 3)
KPH/ND
(LOD = 3)
KPH/ND
(LOD = 3) ≤ 4.8
Ref. EPA 1699 &
AOAC 2007.01
9 Thuốc trừ sâu gốc clo/
Organochlorine pesticides µg/kg KPH/ND KPH/ND KPH/ND KPH/ND -
Ref. EPA 1699 &
AOAC 2007.01
a-lindane µg/kg KPH/ND
(LOD = 1)
KPH/ND
(LOD = 1)
KPH/ND
(LOD = 1)
KPH/ND
(LOD = 1) -
Ref. EPA 1699 &
AOAC 2007.01 b-lindane µg/kg
KPH/ND
(LOD = 1)
KPH/ND
(LOD = 1)
KPH/ND
(LOD = 1)
KPH/ND
(LOD = 1) -
Lindane µg/kg KPH/ND
(LOD = 1)
KPH/ND
(LOD = 1)
KPH/ND
(LOD = 1)
KPH/ND
(LOD = 1) ≤ 1.4
g-lindane µg/kg KPH/ND
(LOD = 1)
KPH/ND
(LOD = 1)
KPH/ND
(LOD = 1)
KPH/ND
(LOD = 1) -
Ref. EPA 1699 &
AOAC 2007.01
Heptachlor µg/kg KPH/ND
(LOD = 1)
KPH/ND
(LOD = 1)
KPH/ND
(LOD = 1)
KPH/ND
(LOD = 1) -
Aldrin µg/kg KPH/ND
(LOD = 5)
KPH/ND
(LOD = 5)
KPH/ND
(LOD = 5)
KPH/ND
(LOD = 5) -
Heptachlor epoxide µg/kg KPH/ND
(LOD = 1)
KPH/ND
(LOD = 1)
KPH/ND
(LOD = 1)
KPH/ND
(LOD = 1) ≤ 2.7
a-chlordane µg/kg KPH/ND KPH/ND KPH/ND KPH/ND -
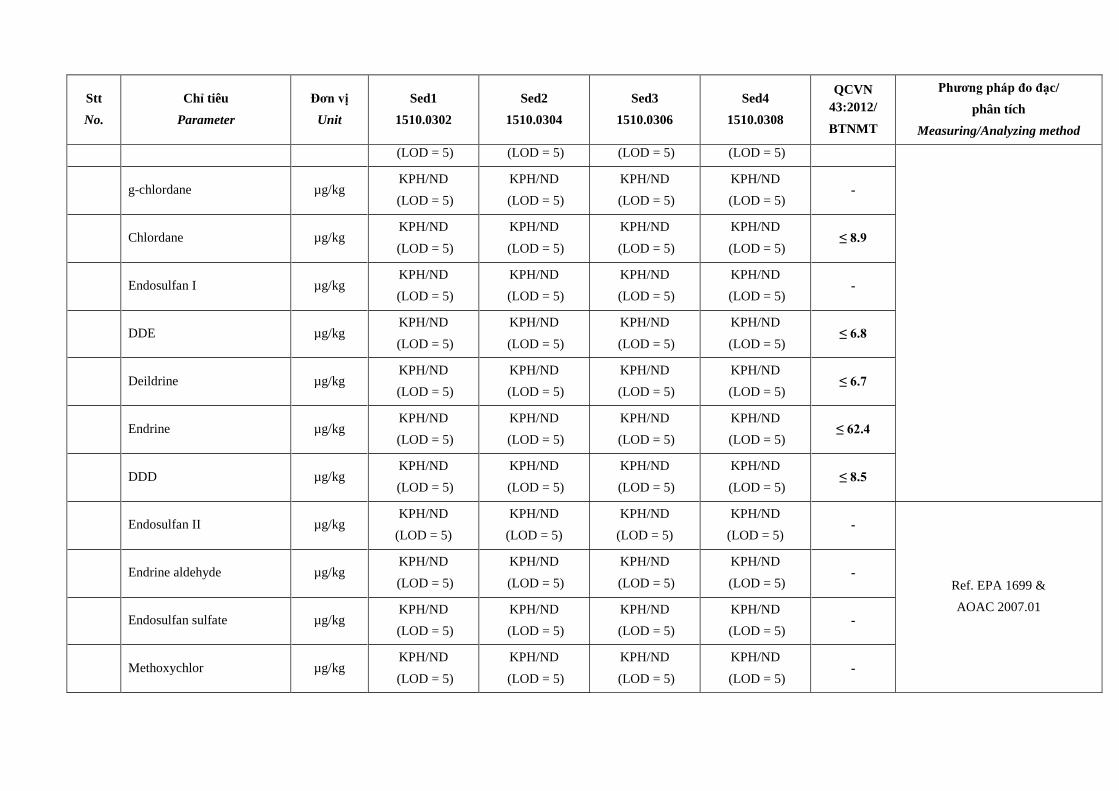
Stt
No.
Chỉ tiêu
Parameter
Đơn vị
Unit
Sed1
1510.0302
Sed2
1510.0304
Sed3
1510.0306
Sed4
1510.0308
QCVN
43:2012/
BTNMT
Phương pháp đo đạc/
phân tích
Measuring/Analyzing method
(LOD = 5) (LOD = 5) (LOD = 5) (LOD = 5)
g-chlordane µg/kg KPH/ND
(LOD = 5)
KPH/ND
(LOD = 5)
KPH/ND
(LOD = 5)
KPH/ND
(LOD = 5) -
Chlordane µg/kg KPH/ND
(LOD = 5)
KPH/ND
(LOD = 5)
KPH/ND
(LOD = 5)
KPH/ND
(LOD = 5) ≤ 8.9
Endosulfan I µg/kg KPH/ND
(LOD = 5)
KPH/ND
(LOD = 5)
KPH/ND
(LOD = 5)
KPH/ND
(LOD = 5) -
DDE µg/kg KPH/ND
(LOD = 5)
KPH/ND
(LOD = 5)
KPH/ND
(LOD = 5)
KPH/ND
(LOD = 5) ≤ 6.8
Deildrine µg/kg KPH/ND
(LOD = 5)
KPH/ND
(LOD = 5)
KPH/ND
(LOD = 5)
KPH/ND
(LOD = 5) ≤ 6.7
Endrine µg/kg KPH/ND
(LOD = 5)
KPH/ND
(LOD = 5)
KPH/ND
(LOD = 5)
KPH/ND
(LOD = 5) ≤ 62.4
DDD µg/kg KPH/ND
(LOD = 5)
KPH/ND
(LOD = 5)
KPH/ND
(LOD = 5)
KPH/ND
(LOD = 5) ≤ 8.5
Endosulfan II µg/kg KPH/ND
(LOD = 5)
KPH/ND
(LOD = 5)
KPH/ND
(LOD = 5)
KPH/ND
(LOD = 5) -
Ref. EPA 1699 &
AOAC 2007.01
Endrine aldehyde µg/kg KPH/ND
(LOD = 5)
KPH/ND
(LOD = 5)
KPH/ND
(LOD = 5)
KPH/ND
(LOD = 5) -
Endosulfan sulfate µg/kg KPH/ND
(LOD = 5)
KPH/ND
(LOD = 5)
KPH/ND
(LOD = 5)
KPH/ND
(LOD = 5) -
Methoxychlor µg/kg KPH/ND
(LOD = 5)
KPH/ND
(LOD = 5)
KPH/ND
(LOD = 5)
KPH/ND
(LOD = 5) -

Stt
No.
Chỉ tiêu
Parameter
Đơn vị
Unit
Sed1
1510.0302
Sed2
1510.0304
Sed3
1510.0306
Sed4
1510.0308
QCVN
43:2012/
BTNMT
Phương pháp đo đạc/
phân tích
Measuring/Analyzing method
Endrine keton µg/kg KPH/ND
(LOD = 5)
KPH/ND
(LOD = 5)
KPH/ND
(LOD = 5)
KPH/ND
(LOD = 5) -
Ghi chú/Note:
() Phương pháp đo đạc/phân tích được VILAS công
nhận/Measuring/analyzing method is accredited by VILAS
KPH: Không phát hiện. LOD: Giới hạn phát hiện của phương pháp đo
đạc/phân tích./
ND: Not detected. LOD: Limit of detection.
DW: Dry weight.
QCVN 43:2012/BTNMT: Quy chuẩn kỹ thuật quốc gia về chất lượng trầm
tích/ National technical regulation on sediment quality
Sed1: Vị trí cách sông Sài Gòn 200 về phía cống Vàm Thuật/ Location 200 meter from Sai Gon river towards
the Vam Thuat kennel.(0603441;1197897).
Sed2: Vị trí tại điểm giao giữa rạch Chín Xiểng với kênh chính Tham Lương – Bến Cát – Nước Lên/ Location
at the junction between the Chin Xieng canal and the Tham Luong – Ben Cat- Nuoc Len
channels.(0602849;1197393)
Sed3: Vị trí tại điểm giao giữa rạch Ông Bầu với kênh chính Tham Lương – Bến Cát – Nước Lên/ Location at
the junction between the Ong Bau canal and the Tham Luong – Ben Cat- Nuoc Len
channels.(0602742;1197488)
Sed4: Vị trí tại diểm giao giữa rạch Ông Tổng với kênh chính Tham Lương – Bến Cát – Nước Lên/ Location at
the junction between the Ong Tong canal and the Tham Luong – Ben Cat- Nuoc Len
channels.(0602361;1198764)

KẾT QUẢ PHÂN TÍCH MẪU
ANALYZING RESULT OF SAMPLE
Số phiếu/No: BN1041015 – MS/Code 1510.0311-0313-0315-0317
Dự án
Project
Ký hiệu mẫu
Type of sample
:
:
:
:
GÓI THẦU FRM – PPTAF02 – DỰ ÁN QUẢN LÝ RỦI RO NGẬP NƯỚC
CHO KHU VỰC TP.HCM
Bùn đáy – Tầng sâu (0,5m)
Sediment - Depth layer (0.5m)
Ngày lấy mẫu/
Sampling date
:
12-13/10/2015
Stt
No.
Chỉ tiêu
Parameter
Đơn vị
Unit
Sed5
1510.0311
Sed6
1510.0313
Sed7
1510.0315
Sed8
1510.0317
QCVN
43:2012/
BTNMT
Phương pháp đo đạc/
phân tích
Measuring/Analyzing
method
1 As mg/kgDW 1.25 3.45 10.6 2.57 ≤ 17.0 TCVN 6649:2000,
SMEWW 3120 B (2012) ()
2 Cd mg/kgDW KPH/ND
(LOD = 0.5)
KPH/ND
(LOD = 0.5)
KPH/ND
(LOD = 0.5)
KPH/ND
(LOD = 0.5) ≤ 3.5
TCVN 6649:2000,
SMEWW 3120 B (2012) ()
3 Cr mg/kgDW 25.5 55.7 49.5 25.7 ≤ 90 TCVN 6649:2000,
SMEWW 3120 B (2012) ()
4 Hg mg/kgDW KPH/ND
(LOD = 0.5)
KPH/ND
(LOD = 0.5)
KPH/ND
(LOD = 0.5)
KPH/ND
(LOD = 0.5) ≤ 0.5
TCVN 6649:2000,
SMEWW 3120 B (2012) ()
5 Pb mg/kgDW 8.5 25.5 32.1 20.3 ≤ 91.3 TCVN 6649:2000,
SMEWW 3120 B (2012) ()
6 Fe mg/kgDW 18925 29874 35913 15540 - TCVN 6649:2000,
SMEWW 3120 B (2012) ()

Stt
No.
Chỉ tiêu
Parameter
Đơn vị
Unit
Sed5
1510.0311
Sed6
1510.0313
Sed7
1510.0315
Sed8
1510.0317
QCVN
43:2012/
BTNMT
Phương pháp đo đạc/
phân tích
Measuring/Analyzing
method
7 PAHs µg/kg KPH/ND KPH/ND KPH/ND KPH/ND -
Ref. EPA 8272
Acenaphthen µg/kg KPH/ND
(LOD = 20)
KPH/ND
(LOD = 20)
KPH/ND
(LOD = 20)
KPH/ND
(LOD = 20) ≤ 88.9
Acenaphthylen µg/kg KPH/ND
(LOD = 10)
KPH/ND
(LOD = 10)
KPH/ND
(LOD = 10)
KPH/ND
(LOD = 10) ≤ 128
Anthracen µg/kg KPH/ND
(LOD = 10)
KPH/ND
(LOD = 10)
KPH/ND
(LOD = 10)
KPH/ND
(LOD = 10) ≤ 245
Benzo(a) anthracen µg/kg KPH/ND
(LOD = 10)
KPH/ND
(LOD = 10)
KPH/ND
(LOD = 10)
KPH/ND
(LOD = 10) ≤ 385
Benzo(e) pyren µg/kg KPH/ND
(LOD = 50)
KPH/ND
(LOD = 50)
KPH/ND
(LOD = 50)
KPH/ND
(LOD = 50) ≤ 782
Chrysen µg/kg KPH/ND
(LOD = 10)
KPH/ND
(LOD = 10)
KPH/ND
(LOD = 10)
KPH/ND
(LOD = 10) ≤ 862
Dibenzo (a.h) anthracen µg/kg KPH/ND
(LOD = 10)
KPH/ND
(LOD = 10)
KPH/ND
(LOD = 10)
KPH/ND
(LOD = 10) ≤ 135
Fluoranthen µg/kg KPH/ND
(LOD = 20)
KPH/ND
(LOD = 20)
KPH/ND
(LOD = 20)
KPH/ND
(LOD = 20) ≤ 2355
Fluoren µg/kg KPH/ND
(LOD = 20)
KPH/ND
(LOD = 20)
KPH/ND
(LOD = 20)
KPH/ND
(LOD = 20) ≤ 144
2-Methylnapthalen µg/kg KPH/ND
(LOD = 50)
KPH/ND
(LOD = 50)
KPH/ND
(LOD = 50)
KPH/ND
(LOD = 50) ≤ 201
Ref. EPA 8272
Naphthalen µg/kg KPH/ND KPH/ND KPH/ND KPH/ND ≤ 391

Stt
No.
Chỉ tiêu
Parameter
Đơn vị
Unit
Sed5
1510.0311
Sed6
1510.0313
Sed7
1510.0315
Sed8
1510.0317
QCVN
43:2012/
BTNMT
Phương pháp đo đạc/
phân tích
Measuring/Analyzing
method
(LOD = 50) (LOD = 50) (LOD = 50) (LOD = 50)
Phenanthren µg/kg KPH/ND
(LOD = 10)
KPH/ND
(LOD = 10)
KPH/ND
(LOD = 10)
KPH/ND
(LOD = 10) ≤ 515
Pyren µg/kg KPH/ND
(LOD = 10)
KPH/ND
(LOD = 10)
KPH/ND
(LOD = 10)
KPH/ND
(LOD = 10) ≤ 875
8 DDT µg/kg KPH/ND
(LOD = 3)
KPH/ND
(LOD = 3)
KPH/ND
(LOD = 3)
KPH/ND
(LOD = 3) ≤ 4.8
Ref. EPA 1699 &
AOAC 2007.01
9 Thuốc trừ sâu gốc clo/
Organochlorine pesticides µg/kg KPH/ND KPH/ND KPH/ND KPH/ND -
Ref. EPA 1699 &
AOAC 2007.01
a-lindane µg/kg KPH/ND
(LOD = 1)
KPH/ND
(LOD = 1)
KPH/ND
(LOD = 1)
KPH/ND
(LOD = 1) -
b-lindane µg/kg KPH/ND
(LOD = 1)
KPH/ND
(LOD = 1)
KPH/ND
(LOD = 1)
KPH/ND
(LOD = 1) -
Lindane µg/kg KPH/ND
(LOD = 1)
KPH/ND
(LOD = 1)
KPH/ND
(LOD = 1)
KPH/ND
(LOD = 1) ≤ 1.4
g-lindane µg/kg KPH/ND
(LOD = 1)
KPH/ND
(LOD = 1)
KPH/ND
(LOD = 1)
KPH/ND
(LOD = 1) -
Heptachlor µg/kg KPH/ND
(LOD = 1)
KPH/ND
(LOD = 1)
KPH/ND
(LOD = 1)
KPH/ND
(LOD = 1) -
Aldrin µg/kg KPH/ND
(LOD = 5)
KPH/ND
(LOD = 5)
KPH/ND
(LOD = 5)
KPH/ND
(LOD = 5) - Ref. EPA 1699 &
AOAC 2007.01 Heptachlor epoxide µg/kg KPH/ND KPH/ND KPH/ND KPH/ND ≤ 2.7

Stt
No.
Chỉ tiêu
Parameter
Đơn vị
Unit
Sed5
1510.0311
Sed6
1510.0313
Sed7
1510.0315
Sed8
1510.0317
QCVN
43:2012/
BTNMT
Phương pháp đo đạc/
phân tích
Measuring/Analyzing
method
(LOD = 1) (LOD = 1) (LOD = 1) (LOD = 1)
a-chlordane µg/kg KPH/ND
(LOD = 5)
KPH/ND
(LOD = 5)
KPH/ND
(LOD = 5)
KPH/ND
(LOD = 5) -
g-chlordane µg/kg KPH/ND
(LOD = 5)
KPH/ND
(LOD = 5)
KPH/ND
(LOD = 5)
KPH/ND
(LOD = 5) -
Chlordane µg/kg KPH/ND
(LOD = 5)
KPH/ND
(LOD = 5)
KPH/ND
(LOD = 5)
KPH/ND
(LOD = 5) ≤ 8.9
Endosulfan I µg/kg KPH/ND
(LOD = 5)
KPH/ND
(LOD = 5)
KPH/ND
(LOD = 5)
KPH/ND
(LOD = 5) -
DDE µg/kg KPH/ND
(LOD = 5)
KPH/ND
(LOD = 5)
KPH/ND
(LOD = 5)
KPH/ND
(LOD = 5) ≤ 6.8
Deildrine µg/kg KPH/ND
(LOD = 5)
KPH/ND
(LOD = 5)
KPH/ND
(LOD = 5)
KPH/ND
(LOD = 5) ≤ 6.7
Endrine µg/kg KPH/ND
(LOD = 5)
KPH/ND
(LOD = 5)
KPH/ND
(LOD = 5)
KPH/ND
(LOD = 5) ≤ 62.4
DDD µg/kg KPH/ND
(LOD = 5)
KPH/ND
(LOD = 5)
KPH/ND
(LOD = 5)
KPH/ND
(LOD = 5) ≤ 8.5
Endosulfan II µg/kg KPH/ND
(LOD = 5)
KPH/ND
(LOD = 5)
KPH/ND
(LOD = 5)
KPH/ND
(LOD = 5) -
Endrine aldehyde µg/kg KPH/ND
(LOD = 5)
KPH/ND
(LOD = 5)
KPH/ND
(LOD = 5)
KPH/ND
(LOD = 5) -
Endosulfan sulfate µg/kg KPH/ND
(LOD = 5)
KPH/ND
(LOD = 5)
KPH/ND
(LOD = 5)
KPH/ND
(LOD = 5) -
Ref. EPA 1699 &
AOAC 2007.01

Stt
No.
Chỉ tiêu
Parameter
Đơn vị
Unit
Sed5
1510.0311
Sed6
1510.0313
Sed7
1510.0315
Sed8
1510.0317
QCVN
43:2012/
BTNMT
Phương pháp đo đạc/
phân tích
Measuring/Analyzing
method
Methoxychlor µg/kg KPH/ND
(LOD = 5)
KPH/ND
(LOD = 5)
KPH/ND
(LOD = 5)
KPH/ND
(LOD = 5) -
Endrine keton µg/kg KPH/ND
(LOD = 5)
KPH/ND
(LOD = 5)
KPH/ND
(LOD = 5)
KPH/ND
(LOD = 5) -
Ghi chú/Note:
() Phương pháp đo đạc/phân tích được VILAS công nhận/Measuring/analyzing method
is accredited by VILAS.
KPH: Không phát hiện. LOD: Giới hạn phát hiện của phương pháp đo đạc/phân tích./
ND: Not detected. LOD: Limit of detection.
DW: Dry weight.
QCVN 43:2012/BTNMT: Quy chuẩn kỹ thuật quốc gia về chất lượng trầm tích/ National
technical regulation on sediment quality.
Sed5: Vị trí tại điểm giao giữa rạch Bà Miên với kênh chính Tham Lương – Bến Cát – Nước
Lên/ Location at the junction between the Ba Mien canal and the Tham Luong – Ben Cat –
Nuoc Len channels.(0601002;1199835)
Sed6: Vị trí tại điểm giao giữa rạch Cầu Cụt với kênh chính Tham Lương – Bến Cát – Nước
Lên/ Location at the junction between the Cau Cut canal and the Tham Luong – Ben Cat –
Nuoc Len channels.(0598939;1200474)
Sed7: Vị trí tại điểm giao giữa kênh Hy Vọng với kênh chính Tham Lương – Bến Cát – Nước
Lên/ Location at the junction between the Hy Vong channel and the Tham Luong – Ben Cat –
Nuoc Len channels.(0596170;1197484)
Sed8: Vị trí tại cầu Tham Lương, KCN Tân Bình/ Location at the Tham Luong bridge, Tan
Binh Industrial Park.(0595884;1196999)

KẾT QUẢ PHÂN TÍCH MẪU
ANALYZING RESULT OF SAMPLE
Số phiếu/No: BN1041015 – MS/Code 1510.0310-0312-0314-0316
Dự án
Project
Ký hiệu mẫu
Type of sample
:
:
:
:
GÓI THẦU FRM – PPTAF02 – DỰ ÁN QUẢN LÝ RỦI RO NGẬP NƯỚC
CHO KHU VỰC TP.HCM
Bùn đáy – Tầng mặt
Sediment - Surface layer
Ngày lấy mẫu/
Sampling date
:
12-13/10/2015
Stt
No.
Chỉ tiêu
Parameter
Đơn vị
Unit
Sed5
1510.0310
Sed6
1510.0312
Sed7
1510.0314
Sed8
1510.0316
QCVN
43:2012/
BTNMT
Phương pháp đo đạc/
phân tích
Measuring/Analyzing method
1 As mg/kgDW 1.70 5.25 0.84 1.39 ≤ 17.0 TCVN 6649:2000,
SMEWW 3120 B (2012) ()
2 Cd mg/kgDW KPH/ND
(LOD = 0.5) 0.79
KPH/ND
(LOD = 0.5)
KPH/ND
(LOD = 0.5) ≤ 3.5
TCVN 6649:2000,
SMEWW 3120 B (2012) ()
3 Cr mg/kgDW 19.6 72.2 14.2 37.0 ≤ 90 TCVN 6649:2000,
SMEWW 3120 B (2012) ()
4 Hg mg/kgDW KPH/ND
(LOD = 0.5)
KPH/ND
(LOD = 0.5)
KPH/ND
(LOD = 0.5)
KPH/ND
(LOD = 0.5) ≤ 0.5
TCVN 6649:2000,
SMEWW 3120 B (2012) ()
5 Pb mg/kgDW 12.2 31.4 14.9 16.9 ≤ 91.3 TCVN 6649:2000,
SMEWW 3120 B (2012) ()
6 Fe mg/kgDW 9665 31454 7349 17798 - TCVN 6649:2000,
SMEWW 3120 B (2012) ()

Stt
No.
Chỉ tiêu
Parameter
Đơn vị
Unit
Sed5
1510.0310
Sed6
1510.0312
Sed7
1510.0314
Sed8
1510.0316
QCVN
43:2012/
BTNMT
Phương pháp đo đạc/
phân tích
Measuring/Analyzing method
7 PAHs µg/kg KPH/ND KPH/ND KPH/ND KPH/ND -
Ref. EPA 8272
Acenaphthen µg/kg KPH/ND
(LOD = 20)
KPH/ND
(LOD = 20)
KPH/ND
(LOD = 20)
KPH/ND
(LOD = 20) ≤ 88.9
Acenaphthylen µg/kg KPH/ND
(LOD = 10)
KPH/ND
(LOD = 10)
KPH/ND
(LOD = 10)
KPH/ND
(LOD = 10) ≤ 128
Anthracen µg/kg KPH/ND
(LOD = 10)
KPH/ND
(LOD = 10)
KPH/ND
(LOD = 10)
KPH/ND
(LOD = 10) ≤ 245
Benzo(a) anthracen µg/kg KPH/ND
(LOD = 10)
KPH/ND
(LOD = 10)
KPH/ND
(LOD = 10)
KPH/ND
(LOD = 10) ≤ 385
Benzo(e) pyren µg/kg KPH/ND
(LOD = 50)
KPH/ND
(LOD = 50)
KPH/ND
(LOD = 50)
KPH/ND
(LOD = 50) ≤ 782
Chrysen µg/kg KPH/ND
(LOD = 10)
KPH/ND
(LOD = 10)
KPH/ND
(LOD = 10)
KPH/ND
(LOD = 10) ≤ 862
Dibenzo (a.h) anthracen µg/kg KPH/ND
(LOD = 10)
KPH/ND
(LOD = 10)
KPH/ND
(LOD = 10)
KPH/ND
(LOD = 10) ≤ 135
Fluoranthen µg/kg KPH/ND
(LOD = 20)
KPH/ND
(LOD = 20)
KPH/ND
(LOD = 20)
KPH/ND
(LOD = 20) ≤ 2355
Fluoren µg/kg KPH/ND
(LOD = 20)
KPH/ND
(LOD = 20)
KPH/ND
(LOD = 20)
KPH/ND
(LOD = 20) ≤ 144
2-Methylnapthalen µg/kg KPH/ND
(LOD = 50)
KPH/ND
(LOD = 50)
KPH/ND
(LOD = 50)
KPH/ND
(LOD = 50) ≤ 201
Ref. EPA 8272
Naphthalen µg/kg KPH/ND
(LOD = 50)
KPH/ND
(LOD = 50)
KPH/ND
(LOD = 50)
KPH/ND
(LOD = 50) ≤ 391

Stt
No.
Chỉ tiêu
Parameter
Đơn vị
Unit
Sed5
1510.0310
Sed6
1510.0312
Sed7
1510.0314
Sed8
1510.0316
QCVN
43:2012/
BTNMT
Phương pháp đo đạc/
phân tích
Measuring/Analyzing method
Phenanthren µg/kg KPH/ND
(LOD = 10)
KPH/ND
(LOD = 10)
KPH/ND
(LOD = 10)
KPH/ND
(LOD = 10) ≤ 515
Pyren µg/kg KPH/ND
(LOD = 10)
KPH/ND
(LOD = 10)
KPH/ND
(LOD = 10)
KPH/ND
(LOD = 10) ≤ 875
8 DDT µg/kg KPH/ND
(LOD = 3)
KPH/ND
(LOD = 3)
KPH/ND
(LOD = 3)
KPH/ND
(LOD = 3) ≤ 4.8
Ref. EPA 1699 &
AOAC 2007.01
9 Thuốc trừ sâu gốc clo/
Organochlorine pesticides µg/kg KPH/ND KPH/ND KPH/ND KPH/ND -
Ref. EPA 1699 &
AOAC 2007.01
a-lindane µg/kg KPH/ND
(LOD = 1)
KPH/ND
(LOD = 1)
KPH/ND
(LOD = 1)
KPH/ND
(LOD = 1) -
b-lindane µg/kg KPH/ND
(LOD = 1)
KPH/ND
(LOD = 1)
KPH/ND
(LOD = 1)
KPH/ND
(LOD = 1) -
Lindane µg/kg KPH/ND
(LOD = 1)
KPH/ND
(LOD = 1)
KPH/ND
(LOD = 1)
KPH/ND
(LOD = 1) ≤ 1.4
g-lindane µg/kg KPH/ND
(LOD = 1)
KPH/ND
(LOD = 1)
KPH/ND
(LOD = 1)
KPH/ND
(LOD = 1) -
Heptachlor µg/kg KPH/ND
(LOD = 1)
KPH/ND
(LOD = 1)
KPH/ND
(LOD = 1)
KPH/ND
(LOD = 1) -
Aldrin µg/kg KPH/ND
(LOD = 5)
KPH/ND
(LOD = 5)
KPH/ND
(LOD = 5)
KPH/ND
(LOD = 5) -
Ref. EPA 1699 &
AOAC 2007.01 Heptachlor epoxide µg/kg KPH/ND
(LOD = 1)
KPH/ND
(LOD = 1)
KPH/ND
(LOD = 1)
KPH/ND
(LOD = 1) ≤ 2.7
a-chlordane µg/kg KPH/ND KPH/ND KPH/ND KPH/ND -

Stt
No.
Chỉ tiêu
Parameter
Đơn vị
Unit
Sed5
1510.0310
Sed6
1510.0312
Sed7
1510.0314
Sed8
1510.0316
QCVN
43:2012/
BTNMT
Phương pháp đo đạc/
phân tích
Measuring/Analyzing method
(LOD = 5) (LOD = 5) (LOD = 5) (LOD = 5)
g-chlordane µg/kg KPH/ND
(LOD = 5)
KPH/ND
(LOD = 5)
KPH/ND
(LOD = 5)
KPH/ND
(LOD = 5) -
Chlordane µg/kg KPH/ND
(LOD = 5)
KPH/ND
(LOD = 5)
KPH/ND
(LOD = 5)
KPH/ND
(LOD = 5) ≤ 8.9
Endosulfan I µg/kg KPH/ND
(LOD = 5)
KPH/ND
(LOD = 5)
KPH/ND
(LOD = 5)
KPH/ND
(LOD = 5) -
DDE µg/kg KPH/ND
(LOD = 5)
KPH/ND
(LOD = 5)
KPH/ND
(LOD = 5)
KPH/ND
(LOD = 5) ≤ 6.8
Deildrine µg/kg KPH/ND
(LOD = 5)
KPH/ND
(LOD = 5)
KPH/ND
(LOD = 5)
KPH/ND
(LOD = 5) ≤ 6.7
Endrine µg/kg KPH/ND
(LOD = 5)
KPH/ND
(LOD = 5)
KPH/ND
(LOD = 5)
KPH/ND
(LOD = 5) ≤ 62.4
DDD µg/kg KPH/ND
(LOD = 5)
KPH/ND
(LOD = 5)
KPH/ND
(LOD = 5)
KPH/ND
(LOD = 5) ≤ 8.5
Endosulfan II µg/kg KPH/ND
(LOD = 5)
KPH/ND
(LOD = 5)
KPH/ND
(LOD = 5)
KPH/ND
(LOD = 5) -
Endrine aldehyde µg/kg KPH/ND
(LOD = 5)
KPH/ND
(LOD = 5)
KPH/ND
(LOD = 5)
KPH/ND
(LOD = 5) -
Ref. EPA 1699 &
AOAC 2007.01 Endosulfan sulfate µg/kg
KPH/ND
(LOD = 5)
KPH/ND
(LOD = 5)
KPH/ND
(LOD = 5)
KPH/ND
(LOD = 5) -
Methoxychlor µg/kg KPH/ND
(LOD = 5)
KPH/ND
(LOD = 5)
KPH/ND
(LOD = 5)
KPH/ND
(LOD = 5) -

Stt
No.
Chỉ tiêu
Parameter
Đơn vị
Unit
Sed5
1510.0310
Sed6
1510.0312
Sed7
1510.0314
Sed8
1510.0316
QCVN
43:2012/
BTNMT
Phương pháp đo đạc/
phân tích
Measuring/Analyzing method
Endrine keton µg/kg KPH/ND
(LOD = 5)
KPH/ND
(LOD = 5)
KPH/ND
(LOD = 5)
KPH/ND
(LOD = 5) -
Ghi chú/Note:
() Phương pháp đo đạc/phân tích được VILAS công nhận/Measuring/analyzing
method
is accredited by VILAS.
KPH: Không phát hiện. LOD: Giới hạn phát hiện của phương pháp đo đạc/phân
tích./
ND: Not detected. LOD: Limit of detection.
DW: Dry weight.
QCVN 43:2012/BTNMT: Quy chuẩn kỹ thuật quốc gia về chất lượng trầm tích/
National technical regulation on sediment quality.
Sed5: Vị trí tại điểm giao giữa rạch Bà Miên với kênh chính Tham Lương – Bến Cát – Nước Lên/ Location
at the junction between the Ba Mien canal and the Tham Luong – Ben Cat – Nuoc Len
channels.(0601002;1199835)
Sed6: Vị trí tại điểm giao giữa rạch Cầu Cụt với kênh chính Tham Lương – Bến Cát – Nước Lên/ Location
at the junction between the Cau Cut canal and the Tham Luong – Ben Cat – Nuoc Len
channels.(0598939;1200474)
Sed7: Vị trí tại điểm giao giữa kênh Hy Vọng với kênh chính Tham Lương – Bến Cát – Nước Lên/
Location at the junction between the Hy Vong channel and the Tham Luong – Ben Cat – Nuoc Len
channels.(0596170;1197484)
Sed8: Vị trí tại cầu Tham Lương, KCN Tân Bình/ Location at the Tham Luong bridge, Tan Binh Industrial
Park.(0595884;1196999)

KẾT QUẢ PHÂN TÍCH MẪU
ANALYZING RESULT OF SAMPLESố phiếu/No: BN1151015 – MS/Code 1510.0387-0385-0389-0391
Dự án
Project
Ký hiệu mẫu
Type of sample
:
:
:
:
GÓI THẦU FRM – PPTAF02 – DỰ ÁN QUẢN LÝ RỦI RO NGẬP NƯỚC
CHO KHU VỰC TP.HCM
Bùn đáy – Tầng sâu (0,5m)
Sediment - Depth layer (0.5m)
Ngày lấy mẫu/
Sampling date
:
12-13/10/2015
Stt
No.
Chỉ tiêu
Parameter
Đơn vị
Unit
Sed9
1510.0387
Sed10
1510.0385
Sed11
1510.0389
Sed12
1510.0391
QCVN
43:2012/
BTNMT
Phương pháp đo đạc/phân
tích
Measuring/Analyzing method
1 As mg/kgDW 2.58 4.87 4.25 1.25 ≤ 17.0 TCVN 6649:2000,
SMEWW 3120 B (2012) ()
2 Cd mg/kgDW KPH/ND
(LOD = 0.5)
KPH/ND
(LOD = 0.5)
KPH/ND
(LOD = 0.5)
KPH/ND
(LOD = 0.5) ≤ 3.5
TCVN 6649:2000,
SMEWW 3120 B (2012) ()
3 Cr mg/kgDW 56.9 32.2 69.4 11.9 ≤ 90 TCVN 6649:2000,
SMEWW 3120 B (2012) ()
4 Hg mg/kgDW KPH/ND
(LOD = 0.5)
KPH/ND
(LOD = 0.5)
KPH/ND
(LOD = 0.5)
KPH/ND
(LOD = 0.5) ≤ 0.5
TCVN 6649:2000,
SMEWW 3120 B (2012) ()
5 Pb mg/kgDW 30.5 14.2 25.5 3.52 ≤ 91.3 TCVN 6649:2000,
SMEWW 3120 B (2012) ()
6 Fe mg/kgDW 35120 35496 32865 12480 - TCVN 6649:2000,
SMEWW 3120 B (2012) ()
7 PAHs µg/kg KPH/ND KPH/ND KPH/ND KPH/ND - Ref. EPA 8272

Acenaphthen µg/kg KPH/ND
(LOD = 20)
KPH/ND
(LOD = 20)
KPH/ND
(LOD = 20)
KPH/ND
(LOD = 20) ≤ 88.9
Acenaphthylen µg/kg KPH/ND
(LOD = 10)
KPH/ND
(LOD = 10)
KPH/ND
(LOD = 10)
KPH/ND
(LOD = 10) ≤ 128
Anthracen µg/kg KPH/ND
(LOD = 10)
KPH/ND
(LOD = 10)
KPH/ND
(LOD = 10)
KPH/ND
(LOD = 10) ≤ 245
Benzo(a) anthracen µg/kg KPH/ND
(LOD = 10)
KPH/ND
(LOD = 10)
KPH/ND
(LOD = 10)
KPH/ND
(LOD = 10) ≤ 385
Benzo(e) pyren µg/kg KPH/ND
(LOD = 50)
KPH/ND
(LOD = 50)
KPH/ND
(LOD = 50)
KPH/ND
(LOD = 50) ≤ 782
Chrysen µg/kg KPH/ND
(LOD = 10)
KPH/ND
(LOD = 10)
KPH/ND
(LOD = 10)
KPH/ND
(LOD = 10) ≤ 862
Dibenzo (a.h) anthracen µg/kg KPH/ND
(LOD = 10)
KPH/ND
(LOD = 10)
KPH/ND
(LOD = 10)
KPH/ND
(LOD = 10) ≤ 135
Fluoranthen µg/kg KPH/ND
(LOD = 20)
KPH/ND
(LOD = 20)
KPH/ND
(LOD = 20)
KPH/ND
(LOD = 20) ≤ 2355
Fluoren µg/kg KPH/ND
(LOD = 20)
KPH/ND
(LOD = 20)
KPH/ND
(LOD = 20)
KPH/ND
(LOD = 20) ≤ 144
2-Methylnapthalen µg/kg KPH/ND
(LOD = 50)
KPH/ND
(LOD = 50)
KPH/ND
(LOD = 50)
KPH/ND
(LOD = 50) ≤ 201
Ref. EPA 8272
Naphthalen µg/kg KPH/ND
(LOD = 50)
KPH/ND
(LOD = 50)
KPH/ND
(LOD = 50)
KPH/ND
(LOD = 50) ≤ 391
Phenanthren µg/kg KPH/ND
(LOD = 10)
KPH/ND
(LOD = 10)
KPH/ND
(LOD = 10)
KPH/ND
(LOD = 10) ≤ 515
Pyren µg/kg KPH/ND
(LOD = 10)
KPH/ND
(LOD = 10)
KPH/ND
(LOD = 10)
KPH/ND
(LOD = 10) ≤ 875
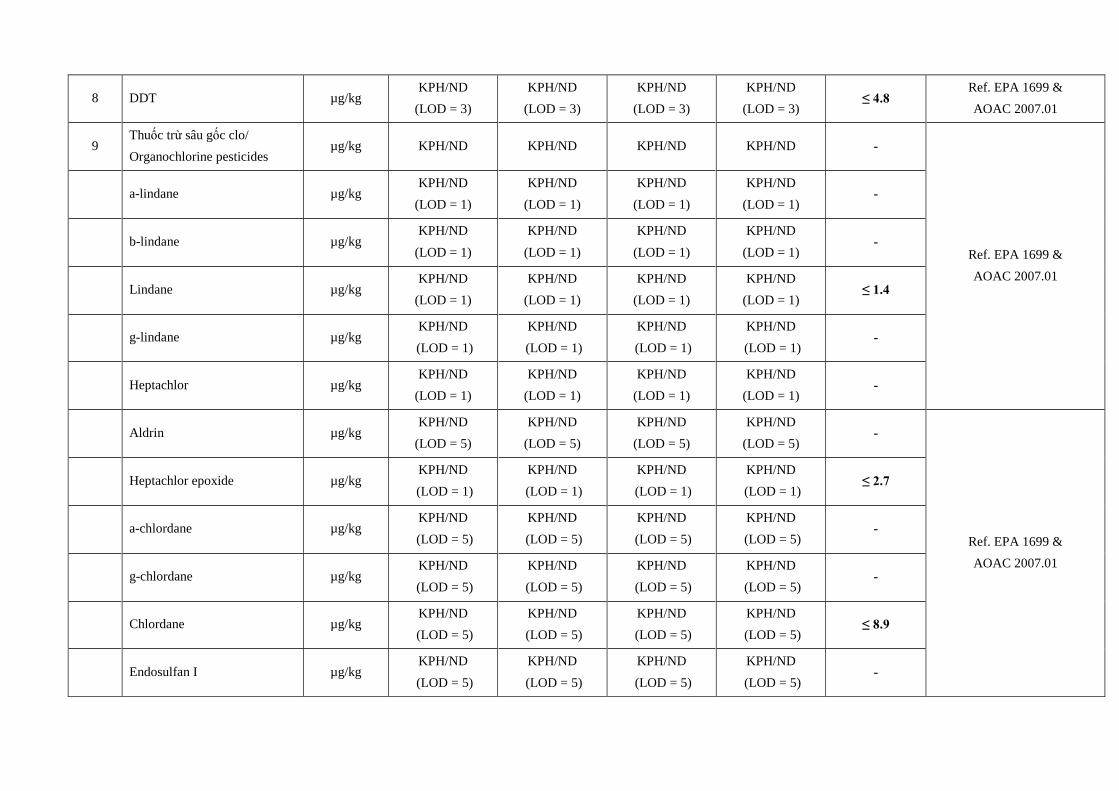
8 DDT µg/kg KPH/ND
(LOD = 3)
KPH/ND
(LOD = 3)
KPH/ND
(LOD = 3)
KPH/ND
(LOD = 3) ≤ 4.8
Ref. EPA 1699 &
AOAC 2007.01
9 Thuốc trừ sâu gốc clo/
Organochlorine pesticides µg/kg KPH/ND KPH/ND KPH/ND KPH/ND -
Ref. EPA 1699 &
AOAC 2007.01
a-lindane µg/kg KPH/ND
(LOD = 1)
KPH/ND
(LOD = 1)
KPH/ND
(LOD = 1)
KPH/ND
(LOD = 1) -
b-lindane µg/kg KPH/ND
(LOD = 1)
KPH/ND
(LOD = 1)
KPH/ND
(LOD = 1)
KPH/ND
(LOD = 1) -
Lindane µg/kg KPH/ND
(LOD = 1)
KPH/ND
(LOD = 1)
KPH/ND
(LOD = 1)
KPH/ND
(LOD = 1) ≤ 1.4
g-lindane µg/kg KPH/ND
(LOD = 1)
KPH/ND
(LOD = 1)
KPH/ND
(LOD = 1)
KPH/ND
(LOD = 1) -
Heptachlor µg/kg KPH/ND
(LOD = 1)
KPH/ND
(LOD = 1)
KPH/ND
(LOD = 1)
KPH/ND
(LOD = 1) -
Aldrin µg/kg KPH/ND
(LOD = 5)
KPH/ND
(LOD = 5)
KPH/ND
(LOD = 5)
KPH/ND
(LOD = 5) -
Ref. EPA 1699 &
AOAC 2007.01
Heptachlor epoxide µg/kg KPH/ND
(LOD = 1)
KPH/ND
(LOD = 1)
KPH/ND
(LOD = 1)
KPH/ND
(LOD = 1) ≤ 2.7
a-chlordane µg/kg KPH/ND
(LOD = 5)
KPH/ND
(LOD = 5)
KPH/ND
(LOD = 5)
KPH/ND
(LOD = 5) -
g-chlordane µg/kg KPH/ND
(LOD = 5)
KPH/ND
(LOD = 5)
KPH/ND
(LOD = 5)
KPH/ND
(LOD = 5) -
Chlordane µg/kg KPH/ND
(LOD = 5)
KPH/ND
(LOD = 5)
KPH/ND
(LOD = 5)
KPH/ND
(LOD = 5) ≤ 8.9
Endosulfan I µg/kg KPH/ND
(LOD = 5)
KPH/ND
(LOD = 5)
KPH/ND
(LOD = 5)
KPH/ND
(LOD = 5) -

Ghi chú/Note:
() Phương pháp đo đạc/phân tích được VILAS công nhận/Measuring/analyzing method
is accredited by VILAS.
KPH: Không phát hiện. LOD: Giới hạn phát hiện của phương pháp đo đạc/phân tích./
ND: Not detected. LOD: Limit of detection.
DW: Dry weight.
QCVN 43:2012/BTNMT: Quy chuẩn kỹ thuật quốc gia về chất lượng trầm tích/ National
technical regulation on sediment quality
Sed9: Vị trí tại cầu An Lạc ( giữa cầu An lạc và An Lập)/ Location at the junction An Lac
bridge( between the An Lac bridge and the An Lap bridge).
Sed10: Vị trí cách công Chợ Đệm 200m về phía cầu Nước Lên/ Location 200 meter from
Cho Dem river toward the Nuoc Len bridge.
Sed11: Vị trí đang thi công của gói 4A/ Location at the juction the package 4A.
Sed12: Vị trí tại cầu Tân Kỳ - Tân Quý/ Location at the junction the Tan Ky – Tan Quy
DDE µg/kg KPH/ND
(LOD = 5)
KPH/ND
(LOD = 5)
KPH/ND
(LOD = 5)
KPH/ND
(LOD = 5) ≤ 6.8
Deildrine µg/kg KPH/ND
(LOD = 5)
KPH/ND
(LOD = 5)
KPH/ND
(LOD = 5)
KPH/ND
(LOD = 5) ≤ 6.7
Endrine µg/kg KPH/ND
(LOD = 5)
KPH/ND
(LOD = 5)
KPH/ND
(LOD = 5)
KPH/ND
(LOD = 5) ≤ 62.4
DDD µg/kg KPH/ND
(LOD = 5)
KPH/ND
(LOD = 5)
KPH/ND
(LOD = 5)
KPH/ND
(LOD = 5) ≤ 8.5
Endosulfan II µg/kg KPH/ND
(LOD = 5)
KPH/ND
(LOD = 5)
KPH/ND
(LOD = 5)
KPH/ND
(LOD = 5) -
Endrine aldehyde µg/kg KPH/ND
(LOD = 5)
KPH/ND
(LOD = 5)
KPH/ND
(LOD = 5)
KPH/ND
(LOD = 5) -
Endosulfan sulfate µg/kg KPH/ND
(LOD = 5)
KPH/ND
(LOD = 5)
KPH/ND
(LOD = 5)
KPH/ND
(LOD = 5) -
Ref. EPA 1699 &
AOAC 2007.01 Methoxychlor µg/kg
KPH/ND
(LOD = 5)
KPH/ND
(LOD = 1)
KPH/ND
(LOD = 1)
KPH/ND
(LOD = 1) -
Endrine keton µg/kg KPH/ND
(LOD = 5)
KPH/ND
(LOD = 5)
KPH/ND
(LOD = 5)
KPH/ND
(LOD = 5) -

KẾT QUẢ PHÂN TÍCH MẪU
ANALYZING RESULT OF SAMPLE
Số phiếu/No: BN1151015 – MS/Code1510.0384-0386-0388-0390
Dự án
Project
Ký hiệu mẫu
Type of sample
:
:
:
:
GÓI THẦU FRM – PPTAF02 – DỰ ÁN QUẢN LÝ RỦI RO NGẬP NƯỚC
CHO KHU VỰC TP.HCM
Bùn đáy – Tầng mặt
Sediment - Surface layer
Ngày lấy mẫu/
Sampling date
:
12-13/10/2015
Stt
No.
Chỉ tiêu
Parameter
Đơn vị
Unit
Sed9
1510.0386
Sed10
1510.0384
Sed11
1510.0388
Sed12
1510.0390
QCVN
43:2012/
BTNMT
Phương pháp đo đạc/
phân tích
Measuring/Analyzing method
1 As mg/kgDW 2.83 3.16 5.86 KPH/ND
(LOD = 1) ≤ 17.0
TCVN 6649:2000,
SMEWW 3120 B (2012) ()
2 Cd mg/kgDW KPH/ND
(LOD = 0.5)
KPH/ND
(LOD = 0.5)
KPH/ND
(LOD = 0.5)
KPH/ND
(LOD = 0.5) ≤ 3.5
TCVN 6649:2000,
SMEWW 3120 B (2012) ()
3 Cr mg/kgDW 62.9 49.2 84.6 2.70 ≤ 90 TCVN 6649:2000,
SMEWW 3120 B (2012) ()
4 Hg mg/kgDW KPH/ND
(LOD = 0.5)
KPH/ND
(LOD = 0.5)
KPH/ND
(LOD = 0.5)
KPH/ND
(LOD = 0.5) ≤ 0.5
TCVN 6649:2000,
SMEWW 3120 B (2012) ()
5 Pb mg/kgDW 34.7 24.9 31.9 2.70 ≤ 91.3 TCVN 6649:2000,
SMEWW 3120 B (2012) ()
6 Fe mg/kgDW 43142 37057 46487 908 - TCVN 6649:2000,
SMEWW 3120 B (2012) ()
7 PAHs µg/kg KPH/ND KPH/ND KPH/ND KPH/ND - Ref. EPA 8272
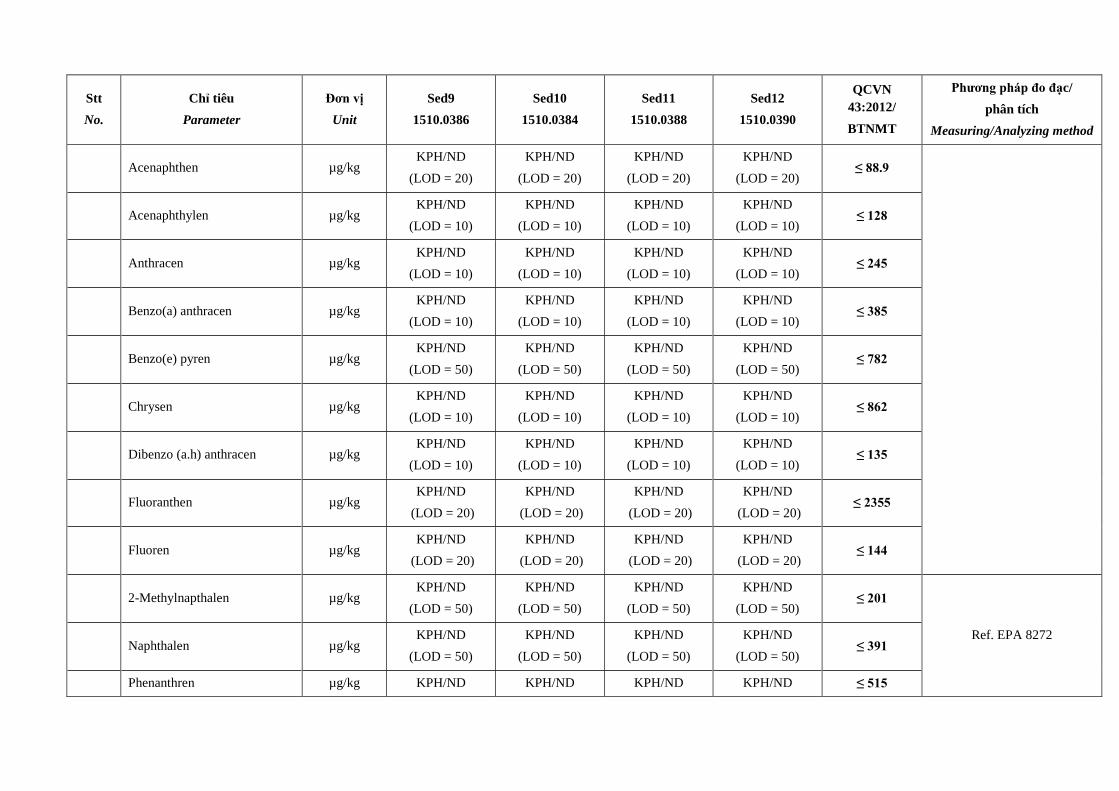
Stt
No.
Chỉ tiêu
Parameter
Đơn vị
Unit
Sed9
1510.0386
Sed10
1510.0384
Sed11
1510.0388
Sed12
1510.0390
QCVN
43:2012/
BTNMT
Phương pháp đo đạc/
phân tích
Measuring/Analyzing method
Acenaphthen µg/kg KPH/ND
(LOD = 20)
KPH/ND
(LOD = 20)
KPH/ND
(LOD = 20)
KPH/ND
(LOD = 20) ≤ 88.9
Acenaphthylen µg/kg KPH/ND
(LOD = 10)
KPH/ND
(LOD = 10)
KPH/ND
(LOD = 10)
KPH/ND
(LOD = 10) ≤ 128
Anthracen µg/kg KPH/ND
(LOD = 10)
KPH/ND
(LOD = 10)
KPH/ND
(LOD = 10)
KPH/ND
(LOD = 10) ≤ 245
Benzo(a) anthracen µg/kg KPH/ND
(LOD = 10)
KPH/ND
(LOD = 10)
KPH/ND
(LOD = 10)
KPH/ND
(LOD = 10) ≤ 385
Benzo(e) pyren µg/kg KPH/ND
(LOD = 50)
KPH/ND
(LOD = 50)
KPH/ND
(LOD = 50)
KPH/ND
(LOD = 50) ≤ 782
Chrysen µg/kg KPH/ND
(LOD = 10)
KPH/ND
(LOD = 10)
KPH/ND
(LOD = 10)
KPH/ND
(LOD = 10) ≤ 862
Dibenzo (a.h) anthracen µg/kg KPH/ND
(LOD = 10)
KPH/ND
(LOD = 10)
KPH/ND
(LOD = 10)
KPH/ND
(LOD = 10) ≤ 135
Fluoranthen µg/kg KPH/ND
(LOD = 20)
KPH/ND
(LOD = 20)
KPH/ND
(LOD = 20)
KPH/ND
(LOD = 20) ≤ 2355
Fluoren µg/kg KPH/ND
(LOD = 20)
KPH/ND
(LOD = 20)
KPH/ND
(LOD = 20)
KPH/ND
(LOD = 20) ≤ 144
2-Methylnapthalen µg/kg KPH/ND
(LOD = 50)
KPH/ND
(LOD = 50)
KPH/ND
(LOD = 50)
KPH/ND
(LOD = 50) ≤ 201
Ref. EPA 8272 Naphthalen µg/kg
KPH/ND
(LOD = 50)
KPH/ND
(LOD = 50)
KPH/ND
(LOD = 50)
KPH/ND
(LOD = 50) ≤ 391
Phenanthren µg/kg KPH/ND KPH/ND KPH/ND KPH/ND ≤ 515

Stt
No.
Chỉ tiêu
Parameter
Đơn vị
Unit
Sed9
1510.0386
Sed10
1510.0384
Sed11
1510.0388
Sed12
1510.0390
QCVN
43:2012/
BTNMT
Phương pháp đo đạc/
phân tích
Measuring/Analyzing method
(LOD = 10) (LOD = 10) (LOD = 10) (LOD = 10)
Pyren µg/kg KPH/ND
(LOD = 10)
KPH/ND
(LOD = 10)
KPH/ND
(LOD = 10)
KPH/ND
(LOD = 10) ≤ 875
8 DDT µg/kg KPH/ND
(LOD = 3)
KPH/ND
(LOD = 3)
KPH/ND
(LOD = 3)
KPH/ND
(LOD = 3) ≤ 4.8
Ref. EPA 1699 &
AOAC 2007.01
9 Thuốc trừ sâu gốc clo/
Organochlorine pesticides µg/kg KPH/ND KPH/ND KPH/ND KPH/ND -
Ref. EPA 1699 &
AOAC 2007.01
a-lindane µg/kg KPH/ND
(LOD = 1)
KPH/ND
(LOD = 1)
KPH/ND
(LOD = 1)
KPH/ND
(LOD = 1) -
b-lindane µg/kg KPH/ND
(LOD = 1)
KPH/ND
(LOD = 1)
KPH/ND
(LOD = 1)
KPH/ND
(LOD = 1) -
Lindane µg/kg KPH/ND
(LOD = 1)
KPH/ND
(LOD = 1)
KPH/ND
(LOD = 1)
KPH/ND
(LOD = 1) ≤ 1.4
g-lindane µg/kg KPH/ND
(LOD = 1)
KPH/ND
(LOD = 1)
KPH/ND
(LOD = 1)
KPH/ND
(LOD = 1) -
Heptachlor µg/kg KPH/ND
(LOD = 1)
KPH/ND
(LOD = 1)
KPH/ND
(LOD = 1)
KPH/ND
(LOD = 1) -
Aldrin µg/kg KPH/ND
(LOD = 5)
KPH/ND
(LOD = 5)
KPH/ND
(LOD = 5)
KPH/ND
(LOD = 5) -
Ref. EPA 1699 &
AOAC 2007.01 Heptachlor epoxide µg/kg
KPH/ND
(LOD = 1)
KPH/ND
(LOD = 1)
KPH/ND
(LOD = 1)
KPH/ND
(LOD = 1) ≤ 2.7
a-chlordane µg/kg KPH/ND
(LOD = 5)
KPH/ND
(LOD = 5)
KPH/ND
(LOD = 5)
KPH/ND
(LOD = 5) -

Stt
No.
Chỉ tiêu
Parameter
Đơn vị
Unit
Sed9
1510.0386
Sed10
1510.0384
Sed11
1510.0388
Sed12
1510.0390
QCVN
43:2012/
BTNMT
Phương pháp đo đạc/
phân tích
Measuring/Analyzing method
g-chlordane µg/kg KPH/ND
(LOD = 5)
KPH/ND
(LOD = 5)
KPH/ND
(LOD = 5)
KPH/ND
(LOD = 5) -
Chlordane µg/kg KPH/ND
(LOD = 5)
KPH/ND
(LOD = 5)
KPH/ND
(LOD = 5)
KPH/ND
(LOD = 5) ≤ 8.9
Endosulfan I µg/kg KPH/ND
(LOD = 5)
KPH/ND
(LOD = 5)
KPH/ND
(LOD = 5)
KPH/ND
(LOD = 5) -
DDE µg/kg KPH/ND
(LOD = 5)
KPH/ND
(LOD = 5)
KPH/ND
(LOD = 5)
KPH/ND
(LOD = 5) ≤ 6.8
Deildrine µg/kg KPH/ND
(LOD = 5)
KPH/ND
(LOD = 5)
KPH/ND
(LOD = 5)
KPH/ND
(LOD = 5) ≤ 6.7
Endrine µg/kg KPH/ND
(LOD = 5)
KPH/ND
(LOD = 5)
KPH/ND
(LOD = 5)
KPH/ND
(LOD = 5) ≤ 62.4
DDD µg/kg KPH/ND
(LOD = 5)
KPH/ND
(LOD = 5)
KPH/ND
(LOD = 5)
KPH/ND
(LOD = 5) ≤ 8.5
Endosulfan II µg/kg KPH/ND
(LOD = 5)
KPH/ND
(LOD = 5)
KPH/ND
(LOD = 5)
KPH/ND
(LOD = 5) -
Endrine aldehyde µg/kg KPH/ND
(LOD = 5)
KPH/ND
(LOD = 5)
KPH/ND
(LOD = 5)
KPH/ND
(LOD = 5) -
Ref. EPA 1699 &
AOAC 2007.01
Endosulfan sulfate µg/kg KPH/ND
(LOD = 5)
KPH/ND
(LOD = 5)
KPH/ND
(LOD = 5)
KPH/ND
(LOD = 5) -
Methoxychlor µg/kg KPH/ND
(LOD = 5)
KPH/ND
(LOD = 5)
KPH/ND
(LOD = 5)
KPH/ND
(LOD = 5) -
Endrine keton µg/kg KPH/ND KPH/ND KPH/ND KPH/ND -

Stt
No.
Chỉ tiêu
Parameter
Đơn vị
Unit
Sed9
1510.0386
Sed10
1510.0384
Sed11
1510.0388
Sed12
1510.0390
QCVN
43:2012/
BTNMT
Phương pháp đo đạc/
phân tích
Measuring/Analyzing method
(LOD = 5) (LOD = 5) (LOD = 5) (LOD = 5)
Ghi chú/Note:
() Phương pháp đo đạc/phân tích được VILAS công nhận/Measuring/analyzing
method
is accredited by VILAS.
KPH: Không phát hiện. LOD: Giới hạn phát hiện của phương pháp đo đạc/phân tích./
ND: Not detected. LOD: Limit of detection.
DW: Dry weight.
QCVN 43:2012/BTNMT: Quy chuẩn kỹ thuật quốc gia về chất lượng trầm tích/
National technical regulation on sediment quality.
Sed9: Vị trí tại cầu An Lạc ( giữa cầu An lạc và An Lập)/ Location at the junction An Lac bridge(
between the An Lac bridge and the An Lap bridge).(0593163;1186046)
Sed10: Vị trí cách cầu Chợ Đệm 200m về phía cầu Nước Lên/ Location 200 meter from Cho Dem
river toward the Nuoc Len bridge.(0593205;1184253)
Sed11: Vị trí đang thi công của gói 4A/ Location at the juction the package 4A.(0591376;1188406)
Sed12: Vị trí tại cầu Tân Kỳ - Tân Quý/ Location at the junction the Tan Ky – Tan Quy
(0591750;1187781)

Environmental and Social Impact Assessment, HCMC Steering Center of the Urban
and Environmental and Social Management Plan Flood Control Program
Proposed HCMC Flood Risk Management Project Date Submitted: December 2, 2015
291
ANNEX 3
ESTIMATION OF AIR EMISSION CONCENTRATION
FOR PRECONSTRUCTION PASE AND
CONSTRUCTION PHASE OF PROJECT COMPONENT 2

338
A. Estimation for air emission generated from subcomponent 2.1. 2.2 and 2.4 of component 2 during pre-construction phase
Table 3.1 Emission factor emitted from vehicle movement of sub-components during pre-construction phase
Activities
NO2 CO TSP SO2
Emission
Factor
(kg/km)
Emission
loading
(kg/day)
Emission
Factor
(kg/km)
Emission
(kg/day)
Emission
Factor
(kg/km)
Emission
(kg/day)
Emission
Factor
(kg/km)
Emission
(kg/day)
Subcomponent 2.1 Combined
ship lock and tidal sluice gates:
Nuoc Len.
0.00638 4.29 0.00251 1.68 0.0019 1.28 0.00017 0.11
Sub-Component 2.2: Canal
embankments in the main Tham
Luong – Ben Cat – Rach Nuoc
Len canal.
0.00638 5.51 0.00251 2.16 0.0016 1.64 0.00017 0.15
Sub-Component 2.4:
Secondary canals systems. 0.00638 12.76 0.00251 5.02 0.0016 3.80 0.00017 0.34
Table 3.2 Emission concentration emitted from transportation during land clearance phase
Receptors
NO2- 1 hr average (mg/m3) CO- 1hr average (mg/m
3) TSP- 1 hr average (mg/m
3) SO2- 1 hr average (mg/m
3)
Baseline Project
Top Up Baseline
Project Top
Up Baseline
Project Top
Up Baseline Project Top Up
Subcomponent
2.1 Combined ship
lock and tidal
sluice gates: Nuoc
Len.
0.23-0.28 0.17 7.11-7.12 7.17 0.11-0.14 0.14-0.18 0.02-0.024 0.024-0.028

339
Receptors
NO2- 1 hr average (mg/m3) CO- 1hr average (mg/m
3) TSP- 1 hr average (mg/m
3) SO2- 1 hr average (mg/m
3)
Baseline Project
Top Up Baseline
Project Top
Up Baseline
Project Top
Up Baseline Project Top Up
Sub-Component
2.2: Canal
embankments in
the main Tham
Luong – Ben Cat –
Rach Nuoc Len
canal.
0.013-0.053 0.19-0.229 2.73-15.05 2.8-15.12 0.1-0.38 0.15-0.38 0.008 – 0.043 0.012-0.047
Sub-Component
2.4: Secondary
canals systems.
0.013-0.053 0.42-0.46 2.73-15.05 2.89-15.21 0.1-0.38 0.22-0.5 0.008 – 0.043 0.019-0.054
QCVN 05:2013 0.2 30 0.3 0.35
WHO Guidelines 0.1 - - -
B. Estimation for air emission generated from all subcomponents of component 2 during construction phase
Table 3.3 Emission concentration emitted from machineries operation during land clearance
Equipment list Number of
equipment
Working
Hours
Horse
power (HP)
EF CO
(g/hp-hr)
Emission
loading
(g/8 hrs.)
EF NO2
(g/hp-
hr)
Emission
loading
(g/8 hrs.)
EF SO2
(g/hp-
hr)
Emission
loading
(g/8 hrs.)
EF TSP
(g/hp-
hr)
Emission
loading
(g/8 hrs.)
Excavator 1 8 500 1.282 5128 3.589 14356 0.006 24 0.48 1920
Bulldozer 1 8 500 3.053 12212 4.7 18800 0.006 24 0.5 2000
Truck 2 8 - 10.14 (g/hr) 162.24 6 (g/hr) 96 0.03
(g/hr) 0.48
7.46
(g/hr) 119.36

340
Total
17502.24
33252
48.48
4039.36
Table 3.4 Emission concentration emitted from machineries operation during land clearance
Receptors
NO2- 1 hr average (mg/m3) CO- 1hr average (mg/m
3) TSP- 1 hr average (mg/m
3) SO2- 1 hr average (mg/m
3)
Baseline Project
Top Up Baseline
Project Top
Up Baseline
Project Top
Up Baseline Project Top Up
Subcomponent 2.1
Combined ship lock
and tidal sluice gates:
Nuoc Len.
0.23-0.28 3.23-3.24 7.11-7.12 8.79-8.8 0.11-0.14 0.49-0.52 0.02-0.024 0.024-0.028
Sub-Component
2.2: Canal
embankments in the
main Tham Luong –
Ben Cat – Rach Nuoc
Len canal.
0.013-0.053 3.22-3.23 2.73-15.05 4.41-9.72 0.1-0.38 0.5-0.63 0.008 – 0.043 0.012-0.047
Sub-Component
2.4: Secondary
canals systems.
0.014-0.053 3.22-3.25 3.63-9.78 5.31-11.5 0.1-0.38 0.51-0.74 0.008 – 0.043 0.018-0.03
QCVN 05:2013 0.2 30 0.3 0.35
WHO Guidelines 0.1 - - -
Table 3.5 Emission factor emitted from vehicle movement of sub-components during construction
Activities NO2 CO TSP SO2
Emission Emission Emission Emission Emission Emission Emission Emission

341
Factor
(kg/km)
loading
(kg/day)
Factor
(kg/km)
(kg/day) Factor
(kg/km)
(kg/day) Factor
(kg/km)
(kg/day)
Subcomponent 2.1 Combined ship
lock and tidal sluice gates: Nuoc Len
and Vam Thuat
0.00638 11.57 0.00251 4.55 0.0019 3.44 0.00017 0.3
Sub-Component 2.2: Canal
embankments in the main Tham
Luong – Ben Cat – Rach Nuoc Len
canal.
0.00638 137.8 0.00251 54.2 0.0019 34.6 0.00017 3.7
0.0198 0.585 3.1 x 10⁻³
0.00675 1.3 x 10⁻³
8.91 1.5 x 10⁻⁵
1.4
Sub-Component 2.3: Selected
storm and waste water systems in Go
Vap District
0.00638 2.95 0.00251 1.16 0.0019 0.88 0.00017 0.08
Primary and secondary combined
storm water and sewer systems and
the secondary interceptor in Go Vap
district
0.00638 17.41 0.00251 6.85 0.0019 5.18 0.00017 0.46
Sub-Component 2.4: Secondary
canals systems. 0.00638 38.92 0.00251 15.31 0.0019 11.59 0.00017 1.03
Table 3.6 Emission factor emitted from vehicle movement of sub-components
Receptors
NO2- 1 hr average (mg/m3) CO- 1hr average (mg/m
3)
TSP- 1 hr average
(mg/m3)
SO2- 1 hr average (mg/m3)
Baseline Project Top
Up Baseline
Project Top
Up Baseline
Project Top
Up Baseline
Project Top
Up
Subcomponent 2.1 Combined
ship lock and tidal sluice gates:
Nuoc Len and Vam Thuat
0.025-0.028 0.4 7.11-7.12 7.26 0.1-0.14 0.21-0.25 0.02-0.024 0.03

342
Receptors
NO2- 1 hr average (mg/m3) CO- 1hr average (mg/m
3)
TSP- 1 hr average
(mg/m3)
SO2- 1 hr average (mg/m3)
Baseline Project Top
Up Baseline
Project Top
Up Baseline
Project Top
Up Baseline
Project Top
Up
Sub-Component 2.2: Canal
embankments in the main Tham
Luong – Ben Cat – Rach Nuoc
Len canal.
0.013-0.053 4.44-4.49 2.73-15.05 4.46-16.79 0.10-0.38 1.41-1.71 0.008-0.043 0.126-0.161
Sub-Component 2.3: Selected
storm and waste water systems
in Go Vap District
0.026-0.053 0.11-0.15 2.73-15.05 2.77-15.09 0.12-0.33 0.15-0.36 0.008-0.043 0.011-0.046
Primary and secondary
combined storm water and
sewer systems and the
secondary interceptor in Go Vap
district
0.013-0.053 0.57-0.61 2.73-15.05 2.95-15.27 0.12-0.33 0.28-0.49 0.008-0.043 0.02-0.06
Sub-Component 2.4:
Secondary canals systems. 0.013-0.047 1.26-1.30 2.73-9.78 3.22-10.27 0.12-0.33 0.49-0.70 0.008-0.026 0.04-0.06
QCVN 05:2013 0.2 30 0.3 0.35
WHO Guidelines 0.1 - - -
Table 3.7 Emission of air pollutants generated by machinery and vehicles (Subcomponent 1- combined ship lock and tidal sluice gates: Vam Thuat
or Nuoc Len) (Note: This table is estimated only for Vam Thuat or Nuoc Len given those have the same assumption of equipment list)

343
Equipment
list
Number of
equipment
Working
Hours
Horse
power
(HP)
EF CO
(g/hp-
hr)
Emission
loading
(g/8 hrs.)
EF NO2
(g/hp-
hr)
Emission
loading
(g/8 hrs.)
EF SO2
(g/hp-
hr)
Emission
loading
(g/8 hrs.)
EF TSP
(g/hp-hr)
Emission
loading
(g/8 hrs.)
Excavator 3 8 500 1.282 15384 3.589 43068 0.006 72 0.48 5760
Bulldozer 5 8 500 3.053 61060 4.7 94000 0.006 120 0.54 10800
Truck 4 8 - 10.14 324.48 6 192 0.03 0.96 7.46 238.72
Hammer
(piling work) 1 8 50 5.386 2154.4 5.1 2040 0.007 2.8 1.5 600
Concrete
mixer 3 8 250 1.118 6708 4.555 27330 0.006 36 0.5 3000
Plate
compactor 7 8 300 3.79 63672 5.67 95256 0.01 168 2 33600
Crane 1 8 175 1.29 1806 4.121 5769.4 0.006 8.4 0.52 728
Total 151108.88 267655.4 408.16 54726.72
Table 3.8 Emission of air pollutants generated by machinery and vehicles (Subcomponet 2 - Canal embankments in the main Tham Luong – Ben
Cat – Rach Nuoc Len canal)
Equipment
list
Number of
equipment
Working
Hours
Horse
power
(HP)
EF CO
(g/hp-
hr)
Emission
loading
(g/8 hrs.)
EF NO2
(g/hp-
hr)
Emission
loading
(g/8 hrs.)
EF SO2
(g/hp-
hr)
Emission
loading
(g/8 hrs.)
EF TSP
(g/hp-
hr)
Emission
loading
(g/8 hrs.)
Excavator 5 8 500 1.282 25640 3.589 71780 0.006 120 0.48 9615.4
Bulldozer 5 8 500 3.053 61060 4.7 94000 0.006 120 0.54 10769.2
Truck 4 8 - 10.14 324.48 6 192 0.03 0.96 7.46 238.8

344
Equipment
list
Number of
equipment
Working
Hours
Horse
power
(HP)
EF CO
(g/hp-
hr)
Emission
loading
(g/8 hrs.)
EF NO2
(g/hp-
hr)
Emission
loading
(g/8 hrs.)
EF SO2
(g/hp-
hr)
Emission
loading
(g/8 hrs.)
EF TSP
(g/hp-
hr)
Emission
loading
(g/8 hrs.)
Hammer
(piling work) 3 8 50 5.386 6463.2 5.1 6120 0.007 8.4 1.50 1800.0
Pilling
machine 3 8 250 1.494 8964 4.9 29400 0.0006 3.6 0.62 3692.3
Concrete
mixer 6 8 250 1.118 13416 4.555 54660 0.006 72 0.50 5953.8
Plate
compactor 10 8 300 3.79 90960 5.67 136080 0.01 240 2.00 48000.0
Crane 6 8 175 1.29 10836 4.121 34616.4 0.006 50.4 0.52 4329.2
Cutter
Suction
Dredger
2 8 5000 18.24 1459200 9.82 785600 2.88 230400 0.23 18400
Total
1646164.9
1053373
230808.1744
72553.6
Table 3.9 Emission factors of air pollutants generated by vehicles operation (Sub-component 3 - Selected storm and waste water systems in Go Vap
District: main interceptor)
Equipment
list
Number of
equipment
Working
Hours
Horse
power
(HP)
EF CO
(g/hp-
hr)
Emission
loading
(g/8 hrs.)
EF NO2
(g/hp-
hr)
Emission
loading
(g/8 hrs.)
EF SO2
(g/hp-
hr)
Emission
loading
(g/8 hrs.)
EF TSP
(g/hp-
hr)
Emission
loading
(g/8 hrs.)
Excavator 2 8 500 1.282 10256 3.589 28712 0.006 48 0.48 3840
Bulldozer 2 8 500 3.053 24424 4.7 37600 0.006 48 0.54 4320

345
Equipment
list
Number of
equipment
Working
Hours
Horse
power
(HP)
EF CO
(g/hp-
hr)
Emission
loading
(g/8 hrs.)
EF NO2
(g/hp-
hr)
Emission
loading
(g/8 hrs.)
EF SO2
(g/hp-
hr)
Emission
loading
(g/8 hrs.)
EF TSP
(g/hp-
hr)
Emission
loading
(g/8 hrs.)
Truck 4 8 - 10.14 324.48 6 192 0.03 0.96 7.46 238.72
Hammer
(piling work) 1 8 50 5.386 2154.4 5.1 2040 0.007 2.8 1.5 600
Concrete
mixer 2 8 250 1.118 4472 4.555 18220 0.006 24 0.5 2000
Crane 2 8 175 1.29 3612 4.121 11538.8 0.006 16.8 0.52 1456
Total
45242.88
98302.8
140.56
12454.72
Table 3.10 Emission factors of air pollutants generated by vehicles operation (Sub-component 3 - Selected storm and waste water systems in Go
Vap District: Primary and secondary combined storm water and sewer systems)
Equipment
list
Number of
equipment
Working
Hours
Horse
power
(HP)
EF CO
(g/hp-
hr)
Emission
loading
(g/8 hrs.)
EF
NO2
(g/hp-
hr)
Emission
loading
(g/8 hrs.)
EF SO2
(g/hp-
hr)
Emission
loading
(g/8 hrs.)
EF TSP
(g/hp-
hr)
Emission
loading
(g/8 hrs.)
Excavator 2 8 500 1.282 10256 3.589 28712 0.006 48 0.48 3840
Bulldozer 2 8 500 3.053 24424 4.7 37600 0.006 48 0.54 4320
Truck 4 8 - 10.14 324.48 6 192 0.03 0.96 7.46 238.72
Hammer
(piling work) 1 8 50 5.386 2154.4 5.1 2040 0.007 2.8 1.5 600
Concrete 2 8 250 1.118 4472 4.555 18220 0.006 24 0.5 2000

346
mixer
Crane 2 8 175 1.29 3612 4.121 11538.8 0.006 16.8 0.52 1456
Total
45242.88
98302.8
140.56
12454.72
Table 3.11 Emission of air pollutants generated by machinery and vehicles (Sub-component 4 - Secondary canals systems)
Equipment
list
Number of
equipment
Working
Hours
Horse
power
(HP)
EF CO
(g/hp-
hr)
Emission
loading
(g/8 hrs.)
EF NO2
(g/hp-
hr)
Emission
loading
(g/8 hrs.)
EF SO2
(g/hp-
hr)
Emission
loading
(g/8 hrs.)
EF TSP
(g/hp-
hr)
Emission
loading
(g/8 hrs.)
Excavator 5 8 500 1.282 25640 3.589 71780 0.006 120 0.48 9615.4
Bulldozer 5 8 500 3.053 61060 4.7 94000 0.006 120 0.54 10769.2
Truck 4 8 - 10.14 324.48 6 192 0.03 0.96 7.46 238.8
Hammer
(piling work) 3 8 50 5.386 6463.2 5.1 6120 0.007 8.4 1.50 1800.0
Pilling
machine 3 8 250 1.494 8964 4.9 29400 0.0006 3.6 0.62 3692.3
Concrete
mixer 6 8 250 1.118 13416 4.555 54660 0.006 72 0.50 5953.8
Plate
compactor 10 8 300 3.79 90960 5.67 136080 0.01 240 2.00 48000.0
Crane 6 8 175 1.29 10836 4.121 34616.4 0.006 50.4 0.52 4329.2
Cutter
Suction
Dredger
2 8 5000 18.24 1459200 9.82 785600 2.88 230400 0.23 18400
Total
1646164.9
1053373
230808.1744
72553.6

347
Table 3.12 Emission of air pollutants generated by operation of machinery and vehicles of all sub-components of component 2
Receptors
NO2- 1 hr average (mg/m3) CO- 1hr average (mg/m
3)
TSP- 1 hr average
(mg/m3)
SO2- 1 hr average (mg/m3)
Baseline Project Top
Up Baseline
Project Top
Up Baseline
Project Top
Up Baseline
Project Top
Up
Subcomponent 2.1 Combined
ship lock and tidal sluice gates:
Nuoc Len and Vam Thuat
0.023-0.028 12.93-12.95 7.11-7.12 14.40-14.41 0.1-0.14 2.74-2.78 0.02-0.024 0.039-0.04
Sub-Component 2.2: Canal
embankments in the main Tham
Luong – Ben Cat – Rach Nuoc
Len canal.
0.013-0.053 13.18-13.22 2.73-15.05 25.88-37.3 0.10-0.38 0.72-0.95 0.008-0.043 3.36-3.38
Sub-Component 2.3: Selected
storm and waste water systems in
Go Vap District
0.013-0.028 1.60-1.61 2.73-8.04 3.45-8.76 0.12-0.23 0.32-0.43 0.008-0.025 0.01-0.03
Sub-Component 2.3: Primary
and secondary combined storm
water and sewer systems and the
secondary interceptor in Go Vap
district
0.013-0.053 1.60-1.64 2.73-15.05 3.45-15.77 0.12-0.33 0.32-0.53 0.008-0.043 0.01-0.05
Sub-Component 2.4: Secondary
canals systems. 0.014-0.047 16.17-16.21 3.63-9.78 32.29-38.44 0.10-0.33 0.62-0.85 0.013-0.026 4.458-4.471
QCVN 05:2013 0.2 30 0.3 0.35
WHO Guidelines 0.1 - - -
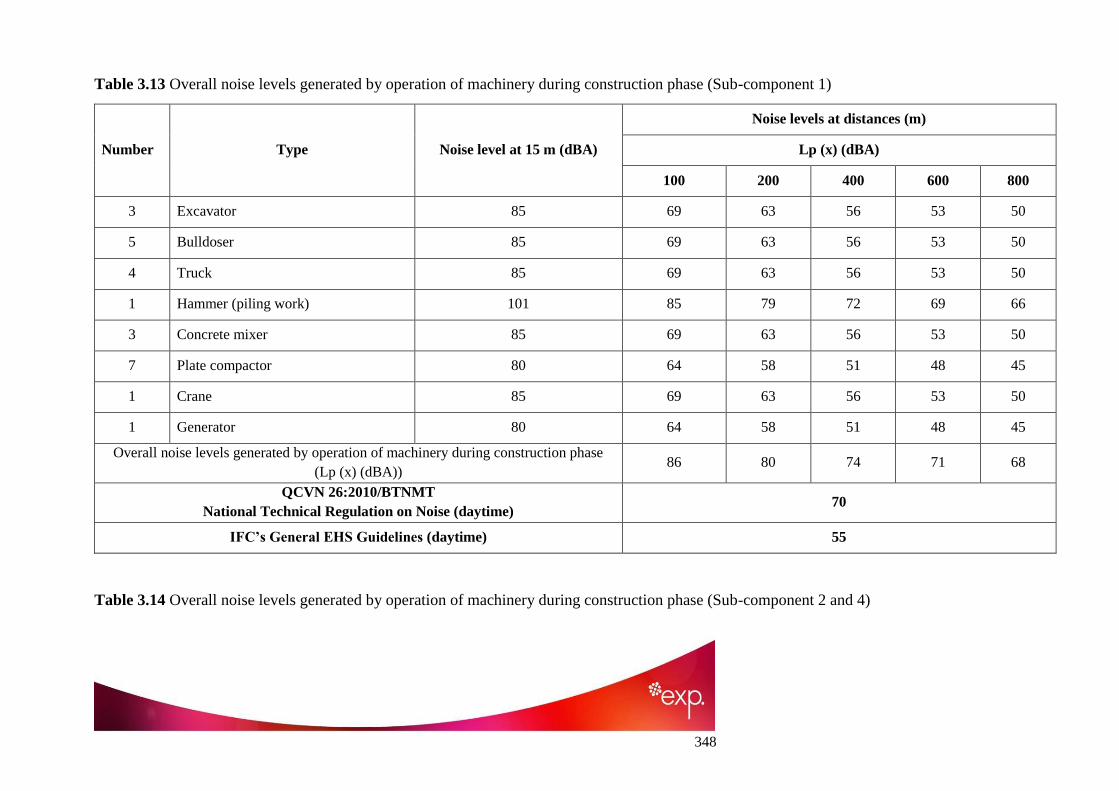
348
Table 3.13 Overall noise levels generated by operation of machinery during construction phase (Sub-component 1)
Number Type Noise level at 15 m (dBA)
Noise levels at distances (m)
Lp (x) (dBA)
100 200 400 600 800
3 Excavator 85 69 63 56 53 50
5 Bulldoser 85 69 63 56 53 50
4 Truck 85 69 63 56 53 50
1 Hammer (piling work) 101 85 79 72 69 66
3 Concrete mixer 85 69 63 56 53 50
7 Plate compactor 80 64 58 51 48 45
1 Crane 85 69 63 56 53 50
1 Generator 80 64 58 51 48 45
Overall noise levels generated by operation of machinery during construction phase
(Lp (x) (dBA)) 86 80 74 71 68
QCVN 26:2010/BTNMT
National Technical Regulation on Noise (daytime) 70
IFC‟s General EHS Guidelines (daytime) 55
Table 3.14 Overall noise levels generated by operation of machinery during construction phase (Sub-component 2 and 4)

349
Machineries
number Machineries Noise level at 15 m (dBA)
Noise levels at distances (m)
Lp (x) (dBA)
100 200 400 600 800 1000 1200
5 Excavator 85 68.5 62.5 56.5 53.0 50.5 48.5 46.9
5 Bulldoser 85 68.5 62.5 56.5 53.0 50.5 48.5 46.9
4 Truck 85 68.5 62.5 56.5 53.0 50.5 48.5 46.9
3 Hammer (piling work) 101 84.5 78.5 72.5 69.0 66.5 64.5 62.9
3 Pilling machine 101 84.5 78.5 72.5 69.0 66.5 64.5 62.9
6 Concrete mixer 85 68.5 62.5 56.5 53.0 50.5 48.5 46.9
10 Plate compactor 80 63.5 57.5 51.5 48.0 45.5 43.5 41.9
6 Crane 85 68.5 62.5 56.5 53.0 50.5 48.5 46.9
1 Generator 80 63.5 57.5 51.5 48.0 45.5 43.5 41.9
2 Cutter Suction Dredger 89 72.5 66.5 60.5 57.0 54.5 52.5 50.9
Overall noise levels generated by operation of machinery during construction phase
(Lp (x) (dBA)) 93 87 81 77 75 73 71
QCVN 26:2010/BTNMT
National Technical Regulation on Noise (daytime) 70
IFC‟s General EHS Guidelines (daytime) 55

350
Table 3.15 Overall noise levels generated by operation of machinery during construction phase (Sub-component 3)
Machineries
number Machineries
Noise level at
15 m (dBA)
Noise levels at distances (m)
Lp (x) (dBA)
100 200 400 600 800
2 Excavator 85 69 63 56 53 50
2 Bulldozer 85 69 63 56 53 50
4 Truck 85 68.5 62.5 56.5 53.0 50.5
1 Piling machine 101 85 79 72 69 66
2 Concrete mixer 85 69 63 56 53 50
1 Horizontal Boring Hydraulic Jack 80 64 58 51 48 45
2 Crane 85 69 63 56 53 50
1 Generator 80 64 58 51 48 45
Overall noise levels generated by operation of machinery during construction phase
(Lp (x) (dBA)) 86 80 74 70 68
QCVN 26:2010/BTNMT
National Technical Regulation on Noise (daytime) 70
IFC‟s General EHS Guidelines (daytime) 55

351
Table 3.16 Vibration estimation for vehicles operation of component 2

352
No. Vehicles PPVequip (D) (in/sec) (in ft) Lv (D) (ft)
10 17 34 66 75 10 17 34 66 75
1 Truck 0.850 0.300 0.136 0.048 0.018 106.97 97.94 91.02 81.99 73.35
2 Bulldoser 0.034 0.012 0.005 0.002 0.001 78.97 69.94 63.02 53.99 45.35
3 Piling works 16.972 6.000 2.707 0.957 0.354 132.97 123.94 117.02 107.99 99.35
4 Drilling 0.995 0.352 0.159 0.056 0.021 107.97 98.94 92.02 82.99 74.35
5 Excavator 0.034 0.012 0.005 0.002 0.001 78.97 69.94 63.02 53.99 45.35
6 Horizontal Boring
Hydraulic Jack 0.01186 0.00535 0.00189 0.00070 0.00058
7 Crane 0.027 0.013 0.007 0.003 0.002
8 Concrete mixer 0.270 0.126 0.070 0.033 0.016 NA NA NA NA NA

Environmental and Social Impact Assessment, HCMC Steering Center of the Urban
and Environmental and Social Management Plan Flood Control Program
Proposed HCMC Flood Risk Management Project Date Submitted: December 2, 2015
292
ANNEX 4
HOUSEHOLD SURVEY

Environmental and Social Impact Assessment, HCMC Steering Center of the Urban
and Environmental and Social Management Plan Flood Control Program
Proposed HCMC Flood Risk Management Project Date Submitted: December 2, 2015
293
“Environmental and Social Impact Assessment
Ho Chi Minh City Flood Risk Management Project”
Tham Luong – Ben Cat – Nuoc Len Sub-catchment”
Confidentiality: All data collected in this survey is completely confidential and will only be
used for statistical purposes.
Head of household full name: Gender:
Address: Phone number:
Name of interviewer: Signature of interviewer:
Survey date:
Note: The following questions are for the head of the household, or any household members over
the age of 18 in the household.
A. SOCIAL DEMOGRAPHY
Question 1: Please provide some general information about the household:
- Are you head of the household? 1. Yes 2. No
- Number of household members__________ Ethnicity

Package FRM-PPTAF 02: Environmental and Social Impact Assessment, HCMC Steering Center of the Urban
and Environmental and Social Management Plan Flood Control Program
Project Number: VNWC-00227753-A0 Date Submitted: December 2, 2015
294
No. Full name Gender Age Relationship with
household owner
Marital status
1. Married;
2. Not married;
3. Divorced;
4. Separated;
5. Widowed;
6. Other (specify)
Education
1. University or higher;
2. High school;
3.Secondary school;
4. Primary school;
5. Illiterate
Job Monthly
income
1
2
3
4
5
6
7
8
9
10
…
…

Environmental and Social Impact Assessment, HCMC Steering Center of the Urban
and Environmental and Social Management Plan Flood Control Program
Proposed HCMC Flood Risk Management Project Date Submitted: December 2, 2015
295
B. HOUSING AND LIVING FACILITIES
Question 2: When was the house constructed? (Please circle only ONE option)
1.Before 1993 2. 1993 – 2004 3. 2004 – 2009 4. 2009 – present
Question 3: Location of the house: (Please circle only ONE option)
1. On the street 2. In the alley (more than 4 meters in width)
3. In the narrow alley (less than 4 meters in
width)
4. Along the canal in the planned area
5. Along the canal/sub catchment area in the
unplanned area
6. On the canal
Question 4: Structure of the house: (Please circle only ONE option)
1. Above three storeys 2. Two storeys
3. One storey with flat roof 4. Level 4/ Temporary house
5. Apartment
Question 5: Housing condition/quality: (Please circle only ONE option)
1. Very good 2. Good 3. Average 4. Bad 5. Very bad
Question 6: Housing area (m2):
Question 7: Types of ownership: (Please circle only ONE option)
1. Rental house 2. Sole ownership 3. Shared house
Question 8: What is the supply source of drinking water?
1. Tap water 2. Well 3. Lake/river 4. Rainwater 5.Other (please specify):
Question 9: How is the household wastewater treated?
1. Through the sewers 2. Through canals/lakes
3. Discharged to the garden 4. Discharged to the street
Question 10: How is your household waste usually treated? (Please circle only ONE option)
1. Waste collection service at home 2. Taken to garbage collection site
3. Treat at home (landfill, fertilizer, burning…) 4. Throw somewhere
(please specify where you throw garbage)
Question 11: Please specify availability of the following utensils/amenities in your house?
Property Quantity Property Quantity
1. Bike 5. Washing machine
2. Motorbike 6. TV
3. Car 7. Computer

Environmental and Social Impact Assessment, HCMC Steering Center of the Urban
and Environmental and Social Management Plan Flood Control Program
Proposed HCMC Flood Risk Management Project Date Submitted: December 2, 2015
296
Property Quantity Property Quantity
4. Air conditioner 8. Internet connection
C. HOUSEHOLD ECONOMIC ACTIVITIES
Question 12: Which of the following is your source of monthly income?
Source of monthly income Monthly income
(VND)/month Note
1. Salary for employees in state-owned
organizations and enterprises
2. Salary for workers
3. Business, service
4. Pensions
5. From renting houses
6. Subsidy
7. Other:
8. Total monthly income
Question 13: Please specify your household‘s living cost per month:
Cost Amount (VND/month) Note
1. Food
2. Housing
3. Clothes
4. Electricity, water, gas, coal, phone
5. Transport (gasoline, parking…)
6. Study
7. Health, medical care
8. Entertainment and travel
9. Occasional events (wedding, birthday…)
10. Other: …
11. Total cost
C. FAMILY HEALTH CONDITIONS

Environmental and Social Impact Assessment, HCMC Steering Center of the Urban
and Environmental and Social Management Plan Flood Control Program
Proposed HCMC Flood Risk Management Project Date Submitted: December 2, 2015
297
Question 14: Is there any family member having health problem in the past one year?
1. Yes 2. No
If YES, please specify the health problem/symptoms?
1. Hearing impairment 2. Sight impairment 3. Breathing problem
4. Cholera 5. Tuberculosis 6. Hepatitis B
7. Typhoid 8. Dengue fever 9. Cardiovascular issue
10. Respiratory issue 11. Other:
If NO, please go to Question 15.
Question 15: Please indicate the extent of flooding impacts on your health and your family‘s
health: (Please circle only ONE option)
1. Extremely serious 2. Serious
3. A little serious 4. No impacts
Question 16: How does flooding impact your access to medical services? (Please circle only
ONE option)
1. Impact means of travel 2. Impact travel costs
3. Impact travel time 4. No impact at all
D. LOCAL INFRASTRUCTURE AND LIVING ENVIRONMENT
Question 17: Please indicate the structure of street/alley/lane where your house is situated?
(Please circle only ONE option)
1. Paved road 2. Concrete or cement road
3. Rock road 4. Soil road
Question 18: Please evaluate the road condition of your local area (Please circle only ONE
option)
1. Very good 2. Good 3. Average 4. Bad 5. Very bad
Question 19: To what extent does flooding impact on your daily travel? (Please circle only ONE
option)
1. Extremely serious 2. Serious
3. A little serious 4. Not serious at all
Question 20: Does your house get flooded? (Please circle only ONE option)
1. Yes, due to rising water and/or rainwater 2. Yes, due to rising water
3. Yes, only due to rainwater 4. Never flooded
Question 21: How do you evaluate the air quality of your neighborhood? (Please circle only
ONE option)

Environmental and Social Impact Assessment, HCMC Steering Center of the Urban
and Environmental and Social Management Plan Flood Control Program
Proposed HCMC Flood Risk Management Project Date Submitted: December 2, 2015
298
1. Good 2. Normal
3. Lightly polluted 4. Extremely polluted
F. AWARENESS/CONCERN ABOUT THE PROJECT
Question 22: How and since when did you hear about the project? (Please circle only ONE
option)
When:
1. This is the first time 2. Less than one year ago 3. 1-3 years 4.More than 3 years
How:
1. Newspaper/ TV 2. Announcement from local government
3. Announcement from public groups
4. Public meetings 5. Other:
Question 23: Did you attend any public consultation meeting of the Project?
1. Yes 2. No
Question 24: If YES, do you think that you have been provided with adequate information about
the Project, including project description, potential impacts and mitigation plan? (Please circle
only ONE option)
1. Adequate 2. Not adequate 3. Don‘t know
If NOT ADEQUATE, what information do you want to know about the Project?
1. Project description 2. Other potential impacts 3. Mitigation plan
4. Resettlement area 5. Livelihood recovery program 6. Other: ...
Question 25: Did you ask any question during the public consultation meeting?
1. Yes 2. No
If YES, was your question fully answered?
1. Not yet answered 2. Partly answered 3. Fully answered
Question 26: How does flood impact your household living conditions? From 1 to 5, please rank
the seriousness of potential impacts.
Impacts Yes No
Rank
(5 is the most serious impact)
1 2 3 4 5
1. Hygienic condition
2. Water pollution

Environmental and Social Impact Assessment, HCMC Steering Center of the Urban
and Environmental and Social Management Plan Flood Control Program
Proposed HCMC Flood Risk Management Project Date Submitted: December 2, 2015
299
Impacts Yes No
Rank
(5 is the most serious impact)
1 2 3 4 5
3. Air pollution
4. Health
5. Economic cost (repair cost, property
loss…)
6. Value of the house
7. Access to electricity and clean water
(availability, price, etc.)
8. Job and income
For local businesses
9. Impacts on business activities
- Delay in production
- Delay in delivery
10. Impacts on revenue
- Damage to production facilities
- Damage and loss of products
11. Impacts on work environment
- Food hygiene and safety
- Hygiene in workplace
- Hygiene in production area
12. Impact on workers‘ income
Question 27: Please specify your opinion/expectation towards improving the hygienic
conditions and flooding issue in the area? …………………………………………………………
Question 28: To what extent do you support the city‘s flooding improvement projects such as
Nhieu Loc - Thi Nghe and Tham Luong - Ben Cat?
1. Don‘t support 2. No idea 3. Support 4. Strongly support
Thank you for your participation!
Environmental and Social Impact Assessment, HCMC Steering Center of the Urban
and Environmental and Social Management Plan Flood Control Program
Proposed HCMC Flood Risk Management Project Date Submitted: December 2, 2015
300
ANNEX 5
DESCRIPTION OF SOCIAL IMPACT ASSESSMENT
PROCESS

Environmental and Social Impact Assessment, HCMC Steering Center of the Urban
and Environmental and Social Management Plan Flood Control Program
Proposed HCMC Flood Risk Management Project Date Submitted: December 2, 2015
301
DESCRIPTION OF SOCIAL IMPACT ASSESSMENT PROCESS
Articulating the impact
It is critical to be very specific and clear when articulating household and community health
impacts. If impacts are not clearly defined, the impact rating process could result in an inaccurate
impact categorisation. When defining impacts, it is important to:
- Clearly specify the source of the impact with clear reference to causal Project activities;
- Summarise the baseline context including specific reference to potential vulnerable groups;
and
- State any assumptions.
Determining the magnitude
Magnitude of household and community health impacts is understood as a reflection of the ‗size‘
or degree of change caused by social and community health impacts. Magnitude is a function of
one or more of the following characteristics:
- Extent;
- Duration;
- Scale;
- Frequency; and
- Likelihood (for unplanned events only).
Please check Annex 3 for definition of characteristics to define magnitude and designation of
magnitude.
Assessing Levels of Vulnerability
Vulnerability is underpinned by a low existing level of livelihoods assets (such as health or
education) or inadequate access to public facilities, services and opportunities for jobs and
livelihood. In order to identify vulnerable receptors, it is necessary to identify receptors that
experience these circumstances and analyze adaptive abilities of the receptors. It is classified into
three types as presented in Table 5.1.
Table 5.1 Levels of Vulnerability
Type Definition
Low Minimal vulnerability; consequently with a high ability to adapt to changes brought by
the Project and opportunities associated with it.
Medium Some, but few areas of vulnerability; still retaining an ability to at least in part adapt to
change brought by the Project and opportunities associated with it.

Environmental and Social Impact Assessment, HCMC Steering Center of the Urban
and Environmental and Social Management Plan Flood Control Program
Proposed HCMC Flood Risk Management Project Date Submitted: December 2, 2015
302
Type Definition
High Profound or multiple levels of vulnerability that undermine the ability to adapt to
changes brought by the Project and opportunities associated with it.
Evaluating Significance for Social and Health Impacts
The significance of social and health impacts is evaluated taking into account the magnitude of
the impact and the vulnerability of affected receptors. For rating significance for social and
community health impacts, the matrix in Table 6.3 is used to assign social and community health
impact significance for both negative and positive impacts, and includes the definitions of
magnitude and vulnerability designations.
Table 5.2 Impact Significance
Sensitivity/Vulnerability/Importance of Resource/Receptor
Low Medium High
Magn
itu
de
of
Imp
act
Negligible Negligible Negligible Negligible
Small Negligible Minor Moderate
Medium Minor Moderate Major
Large Moderate Major Major
Magnitude
of Impact Positive Minor Moderate Major

Environmental and Social Impact Assessment, HCMC Steering Center of the Urban
and Environmental and Social Management Plan Flood Control Program
Proposed HCMC Flood Risk Management Project Date Submitted: December 2, 2015
303
ANNEX 6
SUMMARY OF RESETTLEMENT ACTION PLAN

Environmental and Social Impact Assessment, HCMC Steering Center of the Urban
and Environmental and Social Management Plan Flood Control Program
Proposed HCMC Flood Risk Management Project Date Submitted: December 2, 2015
304
6.1. Project description
HCMC faces serious problems of flooding during the rainy season from July to November and
high tides from September to December each year. The flooding in the urban area of HCMC
poses big challenge due to the high concentration of residents and property in the central area,
and has direct impacts on the city‘s economic growth. A lot of plans have been approved in order
to manage flood risks in the city area. However, the implemented plans still lack overall
orientation in order to have significant effects on reducing floods in HCMC.
The proposed HCMC Flood Risk Management project aims to reduce flood risk and improve
drainage in selected areas of HCMC. It will support the coordination of relevant flood risk
management plans to prevent tides, adequately drain off the water to stop flood for the City
Centre area (taking into consideration climate change impacts). This project will be aligned with
the Twin Goals of the WB on poverty reduction and promoting shared prosperity
6.2. The scope of the impacts and land acquisition
The project is to be implemented in the area of 15 ward in 4 districts of HCMC, including:
Binh Tan District: An Lac Ward, Binh Hung Hoa B Ward, Binh Hung Hoa Ward
Go Vap District: Ward 6, Ward 5, Ward 13, Ward 14, Ward 15, Ward 16, Ward 17
District 12: Thoi An Ward, Thanh Xuan Ward, Thanh Loc Ward, An Phu Dong Ward
Tan Binh District: Ward 15
The project will acquire 185,046 m2 of land belonging to 717 HHs, enterprises and
organizations.
Residential Land: 17,598 m2;
Agriculture land: 131,773 m2
Non-agricultural Land: 10,877 m2
Other land: 24,798 m2
A total 717 households, enterprises and organizations in the project area will be affected due to
permanent land acquisition for the purpose of the project. In which:
493 households are affected on residential land
208 households are affected on agricultural land
7 households are affected on non-agricultural land
23 household are affected on other land
There are 65 HHs severely affected, of which 60 PAHs suffer from more than 20% and 5 PAHs
suffer from more than 10% (for vulnerable households) agricultural land (including gardening
land).
There are 424 HHs affected housing, of which 71 totally affected and will need relocation. In
additional 77 HHs may need relocation.

Environmental and Social Impact Assessment, HCMC Steering Center of the Urban
and Environmental and Social Management Plan Flood Control Program
Proposed HCMC Flood Risk Management Project Date Submitted: December 2, 2015
305
There are 157 affected household businesses.
38 HHs out of the 697 households are identified as vulnerable households, including those
headed by single women with dependents, poor households, households with the disable, single
elderly households, ethnic minorities, and social policy beneficiary households. In which five
vulnerable households will lose from 10% of their productive landholdings.
6.3. Socio-economic information in project area
The sample rate used for socio-economic survey project area includes 100% of the seriously
PAHs, relocated HHs, and about 20% other PAHs were randomly selected. The survey method is
done by the questionnaire interview. The socioeconomic survey results are summarized as
follow:
There are 451 HHs with 1,990 inhabitants surveyed. Household size in the PAHs is 4.41
people/household. In total 451 HHs, HHs with male heads account for 268 HHs, while the
number of female-headed HHs is 183 HHs. The average age of the household head is 50 years
old.
Educational background: the majority of household heads with primary education level are 63%.
The number of household heads holding secondary or higher degrees forms 12.2%. Educational
attainment of the household members also focuses highest on primary with 51.4%.
Occupation: For homeowners, service trade accounts for a high percentage of all HHs‘
profession with 66.1%, followed by workers and employees. The number of all HHs with
incomes coming from salaries (including pensions) makes up the percentage of 16.6%. In
contrast, the percentage of all agricultural HHs is the lowest with 2.44%.
In total 1,340 people in the working age of PAHs surveyed, the number of people working in the
service trade sector also accounts for the highest percentage with 20.9%, followed by the
percentage of people hired with 16%, workers with 13%, housewife with 10.2%, and the lowest
is agriculture with 1:27%.
The average income of 451 HHs is 11,469,426V VND/month, in which the average income of
the male head of household is higher than that of female-headed. Income sources of HHs are
based on the following four revenue sources: wages; service business, supporting relatives, and
agricultural assistance.
6.4. Legal framework
The policy framework and entitlement of the project are developed based on the regulations of
the GoV on compensation, support, and resettlement when land is recovered by the State and
involuntary resettlement policy of WB. Due to some differences between the policies of the WB
and the policy of the GoV on compensation, support, and resettlement, this project requires the
exemption from compliance with provisions of the Decree and Vietnam Government.
Accordingly, the compensation, support and RAP of the project will be implemented under the
RPF of the project approved by the Prime Minister.

Environmental and Social Impact Assessment, HCMC Steering Center of the Urban
and Environmental and Social Management Plan Flood Control Program
Proposed HCMC Flood Risk Management Project Date Submitted: December 2, 2015
306
The compensation, assistance and resettlement principles of this RPF have been disseminated to
the representatives of the District Compensation, Assistance and Resettlement Boards, local
authorities, and affected households during the consultation meetings held in October and
November 2015. Their feedbacks have been incorporated into the RPF and RAP.
6.5. Resettlement measures
If no other residential land in the respective ward exists, HHs and individuals with the entire
house and land acquired by the project, or for whom the rest of area after acquisition not eligible
for construction permit, will be entitled to: (i) arrange resettlement; and (ii) in case the land
compensation rate is lower than the value of minimum land in resettlement areas, will be
supported for the difference by the State as long as the amount of support does not exceed the
amount of the difference rate between the land compensation rate and minimum resettlement
land prescribed locally.
For the case of PAHs whose residential land is not eligible for compensation (including canal
encroaching HHs), if there is no other place on the respective ward, they will be allocated
minimum resettlement land in resettlement sites and PAHs must pay land use fees.
The displaced PAHs of the project will be relocated in the available resettlement areas in the city
areas.
6.6. Income Restoration Program
The Income Restoration Plan (IRP) will be developed for those affected by land acquisition of
the project. Project policy objectives indicate that the livelihoods and incomes of the PAHs must
be actually restored at least equal to or higher than the level before displacement or before
starting the project if that level is higher.
Gender issues: Socio-economic survey shows that women suffer more than men in the process
of resettlement and income restoration. A Gender Strategy will be developed for the project in
order to promote participation of women in the process of project implementation as well as to
facilitate the development of women.
6.7. Dissemination of information and public consultation
The community consultations, public meeting, and discussion between the PAHs and local
officials have been carried out in the relevant wards from October to November 2015. In total
393 affected people participated in the public consultation for information on the subproject,
impacts, policies, and entitlements applied. Responses from the public consultation were taken
into consideration and updated in this RAP.
6.8. Grievance redress machanism
A mechanism of handling and redressing grievances will be clearly established to redress
grievances and complaints of PAHs related to land acquisition, compensation and resettlement in
a timely and satisfactory manner. An effective and reliable Grievance Redress Mechanisms is
necessary to ensure the social negative impacts, particularly those subjects related to land

Environmental and Social Impact Assessment, HCMC Steering Center of the Urban
and Environmental and Social Management Plan Flood Control Program
Proposed HCMC Flood Risk Management Project Date Submitted: December 2, 2015
307
acquisition, are resolved effectively and promptly. Grievance Redress Mechanism and
prosecution complying with current Law on Complaints of the GoV is stipulated in Article 28,
Article 32 and Article 33 of the Law on Complaints No. 02/2011 / QH13 dated 11/11/2011.
6.9. Implementation Arrangements
The implementation of compensation, support, and resettlement requires the participation of
agencies and local organizations in all levels including city, district, and ward projects. HCMC
People's Committee will be responsible for the overall compliance with the provisions in the
Resettlement Policy Framework and Resettlement Plan (RP) built under the guidance of the
Resettlement Policy Framework of the project.
PMU assists the Project Owner to directly manage project implementation. It is responsible for
updating and implementing the RAP of the Project.
The project Consultants have supported PMU and district land clearance and compensation
Board to ensure resettlement work are performed in accordance with the policy of involuntary
resettlement of the WB.
PMU will submit the updated Land Clearance and Resettlement Plan to HCMC People's
Committee and the WB for review and approval prior to implementation of land clearance
compensation.
6.10. Implementation Schedule
Compensation, assistance and resettlement activities will be carried out during the 2016.
6.11. Budget
It is estimated that the total cost for compensation and assistance is VND 904,402,793,000
(equivalent to USD 41,109,217.86). This budget includes the cost of compensation, support, and
resettlement and Income Restoration Plan, management costs, grievance redressing, independent
monitoring, and contingency expenses.
6.12. Monitoring and evaluation
PMU is responsible for the overall internal monitoring of resettlement activities. Progress reports
will be submitted to the WB quarterly.
PMU will hire an independent monitoring agency before the start of implementation of the RP.
Independent monitoring agency will report the beginning of the period after 1 month of
operation. This unit will also submit a report every six months on the progress of implementation
of the RP, and propose recommendations on request as well. Independent monitoring agency will
conduct post-implementation evaluation of resettlement within 6 - 12 months after the
completion of the project resettlement activities.

Environmental and Social Impact Assessment, HCMC Steering Center of the Urban
and Environmental and Social Management Plan Flood Control Program
Proposed HCMC Flood Risk Management Project Date Submitted: December 2, 2015
308
ANNEX 7
PICTURES OF SAMPLING

Environmental and Social Impact Assessment, HCMC Steering Center of the Urban
and Environmental and Social Management Plan Flood Control Program
Proposed HCMC Flood Risk Management Project Date Submitted: December 2, 2015
309
Figure 7.1 Monitoring sediment quality at HyVong canal.
Figure 7.2 Monitoring sediment quality at Chin Xieng canal.
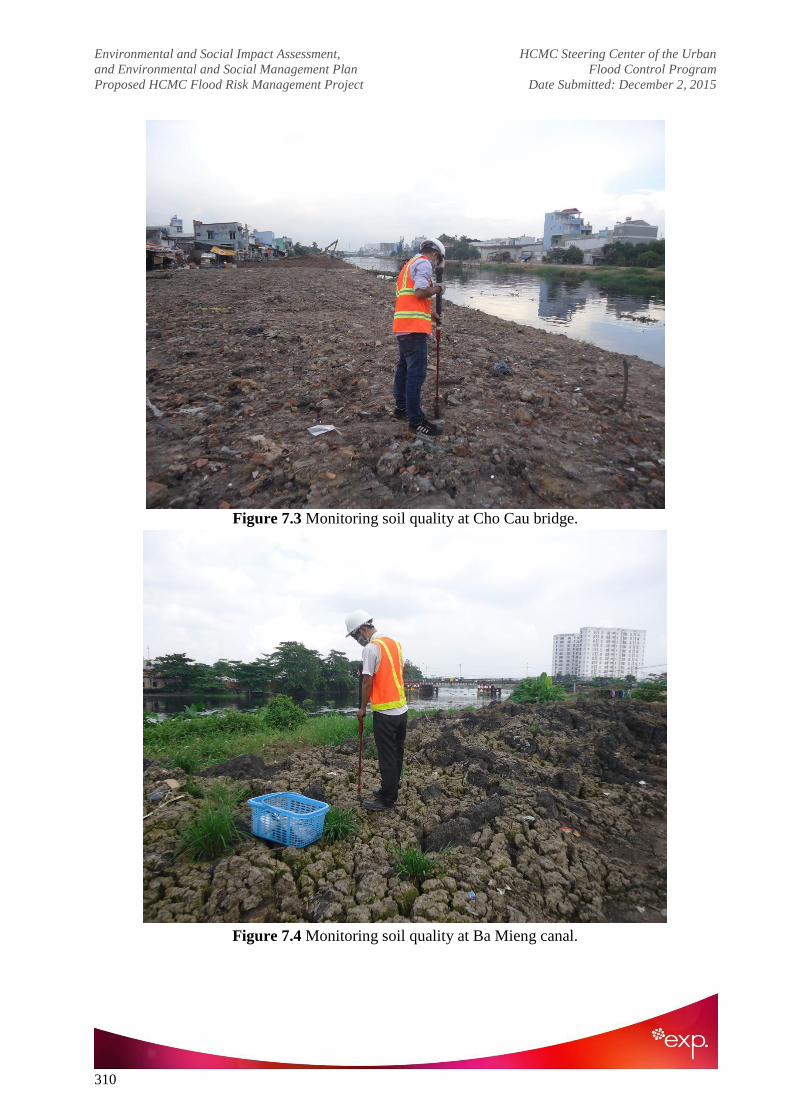
Environmental and Social Impact Assessment, HCMC Steering Center of the Urban
and Environmental and Social Management Plan Flood Control Program
Proposed HCMC Flood Risk Management Project Date Submitted: December 2, 2015
310
Figure 7.3 Monitoring soil quality at Cho Cau bridge.
Figure 7.4 Monitoring soil quality at Ba Mieng canal.

Environmental and Social Impact Assessment, HCMC Steering Center of the Urban
and Environmental and Social Management Plan Flood Control Program
Proposed HCMC Flood Risk Management Project Date Submitted: December 2, 2015
311
Figure 7.5 Monitoring air quality at Vam Thuat sluice.
Figure 7.6 Monitoring air quality at Nuoc Len sluice.

Environmental and Social Impact Assessment, HCMC Steering Center of the Urban
and Environmental and Social Management Plan Flood Control Program
Proposed HCMC Flood Risk Management Project Date Submitted: December 2, 2015
312
ANNEX 8
PICTURES OF PUBLIC CONSULTATION

Environmental and Social Impact Assessment, HCMC Steering Center of the Urban
and Environmental and Social Management Plan Flood Control Program
Proposed HCMC Flood Risk Management Project Date Submitted: December 2, 2015
313
Figure 8.1 Registering to attend the public consultation.
Figure 8.2 Watching the map of the project area.

Environmental and Social Impact Assessment, HCMC Steering Center of the Urban
and Environmental and Social Management Plan Flood Control Program
Proposed HCMC Flood Risk Management Project Date Submitted: December 2, 2015
314
Figure 8.3 Opening the public consultation.
Figure 8.4 The representative of PMU presented project.
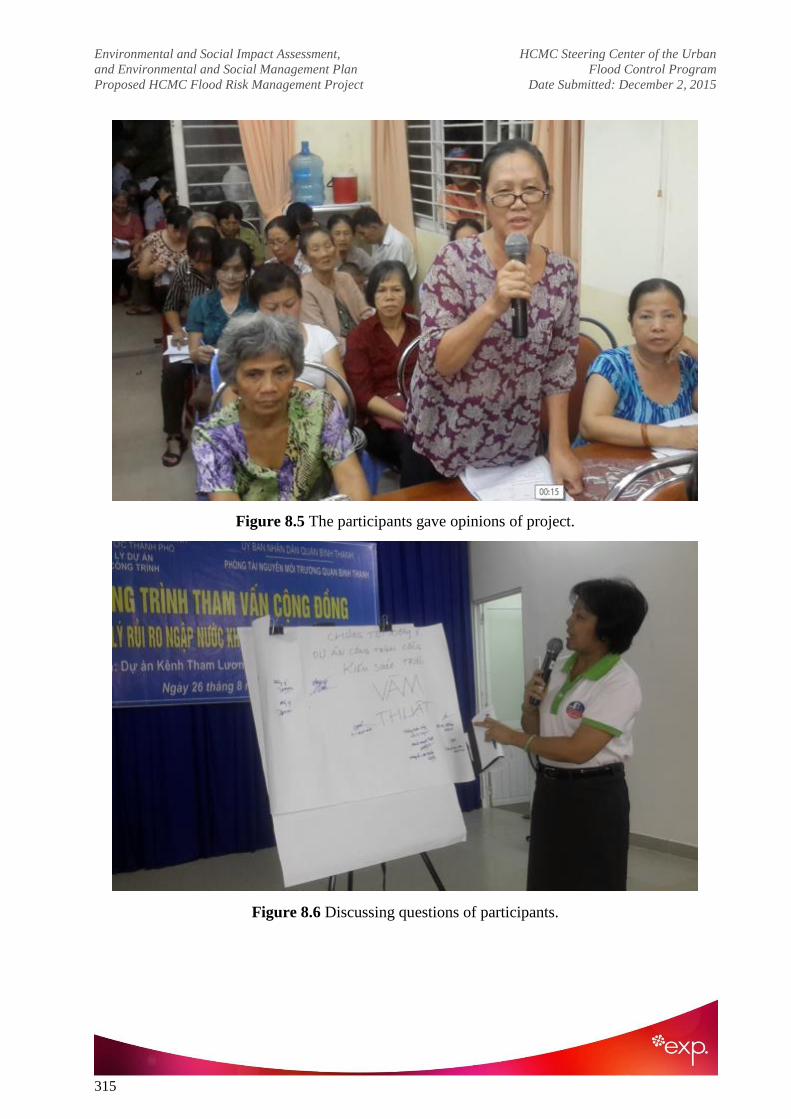
Environmental and Social Impact Assessment, HCMC Steering Center of the Urban
and Environmental and Social Management Plan Flood Control Program
Proposed HCMC Flood Risk Management Project Date Submitted: December 2, 2015
315
Figure 8.5 The participants gave opinions of project.
Figure 8.6 Discussing questions of participants.

Environmental and Social Impact Assessment, HCMC Steering Center of the Urban
and Environmental and Social Management Plan Flood Control Program
Proposed HCMC Flood Risk Management Project Date Submitted: December 2, 2015
316
Figure 8.7 The representative of PMU answered the questions of participants.
Figure 8.8 The representative of FS answered the questions of participants.

Environmental and Social Impact Assessment, HCMC Steering Center of the Urban
and Environmental and Social Management Plan Flood Control Program
Proposed HCMC Flood Risk Management Project Date Submitted: December 2, 2015
317
ANNEX 9
CUMULATIVE IMPACT ASSESSMENT

Environmental and Social Impact Assessment, HCMC Steering Center of the Urban
and Environmental and Social Management Plan Flood Control Program
Proposed HCMC Flood Risk Management Project Date Submitted: December 2, 2015
318
9.1. Introduction
9.1.1 General approach
International Finance Corporation proposed a Good Practice Handbook to assess cumulative
impact of a project. Good practice requires that sponsors assess if project may contribute to
cumulative impact on VEC‘s (valued environment components). When there is a lack of baseline
data the handbook propose to develop a Rapid Cumulative Impact Assessment Approach. The
Good Practice Handbook, also proposing a logical framework with six interactive steps. Figure 1
below illustrates this approach.
The sequence of activities is:
1) Determine project boundaries
2) Identify Valued Environmental Components (VEC)
3) Determine present conditions of VEC
4) Assess the contribution of project
5) Predict the cumulative impact of project
6) Design mitigation measures
Source: IFC Good Practice Handbook
We used a RCIA process that begins with principles of environmental impact assessment
generally accepted in Vietnam. The key to this approach is to choose a set of ―valued
environment components‖ (VECs) that will be the focus of the assessment. Focusing on VECs,
rather than the effects, enables one to ask specific questions in specific places about the effects of
a full array of human and economic activities (i.e., the cumulative effects).

Environmental and Social Impact Assessment, HCMC Steering Center of the Urban
and Environmental and Social Management Plan Flood Control Program
Proposed HCMC Flood Risk Management Project Date Submitted: December 2, 2015
319
The PMU used a RCIA process that begins with the choice of a set of ―valued environmental
components‖ (VECs). That focuses the assessment on the cumulative effects on the VECs. We
chose specific VEC identified in RFP as our components in RCIA to be monitor:
Surface Water
Underground Water
Air
Sludge
Soil
These VECs were chosen largely for the purposes of demonstration. For each VEC we:
Chose a set of indicators to represent the status of VECs;
Chose limits of acceptable change or limits of concern for indicators for the VECs as per
TCVN references;
Collect information about the historical and current status of the indicators;
Project the future status of the indicators (where appropriate).
Indicators for all five VECs required a model depicting the change in watershed conditions. We
used a map describing the zone of influence. A variety of data was used from previous studies.
We will project development scenarios for 20 years into the future using a combination of trend
analysis. The model selected is evaluated with the Chemiotox Index tool
Once the cumulative impacts are determined, their significance must be considered relative to an
established threshold limit, an established legal guideline or policy, or a qualitative assessment
based on professional opinion and consultation. In any case, the significance of the cumulative
impacts must be defensible. The significance of the cumulative impacts and the contribution of
the project must be subsequently evaluated by project decision makers. The consultant needs to
define the level of ―significance‖ or scale and apply it consistently. The significance should be
assessed across past, present and future projects on the trends of each VEC. The significance of
the project interventions‘ contribution to the cumulative impacts should be defined in one of the
following ways:
The project has a measurable effect on the resource;
The project acts in conjunction with the effects of past present or future projects and
activities; and
The project in conjunction with other projects and activities shifts the resource to an
unacceptable level or exceeds a threshold such that the impact is considered significant, in
that:
– The project‘s contribution to cumulative effects is responsible for exceeding or not the
threshold and therefore is significant or,
– The project is contributing with the effects of other projects and activities and the project
contribution may or may not be significant, depending on the level of the contribution.

Environmental and Social Impact Assessment, HCMC Steering Center of the Urban
and Environmental and Social Management Plan Flood Control Program
Proposed HCMC Flood Risk Management Project Date Submitted: December 2, 2015
320
9.1.2. Modeling
The Chemiotox Index model is a mathematical tool for evaluating the overall picture of the toxic
substances discharged into the environment. This evaluation is based on the chemical
characterization results of toxic substances (mg/L), following the weighting (FTOX) of the
relative toxic potential of each substance present in the waste discharged. For practical purposes,
partial indicators (Chemiotox unit, CU) are calculated on the basis of individual results of each
toxic substance in order to integrate these and obtain an overall indicator (Chemiotox Index, CI =
Σ CU). These indicators allow the comparison and integration of important quantities of
characterization data.
The toxicity weighting methodology is quite simple and, serves uniquely environmental
management purposes. Water quality criteria represent an exhaustive census of toxicological
information on pollutants (persistence, bio-accumulation and part of the food chain). This
census aims to define the acceptable concentration limit (mg/L) for the protection of human life
and aquatic ecosystems. The more toxic the substance, the smaller the criterion. In the
CHEMIOTOX model, two water quality criteria were retained, that is the chronic toxicity criteria
(CTC, mg/L) and those pertaining to the contamination of aquatic organisms (CAOC, mg/L).
With these two types of criteria, the toxic effects of chronic exposure to a substance and its bio-
concentration capacity in the food chain are both taken into account. The toxic weighting factor,
FTOX-I related to each substance I, could be arbitrary by defined as proportional to the inverse of
the most stringent water quality criterion for each substance (MSCI):
Or:
Then, for purposes of managerial communications, the FTOX-I could be arbitrarily defined as the
ratio of MSCREFERENCE of a reference substance to the MSCI of the concerned priority pollutant I.
This is a dimensionless number that represents the toxic potential of a pollutant I in comparison
to the toxicity of a reference contaminant. Generally it is recommended to select as reference a
well-known contaminant. It has to be assigned to a given pollutant to evaluate its relative
importance in the global discharge of a list of priority (selected) pollutants.
The reference substance could be the well-known parameter FeTOT whose most stringent criteria
is equal to 0,3 mg/L (CAOC). In this case, the FTOX-I of a substance i becomes as follows:

Environmental and Social Impact Assessment, HCMC Steering Center of the Urban
and Environmental and Social Management Plan Flood Control Program
Proposed HCMC Flood Risk Management Project Date Submitted: December 2, 2015
321
Let remind that it is necessary to select a well-known reference contaminant for environment
management and large communication purposes. Illustrate the usefulness of the tool with the
data and results gathered for the channel ThamLuong – BenCat –NuocLen in order to summarize
the state of the situation in some simple figures that should be understood for most of project
stakeholders.
9.2. Rapid Cumulative Impact Assessment
9.2.1. Determine project boundaries
It is noted that environmental impact assessment for the project is conducted based on the
guidelines of OP4.01. PMU and exp agreed on a Sampling Program. Available documents listed
in Table 9.0 were reviewed and data were collected from these documents.
Table 9.1 List of Reviewed Documents
No. Title Date of document
1 The FS and EIA for construction of Nuoc Len tidal sluice
gate and 2 ship locks.
FS approved by PC on 15/9/2012;
EIA approved on 30/12/2011.
2 The FS and EIA for construction of Vam Thuat tidal sluice
gate and 2 ship locks.
FS approved by DARD on
24/2/2012; Detailed technical
design approved on 21/12/2012;
EIA approved on 30/12/2011.
3
The FS and EIA for dredging and construction of canal
bank revetment in the main canal of THAM LUONG – BEN
CAT – NUOC LEN. (Note: This SP also includes roads and
lighting works which are not included in the present WB
funding and EIA requirements).
FS approved by PC on 23/3/2012
and EIA approved on 21/11/2011.
FS and EIA to be revised in line
with the new cost estimates and
detailed design.
4 The FS and EIA for construction of main interceptor in GO
VAP District (9km long).
FS appraised by DARD on
28/08/12; EIA approved on
07/02/2012.
5
The FS and EIA for construction and improvement of
primary and secondary combined sewer systems and the
secondary interceptor in GO VAP District.
FS approved by PPC on
01/08/2012; EIA approved on
07/02/2012; cost estimates to be
revised.
6 The FS and EIA for improvement of HY VONG secondary
canal.
FS appraised by DPI in 2012;
EIA approved on 22/6/2012; cost
estimates to be revised.
7
The FS and EIA for improvement of secondary canals
(CHIN XIENG, BA MIENG, ONG TONG, ONG BAU and CAU
CUT) connected to THAM LUONG – BEN CAT – NUOC LEN).
FS appraised by DPI; EIA
approved on 22/6/2012; cost
estimates to be revised.
Some data were collected from previous monitoring data, available from the PMU, SCFC and
DONRE (Department of Natural Resources and the Environment). However, in order to obtain
sufficient baseline data for ESIA, exp carried out the required additional sampling and testing
work for surface water, groundwater, sediment/sludge, soil, air quality, plankton &
phytoplankton. Details on the Plan for measurement, sampling, collecting information, including
information on: environmental monitoring, the number of sampling locations, monitoring

Environmental and Social Impact Assessment, HCMC Steering Center of the Urban
and Environmental and Social Management Plan Flood Control Program
Proposed HCMC Flood Risk Management Project Date Submitted: December 2, 2015
322
parameters, sampling frequency and quality standards applied for result analysis are summarized
in Annex 10.
Meanwhile, existing data were analysed and compilation was done and calculation were done
with Chemiotox index analysis. The sampling point will be completed at the stations identified
with PMU. The next map show these sample point stations. Existing data referring to these
sampling points were extracted to calculate the existing Chemiotox Index and to evaluate a
cumulative impact of contamination before 2012 and in 2015.

Environmental and Social Impact Assessment, HCMC Steering Center of the Urban
and Environmental and Social Management Plan Flood Control Program
Proposed HCMC Flood Risk Management Project Date Submitted: December 2, 2015
323

Environmental and Social Impact Assessment, HCMC Steering Center of the Urban
and Environmental and Social Management Plan Flood Control Program
Proposed HCMC Flood Risk Management Project Date Submitted: December 2, 2015
324
9.2.2. Identify Valued Environmental Components (VEC)
The environmental components that will be considered and assessed are: air, climate and noise; soil
and groundwater; water and aquatic resources (fauna and flora), sediment and settled sludge. For
modeling and impact evaluation, impact on five VEC‘s will be measured. Information is
collected to ensure a prediction of environmental quality of the following:
• Surface Water Quality – in the main TL-BC-NL canal and the secondary canals; Plankton &
Phytoplankton in surface water
• Sediment and Sludge characterization including waste classification for hazardous waste;
• Groundwater Quality;
• Soil quality;
• Ambient air quality
9.2.3. Summarizing the past conditions of the VEC (before 2012)
In the preliminary step, it is necessary to produce the synthesis of previous results and data
gathered during the feasibility studies (Components 1, 2, 4A, 4B, 6A and 6B) and from various
environment monitoring reports in order to avoid the replication of future project monitoring
activities.
9.2.3.1. Summary of results (before 2012) on surface water
For defining the quality of surface water the MoNRE has established the QCVN
08:2008/BTNMT. While it is not a complete and sufficient tool for managing and controlling the
quality of rivers and other water bodies that must deserve simultaneous multiple purposes
(supply water, supply water in case of available treatment plant, irrigation and fluvial
navigation), one should rely at least on its quality criteria and add adequate other ones depending
on each situation (spatial and temporal).
At this step of project let propose the following lists of FTOX-I based on the maximum allowable
concentrations (MAC) of QCVN 08:2008/BTNMT:
Table 9.2 The FTOX for surface water quality
QCVN 08:2008/BTNMT Toxicity Factors
A B
Ftox
(A1)
Ftox
(A2) Ftox (B1)
Ftox
(B2) No. Parameter Unit A1 A2 B1 B2
COD
mg/L
(O2) 10 15 30 50 0,05 0,07 0,05 0,04
NH4-N
mg/L
(N) 0,1 0,2 0,5 1,0 5 5 3 2
NO2-N
mg/L
(N) 0,01 0,02 0,04 0,05 50 50 37,5 40
Cl- mg/L 250 400 600 10 000 0,0020 0,0025 0,0025 0,0002

Environmental and Social Impact Assessment, HCMC Steering Center of the Urban
and Environmental and Social Management Plan Flood Control Program
Proposed HCMC Flood Risk Management Project Date Submitted: December 2, 2015
325
QCVN 08:2008/BTNMT Toxicity Factors
A B
Ftox
(A1)
Ftox
(A2) Ftox (B1)
Ftox
(B2)
CN- mg/L 0,005 0,010 0,020 0,020 100 100 75 100
F- mg/L 1 1,5 1,5 2 0,5 0,67 1 1
PO43-
mg/L
(P) 0,1 0,2 0,3 0,5 5 5,00 5 4
AS mg/L 0,01 0,02 0,05 0,10 50 50 30 20
Cd mg/L 0,005 0,005 0,010 0,010 100 200 150 200
Pb mg/L 0,02 0,02 0,05 0,05 25 50 30 40
Cr (III) mg/L 0,05 0,10 0,5 1,0 10 10 3 2
Cr (VI) mg/L 0,01 0,02 0,04 0,05 50 50 37,5 40
Cu mg/L 0,1 0,2 0,5 1,0 5 5 3 2
Zn mg/L 0,5 1,0 1,5 2,0 1 1 1 1
Ni mg/L 0,1 0,1 0,1 0,1 5 10 15 20
Fe mg/L 0,5 1,0 1,5 2,0 1 1 1 1
Hg mg/L 0,001 0,001 0,001 0,002 500 1 000 1 500 1 000
Surfactant mg/L 0,1 0,2 0,4 0,5 5 5 3,75 4
Total Oil &
Grease mg/L 0,01 0,02 0,1 0,3 50 50 15 6,7
Aldrin +
Dieldrin μg/L 0,002 0,004 0,008 0,010 250 000 250 000 187 500 200 000
Endrin μg/L 0,010 0,012 0,014 0,020 50 000 83 333 107 143 100 000
BHC μg/L 0,050 0,100 0,130 0,015 10 000 10 000 11 538 133 333
DDT μg/L 0,001 0,002 0,004 0,005 500 000 500 000 375 000 400 000
Endosunfan μg/L 0,005 0,010 0,010 0,020 100 000 100 000 150 000 100 000
Lindan μg/L 0,30 0,35 0,38 0,40 1 667 2 857 3 947 5 000
Chlordane μg/L 0,01 0,02 0,02 0,03 50 000 50 000 75 000 66 667
Heptachlor μg/L 0,01 0,02 0,02 0,05 50 000 50 000 75 000 40 000

Environmental and Social Impact Assessment, HCMC Steering Center of the Urban
and Environmental and Social Management Plan Flood Control Program
Proposed HCMC Flood Risk Management Project Date Submitted: December 2, 2015
326
QCVN 08:2008/BTNMT Toxicity Factors
A B
Ftox
(A1)
Ftox
(A2) Ftox (B1)
Ftox
(B2)
Parathion μg/L 0,10 0,20 0,40 0,50 5000 5 000 3 750 4 000
Malathion μg/L 0,10 0,32 0,32 0,40 5000 3 125 4 688 5 000
2,4-D μg/L 100 200 450 500 5,0 5,0 3,3 4,0
2,4,5-T μg/L 80 100 160 200 6,3 10,0 9,4 10,0
Paraquat μg/L 900 1 200 1 800 2 000 0,6 0,8 0,8 1,0
Several notices are necessary:
The reference contaminant has been the parameter FeTOT. For illustration purpose, the
various values of FTOX related to the mercury (Hg) will be assessed as follow:
Supply water :
o FTOX-Hg (A1) = [Fe]MAC (A1) / [Hg]MAC (A1) = 0,5 / 0,001 = 500
Supply water with available treatment plant:
o FTOX-Hg (A2) = [Fe]MAC (A2) / [Hg]MAC (A2) = 1,0 / 0,001 = 1 000
Irrigation use:
o FTOX-Hg (A3) = [Fe]MAC (A3) / [Hg]MAC (A3) = 1,5 / 0,001 = 1 500
Fluvial navigation use:
o FTOX-Hg (A4) = [Fe]MAC (A4) / [Hg]MAC (A4) = 2,0 / 0,002 = 1 000
Some parameters would be discarded in the assessment of FTOX for several reasons:
The pH values are based on logarithm.
Values of D.O. are random and depend on weather conditions. Of course when D.O. is low,
it should reveal permanent high anaerobic biodegradation rate but also high warm
temperature combined with no-winding conditions.
TSS often depends on natural turbidity in VietNam that is often high (Mekong, Red River,
etc.)
BOD5 (20oC) values depends only on easy-biodegradable organics and are not representative
in the case of cumulative environment impacts. COD is more representative of BOD21 or
BODULT.

Environmental and Social Impact Assessment, HCMC Steering Center of the Urban
and Environmental and Social Management Plan Flood Control Program
Proposed HCMC Flood Risk Management Project Date Submitted: December 2, 2015
327
Nutrients NO3- is not really toxic for human and aquatic organisms, and would be discarded
from the list of ―hard‖ pollution parameters to be taken in consideration in the case of
strongly-polluted urban channels.
E. coli, Fecal & Total coliforms are certainly present in all the surface water in VietNam due
to the general lack of wastewater treatment plants. Their cumulative effects in contaminated
surface water are difficult for interpretation. We can just mention that presence is whether
greater than the MACs in each case.
The details of calculations will be presented in Appendices for interested lectors. The following
Figure 9.1 illustrates the calculation results for the various monitoring locations identified by
monitoring activities organized within previous projects (before 2012). With the available
results, one can preliminary estimate that the Environment Monitoring report (July 2011) reveals
a greater level of cumulative environ impact (due to various discharge) within the central area,
approximately close to CauBung area. The situation should be worse approximately at the
junction of the sewer CauBung and the main channel. At this location the daily hydraulic tidal
effects would be low and could not contribute to the purge-mix of surface water toward directly
the Saigon River (at VamThuat) and indirectly the ChoDem channel.
An important lack of results for the official toxic parameters (heavy metals, pesticides and other
toxic organics) exists within the various results gathered before 2012. The pollutants related to
these parameters are generally non-biodegradable. They are qualified as persistent, bio-
accumulative and part of the chain food (bio-amplification) and they should contribute to the
cumulative environmental effects over several years.
9.2.3.2. Summary of results (before 2012) on sediment/sludge
The QCVN 43:2012/BTNMT has been published in 2012. It can be serves as a technical
explanation why monitoring campaigns aiming sediments & settled sludge had not focused
enough on complete lists of heavy metals and other such organic toxic pollutants as pesticides.
Hover on the basis of incomplete useful results the Chemiotox Index methodology has produced
a meaningful overview of the state on contamination and buildup of pollutants in the bottom
volume on sediments along the main channel TL-BC-NL (See Figure 9.2).
The Chemiotox calculations have been based on a mix of data from QCVN 43:2012/BTNMT
and QCVN 03:2008/BTNMT, its equivalent for soils. Most of the monitoring activities before
2012 have been based on contaminants listed in the latter that includes the heavy metals Cu and
Zn. The more recent QCVN 43:2012/BTNMT does not include these metals and Fe.
9.2.3.3 . Summary of results (before 2012) on groundwater
Previous results (before 2012) are the less significant because water samples were not taken for
piezometers (observation wells) implemented accordingly to a scientific method based at least on
the knowledge of underground soil and aquifer layers. The water samples seem be randomly
taken at available inhabitant wells. The inhabitants would find themselves the best locations for

Environmental and Social Impact Assessment, HCMC Steering Center of the Urban
and Environmental and Social Management Plan Flood Control Program
Proposed HCMC Flood Risk Management Project Date Submitted: December 2, 2015
328
implementing useful wells offering suitable service water (domestic purposes) and avoid the
contaminated locations. So we should give less attention to the previous results (See Figure 9.3).
9.2.3.4. Summary of results (before 2012) on ambient air quality
The QCVN 05:2013/BTNMT and QCVN 06:2009/BTNMT together deserve the assessment of
ambient air quality according the Chemiotox Index methodology. The reference contaminant
will be the well-known CO whose MAC is 30 000 μg/m3 or 30 mg/m3. Most of parameters
listed in the QCVN 05:2013/BTNMT should be related to air contaminants due to local traffic or
industrial combustion while the gaseous contaminants NH3 and H2S should be due to
emanations from anaerobic biodegradation within the liquid body of the main channel or due to
savage solid waste dumping along the banks of the main channel. An overall portrait is
illustrated into Figure 9.4.
Table 9.2 The FTOX for ambient air quality
The measured fluctuations along the main channel depend strongly of the contributor sources but
also meteorological conditions (wind, rains, etc.). While the QCVN 05:2009/BTNMT establish a
maximum allowable concentration (MAC) of 30 000 μg/m3 for the well-known contaminant CO
(carbon monoxide), the ―bad‖ quality of ambient air can be assessed by a general approximate
level of 80 – 130 000 μg/m3 of Chemiotox Units (or μg/m3 CO-equivalent toxicity).
No. Parameter Unit Avg-1h Avg-8h Avg-24h Avg-year
SO2 μg/m3 350 125 50 85,7
CO μg/m3 30 000 10 000 5 000 1,0
NOx μg/m3 200 100 40 150,0
O3 μg/m3 180 120 80 166,7
TSP μg/m3 300 200 140 100,0
PM10 μg/m3 150 50
Pb μg/m3 1,5 0,5
NH3 μg/m3 200 150,0
H2S μg/m3 42 714,3
QCVN 06:2009/BTNMT
Ftox (year)
QCVN 05:2013/BTNMT Toxicity Factors
Ftox (1h) Ftox (8h) Ftox (24h)

Environmental and Social Impact Assessment, HCMC Steering Center of the Urban
and Environmental and Social Management Plan Flood Control Program
Proposed HCMC Flood Risk Management Project Date Submitted: December 2, 2015
329
Figure 9.1 Overall portrait of surface water characteristics along the main channel TL-BC-NL.
Figure 9.2 Overall portrait of the contamination of sediment and settled sludge.
10 9 8 7 6 5 4 3 2 1
10 9 9 8 12 7 11 6 5 8 7 4 3 6 2 5 1 4 3 2 1
Chemiotox Index 3,2 2,9 4,7 8,9 8,9 30,5 69,6 162 15,4 25,6 5,9 5,8 4,6 6,5 74,4 5,4 5,4 5,4 7,6 3,5
Monitoring locations
Fluctuations of SURFACE WATER characteristics along the main channel
0
20
40
60
80
100
120
140
160
180
10 9 9 8 12 7 11 6 5 8 7 4 3 6 2 5 1 4 3 2 1
Fluctuations of surface water characteristics (mg/L Fe-based chemiotox units)Surface water
10 9 8 7 6 5 4 3 2 1
10 9 9 8 12 7 11 6 5 8 7 4 3 6 2 5 1 4 3 2 113
9,9
98,3
119,
2
Fluctuations of SEDIMENT characteristics along the main channel
Monitoring locations
Chemiotox Index
136,
2
128,
1
124,
6
98,2
147,
8
153,
6
202,
6
186,
6
183,
1
241,
8
0,0
50,0
100,0
150,0
200,0
250,0
300,0
10 9 9 8 12 7 11 6 5 8 7 4 3 6 2 5 1 4 3 2 1
Sediment/Sludge characteristics (mg/kg Pb-based chemiotox index)
Sediment/Sludge
CAUBUNG area
VAMTHUAN & SAIGON River area
NUOCLEN &
CHODEM Canal area
MAC of QCVN 43:2012/BTNMT: < 91,3 mg/kg
DW Pb
MAC of QCVN 08:2008/BTNMT: < 2 mg/L Fe

Environmental and Social Impact Assessment, HCMC Steering Center of the Urban
and Environmental and Social Management Plan Flood Control Program
Proposed HCMC Flood Risk Management Project Date Submitted: December 2, 2015
330
Figure 9.3 Overall portrait of the groundwater characteristics at private domestic wells.
Figure 9.4 Overall portrait of the groundwater characteristics at domestic wells.
10 9 8 7 6 5 4 3 2 1
10 9 9 8 12 7 11 6 5 8 7 4 3 6 2 5 1 4 3 2 1
0,40
0
0,35
7
0,45
6
Fluctuations of GROUNDWATER characteristics along the main channel
Monitoring locations
Chemiotox Index
1,39
2
1,21
9
1,41
9
0,96
0
0,50
4
0,89
6
0,51
7
0,38
9
1,50
0
1,64
5
0,000
0,500
1,000
1,500
2,000
2,500
3,000
3,500
4,000
4,500
5,000
9 9 8 12 7 11 6 5 8 7 4 3 6 2 5 1 4 3 2 1
Groundwater characteristics (mg/L Fe-based chemiotox index)
Groundwater
10 9 8 7 6 5 4 3 2 1
10 9 9 8 12 7 11 6 5 8 7 4 3 6 2 5 1 4 3 2 1
92 7
25
96 2
49
90 4
17
Fluctuations of AMBIENT AIR characteristics along the main channel
Monitoring locations
Chemiotox Index
83 1
83
130
063
104
086
110
356
113
393
136
183
88 1
07
83 1
83
101
857
136
154
119
497
112
046
97 6
27
101
673
75 6
05
0
20 000
40 000
60 000
80 000
100 000
120 000
140 000
160 000
10 9 9 8 12 7 11 6 5 8 7 4 3 6 2 5 1 4 3 2 1
Ambient Air characteristics (μg/m3 CO-based chemiotox units)Ambient Air
MAC of QCVN 05:2013/BTNM
T: < 30 000
μg/m3 CO
MAC of QCVN 09:2008/BTNM
T: < 5 mg/L Fe

Environmental and Social Impact Assessment, HCMC Steering Center of the Urban
and Environmental and Social Management Plan Flood Control Program
Proposed HCMC Flood Risk Management Project Date Submitted: December 2, 2015
331
9.2.3.5. What is missing in the results (before 2012)
The implementation of a cumulative impact assessment approach requires data related to the
contributor sources (the existing wastewater treatment plant, industrial park discharges, city
sewers un-connected to the interceptors and various canals) to the global contamination of the
main water receiving body. If each contributor can be monitored including the eco-toxic
pollutants (heavy metals and other organics: BTEX, VOCs, PAHs, etc.) we could applied the
factors FTOX-I to the discharge loads (kg/d) and deduce the specific loads in Chemiotox Index
(C.I./d) for each of them. The above schematic (Figure 9.5) illustrates this situation.
Then the cumulative impact per day can be assessed as follows:
∑
The contributor sources would be the following:
o Final effluent of the wastewater treatment plant discharged in the NuocDen canal;
o Effluents of the canals of HyVong, CauCut, BaMien, OngTong, Dua (CauMat); Ong Bau
and ChinXieng;
o BenCat River;
o Effluents of the canals of OngBut, LuongBeo, BaNeng and PhuDinh; and
o Various discharge points that are not indicated on the city maps.
Figure 9.5 Schematic of load discharges in a water receiving body.
It should be emphasized: in order to implement the cumulative impact assessment approach for
the future, one must only consider amongst a multitude of potential pollutants the persistent and
whole part of food chains (bio-accumulation and bio-amplification). They are generally
represented by the eco-toxics (heavy metals and other priority toxic organics).
The construction project will eliminate some percentages or the whole part of certain contributor
sources. Other contributor sources can remain at the same levels or less while new ones can add
their discharge loads in the future. The Environment Management Plan (EMP) should adopt the
same list of parameters for further monitoring activities. With the Chemiotox Index it should be

Environmental and Social Impact Assessment, HCMC Steering Center of the Urban
and Environmental and Social Management Plan Flood Control Program
Proposed HCMC Flood Risk Management Project Date Submitted: December 2, 2015
332
simple to retrieve the cumulative impact assessment with consolidated data (spatial and
temporal) in order to establish the environment-sustainability of the whole construction project.
9.2.3.6. Cumulative Impact before 2012
The Figure 9.6 presented below summarize the results gathered from existing studies before
2012 for the sampling points agreed for the PPTA for HCMC Flood Control Program in channel
Tham Luong – Ben Cat – Nuoc Len. Available data are compiled in the following model.
The graphic of the Figure 9.7 (Profile and plan views of the main channel) illustrates that
contamination is at highest point at the Tham Luong Bridge and at junction of Hy Vong Canal
and Tham Luong – Ben Cat – Nuoc Len channel. A build-up of pollutant contents should occur
at the locations where the hydraulic tidal effects are the less important: at the central areas of the
main channel. The total length of the main channel is 32 950 m. Depth varies from – 7.0 m (ref.
sea level 0-m) at the junction of Saigon River to – 4.0 m at the junction with ChoDem Channel.
Between BinhThuan Bridge and ThamLuong Bridge we face a very low depth varying from 0 to
- 0,4 m.
At low tide, the central areas should act as a long settling canal favourizing the settlement of
suspended solids and consequently the increase of bottom layers of sediments. Build-ups of
persistent pollutants (heavy metals and other non biodegradable organis) should contibute to a
cumulative environmental impact.
-3 -7
-2 -3
-1,7 -2
-1 -1,7
-0,4 -1
0 -0,3
0 -0,5
0 -0,5
0 -1,8
-2 -1,8
-3 -4
10 BaHom Bridge to AnLac Bridge 4 500 BATIEN Rach 30 to 50
11 AnLac Bridge to ChoDem Channel 2 524 NUOCLEN Rach 50
Chua Rach to BinhThuan Bridge 1 410 NUOCDEN 10 to 15
9 BinhTHuan Bridge to BaHom Bridge 5 296 TL10 Road & LuongBeo 20 to 30
ThamLuong Bridge to CauBung Drain 700 CAUSA 8 to 10
7 CauBung Drain to Chua Rach 4 200 Canal 19/5 10
4 TruongDai Bridge to ChoCau Bridge 2 510 THAMLUONG - BENCAT 30 to 60
5 ChoCau Bridge to ThamLuong Bridge 2 990 THAMLUONG - BENCAT 10 to 30
No. CHANNEL PART'S NAME L (m) LOCATION'S NAME W (m) D (m)
1 SaiGon River to AnLoc Bridge 5 220 VAMTHUAT 80
2 AnLoc Bridge to BenPham Bridge 1 588 VAMTHUAT 70 to 80
3 BenPhan Bridge to TruongDai Bridge 2 012 THAMLUONG - BENCAT 60 to 70
6
8

Environmental and Social Impact Assessment, HCMC Steering Center of the Urban
and Environmental and Social Management Plan Flood Control Program
Proposed HCMC Flood Risk Management Project Date Submitted: December 2, 2015
333
Figure 9.6 Overall portrait of the state of environment before 2012.
Environmental and Social Impact Assessment
Ho Chi Minh City Flood Risk Management Project 1
Summary of the state of the environment 2 1
Methodology : Chemiotox Index by EXP 3 2
4 3
Monitoring locations 4 1
2
3
4 1
2
3
4
Data Legal reference Reference of Maximum Allowable Concentration (MAC) 1
1 Surface water QCVN 08:2008/BTNMT MAC of Fe (Column B2: navigation use) : 2 mg/L 2 1
2 Ambient air QCVN 05:2009/BTNMT MAC of CO (Average-1h) : 30 000 μg/m3 3 2
3 Ground water QCVN 09:2008/BTNMT MAC of Fe : 5 mg/L 4 3
4 Sediment sludge QCVN 43:2012/BTNMT MAC of Pb : 91,3 mg/kg dry basis 4
1
2
3 1
4 1 2
2 3
1 3 4
2 4
3
4 1
2
3
4
1
2
3
4
1
2 -3 -7
3 -2 -3
4 -1,7 -2
-1 -1,7
-0,4 -1
0 -0,3
1 0 -0,5
2 0 -0,5
3 0 -1,8
4 -2 -1,8
-3 -4
1 10 9 8 7 6 5 4 3 2 1
2 10 9 9 8 12 7 11 6 5 8 7 4 3 6 2 5 1 4 3 2 1
3 Chemiotox Index 3,2 2,9 4,7 8,9 8,9 30,5 69,6 162 15,4 25,6 5,9 5,8 4,6 6,5 74,4 5,4 5,4 5,4 7,6 3,5
4
1
2
3
4
1
2
3
4
1
2
3 10 9 8 7 6 5 4 3 2 1
4 10 9 9 8 12 7 11 6 5 8 7 4 3 6 2 5 1 4 3 2 1
1
2
3
4
1
2
3
4
1
2
3
4
Fluctuations of SEDIMENT characteristics along the main channel
Monitoring locations
Chemiotox Index
13
6,2
Monitoring locations
12
8,1
12
4,6
98
,2
14
7,8
15
3,6
20
2,6
18
6,6
18
3,1
24
1,8
13
9,9
98
,3
11
9,2
Fluctuations of SURFACE WATER characteristics along the main channel
10 BaHom Bridge to AnLac Bridge 4 500 BATIEN Rach 30 to 50
11 AnLac Bridge to ChoDem Channel 2 524 NUOCLEN Rach 50
Chua Rach to BinhThuan Bridge 1 410 NUOCDEN 10 to 15
9 BinhTHuan Bridge to BaHom Bridge 5 296 TL10 Road & LuongBeo 20 to 30
ThamLuong Bridge to CauBung Drain 700 CAUSA 8 to 10
7 CauBung Drain to Chua Rach 4 200 Canal 19/5 10
4 TruongDai Bridge to ChoCau Bridge 2 510 THAMLUONG - BENCAT 30 to 60
5 ChoCau Bridge to ThamLuong Bridge 2 990 THAMLUONG - BENCAT 10 to 30
No. CHANNEL PART'S NAME L (m) LOCATION'S NAME W (m) D (m)
1 SaiGon River to AnLoc Bridge 5 220 VAMTHUAT 80
2 AnLoc Bridge to BenPham Bridge 1 588 VAMTHUAT 70 to 80
3 BenPhan Bridge to TruongDai Bridge 2 012 THAMLUONG - BENCAT 60 to 70
ThamLuong bridge to
ChoCau bridge
15,4> 2
136 154 > 30 000
147,8 > 91,3
BinhThuan bridge to
BaHom bridge
30,5 > 2
113 393
136,2 > 91,3
NuocLen Cong2,9 < 2
130 063 > 30 000
1,392 < 5
AnLac bridge4,7 > 2
104 086 > 30 000
128,1 > 91,3
8,9 > 2
93 300 > 30 000
0,960 < 5
ThamLuong bridge
Junction HyVong canal &
main channel
25,6 > 2
119 497 > 30 000
0,896 < 5
153,6 > 91,3
ThamLuong bridge to
CauBung bridge
161,9 > 2
101 857 > 30 000
0,504 < 5
0,389 < 5
186,6 > 91,3
5,9 > 2
0, 517 < 5
201,6 > 91,3
CauBung bridge to
BinhThuan bridge 88 107
6
8
ChoDem River (200-m)3,15 > 2
83 183 > 30 000
BinhThuan bridge -
Package 4A
69,6 > 2
136 183
98,2 > 91,3
1,419 < 5
1,219 < 5
BaHom bridge - AnLac
bridge
BaHom bridge - Package
6A
8,9 > 2
110 356
124,6 > 91,3
183,1 > 91,3 AnLoc to TruongDai
bridges (BenPhan)
Junction CauCut canal &
main channel
7 > 2
112 046 > 30 000
ChoCau bridge to
TruongDai bridge
5,8 > 2
98,3 > 91,3
Junction OngBau canal
& main channel
Junction OngTong canal
& main channel
Between AnLoc bridge
& Saigon River
Junction BaMien canal
and main channel
6,5 > 2
97 627 > 30 000
1,500 < 5
241,8 > 91,3 98,6 > 2
92 725 > 30 000
0,402 < 5
139,9 > 91,3 5,4 > 2
Surface water & Ambient air
Ground water
Sediment Sludge only
CHO DEM Canal
SAIG
ON
Riv
er
90 417 > 30 000
0,456 < 5
96 249 > 30 000
0,357 < 5
Main channel (200-m
from Saigon River)
4,3 > 2
75 605 > 30 000
1,645 < 5
119,2 > 91,3
Junction ChinXieng
canal & main channel
7,6 > 2
101 673 > 30 000
10
9
8
12
7
11
6
5
8
7
4
3
6
2
5
1
4
3
2
1
9
10
9
8
7
6
5
4
3
2
1
1
2
0
20
40
60
80
100
120
140
160
180
10 9 9 8 12 7 11 6 5 8 7 4 3 6 2 5 1 4 3 2 1
Fluctuations of surface water characteristics (mg/L Fe-based chemiotox units)Surface water
0,0
50,0
100,0
150,0
200,0
250,0
300,0
10 9 9 8 12 7 11 6 5 8 7 4 3 6 2 5 1 4 3 2 1
Sediment/Sludge characteristics (mg/kg Pb-based chemiotox index)
Sediment/Sludge
3
4
5
6
7
8
9
10
11

Environmental and Social Impact Assessment, HCMC Steering Center of the Urban
and Environmental and Social Management Plan Flood Control Program
Proposed HCMC Flood Risk Management Project Date Submitted: December 2, 2015
334
Figure 9.7 Illustration of build-up of pollutant contents in the center areas of the main channel.
10 9 8 7 6 5 4 3 2 1
10 9 9 8 12 7 11 6 5 8 7 4 3 6 2 5 1 4 3 2 1
Chemiotox Index 3,2 2,9 4,7 8,9 8,9 30,5 69,6 162 15,4 25,6 5,9 5,8 4,6 6,5 74,4 5,4 5,4 5,4 7,6 3,5
Monitoring locations
Fluctuations of SURFACE WATER characteristics along the main channel
0
20
40
60
80
100
120
140
160
180
10 9 9 8 12 7 11 6 5 8 7 4 3 6 2 5 1 4 3 2 1
Fluctuations of surface water characteristics (mg/L Fe-based chemiotox units)Surface water
10 9 8 7 6 5 4 3 2 1
10 9 9 8 12 7 11 6 5 8 7 4 3 6 2 5 1 4 3 2 1
139,
9
98,3
119,
2
Fluctuations of SEDIMENT characteristics along the main channel
Monitoring locations
Chemiotox Index
136,
2
128,
1
124,
6
98,2
147,
8
153,
6
202,
6
186,
6
183,
1
241,
8
0,0
50,0
100,0
150,0
200,0
250,0
300,0
10 9 9 8 12 7 11 6 5 8 7 4 3 6 2 5 1 4 3 2 1
Sediment/Sludge characteristics (mg/kg Pb-based chemiotox index)
Sediment/Sludge

Environmental and Social Impact Assessment, HCMC Steering Center of the Urban
and Environmental and Social Management Plan Flood Control Program
Proposed HCMC Flood Risk Management Project Date Submitted: December 2, 2015
335
9.3. Monitoring of present environmental conditions of VEC (in 2015)
The present environmental conditions of VEC (the state of the existing environment) have been
consolidated by field monitoring campaigns completed in September 2015. This section present
results screening of that campaign. Raw results will be gathered in the Appendices.
9.3.1. The surface water along the TL-BC-NL canal
Related to present surface water characteristics, data have been gathered from previous studies
and reports (cf Figure 9.1) and analytical results from recent monitoring campaigns organized
within the present mandate have been in-depth studied. The maximum allowable concentrations
listed on the QCVN 08:2008/BTNMT (surface water) under the column B2 (fluvial navigation
purposes) have been considered for the calculations of the toxicity factors FTOX related to each
contaminant. The surface water has been characterized during the both conditions of low and
high tide in order to understand the potential influence of hydraulic tidal effects. Traces of heavy
metals have been largely analyzed (As, Cd, Pb, Cr, Cu, Zn, Fe and Hg). As usual, the MAC for
the main contaminant Fe (2 mg/L) has been considered as reference for the calculation of FTOX.
For instance, in the case of the contaminant Hg, the calculation is as follows:
FTOX-Hg = MAC of Fe / MAC of Hg = 2 mg/L / 0,002 mg/L = 1 000
Several parameters have been discarded in the calculations of CHEMIOTOX UNITS. It can be
explained as follow:
The pH values are based on logarithm.
Values of D.O. are random and depend on weather.
TSS often depends on natural turbidity in VietNam.
BOD5 (20oC) values depends only on biodegradable organics and are not representative in
the case of cumulative environment impacts.
Nutrients NO3- and SO4
2- are not really toxics and would be discarded from the list of ―hard‖
pollution parameters to be taken in consideration in the case of strongly-polluted urban
channels.
Cl- is not so much present in polluted surface water in VietNam. It would be discarded to the
profit of F-.
E. coli, Fecal & Total coliforms are certainly present in all the surface water in VietNam due
to the general lack of wastewater treatment plants. Their cumulative effects in contaminated
surface water are difficult for interpretation. We can just mention that presence is greater or
not than the MACs in each case.
The Tables 9.3 to 9.9 summarize the results and conclusions found for the state of environment
for surface water.
9.3.2. The sediment/sludge along the TL-BC-NL canal

Environmental and Social Impact Assessment, HCMC Steering Center of the Urban
and Environmental and Social Management Plan Flood Control Program
Proposed HCMC Flood Risk Management Project Date Submitted: December 2, 2015
336
Sediments have been largely monitored along the main channel. During the present mandate,
EXP has focused on the potential effects of high and low tide, at some monitoring locations near
the junction with Saigon River. The reference for Chemiotox calculations has been the QCVN
43:2012/BTNMT and the pollutant of reference is Pb. Its MAC is 91,3 mg/kg DW. A summary
of results has been gathered on the Table 9.4. We can notice a build-up of concentrations at the
locations where hydraulic tidal effects are the less important: central areas and in the deep layer
of sediment.
9.3.3. The groundwater along the TL-BC-NL canal
The analytical results are compared to the MAC of QCVN 09:2008/BTNMT and the MAC of the
parameter FeTOTAL: 5 mg/L has been taken in consideration for applying the Chemiotox Index
methodology. The results are summarized on the Table 9.5. While most of the groundwaters are
moderately contaminated, the first monitoring location (near the Saigon River, at Chin Xieng
canal junction area) indicates a case of strong contamination by NH4-N and Fe. (See Table 9.5)
9.3.4. The soil along the TL-BC-NL canal
The soil along the main channel area is moderately contaminated by heavy metals. The reference
is the QCVN: 03:2008/BTNMT and the MAC of Pb contaminant has been taken in
consideration: 200 mg/kg DW. At several locations, the cumulative impact due the aimed heavy
metals has demonstrated a value of Chemiotox Units greater than the MAC. Results are
summarized in the Table 9.6.
9.3.5. The characteristics of ambient air along the TL-BC-NL canal
Characteristics of ambient air can be altered by both local traffic (TSP, CO & CO2, SO2, NO2,
etc.) and emission for aquatic environment (mainly NH3, H2S and VOCs). Both QCVN related
to the two series of contaminants are considered: QCVN 05:2013/BTNMT (average 1 hour) and
QCVN 06:2009/BTNMT (average 1 hour). The well-known CO contaminant (MAC = 30
mg/m3) is taken in consideration for the calculations of Chemiotox Units. Results are
summarized in the Table 9.7.
9.3.6. Plankton and Phytoplankton
Biological inventories of plankton and phytoplankton have been organized in order to support
the state of aquatic environment along the main channel. (See Table 9.8 and Table 9.9).
Preliminary conclusions would be: in way of eutrophication.
Table 9.3 Summary of results for surface water
Summary of results for Surface Water monitoring along the ThamLuong–BenCat–NuocLen
channel
The analytical results are compared to the maximum allowable concentrations (MAC) of QCVN
08:2008/BTNMT. For the assessment of the cumulative impact of most of all the considered
contaminants, the CHEMIOTOX model uses the MAC for the parameter FeTOTAL: 2 mg/L (column B2: case
of fluvial transportation). According to the calculations:
At low tide, there is a build-up of the presence of contaminants if during this period, discharges of the

Environmental and Social Impact Assessment, HCMC Steering Center of the Urban
and Environmental and Social Management Plan Flood Control Program
Proposed HCMC Flood Risk Management Project Date Submitted: December 2, 2015
337
latter continue on a regular or permanent basis (e.g. continuous discharge (24/7) of the final effluent
of the wastewater treatment plant of BinhHungHoa, 150 000 m3/d, continuous free discharge of raw
wastewater through combined domestic sewers, etc.)
Build-up of contaminants seems more higher at monitoring locations where hydraulic tidal effects
would be less important (from OngBau Canal/SW3 to ThamLuong Bridge/SW8)
From a managerial point of view, the cumulative effects on aquatic fauna (plankton) and flora
(phytoplankton) would be far greater than the ones due to the sole MAC of 2 mg/L of Fe toxicity
equivalent.
00
10
20
30
40
50
60
70
SW1-HT SW2-HT SW3-HT SW4-HT SW5-HT SW6-HT SW7-HT SW8-HT SW9-HT SW10-HT
Characterisitics of surface water at low tide & at high tide, Chemiotox units (mg/L Fe toxicity equivalent) At low tide
At high tideIncrease of concentrations
at low tide
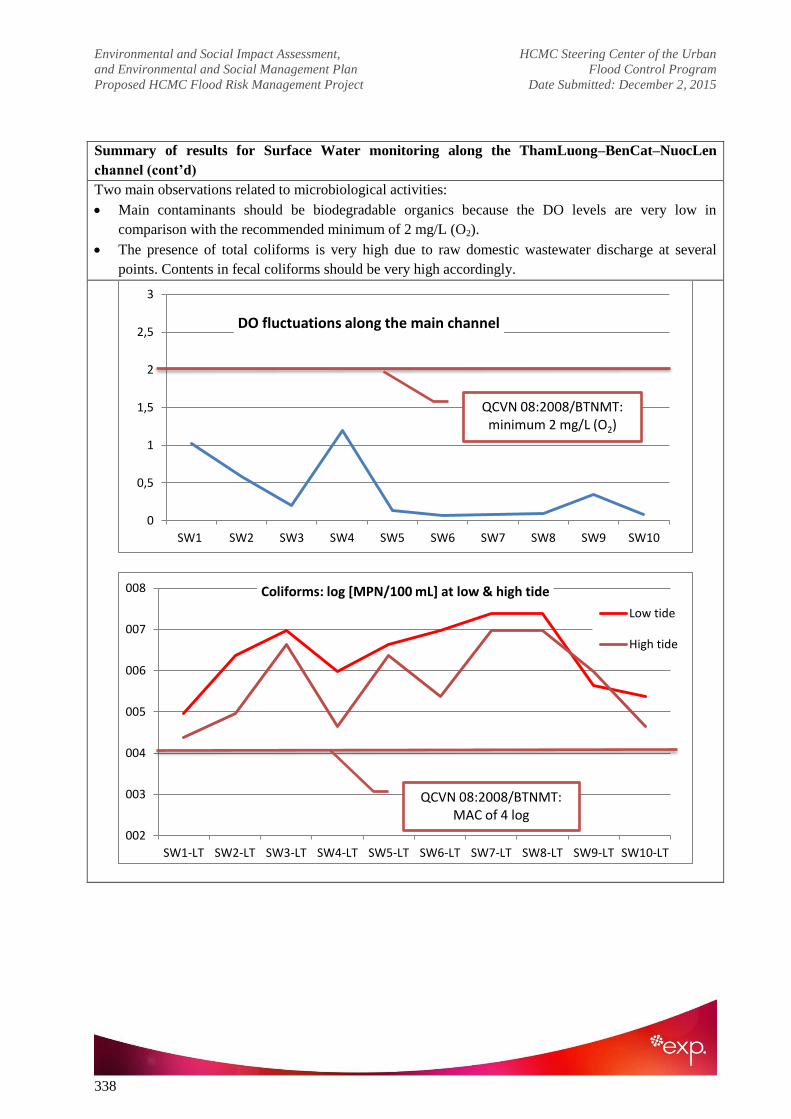
Environmental and Social Impact Assessment, HCMC Steering Center of the Urban
and Environmental and Social Management Plan Flood Control Program
Proposed HCMC Flood Risk Management Project Date Submitted: December 2, 2015
338
Summary of results for Surface Water monitoring along the ThamLuong–BenCat–NuocLen
channel (cont‟d)
Two main observations related to microbiological activities:
Main contaminants should be biodegradable organics because the DO levels are very low in
comparison with the recommended minimum of 2 mg/L (O2).
The presence of total coliforms is very high due to raw domestic wastewater discharge at several
points. Contents in fecal coliforms should be very high accordingly.
0
0,5
1
1,5
2
2,5
3
SW1 SW2 SW3 SW4 SW5 SW6 SW7 SW8 SW9 SW10
DO fluctuations along the main channel
QCVN 08:2008/BTNMT: minimum 2 mg/L (O2)
002
003
004
005
006
007
008
SW1-LT SW2-LT SW3-LT SW4-LT SW5-LT SW6-LT SW7-LT SW8-LT SW9-LT SW10-LT
Coliforms: log [MPN/100 mL] at low & high tide
Low tide
High tide
QCVN 08:2008/BTNMT: MAC of 4 log

Environmental and Social Impact Assessment, HCMC Steering Center of the Urban
and Environmental and Social Management Plan Flood Control Program
Proposed HCMC Flood Risk Management Project Date Submitted: December 2, 2015
339
Table 9.4 Summary of results for sediment/sludge
Summary of results for Sediment/Sludge monitoring along the ThamLuong–BenCat–NuocLen
channel
The analytical results are compared to the maximum allowable concentrations (MAC) of QCVN
43:2012/BTNMT. For the assessment of the cumulative impact of most of all the considered
contaminants, the CHEMIOTOX model uses the MAC for the parameter PbTOTAL: 91,3 mg/kg DW.
According to the calculations:
Along the main channel ThamLuong-BenCat-NuocLen, the results gathered during the previous
project steps demonstrate a cumulative impact at the locations where hydraulic tidal effects would be
less important.
For a fixed area, three would be a progressive build-up of pollutants contents (heavy metals) at deep
layers of sediment / sludge.
The recent results indicate an absence of PAHs and pesticides in the sediments. There would be
present under dissolved forms (in surface water).
,00
50,00
100,00
150,00
200,00
250,00
300,00
350,00
10 9 9 8 12 7 11 6 5 8 7 4 3 6 2 5 1 4 3 2 1
Sediment/Sludge characteristics (mg/kg DW Pb Toxicity equivalent) Data-results < 2012
Sediment/Sludge
00
20
40
60
80
100
120
140
160
180
Sed1 Sed2 Sed3 Sed4
Contents in Chemiotox Units (mg/kg DW Pb tox. eq.) at 0,5-m deep layer & top layer of sediments / Results of 2015
0,5-m deeeplayerTop layer

Environmental and Social Impact Assessment, HCMC Steering Center of the Urban
and Environmental and Social Management Plan Flood Control Program
Proposed HCMC Flood Risk Management Project Date Submitted: December 2, 2015
340
Table 9.5 Summary of results for groundwater
Summary of results for Groundwater monitoring along the ThamLuong–BenCat–NuocLen channel
The analytical results are compared to the maximum allowable concentrations (MAC) of QCVN
09:2008/BTNMT. For the assessment of the cumulative impact of most of all the considered
contaminants, the CHEMIOTOX model uses the MAC for the parameter FeTOTAL: 5 mg/L. According to the
calculations:
There should be 2 monitoring locations where contamination of groundwater is very high (Chinh
Xieng canal area, TrungDai to ChoCau area). The main pollutant would be NH4-N and Fe.
The pH would be often low (acid, less than 5,5)
0
100
200
300
400
500
GW1 GW2 GW3 GW4 GW5 GW6 GW7 GW8 GW9
Groundwater characteristics at monitoring locations, Chemiotox Units (mg/L Fe tox. eq.)
Groundwater
2
3
4
5
6
7
8
9
GW1 GW2 GW3 GW4 GW5 GW6 GW7 GW8 GW9
Groundwater pH fluctuations at monitoring locations
pH fluctuations

Environmental and Social Impact Assessment, HCMC Steering Center of the Urban
and Environmental and Social Management Plan Flood Control Program
Proposed HCMC Flood Risk Management Project Date Submitted: December 2, 2015
341
Table 9.6 Summary of results for soils
Summary of results for Soil monitoring along the ThamLuong–BenCat–NuocLen channel
The analytical results are compared to the maximum allowable concentrations (MAC) of QCVN
03:2008/BTNMT. For the assessment of the cumulative impact of the considered heavy metals, the
CHEMIOTOX model uses the MAC for the parameter PbTOTAL: 200 mg/kg DW (commercial uses of land).
According to the calculations:
At almost 50% of monitoring locations the contents in aimed heavy metals are greater than 200
mg/kg DW Pb toxicity equivalent
The use of sediment/sludge as cover soil without preliminary treatment would increase the contents in
heavy metals
0
50
100
150
200
250
300
350
400
450
500
S1 S2 S3 S4 S5 S6 S7 S8
Soils characteristics at monitoring locations, Chemiotox Units (mg/kg DW Pb toxicity equivalent)
Soils…
QCVN 03:2008/BTNMT, MAC = 200 mg/kg DW Pb
0
1
2
3
4
5
6
7
S1 S2 S3 S4 S5 S6 S7 S8
Soil pH fluctuations along the monitoring locations
pH…

Environmental and Social Impact Assessment, HCMC Steering Center of the Urban
and Environmental and Social Management Plan Flood Control Program
Proposed HCMC Flood Risk Management Project Date Submitted: December 2, 2015
342
Table 9.7 Ambient Air Quality
Summary of results for Ambient air monitoring along the ThamLuong–BenCat–NuocLen channel
Monitoring activities have focused on air contaminants aimed by QCVN 05:2013/BTNMT, QCVN
06:2009/BTNMT and QCVN 26:2010/BTNMT. Detailed results shown low levels of air contaminants
(NH3, H2S and VOCs) due to the anaerobic biodegradation within the main water receiving body.
Local traffic seems be the main cause of monitored results: TSP, NO2, SO2, CO & Pb. For measuring the
cumulative impact, the MAC of CO has been considered. At the majority of monitoring locations, the
MAC of 30 mg/m3 CO (Avg-1h) is largely overpassed.
00
20
40
60
80
100
120
K1 K2 K3 K4 K5 K6 K7 K8 K9 K10 K11
Air monitoring (mg/m3 CO equivalent or Chemiotox Units)
Air monitoring
QCVN 05:2013/BTNMT: 30 mg/m3 CO (Avg-1h)
0
20
40
60
80
100
K1 K2 K3 K4 K5 K6 K7 K8 K9 K10 K11
Noise levels along the monitoring locations
Noise level
MAC : 70 dBA according to QCVN 26:2010/BTNMT, Public locations,
between 6:00 AM & 9:00 PM

Environmental and Social Impact Assessment, HCMC Steering Center of the Urban
and Environmental and Social Management Plan Flood Control Program
Proposed HCMC Flood Risk Management Project Date Submitted: December 2, 2015
343
Table 9.8 Plankton counting
Summary of results for Plankton counting along the ThamLuong–BenCat–NuocLen channel
The direct Plankton counting (biological inventory) in surface water indicates a living water receiving
body including microbiological pathogen species from protozoa to larva. Biodegradable organic matters
should be abundant to allow such living conditions.
The over-polluted ChoDem canal should contribute to an increase on plankton population at high tide
while the less polluted Saigon River contribute to the dilution of identified microorganism species.
0
500
1000
1500
2000
2500
3000
3500
4000
4500
5000
SV1 SV2 SV3 SV4 SV5 SV6 SV7 SV8 SV9 SV10
Low Tide
High tidePlankton counting at low & high
tide

Environmental and Social Impact Assessment, HCMC Steering Center of the Urban
and Environmental and Social Management Plan Flood Control Program
Proposed HCMC Flood Risk Management Project Date Submitted: December 2, 2015
344
Table 9.9 PhytoPlankton counting
Summary of results for Phytoplankton counting along the ThamLuong–BenCat–NuocLen channel
The conditions of eutrophication seem gathered along the main channel. Microalgae seem abundant,
probably due high contents in nutrients (N & P) coming with discharge of domestic wastewater.
9.3.7. Cumulative impact in 2015
In order to avoid duplicate, the field monitoring activities have focused in areas where previous
studies had not sufficient results. The Figure 9.8 presents the areas where recent monitoring
activities have gathered results.
Again lab results confirm a build-up of pollutant concentrations in the central areas where we
should observe a low level of hydraulic tidal effects (Figure 9.9). Unfortunately, the recent
monitoring activities have not gathered detailed data (contents in heavy metals and other non-
biodegradable organics) allowing a numeric quantitative comparison with data gathered before
2012. But we can observe that the pollutant contents gradually increase in the deeper layer of
sediments.
006
006
006
007
007
007
007
007
008
SV1 SV2 SV3 SV4 SV5 SV6 SV7 SV8 SV9 SV10
Phytoplankton at low & high tide, log (Total/m3)
At low tide
At high tide

Environmental and Social Impact Assessment, HCMC Steering Center of the Urban
and Environmental and Social Management Plan Flood Control Program
Proposed HCMC Flood Risk Management Project Date Submitted: December 2, 2015
345
Figure 9.8 Overall portrait of the state of environment in 2015.
Environmental and Social Impact Assessment
Ho Chi Minh City Flood Risk Management Project 1
Summary of the state of the environment 2 1
Methodology : Chemiotox Index by EXP 3 2
4 3
Monitoring locations 5 4 1
2
3
4 1
5 2
3
4
Data Legal reference Reference of Maximum Allowable Concentration (MAC) 1
1 QCVN 08:2008/BTNMT MAC of Fe (Column B2: navigation use) : 2 mg/L 2 1
2 QCVN 05:2009/BTNMT MAC of CO (Average-1h) : 30 mg/m3 3 2
3 QCVN 09:2008/BTNMT MAC of Fe : 5 mg/L 4 3
4 QCVN 43:2012 /BTNMT MAC of Pb : 91,3 mg/kg dry basis 5 4
5 QCVN 03:2008/BTNMT MAC of Pb (Housing soil): 200 mg/kg dry basis 5
1
1 Data collected during previous project step 2
2 Data unavailable during previous project step 3 1
4 1 2
5 2 3
1 3 4
2 4 5
3 5
4
5
1
2
1 3
2 4
3 5
4
5
1
2
3 Monitoring locations
4 SW1 Location 200 meter from Sai Gon river towards the Vam Thuat canal.(0603441;1197897)
5 SW2 Location at the junction between the Chin Xieng canal and the Tham Luong – Ben Cat – Nuoc Len channels.(0602849;1197393)
SW3 Location at the junction between the Ong Bau canal and the Tham Luong – Ben Cat – Nuoc Len channels.(0602742;1197488)
SW4 Location at the junction between the Ong Tong canal and the Tham Luong – Ben Cat – Nuoc Len channels.(0602361;1198764)
1 SW5 Location at the junction between the Ba Mien canal and the Tham Luong – Ben Cat – Nuoc Len channels.(0601002;1199835)
2 SW6 Location at the junction between the Cau Cut canal and the Tham Luong – Ben Cat – Nuoc Len channels (0598939;1200474)
3 SW7 Location at the junction between the Hy Vong channel and the Tham Luong – Ben Cat – Nuoc Len channels.(0596170;1197484)
4 SW8 Location at the Tham Luong bridge, after the discharging point of Tan Binh Industrial Park.(0595884;1196999)
5 SW9 Location at the An Lac bridge.(0593163;1186046)
SW10Location 200 meter from Cho Dem river toward the Nuoc Len bridge.(0593205;1184253)
1
2
3
4
5
1
2
3
4
5
1
2
3
4
5
1
2
3
4
5
1
2
3
4
5
1
2
3
4
5
1 Monitoring locations
2 Sed1Location 200 meter from Sai Gon river towards the Vam Thuat canal (0603441;1197897).
3 Sed2Location at the junction between the Chin Xieng canal and the Tham Luong – Ben Cat- Nuoc Len channels (0602849;1197393)
4 Sed3Location at the junction between the Ong Bau canal and the Tham Luong – Ben Cat- Nuoc Len channels (0602742;1197488)
5 Sed4Location at the junction between the Ong Tong canal and the Tham Luong – Ben Cat- Nuoc Len channels (0602361;1198764)
341 > 200Soils
5,9 > 2
458 > 200
171,4 < 200
CHO DEM Canal
NuocLen Cong2,9 < 2
130 063 > 30 000
14 > 5
ChoDem River (200-m)18,6 - 19,7 > 2
23,5 - 52,7 > 30
AnLac bridge21,1 - 30,8 > 2
31,4 > 30
203,6 > 200
163,5 < 200
BaHom bridge - AnLac
bridge
8,9 > 2
93 300 > 30 000
15 > 5
BinhThuan bridge to
BaHom bridge
30,5 > 2
113 393
6 > 5
BaHom bridge - Package
6A
8,9 > 2
110 356
BinhThuan bridge -
Package 4A
69,6 > 2
136 183
4 < 5
162,9 < 200
12 > 5
CauBung bridge to
BinhThuan bridge 88 107
4 < 5
SAIG
ON
Riv
er
ThamLuong bridge 34,9 - 41,1 > 2
56,4 > 30
12 > 5
321,4 > 200
ThamLuong bridge to
CauBung bridge
161,9 > 2
101 857 > 30 000
10,8 - 21,1 > 2
67,4 > 30
471 > 5
126-160,5 > 91,3
Main channel (200-m
from Saigon River)1,645 < 5158 < 200
122,3-154,8 >91,3
18,6 < 30
0,357 < 5
242,5 > 200 Junction OngTong canal
& main channel
0,456 < 5
Surface water & Ambient airJunction BaMien canal
and main channel
0,402 < 5
Sediment Sludge only235,8 > 200
181 < 200
105,5-114,3 >91,3
ChoCau bridge to
TruongDai bridge
5,8 > 2
60,7 > 30 12 - 23,7 > 2
98 > 5 90 417 > 30 000
220 > 200
Ground water
Surface water
Ambient air
Sediment sludge
5,4 > 2
96 249 > 30 000164 < 200
GroundwaterBetween AnLoc bridge
& Saigon River
ThamLuong bridge to
ChoCau bridge
5,9 > 2
Junction HyVong canal &
main channel
32,9 - 42 > 2
114,3-125 > 91,3
0, 517 < 5 15,8 - 18,3 > 2
287,9 > 200 38,4 - 61,7 > 2 Junction OngBau canal
& main channel
20,0 - 101,5 > 30
178,8 < 200 Junction ChinXieng
canal & main channel
Junction CauCut canal &
main channel
29,2 - 54,6 > 2
32,8 > 30 6,5 > 2
13 > 5
56,6 > 30
97,6 > 30
308,9 > 200 AnLoc to TruongDai
bridges (BenPhan)
1,500 < 5
263,3 > 200 36,8 - 65,9 > 2
35 > 5 244 > 200
11
22
33
44
55
5
5
1
66
77
88
99
1010
12
11
1
2
3
4
5
6
7
8
9
0,0
10,0
20,0
30,0
40,0
50,0
60,0
70,0
SW1-LT SW2-LT SW3-LT SW4-LT SW5-LT SW6-LT SW7-LT SW8-LT SW9-LT SW10-LT
Characterisitics of surface water at low tide & at high tide,
Chemiotox units (mg/L Fe toxicity equivalent) At low tide
At high tide
Increase of concentrations at
low tide
0,0
20,0
40,0
60,0
80,0
100,0
120,0
140,0
160,0
180,0
Sed1 Sed2 Sed3 Sed4
Contents in Chemiotox Units (mg/kg DW Pb tox. eq.)
at 0,5-m deep layer & top layer of sediments
0,5-m deeep layer
Top layer

Environmental and Social Impact Assessment, HCMC Steering Center of the Urban
and Environmental and Social Management Plan Flood Control Program
Proposed HCMC Flood Risk Management Project Date Submitted: December 2, 2015
346
Figure 9.9 Illustration of build-up of pollutant contents in the center areas of the main channel.
0,0
10,0
20,0
30,0
40,0
50,0
60,0
70,0
SW1-LT SW2-LT SW3-LT SW4-LT SW5-LT SW6-LT SW7-LT SW8-LT SW9-LT SW10-LT
Characterisitics of surface water at low tide & at high tide, Chemiotox units (mg/L Fe toxicity equivalent)
At low tide
At high tide
Increase of concentrations
at low tide
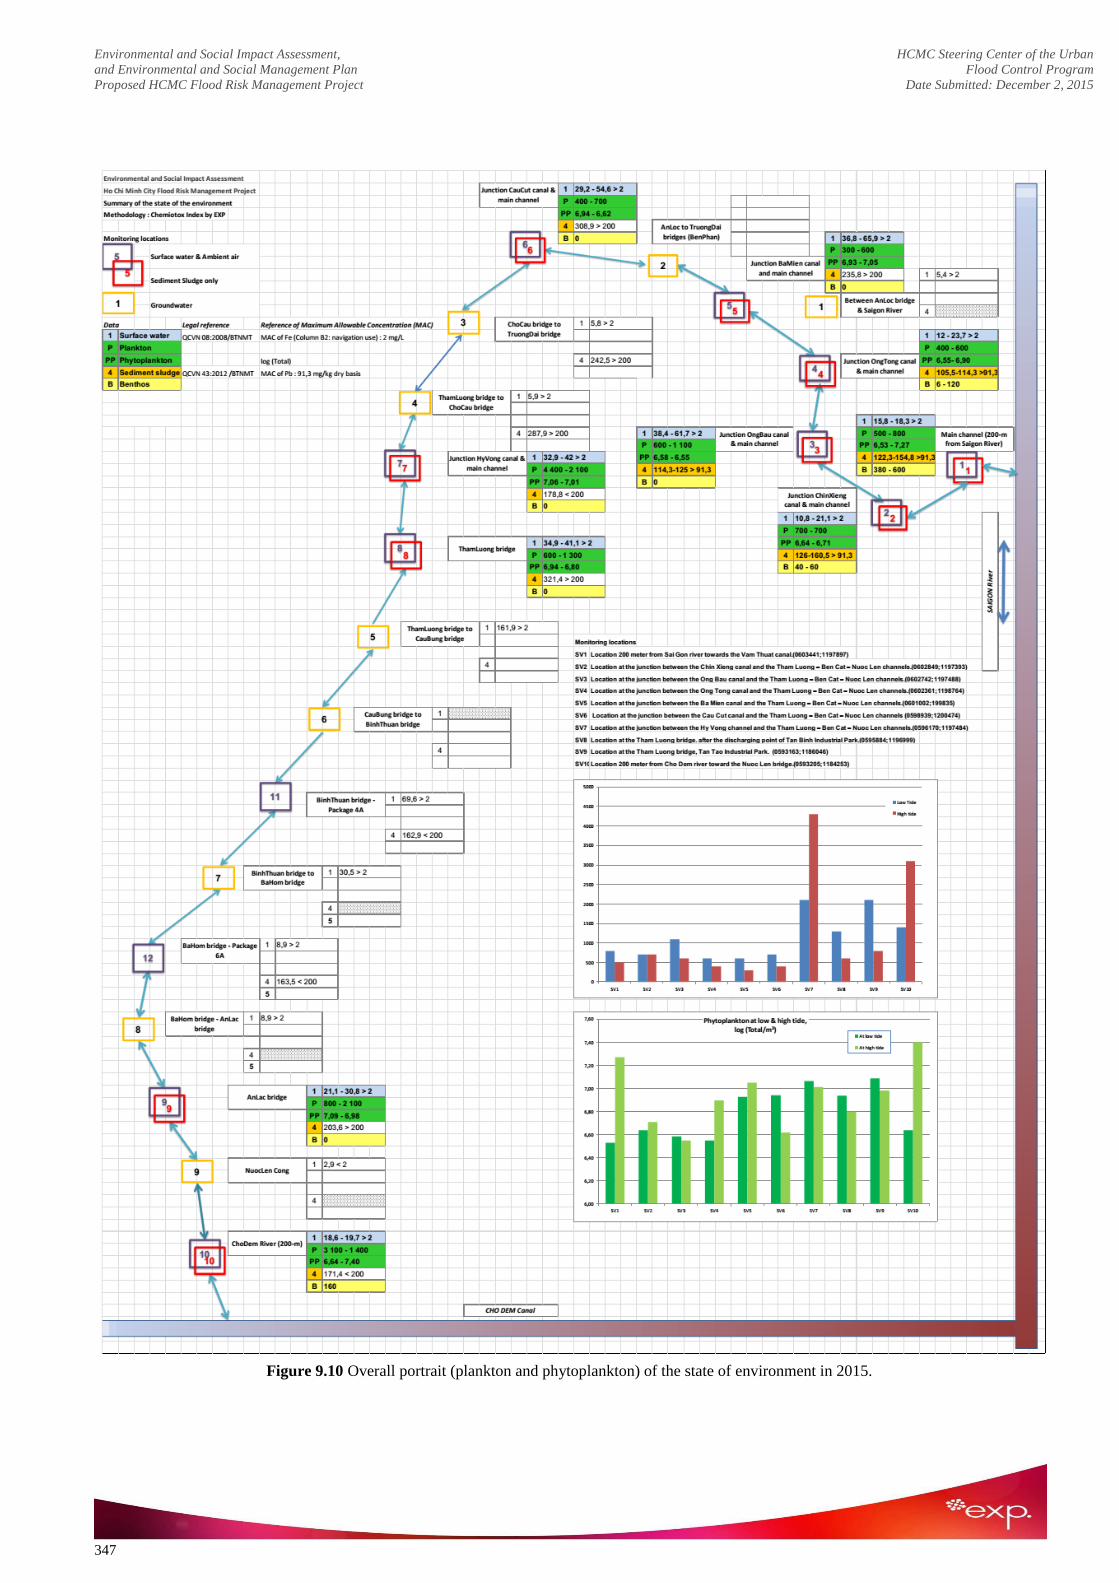
Environmental and Social Impact Assessment, HCMC Steering Center of the Urban
and Environmental and Social Management Plan Flood Control Program
Proposed HCMC Flood Risk Management Project Date Submitted: December 2, 2015
347
Figure 9.10 Overall portrait (plankton and phytoplankton) of the state of environment in 2015.

Environmental and Social Impact Assessment, HCMC Steering Center of the Urban
and Environmental and Social Management Plan Flood Control Program
Proposed HCMC Flood Risk Management Project Date Submitted: December 2, 2015
348
9.3.8.2 Increase of eco-toxic contents in Sediments / Settled sludge
Monitoring locations in 2015 for sediments characterization < 2012 2015
Sed1 Location 200 meter from Sai Gon river towards the Vam Thuat canal
(0603441;1197897). 119,2 154,8
Sed2 Location at the junction between the Chin Xieng canal and the Tham Luong –
Ben Cat- Nuoc Len channels (0602849;1197393) 98,3
160,5
Sed3 Location at the junction between the Ong Bau canal and the Tham Luong – Ben
Cat- Nuoc Len channels (0602742;1197488) - 125,0
Sed4 Location at the junction between the Ong Tong canal and the Tham Luong –
Ben Cat- Nuoc Len channels (0602361;1198764) - 114,3
Figure 9.12 Increase in Chemiotox Units in the sediments/settled sludge.
The sediments/settled sludge in the main channel come from a cumulative effect of the
sedimentation of total suspended solids (TSS). In the present case, it should be due to the
pollutant solids discharged from urban areas (including stand-alone industries), effluents of
industrial parks and surely various run-off rainwater materials. The recent (2015) lab chemical
characterization of sediments within two different layers has shown a progressive build-up of
Chemiotox Units (mg/kg DW Pb tox. Eq.) in the deeper layer. The comparison between previous
0,0
50,0
100,0
150,0
200,0
250,0
300,0
10 9 9 8 12 7 11 6 5 8 7 4 3 6 2 5 1 4 3 2 1
Sediments characteristicsCHEMIOTOX Units (mg/kg DW Pb tox. eq.)
Data < 2012 & Data of 2015
Data < 2012
Data 2015
Recommended by QCVN 43:2012 /BTNMT : 91,3
mg/kg DW Pb
10 9 8 7 6 5 4 3 2 1
10 9 9 8 12 7 11 6 5 8 7 4 3 6 2 5 1 4 3 2 1
98,3
147,
8
153,
6
202,
6
186,
6
183,
1
241,
8
139,
9
119,
2
Fluctuations of SEDIMENT characteristics along the main channel
Monitoring locations
Chemiotox Index
136,
2
128,
1
124,
6
98,2

Environmental and Social Impact Assessment, HCMC Steering Center of the Urban
and Environmental and Social Management Plan Flood Control Program
Proposed HCMC Flood Risk Management Project Date Submitted: December 2, 2015
349
(before 2012) and recent results at the same monitoring locations (relatively deeper bottoms) has
indicated a general progressive build-up of pollutant contents. At lower deeps in the central
areas, it should be more cumulative effects and build-up of Chemiotox Units despite an absence
of recent planned monitoring activities. The sedimentation phenomena are more important in the
lower-depth sections of the main channel.
9.3.8.3 Summary of current situation (2015) of water pollution in the project area
The original VietNamese release of the Feasibility Study Report has described in impressive
terms the state of the aquatic environment of the main channel. Let us try to translate these
sentences that remain significant for the qualtitative description of the current situation, in
addition to what the use of Chemiotox Index methodology intents to quantify.
―As well for the other areas within the City, the pollution of the environment due to savage
garbage disposal along the channel, uncontrolled discharge of wastewater, emanation of
nauseaous biogas becomes an urgent issue while the occurrence of ―dead‖ canals is more than
probable.
The different sections of the ThamLuong-BenCat-NuocLen channel receive wastewaters from
the North and West areas, mainly from plants, industrial enterprises, small industries and a part
of domestic wastewaters. The industrial parks in the NorthWest include textiles factories
(ThanhCong & ThangLoi), chemical manufacturers (TanBinh, HocMon Rubber), food
processing plants (ViFon, ThienHuong, TuongAn Vegetable Oil), liqor and alcohol processing
plants, leather, paper, etc. Thousand of inahbitants get used to directly discharge solid wastes and
wastewaters into various canals.
The surrounding inhabitants along NuocDen Canal (BinhHunhHoa A Ward, BinhTan District)
are suffering day after day while garbage are floating on the surface waters and along the
embankments. It is not rare to see floating corpses of animals. Smell is so nauseaous during
sunny or rainy days: flies, insects, … and they infect food.
9.4. Predict the cumulative impact of project development in 2035
The whole investment project comprises 2 components:
Component 1: Integrated management of urban flood risk. Within this component one can
expect an improvement of the capacity of environmental management by the implementation
of environmental monitoring locations that will allow direct and rapid flows of information
on the fluctuating quality of the environment (air and surface water) in order to implement
adequate mitigation measures.
Component 2: Priority flood risk reduction interventions. This component includes:
o Construction of 2 tidal sluice gates at the end o f VAMTHUAT and NUOCLEN
canals in order to control tidal inflows;

Environmental and Social Impact Assessment, HCMC Steering Center of the Urban
and Environmental and Social Management Plan Flood Control Program
Proposed HCMC Flood Risk Management Project Date Submitted: December 2, 2015
350
o Improving the whole THAMLUONG - BENCAT - NUOCLEN Channel system through
dredging works and embankment construction in order to improve its ability to
discharge flood waters at the safe level of frequency of 10 years;
o Construction of the main interceptor system in GOVAP District;
o Construction and improvement of a primary and secondary combined sewer system
for reaching the appropriate safety level, and construction of the second ar y
interceptor system in GOVAP District
9.4.1. Wastewater Collection, Drainage and Sanitation
With rapid population growth and improvement of functional infrastructure, HCMC will be
challenged with environmental pollution. The major sources of pollution would directly
discharge untreated wastewater or partially treated wastewater to canals, creeks and rivers. The
population growth in the zone of influence could increase the densities of all district up to 136
people per hectare which could result in population of 2 000 000 inhabitants or more. The
wastewater flow will generate pollution in the drainage network and at the end into the
ThamLuong-BenCat-NuocLen Channel.
The wastewater flow generated from factories outside the industrial parks is ranged from 30 to
40 000 m3/day, in which 2.4 tons of pollutant suspended solids are comprised. Total flow of
wastewater generated from industrial parks such as TanTao, TanBinh, VinhLoc A, TanThoiHiep
is estimated to be more than 32 000 m3/day. This flowrate can potentially contribute about 6.4
tons of pollutant suspended solids into ThamLuong Canal if the discharged wastewater could
meet allowable standards.
Within the limits of GoVap District, the common technical solution to the drainage of domestic
wastewater for the City is using combined or separated drainage system for both run-off
rainwater and domestic wastewater collection, depending on the stages of urbanization,
economic conditions and environmental sanitation. Box culverts, manholes and pumping stations
will deserves the collection and the transfer to the planned wastewater treatment plant (a built-
transfer project) that will be located at AnPhuDong Ward, District 12, close to the Saigon River.
The main projected interceptor would collect and transfer the mixed wastewater from HyVong
Canal area (deserving the TanSonNhat Airport) to the ChinXieng area, close to the location
planned for the construction of the tidal sluice gate (VamThuat). Collected wastewater will be
pumped to the planned treatment plant (AnPhuDong Ward). The final treated effluent would be
discharged at a location downstream the tidal sluice gate or directly into the Saigon River current
flow.
According to internal regulations of industrial parks, raw wastewaters discharged by industries
should be treated (first step) separately by preliminary and primary processes prior to their
pumping towards the centralized secondary treatment for a second ―finishing‖ step in order to be
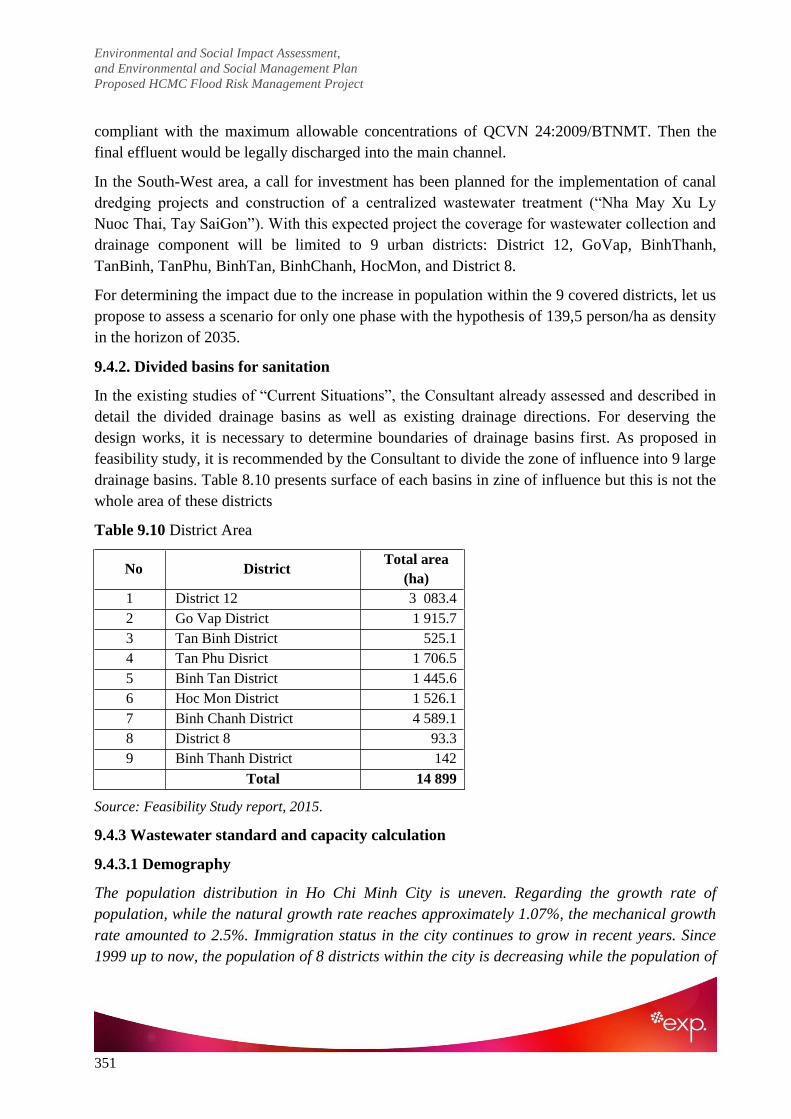
Environmental and Social Impact Assessment, HCMC Steering Center of the Urban
and Environmental and Social Management Plan Flood Control Program
Proposed HCMC Flood Risk Management Project Date Submitted: December 2, 2015
351
compliant with the maximum allowable concentrations of QCVN 24:2009/BTNMT. Then the
final effluent would be legally discharged into the main channel.
In the South-West area, a call for investment has been planned for the implementation of canal
dredging projects and construction of a centralized wastewater treatment (―Nha May Xu Ly
Nuoc Thai, Tay SaiGon‖). With this expected project the coverage for wastewater collection and
drainage component will be limited to 9 urban districts: District 12, GoVap, BinhThanh,
TanBinh, TanPhu, BinhTan, BinhChanh, HocMon, and District 8.
For determining the impact due to the increase in population within the 9 covered districts, let us
propose to assess a scenario for only one phase with the hypothesis of 139,5 person/ha as density
in the horizon of 2035.
9.4.2. Divided basins for sanitation
In the existing studies of ―Current Situations‖, the Consultant already assessed and described in
detail the divided drainage basins as well as existing drainage directions. For deserving the
design works, it is necessary to determine boundaries of drainage basins first. As proposed in
feasibility study, it is recommended by the Consultant to divide the zone of influence into 9 large
drainage basins. Table 8.10 presents surface of each basins in zine of influence but this is not the
whole area of these districts
Table 9.10 District Area
No District Total area
(ha)
1 District 12 3 083.4
2 Go Vap District 1 915.7
3 Tan Binh District 525.1
4 Tan Phu Disrict 1 706.5
5 Binh Tan District 1 445.6
6 Hoc Mon District 1 526.1
7 Binh Chanh District 4 589.1
8 District 8 93.3
9 Binh Thanh District 142
Total 14 899
Source: Feasibility Study report, 2015.
9.4.3 Wastewater standard and capacity calculation
9.4.3.1 Demography
The population distribution in Ho Chi Minh City is uneven. Regarding the growth rate of
population, while the natural growth rate reaches approximately 1.07%, the mechanical growth
rate amounted to 2.5%. Immigration status in the city continues to grow in recent years. Since
1999 up to now, the population of 8 districts within the city is decreasing while the population of

Environmental and Social Impact Assessment, HCMC Steering Center of the Urban
and Environmental and Social Management Plan Flood Control Program
Proposed HCMC Flood Risk Management Project Date Submitted: December 2, 2015
352
suburban districts and newly-setup districts grew rapidly. The mechanical increase of the city's
population is going strongly and difficult to control as indicated in BINHCHANH: population
increasing per year was ever up to 30,000 people, equivalent to the population of one commune.
(ref: FS Study 2012)
In 2007 the estimated population of Ho Chi Minh City was over 6.5 million, growing at around
2.9% per year. It is forecasted that the Study Area population will reach over 13.8 million by
2025, with 10 million people in HCMC. Most of the population growth is projected to happen in
outer areas (the urban fringe, suburban and other outlying communities), while the inner core
areas are projected either to decrease their populations (in high density areas) or increase
moderately (in medium/low density areas). (Ref: Preparing the Ho Chi Minh City Metro Rail
System Project, ADB, Project number 39500, Feb 2010)
At the United Nations Conference on Trade and Development conference (on Investment Policy
Review 2007), it was noted that a new airport and training and research facilities will be built
outside Ho Chi Minh City. As a population growth scenario, we are assuming that the airport
will be delocalized and that districts will be constructed with new development. With a
population growth of 2.5%, total population of zone of influence should reach 2 000 000 latest
2038. We will assume that density will equalized at the average density of 139.5 persons per
hectare. The table 9.11 represent population forecast in each district (zone of influence only) for
year 2035 with that density.
Table 9.11 Population forecasted to 2035 as follows
No. District
Number
of
wards
Area Population
2015
Actual
Density
Population
2035
(ha) (persons) (person/ha) Density 139,5
1 District 12 10 3 083,4 181 127 59 430 134
2 Go Vap 11 1 915,7 313 798 161 308 427
3 Binh Thanh 1 142 19 624 138 19 809
4 Tan Binh 1 525,1 37 244 71 73 251
5 Tan Phu 7 1 706,5 218 843 128 238 056
6 Binh Tan 10 1 445,6 199 316 131 201 661
7 Binh Chanh 3 4 589,1 29 670 7 640 179
8 Hoc Mon 5 1 526,1 99 574 65 212 890
9 District 8 1 93,3 9 054 97 13 015
Total: 9
districts 49 14 899 1 108 250 74 2 137 426

Environmental and Social Impact Assessment, HCMC Steering Center of the Urban
and Environmental and Social Management Plan Flood Control Program
Proposed HCMC Flood Risk Management Project Date Submitted: December 2, 2015
353
9.4.3.2. Calculation of wastewater flows
Within the Phase I (to 2035), the Project aim at limiting the wastewater at these figures and
propose Design References for 2035 as:
Flow of domestic wastewater: 180 L/capita/day in 2035.
Flow of wastewater from Industries, Commerce and Institutional (ICI): 30% Qdomestic;
Irregular coefficient of day max: KDAY-MAX = 1,25;
Known flow from two industrial zones will be added separately.
9.4.3.3 Assessment of Domestic Wastewater Flows
The next table represent the volume of wastewater that should be produced in 2035 in each
district and that may be collected.
Table 9.12 Expected Flow of Wastewater
No. District Population 2035 Discharge m
3 ICI Total
Density 139,5 180 L/pers/day 30% m3/day
1 District 12 430 134 77 424 23 227 100 651
2 Go Vap 308 428 55 517 16 655 72 172
3 Binh Thanh 19 809 3 566 1 070 4 635
4 Tan Binh 73 251 13 185 3 956 17 141
5 Tan Phu 238 057 42 850 12 855 55 705
6 Binh Tan 201 661 36 299 10 890 47 189
7 Binh Chanh 640 179 115 232 34 570 149802
8 Hoc Mon 212 891 38 320 11 496 49 816
9 District 8 13 015 2 343 703 3 046
Total: 9 districts 2 119 598 384 737 115 421 500 158
The calculated flow of wastewater indicates a volume of 500 000 m3/day of wastewater in 2035
that may be discharged directly or indirectly in the THAMLUONG-BENCAT-NUOCLEN Channel
system. This flow would be the parameter for pumping stations and treatment plant for
residential sector. Over this, feasibility studies identified an industrial zone discharging up to
40 000 m3/day and a second industrial zone discharging at 32 000 m
3/day. To evaluate the
cumulative impact of zone of influence on the canal, we will assume that the potential pollution
measured in term of DBO5 will be equal to Suspended Solids discharged into the canal. So
Suspended Solids (SS) will be the indicator to measure the cumulative impact of project
development. Then we will propose a revision of the model for 2035.
9.4.3.3. Calculation of Storm water

Environmental and Social Impact Assessment, HCMC Steering Center of the Urban
and Environmental and Social Management Plan Flood Control Program
Proposed HCMC Flood Risk Management Project Date Submitted: December 2, 2015
354
Table 9.13 Rainfall intensity increase as observed at HCMC
According to this trend y = 0.777x – 1 453.5, the maximum intensity will be 128 mm/hour in
2015. The impermeable surface have increase from 30% to 40 % in HCMC (source: Vo Le Phu
and Luu Dinh Hiep, Faculty of Environment Ho Chi Minh City University of Technology) which
reflect the actual situation. In practice the impermeability factor should be 60% in a mix
commercial-residential development in 2015 if mitigation measures are not applied. The
simplified approach with the SCS (Soil Conservation Service) may be used to calculate overall
the maximum hourly volume of water to fill the Tham Luong Ben Cat Nuoc Len Channel system
in 2035:
Q = (I-0,2*S)2 / (I+0,8*S)
With:
S = 25 400 / CN-254
CN = 86 (2015)
CN = 92 (2035)
Period of return 1 year
Time 90 minutes
I = 50
These calculations show an increase of daily runoff of 16% in comparison of rainfall statistics in
2015.

Environmental and Social Impact Assessment, HCMC Steering Center of the Urban
and Environmental and Social Management Plan Flood Control Program
Proposed HCMC Flood Risk Management Project Date Submitted: December 2, 2015
355
Expected rainfalls (mm/hr) have been assessed for each district. Storm water flows are calculated
as shown into Table 9.14.
Table 9.14 Rainfall estimation in each district (2015-2035)
STORMWATER 2015 2018 2035
Q = (I–0,2xS)x2 / (I+0,8xS) CN = 86 CN = 86 CN = 92
S 41,3488372 41,3488372 22,0869565
Q 28,6913232 28,6913232 36,9023787
Q Q Q
In 2015 In 2018 In 2035
No. District SCS flow (m3/d) SCS flow (m
3/d) SCS flow (m
3/d)
1 District 12 3 083,4 88 467 88 467 113 785
2 Go Vap 1 915,7 54 964 54 964 70 694
3 Binh Thanh 142,0 4 074 4 074 5 240
4 Tan Binh 525,1 15 066 15 066 19 377
5 Tan Phu 1 706,5 49 962 49 962 62 694
6 Binh Tan 1 445,6 41 476 41 476 53 346
7 Binh Chanh 4 589,1 131 667 131 667 169 349
8 Hoc Mon 1 526,1 43 786 43 786 56 317
9 District 8 93,3 2 677 2 677 3 443
Total of 9 districts 15 026,8 431 139 431 139 554 525
The Table 9.14 is presenting assessment for daily flow in each district if all the outfalls are
captured and drained to the man channel TL-BC-NL.
Table 9.15 Potential sanitary hydraulic load discharged into the channel ThamLuong-BenCat-
NuocLen

Environmental and Social Impact Assessment, HCMC Steering Center of the Urban
and Environmental and Social Management Plan Flood Control Program
Proposed HCMC Flood Risk Management Project Date Submitted: December 2, 2015
356
Year 2015 Year 2018 Year 2035
120 L/pers.-day 120 L/pers.-day 180 L/pers.-day
No. District Area
ha m3/day m
3/day m
3/day
1 District 12 3 083,4 21 735 23 365 77 424
2 Go Vap 1 915,7 37 656 40 480 55 517
3 Binh Thanh 142,0 2 355 2 531 3 566
4 Tan Binh 525,1 4 469 4 804 13 185
5 Tan Phu 1 706,5 26 261 28 231 42 850
6 Binh Tan 1 445,6 23 918 25 712 36 299
7 Binh Chanh 4 589,1 3 560 3 827 115 232
8 Hoc Mon 1 526,1 11 949 12 845 38 230
9 District 8 93,3 1 086 1 168 2 343
Total: 9 districts 15 026,8 132 990 142 964 384 737
9.4.3.4. Wastewater Treatment Design Criteria
Even if certain existing evaluation methods in Vietnam indicate that domestic effluent includes a
content of 35 gram per person per day of DBO5 and TSS, we are forecasting that in 2035
Vietnamese population will reach international standard discharges and the characteristics of raw
domestic affluents (before treatment) will reach the average values that are gathered in Table
9.16
Table 9.16 Domestic Wastewater Affluents in 2035
Criteria Unit Quality of Input Wastewater
Phase 1
2035
BOD5 mg/L (O2) 236.0
COD mg/L (O2) 380.0
SS mg/L 320.0
Total Nitrogen mg/L (N) 30.0
Total Phosphorus mg/L (P) 6.3
According to the FS Report and other various documents related to the project areas, the
implementation of wastewater treatment plants have been planned (at AnPhuDong, District 12,
near the Saigon River, 131 000 m3/d – Nha May Xu Ly Nuoc Thay Binh Tan, 150 000 m
3/d,
etc). If implemented, the final effluents of these plants should be compliant with the related
regulations.
Table 9.17 Treated Wastewater Quality criteria 2011
No Criteria
of Analysis Unit Input
QCVN
40:2011 and
QCVN 40:2011
and QCVN 14:

Environmental and Social Impact Assessment, HCMC Steering Center of the Urban
and Environmental and Social Management Plan Flood Control Program
Proposed HCMC Flood Risk Management Project Date Submitted: December 2, 2015
357
QCVN 14:
2008 (col. A)
2008 (col. B)
1 PH 7,02 5-9 5-9
2 Total suspended solids
(SS)
mg/L 320 50 100
3 COD mg/L (O2) 280 75 150
4 BOD5 mg/L (O2) 186 30 50
5 Total N mg/L (N) 40 30 50
6 Total P mg/L (P) 6,3 6 10
8 Total Coliform MPN/100ml 9 250 3 000 5 000
The Table 9.17 shows the criteria that the Consultant will use in 2015 for selection of treatment
technological chain and preparation of basic design for the projects as proposed in TCVN. If
these criteria are not changed treatment technologies should perform to reach these targets. In the
FS column B is proposed as a target for industrial zone and column A is proposed for residential
zone.
9.4.3.4. Storm water contamination
Urban storm water runoff has been the subject of intensive research since the inception of the
Water Quality Act of 1965 in USA. The most comprehensive study of urban runoff was NURP,
conducted by EPA between 1978 and 1983. NURP was conducted in order to examine the
characteristics of urban runoff and similarities or differences between urban land uses, the extent
to which urban runoff is a significant contributor to water quality problems nationwide, and the
performance characteristics and effectiveness of management practices to control pollution loads
from urban runoff (US EPA 1983).
Table 9.18 Pollutant Criteria for Storm Water
BOD5, mg/L (O2) 10 COD, mg/L (O2) 73
TSS, mg/L 101 Total Lead, μg/L 144
Total Copper, μg/l 33 Total Zinc, μg/L 135
TKN, Total Kjeldahl Nitrogen, μg/L 1 900 Nitrate + Nitrite, μg/L 736
Total Phosphorus, μg/L 383 Soluble Phosphorus, μg/L 143
9.4.4. Combined discharge of wastewater and storm water into ThamLuong-BenCat-
NuocLen Channel system
The Table 9.19 determine the quantity of wastewater and drainage solids to be discharged into
the channel system in 2015, in 2018 if WWTPs are in operation and in 2035 if WWTP are built
to support population increase. Table 9.20 shows the potential of increase of SS in 2035.
Table 9.19 Maximum Daily Loads (TSS) from storm water run-off and final effluent of WWTP
No. District 2015 2018 2035 2015 2018 2035
Storm water Wastewater

Environmental and Social Impact Assessment, HCMC Steering Center of the Urban
and Environmental and Social Management Plan Flood Control Program
Proposed HCMC Flood Risk Management Project Date Submitted: December 2, 2015
358
kg/day kg/day kg/day kg/day kg/day kg/day
1 District 12 8 847 4 423 5 869 6 955 1 168 3 871
2 Go Vap 5 496 2 748 3 535 12 050 2 024 2 776
3 Binh Thanh 407 204 262 754 127 178
4 Tan Binh 1 507 753 969 1 430 1 430 659
5 Tan Phu 4 896 2 448 3 149 8 404 8 404 2 143
6 Binh Tan 4 148 2 074 2 667 7 654 120 181
7 Binh Chanh 13 167 6 583 8 467 1 139 1 139 5 762
8 Hoc Mon 4 379 2 189 2 816 3 824 3 824 1 916
9 District 8 268 134 172 348 348 117
Total: 9
districts 43 114 21 557 27 726 42 557 18 583 17 603
Table 9.20 Total Maximum Daily Load (TSS)
No. District 2015 2018 2035
kg/day kg/day kg/day
1 District 12 15 802 5 592 9 560
2 Go Vap 17 546 4 772 6 311
3 Binh Thanh 1 161 330 440
4 Tan Binh 2 937 2 937 1 628
5 Tan Phu 13 300 13 300 5 291
6 Binh Tan 11 801 11 801 4 482
7 Binh Chanh 14 306 14 306 14 229
8 Hoc Mon 8 202 8 202 4 732
9 District 8 615 615 289
Total: 9 districts 78 137 54 321 45 330
The Table 9.20 illustrates the cumulative impact (kg per day of DBO5 or Suspended Solids) of
load that may be discharged in the channel system if WWTP are in operation. This situation
suggests that in 2035 all the projected WWTPs will be in operation. According to this
hypothesis, there would be some 132 079 tons of dry sludge in the channel in 2035. The volume
of sludge may be 3 301 987 m3 at 4% dryness. The figure 8.13 represents the volume of Channel
after dredging the channel assuming that bottom will be at -4 meter and top average water level
will be at +1 meter over the sea level. Total effective volume of channel will be 6 060 612 m3.
This indicates that the canal will filled with up to 55% if no sludge is removed within 20 years.
To evaluate the contamination of channel, it will be divide in three sections
1) From ChoDem River to Bridge BaHom Bridge: 1 273 100 m3
2) From BaHom Bridge to Bridge ChoCau Bridge: 2 189 700 m3
3) From Cho CauBridge to Saigon River: 2 597 812 m3

Environmental and Social Impact Assessment, HCMC Steering Center of the Urban
and Environmental and Social Management Plan Flood Control Program
Proposed HCMC Flood Risk Management Project Date Submitted: December 2, 2015
359
The Section 1 will receive 50% of discharge from BinhTan District, District 8 and part of
District Huyen BinhChanh and certain parts of Section 2.
The Section 2 will receive discharge from HocMon District, 50% of District 12, 50% of BinhTan
District, TanPhu District, TanBinh District with the catchment of BinhHungHoa WWTP. The
treatment plant uses aerated lagoon and stabilization pond technology to treat wastewater from
nearby NuocDen canal. NuocDen canal has an area of 785 ha and population in the area is
around 120 000 (1999). The canal also receives untreated wastewater from surrounding
industrial activities, creating black colour and bad odour in the surface water with the following
values for the physico-chemical parameters: SS 250 mg/L, BOD5 200 mg/L (O2), COD 300
mg/L (O2), NH4/NH3-N 25 mg/L (N), and pH 6.5 - 7 (Smet et al.,2006). It will also receive
effluents of 2 industrial zones
The Section 3 will receive 50% of District 12, GoVap District and part of BinhThanh District.
Four scenarios will be evaluated.
1) Rainy Season after modifications occurring in 2018
2) Dry Season after modifications occurring in 2018
3) Rainy Season in 2035 expecting that all WWTP will be completed.
4) Dry Season in 2035 expecting that all WWTP will be completed.
According to rainfall statistic 85% of rain is falling from May to October and 15% from
December to April.

Environmental and Social Impact Assessment, HCMC Steering Center of the Urban
and Environmental and Social Management Plan Flood Control Program
Proposed HCMC Flood Risk Management Project Date Submitted: December 2, 2015
360
Figure 9.13 Illustration of dredging and embankment construction works.

Environmental and Social Impact Assessment, HCMC Steering Center of the Urban
and Environmental and Social Management Plan Flood Control Program
Proposed HCMC Flood Risk Management Project Date Submitted: December 2, 2015
361
Table 9.21 Assessment of pollutant contents based on conventional parameters TSS COD BOD5
Dry Wet Dry Wet Dry Wet Dry Wet Dry Wet Dry Wet
2018+ 2035 2018+ 2035 2018+ 2035
mg/L mg/L (O2) mg/L (O2)
1 91 25 96 52 137 38 144 78 55 15 58 31
2 99 40 96 52 148 60 144 78 59 24 58 31
3 54 27 98 55 81 40 147 82 33 16 59 33
The channel may become an anaerobic pond inn these conditions. During the dry seasons,
according some suggestions listed in the FS Report, the sluice gates remain closed in order (at
least for 4 months) to preserve the water body at an aimed level for the purposes of fluvial
navigation. Dilution of receiving water body would be not sufficient to decrease the pollutant
contents. As earlier mentioned, dredging & embankment construction works will modify the
hydraulic volumes of the three sections of the main channel. Calculations taking in consideration
an increase in population (and pollution discharge into sewerage networks) and an achievement
of wastewater treatment plants would allow assessing the pollutant contents in terms of
CHEMIOTOX UNITS in the three sections of the main channel as follow:
Table 9.21 Assessment of pollutant contents based on Chemiotox units
2018 2035
Dry
Seasons
Wet
Seasons
Dry
Seasons
Wet
Seasons
CHEMIOTOX UNITS (mg/L Fe Tox. Eq.)
Section 1: ChoDem Channel (or NuocLen Sluice Gate)
to BaHom Bridge 70,0 19,4 73,5 39,8
Section 2: BaHom Bridge to ChoCau Bridge 75,6 30,6 73,5 39,8
Section 3: ChoCau Bridge to Saigon River (or
VamThuat Sluice Gate) 41,4 20,4 75,1 41,9

Environmental and Social Impact Assessment, HCMC Steering Center of the Urban
and Environmental and Social Management Plan Flood Control Program
Proposed HCMC Flood Risk Management Project Date Submitted: December 2, 2015
362
Figure 9.14 Potential general increase in pollutant contents assessed with Chemiotox Units.
0
10
20
30
40
50
60
70
80
SW10 SW9 SW8 SW7 SW6 SW5 SW4 SW3 SW2 SW1
SURFACE WATERCHEMIOTOX Units (mg/L Fe tox.eq.)
Data of 2012, 2015, 2018 & 2035
Data of 2012
Data of 2015
Data of 2018
Data of 2035

Environmental and Social Impact Assessment, HCMC Steering Center of the Urban
and Environmental and Social Management Plan Flood Control Program
Proposed HCMC Flood Risk Management Project Date Submitted: December 2, 2015
363
The following figures are presenting the schematic of drainage and WWTP organization.
Figure 9.15 Illustration of discharges along the main channel in 2015.
Figure 9.16 Illustration of discharges along the main channel in 2018.
Figure 9.17 Illustration of discharges along the main channel in 2035.
2035
GO VAP126211m3/daY6311kg/day
District 12191209m3/day9560kg/day
Tan Binh32563m3/day1628kg/day
Tan Phu105824m3/day5291kg/day
Hoc Mon946374732kg/day
Binh Thanh8806M3/day440kg/day
Binh Tan89645m3/day2849kg/day
Binh Chanh284581m3/day14229kg/day
District 85786m3/day289kg/day
WWTP
WWTP
WWTP WWTP

Environmental and Social Impact Assessment, HCMC Steering Center of the Urban
and Environmental and Social Management Plan Flood Control Program
Proposed HCMC Flood Risk Management Project Date Submitted: December 2, 2015
364
FS also proposes two important mitigation measures that could improve the environmental
situation:
1) Constructing a retention pond at GOVAP park (available in the planning of control reservoir
in HCMC) and to propose size of the reservoir to reduce water level in main canal and
reduce inundation for the basin at the head route, nearby SaiGon River (mainly
AnPhuDong Ward, Thanh Xuan Ward - District 12.
2) Constructing TanTao retention pond for climate change by 2100.
These two measures would have a direct impact to reduce and eliminate contamination coming
from stormwater. Mitigation measures like application of Low Impact Development
Technologies would also reduce the loads. In these cases the loads would be limited to the
contamination due to final effluents of wastewater treatment plants. The WWTP of
BinhHungHoa is already in operation and its final effluent is discharged into NUOCDEN Canal.
9.5. Linked Ancillary Projects
9.5.1. Summary of projects
Following table presents a summary of current and future projects whose impacts can be
negative, neutral or positive to the factors identified previously. Each project is described with
status, status of EIA, detail of EMP, cumulative impact assessment and screening of linked
project.
Table 9.17 Cumulative impacts
1. Project Name DA PHUOC SOLID WASTE TREATMENT COMPLEX
Description
Scope of work:
The Da Phuoc Solid Waste Treatment Complex near Ho Chi Minh City is
Vietnam‘s largest solid waste processing complex. This project was developed,
and is currently operated, by Vietnam Waste Solutions (VWS) of Ho Chi Minh
City and California Waste Solutions (CWS) of California. This Complex is
located in Da Phuoc Commune, Binh Chanh District, Ho Chi Minh City.
Capacity of the Complex is currently 10,000 tons per day designed to collect
whole domestic solid waste generated by Ho Chi Minh City and partly solid
waste collection from Long An province. The complex is planned on an area of
128.22 ha that includes administrative office (0.2%), domestic waste treatment
factory (6.64%), industrial waste and hazardous waste treatment factory (1.41%),
technical infrastructures (5.08%), green field and utilities (0.21%), high-tech
landfill including four cells (68.91), green trees and grass cover (5.48%) and
internal roads and yards (12.06%).
A sanitary landfill sheet included seven layers: stone drainage layer, geotextile
layer, HDPE layer, geotextile layer, stone drainage layer, geotextile layer and
vegetative soil
Waste treatment processing: Waste collected from Ho Chi Minh city and Long
An province will be transported to the Da Phuoc landfill. Then, waste is

Environmental and Social Impact Assessment, HCMC Steering Center of the Urban
and Environmental and Social Management Plan Flood Control Program
Proposed HCMC Flood Risk Management Project Date Submitted: December 2, 2015
365
compressed by the Compactors and removed odor with Posi-Shell. After waste is
filled to fixed height, waste will be covered with waterproof HDPE.
Relationship with the HCMC – FRM project:
The Da Phuoc Landfill will receive all the dredged materials and construction
waste from the demolition process, construction process and dredging process
during pre-construction phase, construction phase and operation phase of six
components.
Status The project has entered operation with a capacity of 10,000 tons solid waste per
day
Status of EIA
The EIA of the project with capacity of 3,000 tons per day has been approved by
DONRE of Ho Chi Minh City in accordance with a Decree No. 132/QĐ-TNMT
dated on 18th
April 2005. Following the approval of HCM PC to upgrade from
3,000 tons per day to 10,000 tons per day, the EIA for upgraded capacity was
approved in 2015.
Detail of EMP
Mitigation measure to treat leachate wastewater and storm water:
The complex currently has a wastewater treatment complex with a capacity of
4,280 m3 per day. Three wastewater treatment plants were constructed in this
complex, including two leachate wastewater treatment plants (280 m3/day and
1,000 m3/day) and one storm water treatment plant (3,000 m
3/day). Following the
treatment, the wastewater of the first two meets QCVN 25:2009/BTNMT
(column B1) and QCVN 40:2011/BTNMT (column B) (in accordance with a
Decree No. 541/QĐ-TNMT-QLTN dated on 1st June 2012 about extending a
license of discharging the treated wastewater to receiving stream) and of the third
meets QCVN 25:2009/BTNMT (column B1) (in accordance with a Decree No.
926/QĐ-TNMT-QLTN dated on 4th September 2012 by MONRE about
extending a license of discharging the treated wastewater to receiving stream).
Following increasing up to 10,000 tons of solid waste per day, total capacity will
be increased from 4,280 m3
per day to 4,510 m3 per day. In this case, the leachate
wastewater treatment plant will be upgraded to meet the increased capacity.
Mitigation measure to treat gas emission from landfill:
Gas emissions from landfill revenues are collected by spaced vertical wells. All
the collected gas is flared.
Mitigation measures to treat odor and pathogens microorganisms:
In addition to the daily soil cover layer to prevent odors, spraying is also done
regularly, especially during the time after the rain.
In addition, planting of trees is also done to create buffer areas.
Limitations of the residents scavenging and require workers to user PPE when
working at the landfill.
Assessment of
cumulative impact
Given the Complex has now received a half of 10,000 tons of solid waste per
day, it still has enough area and capacity to receive the solid waste generated
from the HCM – FRM project. Therefore, negative cumulative impact is assessed
to be minimal. WW is discharged in Nga Cay creek which do not directly reach
the channel TL-BC-NL.
OP 4.12: Screening The Da Phuoc landfill is to accommodate sludge from dredging operation to be

Environmental and Social Impact Assessment, HCMC Steering Center of the Urban
and Environmental and Social Management Plan Flood Control Program
Proposed HCMC Flood Risk Management Project Date Submitted: December 2, 2015
366
of linked project supported by HCM – FRM project. This is existing landfill built 10 years ago and
it will not require any further civil works or any involuntary land acquisition.
Therefore it is noted that this is not considered as linked project, but is
considered as ancillary activities.
2. Project Name THAM LUONG BEN CAT WASTEWATER TREATMENT PLANT
Description
The project of wastewater treatment plant for a catchment of Tham Luong Ben
Cat Nuoc Len, phase 1, with a total capacity of 131,000 m3 per day. It is scoped
in a project ―Wastewater collection system and wastewater treatment plant for a
catchment of Tham Luong Ben Cat Nuoc Len‖, where the Prime Minister
approved a pre-feasible study regarding to a document No. 1131/CP-CN dated on
13th August 2014 and investment policy under forms of Building and Transfer
(BT) regarding to a document No. 383/QĐ-UBND-DT dated on 8th October
2010.
The catchment area where wastewater will be collected for treatment by the
Tham Luong Ben Cat WWTP is of 5,141 ha of District 12, Go Vap District and
Binh Thanh District. It is located at An Phu Dong Ward, District 12, Ho Chi
Minh City.
Diagram of wastewater treatment technology processing:
Wastewater from sewage system Screen bar Sand sediment tank
Selector C-Tech (biological tank) UV disinfaction tank Lagoon
Discharge to Vam Thuat River using pump.
In addition to those major treatment units, the WWTP also comprise of units to
treat gas and sludge (sludge holding tank, belt press, gas collection and
treatment). Following treatment, treated wastewater will meet QCVN 40:
2011/BTNMT (column A).
Status The project is under construction and expected to be completed on May 2017.
Status of EIA
The EIA of project has been approved by the local authority (DONRE) of Ho Chi
Minh City. Below is a summary of impact evaluation for each project
components:
Waste water treatment plant:
- Location is An Phu Dong Ward, District 12, Ho Chi Minh City. Point for
discharge is Vam Thuat River and the treated wastewater will meet the Viet Nam
environmental standard of type A, QCVN 40: 2011/BTNMT (column A) before
discharge.
- Option technology is Sequencing Batch Reactor. The treatment is activated
sludge.
- Per EIA, most of the negative environmental impacts are short-term and
mitigated. Mitigation measures have been properly proposed in EMP, including
institutional arrangement for environmental management, monitoring and
capacity building program. Total estimated cost for EMP is as follow:
Cost for environmental protection works during construction period is
640,000,000 VND.
Cost for environmental protection works during operation period is 408,000,000
VND.

Environmental and Social Impact Assessment, HCMC Steering Center of the Urban
and Environmental and Social Management Plan Flood Control Program
Proposed HCMC Flood Risk Management Project Date Submitted: December 2, 2015
367
Cost for environmental quality monitoring program in the first year operation is
42,126,332 VND.
(Source: The EIA report of WWTP project 2015)
Community consultation has been conducted during project preparation. Most of
the participants raised their concerns on compensation prices, construction-
caused disturbance and pollution generated during construction and operation
phase and requested PMU to comply with the mitigation measures proposed.
Detail of EMP
Proposed mitigation measures on approved EIA report of WWTP project are :
Mitigation measures to treat sludge out of WWTP processing:
Sludge out of WWTP processing will be treated by following process:
Activated sludge sludge holding tank Sludge pump Centrifuge
Fertilized or disposed to landfill.
Controlling the treated wastewater quality out of WWTP:
According to an approved decision of an EIA report by Ho Chi Minh City
People‘s Committee - Department of Natural Resources and Environment
(DONRE), quality of treated wastewater must satisfy the Viet Nam
environmental standard of type A, QCVN 40: 2011/BTNMT (column A) before
discharge.
Environmental monitoring program also included in the EIA report.
Assessment of
cumulative impact
Impacts will be positive as wastewater from Tham Luong Ben Cat WWTP will
be treated prior to discharge. However, if the discharge cannot be monitored well
in term of treatment performance, it can cause negative impacts to receiving
streams. Sludge will accumulate in the channel and will have to be removed.
OP 4.12: Screening
of linked project
The project has been constructed to collect the domestic wastewater generated
from local community located in the Tham Luong ben Cat Nuoc Len Catchment.
It is scoped in a project ―Wastewater collection system and wastewater treatment
plant for a catchment of Tham Luong Ben Cat Nuoc Len‖ and constructed to
serve the outcomes of project component 4. Therefore, it is considered as a
linked project.
3. Project Name TAN TAO INDUSTRIAL PARK
Description
Tan Tao IP is located in Binh Tan District, Ho Chi Minh City with total area of
380.15ha. It was established on 30th November 1996 following a Decision
906/TTg and 978/QĐ-MT.
In 2008, Tan Tao Investment Industry Corporation constructed a WWTP, which
has a capacity of 3,000 m3 per day for extension of Tan Tao IP, and completed
that in 2010. This WWTP for Tan Tao IP extension was provided completion
certification issued a documents No. 171/BQL-KCN-HCM-QLMT dated
14/01/2010. In addition, DONRE of Ho Chi Minh City also issued a document
No. 373/GP-TNMT-QLTN dated 23rd
April 2012 to provide a discharge license
where the project can discharge 3,000 m3 of wastewater per day to receiving
stream.
This flowrate together with flowrate of the original Tan Tao IP contribute to
generate up to 12,000 m3 per day.
Major industry sectors invested in this IP comprise of textile, leather, rubber,

Environmental and Social Impact Assessment, HCMC Steering Center of the Urban
and Environmental and Social Management Plan Flood Control Program
Proposed HCMC Flood Risk Management Project Date Submitted: December 2, 2015
368
plastic, mechanics, electronics, wood, food. Regarding to document No. 137/CV-
ITACO-10, all investors must ensure the wastewater generated from their
factories must meet the parameters concentration developed by Tan Tao IP
owner before discharging to the central wastewater treatment plant in Tan Tao
IP.
Currently, approximate 107 business sectors has invested in Tan Tao IP and
contribute a total of wastewater flow ranged from 2,300 to 2,400 m3
per day.
Wastewater following pretreatment stage undertaken in each factory is permitted
to discharge to central wastewater treatment plant of Tan Tao IP for further
treatment to meet the QCVN 40: 2011/BTNMT (Column B). Treated wastewater
effluent then enters to sewage system to discharge to Nuoc Len Creek, which is
connected to Cho Dem River and Vam Co Dong River.
Status The project has entered operation, where a WWTP was constructed with a
capacity of 12,000 m3 per day.
Status of EIA The EIA of project has been approved by the local authority (DONRE) of Ho Chi
Minh City.
Detail of EMP
The business sectors must commit to preliminary treat raw wastewater to meet
the influent discharge requirement of central WWTP of Tan Tao IP.
Mitigation measures to treat wastewater generated from factories in Tan Tao IP:
Tan Tao IP (Original):
Wastewater from sewage system Collection tank Screen bar
Equalization Tank Aeration tank (biological tank) Clarifier Discharge
to Nuoc Len Creek
Tan Tao IP (Extension):
Wastewater from sewage system Collection tank Fine screen
Equalization Tank Neutralization tank Coagulation and flocculation tank
Physical sedimentation tank Mutech tank (activated sludge)
Disinfection tank Discharge to Nuoc Len Creek
According to the approved decision of the EIA report by Ho Chi Minh City
People‘s Committee - Department of Natural Resources and Environment
(DONRE), quality of treated wastewater must satisfy the Viet Nam
environmental standard of type A, QCVN 40: 2011/BTNMT (column A) before
discharge.
Assessment of
cumulative impact
Negative cumulative impact is assessed to be minimal as the WWTP can
accommodate wastewater generated from factories located in Tan Tao IP to meet
QCVN 40: 2011/BTNMT (column A) before discharge. However, if the
discharge cannot be monitored well in term of treatment performance, it can
cause negative impacts to receiving streams.
OP 4.12: Screening
of linked project
This is existing landfill established at nearly 20 years ago and it will not involve
any further civil works or any involuntary taking of land. Therefore it is noted
that this is not considered as linked project.

Environmental and Social Impact Assessment, HCMC Steering Center of the Urban
and Environmental and Social Management Plan Flood Control Program
Proposed HCMC Flood Risk Management Project Date Submitted: December 2, 2015
369
9.5.2. Screening of cumulative impacts generated from linked/ancillary projects
In order to estimate the significance of the impacts generated from linked/ancillary projects on
the projects, scoring need to be undertaken for each key factors defined in Section 1. There are
six key factors that can be directly or indirectly affected from linked/ancillary projects. Rules are
proposed in order to classify the significance of those impacts, including (+) imply for positive
impacts and (-) imply for negative impacts and scores 0, 1,2 and 3 referred as negligible, minor,
medium and significance. Overall score of each key factor is presented in Table 9.18. The
overall scores for key factors indicates that water quality, aquatic ecology and air quality are the
most affected key factors given they are directly influenced by the performance of linked
wastewater treatment plant and the WWTPs located within the catchment. Groundwater is
considered to be affected by the water quality of the Canal. However, the baseline indicates that
there are in non-proportional relationship between the surface water quality and groundwater
quality, but this in somehow can be affected with the significant change of surface water quality.
Therefore, it is of slightly lower score than the first three key factors. The public health is of the
most concern as it is directly closely affected by the environment factors. For business
development, following completion of the project, the local community will have more options
to develop their business along the upgraded Canal. However, their business opportunities can be
threaten if water quality of the Canal is affected negatively from low quality of effluent
discharge from the contributors.
Table 9.18 Screening of cumulative impacts generated from linked/ancillary projects
Key factor
Development Activities in Study Area
Overall
Score
DAPHUOC SOLID
WASTE
TREATMENT
COMPLEX
THAMLUONG-
BENCAT
WASTEWATER
TREATMENT
PLANT
TAN TAO
INDUSTRIA
L PARK
TANBINH
INDUSTRIA
L PARK
Water quality +2 ±3 ±3 ±3 ±3
Aquatic ecology +1 ±3 ±3 ±3 ±3
Air Quality +1 ±3 ±3 ±3 ±3
Groundwater +1 ±2 ±2 ±2 ±2
Public health 0 ±3 ±3 ±3 ±3
Business
development 0 ±2 ±2 ±2 ±2
9.6. Design mitigation measures
9.6.1. Objectives
The main goal of the in the Tham Luong Ben Cat Nuoc Len Channel restoration is to restore the
degraded reservoir to a level that can be permanently sustained through protection and
conservation. The water quality target should be in accordance with the quality of natural water
and without stresses that cause degradation, i.e. with a good ecosystem health, long-term stability

Environmental and Social Impact Assessment, HCMC Steering Center of the Urban
and Environmental and Social Management Plan Flood Control Program
Proposed HCMC Flood Risk Management Project Date Submitted: December 2, 2015
370
and sustainability. On the other hand the time needed to reach the restoration target depends first
of all on the residence time (RT), the shorter the RT, shorter will be the time to restore the
reservoir. It‘s especially true for a shallow channel.
The water quality management of the channel must be at first oriented to control eutrophication
and the external factors causing the increase of nutrient load. Restoration program is also
oriented to enhance the biodiversity of the channel. Fortunately, in the last decade, many good
experiments have been realized and many solutions are now available to control the
eutrophication by minimizing the nutrient inflows from the point sources and from the non-point
sources (NPS).
9.6.2. Cumulative impact from wastewater and drainage water pollution
Wastewater treatment engineering design has to bring solutions for the 3 issues with equal
emphasis: odour removal, main influent treatment and sludge disposal. Referring to the results
obtained in the previous section, we can conclude that by installing barriers at each end of the
channel, it will become a closed tank. Previously the rising and falling tide of the Saigon River
and Cho Dem River had a washing effect and allow a dilution of pollution in the channel. Tests
show that the central portion of the channel is much more contaminated than the remainder of
the channel. By closing the channel, this washing effect will disappear.
To reduce contamination of what will become a closed container, we believe that mitigation
measures are necessary.
As mitigation measures we recommend to:
1) Use the category A standard or more quality standard for discharging to the channel
2) Install the outfalls of WWTP at east side of Van Thuat sluice gate.
3) Develop districts with green infrastructure
4) Develop a strategic sanitation and drainage plan at a local scale.
9.6.3. Green Infrastructure
PMU should propose a strategic sanitation and drainage plan with Green Infrastructure. PMU
should establish what level of sanitation exists in each district, in terms of facilities, in terms of
institutions and in terms of the people‘s perspectives and the level of service expected. PMU
should proposed green approach in designing services. By introducing Green Infrastructures the
quality of storm water will be improved by a pre-filtration effect. LID (Low Impact
Development) measures are proposed.
LID is a multi-barrier approach that uses features at the lot, neighborhood, and watershed level to
maintain the on-site water balance (Gyurek, 2009). The proposed plan must integrate this multi-
barrier approach to reduce the water footprint in the development. This involves:
Designing strategies to provide quantity and quality control and enhancement of groundwater
recharge (through infiltration of runoff into the soil), retention or detention of runoff for

Environmental and Social Impact Assessment, HCMC Steering Center of the Urban
and Environmental and Social Management Plan Flood Control Program
Proposed HCMC Flood Risk Management Project Date Submitted: December 2, 2015
371
permanent storage or for later release, and pollutant settling and entrapment (by conveying
runoff slowly through vegetated swales and buffer strips or small wetlands). (Gyurek, 2009)
In the proposed approach, all LID features are introduced to maximize water quality. The
concept includes features such as rain gardens, bio-retention, and bio-swales. To integrate all
systems, it is necessary to protect canals on-site and to link all parts of the system with that water
body as the core.
LID Features are local infrastructures. There are numerous features to consider in the layout of a
LID, with features typically selected and arranged according to the topography and landscape of
the site. The LIDC proposes that the following features be incorporated into design.
9.6.3.1. Rain Gardens
Rain Gardens enhance local water quality by allowing water to be filtered naturally by soil
instead of being piped untreated into large bodies of water (LIDC 2011). A rain garden is a
landscaped garden in a shallow depression that receives the storm water from nearby impervious
surfaces, thereby recharging it (Dussailsant 2004). Beyond its environmental use, rain gardens
provide attractive landscaping and a natural habitat for birds, bees, and butterflies, while
encouraging environmental stewardship and community pride (LIDC 2011).
9.6.3.2. Street Storage
Street storage refers to the technology of temporarily storing storm water (in densely populated
urban areas) on the surface — on- and off-street — and, as needed, below the surface, close to
the source (Carr, Esposito & Walsh 2000). The use of street storage and catchment basins
reduces the rate of runoff entering storm sewer systems, reducing the required minimum size of
water mains conveying storm water pipes (LIDC 2011).
9.6.3.3. Bio-Retention
Bio-retention is an alternative to runoff treatment, acting on storm water before it is discharged
into waterways (Hsieh & Davis 2003). A landscaped island containing a curb inlet drains a large
area or street, channeling rainwater through a small pipe into a municipal storm drain system.
Bio-retention consists of porous media layers that can remove pollutants by infiltrating runoff
through mechanisms that include adsorption, precipitation, and filtration (Hsieh & Davis 2003).
9.6.3.4. Permeable Pavements
Permeable pavement systems restore soil infiltration functions in the urban landscape. These
systems are mainly composed of porous pavement systems in parking areas (LIDC). Permeable
pavements offer one solution to the problem of increased storm water runoff and the decreased
stream water quality associated with automobile usage (Brattebo & Booth 2003). Permeable
pavements with reservoir structures consisting of concrete paving stones offer the possibility for
decentralized, sustainable storm water management and source control in urban areas. Runoff
from streets and parking areas with low traffic densities can be infiltrated to support groundwater
recharge and to reduce hydraulic stress in sewer systems. Infiltration can help to return the urban
water cycle to its natural condition, increasing the level of groundwater (Dierkes et al. 2002).

Environmental and Social Impact Assessment, HCMC Steering Center of the Urban
and Environmental and Social Management Plan Flood Control Program
Proposed HCMC Flood Risk Management Project Date Submitted: December 2, 2015
372
9.6.3.5. Vegetated Roof Cover
Green roofs (roofs with a vegetated surface and substrate) provide ecosystem services in urban
areas, including improved storm water management, better regulation of building temperatures,
reduced urban heat island effects, and increased urban wildlife habitat (Oberndoofer et al. 2007).
The use of vegetation on a rooftop as an alternative to traditional roofing materials is an
increasingly utilized example of GI practice. The vegetation and growing media perform a
number of functions that improve environmental performance, including absorption of rainfall,
reduction of roof temperatures, improvement in ambient air quality, and the provision of urban
habitat (Carter & Keeler 2007).
9.6.3.6. Bioswales
Bioswales are broad ditches with gentle slopes. Swales are vegetated open channels designed to
accept sheet flow runoff and convey it in a broad shallow flow. Swales are used to reduce storm
water volume through infiltration, improve water quality through vegetative and soil filtration,
and reduce flow velocity by increasing channel roughness (Lukes & Kloss 2008). Bioswales can
take many forms. Generally, bioswales can be contained in approximately one per cent of the
land area draining into them. Since bioswales are linear, they work well along impermeable
surfaces such as roads and sidewalks (Wahl 2009).
9.6.3.7. Rainwater Harvesting
Rainwater harvesting, which involves the collection of rainwater from impervious surfaces and
storing it for later use, is a technique that has been used for millennia. Although, rainwater
harvesting has not been widely employed in industrialized societies, which rely primarily on
centralized water distribution systems, with the increasing recognition of the need to address the
problems of limited water resources and storm water pollution, and the emergence of green
building design, the role of rainwater harvesting in water supply is being reassessed (Kloss
2009).
9.6.3.8. Tertiary treatment
In addition to the site sizing to physically accommodate future treatment plant extensions, it is
necessary for the designer to include provisions to deal with the future expansion and /or process
changes. Onsite sewage additional treatment should be designed such that their capacity can be
increased and/or parallel facilities constructed without the need for major disruption of plant
operation. The layout and sizing of channels and plant piping should be such that additional
treatment units can be added in the future or increases in loading rates can be accommodated
hydraulically. The location of buildings and tanks should allow for the location of the next stages
of expansion. Buffer areas should be provided.
Treatment beyond the norm of secondary or equivalent level for various watersheds may be
necessary due to limited assimilation capacity and/or critical downstream uses being made of the
water receiving body. Some sewage treatment plants are required to meet more stringent
effluent quality requirements than associated with secondary treatment. The receiving water-

Environmental and Social Impact Assessment, HCMC Steering Center of the Urban
and Environmental and Social Management Plan Flood Control Program
Proposed HCMC Flood Risk Management Project Date Submitted: December 2, 2015
373
based effluent requirements are incorporated into the A and B QCVN 40:2011 and QCVN
14:2008 of BTNMT, as effluent compliance limits with appropriate effluent quality objectives in
terms of concentrations and loadings. Depending on the effluent requirements, there are a
number of suitable alternative sewage treatment processes that can be considered. In this case to
mitigate impact of load discharged into the main channel, a tertiary treatment should be added to
the proposed process.
Granular media filters may be used as an advanced treatment process for the removal of residual
TSS and Total-P from secondary effluent. Filters may be necessary where effluent
concentrations of less than 15 mg/L of TSS and/or 0,5 mg/L of Total-P need to be achieved. A
pre-treatment process such as chemical coagulation and sedimentation or other acceptable
process should precede the granular media filter units where effluent suspended solids
requirements are less than 10 mg/L.
In this case, provision for continuous backwashing up flow sand filters should be planned to
eliminate suspended solids in the effluent of WWTP. This will improve largely water quality in
the Channel.

Environmental and Social Impact Assessment, HCMC Steering Center of the Urban
and Environmental and Social Management Plan Flood Control Program
Proposed HCMC Flood Risk Management Project Date Submitted: December 2, 2015
374
ANNEX 10
SUMMARY OF DUE DILIGENCE REPORT ON THAM
LUONG-BEN CAT WASTEWATER TREATMENT
PLANT PROJECT (PHASE 1); SUMMARY OF DUE
DILIGENCE REPORT ON DRAINAGE SYSTEM AND
WATER ENVIRONMENT IMPROVEMENT OF THE
THAM LUONG-BEN CAT-NUOC LEN MAIN CANAL
PROJECT (PHASE 1)

Environmental and Social Impact Assessment, HCMC Steering Center of the Urban
and Environmental and Social Management Plan Flood Control Program
Proposed HCMC Flood Risk Management Project Date Submitted: December 2, 2015
375
10.1. Summary Of Due Diligence Report On Tham Luong - Ben Cat Wastewater
Treatment Plant Project (Phase 1)
The Government of Vietnam (GoV) requested a loan from the World Bank (WB) for the
implementation of Ho Chi Minh City Flood Risk Management Project (HCMCFRMP). Under
support of the WB, an integrated flood risk management approach for Ho Chi Minh City
(HCMC) is established to continually improve drainage systems, flood control and
environmental sanitation for the City, where a focal point will be a catchment of Tham Luong-
Ben Cat-Nuoc Len canal.
According to WB‘s requirements, resettlement caused by non-Bank-financed activities which are
critical to the design or performance of Bank project requires due diligence (DD) by the Bank7.
Activities causing resettlement are usually contemporaneous with the Bank investment. To
address the fact that these activities are not part of the WB project, the Bank applies a DD
approach. Following such policy requirements, the national project, Tham Luong-Ben Cat
Wastewater Treatment Plant (WWTP) Project (hereinafter referred to as the Project) was
identified as a link activity associated to the HCMC FRMP financed by WB. Therefore, a due
diligence review (DDR) was conducted in October 2015 for this Project.
The main purpose of this DDR is to verify whether the land acquisition was implemented in
accordance with the laws and regulations of the GoV, and to identify the gaps between the
regulations of the GoV and actual implementation. Furthermore, the DDR will assess the present
living standards as well as the level of livelihood restoration of the affected people (APs) after
land acquisition by the projects. In case, these due diligences conclude that the APs lack of
sustainable livelihood resources, additional support and rehabilitation measures to restore and
improve the incomes and living standards of the APs will be proposed to ensure that the
outcomes of the project in line with the policy objectives of the WB as described in the OP 4.12.
A number of research methods are carried out for the purpose of the DDR including desk review,
in-depth interview, group discussion, questionnaire survey, and field visit. Information presented
in the DDR are largely obtained from interviews of persons knowledgeable about the land
acquisition process of the two abovementioned national projects, including 7 affected households
(AHs) and 8 representatives of the local authorities, particularly from the District Compensation,
Assistance, and Resettlement Boards (DCARBs) and People‘s Committees at ward/commune
level. Desk review of detailed measurement survey (DMS) records and approved compensation
plans of the AHs augmented information gathered in the interviews.
The Tham Luong-Ben Cat WWTP is located at the Residential Group No. 2 in An Phu Dong
Ward, District 12, Ho Chi Minh City. The WWTP has a total area of 55,549.2 m2 with the design
capacity of 131,000 m3 a day-night in the first phase and 250,000 m
3 a day-night when
7 According to the Bank‘s OP 4.12 on Involuntary Resettlement, OP 4.12 applies to the projects that in
the judgment of the Bank are (a) directly and significantly related to the Bank-assisted project; (b)
necessary to achieve its objectives as set forth in the project documents; and (c) carried out, or planned to
be carried out, contemporaneously with the project (Para. 4).

Environmental and Social Impact Assessment, HCMC Steering Center of the Urban
and Environmental and Social Management Plan Flood Control Program
Proposed HCMC Flood Risk Management Project Date Submitted: December 2, 2015
376
completed. The civil work of the Project was commenced on April 26 2015 and is expected to be
completed in the first quarter of 2017.
According to the initial engineering design, the construction of the WWTP would require an
aggregate 136,119 m2 of land belonging to 241 households, including 67 households in the Phase
1 and 174 households in the Phase 2. In April 2015, the WWTP planning was adjusted by
reducing the plant area to 55,549.2 m2 including 23,173.7 m
2 for the plant campus in the Phase 1
and 32,375.5 m2 in the Phase 2. Accordingly, the number of PAHs have reduced to 67
households including 22 households in the Phase 1 and 45 households in the Phase 2.
The key findings of the DDR for the Tham Luong-Ben Cat WWTP Project are as follows:
1. The land acquisition and compensation payment process was carried out since 2010. The
compensation, assistance, and resettlement of the Project complied with the 2013 Land Law
and its associated decrees as well as the local decisions and policies issued by Ho Chi Minh
City People‘s Committee at that time, particularly Decision No. 35/2010/QD-UBND on
compensation, assistance, and resettlement in the area of HCMC. However, to date, only less
than half of the total number of PAHs have received compensation (30 households including
18 AHs of the Phase 1 and 12 AHs of the Phase 2) while 29 households still refuse to receive
compensation (4 AHs of the Phase 1 and 25 AHs of the Phase 2). For the remaining eight
households in the Phase 2, their compensation payment decisions are yet to be issued by the
local government.
2. Among the reasons for the outstanding issues related to compensation and resettlement are
the overlap in planning in the project area together with loose land management of the local
authorities and non-transparent, unofficial land transactions among households, which
contributed to hindering the land acquisition process. Particularly, the overlapping and
adjustment of planning have led to more complicated issues since several households already
received compensation and resettlement land at the relocation site although they are no
longer affected by the Project.
3. Low compensation rates, although based on independent valuation, did not meet the market
prices. In fact, even the compensation plus the whole assistance package (relocation
allowance, life stability support, etc.) together with preference in purchasing resettlement
houses (for legal users) could not meet the market prices for residential land in the area. This
is the main reason why several households refuse to receive compensation.
4. Information disclosure and consultation meetings were conducted for several times during
the project implementation process with the local authorities and residents in the project area.
However, during the design and planning process, there was no information provided for the
APs. Similarly, the dissemination activities were mostly one-way and focused on regulations
and policies applied by the Project. Information related to other supports such as income
restoration program was not provided for the APs. Therefore, although there are available
funds targeting the poor and APs whose land is acquired in the area, the interviewed APs are
not aware of them.

Environmental and Social Impact Assessment, HCMC Steering Center of the Urban
and Environmental and Social Management Plan Flood Control Program
Proposed HCMC Flood Risk Management Project Date Submitted: December 2, 2015
377
5. In the project area, land-based livelihood is not the main source of income of the PAHs. The
number of households dependent on agriculture in this area is rather small, only accounting
for about 5% of the total households in An Phu Dong. Therefore, the acquisition of
productive land did not severely affect the PAHs‘ incomes. Although the annual household
income of the interviewed households shows a slight increase; when being asked about
changes in living standards, 100% of the respondents assess that their living standards are
worse than pre-project level. Furthermore, their access to public services is also worse. This
can be explained by two main reasons: (i) only two out of seven interviewed households have
received compensation while the rest still refuse; and (ii) inflation rate in the recent years has
made people‘s lives more difficult in general. Nevertheless, it cannot be denied that the low
compensation and assistance rates have not enabled the APs to make decisive changes in
their lives.
6. Lastly, there is no formal policy regarding monitoring in the regulation of Vietnam. As a
result, there is no monitoring mechanism for the project impacts and restoration of income
and living standards of the APs. Information related to the relocated households who already
moved out of An Phu Dong Ward as well as their restoration ability cannot be assessed as the
Ward PC and Fatherland Front or WU do not have information related to them. The 15 PAHs
of the Phase 1 have moved out of An Phu Dong Ward and thus not being able to meet these
households has limited a deeper assessment of project‘s impacts on livelihoods as well as
income restoration level of the APs.
A corrective action plan is proposed for the abovementioned shortcomings vis-à-vis the
resettlement policies and regulations of the government and the way the DCARB carried out
land acquisition since 2010.
10.2. Summary Of Due Diligence Report On Drainage System And Water Environment
Improvement Of The Tham Luong-Ben Cat-Nuoc Len Main Canal Project (Phase
1)
The Government of Vietnam (GoV) requested a loan from the World Bank (WB) for the
implementation of Ho Chi Minh City Flood Risk Management Project (HCMCFRMP). Under
support of the WB, an integrated flood risk management approach for Ho Chi Minh City
(HCMC) is established to continually improve drainage systems, flood control and
environmental sanitation for the City, where a focal point will be a catchment of Tham Luong-
Ben Cat-Nuoc Len canal.
According to WB‘s requirements, resettlement caused by non-Bank-financed activities which are
critical to the design or performance of Bank project requires due diligence (DD) by the Bank8.
Activities causing resettlement are usually contemporaneous with the Bank investment. To
8 According to the Bank‘s OP 4.12 on Involuntary Resettlement, OP 4.12 applies to the projects that in
the judgment of the Bank are (a) directly and significantly related to the Bank-assisted project; (b)
necessary to achieve its objectives as set forth in the project documents; and (c) carried out, or planned to
be carried out, contemporaneously with the project (Para. 4).

Environmental and Social Impact Assessment, HCMC Steering Center of the Urban
and Environmental and Social Management Plan Flood Control Program
Proposed HCMC Flood Risk Management Project Date Submitted: December 2, 2015
378
address the fact that these activities are not part of the WB project, the Bank applies a DD
approach. Following such policy requirements, the national project, Drainage System and Water
Environment Improvement of the Tham Luong-Ben Cat-Nuoc Len Main Canal Project
(hereinafter referred to as the Project) is identified as associated to the HCMFRMP financed by
WB. Therefore, a due diligence review (DDR) was conducted in October 2015 for this Project.
The main purpose of this DDR is to verify whether the land acquisition was implemented in
accordance with the laws and regulations of the GoV, and to identify the gaps between the
regulations of the GoV and actual implementation. Furthermore, the DDR will assess the present
living standards as well as the level of livelihood restoration of the affected people (APs) after
land acquisition by the projects. In case, these due diligences conclude that the APs lack of
sustainable livelihood resources, additional support and rehabilitation measures to restore and
improve the incomes and living standards of the APs will be proposed to ensure that the
outcomes of the project in line with the policy objectives of the WB as described in the OP 4.12.
A number of research methods are carried out for the purpose of the DDR including desk review,
in-depth interview, group discussion, questionnaire survey, and field visit. Information presented
in the DDR are largely obtained from interviews of persons knowledgeable about the land
acquisition process of the two abovementioned national projects, including questionnaire survey
with 211 affected households (AHs) and interviews with 28 representatives of the local
authorities, particularly from the District Compensation, Assistance, and Resettlement Boards
(DCARBs) and People‘s Committees at ward/commune level. Desk review of detailed
measurement survey (DMS) records and approved compensation plans of the AHs augmented
information gathered in the interviews.
The Project consists of the dredging of an aggregate 32,714 meters of canal and rehabilitation
and construction of 134 sewers. The overall objective of the Project is to drain runoff water and
prevent flooding for residential areas, industrial zones, urban development, green space, and
garden house with the total basin area of 14,900 hectares. The project area covers 17 wards and
two communes belonging to eight districts of HCMC, namely District 8, Binh Tan, Tan Phu, Tan
Binh, District 12, Go Vap, Binh Thanh, and Binh Chanh. The Project‘s phase 1 requires the
acquisition of an aggregate 1,534,600 m2 belonging to 3,212 households and 46 organizations.
By land use, these comprise 309,527 m2 of residential land (20.1%); 238,822 m
2 of specially
used land (15.6%), and 986,251 m2 of agricultural land (64.3%). Among the total PAHs, 1,342
households are fully affected, thus have to relocate; of which, 654 households are eligible for
resettlement entitlements while 391 households are deemed ineligible. The remaining 1,870
households are partially affected; of which, 498 households are affected on a part of their houses
and have sufficient remaining area to reorganize (including production establishment/business
households).
The key findings of the DDR for the Tham Luong-Ben Cat-Nuoc Len Canal Project are as
follows:
Environmental and Social Impact Assessment, HCMC Steering Center of the Urban
and Environmental and Social Management Plan Flood Control Program
Proposed HCMC Flood Risk Management Project Date Submitted: December 2, 2015
379
1. To date, land acquisition activities in three districts, namely Binh Chanh, Tan Phu, and Binh
Thanh have been completed while the rest including Binh Tan, Tan Binh, District 12, and
Go Vap have not been finished. Of the total 3,212 households, 2,937 households,
accounting for 91.4%, have received compensation and handed over site to the Project. 268
AHs, or 8.3%, have not handed over site although 44 of them have already received
compensation. The compensation for 212 households who refuse to receive compensation
were deposited into bank accounts while the remaining 12 households (0.3%) are waiting
for compensation payment decisions to be issued by the local government.
2. Land acquisition and compensation process of the Project has been carried out since 2002
and thus undergone two revisions of the Land Law in 2003 and 2013. The compensation,
assistance, and resettlement of the Project are assessed as compliant with the 1993 and 2003
Land Laws and their associated decrees as well as the local decisions and policies issued by
Ho Chi Minh City People‘s Committee at that time. Particularly, the City‘s Directive No.
08/2002/CT-UBND has issued an important milestone, April 22 2002, which can be
considered as the ―cut-off date‖, to decide the eligibility of the APs for compensation for
their affected houses and structures.
3. Land acquisition and compensation activities of the Project are significantly delayed.
Specifically, the compensation plans for the AHs were prepared in 2002 and compensation
rates applied were issued in 1995. Then the compensation rates were adjusted one time in
2005 and remained the same until now. Such policy adjustments are only made when there
are too many complaints and objections from the APs to receive compensation and hand
over site to the Project. However, even these adjustments are not carried out in a timely
manner. Several recommendations of the DCARBs were proposed since 2007; however,
after 7 years, until 2014 did the City PC approve these proposals.
4. The resettlement site (RS), particularly Vinh Loc B, is not acceptable to several AHs. The
selection of the RS was not decided by the APs but implemented according to the city‘s
planning. Vinh Loc B RS in Vinh Loc Commune, Binh Chanh District, was developed
comprising 30 apartment buildings to arrange resettlement for the city‘s projects involved
land acquisition. However, the design of resettlement apartments is not suitable to the large-
size households and the use of corrugated iron roofs are not suitable to the weather.
Moreover, the RS is too far with little opportunity for economic development. Therefore, the
PAHs do not want to receive houses in the RS and refuse to hand over site although they
already received compensation. For those that were arranged to relocate here, the majority
of them live in other places while letting other people use or lease their allocated
apartments. Moreover, the RS of the Project does not meet a principle stipulated in the
Government‘s Decree No. 22/1998, which is the principle of equivalent value.
5. Information disclosure and consultation meetings were conducted for several times during
the project implementation process with the local authorities and residents in the project
area. However, during the design and planning process, there was no information provided
for the APs. Similarly, the dissemination activities were mostly one-way and focused on
regulations and policies applied by the Project. Information related to other supports such as

Environmental and Social Impact Assessment, HCMC Steering Center of the Urban
and Environmental and Social Management Plan Flood Control Program
Proposed HCMC Flood Risk Management Project Date Submitted: December 2, 2015
380
income restoration program was not provided for the APs. Therefore, although there are
available funds targeting the poor and APs whose land is acquired in the area, the
interviewed APs are not aware of them.
6. There are several outstanding complaints related to the Project. A total 687 written
complaints have been sent to the DCARBs; of which, 419 cases, or 61%, were resolved
while 268 complaints (39%) are yet to be solved. Most of the complaints lodged by APs are
related to (i) low compensation rates for affected land; and (ii) legal status of land.
7. In the project area, land-based livelihood is not the main source of income of the PAHs. The
number of households dependent on agriculture in this area is rather small. Therefore, the
acquisition of productive land do not severely affect the income and livelihoods of the AHs.
Like other national projects, the post-resettlement monitoring is not conducted as there is no
regulation as well as allocated budget for monitoring income restoration of the APs.
8. Accumulated impacts are identified for 25 households who are affected by both Phase 1 and
Phase 2 of this Project. Hence, special attention needs to be given to these households,
particularly in restoring their living standards.
Although the compensation, assistance, and resettlement activities of the Project are in compliant
with the national laws and government‘s regulations, it is not a good practice due to the
outstanding issues and delays of the Project, which is costly because the Project is not completed
and causes adverse social impacts. Hence, a corrective action plan is proposed for the
abovementioned shortcomings vis-à-vis the resettlement policies and regulations of the
government and the way the DCARBs carried out land acquisition since 2002. These corrective
actions must be completed by the end of June 2016 at the latest.

Environmental and Social Impact Assessment, HCMC Steering Center of the Urban
and Environmental and Social Management Plan Flood Control Program
Proposed HCMC Flood Risk Management Project Date Submitted: December 2, 2015
381


