
H.S.H.S.
1
Homologation test cycles worldwide
Status of the WLTP
Heinz Steven
13.04.2013
Green Global NCAP labelling / green
scoring Workshop, 30.04.2013
H.S.H.S.
Introduction
2
• Road vehicles have to comply with limit values for their
pollutant exhaust emissions and in future also for their CO2
emissions.
• The compliance with the limits is checked by test bench
measurements using standardised test cycles.
• For heavy duty vehicles the engines are tested on an engine
dynamometer test bench using normalised engine speed and
engine load cycles.
• Light duty vehicles and motorcycles are tested on a chassis
dynamometer test bench using standardised vehicle speed
cycles.
• For heavy duty vehicle engines and motorcycles worldwide
harmonised cycles (WHDC, WMTC) were developed under the
UN ECE WP29 umbrella and are currently transposed into
regional legislation (e.g. EU, Japan, USA).
H.S.H.S.
Introduction
3
• For light duty vehicles the development work for a worldwide
harmonised cycle (WLTP) and a corresponding test procedure
is currently performed and will be finalised in 2014.
• Two main elements are important for the measurement results:
The test cycle,
The test procedure
• The test cycle defines the driving schedule for the test in
terms of vehicle speed and gear use in case of manual
transmission vehicles.
• The test procedure defines the conditions of the vehicle in
terms of vehicle mass, road load, inertia, preconditioning,
temperatures etc.
• Within the WLTP both elements are significantly changed
compared to the current regional procedures, but this
presentation will focus on the test cycle.
H.S.H.S.
Worldwide test cycles for LDV
4
• The most important test cycles that are currently used for light
duty vehicle type approval are
NEDC,
FTP 75,
JC08.
• The NEDC is used in Europe, the low powered vehicle version
of this cycle is used in India. The FTP 75 cycle is used in the
USA and the JC08 in Japan.
• The NEDC is a synthetic cycle while the other two are derived
from real world in-use data.
• The EU commission plans to replace the NEDC by the WLTC in
future and base its CO2 legislation on the WLTC and its test
procedure.

H.S.H.S.
Development steps for the WLTC
5
• The development of the WLTC was carried out in the following
steps
Collection and analysis of in-use data from different
regions of the world,
Collection of in-use mileage statistics to be used for the
weighting of the in-use data,
Creation of the worldwide unified database,
Derivation of the WLTC from this database.
• The in-use data collected for the cycle development consists
of 451 000 km from Europe, 98 000 km from India, Japan and
Korea and 153 000 km from the USA.
• The major part of this data is M1 data but N1/M2 vehicles are
well represented with 96 000 km.
H.S.H.S.
Structure of the WLTC
6
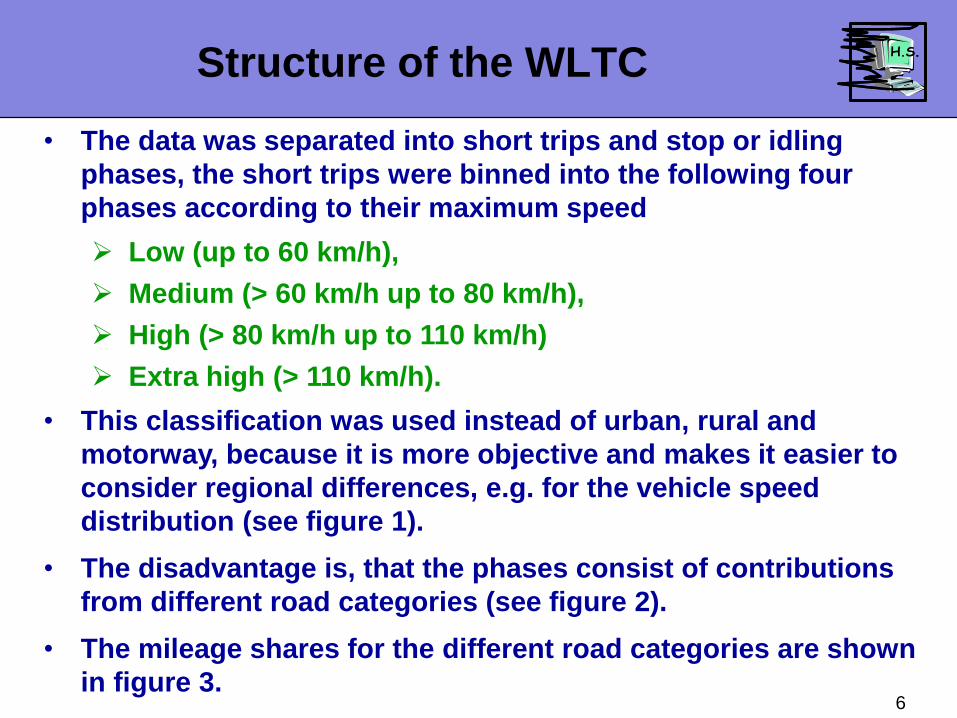
• The data was separated into short trips and stop or idling
phases, the short trips were binned into the following four
phases according to their maximum speed
Low (up to 60 km/h),
Medium (> 60 km/h up to 80 km/h),
High (> 80 km/h up to 110 km/h)
Extra high (> 110 km/h).
• This classification was used instead of urban, rural and
motorway, because it is more objective and makes it easier to
consider regional differences, e.g. for the vehicle speed
distribution (see figure 1).
• The disadvantage is, that the phases consist of contributions
from different road categories (see figure 2).
• The mileage shares for the different road categories are shown
in figure 3.

H.S.H.S.
0%
10%
20%
30%
40%
50%
60%
70%
80%
90%
100%
0 20 40 60 80 100 120 140 160
cum
fre
qu
en
cy
vehicle speed in km/h
Europe
USA
Japan
Korea
India
Vehicle speed distributions for
different regions/countries
7 Figure 1

H.S.H.S.
0.0% 0.0% 0.2%
32.9%
2.9%
19.2%
71.5%
55.0%
97.1%
80.7%
28.3%
12.0%
0%
10%
20%
30%
40%
50%
60%
70%
80%
90%
100%
low medium high extra high
mile
age
sh
are
urban
rural
motorway
mileage share
Comparison of road categorie shares of
the WLTC for the 4 speed classes
8
Figure 2

H.S.H.S.
42.4%37.3%
26.5%
45.9%
46.4%
58.7%
11.7%16.4% 14.8%
0%
10%
20%
30%
40%
50%
60%
70%
80%
90%
100%
WLTC, version 5 WLTP database Tremove
mile
age
sh
are
s
motorway
rural
urban
Comparison of road categorie shares of
the WLTC for the 4 speed classes
9
Figure 3

H.S.H.S.
Structure of the WLTC
10
• The WLTC has a total duration of 1800 s. The durations of the
four cycle phases are set in that way that it reflects the
mileage distribution of the database and thus no weighting
factors are necessary for the final result.
• The in-use database contains data for a broad variety of
vehicles with respect to rated power to kerb mass ratio (pmr),
ranging from 9 kW/t to 127 kW/t.
• The analysis of the in-use data showed that the driving
dynamics for vehicles with pmr > 34 kW/t is more influenced
by individual driving behaviour and traffic load rather than by
technical vehicle parameter, but that the driving dynamics
below this threshold decreases with decreasing pmr.
• This reflects the situation that the dynamics are limited by the
limited power availability.

H.S.H.S.
Structure of the WLTC
11
• Based on the analysis results the following three pmr classes
are defined:
Class 1, pmr <= 22 kW/t,
Class 2, 22 kW/t < pmr <= 34 kW/t,
Class 3, pmr > 34 kW/t.
• Cycles with different dynamics were developed for each
vehicle class, adjusted to the acceleration potential of the
vehicles.
• The key parameters of these cycles are shown in table 1.
• For Europe class 3 is of highest importance, at least for the
current vehicle stock.
• But class 2 vehicles might become more important in future,
especially in the context of electrified vehicles.

H.S.H.S.
Key parameters of the WLTC
12 Table 1
cycle
phaseduration
stop
durationdistance p_stop v_max
v_ave
without
stops
v_ave
with
stops
a_min a_maxa_pos
ave
v*a_pos
aveRPA
s s m km/h km/h km/h m/s² m/s² m/s² m²/s³ kWs/(kg*km)
low 589 156 3,095 26.5% 56.5 25.7 18.9 -1.47 1.47 0.47 3.04 0.2046
medium 433 48 4,756 11.1% 76.6 44.5 39.5 -1.49 1.57 0.42 4.36 0.1964
high 455 31 7,162 6.8% 97.4 60.8 56.7 -1.49 1.58 0.37 4.49 0.1322
extra high 323 7 8,254 2.2% 131.3 94.0 92.0 -1.21 1.03 0.30 6.21 0.1249
1800 242 23,266 53.8 46.5
low 589 155 3101 26.3% 51.4 25.7 19.0 -0.94 0.90 0.34 2.25 0.1605
medium 433 48 4737 11.1% 74.7 44.3 39.4 -0.93 0.96 0.30 3.24 0.1236
high 455 30 6792 6.6% 85.2 57.5 53.7 -1.11 0.85 0.22 3.19 0.1218
extra high 323 7 8019 2.2% 123.1 91.4 89.4 -1.06 0.65 0.21 4.00 0.0913
1800 240 22649 52.3 45.3
low 589 154 3330 26.1% 49.1 27.6 20.4 -1.00 0.76 0.22 1.26 0.0908
medium 433 48 4767 11.1% 64.4 44.6 39.6 -0.53 0.63 0.19 2.00 0.0743
1022 202 8098 35.6 28.5
class 3, version 5.3
class 2, version 2
class 1, version 2

H.S.H.S.
Structure of the WLTC
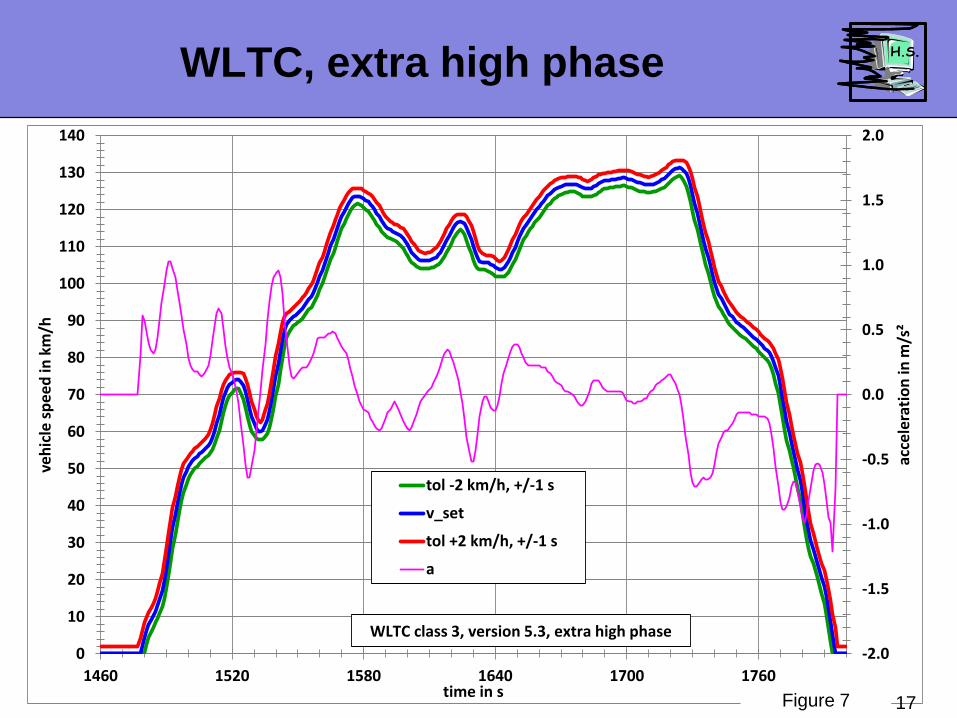
13
• In order to consider the special situation of kei cars in Japan,
two different versions of the class 3 cycle exist, version 5.1 to
be used for vehicles with v_max <= 120 km/h and version 5.3
for vehicles with v_max > 120 km/h.
• According to the importance for Europe, the presentation is
restricted to the WLTC class 3 (version 5.3) cycle only.
• The driving pattern of this cycle is shown in figures 4 to 7.

H.S.H.S.
-2.0
-1.5
-1.0
-0.5
0.0
0.5
1.0
1.5
2.0
0
10
20
30
40
50
60
70
80
90
100
110
120
130
140
0 60 120 180 240 300 360 420 480 540
acce
lera
tio
n in
m/s
²
veh
icle
sp
ee
d in
km
/h
time in s
tol -2 km/h, +/-1 s
v_set
tol +2 km/h, +/-1 s
a
WLTC class 3, version 5.3, low phase
WLTC, low phase
14 Figure 4

H.S.H.S.
-2.0
-1.5
-1.0
-0.5
0.0
0.5
1.0
1.5
2.0
0
10
20
30
40
50
60
70
80
90
100
110
120
130
140
580 640 700 760 820 880 940 1000
acce
lera
tio
n in
m/s
²
veh
icle
sp
ee
d in
km
/h
time in s
tol -2 km/h, +/-1 s
v_set
tol +2 km/h, +/-1 s
a
WLTC class 3, version 5.3, medium phase
WLTC, medium phase
15 Figure 5

H.S.H.S.
-2.0
-1.5
-1.0
-0.5
0.0
0.5
1.0
1.5
2.0
0
10
20
30
40
50
60
70
80
90
100
110
120
130
140
1020 1080 1140 1200 1260 1320 1380 1440
acce
lera
tio
n in
m/s
²
veh
icle
sp
ee
d in
km
/h
time in s
tol -2 km/h, +/-1 s
v_set
tol +2 km/h, +/-1 s
a
WLTC class 3, version 5.3, high phase
WLTC, high phase
16 Figure 6
H.S.H.S.
-2.0
-1.5
-1.0
-0.5
0.0
0.5
1.0
1.5
2.0
0
10
20
30
40
50
60
70
80
90
100
110
120
130
140
1460 1520 1580 1640 1700 1760
acce
lera
tio
n in
m/s
²
veh
icle
sp
ee
d in
km
/h
time in s
tol -2 km/h, +/-1 s
v_set
tol +2 km/h, +/-1 s
a
WLTC class 3, version 5.3, extra high phase
WLTC, extra high phase
17 Figure 7
H.S.H.S.Comparison with NEDC, FTP 75 and
JC08
18
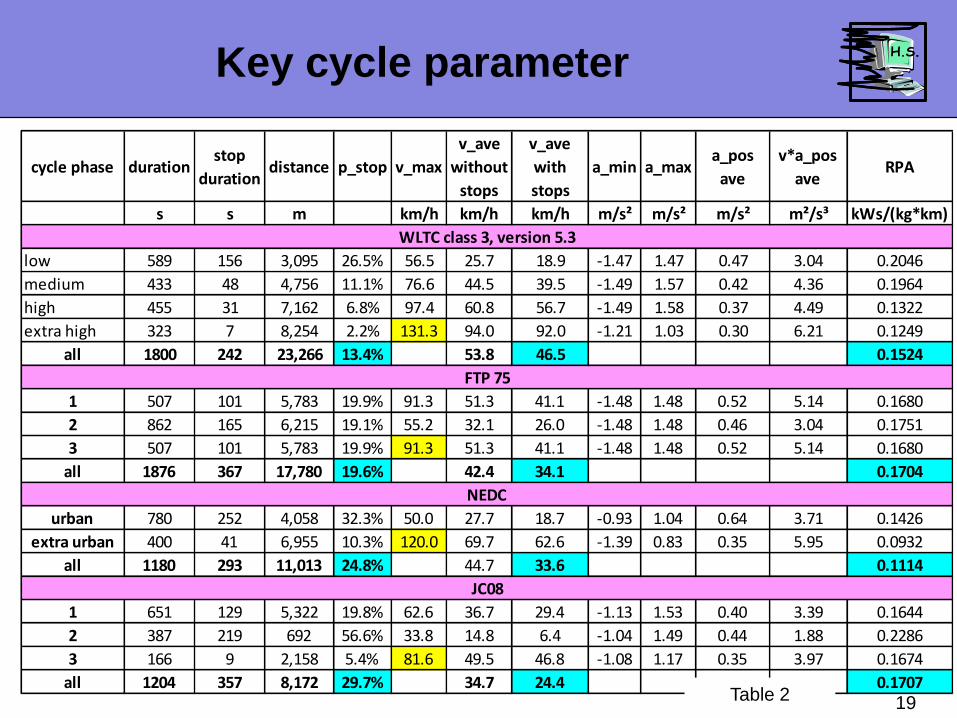
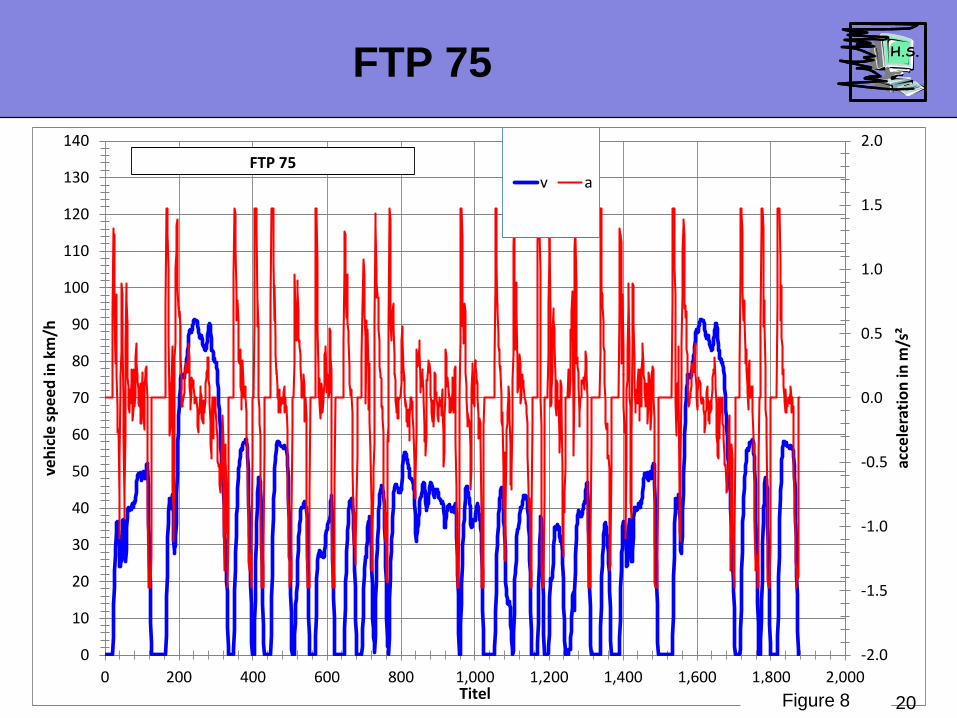
• Table 2 shows a comparison of the key cycle parameter for the
WLTC, class 3, version 5.3 and the currently used type
approval cycles FTP 75, NEDC and JC08.
• RPA is the relative positive acceleration. This is the sum of
v*a*dt for positive accelerations, divided by the cycle distance.
It can be interpreted as acceleration as well as specific
acceleration work. RPA is a good descriptor for the cycle
dynamics.
• The time pattern of the current type approval cycles are shown
in figures 8 to 10.
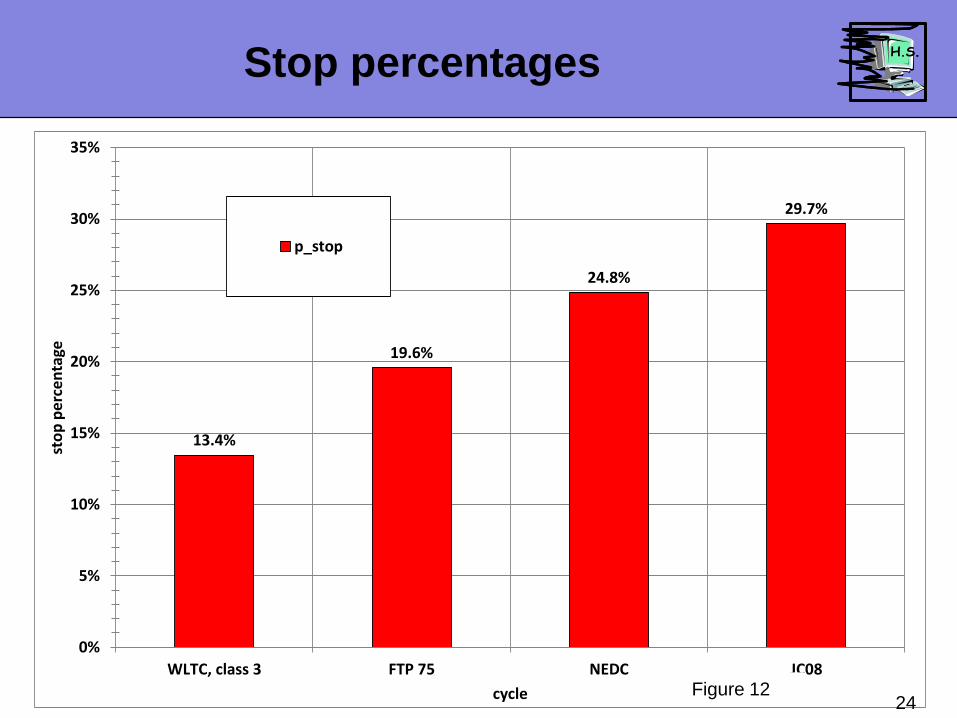
• The WLTC has lower stop percentages and higher speeds than
the other cycles (see figures 11 and 12), the JC08 is the other
extreme (highest stop percentages and lowest speeds.
• The NEDC has the lowest dynamics.
H.S.H.S.
cycle phase durationstop
durationdistance p_stop v_max
v_ave
without
stops
v_ave
with
stops
a_min a_maxa_pos
ave
v*a_pos
aveRPA
s s m km/h km/h km/h m/s² m/s² m/s² m²/s³ kWs/(kg*km)
low 589 156 3,095 26.5% 56.5 25.7 18.9 -1.47 1.47 0.47 3.04 0.2046
medium 433 48 4,756 11.1% 76.6 44.5 39.5 -1.49 1.57 0.42 4.36 0.1964
high 455 31 7,162 6.8% 97.4 60.8 56.7 -1.49 1.58 0.37 4.49 0.1322
extra high 323 7 8,254 2.2% 131.3 94.0 92.0 -1.21 1.03 0.30 6.21 0.1249
all 1800 242 23,266 13.4% 53.8 46.5 0.1524
1 507 101 5,783 19.9% 91.3 51.3 41.1 -1.48 1.48 0.52 5.14 0.1680
2 862 165 6,215 19.1% 55.2 32.1 26.0 -1.48 1.48 0.46 3.04 0.1751
3 507 101 5,783 19.9% 91.3 51.3 41.1 -1.48 1.48 0.52 5.14 0.1680
all 1876 367 17,780 19.6% 42.4 34.1 0.1704
urban 780 252 4,058 32.3% 50.0 27.7 18.7 -0.93 1.04 0.64 3.71 0.1426
extra urban 400 41 6,955 10.3% 120.0 69.7 62.6 -1.39 0.83 0.35 5.95 0.0932
all 1180 293 11,013 24.8% 44.7 33.6 0.1114
1 651 129 5,322 19.8% 62.6 36.7 29.4 -1.13 1.53 0.40 3.39 0.1644
2 387 219 692 56.6% 33.8 14.8 6.4 -1.04 1.49 0.44 1.88 0.2286
3 166 9 2,158 5.4% 81.6 49.5 46.8 -1.08 1.17 0.35 3.97 0.1674
all 1204 357 8,172 29.7% 34.7 24.4 0.1707
WLTC class 3, version 5.3
FTP 75
NEDC
JC08
Key cycle parameter
19 Table 2
H.S.H.S.
-2.0
-1.5
-1.0
-0.5
0.0
0.5
1.0
1.5
2.0
0
10
20
30
40
50
60
70
80
90
100
110
120
130
140
0 200 400 600 800 1,000 1,200 1,400 1,600 1,800 2,000
acce
lera
tio
n in
m/s
²
veh
icle
sp
ee
d in
km
/h
Titel
v aFTP 75
FTP 75
20 Figure 8

H.S.H.S.
-2.0
-1.5
-1.0
-0.5
0.0
0.5
1.0
1.5
2.0
0
10
20
30
40
50
60
70
80
90
100
110
120
130
140
0 300 600 900 1,200
acce
lera
tio
n in
m/s
²
veh
icle
sp
ee
d in
km
/h
Titel
v
a
NEDC
NEDC
21 Figure 9

H.S.H.S.
-2.0
-1.5
-1.0
-0.5
0.0
0.5
1.0
1.5
2.0
0
10
20
30
40
50
60
70
80
90
100
110
120
130
140
0 300 600 900 1,200
acce
lera
tio
n in
m/s
²
veh
icle
sp
ee
d in
km
/h
Titel
v
a
JC08
JC08
22 Figure 10

H.S.H.S.
46.5
34.1 33.6
24.4
131.3
91.3
120.0
81.6
0
20
40
60
80
100
120
140
WLTC, class 3 FTP 75 NEDC JC08
veh
icle
sp
ee
d in
km
/h
cycle
v_ave v_max
Average and maximum speeds
23 Figure 11
H.S.H.S.
13.4%
19.6%
24.8%
29.7%
0%
5%
10%
15%
20%
25%
30%
35%
WLTC, class 3 FTP 75 NEDC JC08
sto
p p
erc
en
tage
cycle
p_stop
Stop percentages
24 Figure 12

H.S.H.S.Comparison with NEDC, FTP 75 and
JC08
25
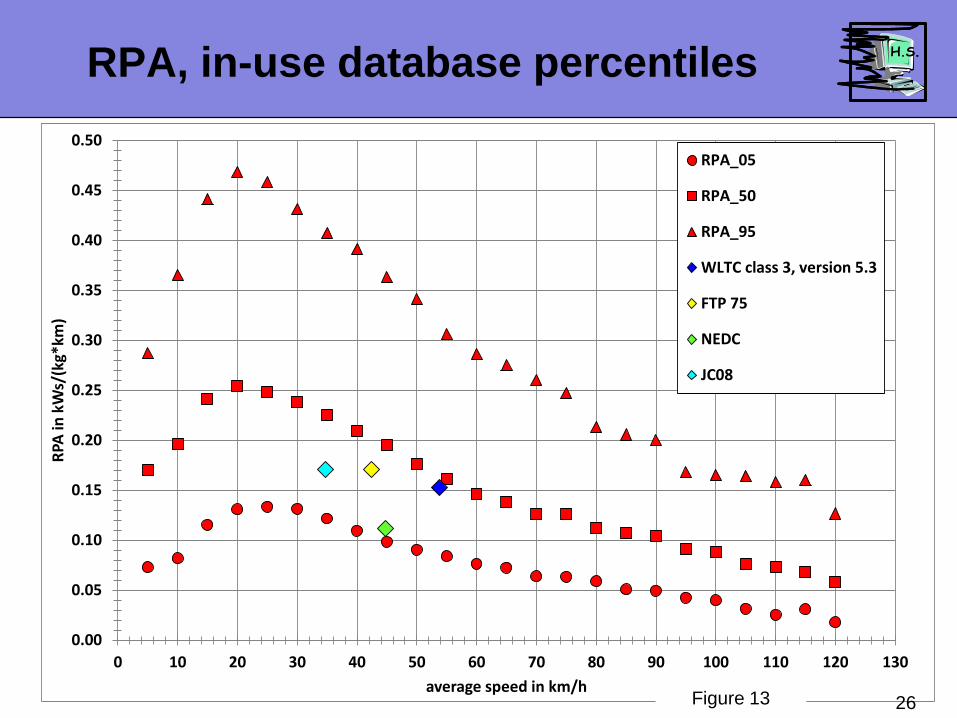
• The RPA values cannot be compared directly, they have to be
assessed together with the average speed of a cycle without
the stop phases.
• Figure 13 shows the percentiles (5%, 50% and 95%) of the RPA
values from all short trips of the EU in-use database as
function of the average speed of the short trips. The maxima
of these curves are located between 15 km/h and 25 km/h.
• For higher average speeds the RPA values decrease with
increasing speed.
• The RPA values of the different type approval cycles are also
shown. They are located between the 5% and 50% curves. The
WLTC is closest to the 50% curve, the NEDC is closest to the
5% curve, the values for the FTP 75 and JC08 are in between.
• This demonstrates that the WLTC has the highest and the
NEDC the lowest dynamics.
H.S.H.S.
0.00
0.05
0.10
0.15
0.20
0.25
0.30
0.35
0.40
0.45
0.50
0 10 20 30 40 50 60 70 80 90 100 110 120 130
RPA
in k
Ws/
(kg*
km)
average speed in km/h
RPA_05
RPA_50
RPA_95
WLTC class 3, version 5.3
FTP 75
NEDC
JC08
RPA, in-use database percentiles
26 Figure 13

H.S.H.S.Comparison with NEDC, FTP 75 and
JC08
27
• Figure 14 shows a comparison of the engine map coverage in
terms of normalised engine speed and engine power for
positive power values for a small Petrol car.
• Figure 15 shows corresponding results for a medium sized
Diesel car.
• For a better comparison the WLTP gearshift prescriptions
were used for all cycles.
• The engine speed range is correlated to the maximum cycle
speed; the JC08 has the lowest and the WLTC the highest
range.
• Concerning the engine load the NEDC is least and the WLTC
most demanding.

H.S.H.S.
0%
10%
20%
30%
40%
50%
60%
70%
80%
0% 10% 20% 30% 40% 50% 60% 70% 80% 90% 100%
P_n
orm
n_norm
P_norm_max
P_norm_res
P_norm_tot
veh 45, NEDC, rated power = 55 kW, v_max = 165 km/h
0%
10%
20%
30%
40%
50%
60%
70%
80%
0% 10% 20% 30% 40% 50% 60% 70% 80% 90% 100%
P_n
orm
n_norm
P_norm_max
P_norm_tot
P_norm_res
veh 45, WLTC 5.3, rated power = 55 kW, v_max = 165 km/h
Engine map comparison, small Petrol
car
28
Figure 14
0%
10%
20%
30%
40%
50%
60%
70%
80%
0% 10% 20% 30% 40% 50% 60% 70% 80% 90% 100%
P_n
orm
n_norm
P_norm_max
P_norm_res
P_norm_tot
veh 45, FTP 75, rated power = 55 kW, v_max = 165 km/h
0%
10%
20%
30%
40%
50%
60%
70%
80%
0% 10% 20% 30% 40% 50% 60% 70% 80% 90% 100%
P_n
orm
n_norm
P_norm_max
P_norm_res
P_norm_tot
veh 45, JC08, rated power = 55 kW, v_max = 165 km/h

H.S.H.S.
0%
10%
20%
30%
40%
50%
60%
70%
80%
0% 10% 20% 30% 40% 50% 60% 70% 80% 90% 100%
P_n
orm
n_norm
P_norm_max
P_norm_res
P_norm_tot
veh 43, NEDC, rated power = 85 kW, v_max = 184 km/h
Engine map comparison, medium
Diesel car
29
Figure 15
0%
10%
20%
30%
40%
50%
60%
70%
80%
0% 10% 20% 30% 40% 50% 60% 70% 80% 90% 100%
P_n
orm
n_norm
P_norm_max
P_norm_tot
P_norm_res
veh 43, WLTC 5.3, rated power = 85 kW, v_max = 184 km/h
0%
10%
20%
30%
40%
50%
60%
70%
80%
0% 10% 20% 30% 40% 50% 60% 70% 80% 90% 100%
P_n
orm
n_norm
P_norm_max
P_norm_res
P_norm_tot
veh 43, FTP 75, rated power = 85 kW, v_max = 184 km/h
0%
10%
20%
30%
40%
50%
60%
70%
80%
0% 10% 20% 30% 40% 50% 60% 70% 80% 90% 100%
P_n
orm
n_norm
P_norm_max
P_norm_res
P_norm_tot
veh 43, JC08, rated power = 85 kW, v_max = 184 km/h

H.S.H.S.Comparison with NEDC, FTP 75 and
JC08
30
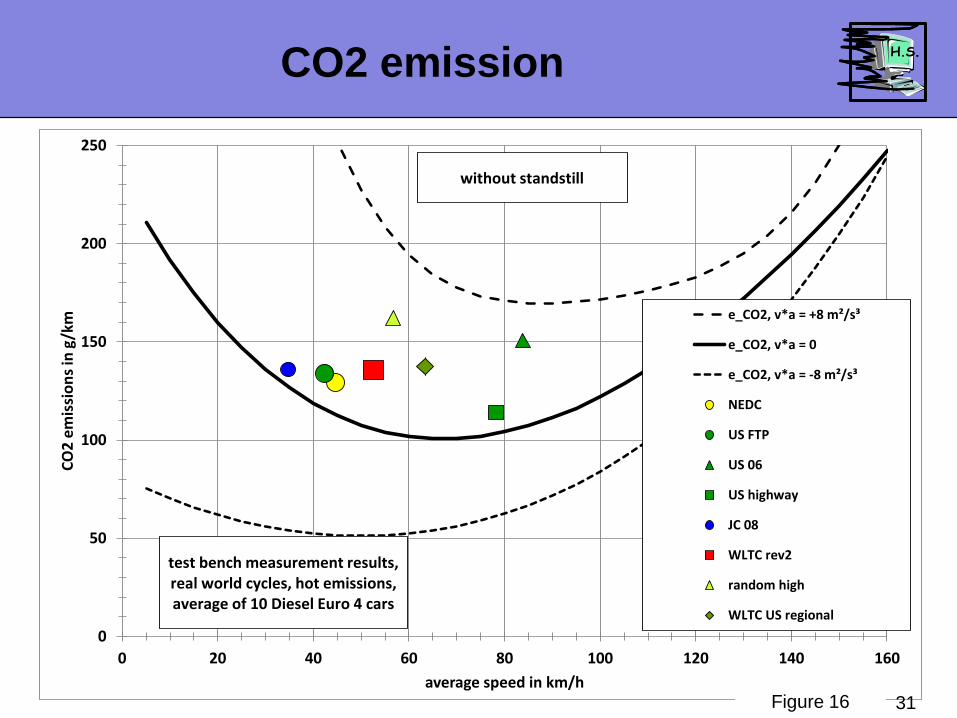
• First emission tests during the validation phases showed that
the CO2 emissions of the WLTC are close to those of the
NEDC, at least if the same side conditions in terms of test
mass and road load settings are used and although the WLTC
is much more dynamic than the NEDC.
• An explanation is given in figure 16, where the CO2 emissions
in g/km are displayed as function of average speed and the
dynamic parameter v*a. The solid curve (v*a = 0) represents
constant speed driving.
• The dotted curves represent deceleration and acceleration.
• The CO2 emissions for the discussed cycles are also shown.
• The WLTC emissions are further away from the constant
speed curve than the values for the other cycles, but the
average speed is closer to the area of minimum CO2
emissions (between 60 km/h and 80 km/h).
H.S.H.S.
0
50
100
150
200
250
0 20 40 60 80 100 120 140 160
CO
2 e
mis
sio
ns
in g
/km
average speed in km/h
e_CO2, v*a = +8 m²/s³
e_CO2, v*a = 0
e_CO2, v*a = -8 m²/s³
NEDC
US FTP
US 06
US highway
JC 08
WLTC rev2
random high
WLTC US regional
test bench measurement results, real world cycles, hot emissions, average of 10 Diesel Euro 4 cars
without standstill
CO2 emission
31 Figure 16

H.S.H.S.
Status of the WLTP
32
• The current status of the WLTP can be summarised as follows:
• The cycle development phase is completed.
• The current discussions in the DHC subgroup (cycle
development group) focus on the remaining issue, how to
proceed with vehicles that cannot follow the cycle trace within
the tolerances.
• For class 2 and class 3 vehicles this problem is exclusively
related to the extra high speed phase.
• The author has proposed to solve this problem by
downscaling of those extra high speed sections that cause
high power demand (see figure 17).

H.S.H.S.
-4.5
-4.0
-3.5
-3.0
-2.5
-2.0
-1.5
-1.0
-0.5
0.0
0.5
1.0
1.5
2.0
2.5
0
10
20
30
40
50
60
70
80
90
100
110
120
130
140
1,500 1,560 1,620 1,680 1,740 1,800
de
lta
v in
km
/h
veh
icle
sp
ee
d in
km
/h
time in s
v_downscale
v
tol_min
tol_max
v_orig
delta v
JRC, veh 2, RL medium N1 ave, 9.8% DSC, rated power = 63 kW, v_max = 137 km/h
Downscaling example
33 Figure 17

H.S.H.S.
Status of the WLTP
34
• The DTP subgroup (test procedure development group) has
already reached agreements about the test mass and the road
load settings in principle, but some details still need to be
resolved.
• The modifications will lead to higher test mass and driving
resistances so that the CO2 emissions will be higher
compared to the current test conditions.

H.S.H.S.
End
35
• Thank you for your attention!


