

1
A report prepared for the Energy Efficiency and Conservation Authority (EECA)
by Energy Cultures researchers Dr Miranda Mirosa, Daniel Gnoth, Prof. Rob
Lawson and Dr Janet Stephenson
November, 2010
Centre for the Study of Agriculture, Food and Environment (CSAFE) │ Kā Rakahau o te Ao Tūroa,
University of Otago │ Te Whare Wānanga o Otāgo, PO Box 56, Dunedin 9054 New Zealand
t: +64 (0)3 479 3928 e: [email protected]
Characteristics of
Household Energy
Behaviours

2
Executive Summary The specific aims of this research were to:
Develop an improved understanding of the drivers of energy-related behaviours amongst
Thorndon and Wadestown residents.
To identify the variability in householder values, energy practices and energy-related
technologies relating to household hot water and space heating.
To identify opportunities for promoting energy-efficient behaviour change.
Twenty three household energy-saving behaviours were investigated through face-to-face interviews,
using laddering methods designed to uncover rationalisations for action as well as the underlying values.
Household surveys provided detailed data on how residents use and understand energy.
Key findings are:
Behaviours are influenced by many drivers, and personal values often are not a good predictor
of behaviour.
Respondents often could not articulate any values relating to a given behaviour. This was
particularly marked with inefficient energy behaviours.
The four values of Being Capable, Being Intelligent, Protecting the Environment and Enjoying Life
are most strongly aligned with energy-efficient behaviours. However behaviour may at times be
inconsistent with values, or values may drive energy-inefficient behaviours.
The most common rationalisations of energy-related behaviours are that they are economically
efficient, followed by situational constraints or opportunities. Environmental efficiency and
inconvenience are also common rationalisations.
Rationalisations provide insights into the direct drivers and barriers to behaviour change, and
these differ greatly between specific behaviours.
The Thorndon-Wadestown households are relatively wealthy, and lack of finance is not an
important determinant of most of their energy behaviours. Participants were conscious of their
energy use and many actively pursued easy and low cost energy-saving behaviours such as
pulling curtains.
Norms of comfort associated with household heating are changing, with smaller electrical
appliances like towel rails and dehumidifiers being abandoned in favour of larger heat pump
technologies.
A substantial proportion of households use gas water heating. Where electric hot water
cylinders are in use, many of those that are more than ten years old do not have extra insulation
wrapping as recommended by EECA.
The reasonably high levels of sunshine most households receive offers an opportunity to
improve the uptake of solar hot water heating systems in this area.

3
There is a strong willingness and desire to move to more efficient behaviours – particularly for
energy-efficient investments.
There is surprisingly low take-up even of some very simple actions such as wrapping hot water
cylinders, energy-efficient light bulbs or sealing drafts – activities that cost little but may seem
just too difficult if households are time-poor.
Fifteen percent would like to change their main method of heating, and most of these currently
heat their homes with inefficient and/or carbon-generating technologies.
Overall the results indicate a strong willingness by householders to become more energy-
efficient amongst the vast majority of respondents (almost 90%).
A large number of households are thus well-positioned to make a change to more energy-
efficient behaviours, but are not doing so.
Most respondents feel it is not hard to find information about being energy efficient, and are
well aware of sources of knowledge, although some sources were clearly more useful than
others. Not knowing what information to trust, and finding it difficult to make choices, are
problems for at least a quarter of households.
Although consumers appear to have the efficacy and some knowledge, as well as the financial
means to make the right decisions in terms of energy efficiency, they are still reluctant to make
larger energy-saving investments and lifestyle changes.
Reasons for not taking action vary considerably. This reinforces the need to craft different
approaches towards promoting efficiency will be needed for different households.
Conversations about energy, and sharing of energy-efficiency experiences and knowledge, are
occurring regularly in the community.
High-level recommendations:
EECA should align marketing campaigns with values that appear to be most closely and
consistently associated with energy-efficient behaviour - in particular Being Capable, Being
Intelligent, Protecting the Environment and Enjoying Life. EECA should focus on addressing the
obstacles that prevent people from acting in energy-efficient ways that are consistent with their
values.
Understanding people’s rationalisations for behaviour are likely to be more relevant than values
in seeking to identify appropriate interventions. Identifying the most common rationalisations
for given behaviours, as outlined in the report, will assist in crafting behaviour-specific
interventions.
Given the relative lack of financial constraints in the Thorndon-Wadestown area, the evident
willingness and ability to act, and significant opportunities for change, we suggest EECA
develops a program that creates situational opportunities, requires relatively little time and
effort by householders, and helps them make choices with trustworthy information.
EECA could potentially make a big difference in community efficacy levels by tapping into
unofficial but expert ‘efficiency leaders’, and supporting these people in their key roles of
sharing knowledge and experiences.

4
Contents 1 Introduction ..................................................................................... Error! Bookmark not defined.
1.1 Background to Research ........................................................................................................... 6
1.2 The Thorndon-Wadestown research ........................................................................................ 7
2 Methodology ............................................................................................................................ 10
2.1 Part 1: ‘Laddering’ Interviews ................................................................................................. 10
2.2 Part 2: The Household Energy Survey ..................................................................................... 12
3 Findings .................................................................................................................................... 13
3.1 Part 1: Laddering .................................................................................................................... 13
3.1.1 Rationalisations .............................................................................................................. 14
3.1.2 Values ............................................................................................................................ 16
3.2 Part 2: The Household Energy Survey ..................................................................................... 24
3.2.1 Survey Statistics.............................................................................................................. 24
4 Conclusions and Preliminary Policy Implications ........................................................................ 44
5 References ............................................................................................................................... 48
6 Appendices............................................................................................................................... 49
6.1 Appendix A: Information Sheet for Interview Respondents .................................................... 49
6.2 Appendix B: Consent Form for Respondents .......................................................................... 51
6.3 Appendix C: Interview Template............................................................................................. 52
6.4 Appendix D: Coding Sheets..................................................................................................... 55
6.5 Appendix E: Information Sheet for the Survey ........................................................................ 57
6.6 Appendix F: The Paper Based Survey ...................................................................................... 59
6.7 Appendix G: Explanation of Rationalisations with Exemplar Quotes ...................................... 70
6.8 Appendix H: Explanation of Values with Exemplar Quotes ...................................................... 73
6.9 Appendix I: The Means End Chains ......................................................................................... 77

5
Figures and Tables Figure 1: Thorndon-Tinakori Rd Area Unit ................................................................................................ 7
Figure 2: Wadestown Area Unit ............................................................................................................... 8
Table 1: Ethnic Groups in Thorndon-Tinakori Road,Wadestow and the Wellington region, 2006 Census .. 9
Table 1: Summary of Energy-saving Behaviours and Investments .......................................................... 13
Table 2: Overall Frequency of Main Rationalisations Identified from Value Laddering Interviews ........... 14
Table 3: Frequency of Main Rationalisations (broken down into Positive and Negative Rationalisations)15
Table 4: Frequency of Main Values Identified from Value Laddering Interviews ..................................... 16
Table 5: Frequency of Main Values (Broken Down into Positive and Negative Responses) ..................... 17
Figure 1: Means-end Chains for Q1 ........................................................................................................ 19
Figure 2: Means-end Chains for Q18 ...................................................................................................... 21
Figure 3: Age Distribution of Respondents ............................................................................................. 24
Figure 4: Income Distribution for the Household (Before Tax) ................................................................ 25
Figure 5: Work Status ............................................................................................................................ 25
Figure 6: Home Ownership Status .......................................................................................................... 26
Figure 7: Approximate Summer and Winter Energy Costs ...................................................................... 27
Figure 8: Year Dwelling Was Built .......................................................................................................... 27
Figure 9: Number of Bedrooms .............................................................................................................. 28
Table 8: Proportion of Heating Appliances that Participants Have and Use ............................................ 28
Table 9: Main Heat Source .................................................................................................................... 29
Table 10: Overall Satisfaction with Main Method of Heating.................................................................. 30
Table 11: Satisfaction with Main Method of Heating Broken Down by Type of Heating .......................... 30
Table 12: Extra Hot Water Cylinder Insulation on Older Cylinders .......................................................... 31
Figure 10: Main Methods for Heating Water.......................................................................................... 32
Figure 11: Number of Unused Appliances in the Household ................................................................... 33
Figure 12: Proportion of Commonly Used Household Appliances ........................................................... 33
Figure 13: Frequency of Doing Certain Energy Related Behaviours......................................................... 34
Figure 14: Energy Related Investments .................................................................................................. 35
Figure 15a: Energy Attitudes .................................................................................................................. 36
Figure 15b: Energy Efficacy .................................................................................................................... 37
Figure 16: Overall Energy Attitudes ....................................................................................................... 37
Table 13: Recent Energy Information Sources ........................................................................................ 38
Figure 17: Most Useful Information Sources .......................................................................................... 39
Table 14: Frequency of Energy Discussions with Friends/Neighbours ..................................................... 40
Table 15: Amount of Information Given in Energy Discussions with Friends/Neighbours ....................... 40
Table 16: How Many People Respondents Told about Conserving Energy (Last 6 Months) ..................... 40
Table 17: Compared with Friends, How Likely Respondents are to be asked About Energy Efficiency .... 41
Table 18: What Happens the Most in Discussions about Energy Use ...................................................... 41
Table 19: How Respondents are Used Overall in Discussions with Friends and Neighbours .................... 41
Figure 18: Extra Energy Use for Health Requirements ............................................................................ 42
Figure 19: Importance of a Range of Personal Values ............................................................................ 43

6
1 Introduction The aim of this research is to support EECA's work in promoting more energy-efficient household
behaviours. The critical importance of improved energy efficiency – using less energy to achieve the
same (or better) level of service – means that much of the investment required to mitigate future
climate change will be made by energy consumers, rather than suppliers. The International Energy
Agency has concluded that;
“A huge step-change in the attitudes to energy efficiency and consumer purchases by
hundreds of millions of people worldwide is needed. Governments, through information
provision, sound regulation and targeted fiscal incentives, have a key role to play in
ensuring that, worldwide, the right decisions are taken to safeguard the future of the
energy sector – and of the planet” (IEA, 2009).
There is significant potential in New Zealand to achieve greater efficiencies in energy use, as indicated
by the Government’s target to save 55PJ pa by 2015 (NZES/NZEECS 2010). A deeper understanding of
consumer behaviour and barriers to smart energy use could further refine EECA’s interventions and
support its mandate to promote energy efficiency and conservation.
It is clear from the literature, and from our own observations within the Energy Cultures research
programme, that there is surprising variability in energy-related behaviour, even across households or
firms with apparently similar characteristics. We suspect that the lack of achievement of potential
savings to date might in part arise from interventions being designed to influence an imaginary typical
consumer, rather than selected as ‘best fit’ for definable clusters of consumers or behaviours. This
research will help find some way to describe and characterise this heterogeneity, so as to be in a better
position to match interventions to the situation.
This research is aimed to support EECA in planning more targeted interventions to maximise uptake of
smarter energy use by consumers.
1.1 Background to Research This research is associated with a larger FRST-funded research programme, led by the University of
Otago. “Energy Cultures” is based on a conceptual framework that utilises systems and behavioural
theories, amongst others, to assist in understanding the factors that influence the energy decisions of
consumers and their impact on the adoption of more efficient energy practices within society
(Stephenson, et al., 2010). The Energy Cultures framework suggests that consumer energy behaviour
can be understood at its most fundamental level as the interactions between cognitive norms (e.g.
values, beliefs, and understandings), material culture (e.g. technologies, building form) and energy
practices (e.g. activities, processes). The research programme hypothesises that within New Zealand
there are clusters of households with identifiably different sets of norms, material culture and practices
relating to energy use (i.e. ‘energy cultures'). The research sets out to identify the characteristics of, and
influences on, different energy cultures to help to develop more effective interventions.

7
1.2 The Thorndon-Wadestown research The Energy Cultures programme initially set out to study three case study areas – Pakuranga in
Auckland, Cambridge in the Waikato and North-East Valley in Dunedin. EECA provided funding for
Energy Cultures to investigate an additional affluent urban area where both knowledge and financial
barriers to change were likely to be low.
The aims of the research were to:
Develop an improved understanding of the drivers of energy-related behaviours amongst
Thorndon and Wadestown residents.
To identify the variability in householder values, energy practices and energy-related
technologies relating to household hot water and space heating.
To identify opportunities for promoting energy-efficient behaviour change.
Note: Within this report, ‘behaviour’ refers to the combination of energy practices (actions relating to
energy use) and household investments in energy-related technologies.
The Thorndon-Wadestown case study area consists of two adjacent suburbs of Wellington, close to the
inner city, which appear in the NZ census as the Thorndon-Tinakori Rd Area Unit and the Wadestown
Area Unit (see Figures 1 & 2).
Figure 1: Thorndon-Tinakori Rd Area Unit (Source: Statistics New Zealand website http://apps.nowwhere.com.au/StatsNZ/Maps/default.aspx)

8
Figure 2: Wadestown Area Unit (Source: Statistics New Zealand website http://apps.nowwhere.com.au/StatsNZ/Maps/default.aspx)
According to the 2006 census data, 3,840 people usually live in the area of Thorndon-Tinakori Road,
0.9% of the Wellington region's population, and there were 1,896 occupied dwellings on census night.
For people aged 15 years and over, the median personal income is $45,100. This compares with a
median of $28,000 for the Wellington region overall, and $24,400 for NZ as a whole. The
unemployment rate in Thorndon is 2.5% for people aged 15 years and over, compared with 5.2% for the
Wellington region and 5.1% for New Zealand, and the most common occupational group in Thorndon is
'Professionals'. The ethnic make-up of the suburb differs from the Wellington region average, with
Europeans over-represented and Māori and Pacific peoples under-represented. In Thordon, only 31.6%
of households in private occupied dwellings own the dwelling, with or without a mortgage, which is
considerably below the 55.1% home ownership rate for the Wellington region. This suggests a relatively
high proportion of rented houses or flats.
The population in Wadestown on census night was 3,252 (0.7% of Wellington Region's population) in
1,251 occupied dwellings. Like Thorndon, the median income in Wadestown ($47,700) was considerably
higher than the Wellington average. The unemployment rate in Wadestown was 3.0% and, like

9
Thorndon, the most common occupational group were 'Professionals'. Another similarity between the
two suburbs was the overrepresentation of European residents. The home ownership rate in
Wadestown was higher than that in Thorndon, with 52.6% of households in private occupied dwellings
owning the dwelling, with or without a mortgage. Schools in both areas are all classified in the top
socio-economic decile to describe their catchment areas.
Table 1: Ethnic Groups in Thorndon-Tinakori Road, Wadestown and the Wellington region, 2006
Census
Thorndon-
Tinakori Rd %
Wadeston % Wellington
region %
European 76.9 83.1 69.8
Māori 5.6 4.6 12.8
Pacific peoples 1.7 1.2 8
Asian 10.0 4.2
Middle Eastern/Latin American/African 1.0 0.6
Other ethnicity 11.8 13.6
After comparative analysis of the demographic data for Wadestown and Thorndon, it was decided that
there were enough similarities between the two to treat them as one case study area. Although there
are some differences in household ownership and type, the incomes, employment and educational
backgrounds are similar.

10
2 Methodology The field research involved a two-part process. Part 1 sought to identify householder values and
behavioural rationalisations using a technique known as ‘laddering’. This is a qualitative method of
inquiry that uses semi-structured, in-depth interviews to probe deeply the reasons for behaviour.
Means-end chains are then constructed that display the associations between behaviours, the reasons
people give for their behaviours, and personal values (c.f. Reynolds & Gutman, 2001). Part 2 gathered
data on energy technologies, energy practices, values and energy literacy by means of a household
survey.
2.1 Part 1: ‘Laddering’ Interviews Initially, residents in Thorndon and Wadestown were contacted by randomly selecting numbers from
the telephone directory. A snowballing recruitment method was then employed which involved asking
the respondents at the end of the interview to pass on contact details for other Thorndon/Wadestown
residents. One participant was recruited via an intercept method in a local cafe. Twenty eight people
were interviewed in total. The data collection ceased once researchers reached saturation, i.e. when no
new values were being presented.
Two researchers attended each interview and these were conducted either in the respondents’ homes,
in a local cafe, or at the EECA offices. The duration of the interviews varied between 40 and 90 minutes.
At the start of the interview, respondents were asked to read an information sheet about the interview
(Appendix A) and then asked to sign a consent form (Appendix B). Twenty seven of the 28 interviews
were recorded on a digital voice recorder and the researchers also wrote notes throughout the
interview process. One interview was recorded as notes only). At the end of the interview, researchers
thanked the respondents and gave them $20 cash for their time.
The interview process (Appendix C) consisted of three sections. The first section asked questions about
12 possible energy-saving practices in the home. This included questions such as “do you reduce
heating in unoccupied rooms?” and “do you line dry laundry?” For each of these questions,
respondents were asked to give an answer on a scale of 1-5 (1=never, 2=rarely, 3=sometimes, 4=often,
and 5=always). The second section contained 11 questions about energy related investments which
included questions such as “how likely would you be to consider installing double glazing?” and “how
likely would you be to install energy efficient light bulbs?” Respondents were again asked to give an
answer from 1-5 (1=never, 2=unlikely, 3=would possibly consider, 4=would actively consider, and
5=already do). The list of items discussed with respondents in these two sections was derived from the
work of Barr and Gilg (2006; 2007), who carried out an extensive analysis of activities that could support
living a more sustainable lifestyle. For this study, those items related to energy efficiency were selected.
The third section asked about the interviewee’s demographics, the household and their electricity costs.
After each question in sections 1 and 2, the interviewer probed for the reasons for the answer given.
Why Questions such as “why do you do this?” or “why is that important to you?” were asked in order to
reveal motivations were for doing, or not doing, the energy-efficient behaviours.

11
The interviewees would generally give an immediate and often quite practical reason for their behaviour
(e.g. not using energy-efficient light bulbs because they felt the light was harsh). If probed further, they
would sometimes talk about a value that they associated with the behaviour (e.g. aesthetic value). In
the analysis, the immediate explanation for the behaviour is described as a ‘rationalisation’ of the
behaviour, and philosophical or belief-related comments are described as ‘values’.
All interviews were transcribed and then coded to identify rationalisations and values (see Appendix D)
using a formal text analysis method and the analytical software NVIVO. Three different people were
involved in devising the coding schema and coding the text: checks for consistency between coders were
undertaken to ensure inter-coder reliability.
The coding for values was guided by the work of Schwartz and Bilsky (1990). Their values classification
was chosen because it is the most widely validated measurement system for personal values, it provides
insights into how values are structured in relation to each other, and it allows for people to be aligned
with or opposed to a particular value.
Rationalisations were not predetermined – they were simply the patterns of responses that emerged
from the interview data, as discussed and agreed by the researchers.
For each interview, the text was coded to identify the rationalisations and values relating to each of the
12 questions about energy practices and 11 questions about energy investments. The relevant parts of
the responses were coded – sometimes a phrase but at other times a whole paragraph – to help ensure
the response remained in context. Although the coding was guided, if information did arise that did not
fit into one of the predetermined categories, researchers devised a new category. The examples given
in the Laddering Findings section of this report have been selected from the ‘pool’ of coded responses
because they best reflect the type of response coded into that category.
Once coding was complete, aggregate value-rationalisation-behaviour ladders were constructed. For
each behaviour, two sets of ladders were drawn: one ladder for negative responses (1&2 “never” and
“unlikely to consider”) and one ladder for positive responses (4&5 -“likely to consider” and “already
do”). Response 3 (“sometimes”) was omitted from this analysis in order to restrict comparisons to those
between positive and negative responses to energy efficient behaviours.
Devising the aggregate ladders involved identifying the rationalisations and values stated by all
respondents relating to a given behaviour, and assessing the relative frequencies of these. While NVIVO
could produce the aggregate number counts based on the coding, this data then needed to be exported
to EXCEL where the ladders were drawn manually using basic design tools.

12
2.2 Part 2: The Household Energy Survey The survey collected a wide range of information, including house and householder characteristics,
space and water heating, appliances and insulation, heating behaviours, recent changes in technologies
or behaviours, and asked where householders source their energy-related information (see Appendix F).
The survey format had been previously trialled in South Auckland, Waitati (Dunedin) and Brockville
(Dunedin), and since then had been revised as a result of discussions with Dr Sea Rotmann at EECA.
Survey delivery involved a combination of letterbox dropping and door knocking. Every third house on
all of the streets in these two suburbs received a paper version of the survey. In total 1100 surveys were
delivered which equates to 35% of all households in Thorndon and Wadestown. Of these,
approximately 350 were handed over to residents by the researchers, and the rest were left in
letterboxes. The purpose of delivering the surveys in person whenever possible was to increase the
response rate. To try and maximize the number of people that were home, researchers delivered
surveys during the weekends and at different times of the day, including evenings. Each survey had an
information sheet about the research (see Appendix E), which also gave people the option of filling out
the survey on-line.
The response rate was satisfactory at approximately 34%.
13
3 Findings
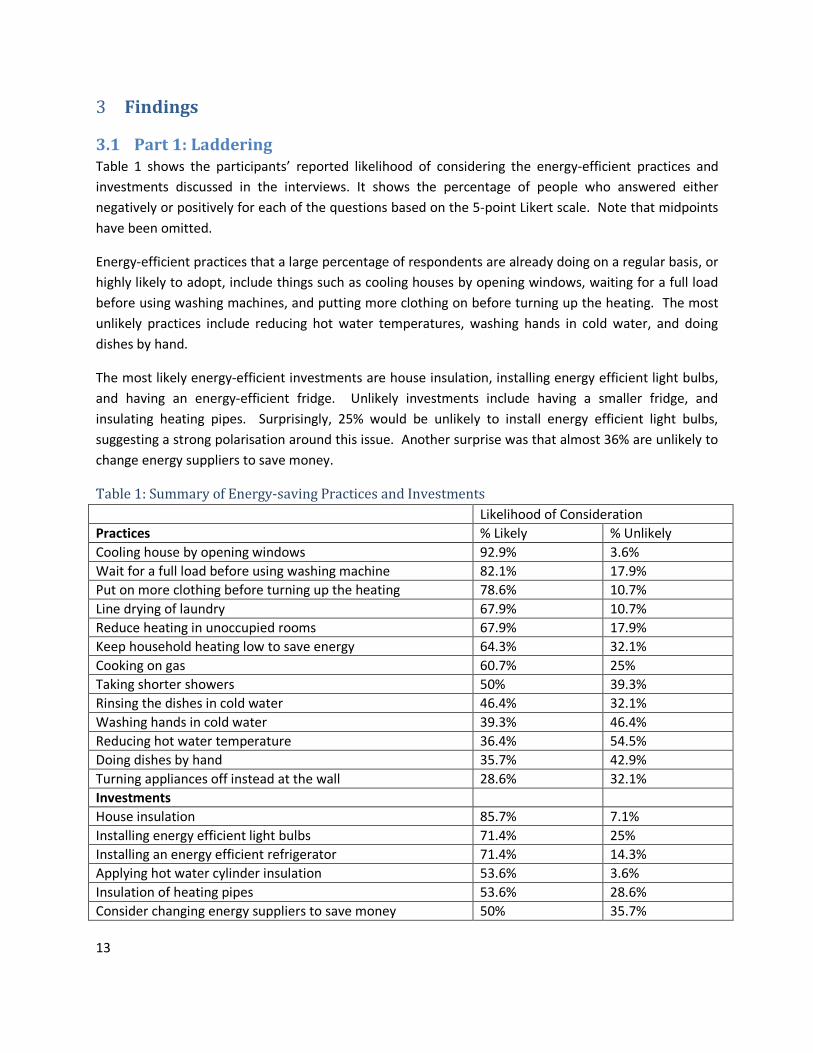
3.1 Part 1: Laddering Table 1 shows the participants’ reported likelihood of considering the energy-efficient practices and
investments discussed in the interviews. It shows the percentage of people who answered either
negatively or positively for each of the questions based on the 5-point Likert scale. Note that midpoints
have been omitted.
Energy-efficient practices that a large percentage of respondents are already doing on a regular basis, or
highly likely to adopt, include things such as cooling houses by opening windows, waiting for a full load
before using washing machines, and putting more clothing on before turning up the heating. The most
unlikely practices include reducing hot water temperatures, washing hands in cold water, and doing
dishes by hand.
The most likely energy-efficient investments are house insulation, installing energy efficient light bulbs,
and having an energy-efficient fridge. Unlikely investments include having a smaller fridge, and
insulating heating pipes. Surprisingly, 25% would be unlikely to install energy efficient light bulbs,
suggesting a strong polarisation around this issue. Another surprise was that almost 36% are unlikely to
change energy suppliers to save money.
Table 1: Summary of Energy-saving Practices and Investments
Likelihood of Consideration
% not interested or rarely done Practices % Likely % Unlikely
Cooling house by opening windows 92.9% 3.6%
Wait for a full load before using washing machine 82.1% 17.9%
Put on more clothing before turning up the heating 78.6% 10.7%
Line drying of laundry 67.9% 10.7%
Reduce heating in unoccupied rooms 67.9% 17.9%
Keep household heating low to save energy 64.3% 32.1%
Cooking on gas 60.7% 25%
Taking shorter showers 50% 39.3%
Rinsing the dishes in cold water 46.4% 32.1%
Washing hands in cold water 39.3% 46.4%
Reducing hot water temperature 36.4% 54.5%
Doing dishes by hand 35.7% 42.9%
Turning appliances off instead at the wall 28.6% 32.1%
Investments
House insulation 85.7% 7.1%
Installing energy efficient light bulbs 71.4% 25%
Installing an energy efficient refrigerator 71.4% 14.3%
Applying hot water cylinder insulation 53.6% 3.6%
Insulation of heating pipes 53.6% 28.6%
Consider changing energy suppliers to save money 50% 35.7%

14
Installing an energy-efficient heating system 50% 21.4%
Installing an energy efficient washing machine 50% 7.1%
Installing double glazing 46.4% 21.4%
Buying a smaller refrigerator 14.3% 82.1%
3.1.1 Rationalisations
Table 2 presents the main rationalisations of behaviours that were mentioned during the interviews,
and the frequency with which these were mentioned. Note that the ‘real’ reasons for certain behaviour
may be more complex and nuanced than the reason given by the interviewee, so these rationalisations
cannot be considered to be the only or even the main drivers of behaviour. Nevertheless the frequency
with which the same reasons are given by a range of interviewees to explain behaviours does give them
credibility.
While there were 27 different categories of rationalisations identified in the interviews, the top 10
accounted for approximately 80% of the responses. Appendix G explains the categories of
rationalisations and exemplar quotes are given to illustrate their meanings.
Tables 2 and 3 represent aggregations of the rationalisations that were given across all of the 23 energy-
related behavioural questions.
Table 2: Overall Frequency of Main Rationalisations Identified from Value Laddering Interviews
Rationalisation #
Situational Factors 206
Economic Efficiency 157
Convenience 136
Environmental Efficiency 88
Comfort 86
Conservation 79
Technological Factors 67
Time Efficiency 57
Physical Factors 45
Hygiene 33
Table 2 shows that the most common rationalisations for energy related behaviours overwhelmingly
involve situational factors. Economic efficiency and convenience are also important factors.
Environmental efficiency, comfort and conservation are also well-used rationalisations, but the first
three clearly dominate the responses. Interestingly, convenience ranks above comfort and environment
as a rationalisation for behaviour.
Reasons given for energy-related behaviours could involve either a positive or a negative response in
relation to any of these categories. For example, for the first rationalisation category (‘situational

15
factors’) responses people could explain their behaviours as a response to either a situational
opportunity or situational constraint. For example:
“Yes we have two refrigerators. Again it’s because of the number of people that live here... There is four
people, and various hangers on at various times” (Robberts)
“We have not swapped *to energy efficient light bulbs+ here because we are renting and it was a short
time rental, if we were renting here for longer I would have invested in them... “(Jackells)
Likewise with the second most common rationalisation ('economic efficiency') people could either
explain their behaviour as being economically efficient or as a perception that the possible alternative
was not economically efficient. Table 3 shows the results split into positive and negative rationalisation
categories.
Table 3: Frequency of Main Rationalisations (broken down into Positive and Negative
Rationalisations)
Positive rationalisation # Negative rationalisation #
Economically Efficient 132 Situational constraint 99
Situational opportunity 107 Not Convenient 78
Environmentally Efficient 80 Financial Constraint 36
Comfortable, Pleasurable 62 Technical Constraint 35
Convenient 58 Physical Constraint 32
Time Efficient 38 Not Hygienic 25
Financial Opportunity 32 Not Economically Efficient 25
Technical Opportunity 32 Not Comfortable, Not Pleasurable 24
Physical Opportunity 13 Not Time Efficient 19
Hygienic 8 Not Environmentally Efficient 8
Broken down this way, the most commonly-used positive rationalisation for energy behaviour is
economic efficiency, followed by situational opportunities. Environmental efficiency, convenience and
comfort are also relatively common rationalisations. For positive rationalisations, comfort and
convenience rank similarly.
The most commonly-used negative rationalisations for energy behaviours are situational constraints and
inconvenience. Financial, technical and physical constraints are also relatively commonly used. Unlike
positive rationalisations, inconvenience ranks well above discomfort.
Of particular interest is the unexpectedly low frequency of ‘financial constraint’, suggesting that the
inability to pay is not often the main driver for energy behaviours, for Thorndon-Wadestown
respondents at least. At the same time, economic efficiency is an important consideration for many.

16
It should be noted that Tables 2 & 3 contain the aggregated responses across all energy behaviours
(practices and investments). In section 3.1.2 and Appendix I a more detailed analysis is given, where the
rationalisations are linked to specific practices and investments.
3.1.2 Values
As noted previously, interviewees generally gave a practical rationalisation when first asked about a
behaviour, but when probed, they sometimes spoke of personal values that they felt underpinned their
practices or investments. These self-reported values cannot be assumed to ‘drive’ behaviour, as
research has shown that there are often poor linkages between values and behaviour (Barr & Gilg 2007).
However, it can be said is that the reported values are associated with the given behaviours (in those
respondents' minds at least).
Table 4 presents the main values that were elicited in the interviews and the number of times that each
of these values were mentioned. While three quarters (31 out of a possible 41) of the values from
Schwartz and Bilsky’s work were identified in the interviews, ten values accounted for approximately
70% of the responses. The top ten values are detailed in Appendix H, with exemplar quotes provided
to aid comprehension. Values identified fewer than 17 times have not been included in the table below
as they seemed to represent particular situations unique to individuals. While many of these individual
stories are very interesting, it is not possible to generalise these findings across the data set.
Table 4: Frequency of Main Values Identified from Value Laddering Interviews
Value #
Capable 153
Protecting the Environment 101
Pleasure 71
Intelligent 56
Clean 32
Respect for Tradition 22
Choosing own goals 21
Honouring Parents and Elders 20
Obedient 19
A meaning in life 17
These values were not only associated with energy-efficient behaviours, they were also used to justify
energy-inefficient behaviours. Table 5 details the relative frequency of these values. The left hand side
of the table shows the values that are associated with the likelihood to undertake energy-efficient
behaviours (positive behaviours). The right hand side of the table shows the values that are associated
with unlikelihood of energy-efficient behaviours (negative behaviours).

17
Table 5: Frequency of Main Values (Broken Down into Positive and Negative Responses)
Values associated with positive
responses (are doing, or are likely to do
energy efficient behaviours) #
Values associated with negative
responses (not doing or not likely to do
energy efficient behaviours) #
Capable 122 Capable 31
Protecting the Environment 92 Pleasure 24
Pleasure 47 Clean 21
Intelligent 42 Intelligent 14
Choosing own goals 18 Protecting the Environment 9
Respect for Tradition 17 Obedient 7
A meaning in life 14 Honouring Parents and Elders 6
Honouring Parents and Elders 14 Respect for Tradition 5
Obedient 12 A meaning in life 3
Influential 9 Choosing own goals 3
It is notable that values were far more frequently mentioned in relation to positive behaviours than with
negative behaviours. Values were frequently volunteered in relation to positive behaviours, but
respondents appeared to have much more difficulty articulating any underlying values behind negative
behaviours. Such behaviours may be largely habitual and not subject to much conscious consideration.
The relative scarcity of stated values associated with negative responses may also suggest that some
respondents are acting at odds with their values.
It is also of interest that the same values were associated with both positive and negative behaviours.
Nine of the top ten values associated with energy-efficient behaviours were the same as those
associated with energy-inefficient behaviours. Despite some variation in order, four of the top five
values are identical: 'Capable', 'Protecting the environment', 'Pleasure' and 'Intelligent'. However, values
could be used to justify different aspects of positive and negative behaviours. For example, where
‘Pleasure’ is cited as an obstacle to an energy efficient behaviour, it was often the physical pleasure of
having a long shower or washing hands and dishes in warm water that was discussed. In the cases
where ‘Pleasure’ was associated with an energy efficient behaviour, respondents talked about the
pleasure they got of doing something they knew was good for the environment, or from hanging out the
washing (e.g. gave them time to think while also getting fresh air). This will be discussed more fully
below in relation to specific behaviours.
The only value unique to positive behaviours was ‘Influential’. Here, respondents saw value in modeling
good behavior or feeling they were showing the way. The only value unique to negative behaviours was
‘Clean’. Some respondents felt it was not clean to undertake some of the positive behaviours - washing
dishes by hand, taking shorter showers, and washing hands and dishes with cold water.

18
3.1.3 Constructing ‘Ladders’
For each given behaviour discussed in interviews, it was possible to ‘map’ an individual’s explanation of
the reasons for the behaviour – the immediate rationalisation, and (if mentioned) the values they
associate with this behaviour. By compiling these responses across all respondents, aggregated ‘ladders’
of all of the rationalisations and values for a given behaviour are produced. Two ‘ladders’ (one for
negative behaviours and one for positive behaviours) have been constructed for all of the interview
questions. These are detailed in Appendix I.
It should be noted that these ladders cannot be claimed to represent the sole causes or drivers of
behaviour. Behaviour has many influences, some of which are able to be easily verbalised by
individuals, and others which may be unable to be articulated or even understood to be an influence.
Nevertheless, the ‘ladders’ do give useful insights into people’s rationalisations for their behaviour.
The chains for two questions – turning appliances off at the wall and buying energy-efficient light bulbs
– are presented below and discussed (Figure 1 and Figure 2). The titles on the left hand side of the
diagrams (B, R and V) represent the three levels of the ladders (B=Behaviour, R=Rationalisation,
V=Value). The thickness of the lines indicates the frequency with which the rationalisations or values
were reported.

19
Figure 1: Means-end Chains for Q1
Figure 1 shows the ladders for Question 1: “How often do you turn appliance off at the wall?” The top
ladder shows the aggregated responses of people who answered that they never or rarely did so
(negative behaviours). The bottom ladder shows the aggregated responses of people who responded
that they always or often did so (positive behaviours).
For negative behaviours, ‘Convenience’ is the most common rationalisation. Generally this was to do
with the time and effort involved and (for some appliances) the difficulty in physically reaching the off
switch. The following example typifies many of the responses: “It just seems to be a bit of a pain going
to put things on at the wall, particularly if things are hidden under the bench or things you know, are
Q1: How often do you turn appliances off at the wall? Key
Coded 3-5 times
Coded 6-8 times
Coded 9 or more times:
V Honoring Parents Capable
R Convenience Economics Habit Situation Safety
B
Never, Rarely
(1,2)
V
Protecting the
environment
R
Ecological
efficiency
Environmental
efficiencySafety
B
Often, Always
(4,5)

20
hard to get to” (Croft1). Some respondents rationalised their negative behaviours as a habit, or relating
to a specific situation.
‘Safety’ was given as a reason for both positive and negative behaviours. For example, one respondent
didn’t turn his appliances off because he perceived there to be no safety risk in leaving them on: “In my
country, Malaysia, you have to turn them off because when we have storm or thunder they can spark.
But the system in NZ is better” (Baaty). Other respondents perceived a safety risk in leaving appliances
on: “Because I think it’s safer. Televisions I have heard about have sort of burst into flames at times.
When I go out or at night when I go to bed I turn them off at the wall” (Baledoy).
Economic rationalisations were also given for both positive and negative behaviours. Some respondents
believed that not turning appliances off is either cheaper (“there’s no need to turn off at wall because…
the power has to go right back to the beginning before it comes in… meaning it goes little further and
might cost you little bit more” (Baaty)), or not saving sufficient money to make turning them off
worthwhile. Other respondents talked about cost saving as a main driver for switching off appliances -
“there’s no point in keeping things on when you are not using them and then paying money that you
don’t need to pay” (Ford).
The only rationalisation unique to positive behaviour (often or always turning appliances off at the wall)
was environmental efficiency. A typical response here was: “Just aware of waste of energy, it is in the
back of my mind…Well I’m just thinking of the future and just maintaining resources and things” (Finch).
Stated values related to negative behaviours were ‘Honouring parents’ and ‘Capable’. ‘Honouring
parents’ is illustrated by the following quote: “I don’t switch it *the stove+ off at the wall. I think because
I never been in a house where it's ever done like my mother, wherever I’ve stayed the stove always sort
of been left on. You just switch it on and you switch it off but you don’t touch it at the wall like, that’s
where I’ve you know sort of been brought and lived and I just carry on”(Shriff).
The ‘Capable’ value in this context was directly linked to economic arguments for leaving the appliances
on at the wall: “I should let you know that I’m an electrical engineer. A little while ago I bought a little
device that allows you to actually measure the currents from devices. And the only thing that I found
round here that uses significant power while it was turned, in standby mode was the relatively old Fisher
and Paykel washing machine. All the rest draw virtually nothing” (Forad).
The only value associated with positive behaviours was ‘Protection of the environment’
Overall, the most frequently cited rationalisation was that it is ‘convenient’ to leave appliances on at the
wall. To achieve a positive shift for this behaviour, addressing the ‘convenience ‘barrier’ would appear
to have the greatest likely effect. It would also be useful to promulgate accurate information about the
safety issues and energy-savings achieved from switching off at the wall.
1 Note that all respondents have been given pseudonyms to protect their privacy
21
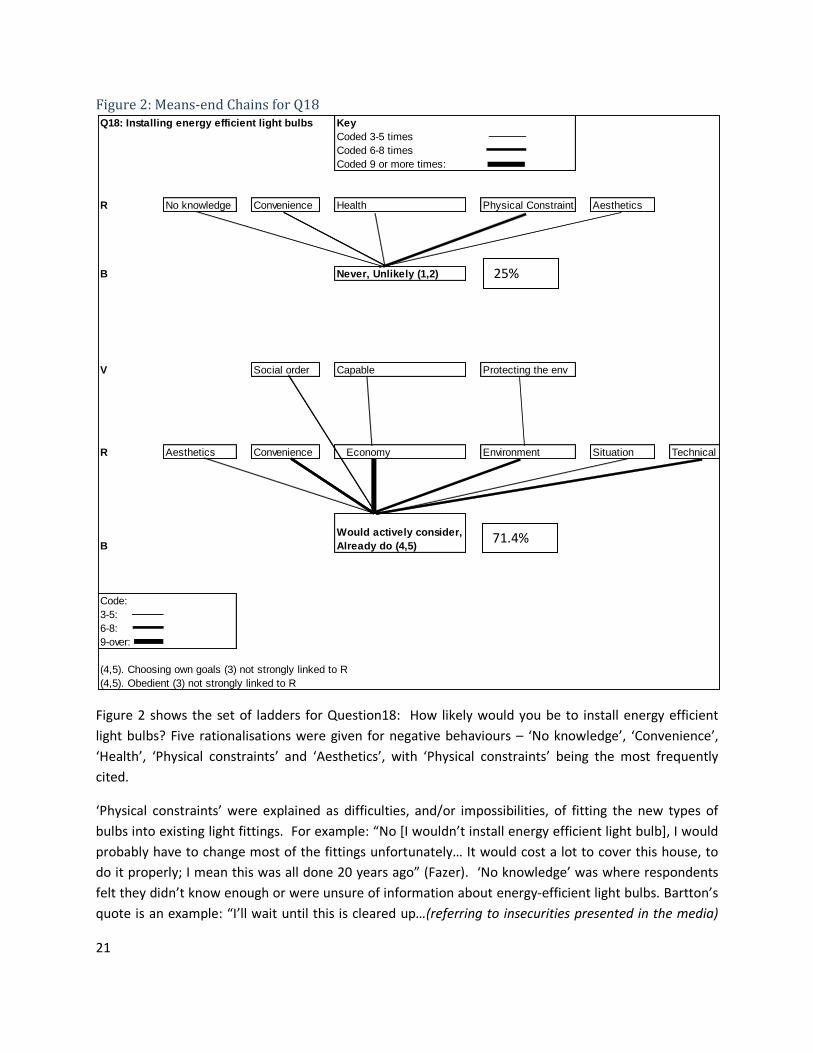
Figure 2: Means-end Chains for Q18
Figure 2 shows the set of ladders for Question18: How likely would you be to install energy efficient
light bulbs? Five rationalisations were given for negative behaviours – ‘No knowledge’, ‘Convenience’,
‘Health’, ‘Physical constraints’ and ‘Aesthetics’, with ‘Physical constraints’ being the most frequently
cited.
‘Physical constraints’ were explained as difficulties, and/or impossibilities, of fitting the new types of
bulbs into existing light fittings. For example: “No *I wouldn’t install energy efficient light bulb+, I would
probably have to change most of the fittings unfortunately… It would cost a lot to cover this house, to
do it properly; I mean this was all done 20 years ago” (Fazer). ‘No knowledge’ was where respondents
felt they didn’t know enough or were unsure of information about energy-efficient light bulbs. Bartton’s
quote is an example: “I’ll wait until this is cleared up…(referring to insecurities presented in the media)
Q18: Installing energy efficient light bulbs Key
Coded 3-5 times
Coded 6-8 times
Coded 9 or more times:
R No knowledge Convenience Health Physical Constraint Aesthetics
B Never, Unlikely (1,2)
V Social order Capable Protecting the env
R Aesthetics Convenience Economy Environment Situation Technical
B
Would actively consider,
Already do (4,5)
Code:
3-5:
6-8:
9-over:
(4,5). Choosing own goals (3) not strongly linked to R
(4,5). Obedient (3) not strongly linked to R
25%
71.4%

22
does it really save? Is it effective to employ?” ‘Convenience’ refers to the perceived hassle involved in
fitting and maintaining the bulbs; for example: “I don’t like those curly ones, I think they collect an awful
lot of dust you know, they must get quite dirty unless you take them out and clean them or something”
(Cairns). ‘Health’ reasons were related to the quality of the light “Oh they are very hard on the eye the
energy efficient ones, horrible... I found the light very difficult, it hurt my eyes” (Baledoy), or the
mercury in the bulbs “also the mercury that comes out if you break them” (Sabarsky). ‘Aesthetic’
concerns were about the actual look of the light bulbs. For example, when asked “would you consider
getting the energy efficient ones?” one respondent commented “have you seen how ugly they are?
Once again there are limits!” (Croft). No values were identified for the negative ladder.
For the positive ladder, six rationalisations were mentioned by respondents. Of these, ‘Economics’ was
overwhelmingly dominant, followed by ‘Convenience’, ‘Environment’, and ‘Technical’. Convenience and
cost often appeared to be linked in people’s minds. For example: “Oh well its cost long term and the
fact that you don’t have to keep changing them” (Hauston). ‘Environment’ was the rationalisation
where respondents believed that the energy-saving bulbs saved electricity and therefore was a better
alternative for environmental reasons e.g. “Finite resources, do not want to waste” (Simpson).
‘Technical’ in this case, referred to people being more willing to buy energy efficient light bulbs because
of advances in the technologies: “this is a new one *a new energy efficient bulb] it starts off the light
immediately” (Bielsty).
Of the less common rationalisations for positive behaviours, ‘Situation’ refers to situational
opportunities that arose to change the bulbs. For example, one respondent said: “whenever I replace
them [the bulbs] I replace them with energy efficient light bulbs” (Bielsty). Rather than rushing out and
just replacing all the bulbs in the house, many people were willing to change bulbs only as the old ones
blew. ‘Aesthetics’ is interesting because it came up as a rationalisation for both the negative and the
positive ladder. This respondent’s comment sums up this mixed result: “I don’t agree that they are
ugly, I think beauty is in the eye of the beholder” (Barchi).
Three values were prominent in this ladder. ‘Protecting the Environment’ is self explanatory. ‘Capable’
is where people felt that using energy efficient light bulbs supported being competent and efficient. A
number of respondents explained their positive behaviour on the basis of ‘Social order’ – a belief in the
previous government’s position that energy-efficient bulbs were better than the incandescent light
bulbs, and was working towards legislation that would ban their use. For example, one respondent said:
“I’m all for the Nanny state… Yes I wouldn’t mind the government [nudging you to do what is right for
you and for the environment] No I wouldn’t mind at all” (Heap). Interestingly, another respondent said
that although he thinks energy efficient light bulbs are “ugly actually” he does think that “they have got
to legislate, they should legislate…I prefer to use incandescent but they should have the right to legislate
against us using light bulbs if they think it’s going to be heaps savings for the country or whatever for
electricity or whatever cause” (Watkins).
These finding suggest that a behavioural shift towards greater adoption of energy efficient light bulbs
would best be supported by addressing the issue of the physical incompatibility of bulb design and light

23
fittings, and stressing their economical benefits and convenience. Information about the health aspects
and technical advances in energy-efficient bulbs may also assist in winning more converts.

24
3.2 Part 2: The Household Energy Survey The purpose of implementing the household survey was to understand how Thorndon and Wadestown
residents use energy in the home, to learn about their values and opinions regarding energy use, and to
gain insights into where they get their energy-related information and how they share this information.
The 49-question survey (Appendix F) gave a wealth of data, and the following sections report only on
some of the key findings from the data.
3.2.1 Survey Statistics
293 paper surveys and 76 online surveys were returned totalling 369 completed questionnaires. This is
a satisfactory response rate of approximately 34%.
3.2.1.1 Participant demographics
Respondents were spread across a range of ages (Figure 3) with approximately 15% of respondents
falling into the over 65 year-old category. With regards to gender, 43% of the total respondents were
males and 57% females. Half of respondents had a household income of over $120,000 (Figure 4). The
majority of respondents worked for someone else, either full-time or part-time (Figure 5). In terms of
ethnicity, 87% of respondents classify themselves as New Zealand (European descent), compared with
only 2% New Zealand (Māori) and 10% ‘Other’. This sample appears reasonably representative of the
Thorndon-Wadestown area units.
Figure 3: Age Distribution of Respondents
0
2
4
6
8
10
12
14
16
20 - 24 25 - 29 30 - 34 35-39 40 - 44 45 - 49 50 - 54 55 - 59 60 - 64 over 65
Pe
rce
nta
ge
Age

25
Figure 4: Income Distribution for the Household (Before Tax)
Figure 5: Work Status
0102030405060
Pe
rce
nta
ge
Income
0
10
20
30
40
50
60
working for someone
else full time
working for someone else part
time
self employed
do not work retired student full time home maker
Pe
rce
nta
ge
Work Status

26
3.2.1.2 Household Situation
There was a relatively even spread between home ownership status (Figure 6), with just slightly more
respondents owning their house debt-free (37%) than renting or owning a house with a mortgage (both
31%). The average time that people had been living in their house is 8.45 years, but with a considerabl4
difference between renters and home owners. The average time for those who rent from a private
owner was 1.95 years, compared to those who own debt free (15.8 years) or own with a mortgage (6
years).
Figure 6: Home Ownership Status
Figure 7 shows respondents’ estimates of their energy bills (total of electricity, gas, coal, wood) over the
summer and winter months. In summer, the most common total energy cost was $51-$100 per month
and in winter it was $101-$150 per month. The range of costs is very broad – from less than $50 in
winter for around 7% of households, to over $350 for around 4% of households.
0 5 10 15 20 25 30 35 40
rent from a private owner
own, debt free
own, with a mortgage
Percentage
Ho
ne
ow
ne
rsh
ip s
tatu
s

27
Figure 7: Approximate Summer and Winter Energy Costs
3.2.1.3 Dwelling Characteristics
Most respondents live in separate houses (64%), or flats/apartments (33%), most of which were built
before 1978 (Figure 8). The external walls of these dwellings are primarily (58%) timber or steel framing
(including those with brick veneer cladding), or otherwise concrete, brick or solid timber (39%). Two to
three bedroom houses predominate (Figure 9).
Figure 8: Year Dwelling Was Built
05
1015202530354045
Pe
rce
nt
Monthly Energy Costs
Summer
Winter
0
10
20
30
40
50
60
70
80
Before 1978 Between 1978-1999
After 2000 Don't know
Pe
rce
nta
ge
Year Built

28
Figure 9: Number of Bedrooms
3.2.1.4 Household Heating
Space heating is the main use of energy in households and thus invites the most focus from researchers
and policy makers. Forty percent of households can apply a temperature setting to their houses.
Thermostat settings range from 15-38 degrees, with an average of 20 degrees Celsius. This challenges
the myth that New Zealanders like to be cold – given the opportunity most of these householders
heated to a comfortable level (i.e. over 17 degrees). Table 8 shows that whilst 44% households have a
heat pump or gas central heating, a majority (59%) have and use portable electric heaters in the home.
The most common main heat sources were evenly split between gas central heating (19%), portable
electric heaters (19%), and heat pumps (18%) (Table 9). However many of the households used a variety
of heating methods (Table 8), with over half using at least one portable electric heater. Comparing
Tables 8 and 9, households that had a heat pump typically used it as the main heating method, as did
most of those who had an enclosed wood burner or a fixed gas heater. While 13% of respondents have
an open fire, only 1% reported using them as a main heat source.
Table 8: Heating Appliances that Participants Have and Use
Appliance % Have and use (rounded to nearest whole number
bar those under 1%)
Portable electric heaters 59
Heat pump 23
Gas heaters fixed in place 22
Central heating – gas (flued) 21
.0
5.0
10.0
15.0
20.0
25.0
30.0
35.0
40.0
0 1 2 3 4 5
Pe
rce
nta
ge
# of Bedrooms

29
Electric heaters fixed in place 16
Open fires 13
Enclosed wood burner 13
Portable gas heater 8
DVS or other heat transfer system 6
HRV or other ventilation system 5
Electric night-store 4
Central heating – electrical 1
Enclosed coal burner 0.33
Table 9: Main Heat Source
Appliance % (rounded to nearest whole number bar those under
1%)
Central heating – gas (flued) 19
Portable electric heaters 19
Heat pump 18
Gas heaters fixed in place 13
Enclosed wood burner 6
Electric heaters fixed in place 5
Portable gas heater 3
HRV or other ventilation system 3
Electric night-store 2
Open fires 1
Central heating – electrical 1
DVS or other heat transfer system 0.28

30
Table 10 shows respondents’ satisfaction with their main method of heating. While 15% were
dissatisfied with their current heating system and wanted to change it, the majority of respondents
were relatively happy with their main method of heating. Interestingly however, 50% either wanted to,
or would at least consider changing to ‘something better’.
Table 10: Overall Satisfaction with Main Method of Heating
I am happy with it and don’t want to change 48%
I like it but would like to get something better if the opportunity arose 35%
I am unhappy with my current method and want to get something else 15%
Table 11 breaks down the above results. Here we can see that those respondents who have a heat
pump, an enclosed wood or pellet burner, gas central heating, or electrical central heating tend to be
happier with their heating devices (and less likely to change) than those respondents who have
alternative methods of heating.
Table 11: Satisfaction with Main Method of Heating Broken Down by Type of Heating
main method of heating happy and don't want to change
like it but would get something better if opportunity or unhappy and want to get something else
heat pump 74% 26%
electric night storage 43% 57%
portable electric heaters 24% 76%
oil heater 18% 82%
fixed electric heaters 36% 64%
enclosed wood or pellet burner
53% 47%
open fires 33% 67%
portable gas heater 25% 75%
fixed gas heaters 47% 53%
gas central heating 75% 25%
electrical central heating 67% 33%
other 50% 50%

31
There is a good opportunity to work with the 15% who would like to improve their heating
system. Those with electric night store heaters, portable electric heaters, oil heaters, fixed
electric heaters, open fires and portable gas heaters are the most likely to want to change.
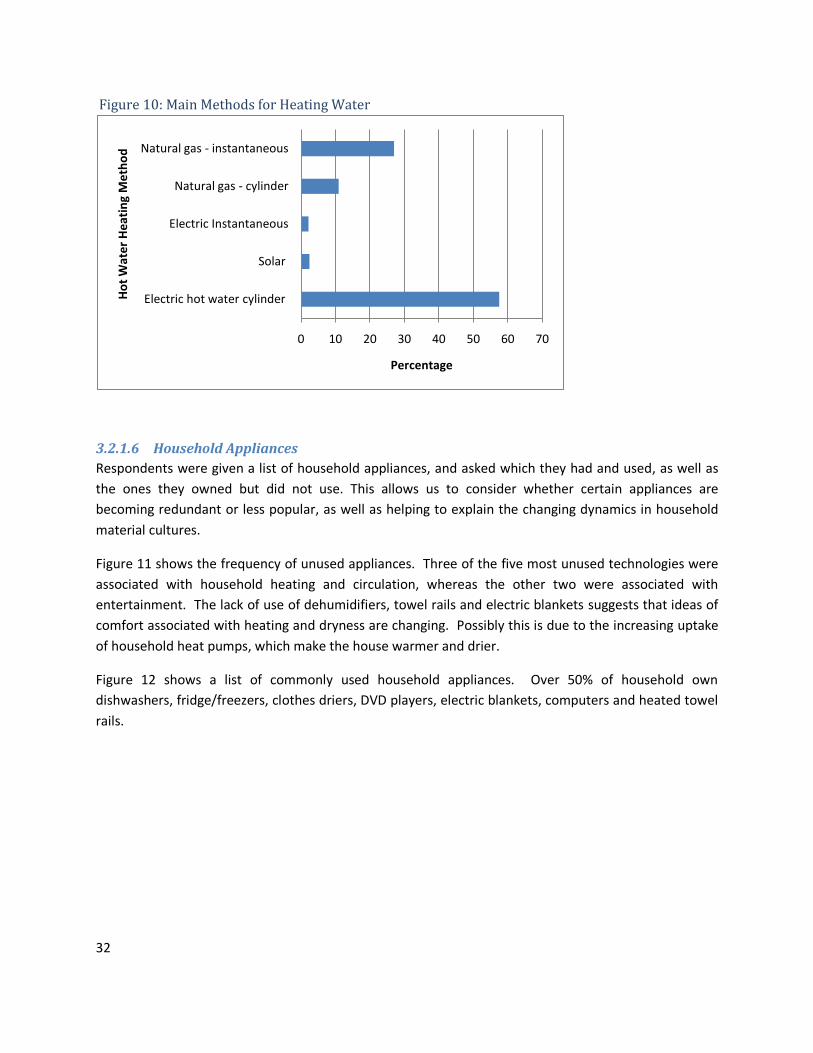
3.2.1.5 Household Hot Water Heating
Hot water heating is the second largest contributor to household energy use. Electric hot water cylinders
are used by close to 60% of households, with instant natural gas the next most common system (around
35%) The third most common system is cylinders heated by natural gas (10%). Solar has been installed
in around 8% of households.
Most homes receive around five and a half hours of sunlight on a winter’s day (June-July) which suggests
that these Thorndon-Wadestown households have opportunities to make use of solar hot water
systems.
Given the winter sunlight hours, solar hot water systems could be far more extensively used in
the Thorndon-Wadeston area.
Table 12: Extra Hot Water Cylinder Insulation on Older Cylinders
Extra Insulation Wrapping 26%
No Extra Insulation 73%
Of those respondents who knew the history of their hot water cylinder, 25% stated that it had been
replaced in the last 10 years. These will be well insulated. Out of the participants who had not replaced
their hot water cylinder within the last 10 years, only 26% had applied extra insulation to their cylinder.
all in all, around 50% of respondents who had older hot water cylinders had not applied extra insulation
wrapping.
The low rate of insulation of hot water cylinders presents an opportunity for behaviour change
interventions.
32
Figure 10: Main Methods for Heating Water
3.2.1.6 Household Appliances
Respondents were given a list of household appliances, and asked which they had and used, as well as
the ones they owned but did not use. This allows us to consider whether certain appliances are
becoming redundant or less popular, as well as helping to explain the changing dynamics in household
material cultures.
Figure 11 shows the frequency of unused appliances. Three of the five most unused technologies were
associated with household heating and circulation, whereas the other two were associated with
entertainment. The lack of use of dehumidifiers, towel rails and electric blankets suggests that ideas of
comfort associated with heating and dryness are changing. Possibly this is due to the increasing uptake
of household heat pumps, which make the house warmer and drier.
Figure 12 shows a list of commonly used household appliances. Over 50% of household own
dishwashers, fridge/freezers, clothes driers, DVD players, electric blankets, computers and heated towel
rails.
0 10 20 30 40 50 60 70
Electric hot water cylinder
Solar
Electric Instantaneous
Natural gas - cylinder
Natural gas - instantaneous
Percentage
Ho
t W
ate
r H
eat
ing
Me
tho
d

33
Figure 11: Number of Unused Appliances in the Household
Figure 12: Proportion of Commonly Used Household Appliances
0 10 20 30 40 50 60 70
Dehumidifier
Tubular TV
Video recorder
Heated Towel rail
Electric Blanket
Frequency
Un
use
d A
pp
lian
ces
0
10
20
30
40
50
60
70
80
90
Pro
po
rtio
n w
ho
hav
e a
nd
use

34
3.2.1.7 Energy Behaviours
The questionnaire asked similar questions regarding energy related behaviours as were asked in the
laddering interviews. As in the interviews, respondents were asked to answer on a scale of 1-5 how
often they do, and/or how likely they would be to consider certain energy related practices or
investments.
The most common practices people engaged in were pulling curtains at night, reducing heating in
unoccupied rooms, switching off lights in unused rooms (Figure 13). The first and third questions were
not asked in the laddering interviews, where the most likely behaviours were cooling the house before
opening windows, waiting for a full load before turning up heating, and line drying of laundry (see Table
1). Reducing heating in unoccupied rooms was ‘already done or likely’ for 68% of people in the
laddering interviews, compared to ‘always or often’ for 82% in the surveys.
Figure 13: Frequency of Doing Certain Energy Related Practices
The least popular practices were taking shorter showers and turning appliances off at the wall. Turning
appliances off was the lowest ranked of the practices in the laddering surveys as well, while around 40%
of laddering respondents were unlikely or would not take shorter showers. Clothers dryers are widely
used, by around 75% of households (Fig 12). Fig 13 shows around 35% always line-dry their laundry,
with the rest doing this often, sometimes, rarely or never.
Clothes driers are a high-energy appliance, and even a partial further shift to line drying could
reduce energy use considerably. This may represent another area for EECA action.
0% 10% 20% 30% 40% 50% 60% 70% 80% 90%100%
Shorter showers
Turn appliances off at the wall
Rinse dishes with cold water
Keep household heating low to save energy
Put on more clothing before turning up heating
Dishes by hand
Line dry laundry
Wait for a full load before using washing …
Switching off lights in unused rooms
Reduce heating in unoccupied rooms
Pulling curtains at night
Never
Rarely
Sometimes
Often
Always

35
Respondents were also asked how likely they would be to make a range of energy related investments
(Figure 14). Only just over 50% already had insulated ceilings, and a little over a quarter already had
insulted walls, under floors and had sealed drafts. At least 20% more would actively consider insulation,
and nearly 40% would actively consider sealing drafts.
Given the energy savings from insulation and draft sealing, these would appear to be obvious
areas for EECA promotion, especially given Thorndon/Wadestown’s relatively high income level
and willingness to consider action in these areas.
There is a high level of willingness to consider energy efficient appliances. As these tend to be
investments made when the old one breaks down, information about sourcing such items
should be easily available.
Figure 14: Energy Related Investments
Respondents were asked a series of questions about their attitudes to energy. As shown in Figure 15a,
most respondents don’t think it is hard to find information about being energy efficient in the home
(76.6%), are concerned with saving energy in the home (76.6%), and do pay attention to their monthly
power bill (79.1%). When asked if they would buy appliances with high energy ratings, even in they cost
more, a surprisingly high proportion (almost 50%) agreed.
Considering the high income levels, and the low level of rationalising behaviours on the basis of
financial constraints, we suggest that there is a good case for promoting the acquisition of
energy-efficient appliances in the Thorndon-Wadestown area.
0% 20% 40% 60% 80% 100%
Installing double glazing
Insulating hot water cylinder
Insulating heating pipes
Installing energy efficient heating …
Reduce hot water temperature
Installing energy efficient fridge
Installing energy efficient washing …
Seal drafts at doors/windows
Insulating under floors
Insulating walls
Insulating ceiling
Never
Unlikely
Would possibly consider
Would actively consider
Already do

36
Figure 15a: Energy Attitudes
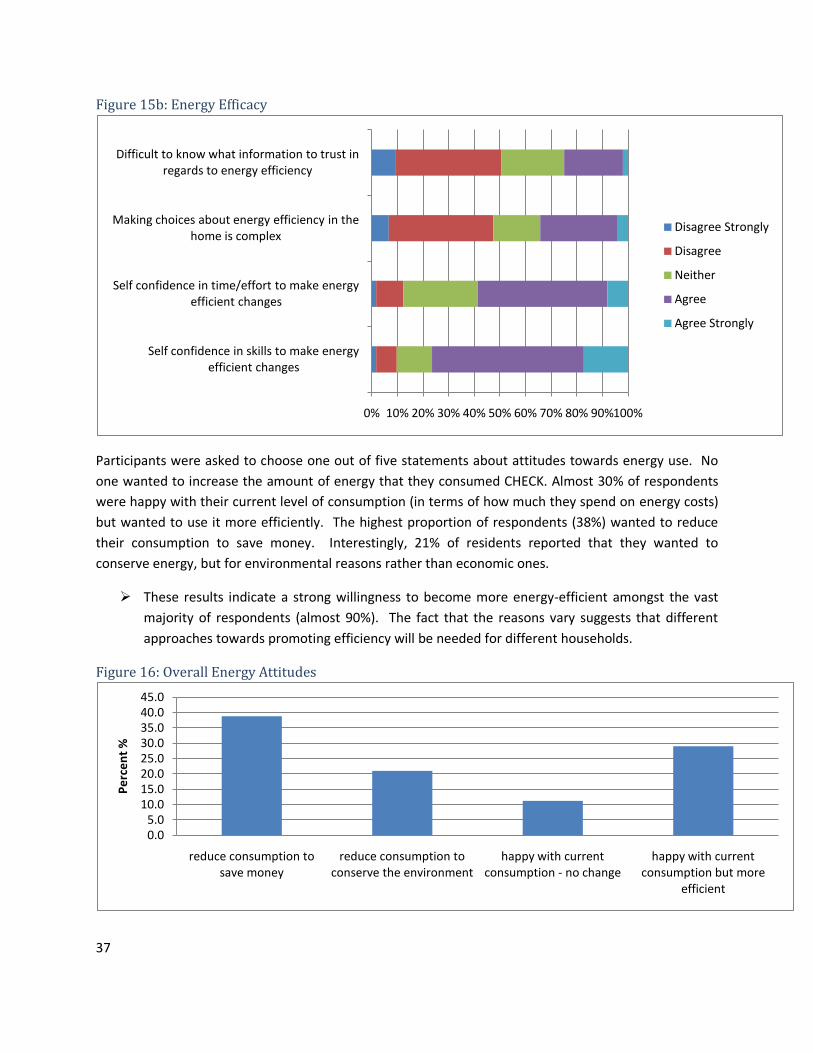
Self-efficacy is the belief that one is able to make decisions and take actions. Respondents appear to be
generally well empowered (Fig 15b) with a high proportion feeling confident that they have the time
and effort (almost 60%) and skills (over 75%) to make energy efficient changes. However at least a
quarter find it difficult to know what information to trust, and find it complex making choices about
energy efficiency.
Assisting people with trustworthy information and in making personal choices about energy
efficiency is likely to enhance their actions towards greater energy efficiency.
0% 20% 40% 60% 80% 100%
Buy appliances with high energy ratings disregarding their cost
No attention to monthly power bill
No concern for saving energy in own home
Hard to find information about being energy efficient around the home
Disagree Strongly
Disagree
Neither
Agree
Agree Strongly
37
Figure 15b: Energy Efficacy
Participants were asked to choose one out of five statements about attitudes towards energy use. No
one wanted to increase the amount of energy that they consumed CHECK. Almost 30% of respondents
were happy with their current level of consumption (in terms of how much they spend on energy costs)
but wanted to use it more efficiently. The highest proportion of respondents (38%) wanted to reduce
their consumption to save money. Interestingly, 21% of residents reported that they wanted to
conserve energy, but for environmental reasons rather than economic ones.
These results indicate a strong willingness to become more energy-efficient amongst the vast
majority of respondents (almost 90%). The fact that the reasons vary suggests that different
approaches towards promoting efficiency will be needed for different households.
Figure 16: Overall Energy Attitudes
0% 10% 20% 30% 40% 50% 60% 70% 80% 90%100%
Self confidence in skills to make energy efficient changes
Self confidence in time/effort to make energy efficient changes
Making choices about energy efficiency in the home is complex
Difficult to know what information to trust in regards to energy efficiency
Disagree Strongly
Disagree
Neither
Agree
Agree Strongly
0.05.0
10.015.020.025.030.035.040.045.0
reduce consumption to save money
reduce consumption to conserve the environment
happy with current consumption - no change
happy with current consumption but more
efficient
Pe
rce
nt
%

38
3.2.1.8 Sourcing Energy Information
In this section we sought to find out where people gained energy-related information, and to what
extent they discussed energy issues with friends and family. Television was the most common source of
information about energy efficiency, followed by power companies, newspapers and EECA (Table 13).
The internet, friends and family, and magazines were also well used.
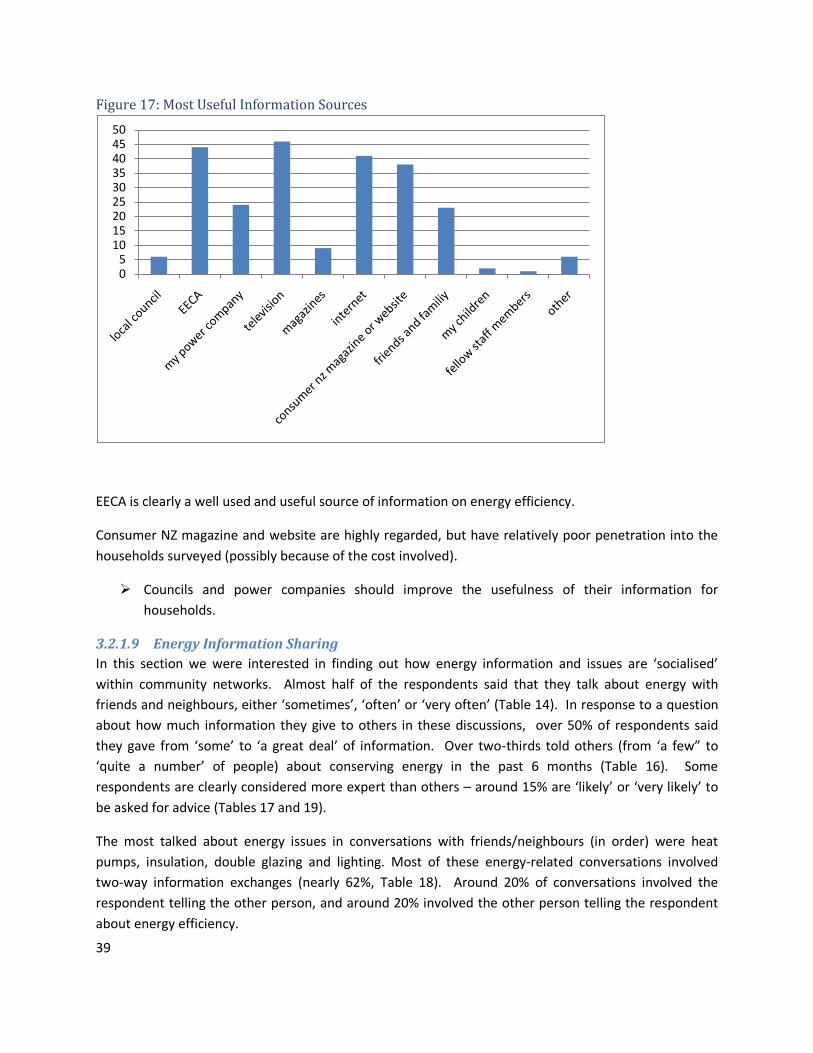
The information sources that respondents found most useful were television and EECA (Figure 17) and it
is likely that there is some overlap here given that EECA advertise on TV. The internet and Consumer NZ
were also highly ranked as useful. It is notable that Consumer NZ was not mentioned as frequently as
many other sources in Table 13 (31%), but was highly ranked in usefulness (Fig 17) (37%) – that is,
everyone who read it found it useful. In contrast, power companies were the second most mentioned
source of information (nearly 62%) but were far less well ranked in the usefulness of the information
(23%). Just under a quarter noted they sourced information from councils but only 5% found this useful.
Table 13 shows which information sources the respondents’ reported they used when they made
changes to help the household use energy more efficiently. Here, own knowledge was the most popular
choice reflecting New Zealanders ‘handyman’ skills or at least ‘can-do’ attitudes.
Table 13: Recent Energy Information Sources
Television 65.9%
Power Company 61.6%
Newspaper 57.4%
EECA 44.6%
Internet 41.2%
Friends and Family 39.5%
Magazines 35.8%
Consumer NZ Magazine or website 31.0%
My local council 23.0%
Fellow Staff Members 15.1%
Other 8.5%
My children 6.8%
39
Figure 17: Most Useful Information Sources
EECA is clearly a well used and useful source of information on energy efficiency.
Consumer NZ magazine and website are highly regarded, but have relatively poor penetration into the
households surveyed (possibly because of the cost involved).
Councils and power companies should improve the usefulness of their information for
households.
3.2.1.9 Energy Information Sharing
In this section we were interested in finding out how energy information and issues are ‘socialised’
within community networks. Almost half of the respondents said that they talk about energy with
friends and neighbours, either ‘sometimes’, ‘often’ or ‘very often’ (Table 14). In response to a question
about how much information they give to others in these discussions, over 50% of respondents said
they gave from ‘some’ to ‘a great deal’ of information. Over two-thirds told others (from ‘a few” to
‘quite a number’ of people) about conserving energy in the past 6 months (Table 16). Some
respondents are clearly considered more expert than others – around 15% are ‘likely’ or ‘very likely’ to
be asked for advice (Tables 17 and 19).
The most talked about energy issues in conversations with friends/neighbours (in order) were heat
pumps, insulation, double glazing and lighting. Most of these energy-related conversations involved
two-way information exchanges (nearly 62%, Table 18). Around 20% of conversations involved the
respondent telling the other person, and around 20% involved the other person telling the respondent
about energy efficiency.
05
101520253035404550

40
It is clear that conversations about energy, and sharing of energy-efficiency experiences and knowledge,
are occurring regularly in the community. Around 15% of people seem to be ‘unofficial experts’, to
whom others often go to for advice. Another 45% are sometimes used for advice. Peer-to-peer
communication is well known to be a very powerful way of passing on information and achieving change
– the issue is to ensure that it is accurate.
EECA could potentially make a big difference in community knowledge levels by tapping into
these informal community networks, finding the unofficial but expert ‘efficiency leaders’, and
supporting these people in their key roles of spreading knowledge and know-how.
Table 14: Frequency of Energy Discussions with Friends/Neighbours
Never 16.2%
Little 37.5%
Sometimes 31.6%
Often 12.0%
Very Often 2.7%
Table 15: Amount of Information Given in Energy Discussions with Friends/Neighbours
give very little information 15.4%
give little information 25.8%
give some information 42.7%
give much information 14.6%
give a great deal of information 1.5%
Table 16: How Many People Respondents Told about Conserving Energy (Last 6 Months)
told no one 28.7%
told a few 36%
told some 20.8%
told a number of people 11.1%
told quite a number of people 3.5%

41
Table 17: Compared with Friends, How Likely Respondents are to be asked About Energy Efficiency
not at all likely to be asked 25.3%
not likely to be asked 33%
maybe asked 27.4%
likely to be asked 10.4%
very likely to be asked 3.8%
Table 18: What Happens the Most in Discussions about Energy Use
your friends tell you about energy
efficiency 17.8%
both tell each other 61.8%
you tell your friends about energy
efficiency 20.4%
Table 19: How Respondents are Used Overall in Discussions with Friends and Neighbours
Not used as a source of advice (or not
often) 39.4%
sometimes used as a source of advice 44.7%
often used as a source of advice 15.9%
3.2.1.10 Energy Use and Health
Respondents were asked the question “does anyone in your household suffer from an illness that requires additional use of energy?” to which 9% of all respondents answered yes. For these respondents, the additional energy is mainly used for heating, due to requirements to keep the house warm, although small numbers also use energy for washing, drying and operating appliances (Figure 18).

42
Figure 18: Extra Energy Use for Health Requirements
3.2.1.11 Personal Values
Personal values are of interest because even if people do not act in ways that are consistent with their
values, they provide a basis which may be supportive of a change in behaviour to become more aligned
with values. Respondents were asked their level of support (or opposition) to a series of personal values
– largely the same set of values that emerged as important during the laddering interviews. Figure 19
shows the responses which were given on a seven-point scale from ‘opposed’ to ‘supreme importance’.
It should be noted that unlike the process in the laddering interviews, the value questions in the survey
did not relate to energy behaviour – they simply asked the importance of the values in a generic sense.
Being ‘Capable’ came through again as the most highly ranked value. Being ‘Helpful’ was second-
ranked, but interestingly did not come through in the top ten list from the laddering interviews. This
perhaps relates to the fact that being ‘Helpful’ is not strongly related to energy behaviours even though
it may be an important life goal for many people. The next 3 values were all highly ranked in the
laddering interviews as well: Being ‘Intelligent’ was third most important (4th in the interviews);
‘Protecting the environment’ was fourth most important (2nd in the interviews); and ‘Enjoying life’ was
fifth most important (3rd in the interviews).
This coherence between the two sets of results suggests that the four values of Being Capable,
Being Intelligent, Protecting the Environment and Enjoying Life are all highly relevant in any
work to promote energy efficiency. If campaigns can be aligned to promote these values, they
are likely to touch a chord with many of the target audience within the Thorndon-Wadestown
population.
washing heating drying operating health or medical appliances
0
20
40
60
80P
erc
en
t%

43
Figure 19: Importance of a Range of Personal Values
0% 10% 20% 30% 40% 50% 60% 70% 80% 90% 100%
Social recognition
Respect for tradition
Being clean
Social order
Unity with nature
Protecting the environment
Honouring parents and elders
Being intelligent
Enjoying life
Being capable
Being helpful
opposed
neutral
not important
bit important
important
very important
supreme importance

44
4 Conclusions and Preliminary Policy Implications
This report reflects an interim point of the data analysis. Eventually, one application of the final results
will be to find out which segments of respondents are most likely to share information about energy
efficiency so that EECA’s campaigns can target these people. Although the cluster analysis required for
segmenting the respondents is beyond the scope of this report, these interim results still provide some
useful insights into behavior and values.
Research internationally has generally revealed that the links between values and behaviours are not
particularly strong, and this is reinforced by our findings. People frequently behave in ways that are not
consistent with their values. However, understanding people’s values is still useful as they tend to be
stable over time and do exert some influence on behaviour as people are usually unwilling to act in
conflict with their values. Given the right set of circumstances, most people are likely to adjust their
behaviour to act more consistently with their values. However given that people’s lives are complex and
full of conflicting demands, their actions may be inconsistent with a goal such as energy efficiency.
There are two main ways that EECA can change household energy behaviours:
1. Get people to adopt more energy-efficient technologies
2. Get people to change their energy practices
Our research has shown that there are diverse set of ‘drivers’ for any given behaviour and also that
many behaviours cannot be traced to identifiable values. This is typical of behaviours learnt ‘socially’
and formed into strong habits which can be resistant to change. Values are sometimes related to
behaviour, but behaviour may at times be inconsistent with values, or values may drive energy-
inefficient behaviours. Some non-efficient behaviours are driven by the same values as efficient ones
(particularly ‘Pleasure’, ‘Comfort’ and ‘Clean’). For example the value ‘Pleasure’ may be consistent with
enjoying a warm, insulated house but may also be consistent with long hot showers. Both the value
laddering interviews and the household surveys suggest that the four values of Being Capable, Being
Intelligent, Protecting the Environment and Enjoying Life are strongly aligned with energy-efficient
behaviours. If campaigns can be aligned to promote these values, they are likely to touch a chord with
many of the target audience within the Thorndon-Wadestown population.
Recommendation: EECA should align marketing campaigns with values that appear to be most
closely and consistently associated with energy-efficient behaviour - in particular Being Capable,
Being Intelligent, Protecting the Environment and Enjoying Life.2 It is clear that simply using the
‘environment’ value to promote energy-efficient behaviours will miss out a significant chunk of
the population for whom this is not a key value.
2 The Energy Spot ads appear to have done this well.

45
People found it harder to express values in relation to non-efficient behaviours than for efficient
behaviours. We suspect that this is because these behaviours have little relationship to underlying
values, but instead relate to habit. People’s personal values tend to be relatively immutable, and as
noted earlier cannot be claimed to be ‘drivers’ of behaviour.
Recommendation: For these reasons it makes sense for EECA not to try to change people’s
values, but to address the obstacles that prevent people from acting in energy-efficient ways
that are consistent with their values.
To this end, the findings relating to people’s rationalisations of their behaviour, together with findings
from the surveys, suggest that there is a wide range of direct barriers and incentives relating to energy-
efficient behaviour. As the laddering diagrams show (Appendix I) these barriers and incentives differ
greatly between behaviours.
Recommendation: Rather than blanket campaigns for efficiency, these findings suggest it would
be beneficial to treat each behaviour individually. EECA should design interventions on a
behaviour-by-behaviour basis to address the main barriers to more efficient behaviours.
For example, the main barrier to switching appliances off at the wall was that it was ‘not convenient’ –
which suggests that market-ready technological solution is needed to make this more convenient. The
main barrier to adopting energy-efficient light bulbs was the perceived physical incompatibility of bulb
design and light fittings – again another technological issue, or perhaps a matter of making people
aware of design advances. More detailed analysis of the ‘ladders’ would assist in this process.
The census data and the survey both reveal that the Thorndon-Wadestown households are relatively
wealthy. The interviews and the survey both show that lack of finance is not an important driver of
most of their energy behaviours. For example, in Table 3, financial constraints were mentioned only a
third as often as situational constraints, as a reason for non-efficient behaviours. In the surveys, only
38% stated that they wanted to reduce consumption to save money (Figure 16), although economic
efficiency was important to many – it was the most frequently cited rationalisation for energy efficient
behaviours (Table 3).
At the same time, there is a strong willingness and desire to move to more efficient behaviours –
particularly for energy-efficient investments. For example, 15% were unhappy with their main method
of heating and wanted to change it, and another 35% would get something better if the opportunity
arose (Table 10). Significant proportions of the survey respondents would ‘actively’ or ‘possibly’
consider all energy related investments listed (Figure 14) – with the stand-outs being sealing drafts,
insulation, energy-efficient appliances and double glazing. And there is a significant potential for major
efficiencies even just in household heating, when it is considered that 22% use portable electric heaters
as their main method of space heating (Table 9). Households with electric night store heaters, portable
electric heaters, oil heaters, fixed electric heatings, open fires and portable gas heaters are the most

46
likely to want to change their method of heating (Table 11). Additionally, there is surprisingly low take-
up even of some very simple actions such as wrapping hot water cylinders, energy-efficient light bulbs or
sealing drafts – activities that cost little but may seem just too difficult if households are time-poor.
All of these findings point to a large number of households that are well-positioned to make a change to
more energy-efficient behaviours, but are not doing so. So what is holding households back? Most
respondents feel it is not hard to find information about being energy efficient (Figure 15a).
Respondents are also well aware of sources of knowledge, although some sources were clearly more
useful than others (Table 13, Figure 17). Not knowing what information to trust, and finding it difficult
to make choices, are problems for at least a quarter of households (Fig 15b). More than half expressed
self confidence in their skills and time/effort to make changes, but over 40% were neutral or felt that
they didn’t have the time or effort, and around 25% felt they didn’t have the skills (Fig 15b).
Situational constraints and opportunities were also hugely influential in people’s behaviour. This was
the most common rationalisation across both negative and positive energy behaviours ((Table 3) –
either a situation holding back change, or a situation (e.g. appliance breakdown) compelling change.
Recommendation: Given the relative lack of financial constraints, evident willingness and bility
to act, an significant opportunities for change, we suggest EECA develops a program that creates
situational opportunities, requires relatively little time and effort by householders, and helps
them make choices with trustworthy information.
The results indicate a strong willingness to become more energy-efficient amongst the vast majority of
respondents (almost 90%). However, reasons for not taking action vary considerably. This reinforces
that different approaches towards promoting efficiency will be needed for different households.
There is a good opportunity for EECA to work with the 15% of households who would like to
improve their heating system. Those with electric night store heaters, portable electric heaters,
oil heaters, fixed electric heatings, open fires and portable gas heaters are the most likely to
want to change.
In considering how this gap between willingness and action could be bridged, we suggest that it is
important to consider the power of social networks. As can be seen in Tables 14-19, and the related
discussion, it is clear that conversations about energy, and sharing of energy-efficiency experiences and
knowledge, are occurring regularly in the community. Peer-to-peer communication is well known to be
a very powerful way of passing on information and achieving change – the issue is to ensure that it is
accurate.
Recommendation: EECA could potentially make a big difference in community efficacy levels by
tapping into these informal community networks, finding the unofficial but expert ‘efficiency
leaders’, and supporting these people in their key roles of spreading knowledge and know-how.

47
Other recommendations from the body of the report are:
Considering the high income levels, and the low level of rationalising behaviours on the basis of
financial constraints, we suggest that there is a good case for promoting the acquisition of
energy-efficient appliances in the Thorndon-Wadestown area.
There is a high level of willingness to consider energy efficient appliances. As these tend to be
investments made when the old one breaks down, information about sourcing such items
should be made easily available.
Given the hours of winter sun for most houses, solar hot water systems could be far more
extensively used in the Thorndon-Wadeston area.
The low rate of insulation of hot water cylinders presents a opportunity for behaviour change
interventions.
Many homes use clothes driers. Even a partial further shift to line drying could reduce energy
use considerably.
Insulation and draft sealing appear to be obvious areas to promote given Thorndon/
Wadestown’s relatively high income level and willingness to consider action in these areas.
Assisting people with trustworthy information and in making personal choices about energy
efficiency is likely to enhance their actions towards greater energy efficiency.
EECA is seen as a useful source of information on energy efficiency and is well used.
Consumer NZ magazine and website are highly regarded, but have relatively poor penetration
into the households surveyed (possibly because of the cost involved)
Councils and power companies should improve the usefulness of their information for
households.

48
5 References Barr, S., & Gilg, A. (2006). Sustainable lifestyles: Framing environmental action in and around the home.
Geoforum, 37, 906-920.
Barr, S., & Gilg, A. W. (2007). A Conceptual Framework For Understanding And Analyzing Attitudes
Towards Environmental Behaviour. Geografiska Annaler, 89 (4), 361-379.
IEA. (2009). World Energy Outlook. Paris.
Reynolds, T. J., & Gutman, J. (2001). Laddering theory, method analysis and intepretation. In R. T. J & O.
J. C (Eds.), Understanding Consumer Decision Making (pp. 25-62). New Jersey: Lawrence Erlbaum
Associates.
Schwartz, S. H., & Bilsky, W. (1990). Toward a Theory of the Universal Content and Structure of Values:
Extensions and Cross-Cultural Replications. Journal of Personality & Social Psychology, 58(5), 878-891.
Stephenson, J., Barton, B., Carrington, G., Gnoth, D., Lawson, R., & Thorsnes, P. (2010). Energy cultures:
A framework for understanding energy behaviours. [doi: DOI: 10.1016/j.enpol.2010.05.069]. Energy
Policy, 38, 6120–6129.

49
6 Appendices
6.1 Appendix A: Information Sheet for Interview Respondents [May-June 2010]
Understanding Household Energy Behaviours
Thank you for showing an interest in this project. Please read this information sheet
carefully before deciding whether or not to participate. If you decide to participate
we thank you. If you decide not to take part there will be no disadvantage to you of
any kind and we thank you for considering our request.
What is the Aim of the Project?
Targets for the uptake of national energy efficient technologies and behaviours by households have not
been met. This project aims to accelerate the achievements of these targets by obtaining an
understanding of household energy behaviours and decision making processes.
What Type of Participants are being sought?
The participants being sought for this project are those over 18 years of age who are responsible for
making the key energy consumption decisions in their household.
To be included in this research you must be expecting to reside in the same house in 2010.
What will Participants be Asked to Do?
Should you agree to be involved in this project, you will be asked to partake in an interview with the
researcher. The interviews will be typically between 30-60 minutes in duration. The interview will be
tape recorded.
Please be aware that you may decide not to take part in the project without any disadvantage to
yourself of any kind.
Can Participants Change their Mind and Withdraw from the Project?
You may withdraw from participation in the project at any time and without any disadvantage to
yourself of any kind.
What Data or Information will be Collected and What Use will be Made of it?
Should you agree to take part in this project, you will be asked to answer a series of questions about
recent energy related consumption decisions as well as a series of demographic and other general
household questions related to energy consumption.
This project involves an open-questioning technique where the precise nature of the questions which
will be asked have not been determined in advance, but will depend on the way in which the interview

50
develops. Consequently, although the University of Otago Human Ethics Committee is aware of the
general areas to be explored in the interview, the Committee has not been able to review the precise
questions to be used.
In the event that the line of questioning does develop in such a way that you feel hesitant or
uncomfortable you are reminded of your right to decline to answer any particular question(s) and also
that you may withdraw from the project at any stage without any disadvantage to yourself of any kind.
The data collected will remain confidential and will only be seen by the interviewer, other members of
the research team and supporting research staff.
The results of the project may be published and will be available in the University of Otago Library
(Dunedin, New Zealand) but every attempt will be made to preserve your anonymity.
You are most welcome to request a copy of the results of the project should you wish.
The data collected will be securely stored in such a way that only those mentioned below will be able to
gain access to it. At the end of the project any personal information will be destroyed immediately
except that, as required by the University's research policy, any raw data on which the results of the
project depend will be retained in secure storage for five years, after which it will be destroyed.
Reasonable precautions will be taken to protect and destroy data gathered by email. However, the
security of electronically transmitted information cannot be guaranteed. Caution is advised in the
electronic transmission of sensitive material.
What if Participants have any Questions?
If you have any questions about our project, either now or in the future, please feel free to contact:-
Dr Miranda Mirosa
Centre for the Study of Food, Agriculture and Environment (CSAFE)
University Telephone (03) 470 3577
51
6.2 Appendix B: Consent Form for Respondents I have read the Information Sheet concerning this project and understand what it is about. All my
questions have been answered to my satisfaction. I understand that I am free to request further
information at any stage.
I know that:-
1. my participation in the project is entirely voluntary;
2. I am free to withdraw from the project at any time without any disadvantage;
3. the data will be destroyed at the conclusion of the project but any raw data on which the results of
the project depend will be retained in secure storage for five years, after which it will be destroyed;
4. this project involves an open-questioning technique where the precise nature of the questions which
will be asked have not been determined in advance, but will depend on the way in which
the interview develops and that in the event that the line of questioning develops in such a
way that I feel hesitant or uncomfortable I may decline to answer any particular
question(s) and/or may withdraw from the project without any disadvantage of any kind;
the Energy Cultures Research Project is being funded by a grant from the Foundation of Research
Science and Technology;
the results of the project may be published and available in the University of Otago Library (Dunedin,
New Zealand) but every attempt will be made to preserve my anonymity.
I agree to take part in this project.
............................................................................. ...............................
(Signature of participant) (Date)

52
6.3 Appendix C: Interview Template Card One Questions: (1 – never: 2 – rarely: 3 – Sometimes: 4 – Often: 5 – Always)
The following is a list of possible energy-saving behaviours. Please indicate how
often you do each of the following actions.
Personal Notes/ Direction of
interview
1. Turning appliances off instead of leaving them on standby 1 2 3 4 5
2. Washing hands in cold water 1 2 3 4 5
3. Rinsing the dishes in cold water 1 2 3 4 5
4. Reduce heating in unoccupied rooms 1 2 3 4 5
5a) Do you know what your hot water temperature is? ?
5b).Would you consider reducing your hot water temperature?
6. Wait for a full load before using washing machine 1 2 3 4 5
7. Put on more clothing before turning up the heating 1 2 3 4 5
8. Keep household heating low to save energy 1 2 3 4 5
9. Line drying of laundry 1 2 3 4 5
10. Taking shorter showers 1 2 3 4 5
11. Doing dishes by hand 1 2 3 4 5
12. Cooling house by opening windows 1 2 3 4 5
Card Two Questions (1 – Never: 2 – Unlikely: 3 – Would possibly consider: 4 – Would actively consider: 5
– Already do)
Please indicate how likely you would be to consider the following energy
related purchases.
Personal Notes/ Direction of
interview
1. Cooking on gas 1 2 3 4 5
2. Installing double glazing 1 2 3 4 5
3. Installing an energy efficient refrigerator 1 2 3 4 5
4. Buying a smaller refrigerator 1 2 3 4 5

53
5. Installing an energy efficient washing machine 1 2 3 4 5
6. Installing energy efficient light bulbs 1 2 3 4 5
7. Insulation of heating pipes 1 2 3 4 5
8. House insulation 1 2 3 4 5
9. Installing an energy-efficient heating system
(such as a heat pump) 1 2 3 4 5
10. Applying hot water cylinder insulation 1 2 3 4 5
11. Consider changing energy suppliers to save power 1 2 3 4 5
Does anyone in your household suffer from an illness that requires additional use of electricity? Y / N
Are you happy for the University of Otago to contact you again in the next 2/3 years for future research?
Y / N
Do you have any friends, family or neighbours in Thorndon/Wadestown who might consider taking part
in this survey as well? YES/NO
If YES, what are their contact details:
Demographic Questions Personal Details
Age (category)……………………………………………………
Rent/Own ………………………………..………………………
Income (category)………………………………………………
# of members in household ………………………………………
Electricity bill (category) ……………………………………
Do you think electricity has gone up since last year?……………
Has this changed the way you think about and use energy? ……
Name
…………………………………………….
Address
………………………………………….
Date:
……………………………………………..
Questionnaire
number……………………………
Dictaphone track number
……………………….

54
Name …………………………………………….
Address ………………………………………….
Telephone number ………………………………
Email …………………………………………….
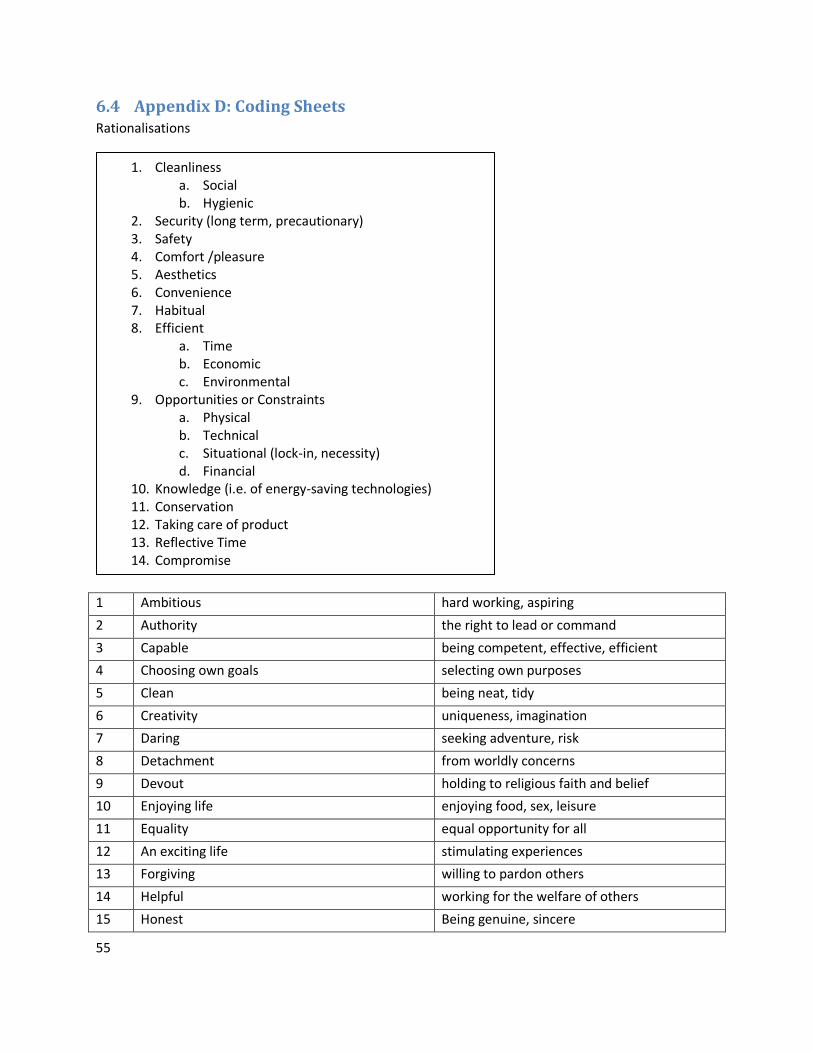
55
6.4 Appendix D: Coding Sheets Rationalisations
Values
1 Ambitious hard working, aspiring
2 Authority the right to lead or command
3 Capable being competent, effective, efficient
4 Choosing own goals selecting own purposes
5 Clean being neat, tidy
6 Creativity uniqueness, imagination
7 Daring seeking adventure, risk
8 Detachment from worldly concerns
9 Devout holding to religious faith and belief
10 Enjoying life enjoying food, sex, leisure
11 Equality equal opportunity for all
12 An exciting life stimulating experiences
13 Forgiving willing to pardon others
14 Helpful working for the welfare of others
15 Honest Being genuine, sincere
1. Cleanliness a. Social b. Hygienic
2. Security (long term, precautionary) 3. Safety 4. Comfort /pleasure 5. Aesthetics 6. Convenience 7. Habitual 8. Efficient
a. Time b. Economic c. Environmental
9. Opportunities or Constraints a. Physical b. Technical c. Situational (lock-in, necessity) d. Financial
10. Knowledge (i.e. of energy-saving technologies) 11. Conservation 12. Taking care of product 13. Reflective Time 14. Compromise

56
16 Honouring Parents and Elders Showing respect
17 Influential Having an impact on people and events
18 Inner Harmony At peace with myself
19 Intelligent Logical thinking
20 Loyal Faithful to my friends, group
21 Mature Love Deep emotional intimacy
22 A meaning in life A purpose in life
23 National Security Protection of my nation from enemies
24 Obedient Being dutiful, meeting obligations
25 Pleasure Gratification of desires
26 Politeness Courtesy, good manners
27 Preserving my Public Image Protecting my ‘face’
28 Protecting the Environment Preserving nature
29 Respect for Tradition Preservation of time-honoured customs
30 Responsible Dependable, reliable
31 Self-Respect Belief in one’s own worth
32 Social Justice Correcting injustice, care for the weak
33 Social Order Stability of society
34 Social Power Control over others, dominance
35 Social Recognition Respect, approval by others
35 Successful Achieving goals
36 A Spiritual Life Emphasis on spiritual not material matters
37 True Friendship Close, supportive friends
38 Unity with Nature Fitting into nature
39 A Varied Life Filled with challenge, novelty and change
40 A World of Beauty Beauty of nature and the arts
41 A World at Peace Free of war and conflict
57
6.5 Appendix E: Information Sheet for the Survey [May-June 2010]
Understanding Household Energy Behaviours
INFORMATION SHEET
The Otago Energy Research Centre is conducting a survey to understand how
Wellington residents use energy within their homes. The purpose of the survey is to
gather information about different energy related behaviours and the way in which they frame and
create energy demand.
Please read this information sheet carefully before deciding whether or not to participate. If you decide
to participate we thank you. Completed surveys go in the draw to win one of five $100 New World
vouchers.
If you decide not to take part there will be no disadvantage to you of any kind and we thank you for
considering our request.
What is the Aim of the Project?
Targets for the uptake of national energy efficient technologies and behaviours by households have not
been met. This project aims to accelerate the achievements of these targets by obtaining an
understanding of household energy behaviours and decision making processes.
What Types of Participants are being sought?
The participants being sought for this project are those over 18 years of age who are responsible for
making the key energy consumption decisions in their household.
What will Participants be Asked to Do?
Should you agree to do this survey you will be asked to answer questions about the physical aspects of
your household and how you interact with the technologies that you own. There will also be some
questions about your personal attitudes and values regarding energy use as well as some demographic
questions.
Can Participants Change their Mind and Withdraw from the Project?
You may withdraw from participation in the project at any time and without any disadvantage to
yourself of any kind.
What Data or Information will be Collected and What Use will be Made of it?
Should you agree to take part in this project the responses you make on the survey will be entered into
a computer program for statistical analysis.

58
The results of the project may be published and will be available in the University of Otago Library
(Dunedin, New Zealand) but your anonymity will be preserved.
You are most welcome to request a copy of the results of the project should you wish.
The data collected will be securely stored in such a way that only those mentioned below will be able to
gain access to it. At the end of the project any personal information will be destroyed immediately
except that, as required by the University's research policy, any raw data on which the results of the
project depend will be retained in secure storage for five years, after which it will be destroyed.
Reasonable precautions will be taken to protect and destroy data gathered by email. However, the
security of electronically transmitted information cannot be guaranteed. Caution is advised in the
electronic transmission of sensitive material.
What if Participants have any Questions?
If you have any questions about our project, either now or in the future, or if you wish to request a
paper copy please feel free to contact:
Dr Miranda Mirosa
Centre for the Study of Food, Agriculture and Environment (CSAFE)
University Telephone (03) 470 3577
You can also do the survey online just visit the link:
http://survey.otago.ac.nz/TakeSurvey.aspx?SurveyID=l21M474

59
6.6 Appendix F: The Paper Based Survey

60

61

62

63

64

65

66

67

68

69

70
6.7 Appendix G: Explanation of Rationalisations with Exemplar Quotes Si
tuat
ion
al F
acto
rs
“Yes we have two refrigerators. Again it’s because of the number of people that live here... There
is four people, and various hangers on at various times” (Robberts)
“We have not swapped [to energy efficient light bulbs] here because we are renting and it was a
short time rental, if we were renting here for longer I would have invested in them... “(Jackells)
“Meridian don’t take credit card payment, really drove me nuts cause we don’t anymore but we
used to put every single thing we buy on credit card and pay it off at the end of the month, that’s
how we worked and so they didn’t take it so that really bugged me that they didn’t and you know
I’ve written to them an email you know ‘oh yes will let you know as soon as we do’ but… and
then Power Shop came up to Gavin’s straight there and so we switched to Power Shop.” (Barchi)
Eco
no
mic
Eff
icie
ncy
“It’s a money thing, always analyzing the value you can get form what appliance before you have
to get another one. I mean if some dramatic breakthrough that came through that I could look at
and say well that is going to save me money over the next year even if I throw that one out then I
would do that.” (Fazer)
I don’t like the wastage of it you know, it’s just sort of money going out the window really”
(Rowling)
I think it saves money, and if you’re going to be in a place in the long term its probably beneficial
[insulation]” (Fazer)
Co
nve
nie
nce
“It’s the effort, it’s just kind of inherently lazy, my appliances are always in awkward position like
down on the bottom so it’s good to keep it out of the way but reaching around, behind the case
every time to switch on the TV is such a hassle.” (Lyons)
“Yeah convenience. I leave my TV on standby because it involves turning it off at the source; I
mean there is no option on the remote.” (Johnson)
“The reason why I’m getting renovating the kitchen is to make it more convenient for me and a
dishwasher would add to that convenience.” (Cairns)

71
Envi
ron
men
tal E
ffic
ien
cy
“I’m quite happy to do little things to be environmentally friendly as long as they are not too
much effort like I’ll do the same things with plastic bags. If it’s just a couple of things I’ll say no to
a plastic bag.” (Lyons)
“Just aware of waste of energy, it is in the back of my mind, same with the lights, you are
probably going to ask about light switches. I’ll make sure if I go out of the room I’ll turn them
off... I’m just thinking of the future and just maintaining resources and things.” (Finch)
“It’s also environment and stuff as well, I’m quite conscious of it, things like turning things off at
the wall I’m not as conscious of the effect on the environment as turning lights off and not using
heating because I think they’re bigger in using more energy and if you can save using energy like
that” (Ford)
Co
mfo
rt
“I have it (the heating) comfortable; I’m too old not to be comfortable.” (Gray)
[would not take shorter showers] “I just love the feeling of the hot water running on my back!
Yes, it’s a pleasurable thing, yes.” (Robberts)
“I shower in the morning and it helps me to wake up and it’s comfortable and I feel good so I take
long showers.” (Craig)
Co
nse
rvat
ion
“Well, *I don’t like to be+ wasteful in an energy sense and wasteful in a money sense.” (Robberts)
“As a matter of principal I don’t like to waste... there is a cost to the community of producing
that water and is not… as a socially responsible citizen I shouldn’t waste those resources.” (Craig)
“Yes, I would buy an energy and water efficient one... even though New Zealand seems to have
plenty of water well you shouldn’t waste things regardless.” (Bielsty)
Tech
no
logi
cal F
acto
rs
“I have a rule in the house, *for showering+ less than 5 minutes... Our tank only holds certain, I
have couple of students living with me, so I have to have that rule” (Baaty)
“No, mine is a very old fashion one [hot water cylinder], it doesn’t have anything on it so no *I
can’t find what the hot water temperature is].” (Baledoy)
“[Considering gas cooking] it’s a matter of choice I guess from as much from a cooking style point
of view, I mean, you can’t make a Pavlova in a gas oven b/c you can’t control the temperature. “
(Sinclair)

72
Tim
e Ef
fici
ency
[using clothes drier] “Maybe it is a balance thing where I go: ‘well at least my clothes are going to
be dry when I want them to be dry.’” (Jackells)
[currently cooks on gas] “Gas is quicker; it doesn’t take as long to heat up.” (Lyons)
“I would [wait for a full load before using washing machine+ because it’s most efficient... [In
terms of] cost and time.” (Johnson)
Ph
ysic
al F
acto
rs
“I’m not able to do that here *line drying laundry+ being in an apartment so everything has to be
machine dried.” (Cairns)
[Installing energy efficient light bulbs] “No, I would probably have to change most of the fittings
unfortunately.” (Fazer)
“Basically if you have a look in the kitchen or anywhere there is not one little place where you
could possibly put it [a clothes drier]. Absolutely I would have no space, I never even considered
a dryer.” (Baledoy)
Hyg
ien
e
[Line drying laundry] “Hygienic, *the+ sunshine gets rid of all sorts of things.” (Hall)
“I think it’s more hygienic [when washing hands] to use hot water or warm water yes.” (Clarke)
[Washing hands in cold water] “That’s more from hygienic point of view I believe that there’s
more bugs killed with hot water than cold.” (Croft)

73
6.8 Appendix H: Explanation of Values with Exemplar Quotes C
apab
le
Being competent, effective, efficient “I'm not, what you could call green as such so that the concept of saving the earth's resources
isn’t big in my mind. But saving money and having more efficient things around appeals to me as
an engineer” (Fazer).
“Money normally comes before energy… To save energy is conscience. You feel you need to do
something for the country. Money is personal, that’s the reason. To save money rather than
energy” (Baaty).
*Wouldn’t buy a smaller refrigerator+ “: because I try to shop once a week and part of that is the
convenience in time saving but also I think there’s been studies that if you shop once a week, and
I budget and I’ve got my list, you are more likely to spend less money as opposed than just
popping down to the supermarket every night on the way home (Ryan).
Ple
asu
re
Gratification of desires *Discussing why they would not consider taking shorter showers+ “It’s my luxury, my one luxury,
I’m not too fast, no absolutely not” (Barchi).
I don’t dry my clothes in the machine… they get a funny smell, I hate the smell. You can tell, you
sit next to people you can smell this electric smell in their clothes (Baaty).
*Discussing their heat pump+ “Mine is set so that it goes off, I think it’s about 9.30 at night and it
comes on at 6 in the morning. So the house is warm overnight, I can hear it switching on at 6. It is
nice. It’s my treat” (Jenkins).
Pro
tect
ing
the
Envi
ron
me
nt
Preserving nature “In the back of one’s mind there is also that sort of conservation of energy ethic which is not just
money based” (Rackmil).
Well, I’ve got children and grandchildren and I’m thinking into them, what we’re doing to them,
that’s probably my motive. Six grandchildren, how is their life going to be like? It’s going to be a
lot harder, resources are going to be more difficult for them to access (Bartton).
You keep thinking about waste, wastage, the issue of wastage is quite big now in our minds I
guess. The media sort of gets to us like that and you know you are seeing more and more things
from the consumer society; there is a lot of wastage” (Finch).

74
Inte
llige
nt
Logical thinking
“It just seems silly to heat a whole house when there is only two of us” (Rabling).
“I just can’t be the person that takes things from a washing machine and put it in the dryer though, ever, that is just not me and a lot of that isn’t about money and environment, a lot of it is just brain thing” (Barchi).
*When asked if he turns appliances off at the wall+ “Only one… A while ago I bought a little device
that allows you to actually measure the currency from devices. And the only thing that I found
round here that uses significant power while it was turned, in standby mode was the relatively
old Fisher & Paykel washing machine (Baaty).
Cle
an
Being neat, tidy “Yes I would *installing an energy efficient washing machine+. It would be a consideration
however for me personally the overriding consideration would be how well it actually got the
chemicals out you know all the you know the laundry powder cause I don’t like wearing that next
to my skin or you know anybody else’s skin so I would rather use the extra water and know that
that is really going to be safe and know that is costing extra but know that feel that I was actually
going to be… you know we were all going to be healthy” (Sabarsky).
Washing hands in cold water is not effective… It doesn’t remove the organisms you want
removed from your skin. It’s a false economy, you are likely to transmit those organisms
especially if you are going to be cooking (Bartton).
I prefer the drying [my clothes] in the sunlight... Sunshine gets rid of all sorts of things (Heap).
Ob
edie
nt
Being dutiful, meeting obligations
*When asked ‘what is it about the energy efficiency that is important to you’?+ Well it’s just uh, its economical. I think the whole community’s got to do this; I’ve been brought up with the whole propaganda. And I agree with it entirely so I do my biggest” (Hauston).
*Talking about why they do some dishes by hand+ “We have a son who trained as a chef and that
was one of the first things he said, he gave me a couple of his knives when he gave up cooking as
a job and he just said “if I ever find them in the dishwasher then I will take them back”… I say,
what’s the point of learning from experts if we don’t follow their advice” (Davis).
[talking about taking showers as opposed to baths+ “We have a grandson that lives with us, and
they did a project at school on conservation, and it entailed finding out how much water there
was in the bath compared with how much in the shower, and I was amazed at the difference.
Poor kid, he then had to have showers” (Davis).

75
Re
spec
t fo
r Tr
adit
ion
Preservation of time-honoured customs “As I get older I find that what I thought was a bit unfashionable, and we were ashamed of (like
my mother wouldn’t use plastic when it first came to the market, she felt it was bad for us…) and
I mean now...now we know… and I respect it much more” (Bartton).
“Because in Malaysia we do that all the time” (Baaty).
“I grew up in the country with tanks, so I know to be careful with water. I’ve been brought up to
be careful with water” (Heap).
Ch
oo
sin
g o
wn
go
als
Selecting own purposes *Talking about energy efficiency light bulbs+ “I don’t agree that they are ugly, I think beauty is in
the eye of the beholder” (Barchi).
“I suppose it’s just the general lifestyle thing... I think very much the same about lots of things,
and we just like to be modest on power usage, just like we are with cars - we’ve got small cars.
It’s just, it is, we’re not fanatical but we do, it’s kind of a small hobby if you like” (Falckon).
“I had a debate with the electrician who put the new cylinder in, I said no I want it that 5 degrees
hotter” (Davis).
Ho
no
uri
ng
Par
en
ts
and
Eld
ers
Showing respect “I’ve invested in icebreakers of each colour... It’s the logical thing to do isn’t it? I can hear my
parents, they’d say: ‘put another jersey on!’. *Interviewer: so you wear an icebreaker in the
house?+ Oh yes, just a light one, that’s the 1/50 icebreakers” (Bartton).
“We never had money to throw around like you know my family in the old country, so we sort of
grow up with those habits and switch the light off sort of thing” (Waters).
*When asked ‘Is there any reason why you wait for a full load before doing your laundry?+ “Just
because I’ve been brought up that way” (Jenkins).
76
Soci
al O
rder
Stability of society *Explaining why they installed energy efficient light bulbs+ “Tim’s is a new Zealander, Kiwi he’s
very proud of his country and well he doesn’t like some of the idiots in the parliament but it
doesn’t matter about that, but he feel like to do if the government asks him to do something, he
will make sure we do it. I call it an obedient citizen and I live with him and I become that way and
we train the children that way” (Baaty).
[When asked if they would consider changing energy suppliers to save money+ “We changed to
Meridian in 2004 or thereabouts. We had Trustpower before that. We didn’t like Trustpower
being foreign owned, much preferred Meridian being a NZ owned company, which had ties to
the government people and also it used water and hydro power” (Falckon).
[When asked if they would consider changing energy suppliers to save money], [We are with]
Contact and I’m liking them, I find their consumer service to be good…I’ll pay more for service
and you know we haven’t had any problems with them. They’ve been consistent in their usage. If
we were talking about telecom, you know the phone service here I could go on for hours about
how horrible it is in New Zealand, energy could go the same way so I rather use one company
that I know I can talk to a person in English and they’ll work with me”(Jackells).

77
6.9 Appendix I: Value Ladders
Q2: Washing hands in cold water
V Clean Pleasure
R
Not
hygenicTime Comfort Routine Not healthy Situation
B
Never, Rarely
(1,2)
V Capable Clean Protecting the env
R Conservation Hygenic Comfort Economy Environment Environment Situation Technical
B
Often, Always
(4,5)
Code:
3-5:
6-8:
9-over:

78
Q3: Rinsing dishes in cold water
V Clean
R Hygenie Convenience Time
B Never, Rarely (1,2)
V Capable Clean Intelligent Protecting the env
R Conservation Economy Situation Technical
B Often, Always (4,5)
Code:
3-5:
6-8:
9-over:

79
Q4: Reduce heating in unoccupied rooms
V Pleasure
R Comfort
B Never, Unlikely (1,2)
V Pleasure Capable
R Conservation Comfort Convenient Economy Environment Finance Situation Technical
B
Would actively consider,
Already do (4,5)
Code:
3-5:
6-8:
9-over:
(4,5). Intelligent (3) no strong link to R
(4,5). Protecting the env (3) no strong link to R
Q6: Wait for a full load before using washing machine
R Situation
B Never, Unlikely (1,2)
V Capable Protecting the env
R Conservation Comfort Convenience Economy Environment Time Routine Situation Techinical
B
Would actively consider,
Already do (4,5)
Code:
3-5:
6-8:
9-over:

80
Q7: Put on more clothing before turning up the heating
R Comfort Pleasure
B Never, Rarely (1,2)
V Capable Pleasure Protecting the env
R Conservation Comfort Convenience Economy Environment Routine Situation
B Often, Always (4,5)
Code:
3-5:
6-8:
9-over:
Respect for trad (5), but not strong link to a R
Q8: Keep household heating low to save energy
V Pleasure
R Comfort Health
B Never, Rarely (1,2)
V Capable Pleasure Protecting the env
R Conservation Comfort Economy Environment Health Situation Technical
B Often, Always (4,5)
Code:
3-5:
6-8:
9-over:
(4,5) Intelligent (3) but no strong link to R

81
Q9: Line drying of laundry
R Situation
BNever, Rarely
(1,2)
V Capable Pleasure Protecting
the env
RBetter for
your clothes Conservation
Aesthetically
pleasing Comfortable Convenient Eco efficient Env efficient Time efficient Routine
Situational
oppor
BOften, Always
(4,5)
Code:
3-5:
6-8:
9-over:

82
Q10: Taking shorter showers
V Pleasure
R Comfort
B Never, Rarely (1,2)
V Capable Protecting the env
R Conservation Comfort Economy Environment Time Situation
B Often, Always (4,5)
Code:
3-5:
6-8:
9-over:
(4,5) Influential (3) no strong link to R

83
Q11: Doing dishes by hand
R Time Situation
B Never, Unlikely (1,2)
V Protecting the env
R Conservation Convenience Environment Situation
B Would actively consider, Already do (4,5)
Code:
3-5:
6-8:
9-over:
(4,5). Capable (3) no strong link to R
Q12: Cooling down house by opening windows
No (1,2) map
V Pleasure
R Aesthetically pleasing Comfort Convenience Health Physical Situation
B
Would Actively consider,
Already do (4,5)
Code:
3-5:
6-8:
9-over:

84
Q13: Cooking on gas
V Capable
R Not convenient Not eco efficient Physical const Dangerous
B Never, Unlikely (1,2)
R Convenience Economy Time Physical Technical
B
Would actively consider,
Already do (4,5)
Code:
3-5:
6-8:
9-over:
(4,5) Capable (3) no strong link to R

85
Q14: Installing double glazing
R Financial
B Never, Unlikely (1,2)
V Capable
R Comfort Economy Finance Situation
B
Would actively consider,
Already do (4,5)
Code:
3-5:
6-8:
9-over:
(1,2). Capable (3) no strong link to R
(4,5). Choosing own goals (3). No strong link to R
(4,5) Intelligent (6). No strong link to R

86
Q15: Installing an energy efficient refrigerator
No map for (1,2)
V Capable Protecting the env
R No knowledge Economy Environment Situation
B Would actively consider, Already do (4,5)
Code:
3-5:
6-8:
9-over:
Q16: Buying a smaller refrigerator
R Convenience Time Situation
B Never, Unlikely (1,2)
V Capable (3) Protecting the env (3)
R Environment (3) Situation (3)
B
Would actively consider, Already
do (4,5)
Key:
Coded 3-5 times:
Coded 6-8 times:
Coded 9+ times:
(1,2). Capable (3), no strong link to R

87
Q17: Installing an energy efficient washing machine
No map for (1,2)
V Capable Intelligent Protecting the env
R Economy Environment
B Would actively consider, Already do (4,5)
Code:
3-5:
6-8:
9-over:
Q19: Insulation of heating pipes
No (1,2) map
R No Knowledge Economy Situation
B
Would Actively
consider, Already do
(4,5)
Code:
3-5: 1pt width
6-8: 2 1/4 pt width
9-over: 4 1/2 pt width
(4,5). Capable (4) no strong link to R

88
Q20: House insulation
No map for (1,2)
V Capable Choosing own goals Pleasure
R Comfort Convenience Economy Finance Physical Situation
B
Would actively
consider, Already do
(4,5)
Key
3-5 times
6-8 times
9+:
(4,5). A meaning in life (3) no strong link to R
(4,5). Intelligent (3) no strong link to R
(4,5). Protecting the env (4) no strong link to R
Q21: Installing an energy-efficient heating system (such as a heat pump)
R Situation
B Never, Unlikely (1,2)
V Pleasure Capable
R Comfort Convenience Economy Environment Finance (3) Situation Technical
B
Would actively
consider, Already do
(4,5)
Code:
3-5:
6-8:
9-over:
(4,5). Intelligent (3) no strong link to R
(4,5). Obedient (3) no strong link to R

89
Q22: Applying hot water insulation
No map for (1,2)
V Capable
R Economy Situation Technical
B
Would actively
consider, Already do
(4,5)
Code:
3-5:
6-8:
9-over:

90
Q23: Changing energy suppliers to save money
R Convenience Economy
B Never, Unlikely (1,2)
V Capable
R Convenience Economy Finance
B
Would actively
consider, Already do
(4,5)
Code:
3-5:
6-8:
9-over:
(4,5). Protecting the env (3) no strong link to R


