
How to Process, Visualize, and Analyze Data
Eugene Wu, Adam Marcus
1
Course Basics
• 5 lab days: ~30min background, 2.5h lab
• 1 presentation madness day
• No grades
• No homework, unless you don’t finish lab
2
Day 6 Madness
• After lab 4, you will have all the skills you need
• Find your own dataset + questions
• Tell us a story: 2 slides, 1 minute
3

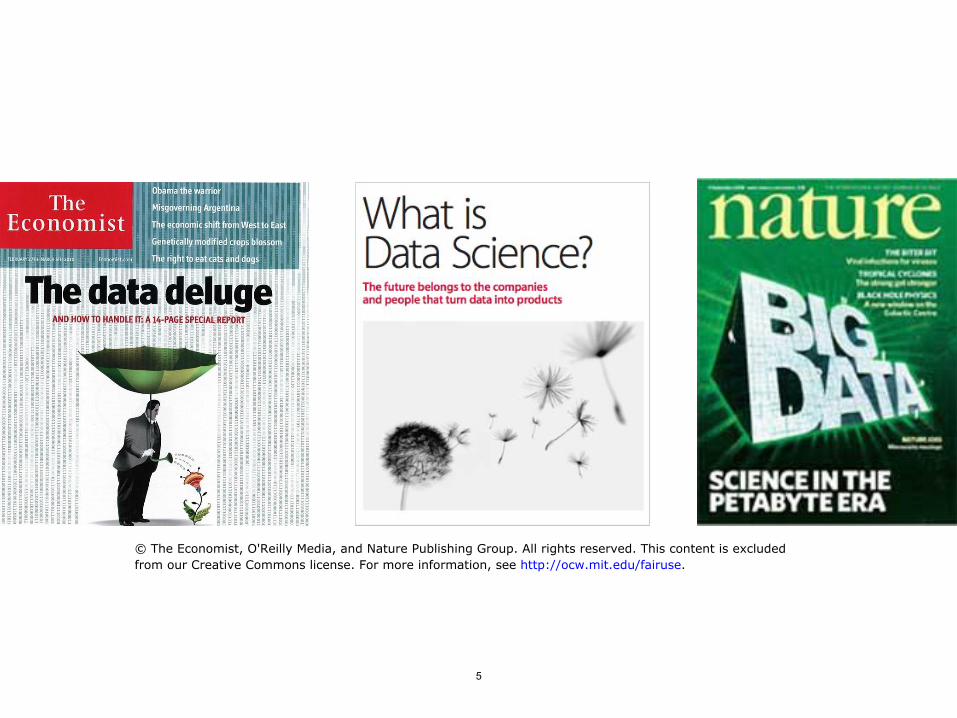
Why is this important?
4
5
© The Economist, O'Reilly Media, and Nature Publishing Group. All rights reserved. This content is excludedfrom our Creative Commons license. For more information, see http://ocw.mit.edu/fairuse.

“I keep saying that the sexy job in the next 10 years will be statisticians”
Hal Varian, Chief Economist Google
Statisticians will never have a sexy job. Data-powered storytellers will.
6
Schedule
7

Day 0
• Setup
• Optimistically, you’ve already done this
8

Today
9
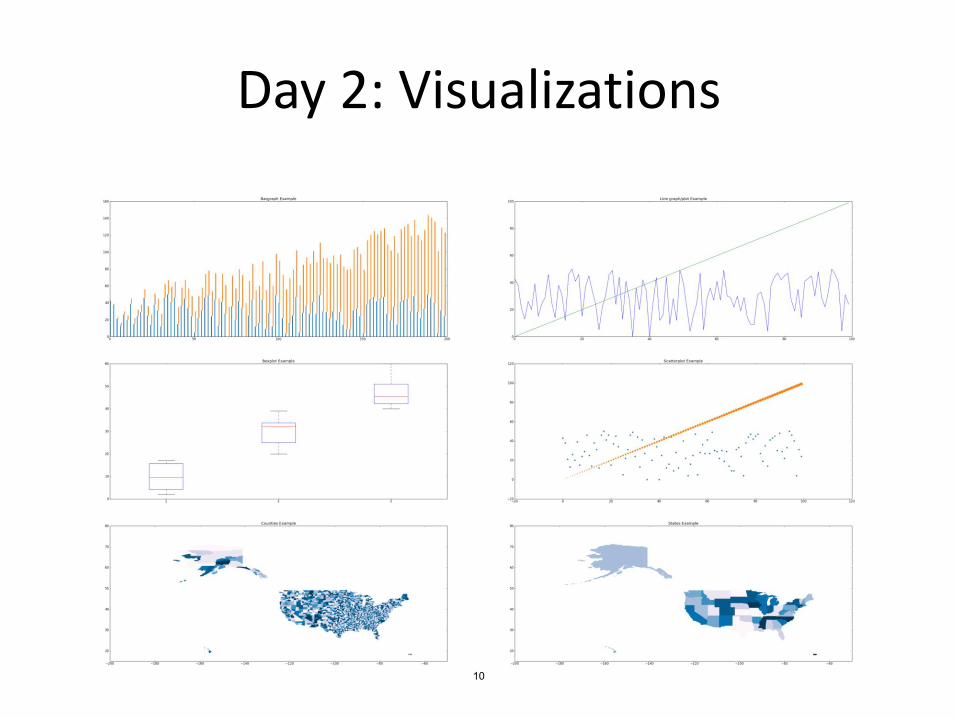
Day 2: Visualizations
10

Day 3: Statistics
11

Day 4: Text Analysis with Kenneth Lay
Day 5: Scaling up with Hadoop/MapReduce
12
Images of Kenneth Lay removed due to copyright restrictions.
Day 6: Storytelling Madness!
biology
stackoverflow
source code
healthcare finance
web scraping
economics
sociology
13
MIT OpenCourseWarehttp://ocw.mit.edu
Resource: How to Process, Analyze and Visualize DataAdam Marcus and Eugene Wu
The following may not correspond to a particular course on MIT OpenCourseWare, but has been provided by the author as an individual learning resource.
For information about citing these materials or our Terms of Use, visit: http://ocw.mit.edu/terms.


