

Human Populations:Human Populations:Population DynamicsPopulation Dynamics
IB syllabus: 3.1.1-3.1.4IB syllabus: 3.1.1-3.1.4Ch 12Ch 12
Video: Population connection videoVideo: Population connection video Population Paradox – world in the Population Paradox – world in the
balancebalance
Syllabus StatementsSyllabus Statements 3.1.1: Describe the nature and explain the 3.1.1: Describe the nature and explain the
implications of exponential growth in human implications of exponential growth in human populationspopulations
3.1.2: Calculate and explain, from given data, 3.1.2: Calculate and explain, from given data, the values of crude birth rate, crude death the values of crude birth rate, crude death rate, fertility , doubling time and natural rate, fertility , doubling time and natural increase rateincrease rate
3.1.3: Analyze age/sex pyramids and 3.1.3: Analyze age/sex pyramids and diagrams showing demographic transition diagrams showing demographic transition modelsmodels
3.1.4: Discuss the use of models in predicting 3.1.4: Discuss the use of models in predicting the growth of human populationsthe growth of human populations

vocabularyvocabulary
Crude birth rateCrude birth rate
Crude death rateCrude death rate
Demographic transitionDemographic transition
Doubling timeDoubling time
FertilityFertility
Rate of natural increaseRate of natural increase

Factors Effecting Population SizeFactors Effecting Population Size
3 factors effecting population birth, 3 factors effecting population birth, death, & migrationdeath, & migration
Population change = (Birth + Population change = (Birth + Immigration) – (Deaths + Emigration)Immigration) – (Deaths + Emigration)
Rates more often usedRates more often used Crude Birth rate = # live births / 1000 Crude Birth rate = # live births / 1000
people in year populationpeople in year population Crude Death rate = # deaths / 1000 Crude Death rate = # deaths / 1000
people in year populationpeople in year population

Average crude birth rate Average crude death rate
World
All developedcountries
All developingcountries
Developingcountries
(w/o China)
21
9
11
10
24
8
29
9
© 2004 Brooks/Cole – Thomson Learning

Africa
LatinAmerica
Asia
Oceania
UnitedStates
NorthAmerica
Europe
38
14
23
6
20
7
18
7
15
9
14
9
10
11
© 2
004
Bro
oks
/Co
le –
Th
om
son
Lea
rnin
g

World Population ChangeWorld Population Change
Worldwide birth and death rates droppingWorldwide birth and death rates dropping Death rate dropping faster than birth rateDeath rate dropping faster than birth rate 216,000 people added to world population 216,000 people added to world population
dailydaily Exponential population growth still occurring Exponential population growth still occurring
but slowerbut slower http://www.census.gov/main/www/popclock.htm
l - Population counter - Population counter
But base number still increasingBut base number still increasing 79 x 1079 x 1066 people added per year people added per year

World Population over the CenturiesWorld Population over the Centuries
9,000 human beings added to the planet every hour
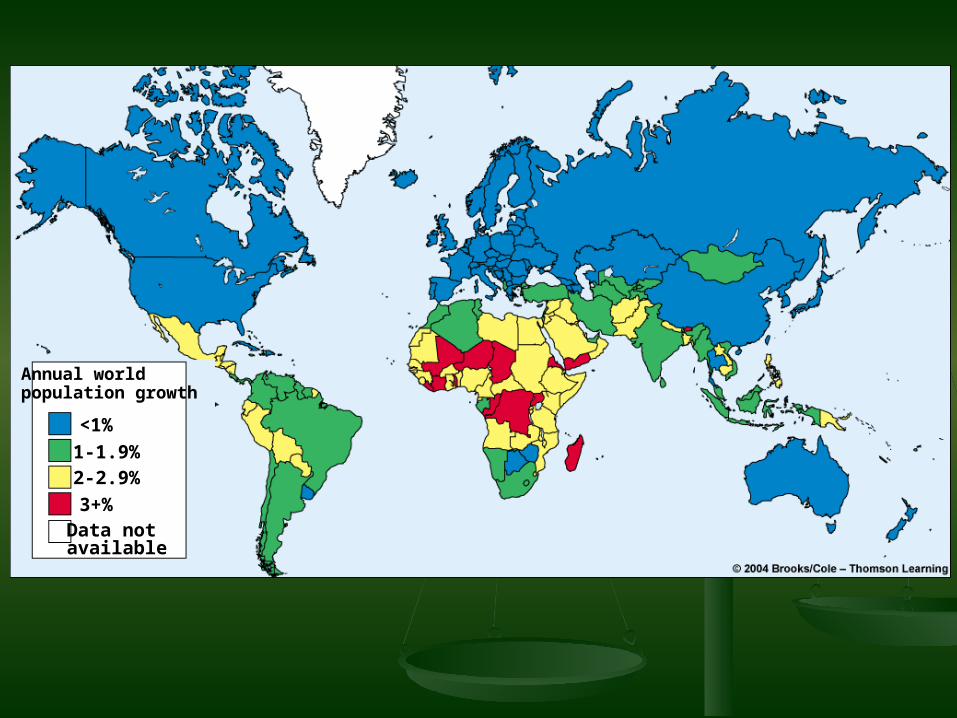
<1%
1-1.9%2-2.9%
3+%Data notavailable
Annual worldpopulation growth
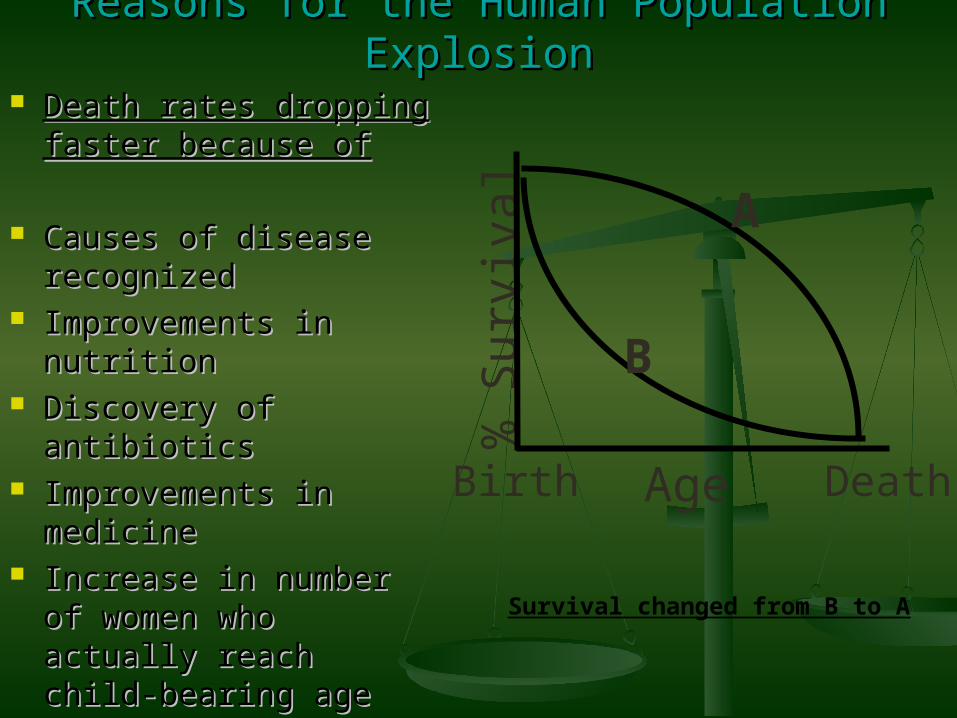
Reasons for the Human Population ExplosionReasons for the Human Population Explosion
Death rates dropping Death rates dropping faster because offaster because of
Causes of disease Causes of disease recognizedrecognized
Improvements in Improvements in nutritionnutrition
Discovery of antibioticsDiscovery of antibiotics Improvements in Improvements in
medicinemedicine Increase in number of Increase in number of
women who actually women who actually reach child-bearing agereach child-bearing age
% S
urvi
val
AgeBirth Death
A
B
Survival changed from B to A

Implications of Exponential GrowthImplications of Exponential Growth
Biotic potential exceeds environmental Biotic potential exceeds environmental resistance: birth rates exceed death ratesresistance: birth rates exceed death rates
Outstrip our resource base – Outstrip our resource base – nonrenewable gone, renewable maybe nonrenewable gone, renewable maybe used faster than replacedused faster than replaced
Increase strain on the environment – Increase strain on the environment – pollution, sanitation needs, biodiversity pollution, sanitation needs, biodiversity lossloss
Increase food production & land under Increase food production & land under productionproduction

Average Number of Children, Average Number of Children, Grandchildren, and Great Grandchildren, and Great
GrandchildrenGrandchildren
AmericaAmerica West GermanyWest Germany AfricaAfrica
1414 55 258258

FertilityFertility
Replacement fertilityReplacement fertility – number of children a – number of children a couple must bear to replace themselves – couple must bear to replace themselves – roughly 2.1roughly 2.1
Reaching replacement fertility now would still Reaching replacement fertility now would still cause population growth for another 50 cause population growth for another 50 yearsyears
Total fertility rateTotal fertility rate (TFR)= # of children a (TFR)= # of children a woman will have in her childbearing years woman will have in her childbearing years (15-49)(15-49)
TFR = 1.6 in developed countries, 3.1 in TFR = 1.6 in developed countries, 3.1 in developing countriesdeveloping countries

Calculating Fertility Rates and Calculating Fertility Rates and Doubling TimesDoubling Times
(CBR – CDR)/10 = Rate of increase or decrease in population per 1,000 per year
70/Rate of Increase = Doubling Time
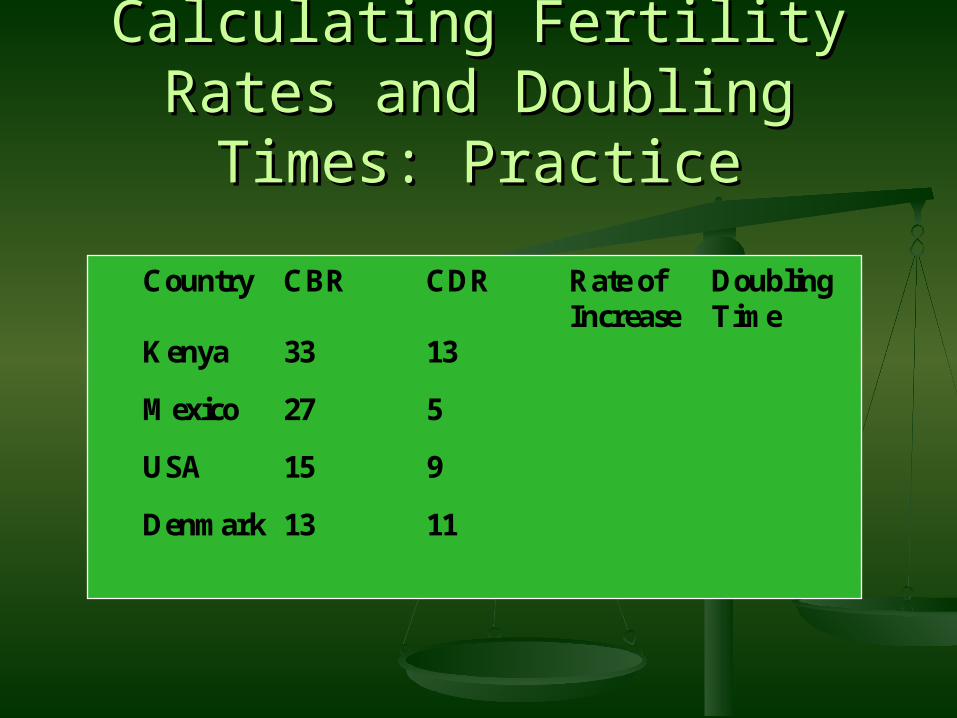
Calculating Fertility Rates and Calculating Fertility Rates and Doubling Times: PracticeDoubling Times: Practice
Country CBR CDR Rate of Increase
Doubling Time
Kenya 33 13
Mexico 27 5
USA 15 9
Denmark 13 11

Calculating Fertility Rates and Calculating Fertility Rates and Doubling Times: AnswersDoubling Times: Answers
Country CBR CDR Rate of Increase
Doubling Time
Kenya 33 13 2.0 35
Mexico 27 5 2.2 32
USA 15 9 0.6 116
Denmark 13 11 0.2 431
350

Births per woman
< 2
2-2.9
3-3.9
4-4.9
5+
Data notavailable
Worldwide TFR in 2002
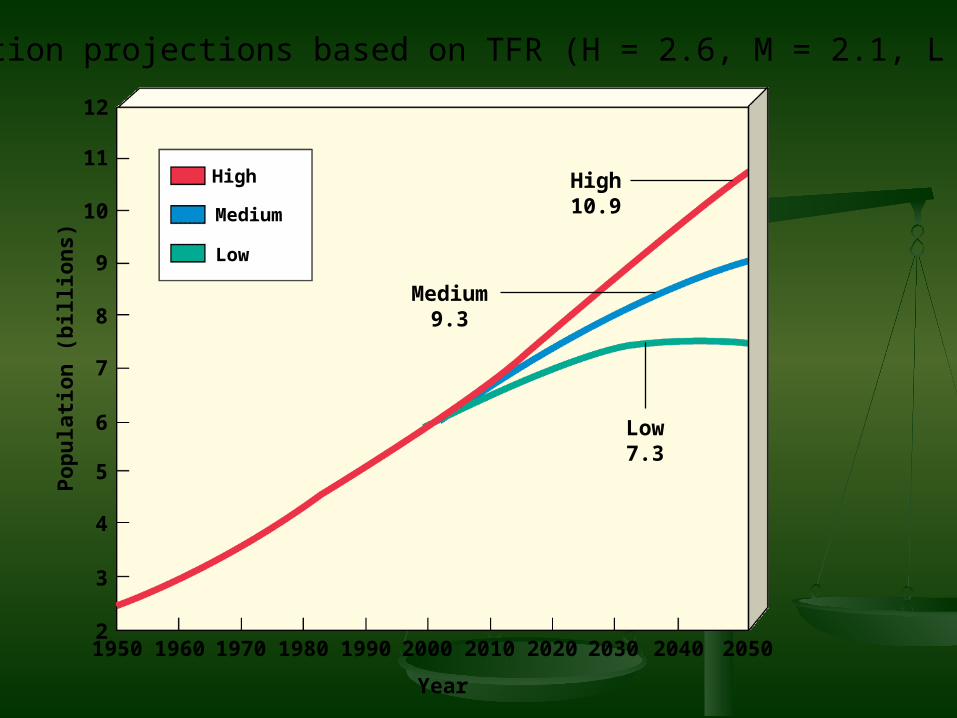
High
Medium
Low
12
11
10
9
8
7
6
5
4
3
21950 1960 1970 1980 1990 2000 2010 2020 2030 2040 2050
High10.9
Medium9.3
Low7.3
Year
Po
pu
lati
on
(b
illio
ns)
Population projections based on TFR (H = 2.6, M = 2.1, L = 1.7)

4.0
3.5
3.0
2.5
2.02.1
1.5
1.0
0.5
01920 1930 1940 1950 1960 1970 1980 1990 2000 2010
Year
Bir
ths
per
wo
man
Baby boom(1946-64)
US fertility and the “baby boom”
323028262422201816140
Bir
ths
pe
r th
ou
sa
nd
po
pu
lati
on
1910 1920 1930 1940 1950 1960 1970 1980 1990 2000 2010
Year
Demographictransition
Depression
End of World War II
Baby boom Baby bust Echo baby boom
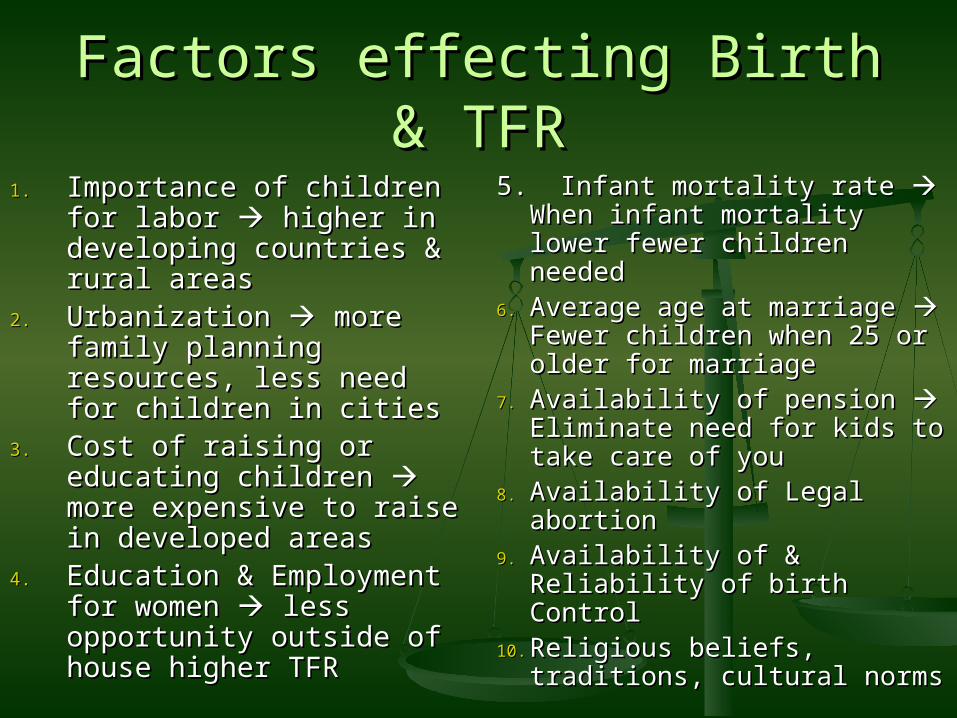
Factors effecting Birth & TFRFactors effecting Birth & TFR
1.1. Importance of children Importance of children for labor for labor higher in higher in developing countries & developing countries & rural areasrural areas
2.2. Urbanization Urbanization more more family planning family planning resources, less need for resources, less need for children in citieschildren in cities
3.3. Cost of raising or Cost of raising or educating children educating children more expensive to raise more expensive to raise in developed areasin developed areas
4.4. Education & Employment Education & Employment for women for women less less opportunity outside of opportunity outside of house higher TFRhouse higher TFR
5. Infant mortality rate 5. Infant mortality rate When infant mortality When infant mortality lower fewer children lower fewer children neededneeded
6.6. Average age at marriage Average age at marriage Fewer children when 25 Fewer children when 25 or older for marriageor older for marriage
7.7. Availability of pension Availability of pension Eliminate need for kids to Eliminate need for kids to take care of youtake care of you
8.8. Availability of Legal Availability of Legal abortionabortion
9.9. Availability of & Reliability Availability of & Reliability of birth Controlof birth Control
10.10. Religious beliefs, Religious beliefs, traditions, cultural normstraditions, cultural norms

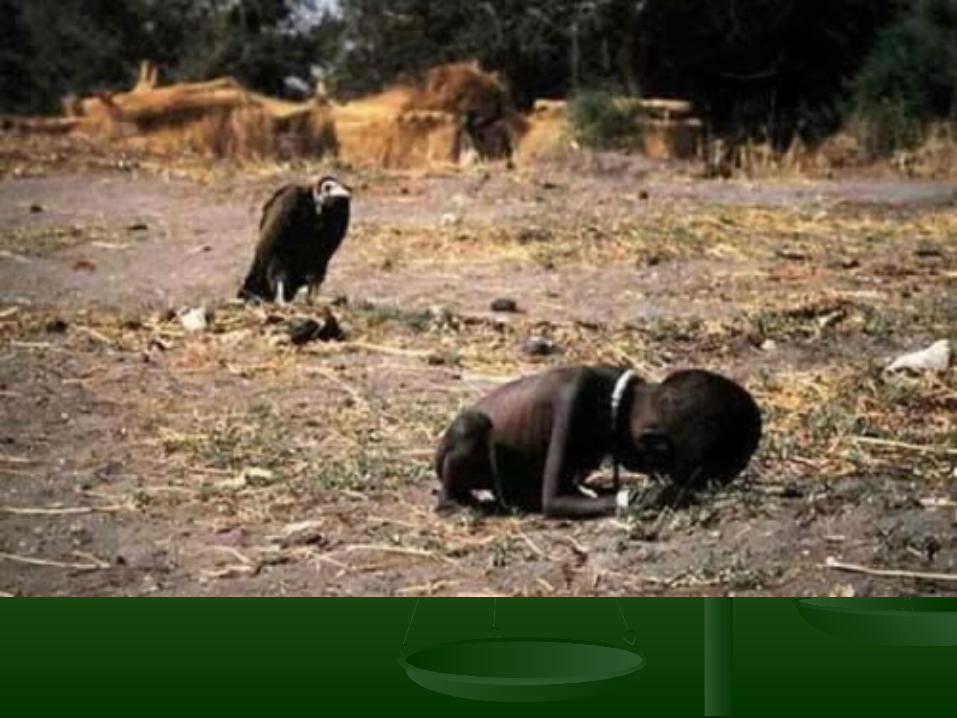
Life & DeathLife & Death Infant mortality and Life Expectancy are Infant mortality and Life Expectancy are
good indicators of health in a countrygood indicators of health in a country Global life expectancy is increasingGlobal life expectancy is increasing Poorest countries it may still be low or even Poorest countries it may still be low or even
falling (AIDS in Africa)falling (AIDS in Africa) Infant mortality encompasses nutrition & Infant mortality encompasses nutrition &
health care so it’s a good measurehealth care so it’s a good measure Still 8 million infants worldwide dieing of Still 8 million infants worldwide dieing of
preventable causes in first year of lifepreventable causes in first year of life US – teen pregnancy rate highest of all US – teen pregnancy rate highest of all
industrialized countriesindustrialized countries

<1010-3536-70
100+Data notavailable
Infant deaths per 1,000 live births
71-100

Different WorldsDifferent Worlds
Rich nations, poor nationsRich nations, poor nations Population growth in rich and poor Population growth in rich and poor
nationsnations Different populations, different problemsDifferent populations, different problems
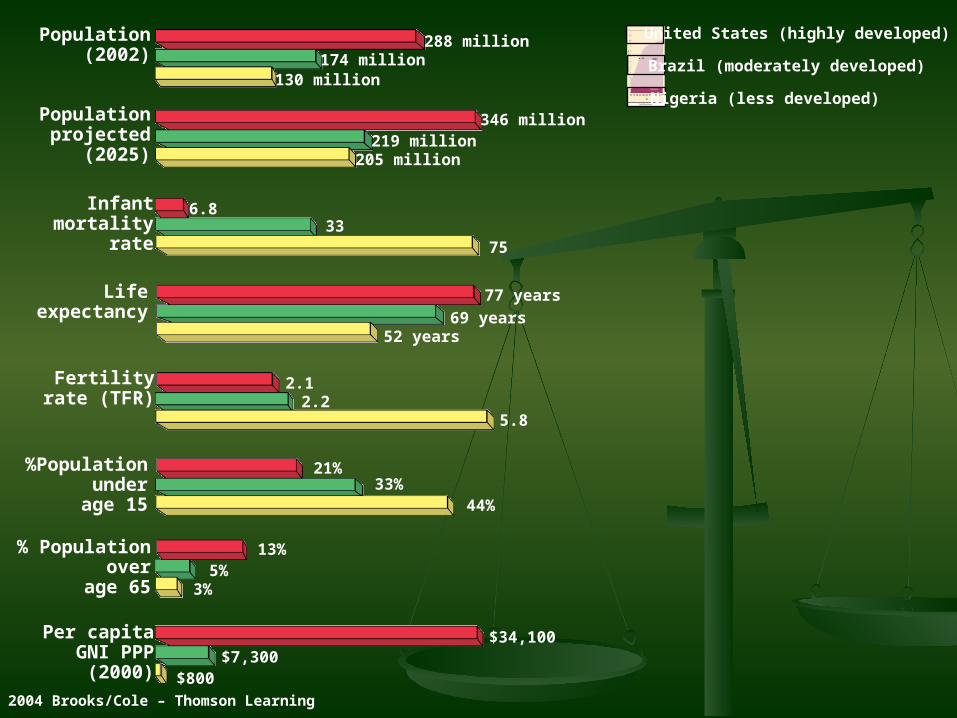
Population(2002)
Populationprojected
(2025)
Infantmortality
rate
Lifeexpectancy
Fertilityrate (TFR)
%Populationunder
age 15
% Populationover
age 65
Per capitaGNI PPP
(2000)
288 million174 million
130 million
346 million219 million
205 million
6.833
75
77 years
69 years52 years
2.12.2
5.8
21%33%
44%
13%5%
3%
$34,100$7,300
$800
United States (highly developed)
Brazil (moderately developed)
Nigeria (less developed)
© 2004 Brooks/Cole – Thomson Learning

Economic Categories Based on Per Economic Categories Based on Per Capita Gross National IncomeCapita Gross National Income
High-income, highly developed, High-income, highly developed, industrialized countriesindustrialized countries United States, Japan, CanadaUnited States, Japan, Canada Average GNI per capita = $26,710Average GNI per capita = $26,710
Middle-income, moderately developed Middle-income, moderately developed countriescountries Latin America, South Africa, ChinaLatin America, South Africa, China Average GNI per capita = $1,850Average GNI per capita = $1,850
Low-income, developing countriesLow-income, developing countries Western and central Africa, India, central AsiaWestern and central Africa, India, central Asia Average GNI per capita = $430Average GNI per capita = $430

DisparitiesDisparities
Developed countriesDeveloped countries 16% of the world’s population16% of the world’s population Control 81% of the world’s wealthControl 81% of the world’s wealth
Low-income developing countriesLow-income developing countries 41% of the world’s population41% of the world’s population Control 3.4% of the world’s gross national Control 3.4% of the world’s gross national
incomeincome Difference in per capita income: 62 to Difference in per capita income: 62 to
1!1!

Population Increase in Developed Population Increase in Developed and Developing Countriesand Developing Countries
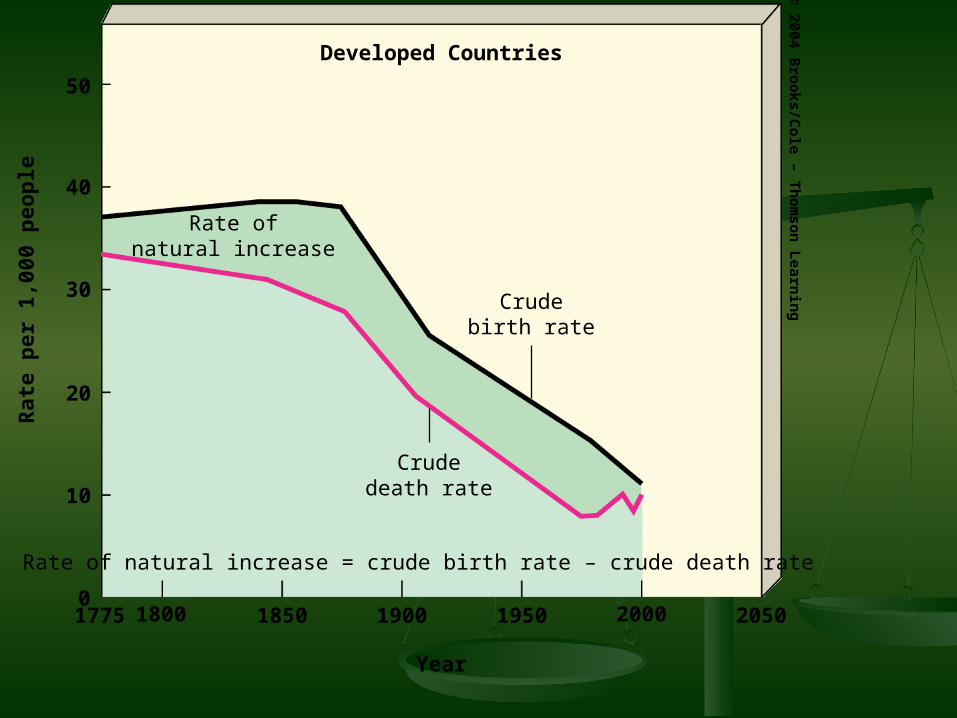
Developed Countries
50
40
30
20
10
01775 1800 1850 1900 1950 2000 2050
Rat
e p
er 1
,000
peo
ple
Year
Rate ofnatural increase
Crudebirth rate
Crudedeath rate
Rate of natural increase = crude birth rate – crude death rate
© 2004 B
roo
ks/Co
le – Th
om
son
Learn
ing

Developing Countries
50
40
30
20
10
01775 1800 1850 1900 1950 2000 2050
Rat
e p
er 1
,000
peo
ple
Crudebirth rate
Rate ofnaturalincrease
Crudedeath rate
Year
© 2004 B
roo
ks/Co
le – Th
om
son
Learn
ing

Population Age StructurePopulation Age Structure
Analysis by sex, of the proportion of Analysis by sex, of the proportion of population at each age levelpopulation at each age level
3 main age categories3 main age categories Prereproductive: 0 – 14 yearsPrereproductive: 0 – 14 years Reproductive: 15 – 44 yearsReproductive: 15 – 44 years Postreproductive: 45 and upPostreproductive: 45 and up
Represent a good comparison between Represent a good comparison between countriescountries
Compare Growth Compare Growth Rapid, Slow, Zero, Rapid, Slow, Zero, NegativeNegative

Male Female
Rapid GrowthGuatemala
NigeriaSaudi Arabia
Slow GrowthUnited States
AustraliaCanada
Male Female
Ages 0-14 Ages 15-44 Ages 45-85+
© 2004 Brooks/Cole – Thomson Learning
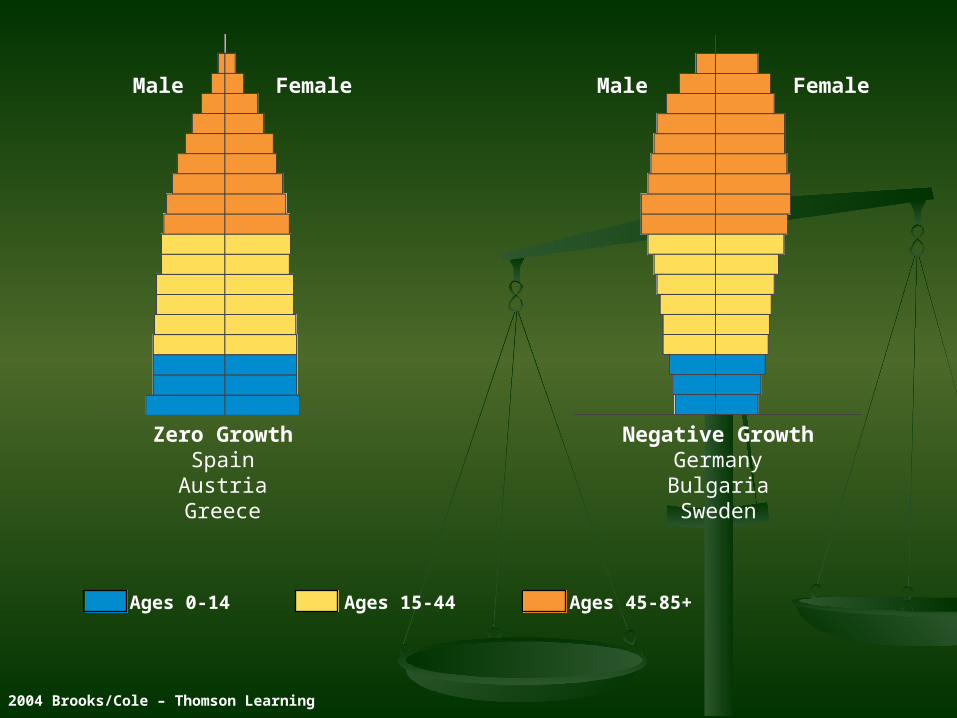
Zero GrowthSpainAustriaGreece
Negative GrowthGermanyBulgariaSweden
Male Female Male Female
Ages 0-14 Ages 15-44 Ages 45-85+
© 2004 Brooks/Cole – Thomson Learning
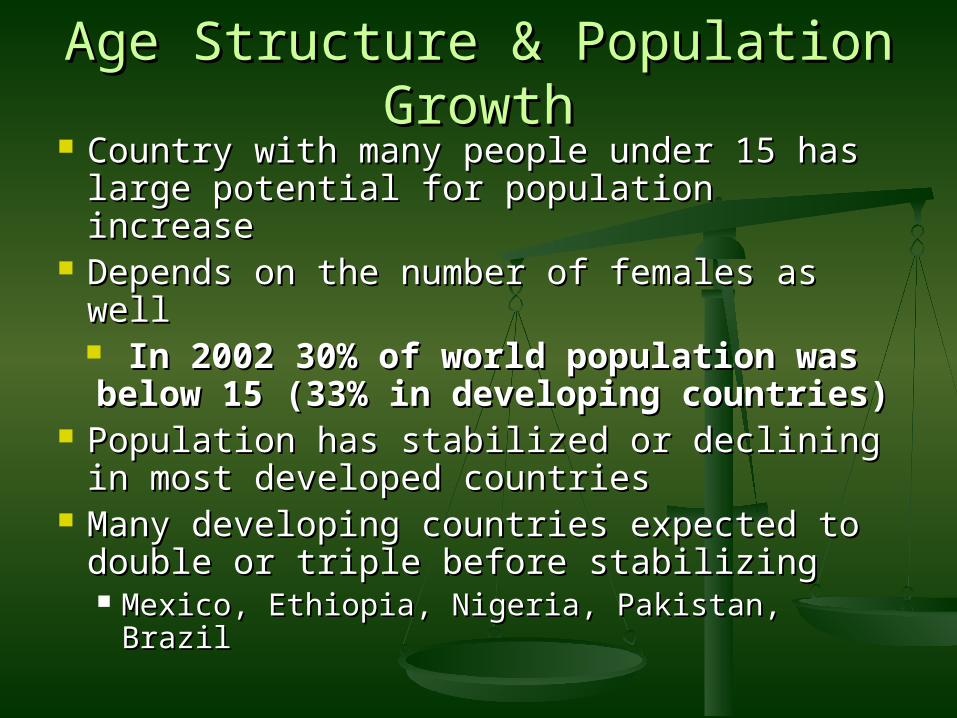
Age Structure & Population GrowthAge Structure & Population Growth Country with many people under 15 has Country with many people under 15 has
large potential for population increaselarge potential for population increase Depends on the number of females as Depends on the number of females as
wellwell In 2002 30% of world population In 2002 30% of world population
was below 15 (33% in developing was below 15 (33% in developing countries)countries)
Population has stabilized or declining in Population has stabilized or declining in most developed countriesmost developed countries
Many developing countries expected to Many developing countries expected to double or triple before stabilizingdouble or triple before stabilizing Mexico, Ethiopia, Nigeria, Pakistan, BrazilMexico, Ethiopia, Nigeria, Pakistan, Brazil

Population Population MomentumMomentum
Countries like Iraq Countries like Iraq will continue to will continue to grow for 50–60 grow for 50–60 years even after years even after the total fertility the total fertility rate is reduced to rate is reduced to replacement level.replacement level.
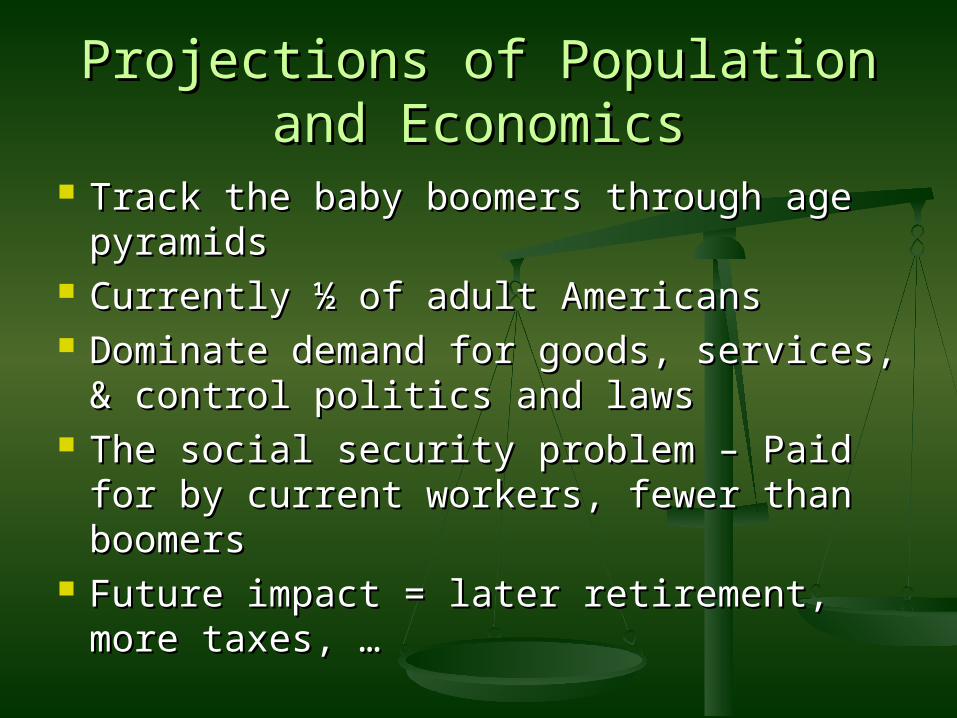
Projections of Population and Projections of Population and EconomicsEconomics
Track the baby boomers through age Track the baby boomers through age pyramidspyramids
Currently ½ of adult AmericansCurrently ½ of adult Americans Dominate demand for goods, services, Dominate demand for goods, services,
& control politics and laws& control politics and laws The social security problem – Paid for The social security problem – Paid for
by current workers, fewer than by current workers, fewer than boomersboomers
Future impact = later retirement, Future impact = later retirement, more taxes, …more taxes, …

20
Age
Females Males
1955
16128 44 8121620
Millions
Age
242016128 4 4 812162024
Females Males
1985
Millions© 2004 Brooks/Cole – Thomson Learning
Age
Females Males
2015
20161284 4812162020
Millions
Age
2420161284 4812162020
Females Males
2035
Millions
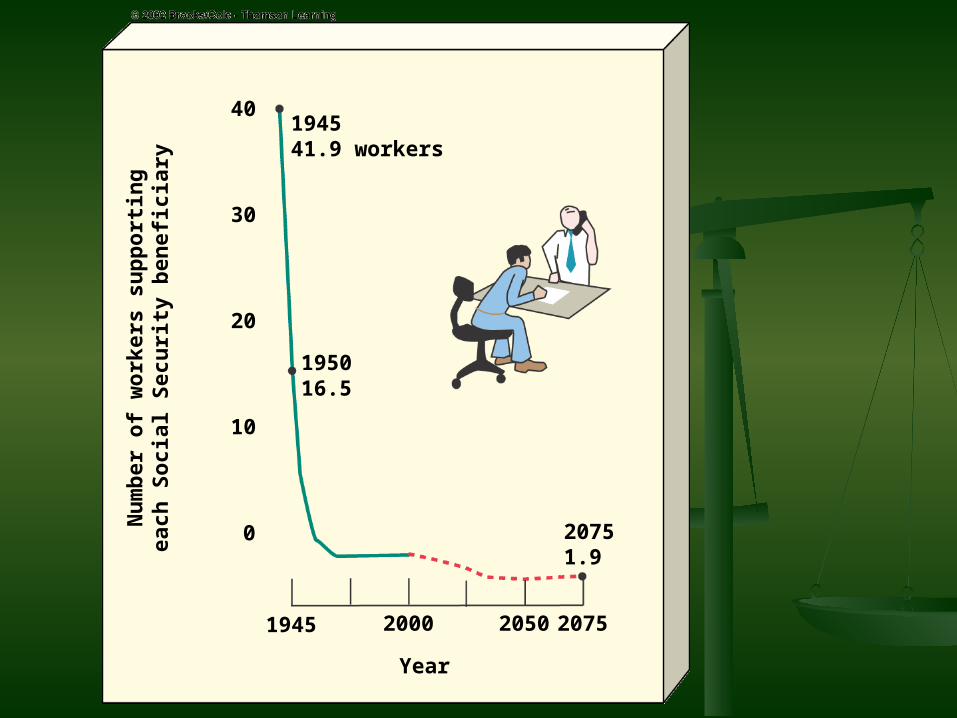
194541.9 workers
40
30
20
10
0
195016.5
20751.9
1945 2000 2050 2075
Nu
mb
er o
f w
ork
ers
sup
po
rtin
gea
ch S
oci
al S
ecu
rity
ben
efic
iary
Year
Problems with Population declineProblems with Population decline
If many populations stable nowIf many populations stable now At some future time they will begin to At some future time they will begin to
declinedecline By 2050 – 39 countries are expected By 2050 – 39 countries are expected
to be in declineto be in decline If rapid, can cause problems (1) If rapid, can cause problems (1)
consume public services, health care, consume public services, health care, social security; (2) labor shortage, social security; (2) labor shortage, increased reliance on immigrant laborincreased reliance on immigrant labor
40
35
30
25
20
15
10
5
01950 1970 1990 2010 2030 2050 2070 2090 2110 2130 2150
Year
Ag
e D
istr
ibu
tio
n (
%)
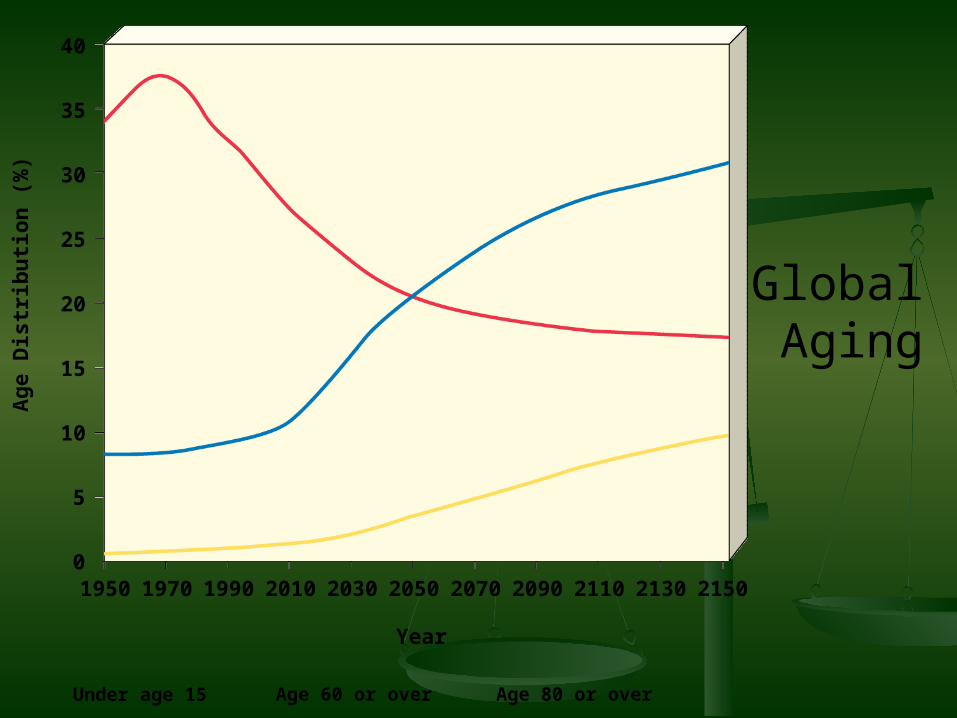
Under age 15 Age 60 or over Age 80 or over
Global Aging

Population decline from rising Population decline from rising death ratesdeath rates
HIV epidemic in Africa kills 6000 dailyHIV epidemic in Africa kills 6000 daily Kills mostly young adultsKills mostly young adults
Sharp decrease in average life expectancySharp decrease in average life expectancy Loss of productive workersLoss of productive workers Rise in numbers of orphansRise in numbers of orphans Drop in food production with loss of laborersDrop in food production with loss of laborers
Need new Marshall PlanNeed new Marshall Plan Reduce HIV spread: education, health servicesReduce HIV spread: education, health services Restore economic progress: aid as $ & Restore economic progress: aid as $ &
volunteersvolunteers

Is the world overpopulated?Is the world overpopulated?
Wrong question?Wrong question? What is the optimum number of people What is the optimum number of people
that can be sustainably supported by that can be sustainably supported by the earth without further the earth without further environmental degradationenvironmental degradation
Optimum would allow people to live Optimum would allow people to live comfortably without harming future comfortably without harming future generationsgenerations

SolutionsSolutions
1.1. Reducing births!Reducing births!- Violation of personal and religious Violation of personal and religious
freedomsfreedoms- Viewed as a form of genocide by some Viewed as a form of genocide by some
ethnic groupsethnic groups- BUTBUT- We currently don’t provide basic needs We currently don’t provide basic needs
for 1/6 of the world populationfor 1/6 of the world population- Increasing environmental harm & death Increasing environmental harm & death
ratesrates- Life span longer today so we have a Life span longer today so we have a
greater per person impact toogreater per person impact too

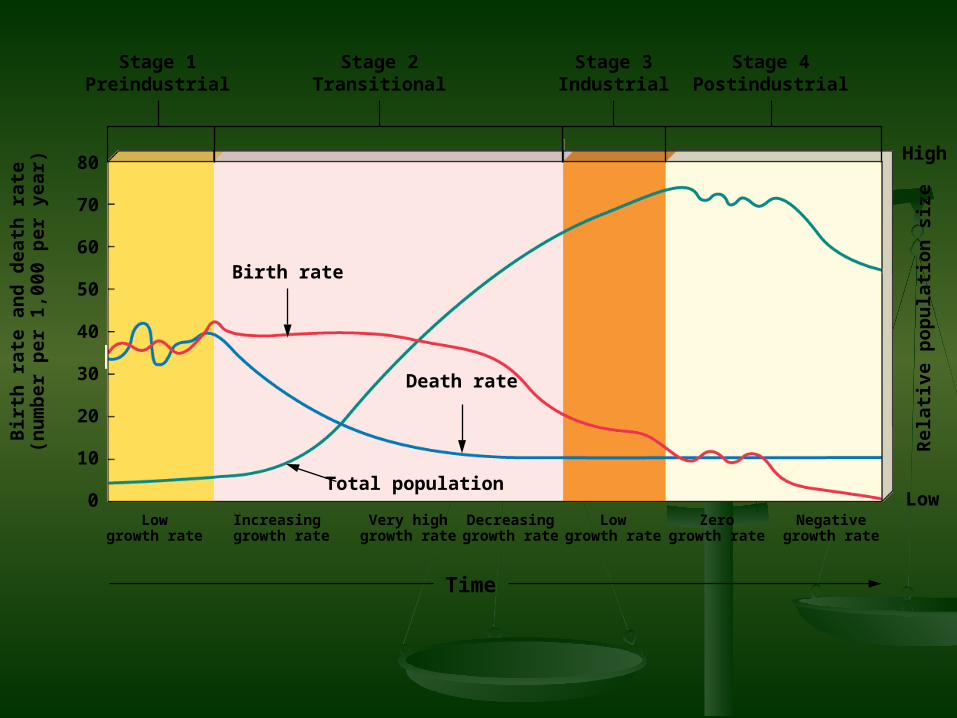
Demographic Transition HypothesisDemographic Transition Hypothesis As countries become industrialized first As countries become industrialized first
death rate then birth rate will declinedeath rate then birth rate will decline1.1. Preindustrial Stage Preindustrial Stage harsh living conditions harsh living conditions
= little population growth, high B & D= little population growth, high B & D2.2. Transitional Stage Transitional Stage industrialization starts, industrialization starts,
better healthcare & food = population growth better healthcare & food = population growth is rapid, high B & lower Dis rapid, high B & lower D
3.3. Industrial Stage Industrial Stage Industry continues = Industry continues = population grows but slowly, B > D by a littlepopulation grows but slowly, B > D by a little
4.4. Postindustrial Stage Postindustrial Stage population growth population growth stops, B = D (13% of world) then B < D an stops, B = D (13% of world) then B < D an may start to decline (this may be stage 5)may start to decline (this may be stage 5)
Low
High
Rel
ati
ve
po
pu
lati
on
siz
e
Bir
th r
ate
an
d d
eath
rat
e(n
um
ber
per
1,0
00 p
er
yea
r)
80
70
60
50
40
30
20
10
0
Stage 1Preindustrial
Stage 2Transitional
Stage 3Industrial
Stage 4Postindustrial
Lowgrowth rate
Increasing growth rate
Very highgrowth rate
Decreasinggrowth rate
Lowgrowth rate
Zerogrowth rate
Negativegrowth rate
Birth rate
Total population
Death rate
Time

Demographic Transition ComparisonsDemographic Transition Comparisons
Demographic Transition HypothesisDemographic Transition Hypothesis
Most developing countries today have Most developing countries today have death rates declining more than birth death rates declining more than birth ratesrates
Still in Transitional stageStill in Transitional stage Fear that population growth in these Fear that population growth in these
areas will overcome economic growthareas will overcome economic growth Demographic TrapDemographic Trap: get stuck in a stage: get stuck in a stage Countries lack skilled workers, capital & Countries lack skilled workers, capital &
resources, drop in economic assistanceresources, drop in economic assistance

Can we reduce Birth ratesCan we reduce Birth rates
Doing so will reduce abortion rates & save Doing so will reduce abortion rates & save lives as welllives as well
1.1. Family Planning – info on birth spacing, Family Planning – info on birth spacing, birth control and prenatal carebirth control and prenatal care
2.2. Empowering women – education, job Empowering women – education, job opportunities, womens rightsopportunities, womens rights
• Women work 2/3 all hours worked, 10% Women work 2/3 all hours worked, 10% incomeincome
3.3. Economic Rewards & Penalties – Economic Rewards & Penalties – payments to individuals who use payments to individuals who use contraceptivescontraceptives

Condom5%
Female sterilization17%
IUD12%
Othermethods
10%
Pill8%
Malesterilization
5%
No method43%
Global Contraceptive Use

India: A Case StudyIndia: A Case Study World’s first national family planning World’s first national family planning
programprogram After 50 years it is still the second most After 50 years it is still the second most
populous country in world (1 billion)populous country in world (1 billion) GNIPP is $2,340 a yearGNIPP is $2,340 a year Unemployment = 50%Unemployment = 50% 40% population, 50% children suffer malnutrition40% population, 50% children suffer malnutrition 16% world population, 2% resources16% world population, 2% resources ½ cropland degraded, 70% water seriously ½ cropland degraded, 70% water seriously
pollutedpolluted Overall, program disappointing & poorly doneOverall, program disappointing & poorly done

China: A Case StudyChina: A Case Study 1972-2002 cut crude birth rate in half, TFR 1972-2002 cut crude birth rate in half, TFR
from 5.7 to 1.8 children per womanfrom 5.7 to 1.8 children per woman Encourage late marriage & 1 child per familyEncourage late marriage & 1 child per family Contraception. Sterilization, Abortion = FREEContraception. Sterilization, Abortion = FREE RewardReward Food, $$$, School tuition, Medical Food, $$$, School tuition, Medical
carecare UN projects population drop by 2042UN projects population drop by 2042 It was either population control or It was either population control or
starvationstarvation Population still growing, mass Population still growing, mass
environmental impactenvironmental impact But projected to be on the decline by 2040But projected to be on the decline by 2040

Percentageof world
population
Population (2000)
Population (2025)(estimated)
Illiteracy (%of adults)
Population under age 15(%)
Population growth rate (%)
Total fertility rate
Infant mortality rate
Life expectancy
GNP per capita(1998)
16%21%
1 billion1.3 billion
1.4 billion
1.4 billion
47%17%
36%
25%
1.8%0.9%
3.3 children per woman (down from 5.3 in 1970)1.8 children per woman (down from 5.7 in 1972)
7231
61 years
71 years
$440
$750
IndiaChina
Cutting Global Population GrowthCutting Global Population Growth
UN encouraging world population stabilityUN encouraging world population stability
Universal access to family planningUniversal access to family planning Improve health care – infants, children, Improve health care – infants, children,
womenwomen Social & Economic plans for countriesSocial & Economic plans for countries Increase access to educationIncrease access to education Eradicate povertyEradicate poverty Eliminate unsustainable patterns of Eliminate unsustainable patterns of
production and consumptionproduction and consumption

The use of ModelsThe use of Models
We can’t see the futureWe can’t see the future But we have good predictive power But we have good predictive power
based on current numbersbased on current numbers Using birth & death rates, fertility Using birth & death rates, fertility
and extrapolation we can model and extrapolation we can model populations into the futurepopulations into the future
Models based on mathematical Models based on mathematical calculations of future predictionscalculations of future predictions

Computer SimulationsComputer Simulations
View Population connection View Population connection simulationsimulation

Demographic TablesDemographic Tables http://www.wpro.who.int/information_sources/d
atabases/demographic_tables/
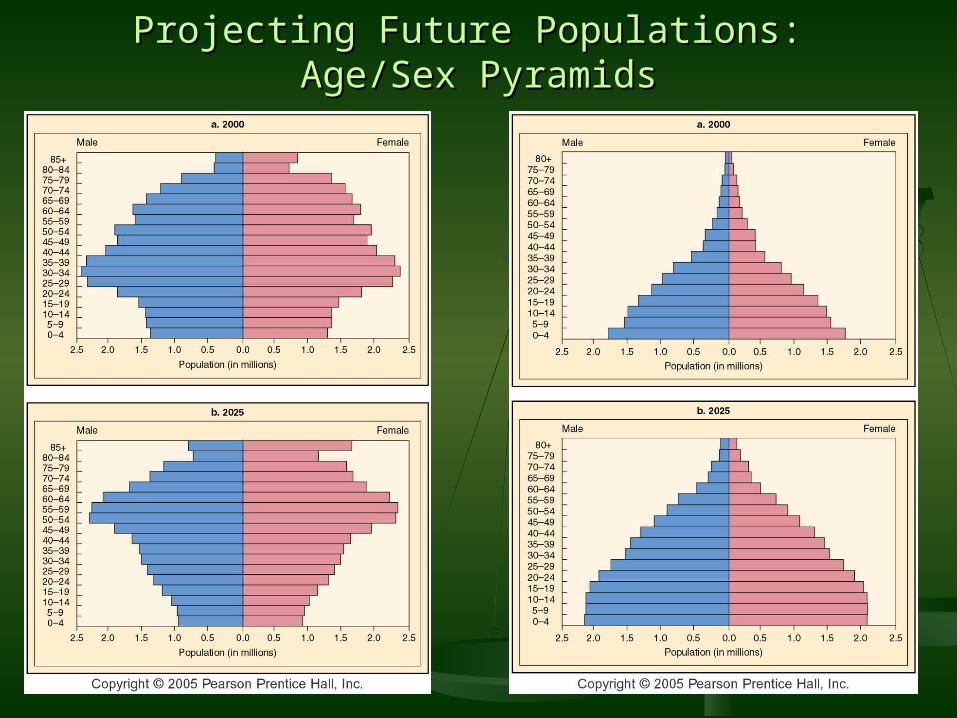
Projecting Future Populations: Age/Sex PyramidsProjecting Future Populations: Age/Sex Pyramids
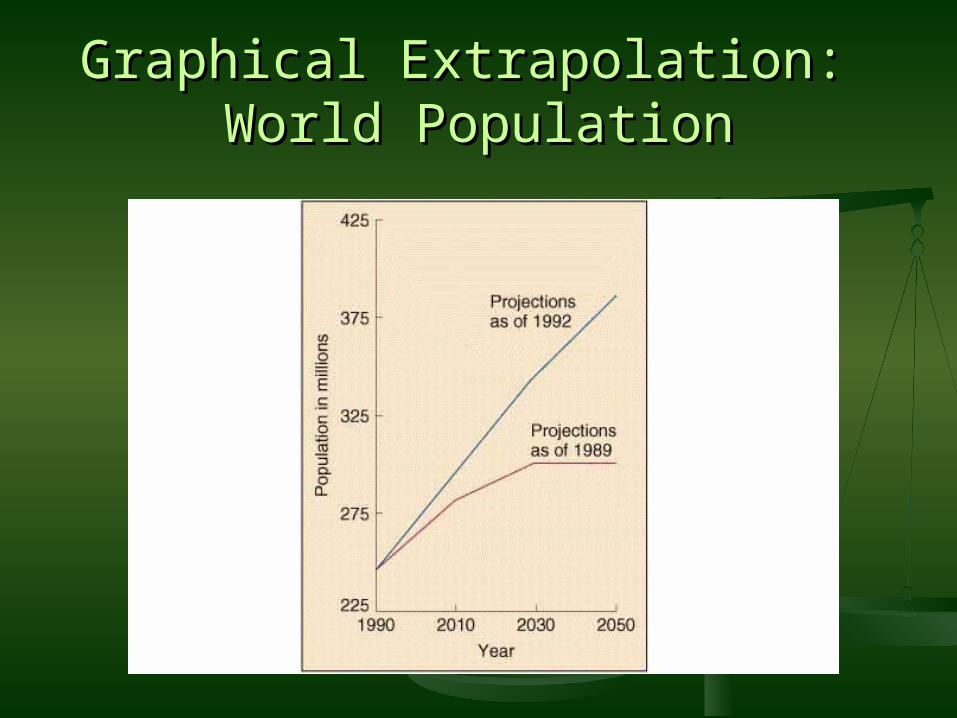
Graphical Extrapolation: World Graphical Extrapolation: World PopulationPopulation

http://www.shambles.net/worldclock/worldclock.swf

Review TopicsReview Topics
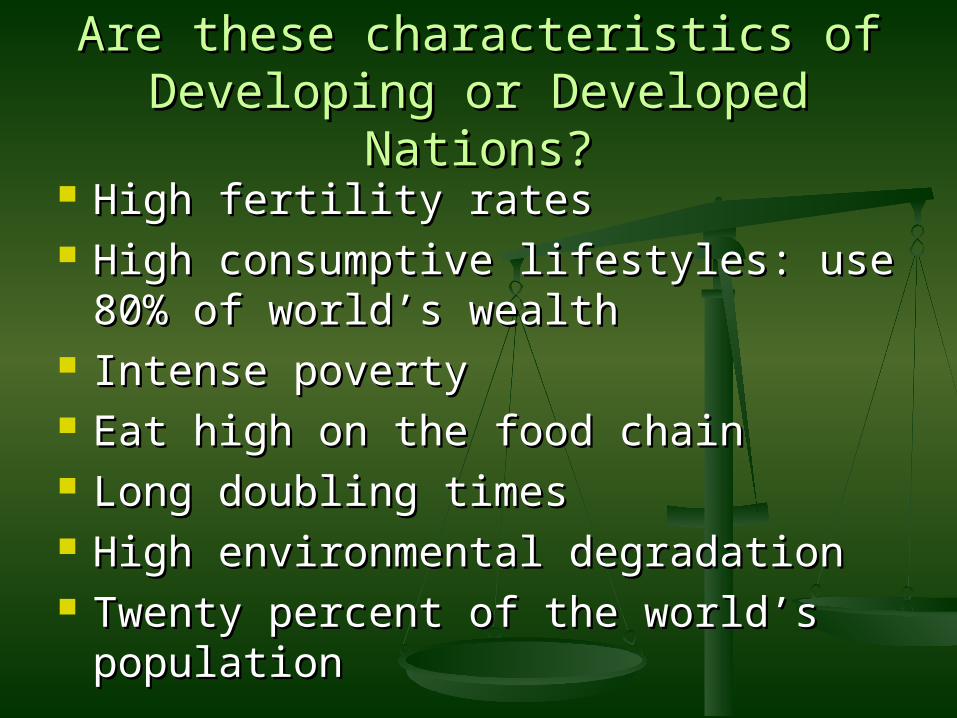
Are these characteristics of Developing Are these characteristics of Developing or Developed Nations?or Developed Nations?
High fertility ratesHigh fertility rates High consumptive lifestyles: use 80% High consumptive lifestyles: use 80%
of world’s wealthof world’s wealth Intense povertyIntense poverty Eat high on the food chainEat high on the food chain Long doubling timesLong doubling times High environmental degradationHigh environmental degradation Twenty percent of the world’s Twenty percent of the world’s
populationpopulation
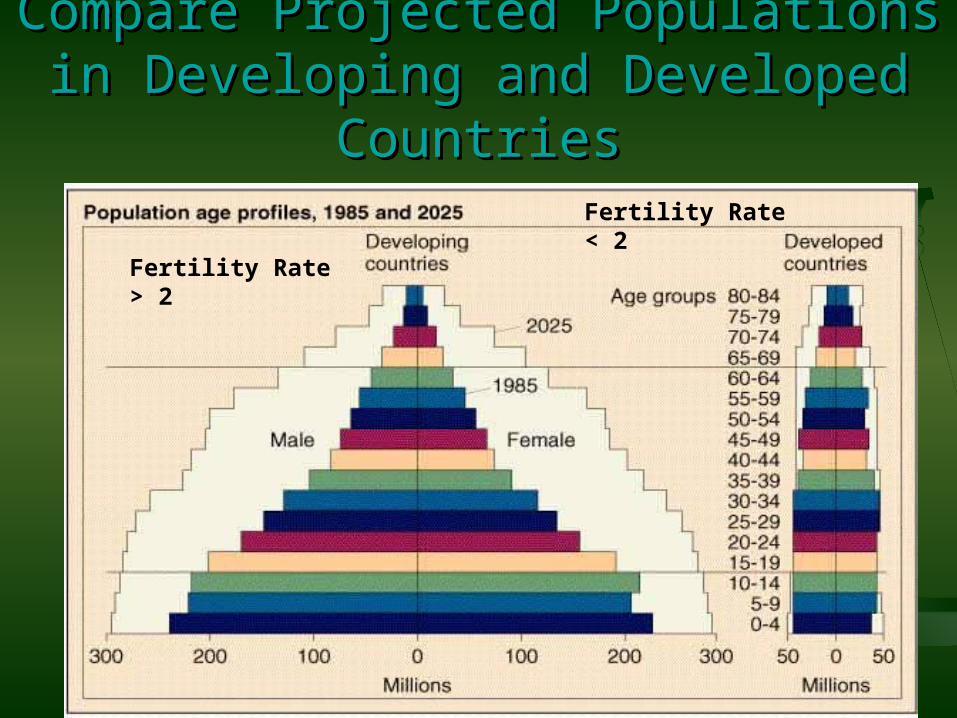
Compare Projected Populations in Compare Projected Populations in Developing and Developed CountriesDeveloping and Developed Countries
Fertility Rate> 2
Fertility Rate< 2

Plumpy nutPlumpy nut Life strawLife straw

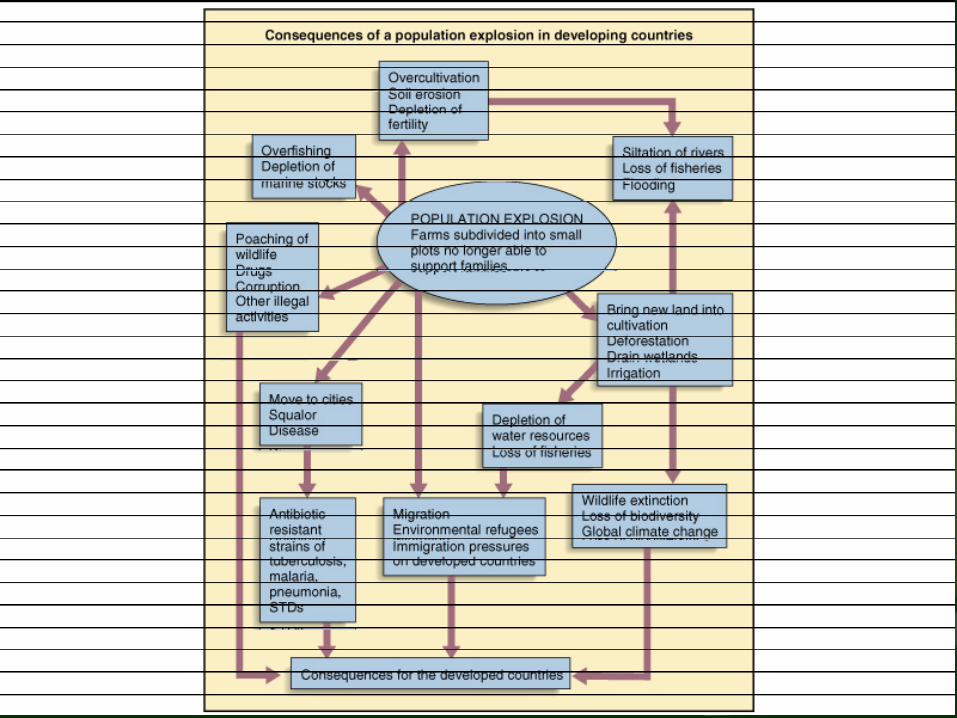
Consequences of Exploding Consequences of Exploding PopulationsPopulations
More PopulationCauses MORE
LESS
deforestationresource depletionloss of agricultural landdiseasepopulation migrationIrrigation
biodiversitypest resistancewetlands


