
Hydrogen generation via steam reforming of biodiesel: Process optimization and heat 1
integration 2
3
Stefan Martina, Friedemann Georg Albrechta, Pieter van der Veerb, Dick Lieftinkb, Ralph-Uwe 4 Dietricha 5 6 a: German Aerospace Center (DLR), Institute of Engineering Thermodynamics 7
Pfaffenwaldring 38 – 40, 70569 Stuttgart, Germany 8 b: HyGear B.V., P.O. Box 5280, 6802 EG Arnhem, The Netherlands 9
Corresponding author: Tel.: +49 711 6862 682; fax: +49 711 6862 665; E-mail address: 10
[email protected] (S. Martin) 11
12
13
Abstract 14
The present study investigates the distributed generation of hydrogen (50 Nm3/h) by steam 15
reforming of biodiesel. The system comprises a steam reformer, a water gas shift stage, a 16
pressure swing adsorption unit and a dual fuel burner. Sensitivity analysis with Aspen Plus 17
shows a positive effect on overall system efficiency for high pressure and a low steam-to-18
carbon ratio. A theoretical maximum efficiency (based on lower heating value) of 78.2 % can 19
be obtained requiring a complex and costly heat exchanger network. Consequently, a system 20
simplification is proposed resulting in a novel fuel processor concept for steam reforming of 21
biodiesel based on a fully heat integrated system. A thermal system efficiency of 75.6 % is 22
obtained at S/C=2.53, p=13 bara and TRef=825 °C. The techno-economic evaluation reveals 23
hydrogen production costs ranging from 7.25 €/kg to 10.58 €/kg. 24
Keywords: hydrogen; steam reforming; biodiesel; energy conversion; energy efficiency; 25
techno-economic evaluation 26
1 Introduction 27
Today, hydrogen is predominantly produced by steam reforming of natural gas in large-scale, 28
central production plants. However, with an increasing share of fuel cell vehicles (FCVs) in 29
the market, central hydrogen production will suffer from additional costs associated with the 30
distribution of gaseous-phase hydrogen by trailer over long distances (1). In contrast, 31
distributed hydrogen generation (DHG) at fueling stations offers the advantage of using 32
readily available liquid fuels such as diesel and biodiesel with high energy densities and 33
existing infrastructure. DHG is widely seen as a promising alternative in the transition phase 34
towards a fully renewable hydrogen production economy (2, 3, 4). DHG is applicable but not 35
limited to decentralized hydrogen production at fueling sites. There is an increasing demand 36
for annealing applications, in particular for the steel industry and in the production of high 37
quality flat glass. According to Neumann et al. (5) conventional hydrogen generation 38
processes up to 300 Nm3/h H2 are being increasingly substituted with advanced steam 39
reforming technologies. 40
Steam reforming (SR) offers the advantage of high partial pressure of hydrogen in the 41
product gas (70-80 vol.%, dry basis) compared to 40-50 % for autothermal reforming (ATR) 42
and partial oxidation (POX). Taking into account that compressing liquid fuels is less energy 43
intensive than compressing gaseous feeds, steam reforming of liquid fuels is considered to 44
be the preferred option for stationary hydrogen generation (3, 6, 7). 45
Amongst the available logistic fuels, biodiesel, which is a fatty acid methyl ester (FAME) 46
produced from transesterification of vegetable oil with methanol, appears to be a promising 47
feedstock for DHG by means of SR (8, 9). Biodiesel is a renewable, non-polluting resource 48
with a low sulfur content (typically below 5 ppmw). This renders biodiesel a favorable 49
feedstock for catalytic applications since sulfur is known to be a strong catalyst poison (10). 50
In the past years, several experimental studies have been conducted shedding light on 51
biodiesel steam reforming (11, 12, 13, 14). Recently, Martin et al. (15) presented a study, the 52
main emphasis of which was placed on finding suitable operating conditions for SR of 53
biodiesel. A stable product gas composition has been achieved over 100 h of operation by 54
using a metallic based precious metal catalyst, applying low feed mass flow rates and a 55
sufficiently high catalyst inlet temperature (> 750 °C). Catalyst deactivation was not 56
observed. A preceding parametric study revealed a detrimental effect of low catalyst inlet 57
temperatures on catalyst deactivation by coking whereas the effect of varying steam-to-58
carbon (S/C) ratio in the considered range (3-5) was negligible. Concurrently, Lin et al. (16) 59
observed increasing carbon formation with decreasing reforming temperature. Regarding the 60
minimum allowable S/C ratio in order to ensure coke-free operation, there is evidence from 61
literature data that stable operating conditions with complete biodiesel conversion can be 62
achieved at S/C ratios as low as 2 (11, 13). 63
Moreover, several research groups have carried out theoretical and experimental studies in 64
order to find optimum operating conditions for small-scale hydrogen production targeting high 65
system efficiency and low hydrogen production costs. 66
Katikaneni et al. (17) carried out a detailed performance study comparing on-site hydrogen 67
generation from liquid fuels by different process routes. Calculations were based on a 68
1000 kg/d hydrogen filling station (approximately 250 FCVs per day). The hydrogen 69
generation efficiency was found to be highest for a concept based on SR with upstream 70
hydrodesulfurization. For diesel fuel a thermal H2-efficiency of 65.2 % was calculated. In 71
terms of hydrogen production costs, the authors conclude that on-site diesel SR is 72
competitive with centralized hydrogen production from natural gas with pipeline transport 73
($ 6.72 per kg vs. $ 6.23 per kg). Finally, the authors present a hydrogen roadmap starting 74
with a small-scale 50 Nm3/h H2 generation system ($ 28.8 per kg H2), the costs of which can 75
be reduced dramatically by design optimization and heat integration. 76
T. Persson (18) investigated an integrated 20 kW hydrogen production system based on 77
feedstock methane using a catalytic converter (steam reformer, water gas shift reactor, 78
catalytic burner) and a pressure swing adsorption (PSA) unit. The Aspen Plus calculations 79
were carried out at a pressure of 4 bara assuming a reformer catalyst inlet temperature of 80
550 °C and an outlet temperature of 850 °C. In the downstream WGS reactor the carbon 81
monoxide content was reduced to below 1.5 vol.%. The PSA off-gas and methane were 82
burned with air at 900 °C in order to provide the necessary heat for the endothermic steam 83
reforming reaction. Parasitic power consumption amounted for 520 W with estimated heat 84
losses of 710 W. The S/C ratio and the system pressure were identified to be crucial 85
parameters for achieving a high system efficiency. A maximum theoretical efficiency (based 86
on lower heating value LHV) of 79.1 % is reported at an S/C ratio of 2.2. 87
Hulteberg et al. (3) carried out an experimental investigation based on a similar system using 88
Fischer-Tropsch-Diesel for the production of 7 Nm3/h H2. The catalytic converter was 89
operated at a pressure of 5 bara and an S/C ratio of 3.1-4.1. Reforming catalyst temperature 90
ranged from 650 °C at the catalyst inlet to 750-800 °C at the catalyst outlet. High heat and 91
mass transfer was ensured by using a noble metal catalyst supported on a patented 92
thermally sprayed woven wire mesh system. With the given experimental set-up, a maximum 93
system efficiency of 58 % (based on LHV) was achieved assuming a parasitic power 94
consumption of 500 W. 95
Although considerable progress has been made in terms of reformer durability, the 96
development of efficient, low-cost DHG systems based on liquid fuels is still in an early stage 97
leaving room for further development (19, 18). It is well known that hydrogen production 98
costs based on reforming technology depend heavily on the price of the feedstock (20, 1). 99
Thus, improving reforming efficiency is essential in order to make DHG competitive with 100
competing hydrogen production technologies such as central production and distribution by 101
trailer. Moreover, there is a need to substantially reduce investment costs by reducing 102
system size and complexity (4, 21). 103
Regarding SR of biodiesel, there is no literature data available for heat integrated on-site 104
hydrogen production systems including PSA in the kilowatt range. 105
The aim of the present paper is to evaluate a 50 Nm3/h hydrogen generation system based 106
on SR of biodiesel. The main emphasis of this simulation study is placed on maximizing 107
system efficiency by an extensive parameter variation (including system pressure and S/C 108
ratio) and setting up a heat exchanger network with a maximum internal heat recovery and a 109
minimum external heating/cooling demand. A novel fuel processor concept is proposed 110
based on a fully heat integrated biodiesel SR system. Further economic analysis is provided. 111
112
113
114
2 Methodology 115
A hydrogen generation system based on feedstock biodiesel is evaluated using the 116
commercial software Aspen Plus ®. The thermodynamic equilibrium calculations are based 117
on minimization of Gibbs free energy using the Soave-Redling-Kwong property method (22). 118
Methyl-oleate (C19H36O2) was chosen as a model substance for biodiesel. Chemically 119
speaking, methyl-oleate is a fatty acid methyl ester produced from transesterification of 120
triolein, the triglyceride of oleic acid, which is known as the dominating fatty acid in vegetable 121
oil (see Fig. 1). Methyl-oleate is considered to be a suitable reference substance for 122
modeling biodiesel SR, since the molar C:H:O-ratio is very similar to biodiesel (C18.3H34.8O2). 123
A more detailed comparison of the physicochemical properties of methyl-oleate and biodiesel 124
is given in (7) and (15). 125
126
Fig. 1: Chemical structure of biodiesel model substance methyl-oleate (C19H36O2) 127
SR of methyl-oleate can be described by three linearly independent chemical equations, 128
namely the steam reforming reaction (Eq. (1)), the water-gas shift reaction (Eq. (2)) and the 129
methanation reaction (Eq. (3)). Apart from these main reactions, coking of the catalyst can 130
occur under real-life conditions being favored at low reforming temperatures, low S/C ratios 131
and high feed mass flow rates. Thermodynamically, coke formation is not expected at S/C 132
ratios higher than 2, the actual value of which depends on the reformer operating 133
conditions (15). 134
C19H36O2 + 17 H2O → 19 CO + 35 H2 ∆H298 K = + 2 645 kJ/mol (1)
CO + H2O ↔ H2 + CO2 ∆H298 K = - 41 kJ/mol (2)
CO + 3 H2 ↔ CH4 + H2O ∆H298 K = - 206 kJ/mol (3)
The Aspen Plus model consists of a steam reformer (SR), a water gas shift reactor (WGS), a 135
pressure swing adsorption unit (PSA) and a burner (B) (see Fig. 2). The system is operated 136
at pressures higher than 6 bara (up to 13 bara) in order to ensure a high PSA efficiency. The 137
molar S/C ratio is varied from 2.5 to 5. All feed streams are supplied at an initial temperature 138
of 20 °C. Water is vaporized and overheated prior to being mixed with biodiesel. By 139
overheating the steam to 400 °C, complete vaporization of the incoming biodiesel is ensured. 140
The water-biodiesel feed stream is then heated up to 650 °C by recuperative heat exchange, 141
making use of the reformate enthalpy. The steam reformer is operated at 825 °C taking into 142
account that coke formation can be significantly reduced by applying high temperatures (15, 143
16). Upon leaving the reformer section, the hydrogen rich gas is cooled down to a WGS inlet 144
temperature of 300 °C. The WGS reactor is operated in an adiabatic mode resulting in a 145
temperature increase of 50 °C up to 100 °C depending on the actual S/C ratio and CO 146
concentration. After leaving the WGS reactor, the gas stream is cooled down to 35 °C 147
leading to a condensation of water. In the PSA unit the gas is divided into pure hydrogen and 148
an off-gas stream containing H2, CO, CO2 and CH4. The PSA unit is implemented as a 149
splitter in Aspen Plus assuming a pressure dependent H2-efficiency ranging from 55 % at 150
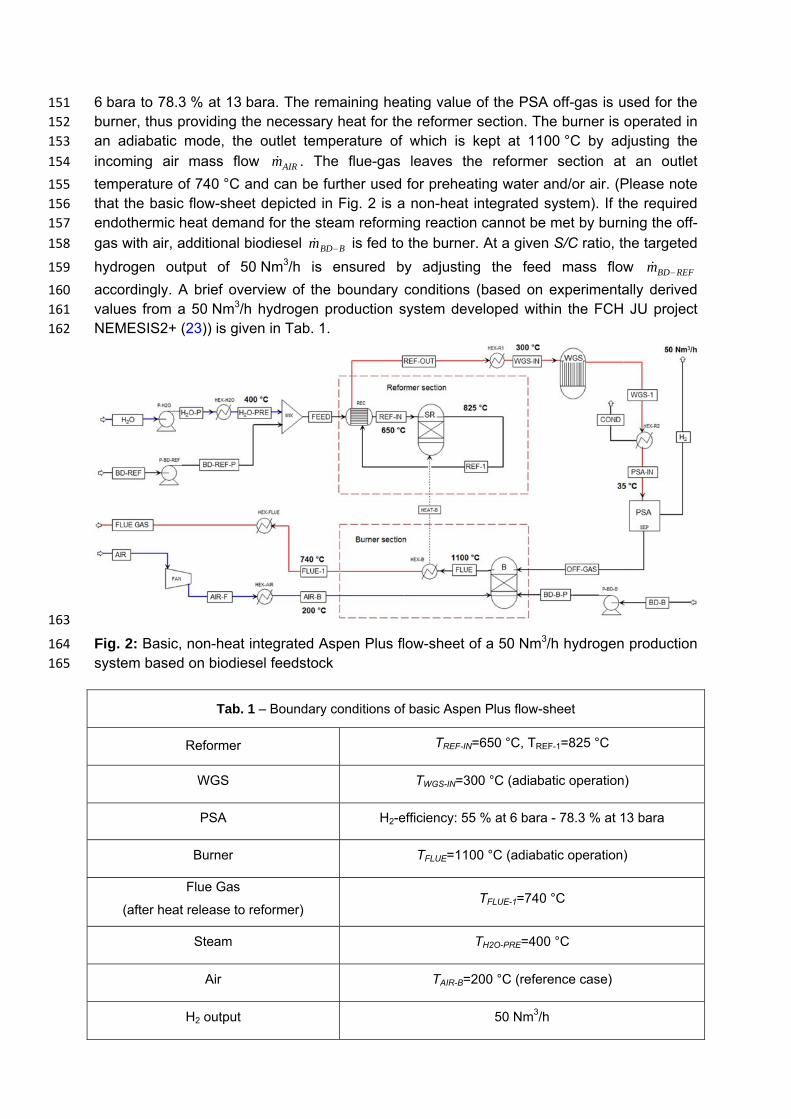
6 bara to 78.3 % at 13 bara. The remaining heating value of the PSA off-gas is used for the 151
burner, thus providing the necessary heat for the reformer section. The burner is operated in 152
an adiabatic mode, the outlet temperature of which is kept at 1100 °C by adjusting the 153
incoming air mass flow AIRm . The flue-gas leaves the reformer section at an outlet 154
temperature of 740 °C and can be further used for preheating water and/or air. (Please note 155
that the basic flow-sheet depicted in Fig. 2 is a non-heat integrated system). If the required 156
endothermic heat demand for the steam reforming reaction cannot be met by burning the off-157
gas with air, additional biodiesel BBDm is fed to the burner. At a given S/C ratio, the targeted 158
hydrogen output of 50 Nm3/h is ensured by adjusting the feed mass flow REFBDm 159
accordingly. A brief overview of the boundary conditions (based on experimentally derived 160
values from a 50 Nm3/h hydrogen production system developed within the FCH JU project 161
NEMESIS2+ (23)) is given in Tab. 1. 162
163
Fig. 2: Basic, non-heat integrated Aspen Plus flow-sheet of a 50 Nm3/h hydrogen production 164
system based on biodiesel feedstock 165
Tab. 1 – Boundary conditions of basic Aspen Plus flow-sheet
Reformer TREF-IN=650 °C, TREF-1=825 °C
WGS TWGS-IN=300 °C (adiabatic operation)
PSA H2-efficiency: 55 % at 6 bara - 78.3 % at 13 bara
Burner TFLUE=1100 °C (adiabatic operation)
Flue Gas
(after heat release to reformer) TFLUE-1=740 °C
Steam TH2O-PRE=400 °C
Air TAIR-B=200 °C (reference case)
H2 output 50 Nm3/h
The thermal system efficiency is defined as follows: 166
BBDBBDREFBDREFBD
HHSyst LHVmLHVm
LHVm
22 (4) 167
LHV: lower heating value; 2Hm : hydrogen product mass flow; REFBDm : biodiesel mass flow to the 168
reformer; BBDm : biodiesel mass flow to the burner 169
For the given system, the numerator of Eq. 4 is constant as the hydrogen output is fixed at 170
50 Nm3/h. Thus, the thermal system efficiency can be calculated from the biodiesel demand 171
for the reformer and the burner. An additional electrical power demand Pel is needed for 172
cooling the WGS outlet stream to the required PSA inlet temperature as well as for the 173
biodiesel and water pump and the air blower. Heat and pressure losses are not considered 174
within this study. 175
The flow-sheet depicted in Fig. 2 comprises two streams that have to be heated up (=cold 176
streams) according to the process specifications, namely “H2O-P” to “H2O-PRE” and “AIR-F” 177
to “AIR-B” and three streams which are cooled down (=hot streams), namely “FLUE-1” to 178
“FLUE GAS”, “REF-OUT” to “WGS-IN” and “WGS-1” to “PSA-IN”. Using the enthalpy of the 179
hot streams for heating up the cold streams is decisive in optimizing the net system 180
efficiency. 181
In this work, a systematic approach is followed by applying Pinch analysis in order to achieve 182
proper heat integration. For given process parameters, hot and cold streams are combined to 183
so-called hot and cold composite curves. Based on the choice of an appropriate ∆Tmin 184
(=minimum temperature difference between hot and cold composite curves, here: 15 °C), the 185
maximum achievable heat recovery within the system and the energy targets for hot and cold 186
utilities can be derived directly from the composite curves. It is thereby always possible to set 187
up a heat exchanger network that fulfills the energy targets (minimum utility targets and 188
maximum heat recovery). For a more detailed description of the widely used Pinch method 189
please refer to (24). 190
191
Techno-economic analysis 192
A techno-economic evaluation of hydrogen net production costs (NPC) is conducted. The 193
cost estimation complies with a class three estimate of AACE International (25) 194
corresponding to an expected accuracy of +- 30 %. All monetary flows were converted to 195
Euro and 2014 prices. 196
In a first step, total capital investment (TCI) was calculated taking into account equipment 197
costs and further capital requirements for unit installation, instrumentation and control, piping 198
system, electrical systems and contingency. Equipment costs of steam reformer, WGS, PSA 199
and burner are based on experience from the NEMESIS2+ project and vendors’ quotations 200
for reactor vessels and the catalyst. Cost data from literature (26) were used to estimate 201
costs for heat exchangers, pumps and compressors. Scaling and experience curve effects, 202
inflation, pressure and material factors were accounted for as shown in Eq. (5) adapted from 203
(26), (27) and (28). 204
)(log2014 2)1( nmatpre
ref
d
refrefn LFF
CEPCI
CEPCI
s
sECEC
(5) 205
m
i j jecoi FECTCI1
5
1 ,1 (6) 206
nEC are the equipment costs for the nth manufactured unit. refEC and refs are the equipment 207
costs and capacity of the reference component, d is the scale factor, CEPCI the used 208
chemical engineering plant cost index (29) and preF and matF are optional pressure and 209
material factors, respectively. L is the experience rate and n the total number of 210
manufactured reformer units. An experience rate between 10 % and 20 % was assumed for 211
the used technology meaning that unit production costs are reduced by 10 % to 20 %, when 212
the total volume of manufactured units is doubled (28, 30). Total capital costs were 213
calculated according to Eq. (6). Cost requirements for equipment installation, instrumentation 214
and control, piping system and electrical systems were considered by multiplying purchased 215
equipment costs by pre-defined ratio factors jecoF , . The annuity method of depreciation was 216
used to calculate annual capital requirements. 217
Operational costs consist of expenses on biodiesel and utilities (electricity, feed water). 218
Annual costs for maintenance, insurances & taxes and working capital were expected to be 219
approximately 4.5 %, 2 % and 10 % of TCI, respectively. Labor costs were estimated 220
assuming 300 man hours per year at gross labor costs of 37.32 €/h (31). All relevant 221
parameters for the techno-economic evaluation are given in Table 2. 222
Tab. 2 – Parameters for economic evaluation
Plant specifications and utility prices (2014) Economic factors
Plant service life: 20 years Interest rate: 7 % on TCI
Annual full load hours: 8640 a h/year Installation factor: 25 % of EC Instrumentation and control: 22 % of EC
Total man hours per year: 300 h/year Piping system: 5 % of EC Gross labor costs: 37.32 31 €/h Electrical system: 10 % of EC
Contingency: 16 % of EC
Electricity price: 0.139 32 €/kWh Maintenance: 4.5 % of TCI Clean water: 1.71 33 €/m³ Insurances & taxes: 2 % of TCI
Biodiesel (with taxes): 1.36 34,35 €/l Working capital 10 % of TCI
a) corresponding to 360 days in operation and 5 days required for annual shutdown/maintenance 223
224
3 Results and Discussion 225
3.1 Non-heat-integrated system: Effect of pressure on system efficiency 226
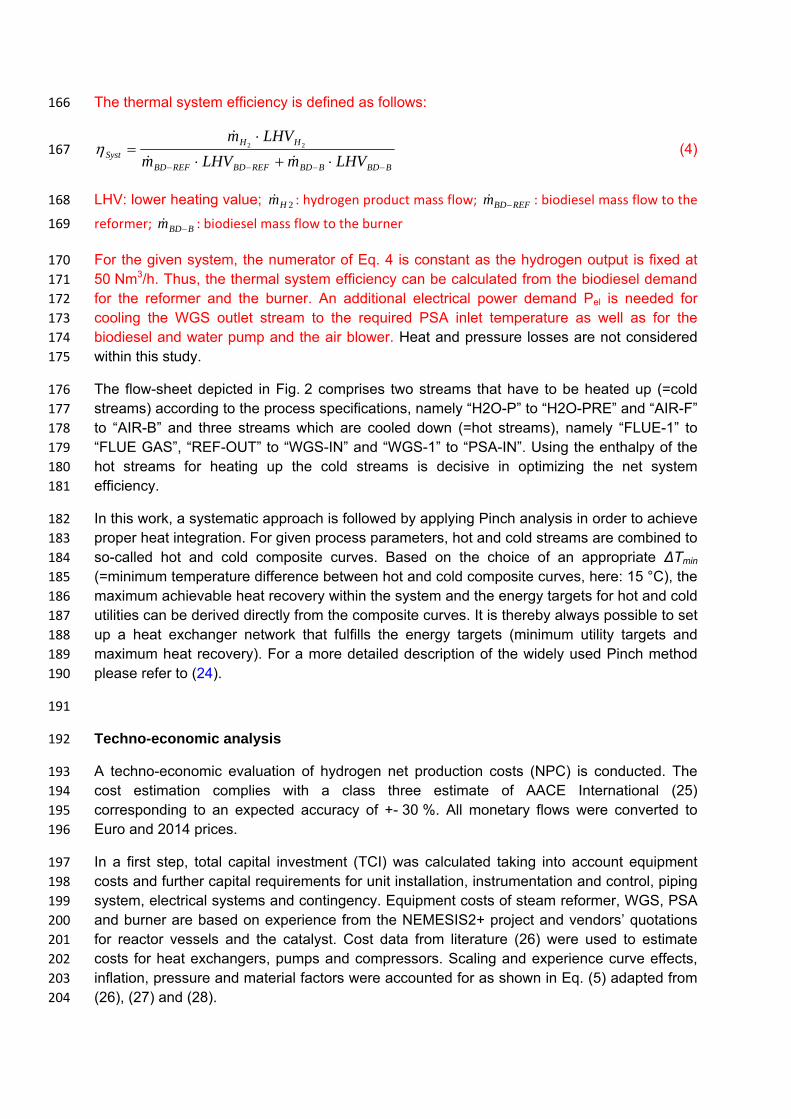
Based on the 50 Nm3/h non-heat integrated Aspen Plus flow-sheet (Fig. 2) a sensitivity 227
analysis has been carried out at S/C=5 by varying system pressure from 6 bara to 13 bara. 228
As can be seen from Fig. 3 the hydrogen efficiency as defined by Eq. 4 increases from 229
53.9 % at 6 bara to 62.4 % at 13 bara which is mainly attributed to an improved PSA-230
efficiency resulting in a decreased amount of biodiesel fed to the reformer ( REFBDm ). Despite 231
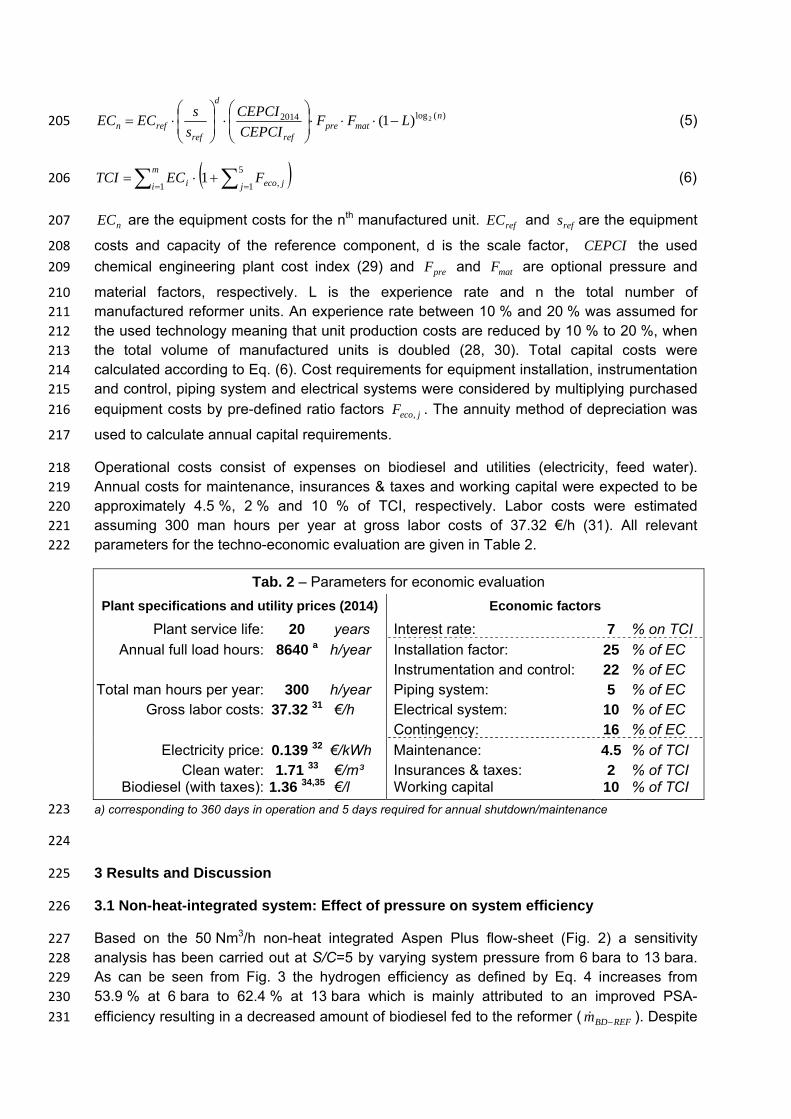
a slight increase of the required biodiesel mass flow to the burner BBDm - which arises from 232
the fact that the PSA off-gas heat load (based on LHV) drops from 127.2 kW at 6 bara to 233
48.3 kW at 13 bara (see Fig. 4a) - total fuel consumption is reduced from 26.4 kg/h to 234
22.8 kg/h. The drop of the PSA off-gas heat load is mainly caused by a rapid decrease of the 235
off-gas mass flow and an increased share of CO2 (Fig. 4b). Obviously, applying high 236
pressure is beneficial for the given H2 generation system including a PSA unit. 237
238
Fig. 3: Effect of system pressure on mass flows and H2 efficiency 239
240
241
Fig. 4: Effect of system pressure on PSA off-gas heat load (Fig. 4a), PSA off-gas 242
composition and PSA off-gas mass flow (Fig. 4b) 243
Assuming an operating pressure of 13 bara and S/C=5 as a starting point (=operating 244
regime “0”), the hydrogen efficiency can be further improved by increasing the burner air 245
preheating temperature TAIR-B (Fig. 5a). By doing so, less fuel BBDm is needed for the burner 246
in order to provide the necessary heat for the endothermic reforming reaction (Fig. 5b), while 247
the amount of fuel needed for the reformer REFBDm remains unaffected. Accordingly, the H2 248
efficiency (Eq. 4) rises. 249
3.2 Heat-integrated system 250
3.2.1 Maximum achievable air preheating temperature at different S/C-ratios 251
252
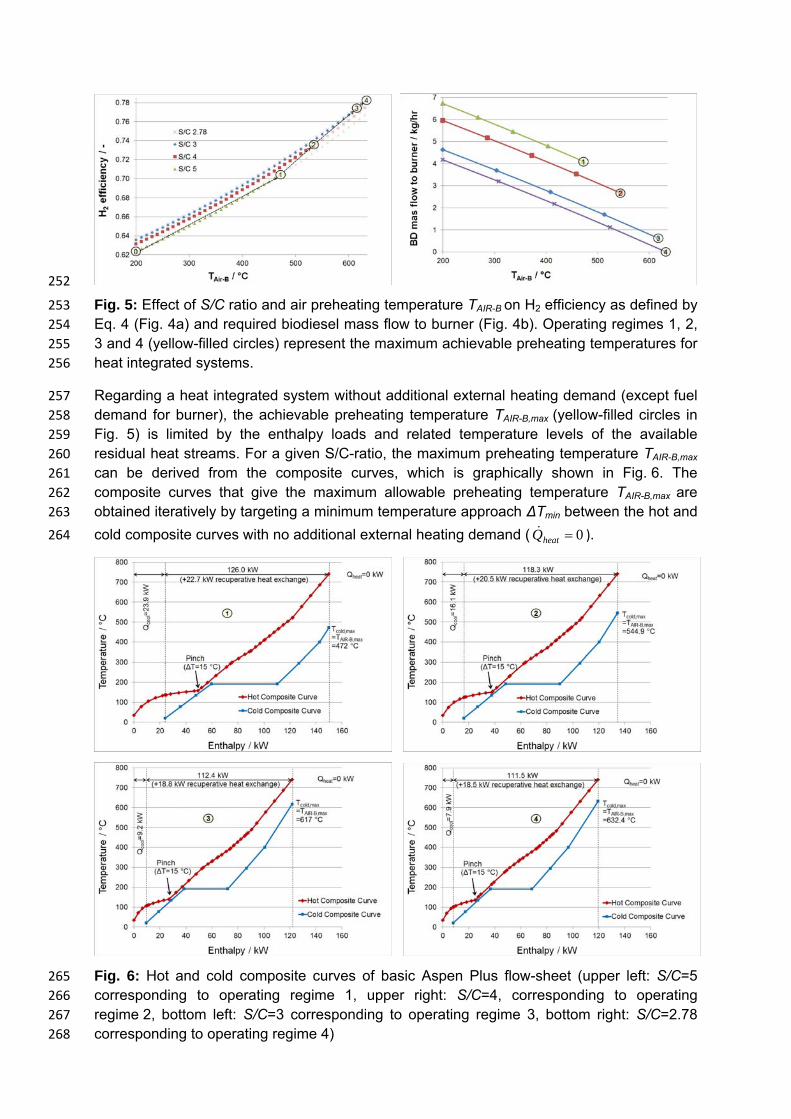
Fig. 5: Effect of S/C ratio and air preheating temperature TAIR-B on H2 efficiency as defined by 253
Eq. 4 (Fig. 4a) and required biodiesel mass flow to burner (Fig. 4b). Operating regimes 1, 2, 254
3 and 4 (yellow-filled circles) represent the maximum achievable preheating temperatures for 255
heat integrated systems. 256
Regarding a heat integrated system without additional external heating demand (except fuel 257
demand for burner), the achievable preheating temperature TAIR-B,max (yellow-filled circles in 258
Fig. 5) is limited by the enthalpy loads and related temperature levels of the available 259
residual heat streams. For a given S/C-ratio, the maximum preheating temperature TAIR-B,max 260
can be derived from the composite curves, which is graphically shown in Fig. 6. The 261
composite curves that give the maximum allowable preheating temperature TAIR-B,max are 262
obtained iteratively by targeting a minimum temperature approach ∆Tmin between the hot and 263
cold composite curves with no additional external heating demand ( 0heatQ ). 264
Fig. 6: Hot and cold composite curves of basic Aspen Plus flow-sheet (upper left: S/C=5 265
corresponding to operating regime 1, upper right: S/C=4, corresponding to operating 266
regime 2, bottom left: S/C=3 corresponding to operating regime 3, bottom right: S/C=2.78 267
corresponding to operating regime 4) 268
As can be seen exemplarily from Fig. 6a, the maximum achievable air preheating 269
temperature TAIR-B,max at S/C=5 is 472 °C. By lowering the S/C ratio stepwise to 4, 3 and 2.78 270
TAIR-B,max can be raised from 472 °C to 545 °C, 617 °C and 632 °C, respectively. At this point 271
(operating regime 4, Fig 6c), hereinafter referred to as the thermo-neutral point, no additional 272
fuel is needed for the burner ( BBDm =0). The necessary heat for the endothermic reforming 273
reaction is provided solely by the heating value of the PSA off-gas. From a technical point of 274
view, this is highly advantageous since it eliminates the need of a dual fuel burner. Instead, a 275
conventional gas burner can be used. 276
Moreover, Fig. 6 reveals an increasing energy turnover at higher S/C. Both the internal heat 277
recovery and the external cooling demand increase (internal heat recovery: from 111.5 kW at 278
S/C=2.78 to 126.0 kW at S/C=5, external cooling demand: from 7.9 kW at S/C=2.78 to 279
23.9 kW at S/C=5) resulting in a larger and more costly heat exchanger (HEX) network and 280
increased energy costs. 281
282
3.2.2 Effect of S/C-ratio on system efficiency 283
284
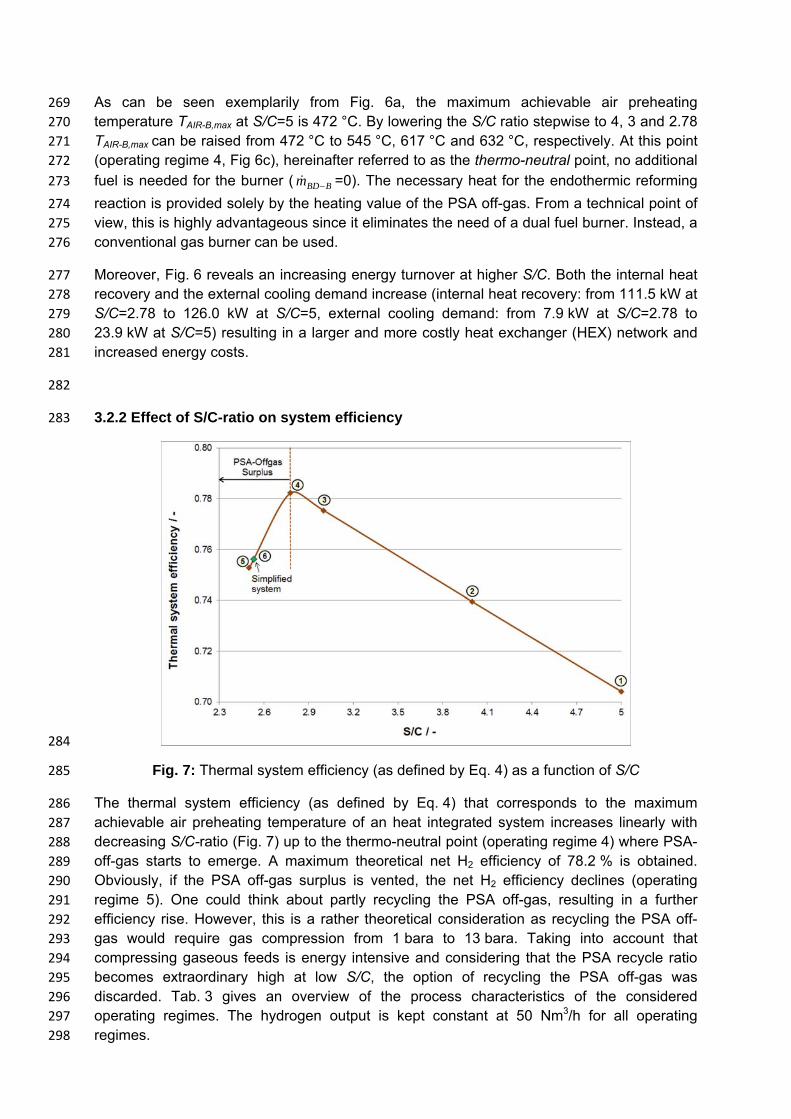
Fig. 7: Thermal system efficiency (as defined by Eq. 4) as a function of S/C 285
The thermal system efficiency (as defined by Eq. 4) that corresponds to the maximum 286
achievable air preheating temperature of an heat integrated system increases linearly with 287
decreasing S/C-ratio (Fig. 7) up to the thermo-neutral point (operating regime 4) where PSA-288
off-gas starts to emerge. A maximum theoretical net H2 efficiency of 78.2 % is obtained. 289
Obviously, if the PSA off-gas surplus is vented, the net H2 efficiency declines (operating 290
regime 5). One could think about partly recycling the PSA off-gas, resulting in a further 291
efficiency rise. However, this is a rather theoretical consideration as recycling the PSA off-292
gas would require gas compression from 1 bara to 13 bara. Taking into account that 293
compressing gaseous feeds is energy intensive and considering that the PSA recycle ratio 294
becomes extraordinary high at low S/C, the option of recycling the PSA off-gas was 295
discarded. Tab. 3 gives an overview of the process characteristics of the considered 296
operating regimes. The hydrogen output is kept constant at 50 Nm3/h for all operating 297
regimes. 298
Tab. 3 – Process characteristics of different operating regimes
Operating
regime S/C BAIRT
(°C)
REFBDm
(kg/h)
BBDm
(kg/h)
totalBDm ,
(kg/h)
Syst
(%)
elP
(kW)
0 5.00 200.0 16.06 6.72 22.78 62.4 8.11
1 5.00 472.0 16.06 4.11 20.17 70.4 6.19
2 4.00 544.9 16.56 2.67 19.23 73.9 5.70
3 3.00 617.0 17.72 0.63 18.35 77.5 5.32
4 2.78 632.4 18.17 0.00 18.17 78.2 5.26
5 2.50 642.2 18.88 0.00 18.88 75.3 5.26
6 2.53 570.0 18.79 0.00 18.79 75.6 5.82
299
Considering the substantially reduced total fuel consumption (Tab. 3) low S/C ratios appear 300
highly favorable for heat-integrated DHG systems. The higher system efficiency at lower S/C 301
mainly arises from the reduced heat demand for preheating and vaporization of water. 302
As mentioned above, the highest theoretical H2 net efficiency is obtained under thermo-303
neutral conditions at S/C=2.78. Nonetheless, a heat integrated system based on these 304
conditions would require a complex HEX network including several stream splits. In 305
particular, the narrow section right above the pinch point and the initiation of water 306
condensation during cooling of the “WGS-1”-stream is detrimental to building up a HEX 307
network. Even though we know from pinch theory that it is theoretically possible to set up a 308
HEX network fulfilling the energy targets based on the composite curves at thermo-neutral 309
conditions, the practicability of such a system must be questioned. Therefore we decided to 310
simplify the system by limiting the use of the “WGS-1”-temperature (for heat integration 311
purposes) to 132 °C, which is the dew-point of the respective stream. 312
313
3.2.3 Heat exchanger network of simplified system 314
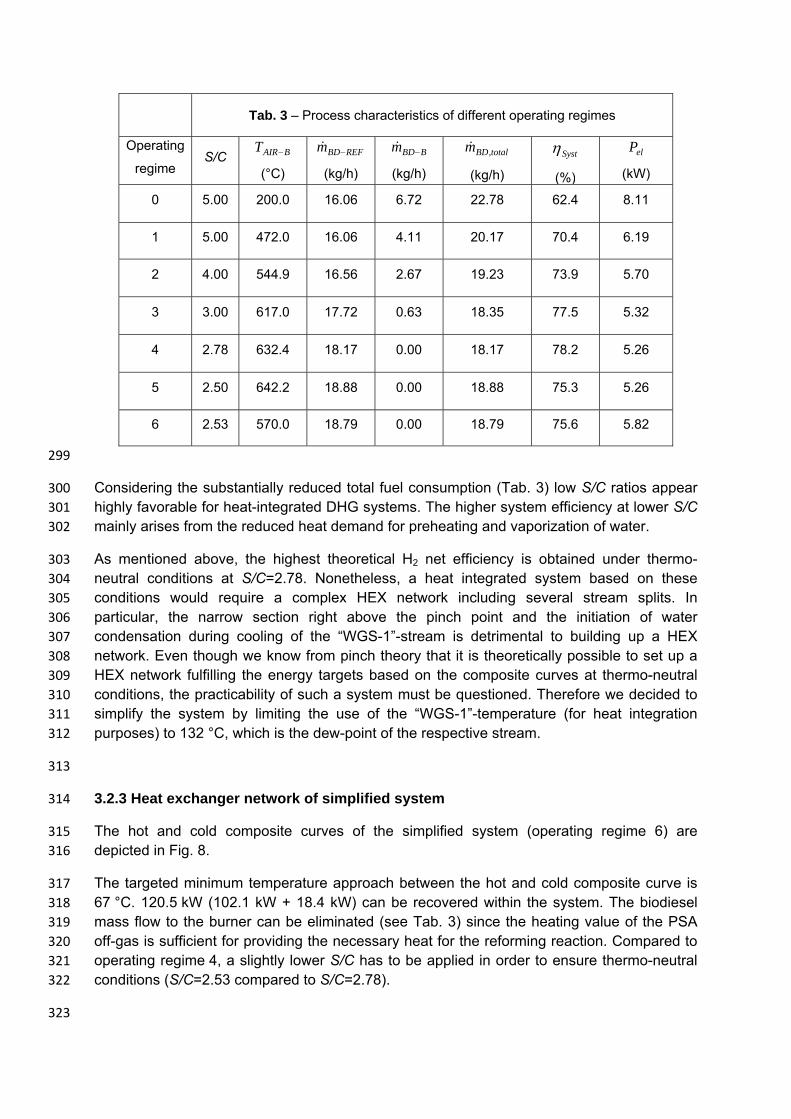
The hot and cold composite curves of the simplified system (operating regime 6) are 315
depicted in Fig. 8. 316
The targeted minimum temperature approach between the hot and cold composite curve is 317
67 °C. 120.5 kW (102.1 kW + 18.4 kW) can be recovered within the system. The biodiesel 318
mass flow to the burner can be eliminated (see Tab. 3) since the heating value of the PSA 319
off-gas is sufficient for providing the necessary heat for the reforming reaction. Compared to 320
operating regime 4, a slightly lower S/C has to be applied in order to ensure thermo-neutral 321
conditions (S/C=2.53 compared to S/C=2.78). 322
323
324
Fig. 8: Composite curves of the simplified hydrogen generation system (operating regime 6) 325
Based on the composite curves of the simplified system, a HEX network has been set up 326
targeting a maximum internal heat recovery with no additional external heating/cooling 327
demand (except the cold utility which is required to cool down the WGS product gas stream 328
from dew point temperature to the PSA inlet temperature). The fully heat integrated system is 329
depicted in Fig. 9. 330
331
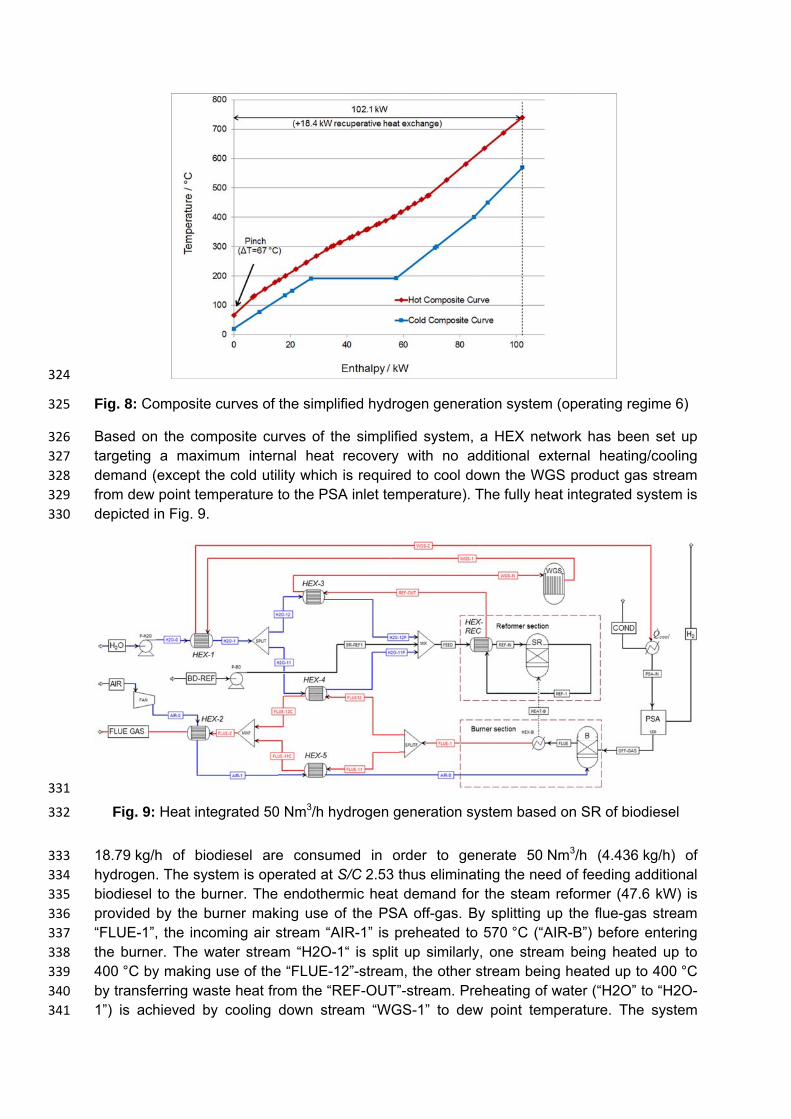
Fig. 9: Heat integrated 50 Nm3/h hydrogen generation system based on SR of biodiesel 332
18.79 kg/h of biodiesel are consumed in order to generate 50 Nm3/h (4.436 kg/h) of 333
hydrogen. The system is operated at S/C 2.53 thus eliminating the need of feeding additional 334
biodiesel to the burner. The endothermic heat demand for the steam reformer (47.6 kW) is 335
provided by the burner making use of the PSA off-gas. By splitting up the flue-gas stream 336
“FLUE-1”, the incoming air stream “AIR-1” is preheated to 570 °C (“AIR-B”) before entering 337
the burner. The water stream “H2O-1“ is split up similarly, one stream being heated up to 338
400 °C by making use of the “FLUE-12”-stream, the other stream being heated up to 400 °C 339
by transferring waste heat from the “REF-OUT”-stream. Preheating of water (“H2O” to “H2O-340
1”) is achieved by cooling down stream “WGS-1” to dew point temperature. The system 341
produces 5,391 l/h of hydrogen at 10 bara delivery pressure (corresponding to 50 Nm3/h H2 342
at standard conditions). 343
The feed and product stream characteristics as well as the heat exchanger properties of the 344
proposed fuel processor concept including the electrical power demand elP are depicted in 345
Tab. 4 and 5. In line with the energy targets derived from the composite curves of the 346
simplified system (see Fig. 8), 120.5 kW are recovered within the system by matching cold 347
and hot streams. An additional electrical energy demand of 5.82 kW is required. Although the 348
minimum temperature approach is slightly lower than targeted (18.8 °C versus 67 °C), a 349
near-optimal HEX network is obtained with a thermal system efficiency (as defined by Eq. 4) 350
of 75.6 %. 351
Tab. 4 – Feed and product stream characteristics of heat integrated system
H2O BD-REF AIR FLUE-OUT COND H2
m (kg/h) 54.9 18.8 335.4 384.0 20.6 4.436
V (l/h) 55.0 21.6 282,130 365,994 21.8 5,391
T (°C) 20 20 20 65.3 20 20 352
Tab. 5 – Heat exchanger properties ( Q : transferred heat; A: heat exchanger area; minT : minimum
temperature approach), electrical power demand elP : 5.82 kW
HEX-1 HEX-2 HEX-3 HEX-4 HEX-5 HEX-REC
Q (kW) 13.24 16.06 8.65 26.51 37.66 18.36
A (m2) 0.90 123.9 0.85 11.2 126.5 1.71
minT 112.0 20.5 74.9 18.8 20.5 175.0
353
3.3 Techno-economic analysis 354
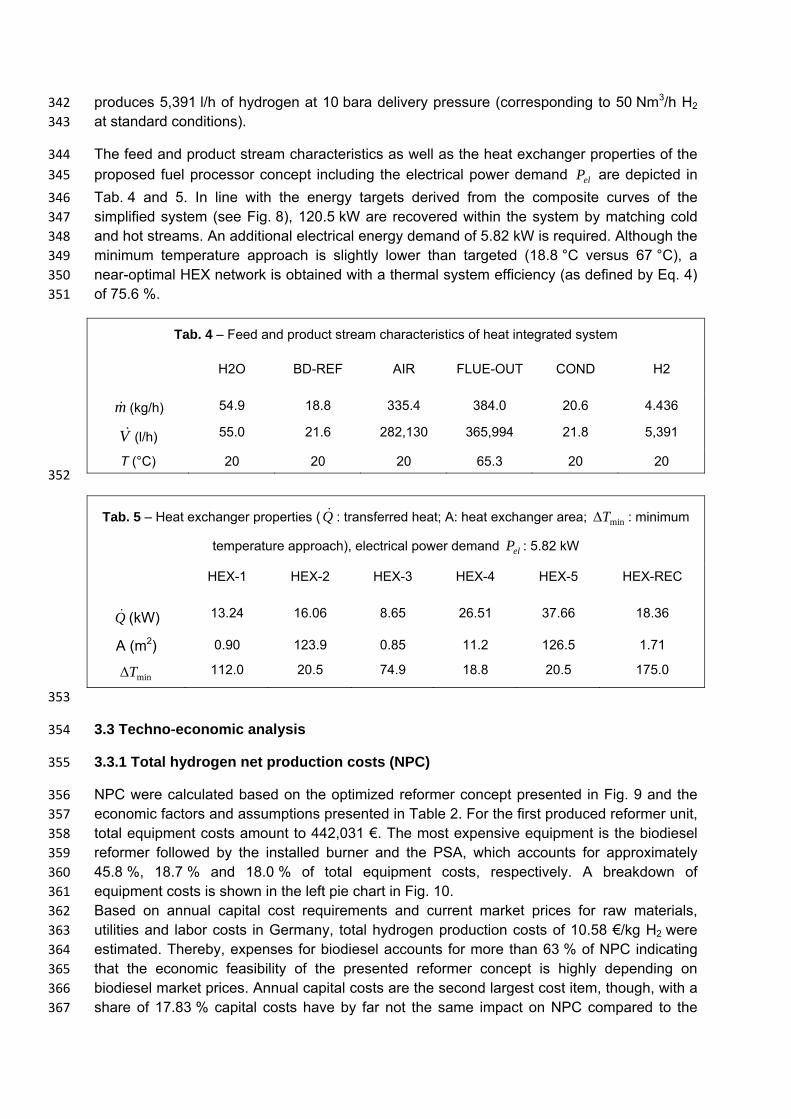
3.3.1 Total hydrogen net production costs (NPC) 355
NPC were calculated based on the optimized reformer concept presented in Fig. 9 and the 356
economic factors and assumptions presented in Table 2. For the first produced reformer unit, 357
total equipment costs amount to 442,031 €. The most expensive equipment is the biodiesel 358
reformer followed by the installed burner and the PSA, which accounts for approximately 359
45.8 %, 18.7 % and 18.0 % of total equipment costs, respectively. A breakdown of 360
equipment costs is shown in the left pie chart in Fig. 10. 361
Based on annual capital cost requirements and current market prices for raw materials, 362
utilities and labor costs in Germany, total hydrogen production costs of 10.58 €/kg H2 were 363
estimated. Thereby, expenses for biodiesel accounts for more than 63 % of NPC indicating 364
that the economic feasibility of the presented reformer concept is highly depending on 365
biodiesel market prices. Annual capital costs are the second largest cost item, though, with a 366
share of 17.83 % capital costs have by far not the same impact on NPC compared to the 367
biodiesel price. Expenses for labor, taxes and insurances have a small effect on H2 368
production costs. NPC broken down by cost items are shown in the right pie chart in Fig. 10. 369
370
Fig. 10: Equipment costs and total hydrogen production costs of first produced reformer unit 371
It is worth noticing that the relative high biodiesel market price is due to the consideration of 372
taxes. In some European countries, hydrogen and the raw materials used in the production 373
process are tax free. As a consequence, significant lower hydrogen production costs are 374
obtained. When neglecting taxes on biodiesel, total hydrogen production costs of 7.30 €/kg 375
were calculated for the presented case. 376
377
3.3.2 Experience curve effects 378
Especially for new developed technologies, equipment costs as well as labor costs for 379
installation and maintenance are decreasing between the first-of-a-kind (FOAK) and Nth-of-a-380
kind unit (NOAK) (28). In order to account for expected cost reductions regarding equipment 381
costs (including installation and maintenance), change of hydrogen production costs was 382
analyzed assuming different experience rates L in Eq. (6). Since it is not possible to 383
determine the exact experience rate for the presented reformer concept at the current 384
technological level, L was varied between 10 % and 20 %, which is a typical range for newly 385
developed technologies. Results for the first 100 manufactured units are presented in 386
Fig. 11. 387
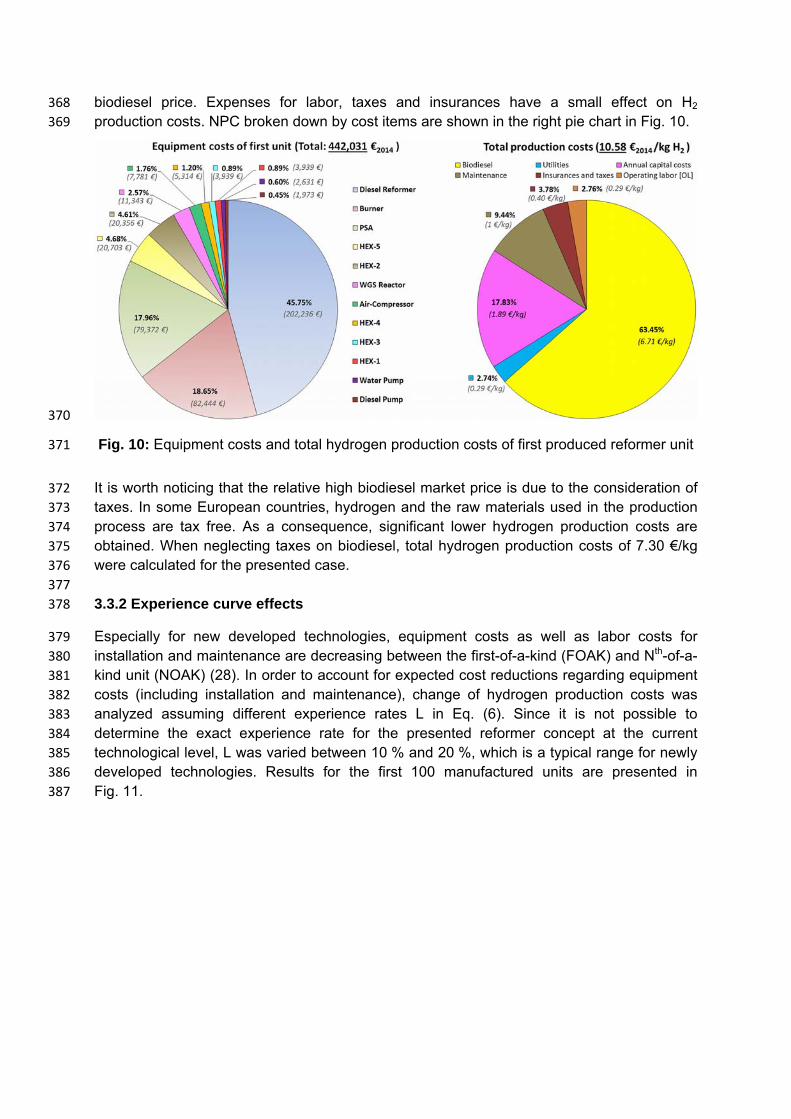
388
Fig. 11: Development of hydrogen net production costs taking into account experience curve 389
effects 390
In general, NPC of hydrogen decrease with every manufactured unit. However, the largest 391
cost reduction effect can be seen in the range between 1 and 25 manufactured units, 392
whereupon NPC tends to a threshold value indicated by the red dashed line in Fig. 11. 393
When reaching the threshold value, capital costs are close to zero and NPC only consists of 394
expenses for biodiesel, utilities and labor costs. At this point, reducing hydrogen production 395
costs is only possible by reducing operational costs or by increasing the energetic efficiency 396
of the reformer concept. 397
398
For the given case, the threshold value is 7.25 €/kg corresponding to a maximum cost 399
reduction potential of 31.5 %. Assuming an experience rate of 10 % and 20 %, NPC of 400
hydrogen is reduced by 12.5 % and 20.5 % (9.26 and 8.46 €/kg) for the 25th unit and 16 % 401
and 24 % (8.88 and 8 €/kg) for the 100th unit, respectively. 402
403
404
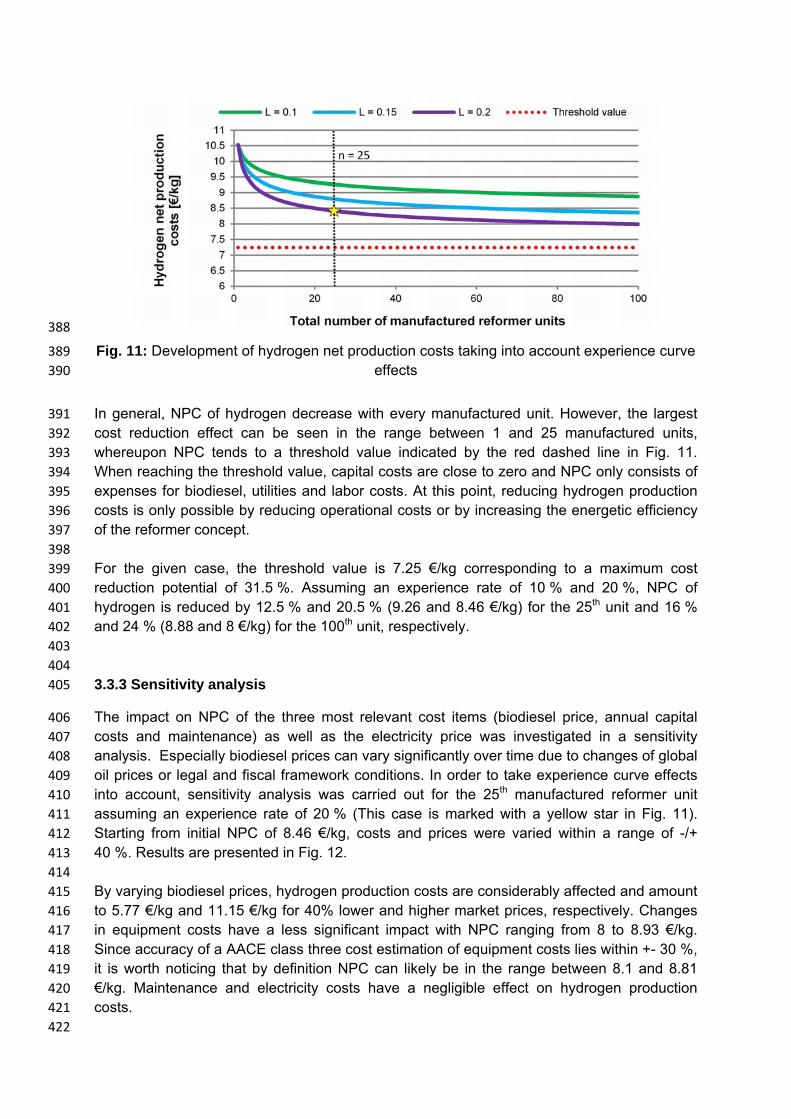
3.3.3 Sensitivity analysis 405
The impact on NPC of the three most relevant cost items (biodiesel price, annual capital 406
costs and maintenance) as well as the electricity price was investigated in a sensitivity 407
analysis. Especially biodiesel prices can vary significantly over time due to changes of global 408
oil prices or legal and fiscal framework conditions. In order to take experience curve effects 409
into account, sensitivity analysis was carried out for the 25th manufactured reformer unit 410
assuming an experience rate of 20 % (This case is marked with a yellow star in Fig. 11). 411
Starting from initial NPC of 8.46 €/kg, costs and prices were varied within a range of -/+ 412
40 %. Results are presented in Fig. 12. 413
414
By varying biodiesel prices, hydrogen production costs are considerably affected and amount 415
to 5.77 €/kg and 11.15 €/kg for 40% lower and higher market prices, respectively. Changes 416
in equipment costs have a less significant impact with NPC ranging from 8 to 8.93 €/kg. 417
Since accuracy of a AACE class three cost estimation of equipment costs lies within +- 30 %, 418
it is worth noticing that by definition NPC can likely be in the range between 8.1 and 8.81 419
€/kg. Maintenance and electricity costs have a negligible effect on hydrogen production 420
costs. 421
422
423
424
Fig. 12: Results of sensitivity analysis of 25th unit 425
426
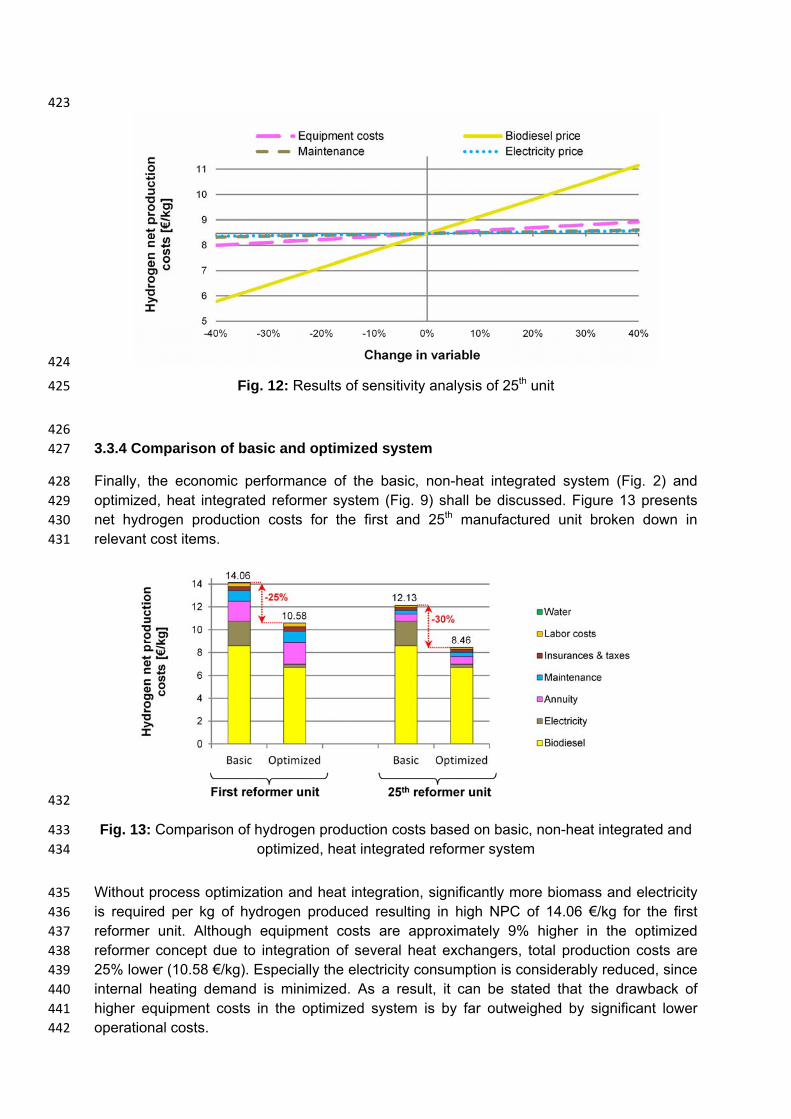
3.3.4 Comparison of basic and optimized system 427
Finally, the economic performance of the basic, non-heat integrated system (Fig. 2) and 428
optimized, heat integrated reformer system (Fig. 9) shall be discussed. Figure 13 presents 429
net hydrogen production costs for the first and 25th manufactured unit broken down in 430
relevant cost items. 431
432
Fig. 13: Comparison of hydrogen production costs based on basic, non-heat integrated and 433
optimized, heat integrated reformer system 434
Without process optimization and heat integration, significantly more biomass and electricity 435
is required per kg of hydrogen produced resulting in high NPC of 14.06 €/kg for the first 436
reformer unit. Although equipment costs are approximately 9% higher in the optimized 437
reformer concept due to integration of several heat exchangers, total production costs are 438
25% lower (10.58 €/kg). Especially the electricity consumption is considerably reduced, since 439
internal heating demand is minimized. As a result, it can be stated that the drawback of 440
higher equipment costs in the optimized system is by far outweighed by significant lower 441
operational costs. 442
When taking experience curve effects into account, the hydrogen production costs are even 443
more reduced as shown for the 25th manufactured unit. This is due to the fact that fixed 444
capital costs are reduced whereas operational costs remain unaffected. Thus, optimizing the 445
system results in more than 30% lower hydrogen production costs. 446
447
4 Conclusions 448
This study serves to evaluate a 50 Nm3/h hydrogen generation system based on steam 449
reforming of biodiesel. Results show that it is vital in terms of improving system efficiency to 450
apply a high system pressure and a low S/C ratio. The positive effect of pressure 451
predominantly arises from an increased PSA efficiency at high pressures, which outweighs 452
the adverse effect of thermodynamics (lower syngas yield at high pressure). The upper limit 453
of the system pressure is hardware-dependent whereas the lower limit of the S/C ratio is 454
determined by the so called thermo-neutral point. At this point, the heat for the steam 455
reforming unit can be provided exclusively by burning the off-gas from the PSA, thus 456
eliminating the need of a dual fuel burner. Further lowering the S/C ratio is not advisable 457
since a PSA off-gas surplus starts to emerge, resulting in a decrease in the net system 458
efficiency. Moreover, a low S/C ratio increases the risk of coke formation on the catalyst 459
surface. Regarding practical applications a trade-off between high catalyst durability and high 460
system efficiency must be found. 461
Based on the results of the process optimization, proper heat integration of the system has 462
been carried out resulting in a near-optimal HEX network with a net system efficiency of 463
75.6 % (based on LHV). Techno-economic analysis of the heat integrated fuel processor 464
system based on steam reforming of biodiesel reveals a major impact of biodiesel price on 465
hydrogen net production costs. 8.46 €/kg were calculated for the 25th reformer unit, the costs 466
of which can be further brought down by increasing the number of units and/or increasing the 467
unit size. 468
469
470 471 Acknowledgement 472
The authors gratefully acknowledge the support of the Fuel Cells and Hydrogen Joint 473
Undertaking (FCH JU) under Grant Agreement No. 278138. For proofreading the manuscript 474
we thank Martin Kraenzel. 475
476
References______________________________________________________________________ 477
[1] G.T. Yeh, Y.L. Kao, S.Y. Yang, M.H. Rei, Y.Y. Yan, P.C. Lee, Low cost compact onsite 478
hydrogen generation, Int J Hydrogen Energ 39 (2014) 20614-20624 479
[2] I. Schjølberg, C. Hulteberg, I. Yasuda, C. Nelsson, Small scale reformers for on-site 480
hydrogen supply, Energy Procedia 29 (2012) 559-566 481
[3] P.C. Hulteberg, H. Burford, K. Duraiswamy, B. Porter, R. Woods, A cost effective steam 482
reformer for a distributed hydrogen infrastructure, Int J Hydrogen Energ 33 (2008) 1266-1274 483
[4] J.M. Ogden, Review of small stationary reformers for hydrogen production, Princeton 484
University Center for Energy and Environmental Studies, Report for the International Energy 485
Agency, Task 16 (2001) 1-49 486
[5] P. Neumann, F. von Linde, Options for economical supply of hydrogen, MPT International 487
2 (2003) 72-75 488
[6] J.D. Holladay, J. Hu, D.L. King, Y. Wang, An overview of hydrogen production 489
technologies, ChemCatChem 3 (2011) 244-260 490
[7] S. Martin, A. Wörner, On-board reforming of biodiesel and bioethanol for high temperature 491
PEM fuel cells: Comparison of autothermal reforming and steam reforming, J Power Sources 492
196 (2011) 3163-3171 493
[8] A. Qi, B. Peppley, K. Karan, Integrated fuel processors for fuel cell application: A review, 494
Fuel Process Technol 88 (2007) 3-22 495
[9] G. Nahar, V. Dupont, Hydrogen via steam reforming of liquid biofeedstock, Biofuels 3 496
(2012) 167-191 497
[10] C.H. Bartholomew, R.J. Farrauto, Fundamentals of Industrial Catalytic Processes, Wiley 498
(2006), Second Edition 499
[11] N. Abatzoglou, C. Fauteux-Lefebvre, N. Braidy, Biodiesel reforming with a NiAl2O4/Al2O3-500
YSZ catalyst for the production of renewable SOFC fuel, WIT Transactions on Ecology and 501
the Environment 143 (2011) 145-155 502
[12] Y. Shiratori, T. Quang-Tuyen, Y. Umemura, T. Kitaoka, K. Sasaki, Paper-structured 503
catalyst for the steam reforming of biodiesel fuel, Int J Hydrogen Energy 38 (2013) 11278-504
11287 505
[13] Y. Shiratori, T. Quang-Tuyen, K. Sasaki, Performance enhancement of biodiesel fueled 506
SOFC using paper-structured catalyst, Int J Hydrogen Energy 38 (2013) 9856-9866 507
[14] G. Nahar, V. Dupont, M.V. Twigg, E. Dvininov, Feasibility of hydrogen production from 508
steam reforming of biodiesel (FAME) feedstock on Ni-supported catalysts, Appl Catal B-509
Environ 168-169 (2015) 228-242 510
[15] S. Martin, G. Kraaij, T. Ascher, D. Wails, A. Wörner, An experimental investigation of 511
biodiesel steam reforming, Int J Hydrogen Energ 40 (2015) 95-105 512
[16] J. Lin, T.A. Trabold, M.R. Walluk, D.F. Smith, Bio-fuel reforming for solid oxide fuel cell 513
applications. Part 2: Biodiesel, Int J Hydrogen Energ 39 (2014) 183-195 514
[17] S.P. Katikaneni, F. Al-Muhaish, A. Harale, T. V. Pham, On-site hydrogen production 515
from transportation fuels: An overview and techno-economic assessment, Int J Hydrogen 516
Energ 39 (2014) 4331-4350 517
[18] T. Persson, Simulation of small-scale hydrogen production, Department of Chemical 518
Engineering Lund University, master thesis (2007) 519
[19] S. Specchia, Fuel processing activities at European level: A panoramic overview, Int J 520
Hydrogen Energ 39 (2014) 17953-17968 521
[20] P. Bolat, C. Thiel, Hydrogen supply chain architecture for bottom-up energy systems 522
models. Part 2: Techno-economic inputs for hydrogen production pathways, Int J Hydrogen 523
Energ 39 (2014) 8898-8925 524
[21] I. Dincer, C. Acar, Review and evaluation of hydrogen production methods for better 525
sustainability, Int J Hydrogen Energ (2014), Article in Press 526
[22] G. Soave, Equilibrium constants from a modified Redlich-Kwong equation of state, 527
Chem Eng Sci 27 (1972) 1196-1203 528
[23] NEMESIS2+ website; http://www.nemesis-project.eu/ (accessed 12.08.2015) 529
[24] I.C. Kemp, Pinch Analysis and Process Integration, Elsevier Ltd (2007), Second Edition 530
[25] P. Christensen, L. R. Dysert, AACE International Recommended Practice No. 18R-97: 531
Cost estimate classification system – as applied in engineering, procurement, and 532
construction for the process industries, AACE International (2011) 533
[26] M. Peters, K. Timmerhaus, R. West, Plant design and economics for chemical 534
engineers. McGraw-Hill (2004) 535
[27] R. Smith, Chemical process design and integration, Wiley (2005) 536
[28] U.S. Department of Energy, National Energy Technology Laboratory, Technology 537
Learning curve (FOAK to NOAK), Publication number: DOE/NETL-341/081213 (2013) 538
[29] Access Intelligence, Chemical engineering plant cost index, Chemical Engineering 122 539
(2015) 63-64 540
[30] R. D. Stewart, R. M. Wyskida, J. D. Johannes, Cost estimators reference manual, Wiley 541
(1995), Second Edition 542
[31] Federal Statistical Office of Germany, Statistisches Jahrbuch 2014, Wiesbaden (2014) 543
[32] Dutch Association of Cost Engineers (DACE), Price Booklet 30 Edition (2014) 544
[33] Federal Statistical Office of Germany, https://www.destatis.de (accessed 24.07.2015) 545
[34] Union zur Förderung von Öl - und Proteinpflanzen e.V. (UFOP), Biodiesel ab Tanklager, 546
Großhandelspreise ohne Mehrwertsteuer, http://www.ufop.de/biodiesel-und-co/biodiesel-547
preis/ (accessed 25.07.2015) 548
[35] Fachagentur Nachwachsende Rohstoffe e.V. (FNR), Basisdaten Bioenergie 549
Deutschland August 2014 550
![Oxidative Steam Reforming of Bioethanol over …...as a support in the ethanol steam-reforming reactions [17]. Rh, Ru and Abstract Oxidative steam reforming of ethanol for hydrogen](https://static.documents.pub/doc/80x56/5e780744e9502758d52e3186/oxidative-steam-reforming-of-bioethanol-over-as-a-support-in-the-ethanol-steam-reforming.jpg)


