

Prepared in cooperation with the Bureau of Land Management
Hydrogeology, Groundwater Levels, and Generalized Potentiometric-Surface Map of the Green River Basin Lower Tertiary Aquifer System, 2010–14, in the Northern Green River Structural Basin, Wyoming
Scientific Investigations Report 2015–5090
U.S. Department of the InteriorU.S. Geological Survey
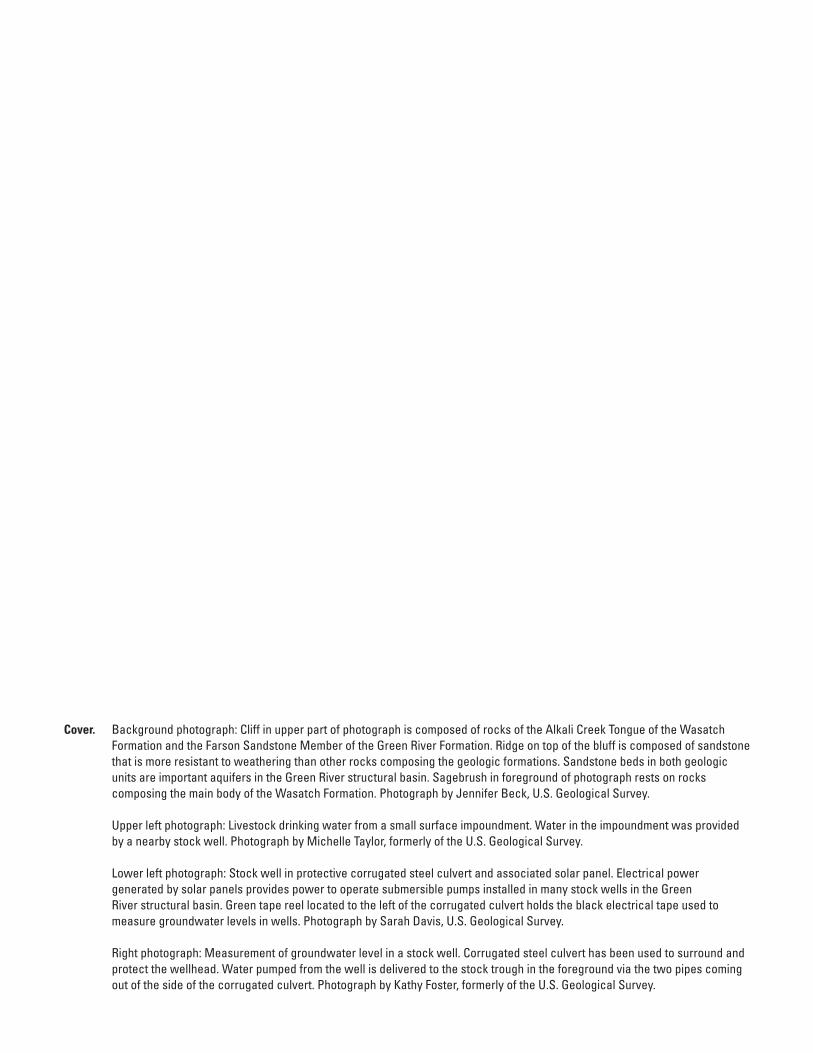
Cover. Background photograph: Cliff in upper part of photograph is composed of rocks of the Alkali Creek Tongue of the Wasatch Formation and the Farson Sandstone Member of the Green River Formation. Ridge on top of the bluff is composed of sandstone that is more resistant to weathering than other rocks composing the geologic formations. Sandstone beds in both geologic units are important aquifers in the Green River structural basin. Sagebrush in foreground of photograph rests on rocks composing the main body of the Wasatch Formation. Photograph by Jennifer Beck, U.S. Geological Survey. Upper left photograph: Livestock drinking water from a small surface impoundment. Water in the impoundment was provided by a nearby stock well. Photograph by Michelle Taylor, formerly of the U.S. Geological Survey. Lower left photograph: Stock well in protective corrugated steel culvert and associated solar panel. Electrical power generated by solar panels provides power to operate submersible pumps installed in many stock wells in the Green River structural basin. Green tape reel located to the left of the corrugated culvert holds the black electrical tape used to measure groundwater levels in wells. Photograph by Sarah Davis, U.S. Geological Survey. Right photograph: Measurement of groundwater level in a stock well. Corrugated steel culvert has been used to surround and protect the wellhead. Water pumped from the well is delivered to the stock trough in the foreground via the two pipes coming out of the side of the corrugated culvert. Photograph by Kathy Foster, formerly of the U.S. Geological Survey.

Hydrogeology, Groundwater Levels, and Generalized Potentiometric-Surface Map of the Green River Basin Lower Tertiary Aquifer System, 2010–14, in the Northern Green River Structural Basin, Wyoming
By Timothy T. Bartos, Laura L. Hallberg, and Cheryl A. Eddy-Miller
Prepared in cooperation with the Bureau of Land Management
Scientific Investigations Report 2015–5090
U.S. Department of the InteriorU.S. Geological Survey

U.S. Department of the InteriorSALLY JEWELL, Secretary
U.S. Geological SurveySuzette M. Kimball, Acting Director
U.S. Geological Survey, Reston, Virginia: 2015
For more information on the USGS—the Federal source for science about the Earth, its natural and living resources, natural hazards, and the environment—visit http://www.usgs.gov or call 1–888–ASK–USGS.
For an overview of USGS information products, including maps, imagery, and publications, visit http://www.usgs.gov/pubprod/.
Any use of trade, firm, or product names is for descriptive purposes only and does not imply endorsement by the U.S. Government.
Although this information product, for the most part, is in the public domain, it also may contain copyrighted materials as noted in the text. Permission to reproduce copyrighted items must be secured from the copyright owner.
Suggested citation:Bartos, T.T., Hallberg, L.L., and Eddy-Miller, C.A., 2015, Hydrogeology, groundwater levels, and generalized potentiometric-surface map of the Green River Basin lower Tertiary aquifer system, 2010–14, in the northern Green River structural basin, Wyoming: U.S. Geological Survey Scientific Investigations Report 2015–5090, 33 p., http://dx.doi.org/10.3133/sir20155090.
ISSN 2328-0328 (online)

iii
Acknowledgments
The authors thank EnCana Oil and Gas (USA), Inc. for their cooperation and participation during this study. Specifically, the use of the Jonah Workforce Facility and access to EnCana leases is appreciated, as is assistance with identifying and contacting local grazing leaseholders. Local ranchers with grazing leases in the area are thanked for providing information about the location and status of groundwater wells, especially Pete Arambel of Midland Land and Livestock and John Erramouspe of G and E Livestock, Inc.
Numerous current and former employees of the U.S. Geological Survey (USGS) are thanked for their assistance with measurement of groundwater levels throughout the study area, including Mike Sweat, Katharine Foster, Greg Boughton, Michelle Taylor, Audrey Plenty Hoops, Jennifer Beck, Scott Edmiston, and Sarah Davis. Colleague reviews by Janet Carter (USGS) and Rod Caldwell (USGS) improved the quality of the manuscript. Suzanne Roberts (USGS) is thanked for creating the illustrations and tables.

iv
Contents
Acknowledgments ........................................................................................................................................iiiAbstract ...........................................................................................................................................................1Introduction.....................................................................................................................................................1
Purpose and Scope ..............................................................................................................................2Methods of Investigation ....................................................................................................................2
Description of Study Area ............................................................................................................................2Geographic Setting and Climate ........................................................................................................2Geologic Setting ....................................................................................................................................4
Hydrogeology................................................................................................................................................12Groundwater Levels ....................................................................................................................................14
Relation between Depth to Groundwater and Well Depth ..........................................................15Temporal Groundwater-Level Changes...........................................................................................15
Generalized Potentiometric Surface ........................................................................................................19Summary........................................................................................................................................................22References Cited..........................................................................................................................................22Appendix 1.....................................................................................................................................................27
Figures 1. Map showing location of the U.S. Geological Survey study area, northern Green
River structural basin, Wyoming ................................................................................................3 2. Map showing location of study area in relation to principal tectonic features of the
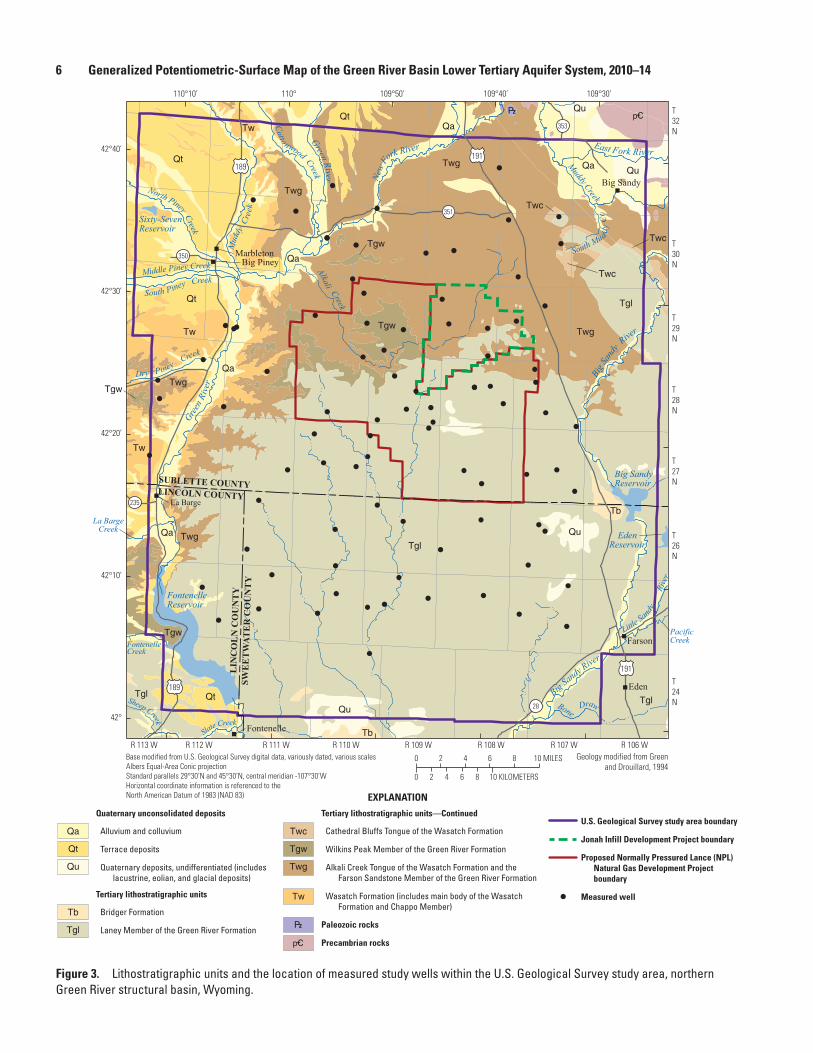
Greater Green River structural basin and adjacent areas ....................................................5 3. Map showing lithostratigraphic units and the location of measured study wells
within the U.S. Geological Survey study area, northern Green River structural basin, Wyoming .............................................................................................................................6
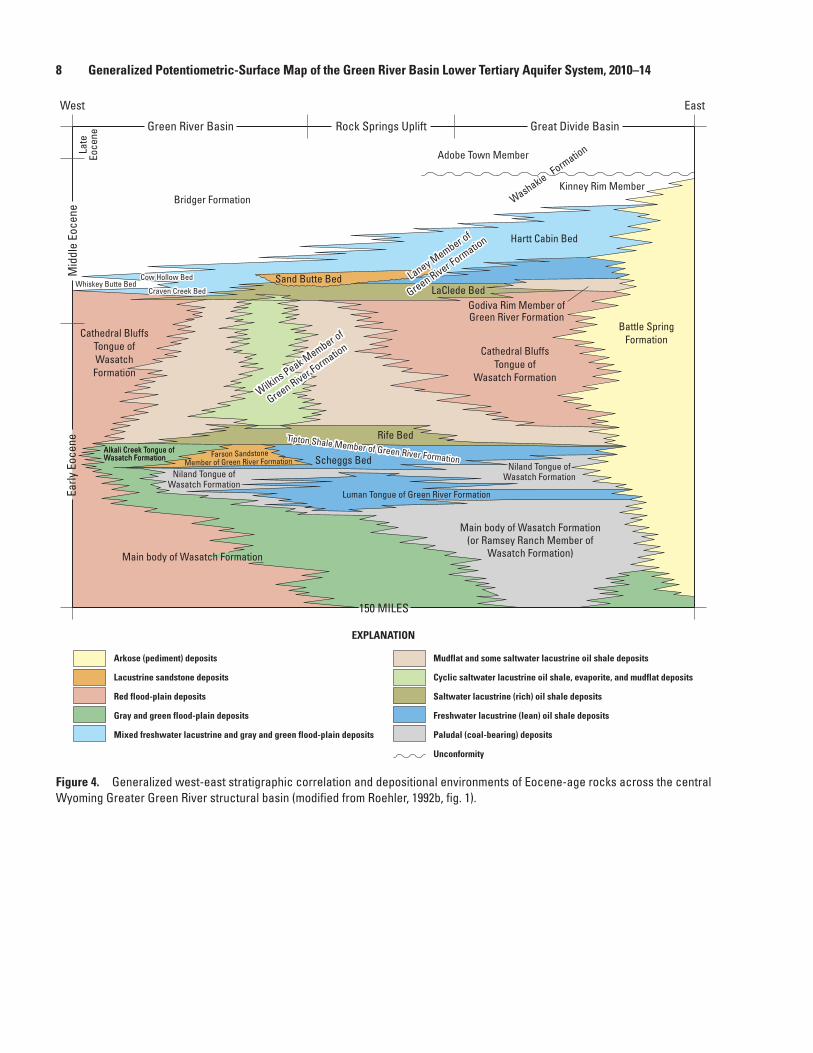
4. Diagram showing generalized west-east stratigraphic correlation and depositional environments of Eocene-age rocks across the central Wyoming Greater Green River structural basin ...................................................................................................................8
5. Diagram showing stratigraphic correlation diagrams of intertongued Wasatch and Green River Formations in the vicinity of study area, northern Green River structural basin .............................................................................................................................9
6. Diagram showing relation of lithostratigraphic units to hydrogeologic units, northern Green River structural basin, Wyoming .................................................................11
7. South-north diagrammatic cross-section summarizing groundwater recharge, discharge, and generalized groundwater-flow paths in the Green River Basin lower Tertiary aquifer system ..............................................................................................................13
8. Graphs showing depth to groundwater and groundwater-level altitude in relation to well depth, northern Green River structural basin, Wyoming .............................................16
9. Map showing difference between oldest and newest groundwater-level measurements in selected wells, northern Green River structural basin, Wyoming .....18
10. Map showing generalized potentiometric surface of the Green River Basin lower Tertiary aquifer system, 2010–14, northern Green River structural basin, Wyoming ......21
v
Tables 1. Summary of groundwater-level measurements, groundwater-level altitudes, and
well depths, in relation to lithostratigraphic and hydrogeologic units, northern Green River structural basin, Wyoming, 2010–14 ....................................................................7
2. Groundwater-level changes in selected wells, northern Green River structural basin, Wyoming ...........................................................................................................................17
Appendix Table 1–1. Wells evaluated for construction of generalized potentiometric-surface map,
northern Green River structural basin, Wyoming .................................................................28
Conversion FactorsInch/Pound to International System of Units
Multiply By To obtain
Length
inch (in.) 2.54 centimeter (cm)foot (ft) 0.3048 meter (m)mile (mi) 1.609 kilometer (km)
Area
square mile (mi2) 2.590 square kilometer (km2)
Temperature in degrees Celsius (°C) may be converted to degrees Fahrenheit (°F) as °F = (1.8 × °C) + 32.
Temperature in degrees Fahrenheit (°F) may be converted to degrees Celsius (°C) as °C = (°F – 32) / 1.8.
Concentrations of chemical constituents in water are given in milligrams per liter (mg/L).
DatumsVertical coordinate information is referenced to the North American Vertical Datum of 1988 (NAVD 88).
Horizontal coordinate information is referenced to the North American Datum of 1983 (NAD 83).
Altitude, as used in this report, refers to distance above the vertical datum.


Hydrogeology, Groundwater Levels, and Generalized Potentiometric-Surface Map of the Green River Basin Lower Tertiary Aquifer System, 2010–2014, in the Northern Green River Structural Basin, Wyoming
By Timothy T. Bartos, Laura L. Hallberg, and Cheryl A. Eddy-Miller
AbstractIn cooperation with the Bureau of Land Management,
groundwater levels in wells located in the northern Green River Basin in Wyoming, an area of ongoing energy develop-ment, were measured by the U.S. Geological Survey from 2010 to 2014. The wells were completed in the uppermost aquifers of the Green River Basin lower Tertiary aquifer sys-tem, which is a complex regional aquifer system that provides water to most wells in the area. Except for near perennial streams, groundwater-level altitudes in most aquifers generally decreased with increasing depth, indicating a general down-ward potential for groundwater movement in the study area. Drilled depth of the wells was observed as a useful indicator of depth to groundwater such that deeper wells typically had a greater depth to groundwater. Comparison of a subset of wells included in this study that had historical groundwater levels that were measured during the 1960s and 1970s and again between 2012 and 2014 indicated that, overall, most of the wells showed a net decline in groundwater levels.
The groundwater-level measurements were used to con-struct a generalized potentiometric-surface map of the Green River Basin lower Tertiary aquifer system. Groundwater-level altitudes measured in nonflowing and flowing wells used to construct the potentiometric-surface map ranged from 6,451 to 7,307 feet (excluding four unmeasured flowing wells used for contour construction purposes). The potentiometric-surface map indicates that groundwater in the study area generally moves from north to south, but this pattern of flow is altered locally by groundwater divides, groundwater discharge to the Green River, and possibly to a tributary river (Big Sandy River) and two reservoirs (Fontenelle and Big Sandy Reservoirs).
IntroductionThe Wyoming Landscape Conservation Initiative
(WLCI) is a program created to “implement a long-term, science-based program of assessing, conserving, and enhanc-ing fish and wildlife habitats while facilitating responsible energy and other development through local collaboration and partnerships” (Bowen and others, 2014, p. 2). The role of the U.S. Geological Survey (USGS) in the WLCI program is “to conduct science and perform technical-assistance activities that help to assess and monitor trends in overall ecosystem conditions, focal habitats, and species of concern; evaluate the effectiveness of habitat enhancement or restoration projects; and provide support to conservation planners and decision-makers” (Bowen and others, 2014, p. 2). The WLCI study area includes much of southwestern Wyoming, including all or parts of Lincoln, Sublette, Fremont, Sweetwater, and Carbon Counties (Bowen and others, 2014, fig. 1).
A study was completed as part of ongoing USGS contri-butions to the WLCI program with the objective to improve understanding of the primary groundwater resources used in a part of the northern Green River structural basin. Natural gas is currently (2015) extracted from tight (low permeability) gas reservoirs in a deep Late Cretaceous-age geologic formation (Lance Formation) (Law, 1984; Law and Spencer, 1989) that underlies the shallow groundwater resources that exclusively provide water to rural livestock, domestic, and industrial wells in the area (Clarey and others, 2010). Expansion of natural-gas development in the study area is expected in the future (EnCana Oil and Gas [USA], Inc., 2011; Bureau of Land Man-agement, 2011). Drilling into the Lance Formation requires penetration of overlying aquifers that compose the regionally extensive and heterogeneous aquifer system contained within

2 Generalized Potentiometric-Surface Map of the Green River Basin Lower Tertiary Aquifer System, 2010–14
Tertiary rocks (known as the Green River Basin lower Tertiary aquifer system) that supplies water to these wells. To improve understanding of this locally and regionally important aquifer system, the USGS, in cooperation with the Bureau of Land Management (BLM), completed the following: (1) measured groundwater levels in wells completed in the aquifer system, (2) evaluated measured groundwater levels and equivalent groundwater-level altitudes in relation to well depths and lithostratigraphic/hydrostratigraphic unit designation, (3) com-pared newly measured groundwater levels with historical groundwater levels where possible, and (4) constructed an updated generalized potentiometric-surface map.
Purpose and Scope
The purpose of this report is to describe groundwater levels and the generalized potentiometric-surface of the lower Tertiary aquifer system in the northern Green River structural basin. The hydrogeology of the area also is summarized. Construction of a generalized potentiometric-surface map of the regional Green River Basin lower Tertiary aquifer system in the northern Green River structural basin Wyoming was the conclusion of an effort by the USGS to measure groundwater levels during 2010–14 (Sweat, 2013). The complex geology in the Green River structural basin greatly influences ground-water levels and movement of groundwater in the lower Tertiary aquifer system. Nomenclature of the interfingering and intertonguing Tertiary lithostratigraphic units represent-ing many different depositional environments (lithostratigra-phy) is very complex and has been repeatedly revised in the northern Green River structural basin. Similarly, the classifica-tion of these lithostratigraphic units as hydrogeologic units (hydrostratigraphy) also is very complex and also has been repeatedly revised; consequently, a summary and synthesis of past and current science related to the lithostratigraphy and hydrostratigraphy of the northern Green River structural basin is provided herein.
Methods of Investigation
The methods used to inventory and select existing wells for measurement of groundwater levels in the study area are described in Sweat (2013). In general, existing wells were selected that included information about the depth of the well, the open or screen/perforated interval(s) of the well, the type of surface seal, and the groundwater level at the time of well completion (Sweat, 2013). Groundwater-level measurements were made during 2010–14 using a steel tape, electrical tape, or pressure gauge using protocols and quality-control proce-dures described in Cunningham and Schalk (2011).
Description of Study AreaThe study area is described in this section of the report.
Brief descriptions of the geographic setting, climate, and geologic setting in the vicinity of the study area are presented. A summary and synthesis of past and current science related to lithostratigraphy and hydrostratigraphy is provided in the following “Hydrogeology” section.
Geographic Setting and Climate
The study area is located in parts of Sublette, Lincoln, and Sweetwater Counties in western Wyoming about 68 miles (mi) northwest of Rock Springs, Wyoming, and about 18 mi south of Pinedale, Wyo. (fig. 1). Most land is administered by the BLM (fig. 1), and one of the primary land uses is livestock grazing. The study area is located in an area of increasing energy development and includes a current gas development project (Jonah Infill Development Project) and a developing natural gas project (Normally Pressured Lance Natural Gas Development Project) on the BLM lands.
Much of the study area is a rolling grass-, sagebrush-, and shrub-covered (greasewood-saltbrush) plain with inter-vening ridges, buttes, badlands, and ephemeral and perennial drainages. This vegetation is sparse in much of the study area and greatest near perennial streams. The study area includes critical habitat for the Greater Sage-Grouse (Centrocercus urophasianus), elk (Cervus elaphus), pronghorn (Antilocapra americana), mule deer (Odocoileus hemionus), and feral horses (Equus caballus) (Duke and others, 2011).
Most of the study area is located east of the primary drainage in the Green River structural basin and drainage basin (Green River Basin), which is the perennial southward flowing Green River (fig. 1). Several prominent perennial tributaries to the Green River are present along the margins of the study area, including the south- and southwest-flowing New Fork and Big Sandy Rivers. Two reservoirs (Fontenelle and Big Sandy Reservoirs) are present in the southwestern and southeastern parts of the study area, respectively (fig. 1).
Climate in the study area is affected strongly by alti-tude and orographic effects of surrounding mountain ranges (Martner, 1986; Curtis and Grimes, 2004). In the southeastern part of the study area at Farson, Wyo. (fig. 1), the mean annual maximum temperature is about 55 degrees Fahrenheit (°F), and the mean annual minimum temperature is about 20 °F (period of record is January 1, 1915–December 31, 2005; Western Regional Climate Center, 2014a). Temperature in the northwestern part of the study area is similar, as the mean annual maximum temperature at Big Piney, Wyo., is about 53 °F, and the mean annual minimum temperature is about

Description of Study Area 3
Map area
80
90
25
189
191
Greater Green River structural basinGreater Green River structural basin
WYOMING
Rock Springs
Buckhorn Canyon
Piney Creek
Fontenelle Reservoir
Big Sandy Reservoir
River
Fork
New BoulderLake
ForkEast
Big S
andy
River
Littl
e San
dy R
iver
Big S
andy
River
Eighteenmile Canyon
Fontenelle Creek
La Barge Creek
New
Fork RiverGreen River
Cottonwood Creek
Green R
iver
South
Eden
Farson
Big Piney
Boulder
Pinedale
T24N
T32N
T33N
R 114 W R 106 W
Fontenelle Reservoir
189
T31N
T28N
T29N
T30N
109°30'109°45’110°00’110°15’
42°45’
42°30’
42°15’
0 5 10 15 MILES
0 5 10 15 KILOMETERS
T25N
T26N
T27N
28
R 107 WR 108 WR 109 WR 110 WR 111 WR 112 WR 113 W
U.S. Geological Survey study area boundary
Jonah Infill Development Project boundary
Proposed Normally Pressured Lance (NPL) Natural Gas Development Project boundary
Land surface administrationBureau of Land Management
Bureau of Reclamation
Forest Service
Private
State
EXPLANATION
191
191
353
351
235
189L
INC
OL
N C
OU
NT
YSW
EE
TW
ATE
R C
OU
NT
Y
SUBLETTE COUNTY
Base from U.S. Geological Survey, variously dated, various scales Albers Equal-Area Conic projectionStandard parallels 29°30’N and 45°30’N, central meridian 111°00’WHorizontal coordinate information is referenced to the North American Datum of 1983 (NAD 83)
Land surface administration data fromBureau of Land Management, 2007
Big Sandy Reservoir
Marbleton
LaBarge
WIND RIVER RANGE
Figure 1. Location of the U.S. Geological Survey study area, northern Green River structural basin, Wyoming.
4 Generalized Potentiometric-Surface Map of the Green River Basin Lower Tertiary Aquifer System, 2010–14
18 °F (period of record is August 1, 1948–March 31, 2013; Western Regional Climate Center, 2014b). Mean annual precipitation for the study area ranges from 6 to 15 inches (in.; Clarey and others, 2010, fig. 2–3, p. 2–33, period of precipita-tion record, 1971–2000) and, consequently, the climate is clas-sified as arid to semiarid. Much of the study area receives less than 10 in. of precipitation per year (areas with mean annual precipitation of less than 10 in. in Wyoming are classified as desert; Martner, 1986). Precipitation increases substantially in areas north and northeast of the study area as altitude increases in the adjacent Wind River Range (Clarey and others, 2010, fig. 2–3, p. 2–33). Estimated mean annual pan evaporation and estimated mean annual potential evapotranspiration exceed mean annual precipitation throughout the study area (Martner, 1986; Curtis and Grimes, 2004).
Geologic Setting
The study area is located in the northern part of the Green River structural basin, a large (10,500 square miles; Roehler, 1992a) structural and topographic basin in southwestern Wyo-ming (identified as Green River structural basin on fig. 2). Tec-tonic activity formed the basin during the Laramide orogeny, a period of compressional mountain-building movements during the Late Cretaceous and early Tertiary. The structural basin is bounded by the Overthrust Belt to the west, the Wind River and Gros Ventre Ranges to the north, Rock Springs Uplift to the east, and the Uinta Mountains to the south (fig. 2). The structural basin also is located within the larger Green River drainage basin that is drained by the perennial southward flow-ing Green River and its tributaries, including the New Fork River in the north and Big Sandy River in the eastern parts of the study area (figs. 1 and 2). The Green River structural and drainage basins are located within part of the much larger multi-State Upper Colorado River drainage basin (fig. 2). The Greater Green River structural basin consists of four structural and topographic basins (Green River, Great Divide, Washakie, and Sand Wash structural basins; shaded in blue on fig. 2).
Lithostratigraphic units exposed at land surface in the study area and the locations of wells used for this study are shown in figure 3. Most of the exposed lithostratigraphic units in the study area are various members and tongues of the Green River and Wasatch Formations of early Tertiary age. Areal extent and thickness of both the Green River and Wasatch Formations vary substantially in the Green River structural basin, including the study area (Roehler, 1992b). Several different types of unconsolidated deposits of Quater-nary age are present locally, most notably alluvium and terrace deposits along the Green, New Fork, and Big Sandy Rivers and associated tributaries (fig. 3).
Wells visited for this study were completed mostly in the Eocene-age Green River Formation and Eocene- and Paleo-cene-age Wasatch Formation (table 1; table 1–1 in appen-dix 1). The stratigraphy of both formations in the Green River structural basin is highly complex because it represents numer-ous interfingering/intertonguing lacustrine and fluvial litholo-gies deposited primarily as a result of lake-level fluctuations in an ancient lake environment (Bradley, 1926, 1959, 1964; Bradley and Eugster, 1969; Surdam and Stanley, 1979, 1980; Sullivan, 1980; Roehler, 1990, 1991a, 1991b, 1992a, 1992b, 1992c, 1993; Chetel and Carroll, 2010). The complex correla-tion and depositional environments of Eocene-age lithostrati-graphic units (including the Green River and Wasatch For-mations) across the central Green River structural basin and adjacent areas to the east is shown in figure 4 (reproduced from Roehler, 1992b, fig. 1).
The complex stratigraphic nomenclature of the various interfingering/intertonguing beds, tongues, and members of both the Green River and Wasatch Formations in the Green River structural basin and study area (figs. 4 and 5) have been repeatedly revised since originally named. Many new member and tongue names of both formations have been defined and abandoned, redefined, or their stratigraphic and geographic boundaries changed. Not all of these identified lithostrati-graphic/lithofacies units (beds, tongues, and members) are present in the study area. Units identified in the vicinity of the study area are shown on figure 5. In this report, the nomencla-ture of Roehler (1991a, 1991b, 1992a, 1992b, 1992c, 1993) and Love and others (1993) generally was used in combination with various geologic maps of the study area (Oriel and Platt, 1980; Love and Christiansen, 1985; Sutherland and Scott, 2009; Sutherland and Luhr, 2011) to identify and name the various member and tongue names of both formations.
The Green River Formation in the Green River structural basin is divided into numerous different tongues, members, and beds representing many different depositional environ-ments (figs. 4 and 5). The Laney Member of the Green River Formation consists of interbedded layers and lenses of oil shale; marlstone; tuffaceous sandstone and siltstone; and gray, tan, or green sandstone and mudstone (Roehler, 1991a, 1991b, 1992a, 1992b, 1992c). In some parts of the Green River structural basin, including much of the study area, the Laney Member has been divided into different beds (for example, LaClede and Sand Butte Beds; fig. 5, sections B–Bʹ and C–C ʹ ) (Roehler, 1992b, figs. 8 and 9). The LaClede Bed contains the thickest oil-shale accumulation in the Green River Forma-tion, and thickness in the study area ranges from 0 to less than 100 feet (ft; Roehler, 1992b, fig. 29). The Sand Butte Bed is present only in a small part of the study area, just south-east of Farson where thickness is less than 400 ft (Roehler, 1992b, fig. 30). The Wilkins Peak Member of the Green River

Description of Study Area
5
Figure 2. Location of study area in relation to principal tectonic features of the Greater Green River structural basin and adjacent areas (modified from Taylor and others,1986; Geldon, 2003a, 2003b).
WYOMINGWYOMING
COLORADOUTAH
NEWMEXICOARIZONA
Upper Colorado River Basin boundary
Study area
SWEETWATERCOUNTY
SUBLETTECOUNTY
FREMONT COUNTY
LINCOLNCOUNTY
UINTACOUNTY
UINTAHCOUNTYDUCHESNE
COUNTY
CARBONCOUNTY
ROUTTCOUNTY
MOFFAT COUNTY
DAGGETTCOUNTY
SUMMITCOUNTY
JACKSONCOUNTY
Rock Springs
WYOMING
COLORADO
Pinedale
108°
43° 43°
42° 42°
41° 41°
109°
110°
106°
107°
0 25 50 75 100 MILES
0 25 50 75 100 KILOMETERS
RawlinsGreen Riverstructural
basin
Green Riverstructural
basin
WASATCHCOUNTY
Craig
HobackBasin
Sweetwater Uplift
Upper Colorado River Basin boundary
Rock SpringsUplift
Cherokee Ridge
Sand Washstructural basin
Axial Basin Arch
Great Divide structural basin
Washakiestructural basin
Sierra Madre-Park Uplift
Middle Park
Blac
ks F
or
k
Wind River Range
BigPiney
FarsonEden
Base from U.S. Geological Survey, 1972, 1:250,000 Albers Equal-Area Conic projectionStandard parallels 29°30’N and 45°30’N, central meridian 109°00’WHorizontal coordinate information is referenced to the North American Datum of 1983 (NAD 83)
Rawlins Uplift
Foss
il Ba
sin
Foss
il Ba
sin
Over
thru
st
Bel
tOv
erth
rust
B
elt
Hams Fork
Wamsutter Arch
Big Sandy Res
Piney Creek
Gre
en R
iver
Green River
Big San
dyRi
ver
Four structural basins within Greater Green River structural basin (Green River, Great Divide, Washakie, Sand Wash)
U.S. Geological Survey study area boundary
Line of section shown on figure 7
EXPLANATION
Uinta Mountains
La Barge
AꞋAꞋ
AA
UTA
HC
OL
OR
AD
OU
TAH
CO
LO
RA
DO
FlamingGorge
Reservoir
FlamingGorge
Reservoir
Fontenelle ReservoirFontenelle Reservoir
AꞋAꞋAA
Gros Ventre Range
North
New Fork
River
Henrys Fork
6 Generalized Potentiometric-Surface Map of the Green River Basin Lower Tertiary Aquifer System, 2010–14
Big SandyReservoir
Sixty-SevenReservoir
Middle Piney Creek
South Piney Creek
Mud
dy C
reek
Green
Rive
r
Big Sandy R
iver
Little San
dy
PacificCreek
Cottonwood Creek
East Fork River
EdenReservoir
Sheep CreekFontenelle Creek
North Piney Creek
Green River New
Fork River
Muddy Creek
Slate Creek
Rive
r
BoneDraw
MarbletonBig Piney
Alkali Creek
Fontenelle Reservoir
Eden
Farson
Big Sandy
Big S
andy
Rive
r
0
6 82 4 10 MILES
6 82
0
4 10 KILOMETERS
Base modified from U.S. Geological Survey digital data, variously dated, various scales Albers Equal-Area Conic projectionStandard parallels 29°30’N and 45°30’N, central meridian -107°30’WHorizontal coordinate information is referenced to the North American Datum of 1983 (NAD 83)
109°30’109°40’109°50’110°110°10’
42°40’
42°30’
42°20’
42°10’
42°
Geology modified from Greenand Drouillard, 1994
T24N
T26N
T27N
T28N
T29N
T30N
T32N
R 113 W R 112 W R 111 W R 110 W R 109 W R 108 W R 107 W R 106 W
EXPLANATION
U.S. Geological Survey study area boundary
Jonah Infill Development Project boundary
Proposed Normally Pressured Lance (NPL) Natural Gas Development Project boundary
Measured well
Alluvium and colluvium
Terrace deposits
Quaternary deposits, undifferentiated (includes lacustrine, eolian, and glacial deposits)
Quaternary unconsolidated deposits
Cathedral Bluffs Tongue of the Wasatch Formation
Wilkins Peak Member of the Green River Formation
Alkali Creek Tongue of the Wasatch Formation and the Farson Sandstone Member of the Green River Formation
Wasatch Formation (includes main body of the Wasatch Formation and Chappo Member)
Tertiary lithostratigraphic units—Continued
189191
353
350
351
235
189
191
28
La Barge
Fontenelle
SUBLETTE COUNTYLINCOLN COUNTY
LIN
CO
LN
CO
UN
TY
SWE
ET
WAT
ER
CO
UN
TY
Dry Piney Creek
South Muddy
Cr
|
=
Tgw
Tw
Twg
Bridger Formation
Laney Member of the Green River Formation
Tertiary lithostratigraphic units
Tb
Tgl
Twc
Qt
Qu
Qa
Tgl
Qu
Qu
Qu
Qu
Qt
Qt
Qt
Qa
Twc
Twc
Twc
=
Qa
Qa
Qa
Qa
Qt
Tw
Tw
Tw
Twg
Twg
Twg
Twg
Tgw
Tgw
Tgw
Tgw
|
Tb
Tb
Tgl
Tgl
Tgl
Twg
La BargeCreek
Paleozoic rocks
Precambrian rocks
Figure 3. Lithostratigraphic units and the location of measured study wells within the U.S. Geological Survey study area, northern Green River structural basin, Wyoming.

Description of Study Area 7
Table 1. Summary of groundwater-level measurements, groundwater-level altitudes, and well depths, in relation to lithostratigraphic and hydrogeologic units, northern Green River structural basin, Wyoming, 2010–14.
[--, no data or not applicable; NAVD 88, North American Vertical Datum of 1988]
CharacteristicNumber of
measured wellsMinimum Median Maximum
Quaternary alluvial aquifer(New Fork alluvium)
Groundwater level, in feet below land surface 1 3.17 -- --Groundwater-level altitude, in feet above NAVD 88 1 6,810 -- --Well depth, in feet below land surface 1 16 -- --
Laney Member of the Green River Formation(Laney aquifer)
Groundwater level, in feet below land surface 2 21.00 -- 26.69Groundwater-level altitude, in feet above NAVD 88 2 6,451 -- 7,012Well depth, in feet below land surface 2 25 -- 65
Wilkins Peak Member of the Green River Formation(Wilkins Peak confining unit)
Groundwater level, in feet below land surface 2 38.64 -- 56.69Groundwater-level altitude, in feet above NAVD 88 2 6,545 -- 6,571Well depth, in feet below land surface 2 190 -- 190
Cathedral Bluffs Tongue of the Wasatch Formation(Wasatch zone of the Wasatch-Fort Union aquifer)
Groundwater level, in feet below land surface 4 17.52 48.38 84.20Groundwater-level altitude, in feet above NAVD 88 4 6,655 6,712 6,875Well depth, in feet below land surface 4 80 139.25 177
Farson Sandstone Member of the Green River Formation and Alkali Creek Tongue of the Wasatch Formation(Farson Sandstone-Alkali Creek aquifer)
Groundwater level, in feet below land surface (nonflowing wells) 47 5.89 120.66 482.82Groundwater-level altitude, in feet above NAVD 88 (nonflowing
and flowing wells)50 6,589 6,846 7,227
Well depth, in feet below land surface 50 66 344.5 1,042Main body of the Wasatch Formation
(Wasatch zone of the Wasatch-Fort Union aquifer)
Groundwater level, in feet below land surface (nonflowing wells) 19 13.00 130.62 484.66Groundwater-level altitude, in feet above NAVD 88 (nonflowing
and flowing wells)27 6,622 6,791 7,231
Well depth, in feet below land surface 27 153 555 1,365Undifferentiated Green River and Wasatch Formations
Groundwater level, in feet below land surface (nonflowing wells) 3 19.81 27.18 171.20Groundwater-level altitude, in feet above NAVD 88 (nonflowing
and flowing wells)3 7,002 7,107 7,191
Well depth, in feet below land surface 2 75 -- 339
8 Generalized Potentiometric-Surface Map of the Green River Basin Lower Tertiary Aquifer System, 2010–14
Figure 4. Generalized west-east stratigraphic correlation and depositional environments of Eocene-age rocks across the central Wyoming Greater Green River structural basin (modified from Roehler, 1992b, fig. 1).
Tipton Shale Member of Green River Formation
Green River Basin
West East
150 MILES
Mid
dle
Eoce
neEa
rly E
ocen
eLa
teEo
cene
Rock Springs Uplift Great Divide Basin
Adobe Town Member
Kinney Rim Member
LaClede Bed
Rife Bed
Scheggs Bed
Sand Butte Bed
Cathedral BluffsTongue ofWasatchFormation
Cathedral BluffsTongue of
Wasatch Formation
Alkali Creek Tongue ofWasatch FormationAlkali Creek Tongue ofWasatch Formation Farson Sandstone
Member of Green River Formation
Godiva Rim Member ofGreen River Formation
Luman Tongue of Green River Formation
Main body of Wasatch Formation
Washakie Formation
Laney Member of
Green River Formation
Laney Member of
Green River Formation
Wilkins Peak Member of
Green River Formation
Wilkins Peak Member of
Green River Formation
Cow Hollow BedCow Hollow BedWhiskey Butte Bed
Craven Creek BedCraven Creek Bed
Niland Tongue ofWasatch Formation
Niland Tongue ofWasatch Formation
Tipton Shale Member of Green River Formation
Main body of Wasatch Formation(or Ramsey Ranch Member of
Wasatch Formation)
Bridger Formation
Arkose (pediment) deposits
Lacustrine sandstone deposits
Red flood-plain deposits
Gray and green flood-plain deposits
Mixed freshwater lacustrine and gray and green flood-plain deposits
Mudflat and some saltwater lacustrine oil shale deposits
Cyclic saltwater lacustrine oil shale, evaporite, and mudflat deposits
Saltwater lacustrine (rich) oil shale deposits
Freshwater lacustrine (lean) oil shale deposits
Paludal (coal-bearing) deposits
Unconformity
EXPLANATION
Battle SpringFormation
Hartt Cabin Bed

Description of Study Area 9
0 3 MILES0
200 FEET
0 5 MILES0
200 FEET
SUBLETTECOUNTY
LINCOLNCOUNTY
Pinedale
43° 43°
42°
109°
110°
BigPiney
FarsonEden
Big Sandy Res
Piney Creek
Gre
en R
iver
La BargeFontenelle ReservoirFontenelle Reservoir
North
New Fork
River
BꞋB
C
CꞋ
A
AꞋ
Upper ColoradoRiver Basin boundary
Study areaboundary
SWEETWATER COUNTY
Big
San d
y R
iver
Gray or tan lacustrine sandstone
Red flood-plain deposits
Gray or green flood-plain deposits
Mixed tan or gray freshwater lacustrine andgray or green flood-plain deposits
Gray or green mudflat and brown or blacksaltwater lacustrine oil-shale deposits
Brown or black saltwater lacustrine oil-shale deposits
Tan or brown or freshwater lacustrine oil-shale deposits
Formation or lithofacies contact—Dashed where approximately located
Unconformity
Stratigraphic marker bed
Line of section
Evaporite crystals (mostly shortite)
EXPLANATION
AꞋAꞋAA
BꞋEAST
BWEST
Wilkins Peak Member ofGreen River Formation
Alkali Creek Tongue of Wasatch Formation
Scheggs Bed of Tipton Shale Memberof Green River Formation
Farson Sandstone Memberof Green River Formation
Cathedral Bluffs TongueCathedral Bluffs Tongue
La Bargeunconformity
Sand Butte Bed of Laney Member ofGreen River Formation
Farson Sandstone Member of Green River Formation
Main body ofWasatchFormation
Main body ofWasatchFormation
Main body ofWasatch Formation
Main body ofWasatch Formation
Layered tuff
Main tuff
Sand Butte Bed of Laney Memberof Green River Formation
Tower unconformity
LaClede Bed of Laney Member of Green Riv er FormationLayered tuffLa Barge unconformity
Contact changes stratigraphicposition
Main body ofWasatch Formation
Main body ofWasatch Formation
Alkali Creek Tongue of Wasatch Formation
Scheggs Bed of Tipton Shale Member ofGreen River Formation
Farson Sandstone Member of Green River Formation
Cathedral Bluffs Tongueof Wasatch Formation
Rife Bed of Tipton Shale Member of Green River Formation
Wilkins Peak Member of Green River FormationCathedral Bluffs Tongueof Wasatch Formation
0 5 MILES0
100 FEET
Cathedral BluffsTongue
Wilkins Peak Member ofGreen River Formation
Scheggs Bed of Tipton Shale Memberof Green River Formation
Laney Member ofGreen River Formation
Laney Member ofGreen River Formation
Laney Member of Green River
Formation
Laney Member of Green River
Formation
Laney Member
Laney Member CꞋ
C
SOUTH
NORTH
A
AꞋSOUTH
NORTH
Laney Member
Figure 5. Stratigraphic correlation diagrams of intertongued Wasatch and Green River Formations in the vicinity of study area, northern Green River structural basin (modified from Roehler, 1992b).

10 Generalized Potentiometric-Surface Map of the Green River Basin Lower Tertiary Aquifer System, 2010–14
Formation consists of saline minerals and bedded trona depos-its within interbedded sandstone, siltstone, mudstone, shale, and oil shale; beds of marlstone, algal limestone, and con-glomerate are present locally (Bradley, 1964; Roehler, 1991a, 1991b, 1992a, 1992b, 1992c). The Wilkins Peak Member has been divided into lower, middle, and upper parts in the Green River structural basin; only the middle and upper parts are present in the study area (Roehler, 1992b). The thickness of the upper and middle parts of the Wilkins Peak Member in the study area ranges from 0 to 100 ft and 0 to 200 ft, respectively (Roehler, 1992b, figs. 25 and 26). The Tipton Shale Mem-ber of the Green River Formation (also known as the Tipton Tongue in parts of the basin) consists of interbedded layers and lenses of oil shale, sandstone, siltstone, and limestone; the member commonly is divided into the Rife and Scheggs Beds, which are less than 50 ft in thickness in the study area (fig. 5) (Roehler, 1992b, figs. 4, 8, and 9). The Rife and Scheggs Beds are composed mostly of tan, brown, or black oil shale in the study area.
Similar to the Green River Formation, the Wasatch Formation in the Green River structural basin is divided into numerous different tongues, members, and beds represent-ing many different depositional environments (figs. 4 and 5). Where undivided in the Green River structural basin, the Wasatch Formation is identified as the “main body of the Wasatch Formation.” The main body of the Wasatch Forma-tion consists of gray, green, and red mudstone and sandstone (Roehler, 1991a, 1991b, 1992a, 1992b, 1992c), and thick-ness in the study area ranges from 2,000 to 8,000 ft (Roehler, 1992b, fig. 15). The Cathedral Bluffs Tongue of the Wasatch Formation consists of red sandstone and mudstone, gray and green sandstone and mudstone, and variegated sandstone and mudstone; thickness in the study area ranges from 0 to less than 500 ft (Roehler, 1992b, fig. 27). The Alkali Creek Tongue
of the Wasatch Formation consists of interbedded freshwater-deposited brown, green, and gray sandstone, siltstone, mud-stone, and shale; and locally conglomeratic lenses (Roehler, 1991a, 1992a, 1992b, 1992c). Thickness of the Alkali Creek Tongue ranges from 0 to 300 ft in the study area (Roehler, 1992b, fig. 21). The laterally equivalent Farson Sandstone Member of the Green River Formation consists of gray, tan, and brown sandstone; thin interbedded, gray shale and silt-stone of lacustrine origin; and locally occurring conglomerate. Thickness of the Farson Sandstone Member ranges from 0 to 400 ft in the study area (Roehler, 1992b, fig. 20).
Donavan (1950) and Lawrence (1963) assigned the rocks composing the Farson Sandstone Member to the Fontenelle Tongue of the Green River Formation. Oriel (1961) assigned the rocks to the New Fork Tongue of the Wasatch Forma-tion, whereas Sullivan (1980) assigned the rocks to the Tipton Shale Member of the Green River Formation. Rocks compos-ing the Alkali Creek Tongue of the Wasatch Formation were assigned to the New Fork Tongue of the Wasatch Formation by Oriel (1961), Lawrence (1963), and Sullivan (1980); and to the Fontenelle Tongue of the Green River Formation by Donavan (1950). Roehler (1991a) proposed assigning these rocks with these former names to the newly proposed Alkali Creek Tongue of the Wasatch Formation and Farson Sandstone Member of the Green River Formation, and abandoning the New Fork Tongue and Fontenelle Tongue names. The conven-tion of Roehler (1991a) is used herein.
The Paleocene-age Fort Union Formation underlies the Wasatch Formation in the study area (fig. 6). Both formations are very similar lithologically, and differentiating the two formations in the subsurface is difficult (Martin, 1996). An unnamed Paleocene-age lithostratigraphic unit composed of interbedded conglomerate, sandstone, siltstone, and mudstone underlies the Fort Union Formation (Law, 1984).
Stock well and associated windmill. The windmill is located directly above the well and provides the power to pump the well. Water removed from the well is pumped into the water storage device constructed of corrugated steel located right of the well. Rocks forming the cliff in the background of the photograph are composed of the Alkali Creek Tongue of the Wasatch Formation and the Farson Sandstone Member of the Green River Formation. The valley floor in foreground of photograph rests on rocks composing the main body of the Wasatch Formation. Sandstone beds in all three geologic units are important aquifers in the Green River structural basin. Photograph by Cheryl Miller, U.S. Geological Survey.

Description of Study Area
11
Figure 6. Relation of lithostratigraphic units to hydrogeologic units, northern Green River structural basin, Wyoming (modified from Love and others, 1993; Ahern and others, 1981; Bruce, 1993; Martin, 1996; Naftz, 1996; Glover and others, 1998; and Bartos and Hallberg, 2010.)
Terti
ary
Eoce
ne
Bridger Formation
ChappoMember2
Pale
ocen
e
Fort UnionFormation
Terti
ary
aqui
fer s
yste
m
Gree
n Ri
ver B
asin
aqu
ifer s
yste
m
Gree
n Ri
ver B
asin
low
er T
ertia
ry a
quife
r sys
tem
Wasatch-Fort Union
aquifer
Fort Unionzone
Not defined Bridger aquiferMajor aquifer
Not definedMajor aquifer
Syst
em
Seri
esLithostratigraphic unit of
Roehler (1991, 1992b, 1992c) and Love and others (1993) for northern
Green River structural basin
Hydrogeologic unit ofAhern and others (1981)
Hydrogeologic unit ofBruce (1993)
Hydrogeologic unit of Bartos andHallberg (2010, fig. 5-1)
Laney Member1 Laney aquifer6
Gree
n Ri
ver F
orm
atio
n
Was
atch
For
mat
ion
LumanTongue1
NilandTongue2
TiptonShale
Member1,4
FarsonSandstoneMember1,3
CathedralBluffs
Tongue2
Alkali Creek Tongue2,3
Mainbody5
Wasatch
aquifer
Confining
unit
Confining
unit with
discontinuous
aquifers
Wilkins Peakconfining
unit
Wilkins PeakMember1
Wasatch-Fort Union
aquifer
Fort Unionzone
Bridger aquifer
Laney aquifer6
Wasatchzone
Wilkins Peakconfining
unit
New Forkaquifer
Tiptonconfining
unit
Farson Sandstone-Alkali Creek
aquifer
Tiptonconfining
unit
Wasatchzone
Majoraquifer
1Of the Green River Formation.2Of the Wasatch Formation.3Farson Sandstone Member intertongues with and underlies the Alkali Creek Tongue in parts of Green River structural basin.
4Also known as the Tipton Tongue of the Green River Formation.5Includes rocks above the Chappo Member formerly identified as the “La Barge Member” of the Wasatch Formation (Roehler, 1991a, 1992b, 1992c)6Laney Member of Green River Formation is a confining unit where impermeable.
Rocks absent due to erosion or nondeposition
Unconformity
Division of Wasatch-Fort Union aquifer into the Wasatch and Fort Union zones
EXPLANATION
Hydrogeologic unit of Martin (1996),Naftz (1996), and
Glover and others (1998)
Was
atch
/Gre
en R
iver
aqu
ifer s
yste
m
12 Generalized Potentiometric-Surface Map of the Green River Basin Lower Tertiary Aquifer System, 2010–14
HydrogeologyAquifers in layered sedimentary rocks of Tertiary (Paleo-
cene and Eocene) age are used widely as sources of water in the Green River structural basin (fig. 2) because they are areally extensive, thick, and yield enough water with sufficient quality for many different uses (Clarey and others, 2010). These aquifers occur in numerous water-saturated geologic formations, members, and tongues (lithostratigraphic units). The hydrologic characteristics of the lithostratigraphic units or parts of the units have been used to name and define them in relation to their hydrogeologic function (aquifers or confin-ing units, referred to as hydrogeologic units). Rocks in the Bridger, Green River, Wasatch, and Fort Union Formations containing these aquifers occur at, near, or below the surface in the basin. Because fluvial sediments (primarily sandstone) compose most of the permeable rocks (aquifers), hydraulic properties generally depend on the number, thickness, and lateral and vertical continuity of sandstone layers and lenses.
Hydraulic connection among the different hydrogeologic units and between individual sandstone aquifers composing an individual hydrogeologic unit varies locally because of intervening fine-grained rocks, but regionally the hydrogeo-logic units generally are in sufficient hydraulic connection to compose a heterogeneous regional aquifer system identified as the Tertiary aquifer system (Ahern and others, 1981), Wasatch/Green River aquifer system (Bruce, 1993), Green River Basin aquifer system (Martin, 1996; Naftz, 1996; Glover and others, 1998), or Green River Basin lower Tertiary aquifer system (Bartos and Hallberg, 2010) (fig. 6). Locally, some sandstone aquifers in these hydrogeologic units are perched and not hydraulically connected to the underlying Green River Basin lower Tertiary aquifer system (AMEC Environment and Infrastructure, Inc., 2012, 2013). An aquifer system consists of two or more aquifers, commonly vertically stacked, that are grouped together because of physical connection or sharing of similar geologic and hydrogeologic characteristics that are best described and studied together. The nomenclature used to characterize and define these hydrogeologic units (fig. 6) dif-fers among investigators and has changed over time because of new data and various interpretations. The last column in figure 6, modified from Bartos and Hallberg (2010, fig. 5–1), is the regional hydrogeologic (hydrostratigraphic) nomencla-ture used in this report.
The large, areally extensive Green River Basin lower Ter-tiary aquifer system coincides with the boundary of the Green River structural basin and includes the study area (fig. 2). The regional aquifer system is thousands of feet thick in the Green River structural basin and consists of as many as four aquifers and two confining units, generally named after their respective lithostratigraphic units (fig. 6). Aquifers, from top to bottom, are the Bridger, Laney, Farson Sandstone-Alkali Creek, and Wasatch-Fort Union aquifers (fig. 6). The Bridger aquifer is only present in the southern part of the study area. The Wasatch-Fort Union aquifer is defined as an aquifer divided into two zones (Wasatch and Fort Union zones). Confining
units are the Wilkins Peak and Tipton confining units; where impermeable, the Laney Member of the Green River Forma-tion also is a confining unit. The Farson Sandstone-Alkali Creek aquifer was formerly named the “New Fork aquifer” (Martin, 1996) on the basis of earlier stratigraphic nomencla-ture identifying rocks composing the unit as the “New Fork and Alkali Creek Tongues of the Wasatch Formation,” and was used by Welder (1968, sheet 2). The base of the aquifer system is defined as the contact with underlying Late Cretaceous-age rocks in the Lance Formation, Fox Hills Sandstone, and Lewis Shale (Martin, 1996; Glover and others, 1998). Details about the Green River Basin lower Tertiary aquifer system, including descriptions of the physical and chemical characteristics of the hydrogeologic units (aquifers and confining units) composing the aquifer system, are provided in previous studies (Robinove and Cummings, 1963; Barker and Sapik, 1965; Welder, 1968; Dana and Smith, 1973a, 1973b; Dinwiddie, 1973; Price and Waddell, 1973; Dana, 1975; Ahern and others, 1981; Lowham and others, 1985 [1987]; Zimmerman and Collier, 1985; Teller and Chafin, 1986; Johnson-Fermelia Co., Inc., 1990; Chafin and Kimball, 1992; Bruce, 1993; Jorgensen Engineering and Land Surveying, and Hinckley Consulting, 1994; Martin, 1996; Naftz, 1996; Glover and others, 1998; Dynamac Corpo-ration, 2002; JFC Engineers/Surveyors, 2002; HydroGeo, Inc., 2004; Geomatrix Consultants, Inc., 2008; AMEC Geomatrix, Inc., 2009; Bartos and Hallberg, 2010; Bartos and others, 2010; Trihydro Corporation, 2011, 2012; AMEC Environment and Infrastructure, Inc., 2012, 2013; Boughton, 2014).
Previous investigations indicate groundwater in the Green River Basin lower Tertiary aquifer system generally flows from high altitude recharge areas along the structural basin margin towards lower altitudes in the basin center and to the south (fig. 7; Ahern and others, 1981; Chafin and Kimball, 1992; Martin, 1996; Naftz, 1996; Glover and others, 1998; AMEC Environment and Infrastructure, Inc., 2012, 2013). Groundwater at shallow depths of the Green River Basin lower Tertiary aquifer system is moving primarily in local to intermediate (and more dynamic) flow systems with shorter groundwater-flow paths, whereas groundwater at greater depths is moving primarily in intermediate to regional groundwater-flow systems with longer groundwater-flow paths and greater residence times (fig. 7; Chafin and Kimball, 1992; Martin, 1996; Naftz, 1996; Glover and others, 1998). Ground-water in saturated unconsolidated deposits of Quaternary age (alluvium or alluvial aquifers) associated with major peren-nial streams is hydraulically connected to the aquifer system in much of the northern structural basin (Martin, 1996; Naftz, 1996; Glover and others, 1998; Dynamac Corporation, 2002; Geomatrix Consultants, Inc., 2008; AMEC Geomatrix, Inc., 2009; AMEC Environment and Infrastructure, Inc., 2012, 2013). Discharge from deep aquifers of the aquifer system is by upward leakage to the shallower aquifers, and ultimately to major streams such as the Green River and its tributaries and associated alluvial aquifers (fig. 7) (Martin, 1996; Naftz, 1996; Glover and others, 1998; Dynamac Corporation, 2002; Geo-matrix Consultants, Inc., 2008; AMEC Geomatrix, Inc., 2009;

Hydrogeology
13
Figure 7. South-north diagrammatic cross-section summarizing groundwater recharge, discharge, and generalized groundwater-flow paths in the Green River Basin lower Tertiary aquifer system (modified from Martin, 1996). Line of section shown on figure 2.
0 10 20 30 40 50 MILES
0 10 20 30 40 50 KILOMETERS
-4,000
-2,000
0
2,000
4,000
6,000
8,000
FEETFEET
-4,000
-2,000
SEA LEVEL
2,000
4,000
6,000
8,000
10,00010,000
Hen
rys F
ork
Blac
ks F
ork
Gre
en R
iver
Big
Sand
y Ri
ver
New
For
k Ri
ver
New
For
k Ri
ver
Laney aquifer
Wilkins Peak confining unit
Tipton confining unit
Farson Sandstone-Alkali Creek aquifer
Fort Union zone of the Wasatch-Fort Union aquifer
Wasatch zone of the Wasatch-Fort Union aquifer
SOUTH NORTH
A
Recharge
Prec
ipita
tion
Prec
ipita
tion
Approximate direction of groundwater movement—Size of arrow indicates local ( ), intermediate ( ), or regional ( ) flow
Fault—Shows direction of movement. Location is approximate
EXPLANATION
UintaMountains
Wind RiverRange
SCALE IS APPROXIMATEDATUM IS NORTH AMERICAN VERTICAL DATUM OF 1988
VERTICAL SCALE GREATLY EXAGGERATED
Late Cretaceous-age rocks, including Lance Formation
Recharge
Discharge
A'
14 Generalized Potentiometric-Surface Map of the Green River Basin Lower Tertiary Aquifer System, 2010–14
AMEC Environment and Infrastructure, Inc., 2012, 2013). Smaller streams in some parts of the northern Green River structural basin likely receive discharge from shallow aquifers of the aquifer system with local groundwater-flow paths (Mar-tin, 1996; AMEC Geomatrix, Inc., 2009; AMEC Environment and Infrastructure, Inc., 2012, 2013).
Wells completed in aquifers of the Green River Basin lower Tertiary aquifer system yield water primarily from permeable unfractured and fractured lenticular sandstone beds typically interbedded with much less permeable fine-grained rocks such as shale, mudstone, and siltstone; locally occurring conglomerate beds also yield water to wells (Ahern and oth-ers, 1981; Martin, 1996; Naftz, 1996; Glover and others, 1998; AMEC Environment and Infrastructure, Inc., 2012, 2013). Lenticular sandstone beds compose most of the aquifers and commonly are laterally and vertically discontinuous. The thickness and amount of sandstone at a given location gener-ally depends on the distance from the sediment source area. Groundwater in the sandstone aquifers is under unconfined (water table) and confined (artesian) conditions. Because of the discontinuous nature of individual sandstone beds compos-ing the aquifers, some investigators classified some aquifers in the northern Green River structural basin as semiconfined or leaky confined aquifers (AMEC Geomatrix, Inc., 2009; AMEC Environment and Infrastructure, Inc., 2012, 2013). Artesian pressure in the sandstone aquifers at some locations can be high enough to cause wells completed in the aquifer system to flow (for example, Welder, 1968; Jorgensen Engineering and Land Surveying, and Hinckley Consulting, 1994; Mar-tin, 1996; Glover and others, 1998; AMEC Environment and Infrastructure, Inc., 2012, 2013). Locally, fine-grained rocks with small primary permeability may yield water to wells where fractured or solution channels have developed, most notably fine-grained lacustrine rocks in the Laney Member of the Green River Formation (Laney aquifer) near Big Sandy Reservoir (Martin, 1996; Glover and others, 1998).
The uppermost lower Tertiary aquifers of the Green River Basin lower Tertiary aquifer system commonly yield water of
sufficient quantity and quality for stock use (Bartos and Hall-berg, 2010; Bartos and others, 2010; Clarey and others, 2010). In fact, most wells in the study area are completed for stock use. Yields from the uppermost aquifers are sometimes suffi-cient for industrial use, as indicated by wells completed in the northern part of the basin (including study area) to facilitate natural gas well construction, development, and maintenance. Although groundwater quality in the study area is highly variable, wells completed in these uppermost shallow aquifers commonly yield freshwater (total dissolved solids concentra-tions less than 1,000 milligrams per liter) and are suitable for many uses (Bartos and others, 2010; Trihydro Corporation, 2011; Boughton, 2014).
Groundwater LevelsAfter selecting existing wells for measurement of ground-
water levels in the study area using procedures described in Sweat (2013), a groundwater-level dataset was constructed using information obtained by visiting 93 wells during May to September from 2010 to 2014 (table 1–1). Groundwater levels measured in four wells (highlighted in gray in table 1–1) were removed from the groundwater-level dataset because of lack of information about open intervals in relation to hydrogeo-logic units (two wells), potential interference from well pump-ing at time of measurement (one well), and interference from an associated storage tank (one well) (table 1–1). Most (71) of the 89 wells utilized in the final groundwater-level dataset were used primarily for stock use. Of the remaining wells in the dataset, six wells were unused stock wells, three wells were used for primarily domestic use, two wells were used to supply water for oil and gas development, two wells were observation (monitoring) wells, four wells were unused oil and gas development water-supply wells, and one well was an unused well with unknown water use (table 1–1). The depths of the 89 selected wells ranged from 16 to 1,365 ft below land surface (table 1; table 1–1).
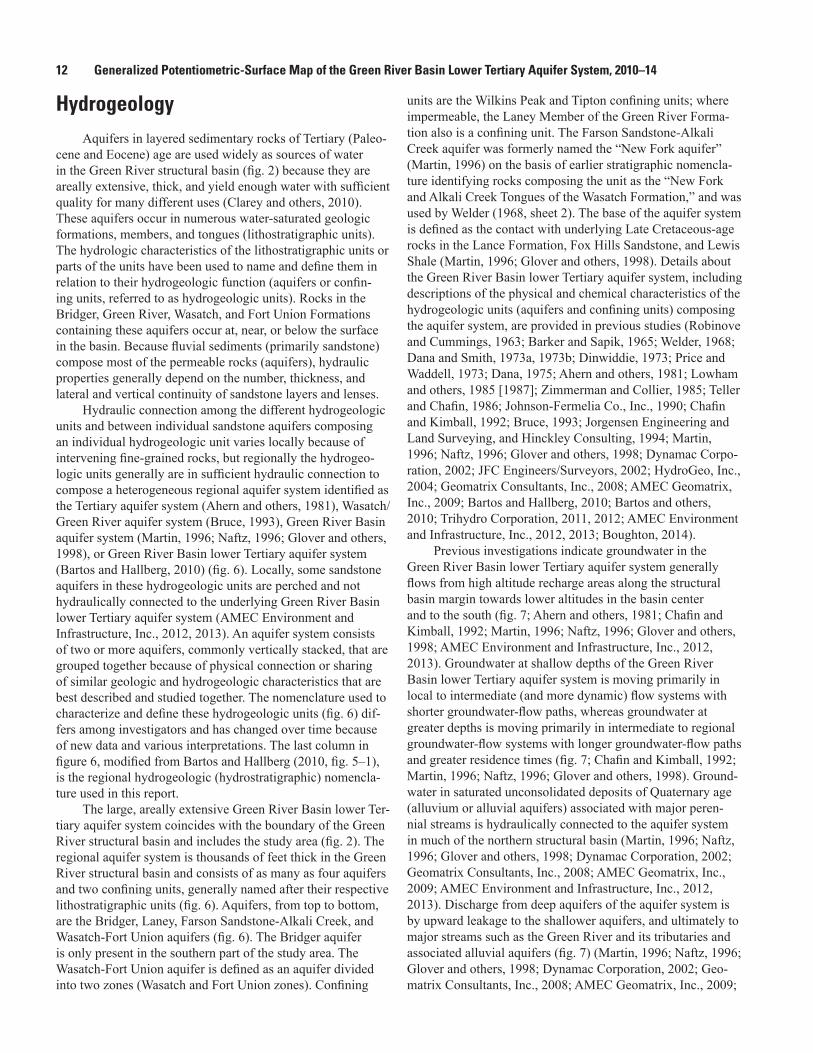
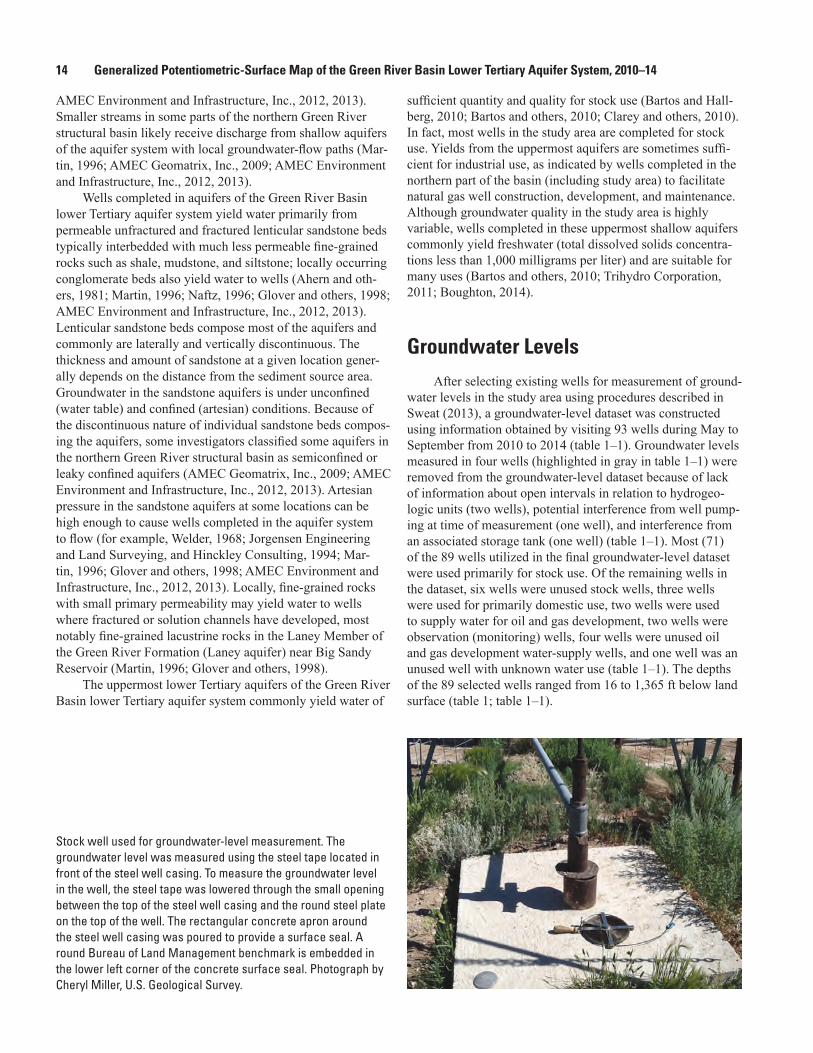
Stock well used for groundwater-level measurement. The groundwater level was measured using the steel tape located in front of the steel well casing. To measure the groundwater level in the well, the steel tape was lowered through the small opening between the top of the steel well casing and the round steel plate on the top of the well. The rectangular concrete apron around the steel well casing was poured to provide a surface seal. A round Bureau of Land Management benchmark is embedded in the lower left corner of the concrete surface seal. Photograph by Cheryl Miller, U.S. Geological Survey.

Groundwater Levels 15
Of the 89 wells remaining in the dataset, 11 wells were flowing wells (no pump and artesian) (noted as “F” in table 1–1). A pressure gauge was used to measure 7 of 11 flowing wells, and those measurements were converted to feet above land surface as described in Cunningham and Schalk (2011). Groundwater levels in six of the flowing wells measured using a pressure gauge ranged from 9.12 to 14.95 ft above land surface, and the groundwater level in one well was 62.9 ft above land surface (table 1–1). For contour-ing purposes, groundwater-level measurements for the four unmeasured flowing wells were estimated to be 10 ft above land surface (marked with an “E” preceding the groundwater-level altitude in table 1–1), which is within the measured range of 9.12 to 14.95 ft above land surface for most (6 of 7) of the measured flowing wells (table 1–1).
Groundwater levels measured above or below land surface were converted to groundwater-level altitudes above the North American Vertical Datum of 1988 (NAVD 88); groundwater-level altitudes also are known as hydraulic heads. The distribution of hydraulic head in an aquifer or aquifer system can be represented with a potentiometric-surface map. Groundwater-level information (depth to groundwater and groundwater-level altitudes) and associated depths for the 89 wells used to construct the final groundwater-level dataset and evaluated to contour the potentiometric-surface map are summarized by hydrogeologic unit in table 1. Groundwater-level altitudes and depth-to-groundwater measurements obtained during this study, as well as ancillary information for all measured wells, are available from the Groundwater Site Inventory database of the USGS National Water Information System database at http://nwis.waterdata.usgs.gov/wy/nwis/inventory by using the site-identification numbers in table 1–1.
Groundwater levels were measured in wells completed in several different lithostratigraphic (and potentially different hydrogeologic units [aquifers]) of the Green River Basin lower Tertiary aquifer system (table 1–1; table 1). With the excep-tion of one well completed in Quaternary alluvium, wells were assigned to Tertiary-age (Eocene) lithostratigraphic units by comparing available well-completion information (screen or open interval, well depth, and driller’s logs) with contour maps showing the thickness of Tertiary lithostratigraphic units in the Green River structural basin (Roehler, 1992b) and geological maps (Oriel and Platt, 1980; Love and Christiansen, 1985; Sutherland and Scott, 2009; Sutherland and Luhr, 2011). Many of the wells (50 of 89) used to construct the potentiometric-surface map for this study were completed in the Farson Sandstone-Alkali Creek aquifer (Farson Sandstone Member of the Green River Formation or Alkali Creek Tongue of the Wasatch Formation). The remaining wells were completed in Quaternary alluvium (1 well), the Laney aquifer (Laney Member of the Green River Formation) (2 wells), the Wilkins Peak confining unit (Wilkins Peak Member of the Green River Formation) (2 wells), the Wasatch zone of the Wasatch-Fort Union aquifer (main body of the Wasatch Formation and Cathedral Bluffs Tongue of the Wasatch Formation) (31 wells), and 3 wells were completed in the undifferentiated
Green River or Wasatch Formations (lithostratigraphic unit or units; table 1; table 1–1).
Relation between Depth to Groundwater and Well Depth
A relation between depth to groundwater and well depth can be used to evaluate overall potential for groundwater movement among aquifers in the study area. Well depth in the groundwater-level dataset generally reflects the screened or open interval of the well, although some wells have mul-tiple open intervals (table 1–1), which could complicate the regional relation.
Depth to groundwater measured in nonflowing wells ranged from 3.17 to 484.66 ft below the land surface (table 1; table 1–1). Depth to groundwater generally increased with increasing well depth (fig. 8A), although three of the deepest wells (greater than 1,000 ft deep) had shallow groundwater levels of less than 100 ft. Two of the three deepest wells had multiple open intervals, and construction information about open intervals was not available for the third well. Except for near perennial streams, groundwater-level altitudes in most aquifers generally decreased with increasing well depth (fig. 8B), indicating a generally downward potential for groundwater movement in the study area. The greatest range of groundwater-level altitudes (about 856 ft for all measured wells and about 776 ft for wells used to construct potentio-metric-surface map) is exhibited in the shallower wells with depths of less than 500 ft. Groundwater levels in wells deeper than or equal to 500 ft (500 to 1,365 ft) vary about 642 ft.
Temporal Groundwater-Level Changes
Differences in groundwater levels between the oldest groundwater-level measurement in a well and a measurement made in the same well during 2012–14 are listed in table 2 and shown in figure 9; the time span between measurements ranged from 36 to 49 years. The purpose of the comparison is to describe general patterns, as well as direct future studies of groundwater-level changes. No interpretation of why the changes have occurred is presented, and comparison of two points in time should not be interpreted as a trend.
A total of 27 wells had data available for comparison, and most were located in the southern part of the study area (fig. 9). Within individual wells the change in groundwater levels between the historic groundwater-level measurement (1960s to 1970s) and the most recent measurement (2012–14) ranged from an increase of 5.5 ft to a decrease of 86.9 ft. Groundwater levels for most of the wells (59 percent, 16 of 27) changed about 10 ft or less between the two measurement periods (table 2). Most of the wells (74 percent, 20 of 27) showed a decrease in groundwater levels with declines rang-ing from 0.1 to 86.9 ft; 41 percent (11 of 27) of the wells had a groundwater-level decline of more than 10 ft, which includes 3 wells with declines of more than 50 ft.

16 Generalized Potentiometric-Surface Map of the Green River Basin Lower Tertiary Aquifer System, 2010–14
Figure 8. Depth to groundwater and groundwater-level altitude in relation to well depth, northern Green River structural basin, Wyoming. A, Relation between depth to groundwater and well depth; and B, relation between groundwater-level altitude and well depth.
Laney Member of the Green River Formation (Laney aquifer)
Wilkins Peak Member of the Green River Formation (Wilkins Peak confining unit)
Cathedral Bluffs Tongue of the Wasatch Formation (Wasatch zone of the Wasatch-Fort Union aquifer)
Farson Sandstone Member of the Green River Formation (Farson Sandstone-Alkali Creek aquifer)
Wasatch Formation (Wasatch zone of the Wasatch-Fort Union aquifer)
Undifferentiated Green River and Wasatch Formations
EXPLANATION-100
0
100
200
300
400
500
Dept
h to
gro
undw
ater
, in
feet
bel
ow la
nd s
urfa
ce
6,400
6,500
6,600
6,700
6,800
6,900
7,000
7,100
7,200
7,300
0 200 400 600 800 1,000 1,200 1,400
Altit
ude
of g
roun
dwat
er le
vel,
in fe
et a
bove
N
orth
Am
eric
an V
ertic
al D
atum
of 1
988
(NAV
D 88
)
Well depth, in feet below land surface
A
B

Groundwater Levels
17
Table 2. Groundwater-level changes in selected wells, northern Green River structural basin, Wyoming.
[USGS, U.S. Geological Survey; NWIS, National Water Information System (http://waterdata.usgs.gov/nwis); NAVD 88, North American Vertical Datum of 1988. Negative groundwater-level value (-) indi-cates groundwater level above land surface (shown in green). Negative groundwater-level change value (-) indicates a decrease in groundwater level between oldest and 2012–14 measurements.]
Site
iden
tifie
r (fig
. 9)
USG
S st
atio
n na
me
USG
S
site
-ide
ntifi
catio
n nu
mbe
r
Dep
th o
f wel
l (fe
et b
elow
land
su
rfac
e)
Old
est g
roun
dwat
er-
leve
l mea
sure
men
t in
NW
IS
(feet
bel
ow la
nd
surf
ace)
Old
est g
roun
dwat
er-
leve
l alti
tude
(fe
et a
bove
NAV
D 8
8)
Dat
e of
old
est
grou
ndw
ater
-lev
el
mea
sure
men
t in
NW
IS
Gro
undw
ater
leve
l us
ed to
con
stru
ct
pote
ntio
met
ric-s
urfa
ce
map
(fe
et b
elow
land
su
rfac
e)
Gro
undw
ater
-lev
el
altit
ude
used
to c
on-
stru
ct p
oten
tiom
etri
c-su
rfac
e m
ap
(feet
abo
ve N
AVD
88)
Dat
e of
gro
undw
ater
- le
vel m
easu
rem
ent
used
to c
onst
ruct
po
tent
iom
etric
-sur
face
m
ap
Chan
ge b
etw
een
the
olde
st a
nd 2
012–
14
grou
ndw
ater
-lev
el
mea
sure
men
ts
(feet
)
01cc 01 24-110-01cc 01 420513109504701 65 22.65 6,455 09/14/1964 26.69 6,451 08/03/2012 -4.0402da 01 25-107-02da 01 421005109315901 200 -43 6,705 07/31/1976 -12.34 6,674 08/07/2013 -3123ddc01 25-107-23ddc01 420710109315601 1,365 flowing 16,736 07/28/1976 67.50 6,659 07/30/2012 -7810dad01 25-108-10dad01 420915109403901 882 17 6,829 04/23/1965 92.24 6,754 07/31/2012 -7504add01 25-109-04add01 421025109481901 205 6.18 6,655 06/09/1965 12.92 6,648 08/01/2012 -6.7413baa01 25-109-13baa01 420901109460001 583 104.12 6,726 09/14/1964 128.71 6,701 08/01/2012 -24.5917da 01 25-109-17da 01 421321109493502 190 58.52 6,543 06/09/1965 56.69 6,545 08/01/2012 1.8315aab01 25-110-15aab01 420905109540901 500 49.66 6,700 06/09/1965 80.10 6,670 08/01/2012 -30.4421cac01 25-110-21cac01 420757109555601 190 39.6 6,570 06/09/1965 38.64 6,571 08/01/2012 1.002dbc01 25-111-02dbc01 421045110002001 480 97.72 6,738 06/09/1965 121.28 6,715 07/07/2014 -23.5622dbb01 25-111-22dbb01 420822110013201 760 155.85 6,698 06/09/1965 204.96 6,649 07/07/2014 -49.1132abb01 26-107-32abb01 421127109354601 191 134.98 6,650 07/31/1976 131.69 6,653 06/25/2012 3.2930bab01 26-108-30bab01 421219109433801 618 140.67 6,727 06/20/1965 151.40 6,717 06/21/2012 -10.7310ccd01 26-109-10ccd01 421421109475001 312 61 6,741 08/19/1976 57.53 6,744 06/14/2012 315dca01 26-110-15dca01 421308109541901 316 70.82 6,876 06/09/1965 86.57 6,860 08/01/2012 -15.7534dca01 26-110-34dca01 421051109543001 280 60 6,709 06/09/1965 60.45 6,709 06/20/2012 025cdc01 27-107-25cdc01 421633109310701 150 24.95 6,649 09/14/1964 19.45 6,655 06/12/2012 5.518cca01 27-109-18cca01 421847109512101 349 142.59 6,829 04/27/1965 159.33 6,813 06/14/2012 -16.7423bcc01 28-109-23bcc01 422330109465201 218 69.1 6,966 06/21/1965 67.50 6,968 06/20/2012 1.601dcb01 28-110-01dcb01 422600109523501 180 42.99 6,922 06/21/1965 44.52 6,920 06/19/2012 -1.5333acd01 28-110-33acd01 422202109553801 420 229.3 6,936 06/21/1965 316.24 6,849 07/17/2012 -86.919aca01 28-112-19aca01 422348110114501 153 80.5 6,970 06/22/1965 80.58 6,969 07/08/2014 -0.130dda01 28-112-30dda01 422243110114301 170 116.14 6,859 06/22/1965 116.51 6,858 07/08/2014 -0.3710dad01 29-107-10dad01 422951109344501 102 22.59 7,103 06/12/1965 25.10 7,101 06/28/2012 -2.5106ddb01 30-107-06ddb01 423539109382201 147 67.1 7,199 09/22/1964 67.26 7,199 06/27/2012 -0.232aca01 30-107-32aca01 423140109370301 222 135 7,186 10/01/1966 135.92 7,185 06/28/2012 -113daa01 31-108-13daa01 423913109392701 251 88.29 7,142 08/05/1966 91.7 7,138 07/09/2014 -3.41
1Groundwater-level assumed to be at least 10 feet above land surface altitude for flowing wells (see text).

18 Generalized Potentiometric-Surface Map of the Green River Basin Lower Tertiary Aquifer System, 2010–14
23bcc011.6WD 218
25cdc015.5WD 150
10ccd013WD 312
32abb013.29WD 191
21cac011.0WD 190
01cc 01-4.04WD 65
19aca01-0.1WD 153
30dda01-0.37WD 170
13daa01-3.41WD 251
32aca01-1WD 222
06ddb01-0.2WD 147
10dad01-2.51WD 102
10dad01-2.51WD 102
01dcb01-1.53WD 180
34dca010WD 280
17da 011.83WD 190
33acd01-86.9WD 420
18cca01-16.74WD 349
18cca01-16.74WD 349
15dca01-15.75WD 316
30bab01-10.73WD 618
22dbb01-49.11WD 760
22dbb01-49.11WD 760 23ddc01
-78WD 1,365
10dad01-75WD 882
10dad01-75WD 882
04add01-6.74WD 205
02dbc01-23.56WD 480
15aab01-30.44WD 500
13baa01-24.59WD 583
02da 01-31WD 200
02da 01-31WD 200
Big SandyReservoir
Sixty-SevenReservoir
Middle Piney Creek
South Piney Creek
Mud
dy C
reek
Green
Rive
r
Big Sandy R
iver
Little San
dyPacificCreek
Cottonwood Creek
East Fork River
EdenReservoir
Sheep CreekFontenelle Creek
North Piney Creek
Green River New
Fork River
Muddy Creek
Slate Creek
Rive
r
BoneDraw
MarbletonBig Piney
Alkali Creek
Fontenelle Reservoir
Eden
Farson
Big Sandy
Big S
andy
Rive
r
0
6 82 4 10 MILES
6 82
0
4 10 KILOMETERS
Base modified from U.S. Geological Survey digital data, variously dated, various scales Albers Equal-Area Conic projectionStandard parallels 29°30’N and 45°30’N, central meridian -107°30’WHorizontal coordinate information is referenced to the North American Datum of 1983 (NAD 83)
109°30’109°40’109°50’110°110°10’
42°40’
42°30’
42°20’
42°10’
42°
T24N
T25N
T27N
T28N
T29N
T31N
T32N
R 113 W R 112 W R 111 W R 110 W R 109 W R 108 W R 107 W R 106 W
EXPLANATION
U.S. Geological Survey study area boundary
Jonah Infill Development Project boundary
Proposed Normally Pressured Lance (NPL) Natural Gas Development Project boundary
Wells where groundwater levels could not be compared
Wells where groundwater levels could be compared
Well redrilled
Data not available for groundwater-level comparison
189191
353
350
351
235
189
191
28
La Barge
Fontenelle
SUBLETTE COUNTYLINCOLN COUNTY
LIN
CO
LN
CO
UN
TY
SWE
ET
WAT
ER
CO
UN
TY
Dry Piney Creek
South Muddy
Cr
La BargeCreek
Groundwater-level increase less than 10 feet
No change in groundwater level
Groundwater-level decrease less than 10 feet
Groundwater-level decrease greater than or equal to 10 feet and less than or equal to 50 feet
Groundwater-level decrease greater than 50 feet
Well information (table 2)
Well identifier (location of well within section [see location diagram below])
Difference between oldest and 2012–2014groundwater-level measurements, in feet
Well depth, in feet below land surface
bb
Well 21cac01cc
ab
d
aa
dd
Section 21Section 21
c
T26N
T30N
21cac011.0WD 190
Figure 9. Difference between oldest and newest groundwater-level measurements in selected wells, northern Green River structural basin, Wyoming.
Generalized Potentiometric Surface 19
Generalized Potentiometric SurfaceA generalized potentiometric surface of the uppermost
aquifers in the Green River Basin lower Tertiary aquifer sys-tem in the northern Green River structural basin (fig. 10) was constructed on the basis of groundwater levels measured from 2010 to 2014 (table 1–1). The potentiometric surface repre-sents groundwater-level altitudes in feet above the NAVD 88. Potentiometric contours are dashed where inferred or approxi-mately located.
The potentiometric surface was mapped by hand con-touring altitudes of groundwater levels (hydraulic heads) in the final groundwater-level dataset consisting of 89 wells completed at different depth intervals, within different aqui-fers of the aquifer system, and measured at different times (2010–2014) (table 1; table 1–1); therefore, this potentiomet-ric-surface map is considered to be generalized. Water levels in most wells were completed in the Farson Sandstone-Alkali Creek aquifer or the Wasatch zone of the Wasatch-Fort Union aquifer (table 1; table 1–1). Martin (1996) indicated that, in general, these aquifers are in hydraulic connection in the northern Green River structural basin that includes the study area; thus, groundwater flowing in this area moves horizon-tally and vertically between aquifer contacts and leaks through the confining units (semiconfining units). Because of this, groundwater-level altitudes from the different aquifers com-posing the aquifer system in this area were grouped together for contouring purposes; however, the sandstone aquifers composing the multi-aquifer system commonly are lenticular, discontinuous, and interbedded with intervening fine-grained rocks, resulting in locally variable groundwater-level alti-tudes (hydraulic heads) and differing amounts of hydraulic connection and confinement. Consequently, caution should be used when using the map to evaluate local (site-specific) horizontal and vertical hydraulic connections between the individual sandstone aquifers and site-specific groundwater-flow direction.
Groundwater-level altitudes from 5 of 89 wells in the dataset did not reasonably fit between appropriate contours
without introducing improbable bends or unlikely placement of contours; therefore, data from these wells were not used to contour the potentiometric surface on figure 10 because the groundwater-level altitudes (hydraulic heads) of these 5 wells (highlighted in orange in table 1–1) are likely representative of aquifers not hydraulically connected to the contoured aquifer system.
The altitudes of the Green, New Fork, and Big Sandy Rivers also were used as control for mapping the potentiomet-ric surface because these perennial streams are in hydraulic connection with the groundwater-flow system in the shallow parts of the northern Green River Basin lower Tertiary aquifer system (Martin, 1996; AMEC Geomatrix, Inc., 2009; AMEC Environment and Infrastructure, Inc., 2012, 2013). In fact, analysis of streamflow records indicates that these streams generally gain water from groundwater discharge from the Green River Basin lower Tertiary aquifer system through-out the northern Green River structural basin although some stream reaches may lose water to the aquifer system, particu-larly during certain times of the year (Martin, 1996; AMEC Environment and Infrastructure, Inc., 2012, 2013).
Groundwater moves from high altitudes (high hydraulic heads) to low altitudes (low hydraulic heads), generally in a direction that is perpendicular to the potentiometric-surface contours, and generally in the direction of the slope of the potentiometric surface (hydraulic gradient). Hydraulic gradi-ents typically were less than 70 feet per mile, but hydraulic gradients vary depending on location. The potentiometric-surface map indicates that regional groundwater flow gener-ally is from north to south, but this pattern of flow is altered locally by groundwater divides and groundwater discharge to the Green River, and possibly to the Big Sandy River and two reservoirs (Fontenelle and Big Sandy Reservoirs; fig. 10). For the contoured area, the altitude of the potentiometric surface declines from about 7,200 ft in the northeast to about 6,600 ft in the south. Although some parts of the study area have some minor differences, the generalized potentiometric-surface map constructed as part of this study generally resembles earlier maps created by Martin (1996) using older groundwater-level data.
Measurement of groundwater level in a stock well. Green tape reel located next to the steel well casing holds the black electrical tape used to measure the groundwater level in this well. The black electrical tape has been lowered into the well through the small round opening located on the left side of the light-colored plate on the top of the well. The orange gasoline-powered generator located to the right of the steel well casing provides the electrical power to operate the submersible pump installed in the well. Photograph by Michelle Taylor, formerly of the U.S. Geological Survey.
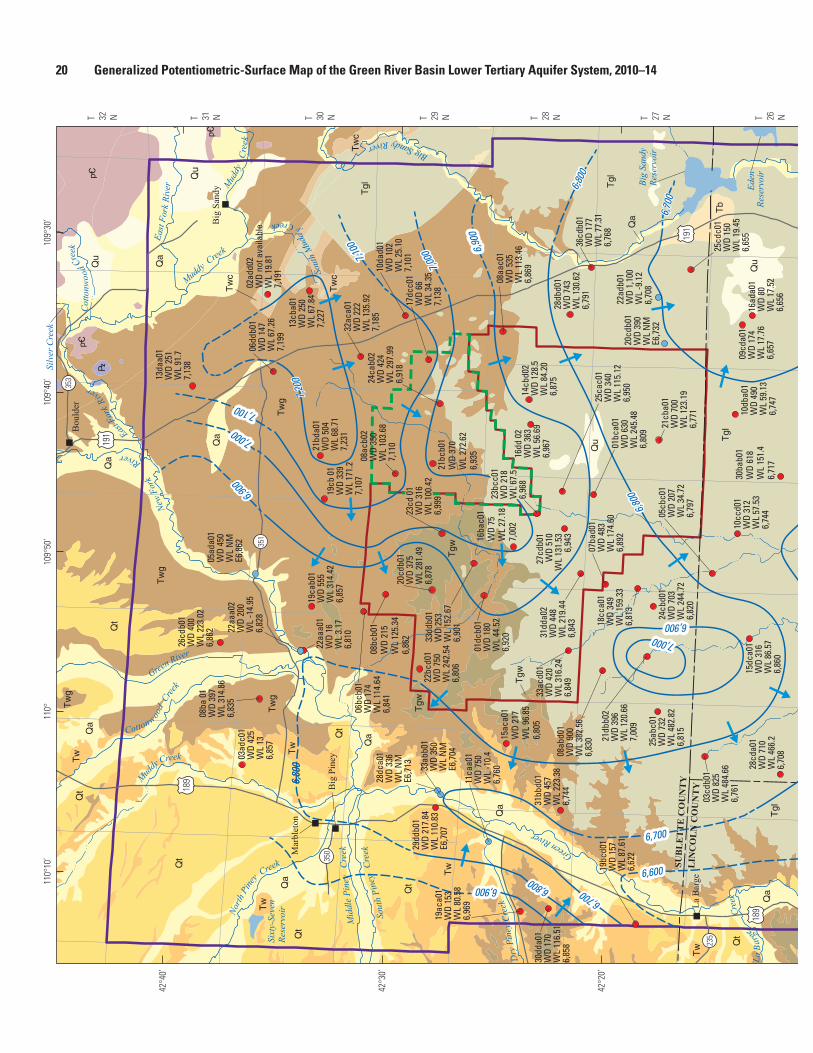
20 Generalized Potentiometric-Surface Map of the Green River Basin Lower Tertiary Aquifer System, 2010–14
6,800
6,800
6,90
06,
900
7,20
07,
200
6,8006,800
6,800
6,800
7,000 7,000
6,700
6,700
6,7006,700
6,80
06,
800
6,600
6,600
7,100 7,100
6,7006,700
6,7006,700
6,900 6,900
6,900 6,9007,0
007,0
00
6,6006,600
7,0007,000
7,100
7,100
6,900
6,900
6,70
06,
700
6,500
6,500
Big
Sand
yRe
serv
oir
Sixt
y-Se
ven
Rese
rvoi
r
Mid
dle
Pine
y C
reek
Sout
h Pi
ney
Cre
ek Green River
Big Sa
ndy R
iver
Littl
e San
dy Rive
rPa
cific
Cre
ek
Font
enel
le Re
servoir
Cottonwood
Creek
New
Fork
River
East F
ork
River
Silv
er C
reek
Cot
tonw
ood
Creek
East
Fork
Riv
er
Muddy Cree
k
Big Sandy River
Eden
Rese
rvoi
r
Bone D
raw
Slat
e C
reek
Green
Riv
er
Shee
p Cree
k
Font
enel
le
Cre
ek
North
Pine
y Creek
Green River
Sou
th M
udd
y Creek
Mud
dy
Cre
ek
La B
arge
Cree
k
Mud
dy Creek
EXPL
AN
ATIO
N
0
68
24
10 M
ILES
68
2
0
410
KIL
OMET
ERS
Base
mod
ified
from
U.S
. Geo
logi
cal S
urve
y di
gita
l dat
a, v
ario
usly
dat
ed, v
ario
us s
cale
s Al
bers
Equ
al-A
rea
Coni
c pr
ojec
tion
Stan
dard
par
alle
ls 2
9°30
’N a
nd 4
5°30
’N, c
entra
l mer
idia
n -1
07°3
0’W
Horiz
onta
l coo
rdin
ate
info
rmat
ion
is re
fere
nced
to th
e N
orth
Am
eric
an D
atum
of 1
983
05ad
a01
WD
450
WL
NM
E6,8
62
28dc
a01
WD
336
WL
NM
E6,7
13
20cd
b01
WD
390
WL
NM
E6,7
32
03ad
c01
WD
425
WL
136,
857
02ad
d02
WD
not a
vaila
ble
WL
19.8
17,
191
22aa
a01
WD
16W
L 3.
176,
810
13da
a01
WD
251
WL
91.7
7,13
8
17dc
c01
WD
66W
L 34
.35
7,13
8
10da
d01
WD
102
WL
25.1
07,
101
23bc
c01
WD
218
WL
67.5
6,96
8
23bc
c01
WD
218
WL
67.5
6,96
8
16ba
c01
WD
75W
L 27
.18
7,00
2
16ad
a01
WD
80W
L 17
.52
6,65
6
15aa
b01
WD
500
WL
80.1
06,
670
19aa
a01
WD
225
WL
5.89
6,75
9
01cc
01W
D 65
WL
26.6
96,
451
19ac
a01
WD
153
WL
80.5
86,
969
19bc
d01
WD
157
WL
87.6
16,
622
21bd
a01
WD
504
WL
68.7
17,
231
19cb
01
WD
339
WL
171.
27,
107
13cb
a01
WD
250
WL
67.8
47,
227
06dd
b01
WD
147
WL
67.2
67,
199
11ca
a01
WD
750
WL
-10.
46,
760
15ac
a01
WD
217
WL
96.8
56,
805
01dc
b01
WD
180
WL
44.5
26,
920
16dd
02
WD
363
WL
56.6
96,
967
36cd
b01
WD
177
WL
77.3
16,
768
07ba
d01
WD
483
WL
174.
606,
892
25cd
c01
WD
150
WL
19.4
56,
655
28cd
a01
WD
710
WL
466.
26,
708
34dc
a01
WD
280
WL
60.4
56,
709
34dc
a01
WD
280
WL
60.4
56,
70915
dca0
1W
D 31
6W
L 86
.57
6,86
0
10cc
d01
WD
312
WL
57.5
36,
74405
cbc0
1W
D 20
7W
L 34
.72
6,79
7
30ba
b01
WD
618
WL
151.
46,
717
10db
a01
WD
490
WL
59.1
36,
747
09cd
a01
WD
174
WL
17.7
66,
657
21ca
c01
WD
190
WL
38.6
46,
571
04ad
d01
WD
205
WL
12.9
26,
648
23dd
c01
WD
1,36
5W
L 67
.56,
659
30dd
a01
WD
170
WL
116.
516,
858
22aa
a02
WD
200
WL
-14.
956,
828
26cd
b01
WD
400
WL
223.
026,
862
08ba
01
WD
397
WL
314.
866,
835
19ca
b01
WD
555
WL
314.
426,
857
32ac
a01
WD
222
WL
135.
927,
185
22bc
d01
WD
750
WL
242.
546,
806
33dd
b01
WD
253
WL
152.
676,
901
23cd
01
WD
316
WL
100.
426,
999
23cd
01
WD
316
WL
100.
426,
999
20cd
b01
WD
375
WL
281.
496,
878
08bc
b01
WD
215
WL
125.
346,
862
06bc
b01
WD
174
WL
114.
646,
841
24ca
b02
WD
424
WL
297.
996,
918
21bc
b01
WD
370
WL
272.
626,
935
08ac
b02
WD
350
WL
103.
687,
110
31bb
d01
WD
457
WL
223.
386,
744
33ac
d01
WD
420
WL
316.
246,
849
31dd
a02
WD
448
WL
219.
446,
843
27cd
b01
WD
510
WL
131.
53 6
,943
28db
d01
WD
743
WL
130.
626,
791
08aa
c01
WD
535
WL
113.
466,
869
25ab
c01
WD
732
WL
482.
826,
815
24cb
d01
WD
703
WL
244.
726,
820
21db
b02
WD
396
WL
120.
667,
009
08ab
d01
WD
900
WL
382.
566,
830
18cc
a01
WD
349
WL
159.
336,
813
01bc
a01
WD
630
WL
245.
486,
809 21
cba0
1W
D 70
0W
L 12
3.19
6,77
1
22ad
b01
WD
1,10
0W
L -9
.12
6,70
8
03cd
b01
WD
825
WL
484.
666,
761
03cd
b01
WD
825
WL
484.
666,
761
32ab
b01
WD
191
WL
131.
696,
653
14aa
b01
WD
685
WL
399.
476,
611
30ca
c01
WD
705
WL
282.
496,
589
22db
b01
WD
760
WL
204.
966,
649
02db
c01
WD
480
WL
121.
286,
715
18dc
c01
WD
825
WL
281.
426,
684
17da
01
WD
190
WL
56.6
96,
545
13ba
a01
WD
583
WL
128.
716,
701
10d
ad01
WD
882
WL
92.2
46,
754
02da
01
WD
200
WL
-12.
346,
674
29dd
b01
WD
217.
84W
L 11
0.83
E6,7
07
33ab
b01
WD
350
WL
NM
E6,7
04
25ca
c01
WD
340
WL
115.
126,
950
14cb
d02
WD
128.
5W
L 84
.20
6,87
5
Eden
Fars
on
Bou
lder
La B
arge
Mar
blet
on
Big
San
dy
109°
30’
109°
40’
109°
50’
110°
110°
10’
42°4
0’
42°3
0’
42°2
0’
42°1
0’
42°
Geol
ogy
mod
ified
from
Gre
en a
nd D
roui
llard
, 199
4
T 23 NT 24 NT 25 NT 26 NT 27 NT 28 NT 29 NT 30 NT 31 NT 32 N
R 11
3 W
R 11
2 W
R 11
1 W
R 11
0 W
R 10
9 W
R 10
8 W
R 10
7 W
R 10
6 W
Big
Pin
ey
189
191
353
Font
enel
le
Dry
Pin
ey C
reek
350
351
191
235
189
191
28
28
372SU
BL
ET
TE
CO
UN
TY
LIN
CO
LN
CO
UN
TY LINCOLN COUNTY
SWEETWATER COUNTY
6,60
06,
600
Site
21c
ac01
1516
1718
1413
34
56
21
2728
2930
2625
109
87
1112
3433
3231
3536
2221
2019
2324
Sect
ion
21Se
ctio
n 21
aabb
d dcc
aabb
d dcc
Site
loca
tion
diag
ram
Sect
ions
U.S
. Geo
logi
cal S
urve
y st
udy
area
bou
ndar
y
Jona
h In
fill D
evel
opm
ent P
roje
ct b
ound
ary
Prop
osed
Nor
mal
ly P
ress
ured
Lan
ce (N
PL) N
atur
al G
as
Dev
elop
men
t Pro
ject
bou
ndar
y
Pote
ntio
met
ric
cont
our a
nd v
alue
—Sh
ows
altit
ude
at w
hich
gro
undw
ater
wou
ld
have
sto
od in
tigh
tly c
ased
wel
ls, 2
010
to 2
014.
Das
hed
whe
re in
ferr
ed o
r ap
prox
imat
ely
loca
ted.
Con
tour
inte
rval
100
feet
. Dat
um is
Nor
th A
mer
ican
Ve
rtica
l Dat
um o
f 198
8 (N
AVD
88)
Gen
eral
dir
ectio
n of
gro
undw
ater
flow
Site
type
Brid
ger F
orm
atio
n
Lane
y M
embe
r of t
he G
reen
Riv
er F
orm
atio
n
Cath
edra
l Blu
ffs T
ongu
e of
the
Was
atch
For
mat
ion
Wilk
ins
Peak
Mem
ber o
f the
Gre
en R
iver
For
mat
ion
Alka
li Cr
eek
Tong
ue o
f the
Was
atch
For
mat
ion
and
the
Fars
on S
ands
tone
Mem
ber o
f the
Gre
en
Rive
r For
mat
ion
Was
atch
For
mat
ion
(incl
udes
mai
n bo
dy o
f the
W
asat
ch F
orm
atio
n an
d Ch
appo
Mem
ber)
Tert
iary
lith
ostr
atig
raph
ic u
nits
Allu
vium
and
col
luvi
um
Terr
ace
depo
sits
Quat
erna
ry d
epos
its, u
ndiff
eren
tiate
d (in
clud
es
lacu
strin
e, e
olia
n, a
nd g
laci
al d
epos
its)
Qua
tern
ary
unco
nsol
idat
ed d
epos
its
Site
info
rmat
ion
Mea
sure
d w
ater
wel
l inc
lude
d in
fina
l gro
undw
ater
-leve
l dat
aset
Mea
sure
d or
vis
ited
flow
ing
wel
l inc
lude
d in
fina
l gro
undw
ater
-leve
l dat
aset
Site
iden
tifie
r [lo
catio
n of
site
with
in s
ectio
n (s
ee s
ite lo
catio
n di
agra
m)]
Dept
h of
wel
l, in
feet
bel
ow la
nd s
urfa
ce
Dept
h of
gro
undw
ater
leve
l, in
feet
bel
ow la
nd s
urfa
ce. G
roun
dwat
er le
vel e
qual
to
NM
indi
cate
s flo
win
g w
ell c
ould
not
be
mea
sure
d bu
t was
ass
umed
for
cont
ourin
g pu
rpos
es to
be
at le
ast 1
0 fe
et a
bove
land
sur
face
alti
tude
. N
egat
ive
valu
e in
dica
tes
grou
ndw
ater
leve
l abo
ve la
nd s
urfa
ce
Grou
ndw
ater
-leve
l alti
tude
, in
feet
abo
ve N
AVD
88. E
, est
imat
ed (s
ee te
xt)
| =Tgw
Tw
Tw
g
Tb
Tgl
Tw
c
Qt
Qu
Qa
=
|
Tw
Tw
g
Qt
Qu
Qa
Qu
Qa
Qa
Tw
g
Tw
gT
wg
Tw
Qa
Qt
Tw
Qt
Qa
QaQ
t
Tw
Qt
Qa
Tw Q
t
Qa
Tgw
Tw
c
Tb
Tb
Tb
Qu
Qu
Qu
Qu
Tw
c
Tw
c
Tgw
Tgw
Tgw
Tgw
Qt
Qa
Qa
Qa
Tgl
Tgl
Tgl
Tg
l
Tgl
Tgl
Tg
l
Tg
l
Qt
Pale
ozoi
c ro
cks
Prec
ambr
ian
rock
s
Tert
iary
uni
ts
com
posi
ng
Gre
en R
iver
B
asin
low
er
Tert
iary
aq
uife
r sy
stem
=
=
21ca
c01
WD
190
WL
38.6
46,
571
aabb
ddcc

Generalized Potentiometric Surface 21
Figu
re 1
0.
Gene
raliz
ed p
oten
tiom
etric
sur
face
of t
he G
reen
Riv
er B
asin
low
er T
ertia
ry a
quife
r sys
tem
, 201
0–14
, nor
ther
n Gr
een
Rive
r stru
ctur
al b
asin
, Wyo
min
g.
6,800
6,800
6,90
06,
900
7,20
07,
200
6,8006,800
6,800
6,800
7,000 7,000
6,700
6,700
6,7006,700
6,80
06,
800
6,600
6,600
7,100 7,100
6,7006,700
6,7006,700
6,900 6,900
6,900 6,900
7,000
7,000
6,6006,600
7,0007,000
7,100
7,100
6,900
6,900
6,70
06,
700
6,500
6,500
Big
Sand
yRe
serv
oir
Sixt
y-Se
ven
Rese
rvoi
r
Mid
dle
Pine
y C
reek
Sout
h Pi
ney
Cre
ek Green River
Big Sa
ndy R
iver
Littl
e San
dy Rive
r
Paci
ficC
reek
Font
enel
le Re
servoir
Cottonwood
Creek
New
Fork
River
East F
ork
River
Silv
er C
reek
Cot
tonw
ood
Creek
East
Fork
Riv
er
Muddy Cree
k
Big Sandy River
Eden
Rese
rvoi
r
Bone D
raw
Slat
e C
reek
Green
Riv
er
Shee
p Cree
k
Font
enel
le
Cre
ek
North
Pine
y Creek
Green River
Sou
th M
udd
y Creek
Mud
dy
Cre
ek
La B
arge
Cree
k
Mud
dy Creek
EXPL
AN
ATIO
N
0
68
24
10 M
ILES
68
2
0
410
KIL
OMET
ERS
Base
mod
ified
from
U.S
. Geo
logi
cal S
urve
y di
gita
l dat
a, v
ario
usly
dat
ed, v
ario
us s
cale
s Al
bers
Equ
al-A
rea
Coni
c pr
ojec
tion
Stan
dard
par
alle
ls 2
9°30
’N a
nd 4
5°30
’N, c
entra
l mer
idia
n -1
07°3
0’W
Horiz
onta
l coo
rdin
ate
info
rmat
ion
is re
fere
nced
to th
e N
orth
Am
eric
an D
atum
of 1
983
05ad
a01
WD
450
WL
NM
E6,8
62
28dc
a01
WD
336
WL
NM
E6,7
13
20cd
b01
WD
390
WL
NM
E6,7
32
03ad
c01
WD
425
WL
136,
857
02ad
d02
WD
not a
vaila
ble
WL
19.8
17,
191
22aa
a01
WD
16W
L 3.
176,
810
13da
a01
WD
251
WL
91.7
7,13
8
17dc
c01
WD
66W
L 34
.35
7,13
8
10da
d01
WD
102
WL
25.1
07,
101
23bc
c01
WD
218
WL
67.5
6,96
8
23bc
c01
WD
218
WL
67.5
6,96
8
16ba
c01
WD
75W
L 27
.18
7,00
2
16ad
a01
WD
80W
L 17
.52
6,65
6
15aa
b01
WD
500
WL
80.1
06,
670
19aa
a01
WD
225
WL
5.89
6,75
9
01cc
01W
D 65
WL
26.6
96,
451
19ac
a01
WD
153
WL
80.5
86,
969
19bc
d01
WD
157
WL
87.6
16,
622
21bd
a01
WD
504
WL
68.7
17,
231
19cb
01
WD
339
WL
171.
27,
107
13cb
a01
WD
250
WL
67.8
47,
227
06dd
b01
WD
147
WL
67.2
67,
199
11ca
a01
WD
750
WL
-10.
46,
760
15ac
a01
WD
217
WL
96.8
56,
805
01dc
b01
WD
180
WL
44.5
26,
920
16dd
02
WD
363
WL
56.6
96,
967
36cd
b01
WD
177
WL
77.3
16,
768
07ba
d01
WD
483
WL
174.
606,
892
25cd
c01
WD
150
WL
19.4
56,
655
28cd
a01
WD
710
WL
466.
26,
708
34dc
a01
WD
280
WL
60.4
56,
709
34dc
a01
WD
280
WL
60.4
56,
70915
dca0
1W
D 31
6W
L 86
.57
6,86
0
10cc
d01
WD
312
WL
57.5
36,
74405
cbc0
1W
D 20
7W
L 34
.72
6,79
7
30ba
b01
WD
618
WL
151.
46,
717
10db
a01
WD
490
WL
59.1
36,
747
09cd
a01
WD
174
WL
17.7
66,
657
21ca
c01
WD
190
WL
38.6
46,
571
04ad
d01
WD
205
WL
12.9
26,
648
23dd
c01
WD
1,36
5W
L 67
.56,
659
30dd
a01
WD
170
WL
116.
516,
858
22aa
a02
WD
200
WL
-14.
956,
828
26cd
b01
WD
400
WL
223.
026,
862
08ba
01
WD
397
WL
314.
866,
835
19ca
b01
WD
555
WL
314.
426,
857
32ac
a01
WD
222
WL
135.
927,
185
22bc
d01
WD
750
WL
242.
546,
806
33dd
b01
WD
253
WL
152.
676,
901
23cd
01
WD
316
WL
100.
426,
999
23cd
01
WD
316
WL
100.
426,
999
20cd
b01
WD
375
WL
281.
496,
878
08bc
b01
WD
215
WL
125.
346,
862
06bc
b01
WD
174
WL
114.
646,
841
24ca
b02
WD
424
WL
297.
996,
918
21bc
b01
WD
370
WL
272.
626,
935
08ac
b02
WD
350
WL
103.
687,
110
31bb
d01
WD
457
WL
223.
386,
744
33ac
d01
WD
420
WL
316.
246,
849
31dd
a02
WD
448
WL
219.
446,
843
27cd
b01
WD
510
WL
131.
53 6
,943
28db
d01
WD
743
WL
130.
626,
791
08aa
c01
WD
535
WL
113.
466,
869
25ab
c01
WD
732
WL
482.
826,
815
24cb
d01
WD
703
WL
244.
726,
820
21db
b02
WD
396
WL
120.
667,
009
08ab
d01
WD
900
WL
382.
566,
830
18cc
a01
WD
349
WL
159.
336,
813
01bc
a01
WD
630
WL
245.
486,
809 21
cba0
1W
D 70
0W
L 12
3.19
6,77
1
22ad
b01
WD
1,10
0W
L -9
.12
6,70
8
03cd
b01
WD
825
WL
484.
666,
761
03cd
b01
WD
825
WL
484.
666,
761
32ab
b01
WD
191
WL
131.
696,
653
14aa
b01
WD
685
WL
399.
476,
611
30ca
c01
WD
705
WL
282.
496,
589
22db
b01
WD
760
WL
204.
966,
649
02db
c01
WD
480
WL
121.
286,
715
18dc
c01
WD
825
WL
281.
426,
684
17da
01
WD
190
WL
56.6
96,
545
13ba
a01
WD
583
WL
128.
716,
701
10d
ad01
WD
882
WL
92.2
46,
754
02da
01
WD
200
WL
-12.
346,
674
29dd
b01
WD
217.
84W
L 11
0.83
E6,7
07
33ab
b01
WD
350
WL
NM
E6,7
04
25ca
c01
WD
340
WL
115.
126,
950
14cb
d02
WD
128.
5W
L 84
.20
6,87
5
Eden
Fars
on
Bou
lder
La B
arge
Mar
blet
on
Big
San
dy
109°
30’
109°
40’
109°
50’
110°
110°
10’
42°4
0’
42°3
0’
42°2
0’
42°1
0’
42°
Geol
ogy
mod
ified
from
Gre
en a
nd D
roui
llard
, 199
4
T 23 NT 24 NT 25 NT 26 NT 27 NT 28 NT 29 NT 30 NT 31 NT 32 N
R 11
3 W
R 11
2 W
R 11
1 W
R 11
0 W
R 10
9 W
R 10
8 W
R 10
7 W
R 10
6 W
Big
Pin
ey
189
191
353
Font
enel
le
Dry
Pin
ey C
reek
350
351
191
235
189
191
28
28
372SU
BL
ET
TE
CO
UN
TY
LIN
CO
LN
CO
UN
TY LINCOLN COUNTY
SWEETWATER COUNTY
6,60
06,
600
Site
21c
ac01
1516
1718
1413
34
56
21
2728
2930
2625
109
87
1112
3433
3231
3536
2221
2019
2324
Sect
ion
21Se
ctio
n 21
aabb
d dcc
aabb
d dcc
Site
loca
tion
diag
ram
Sect
ions
U.S
. Geo
logi
cal S
urve
y st
udy
area
bou
ndar
y
Jona
h In
fill D
evel
opm
ent P
roje
ct b
ound
ary
Prop
osed
Nor
mal
ly P
ress
ured
Lan
ce (N
PL) N
atur
al G
as
Dev
elop
men
t Pro
ject
bou
ndar
y
Pote
ntio
met
ric
cont
our a
nd v
alue
—Sh
ows
altit
ude
at w
hich
gro
undw
ater
wou
ld
have
sto
od in
tigh
tly c
ased
wel
ls, 2
010
to 2
014.
Das
hed
whe
re in
ferr
ed o
r ap
prox
imat
ely
loca
ted.
Con
tour
inte
rval
100
feet
. Dat
um is
Nor
th A
mer
ican
Ve
rtica
l Dat
um o
f 198
8 (N
AVD
88)
Gen
eral
dir
ectio
n of
gro
undw
ater
flow
Site
type
Brid
ger F
orm
atio
n
Lane
y M
embe
r of t
he G
reen
Riv
er F
orm
atio
n
Cath
edra
l Blu
ffs T
ongu
e of
the
Was
atch
For
mat
ion
Wilk
ins
Peak
Mem
ber o
f the
Gre
en R
iver
For
mat
ion
Alka
li Cr
eek
Tong
ue o
f the
Was
atch
For
mat
ion
and
the
Fars
on S
ands
tone
Mem
ber o
f the
Gre
en
Rive
r For
mat
ion
Was
atch
For
mat
ion
(incl
udes
mai
n bo
dy o
f the
W
asat
ch F
orm
atio
n an
d Ch
appo
Mem
ber)
Tert
iary
lith
ostr
atig
raph
ic u
nits
Allu
vium
and
col
luvi
um
Terr
ace
depo
sits
Quat
erna
ry d
epos
its, u
ndiff
eren
tiate
d (in
clud
es
lacu
strin
e, e
olia
n, a
nd g
laci
al d
epos
its)
Qua
tern
ary
unco
nsol
idat
ed d
epos
its
Site
info
rmat
ion
Mea
sure
d w
ater
wel
l inc
lude
d in
fina
l gro
undw
ater
-leve
l dat
aset
Mea
sure
d or
vis
ited
flow
ing
wel
l inc
lude
d in
fina
l gro
undw
ater
-leve
l dat
aset
Site
iden
tifie
r [lo
catio
n of
site
with
in s
ectio
n (s
ee s
ite lo
catio
n di
agra
m)]
Dept
h of
wel
l, in
feet
bel
ow la
nd s
urfa
ce
Dept
h of
gro
undw
ater
leve
l, in
feet
bel
ow la
nd s
urfa
ce. G
roun
dwat
er le
vel e
qual
to
NM
indi
cate
s flo
win
g w
ell c
ould
not
be
mea
sure
d bu
t was
ass
umed
for
cont
ourin
g pu
rpos
es to
be
at le
ast 1
0 fe
et a
bove
land
sur
face
alti
tude
. N
egat
ive
valu
e in
dica
tes
grou
ndw
ater
leve
l abo
ve la
nd s
urfa
ce
Grou
ndw
ater
-leve
l alti
tude
, in
feet
abo
ve N
AVD
88. E
, est
imat
ed (s
ee te
xt)
| =Tgw
Tw
Tw
g
Tb
Tgl
Tw
c
Qt
Qu
Qa
=
|
Tw
Tw
g
Qt
Qu
Qa
Qu
Qa
Qa
Tw
g
Tw
gT
wg
Tw
Qa
Qt
Tw
Qt
Qa
QaQ
t
Tw
Qt
Qa
Tw Q
t
Qa
Tgw
Tw
c
Tb
Tb
Tb
Qu
Qu
Qu
Qu
Tw
c
Tw
c
Tgw
Tgw
Tgw
Tgw
Qt
Qa
Qa
Qa
Tgl
Tgl
Tgl
Tg
l
Tgl
Tgl
Tg
l
Tg
l
Qt
Pale
ozoi
c ro
cks
Prec
ambr
ian
rock
s
Tert
iary
uni
ts
com
posi
ng
Gre
en R
iver
B
asin
low
er
Tert
iary
aq
uife
r sy
stem
=
=
21ca
c01
WD
190
WL
38.6
46,
571
aabb
ddcc

22 Generalized Potentiometric-Surface Map of the Green River Basin Lower Tertiary Aquifer System, 2010–14
SummaryIn cooperation with the Bureau of Land Management,
groundwater levels in wells located in the northern Green River Basin in Wyoming, an area of ongoing energy develop-ment, were measured by the U.S. Geological Survey from 2010 to 2014. The wells were completed in the uppermost aquifers of the Green River Basin lower Tertiary aquifer sys-tem, which is a complex regional aquifer system that provides water to most wells in the area. Except for near perennial streams, groundwater-level altitudes in most aquifers gener-ally decreased with increasing well depth, indicating a general downward potential for groundwater movement in the study area. Drilled depth of the wells was observed as a useful indi-cator of depth to groundwater, such that deeper wells typically had a greater depth to groundwater.
A subset of 27 wells included in this study had historical groundwater levels that were measured during the 1960s and 1970s and again between 2012 and 2014. Overall, a com-parison of the historical and more recent groundwater levels measured in individual wells ranged from a net rise of 5.5 feet to a decline of 86.9 feet. Most of the wells (20 of 27) showed a net decline in groundwater levels, and 3 wells had declines of greater than 50 feet.
The groundwater-level measurements were used to con-struct a generalized potentiometric-surface map of the Green River Basin lower Tertiary aquifer system. Groundwater-level altitudes measured in nonflowing and flowing wells used to construct the potentiometric-surface map ranged from 6,451 to 7,307 feet (excluding four unmeasured flowing wells used for contour construction purposes). The potentiometric-surface map indicates that groundwater in the study area generally moves from north to south, but this pattern of flow is altered locally by groundwater divides, groundwater discharge to the Green River, and possibly groundwater discharge to a tributary river (Big Sandy River) and two reservoirs (Fontenelle and Big Sandy Reservoirs).
References Cited
Ahern, John, Collentine, Michael, and Cooke, Steve, 1981, Occurrence and characteristics of ground water in the Green River Basin and Overthrust Belt, Wyoming: Laramie, Wyo., University of Wyoming, Water Resources Research Institute, report prepared for U.S. Environmental Protec-tion Agency [contract no. G-008269-79], v. V–A [variously paged] and V–B, 6 pl.
AMEC Geomatrix, Inc., 2009, Final plan of study for hydro-geologic data gaps, interim plan—PAPA ROD—Pinedale anticline oil and gas exploration and development project—Sublette County, Wyoming: Missoula, Mont., report pre-pared for the Bureau of Land Management (Pinedale Field Office), Wyoming Department of Environmental Quality (Water Quality Division), U.S. Environmental Protection Agency (Region 8), Shell Rocky Mountain Production, Questar Market Resources, and Ultra Resources, Inc. [vari-ously paged].
AMEC Environment and Infrastructure, Inc., 2012, Final tech-nical report, Hydrogeologic data gaps investigation, interim plan—Pinedale anticline project area ROD—Sublette County, Wyoming: Missoula, Mont., report prepared for the Bureau of Land Management (Pinedale Field Office), Wyo-ming Department of Environmental Quality (Water Quality Division), U.S. Environmental Protection Agency (Region 8), SWEPI LP (Shell), QEP Energy, and Ultra Resources, Inc. [variously paged].
AMEC Environment and Infrastructure, Inc., 2013, Final numerical groundwater modeling report, interim plan—Pinedale anticline project area ROD—Sublette County, Wyoming: Missoula, Mont., report prepared for Bureau of Land Management (Pinedale Field Office), Wyoming Department of Environmental Quality (Water Quality Divi-sion), U.S. Environmental Protection Agency (Region 8), SWEPI LP, QEP Energy, and Ultra Resources, Inc. [vari-ously paged].
Barker, D.A., and Sapik, D.B., 1965, Investigation of ground water as source of irrigation supply, Eden Project, Wyo-ming: Salt Lake City, Utah, U.S. Bureau of Reclamation, Region 4, 51 p.
Bartos, T.T., and Hallberg, L.L., 2010, Groundwater and hydrogeologic units, in Clarey, K.E., Bartos, T.T., Copeland, David, Hallberg, L.L., Clark, M.L., and Thompson, M.L., Available groundwater determination technical memoran-dum—WWDC Green River Basin Water Plan II—Ground-water study, level I (2007–2009): Laramie, Wyo., Wyoming State Geological Survey, chapter 5, p. 5-1–5-93. [Also available at http://waterplan.state.wy.us/plan/green/2010/gw-finalrept/gw-ch05.html.]
Bartos, T.T., Hallberg, L.L., and Clark, M.L., 2010, Ground-water quality, in Clarey, K.E., Bartos, T.T., Copeland, David, Hallberg, L.L., Clark, M.L., and Thompson, M.L., Available groundwater determination technical memoran-dum—WWDC Green River Basin Water Plan II—Ground-water study, level I (2007–2009): Laramie, Wyo., Wyo-ming State Geological Survey, chap. 6, p. 6-1–6-94. [Also available at http://waterplan.state.wy.us/plan/green/2010/gw-finalrept/gw-ch06.html.]
References Cited 23
Boughton, G.K., 2014, Groundwater-quality characteristics for the Wyoming Groundwater-Quality Monitoring Network, November 2009 through September 2012 (ver. 1.1, October 2014): U.S. Geological Survey Scientific Investigations Report 2014–5130, 80 p., appendix, accessed January 29, 2015, at http://dx.doi.org/10.3133/sir20145130.
Bowen, Z.H., Aldridge, C.L., Anderson, P.J., Assal, T.J., Bern, C.R., Biewick, L.R.H., Boughton, G.K., Carr, N.B., Chalfoun, A.D., Chong, G.W., Clark, M.L., Fedy, B.C., Foster, Katharine, Garman, S.L., Germaine, Stephen, Hethcoat, M.G., Homer, Collin, Kauffman, M.J., Keinath, Douglas, Latysh, Natalie, Manier, Daniel, McDougal, R.R., Melcher, C.P., Miller, K.A., Montag, Jessica, Potter, C.J., Schell, Spencer, Shafer, S.L., Smith, D.B., Sweat, M.J., and Wilson, A.B., 2014, U.S. Geological Survey science for the Wyoming Landscape Conservation Initiative—2012 annual report: U.S. Geological Survey Open-File Report 2014–1093, 71 p., accessed October 6, 2014, at http://dx.doi.org/10.3133/ofr20141093.
Bradley, W.H., 1926, Shore phases of the Green River Forma-tion in northern Sweetwater County, Wyoming: U.S. Geo-logical Survey Professional Paper 140–D, p. 121–131.
Bradley, W.H., 1959, Revision of stratigraphic nomenclature of Green River Formation of Wyoming: American Associa-tion of Petroleum Geologists Bulletin, v. 43, no. 5, p. 1072–1075.
Bradley, W.H., 1964, Geology of Green River and associated Eocene rocks in southwestern Wyoming and adjacent parts of Colorado and Utah: U.S. Geological Survey Professional Paper 496–A, 86 p.
Bradley, W.H., and Eugster, H.P., 1969, Geochemistry and paleolimnology of the trona deposits and associated authi-genic minerals of the Green River Formation of Wyoming: U.S. Geological Survey Professional Paper 496–B, 71 p.
Bruce, B.W., 1993, Hydrochemistry of the Wasatch-Green River aquifer system, northeastern Green River Basin, Wyoming: Laramie, Wyo., University of Wyoming, M.S. thesis, 137 p.
Bureau of Land Management, 2007, Land administration data: accessed March 5, 2013, at http://www.geocommunicator.gov/blmMap/MapLSIS.jsp.
Bureau of Land Management, 2011, Notice of intent to pre-pare an environmental impact statement for the proposed Normally Pressured Lance Natural Gas Development Proj-ect, Sublette County, WY: Federal Register, v. 76, no. 70, p. 20370–20371, accessed May 20, 2012, at http://www.blm.gov/pgdata/etc/medialib/blm/wy/information/NEPA/pfodocs/npl.Par.97254.File.dat/noi.pdf.
Chafin, D.T., and Kimball, B.A., 1992, Ground-water geo-chemistry of the near-surface Wasatch Formation, north-ern Green River Basin, Sublette County, Wyoming: U.S. Geological Survey Water-Resources Investigations Report 91–4069, 40 p., 2 pl.
Chetel, L.M., and Carroll, A.R., 2010, Terminal infill of Eocene Lake Gosiute, Wyoming, U.S.A.: Journal of Sedi-mentary Research, v. 80, no. 6, p. 492–514. [Also available at http://dx.doi.org/10.2110/jsr.2010.050.]
Clarey, K.E., Bartos, T.T., Copeland, David, Hallberg, L.L., Clark, M.L., and Thompson, M.L., 2010, Available ground-water determination technical memorandum—WWDC Green River Basin Water Plan II—Groundwater study, level I (2007–2009): Laramie, Wyo., Wyoming State Geological Survey [variously paged]. [Also available at http://waterplan.state.wy.us/plan/green/2010/gw-finalrept/gw-finalrept.html.]
Cunningham, W.L., and Schalk, C.W., comps., 2011, Ground-water technical procedures of the U.S. Geological Survey: U.S. Geological Survey Techniques and Methods, book 1, chap. A1, 151 p. [Also available at http://pubs.usgs.gov/tm/1a1/.]
Curtis, Jan, and Grimes, Kate, 2004, Wyoming climate atlas: Laramie, Wyo., University of Wyoming, 328 p.
Dana, G.F., 1975, Black trona water, Green River Basin, Wyoming: American Association of Petroleum Geologists Bulletin, v. 59, no. 5, p. 907.
Dana, G.F., and Smith, J.W., 1973a, Artesian aquifer, New Fork Tongue of the Wasatch Formation, northern Green River Basin, in Schell, E.M., ed., Symposium and core seminar on the geology and mineral resources of the Greater Green River Basin: Annual Field Conference, 25th, Casper, Wyo., September 17–19, 1973, Wyoming Geological Asso-ciation Guidebook, p. 201–206.
Dana, G.F., and Smith, J.W., 1973b, Black trona water, Green River Basin, in Schell, E.M., ed., Symposium and core seminar on the geology and mineral resources of the Greater Green River Basin: Annual Field Conference, 25th, Casper, Wyo., September 17–19, 1973, Wyoming Geological Asso-ciation Guidebook, p. 153–156.
Dinwiddie, G.A., 1973, Hydraulic testing and sampling of water well number 2, Project Wagon Wheel, Sublette County, Wyoming: U.S. Geological Survey Open-File Report, Report USGS–474–142 for the U.S. Atomic Energy Commission, 32 p.
Donavan, J.H., 1950, Intertonguing of the Green River and Wasatch Formations in part of Sublette and Lincoln Coun-ties, Wyoming: Annual Field Conference, 5th, 1950, Wyo-ming Geological Association Guidebook, p. 59–67.

24 Generalized Potentiometric-Surface Map of the Green River Basin Lower Tertiary Aquifer System, 2010–14
Duke, E.A., Pocewicz, Amy, and Jester, Steve, 2011, Upper Green River Basin Ecosystem Services—Feasibility analy-sis project report: Lander, Wyo., The Nature Conservancy, 30 p. [Also available at http://www.nature.org/ourinitiatives/regions/northamerica/unitedstates/wyoming/science/duke-etal2011-uppergreenpes-report.pdf.]
Dynamac Corporation, 2002, Preliminary groundwater characterization study—Pinedale anticline production area (PAPA), Sublette County, Wyoming: Germantown, Md., report prepared for the Bureau of Land Management (Pine-dale Field Office), [variously paged].
EnCana Oil and Gas (USA), Inc., 2011, Plan of Development 6-29-11—Normally Pressured Lance Natural Gas Develop-ment Project, Sublette County, Wyoming: Denver, Colo., 13 p., accessed May 20, 2012, at http://www.blm.gov/pgdata/etc/medialib/blm/wy/information/NEPA/pfodocs/npl.Par.40081.File.dat/POD.pdf.
Geldon, A.L., 2003a, Geology of Paleozoic rocks in the Upper Colorado River Basin in Arizona, Colorado, New Mexico, Utah, and Wyoming, excluding the San Juan Basin: U.S. Geological Survey Professional Paper 1411–A, 85 p., 17 plates and 1 oversize table in pocket. [Also available at http://pubs.er.usgs.gov/publication/pp1411A.]
Geldon, A.L., 2003b, Hydrologic properties and ground-water flow systems of the Paleozoic rocks in the Upper Colorado River Basin in Arizona, Colorado, New Mexico, Utah, and Wyoming, excluding the San Juan Basin: U.S. Geologi-cal Survey Professional Paper 1411–B, 153 p., 13 plates in pocket. [Also available at http://pubs.er.usgs.gov/publication/pp1411B.]
Geomatrix Consultants, Inc., 2008, Final hydrogeologic conceptual model—Pinedale anticline project area, Sublette County, Wyoming: Missoula, Mont., report prepared for the Shell Rocky Mountain Production, Ultra Petroleum Corpo-ration, Questar Market Resources, BP America Production Company, and Yates Petroleum Corporation [variously paged].
Glover, K.C., Naftz, D.L., and Martin, L.J., 1998, Geohydrol-ogy of Tertiary rocks in the Upper Colorado River Basin in Colorado, Utah, and Wyoming, excluding the San Juan Basin: U.S. Geological Survey Water-Resources Investiga-tions Report 96–4105, 103 p.
Green, G.N., and Drouillard, P.H., 1994, The digital geologic map of Wyoming in ARC/INFO format: U.S. Geological Survey Open-File Report 94–425, accessed May 20, 2012, at http://pubs.usgs.gov/of/1994/ofr-94-0425/.
HydroGeo, Inc., 2004, Groundwater flow model and hydro-logic impact assessment, Jonah Infill Drilling Project: Crested Butte, Colo., report prepared for TRC Mariah Associates, Inc., 19 p.
JFC Engineers/Surveyors, 2002, Marbleton municipal well number six, final report of drilling, development, and test-ing: Rock Springs, Wyo., report prepared for Wyoming Water Development Commission [variously paged].
Johnson-Fermelia Co., Inc., 1990, Farson water supply study, level 1: Rock Springs, Wyo., report prepared for Wyoming Water Development Commission, 122 p.
Jorgensen Engineering and Land Surveying, and Hinckley Consulting, 1994, Final Big Piney/Marbleton level II water supply project report: Jackson, Wyo., report prepared for Wyoming Water Development Commission [variously paged].
Law, B.E., ed., 1984, Geological characteristics of low-permeability Upper Cretaceous and lower Tertiary rocks in the Pinedale Anticline area, Sublette County, Wyoming: U.S. Geological Survey Open-File Report 84–753, 107 p.
Law, B.E., and Spencer, C.W., 1989, Geology of tight gas reservoirs in the Pinedale anticline area, Wyoming, and at the multiwell experiment site, Colorado: U.S. Geological Survey Bulletin 1886 [variously paged]. [Also available at http://pubs.usgs.gov/bul/1886/report.pdf.]
Lawrence, J.C., 1963, Origin of the Wasatch Formation, Cumberland Gap area, Wyoming: Laramie, Wyo., Univer-sity of Wyoming, Contributions to Geology, v. 2, no. 2, p. 151–158.
Love, J.D., and Christiansen, A.C., comps., 1985, Geologic map of Wyoming: U.S. Geological Survey, 3 sheets, scale 1:500,000.
Love, J.D., Christiansen, A.C., and Ver Ploeg, A.J., comps., 1993, Stratigraphic chart showing the Phanerozoic nomen-clature for the State of Wyoming: Geological Survey of Wyoming Map Series 41, MS–41, 1 sheet.
Lowham, H.W., Peterson, D.A., Larson, L.R., Zimmerman, E.A., Ringen, B.H., and Mora, K.L., 1985 [1987], Hydrol-ogy of Area 52, Northern Great Plains and Rocky Mountain Coal Provinces, Wyoming, Colorado, Idaho, and Utah: U.S. Geological Survey Water-Resources Investigations/Open-File Report 83–761, 96 p.

References Cited 25
Martin, L.J., 1996, Geohydrology of Tertiary rocks in the Green River structural basin in Wyoming, Utah, and Colo-rado: U.S. Geological Survey Water-Resources Investiga-tions Report 92–4164, 43 p. [Also available at http://pubs.usgs.gov/wri/1992/4164/report.pdf.]
Martner, B.E., 1986, Wyoming climate atlas: Lincoln, Nebr., University of Nebraska Press, 432 p.
Naftz, D.L., 1996, Geochemistry of selected aquifers in Tertiary rocks of the upper Colorado River Basin in Wyo-ming, Colorado, and Utah: U.S. Geological Survey Water-Resources Investigations Report 95–4065, 45 p. [Also avail-able at http://pubs.usgs.gov/wri/1995/4065/report.pdf.]
Oriel, S.S., 1961, Tongues of the Wasatch and Green River Formations, Fort Hill area, Wyoming, in Topics in the geo-logic and hydrologic sciences, articles 1–146—Geological Survey Research 1961: U.S. Geological Survey Professional Paper 424–B, Article 63, p. B151–B152.
Oriel, S.S. and Platt, L.B., 1980, Geologic map of the Preston 1degree by 2 degrees quadrangle, southeastern Idaho and western Wyoming: U.S. Geological Survey Miscellaneous Investigations Series Map I–1127, scale 1:250,000, 1 sheet.
Price, Don, and Waddell, K.M., 1973, Selected hydrologic data in the Upper Colorado River Basin: U.S. Geological Survey Hydrologic Investigations Atlas HA–477, 2 sheets.
Robinove, C.J., and Cummings, T.R., 1963, Ground-water resources and geology of the Lyman-Mountain View area, Uinta County, Wyoming: U.S. Geological Survey Water-Supply Paper 1669–E, 43 p., 1 pl.
Roehler, H.W., 1990, Correlation and depositional analysis of oil-shale and associated rocks in the Eocene Green River Formation, greater Green River Basin, southwest Wyoming: U.S. Geological Survey Miscellaneous Investigations Map I–2226, scale 1:62,500, 2 sheets.
Roehler, H.W., 1991a, Revised stratigraphic nomenclature for the Wasatch and Green River Formations of Eocene age, Wyoming, Utah, and Colorado: U.S. Geological Survey Professional Paper 1506–B, 38 p. [Also available at http://pubs.usgs.gov/pp/1506b/report.pdf.]
Roehler, H.W., 1991b, Godiva Rim Member—A new strati-graphic unit of the Green River Formation in southwest Wyoming and northwest Colorado: U.S. Geological Survey Professional Paper 1506–C, 17 p. [Also available at http://pubs.usgs.gov/pp/1506c/report.pdf.]
Roehler, H.W., 1992a, Description and correlation of Eocene rocks in stratigraphic reference sections for the Green River and Washakie Basins, southwest Wyoming: U.S. Geological Survey Professional Paper 1506–D, 83 p. [Also available at http://pubs.usgs.gov/pp/1506d/report.pdf.]
Roehler, H.W., 1992b, Correlation, composition, areal distri-bution, and thickness of Eocene stratigraphic units, greater Green River Basin, Wyoming, Utah, and Colorado: U.S. Geological Survey Professional Paper 1506–E, 49 p. [Also available at http://pubs.usgs.gov/pp/1506e/report.pdf.]
Roehler, H.W., 1992c, Introduction to greater Green River Basin geology, physiography, and history of investigations: U.S. Geological Survey Professional Paper 1506–A, 14 p. [Also available at http://pubs.usgs.gov/pp/1506a/report.pdf.]
Roehler, H.W., 1993, Eocene climates, depositional environ-ments, and geography, greater Green River Basin, Wyo-ming, Utah, and Colorado: U.S. Geological Survey Profes-sional Paper 1506–F, 74 p. [Also available at http://pubs.usgs.gov/pp/1506f/report.pdf.]
Sullivan, Raymond, 1980, A stratigraphic evaluation of the Eocene rocks of southwestern Wyoming: Cheyenne, Wyo., The Geological Survey of Wyoming Report of Investiga-tions No. 2, 50 p. [Also available at http://www.wsgs.wyo.gov/public-info/onlinepubs/docs/RI-20.pdf.]
Surdam, R.C., and Stanley, K.O., 1979, Lacustrine sedimenta-tion during the culminating phase of Eocene Lake Gosiute, Wyoming (Green River Formation): Geological Society of America Bulletin, v. 90, no. 1, p. 93–110. [Also available at http://dx.doi.org/10.1130/0016-7606(1979)90<93:LSDTCP>2.0.CO;2.]
Surdam, R.C., and Stanley, K.O., 1980, Effects of changes in drainage-basin boundaries on sedimentation in Eocene Lakes Gosiute and Uinta of Wyoming, Utah, and Colorado: Geology, v. 8, no. 3, p. 135–139. [Also available at http://dx.doi.org/10.1130/0091-7613(1980)8<135:EOCIDB>2.0.CO;2.]
Sutherland, W.M., and Luhr, S.C., 2011, Preliminary geo-logic map of the Farson 30’ x 60’ quadrangle, Sweetwater, Sublette, and Fremont Counties, Wyoming: Wyoming State Geological Survey Open-File Report 11–6, scale 1:100,000.
Sutherland, W.M., and Scott, J.E., 2009, Preliminary geologic map of the Pinedale Quadrangle: Wyoming State Geologi-cal Survey Open-File Report 09–4, scale 1:100,000.
Sweat, M.J., 2013, Groundwater well inventory and assess-ment in the area of the proposed Normally Pressured Lance Natural Gas Development Project, Green River Basin, Wyo-ming, 2012: U.S. Geological Survey Data Series 770, 27 p. [Also available at http://pubs.usgs.gov/ds/770/.]
Taylor, O.J., Hood, J.W., and Zimmerman, E.A., 1986, Hydro-geologic framework of the upper Colorado River Basin—Excluding the San Juan Basin—Colorado, Utah, Wyoming, and Arizona: U.S. Geological Survey Hydrologic Atlas HA–687, 2 sheets, scale 1:3,000,000.

26 Generalized Potentiometric-Surface Map of the Green River Basin Lower Tertiary Aquifer System, 2010–14
Teller, R.W., and Chafin, D.T., 1986, Selected drill-stem tests data for the upper Colorado River Basin: U.S. Geological Survey Water-Resources Investigations Report 84–4146, 112 p., 1 pl. [Also available at http://pubs.usgs.gov/wri/1984/4146/report.pdf.]
Trihydro Corporation, 2011, Groundwater Characteriza-tion—Normally Pressured Lance Gas Development Project Sublette County, Wyoming: Laramie, Wyo., EnCana Oil & Gas (USA), Inc., Trihydro Corporation, [variously paged].
Trihydro Corporation, 2012, 2012 Annual water sampling—Normally Pressured Lance Gas Development Project, Sub-lette County, Wyoming: Laramie, Wyo., EnCana Oil & Gas (USA), Inc., Trihydro Corporation, [variously paged], 1 CD.
Welder, G.E., 1968, Ground-water reconnaissance of the Green River Basin, southwestern Wyoming: U.S. Geologi-cal Survey Hydrologic Atlas HA–290, 2 sheets; accompany-ing text, 5 p. [Also available at http://pubs.usgs.gov/ha/290/report.pdf.]
Western Regional Climate Center, 2014a, Farson, Wyoming (483170)—Period of record monthly climate summary—Period of record—1/1/1915 to 12/31/2005: accessed Octo-ber 6, 2014, at http://www.wrcc.dri.edu/cgi-bin/cliMAIN.pl?wyfars.
Western Regional Climate Center, 2014b, Big Piney, Wyo-ming (480695)—Period of record monthly climate sum-mary—Period of record—08/01/1948 to 03/31/2013: accessed October 6, 2014, at http://www.wrcc.dri.edu/cgi-bin/cliMAIN.pl?wy0695.
Zimmerman, E.A. and Collier, K.R., 1985, Ground-water data, Green River Basin, Wyoming: U.S. Geological Survey Open-File Report 83–943, 511 p.

Appendix 1

28 Generalized Potentiometric-Surface Map of the Green River Basin Lower Tertiary Aquifer System, 2010–14
Table 1–1. Wells evaluated for construction of generalized potentiometric-surface map, northern Green River structural basin, Wyoming.
[USGS, U.S. Geological Survey; DMS, degrees, minutes, seconds; NAVD 88, North American Vertical Datum of 1988; --, no data or not applicable; NA, not avail-able; negative value (-) indicates groundwater level or well casing is above land surface; E, groundwater-level altitude estimated to be 10 feet above land-surface elevation for contouring purposes only (see text). Use of water abbreviations: STO, livestock; UNSTO, unused, formerly used for livestock; STO/MIN, stock and mining (used for drilling oil and gas wells); MIN, mining (oil and gas well drilling); UNMIN/STO, unused, formerly used for drilling oil and gas wells and livestock; UNMIN, unused, formerly used for drilling oil and gas wells; WS, water supply; UNUSED, former use not determined; DOM, domestic; DOM/STO, domestic and livestock; OBS, observation. Lithostratigraphic unit abbreviations: LNEY, Laney Member of Green River Formation; FRSO, Farson Sandstone Member of the Green River Formation; EOCN, undifferentiated Green River or Wasatch Formations; WSTC, Wasatch Formation; WKPK, Wilkins Peak Member of the Green River Forma-tion; CDBF, Cathedral Bluffs Tongue of Wasatch Formation; ALVM, Quaternary alluvial deposits. Hydrogeologic unit abbreviations: LA, Laney aquifer; FSAC, Farson Sandstone-Alkali Creek aquifer; UND, undefined part of the lower Tertiary aquifer system in the Green River Basin; WZWA, Wasatch zone of Wasatch-Fort Union aquifer; WPCU, Wilkins Peak confining unit; QA, Quaternary alluvial aquifers. Groundwater-level status abbreviations: A, atmospheric pressure; F, flowing; P, pumping; R, recently pumped. Casing material abbreviations: S, steel; P, polyvinyl chloride (PVC); Z, other material (see footnote); N, PVC with glued joints; I, iron; G, galvanized iron; K, PVC with threaded joints; R, stainless steel. Type of openings abbreviations: X, open hole (no casing); P, perforated, porous, or slotted; Z, other, described in footnote; R, wire-wound screen. Blue shaded rows, flowing wells used to create potentiometric-surface map; gray shaded rows, wells removed from groundwater-level dataset before potentiometric-surface map compiled (see text); orange shaded rows, removed from groundwater-level dataset after potentio-metric-surface map compiled (see text)]
USG
S st
atio
n na
me
Site
iden
tifie
r (fig
. 10)
1
USG
S
site
-ide
ntifi
catio
n
num
ber
Latit
ude
(DM
S)
Long
itude
(DM
S)
Coun
ty
Use
of w
ater
Lith
ostr
atig
raph
ic u
nit
Hyd
roge
olog
ic u
nit
Dat
e of
wel
l con
stru
ctio
n
(mon
th/d
ay/y
ear)
Land
-sur
face
alti
tude
(fe
et a
bove
NAV
D 8
8)
Dep
th o
f wel
l (fe
et b
elow
land
sur
face
)
Dep
th to
gro
undw
ater
(fe
et b
elow
land
sur
face
)
Gro
undw
ater
-lev
el a
ltitu
de
roun
ded
to n
eare
st fo
ot
(feet
abo
ve N
AVD
88)
Gro
undw
ater
-lev
el s
tatu
s
Dat
e of
gro
undw
ater
-lev
el
mea
sure
men
t
Dep
th h
ole
drill
ed
(feet
bel
ow la
nd s
urfa
ce)
Scre
ened
or o
pen
inte
rval
(fe
et b
elow
land
sur
face
)
Leng
th o
f ope
n in
terv
al
(feet
)
Dia
met
er o
f cas
ing
m
ater
ial i
n sc
reen
ed o
r op
en in
terv
al (i
nche
s)
Casi
ng m
ater
ial i
n sc
reen
ed o
r ope
n in
terv
al
Type
of o
peni
ngs
in
inte
rval
Case
d in
terv
al
(feet
abo
ve o
r bel
ow
land
sur
face
)
Dia
met
er o
f cas
ing
m
ater
ial i
n in
terv
al
(inch
es)
Casi
ng m
ater
ial i
n in
terv
al
24-110-01cc 01 01cc 01 420513109504701 42°04ʹ58.5ʺ 109°50ʹ44.4ʺ Sweetwater STO LNEY LA 11/15/1956 6,478 65 26.69 6,451 -- 08/03/2012 72 57–72 15 -- -- X -0.21–57 6 S25-107-02da 01 02da 01 421005109315901 42°10ʹ03.9ʺ 109°31ʹ55.0ʺ Sweetwater STO FRSO FSAC 01/01/1976 6,662 200 -12.34 6,674 F 08/07/2013 200 150–190 40 6 S P -0.62–200 6 S25-107-06cda01 06cda01 420957109370901 42°09ʹ56.7ʺ 109°37ʹ08.7ʺ Sweetwater STO EOCN UND NA 6,745 NA -- -- F 07/30/2012 NA NA -- -- -- -- NA -- --25-107-19aaa01 19aaa01 420759109363201 42°07ʹ59.4ʺ 109°36ʹ31.5ʺ Sweetwater STO FRSO FSAC 06/18/1980 6,765 225 5.89 6,759 P 07/30/2012 228 204–225 21 6 S P -0.6–225 6 S25-107-23ddc01 23ddc01 420710109315601 42°07ʹ12.2ʺ 109°31ʹ57.7ʺ Sweetwater STO WSTC WZWA 11/30/1972 6,726 1,365 67.50 6,659 P 07/30/2012 1,365 2687–1,334 2108 4 S P -1.88–1,364 4 S25-108-10dad01 10dad01 420915109403901 42°09ʹ14.5ʺ 109°39ʹ59.8ʺ Sweetwater STO WSTC WZWA 08/30/1961 6,846 882 92.24 6,754 -- 07/31/2012 882 756–882 126 -- -- X -0.17–756 6 --25-109-04add01 04add01 421025109481901 42°10ʹ22.3ʺ 109°48ʹ06.7ʺ Sweetwater STO FRSO FSAC 09/10/1957 6,661 205 12.92 6,648 -- 08/01/2012 205 102–205 103 -- -- X 0–102 6.63 S25-109-13baa01 13baa01 420901109460001 42°08ʹ58.1ʺ 109°45ʹ17.3ʺ Sweetwater STO FRSO FSAC 09/03/1959 6,830 583 128.71 6,701 -- 08/01/2012 583 NA -- -- -- -- -0.16–583 7 S25-109-17da 01 17da 01 421321109493502 42°08ʹ27.8ʺ 109°49ʹ25.6ʺ Sweetwater STO WKPK WPCU 08/15/1959 6,602 190 56.69 6,545 -- 08/01/2012 193 NA -- -- -- -- -0.31–193 6 S25-109-18dcc01 18dcc01 420814109510201 42°08ʹ13.8ʺ 109°51ʹ02.0ʺ Sweetwater STO WSTC WZWA 10/23/2004 6,965 825 281.42 6,684 -- 08/03/2012 825 662–822 160 5 P P -2.25–664 7 S25-110-15aab01 15aab01 420905109540901 42°09ʹ08.1ʺ 109°54ʹ04.6ʺ Sweetwater STO FRSO FSAC 10/11/1961 6,750 500 80.10 6,670 -- 08/01/2012 500 3211–500 3289 4 Z3 Z3 0–211 6.62 S25-110-21cac01 21cac01 420757109555601 42°07ʹ43.2ʺ 109°55ʹ48.2ʺ Sweetwater STO WKPK WPCU 09/09/1957 6,610 190 38.64 6,571 -- 08/01/2012 190 443–190 4106 6.62 Z4 Z4 40–100 46.62 S4
25-111-02dbc01 02dbc01 421045110002001 42°10ʹ20.5ʺ 110°00ʹ16.3ʺ Sweetwater STO FRSO FSAC 10/10/1959 6,836 480 121.28 6,715 -- 07/07/2014 480 NA -- -- -- -- -0.25–480 7 S25-111-22dbb01 22dbb01 420822110013201 42°07ʹ54.9ʺ 110°01ʹ26.1ʺ Sweetwater STO WSTC WZWA 10/10/1959 6,854 760 204.96 6,649 -- 07/07/2014 775 615–760 145 -- -- X -0.16–615 6 S25-111-30cac01 30cac01 420703110051501 42°07ʹ02.9ʺ 110°05ʹ14.6ʺ Lincoln STO FRSO FSAC 09/11/1981 6,871 705 282.49 6,589 -- 08/02/2012 705 646–705 59 6 S P -0.98–705 6 S25-112-14aab01 14aab01 420919110065301 42°09ʹ19.6ʺ 110°06ʹ53.1ʺ Lincoln STO FRSO FSAC 09/09/1981 7,010 685 399.47 6,611 -- 08/02/2012 685 625–685 60 6 S P -1.99–685 6 S26-107-09cda01 09cda01 421418109345001 42°14ʹ18.0ʺ 109°34ʹ50.3ʺ Sweetwater UNSTO FRSO FSAC 11/20/1979 6,675 174 17.76 6,657 -- 06/29/2012 200 130–180 50 6.62 P P -0.97–200 6.62 P26-107-16ada01 16ada01 421351109341501 42°13ʹ51.4ʺ 109°34ʹ14.7ʺ Sweetwater STO CDBF WZWA 06/10/2012 6,674 80 17.52 6,656 -- 07/30/2012 80 60–80 20 5 N P -3.33–80 5 N26-107-32abb01 32abb01 421127109354601 42°11ʹ27.1ʺ 109°35ʹ46.2ʺ Sweetwater STO FRSO FSAC 09/20/1969 6,785 191 131.69 6,653 P 06/25/2012 200 160–200 40 6.62 S P -2.03–200 6.62 S26-108-10dba01 10dba01 421433109402301 42°14ʹ32.9ʺ 109°40ʹ23.4ʺ Sweetwater STO FRSO FSAC 09/19/1981 6,806 490 59.13 6,747 -- 06/21/2012 490 469–490 21 6 S P -1.5–490 6 S26-108-30bab01 30bab01 421219109433801 42°12ʹ24.2ʺ 109°44ʹ12.1ʺ Sweetwater STO FRSO FSAC 10/20/1961 6,868 618 151.40 6,717 -- 06/21/2012 618 5170–618 5158 6 S P -0.7–618 6 S26-109-05cbc01 05cbc01 421515109501801 42°15ʹ24.9ʺ 109°50ʹ20.3ʺ Sweetwater STO FRSO FSAC 07/07/1959 6,832 207 34.72 6,797 -- 06/14/2012 210 49–210 161 -- -- X -0.03–49 6.63 S26-109-10ccd01 10ccd01 421421109475001 42°14ʹ18.6ʺ 109°47ʹ50.6ʺ Sweetwater STO FRSO FSAC 11/25/1960 6,802 312 57.53 6,744 -- 06/14/2012 312 660–310 650 7 S P -0.14–312 7 S26-110-15dca01 15dca01 421308109541901 42°13ʹ38.8ʺ 109°54ʹ17.7ʺ Sweetwater STO FRSO FSAC 07/20/1959 6,947 316 86.57 6,860 -- 08/01/2012 316 7190–316 766 6 S P -0.2–316 6 S26-110-34dca01 34dca01 421051109543001 42°11ʹ05.0ʺ 109°54ʹ12.0ʺ Sweetwater STO FRSO FSAC 09/04/1957 6,769 280 60.45 6,709 -- 06/20/2012 285 NA -- -- -- -- -1.55–NA 4 P26-111-03cdb01 03cdb01 421532110014301 42°15ʹ32.5ʺ 110°01ʹ43.2ʺ Sweetwater STO WSTC WZWA 09/15/1981 7,246 825 484.66 6,761 R 07/18/2012 825 785–825 40 6 S P -1.26–825 6 S26-111-28cda01 28cda01 421208110025801 42°12ʹ05.0ʺ 110°02ʹ42.2ʺ Sweetwater STO WSTC WZWA 09/09/1969 7,174 710 466.20 6,708 -- 08/02/2012 710 570–710 140 6.62 S P -1.47–710 6.62 S27-107-20cdb01 20cdb01 421749109360601 42°17ʹ49.1ʺ 109°36ʹ05.6ʺ Sublette STO/MIN FRSO FSAC 12/03/2001 6,722 390 -- E6,732 F 06/22/2012 390 270–390 120 6.62 S P -2–390 6.62 S27-107-22adb01 22adb01 421811109331401 42°18ʹ10.7ʺ 109°33ʹ14.1ʺ Sublette STO WSTC WZWA 12/17/2007 6,699 1,100 -9.12 6,708 F 08/07/2013 1,100 875–1,100 8175 6.62 S P -3–1,100 6.62 S27-107-25cdc01 25cdc01 421633109310701 42°16ʹ41.9ʺ 109°31ʹ28.3ʺ Sublette STO CDBF WZWA 01/01/1964 6,674 150 19.45 6,655 -- 06/12/2012 NA NA -- -- -- -- -0.88–NA 6 S27-108-21cba01 21cba01 421800109420701 42°17ʹ59.5ʺ 109°42ʹ06.8ʺ Sublette STO FRSO FSAC 05/03/1977 6,894 700 123.19 6,771 -- 06/26/2012 700 320–400 80 6 P P -0.3–700 6 P
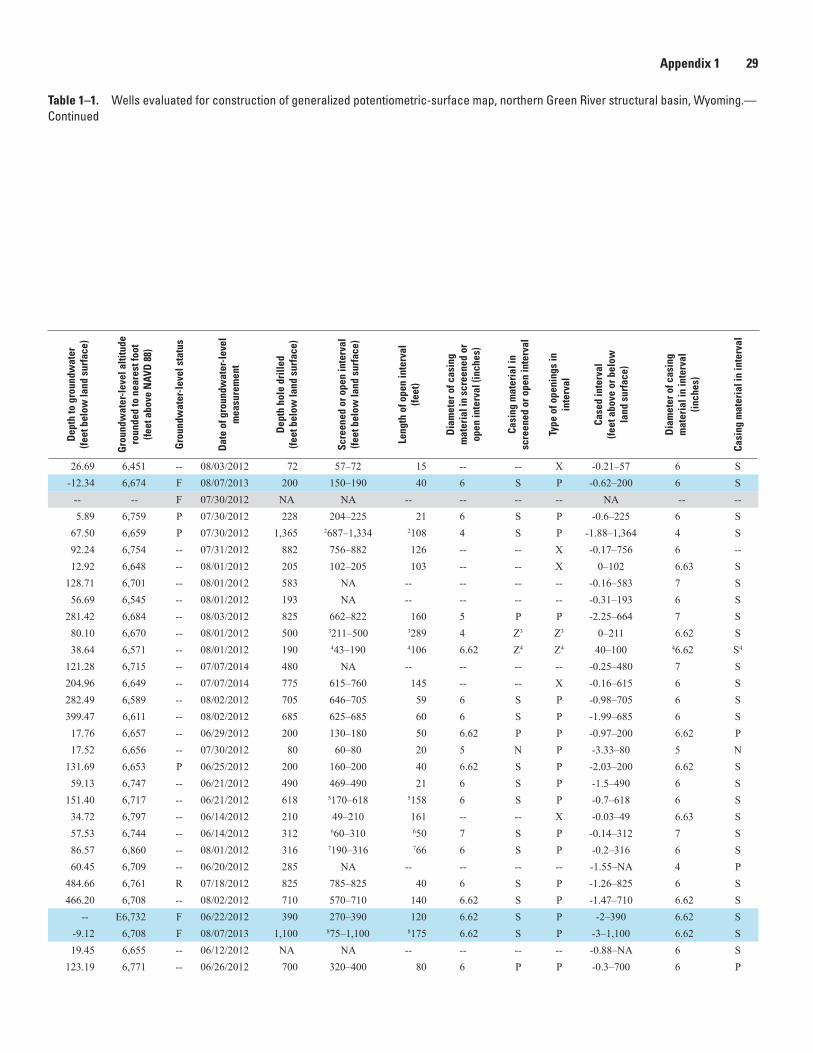
Appendix 1 29
USG
S st
atio
n na
me
Site
iden
tifie
r (fig
. 10)
1
USG
S
site
-ide
ntifi
catio
n
num
ber
Latit
ude
(DM
S)
Long
itude
(DM
S)
Coun
ty
Use
of w
ater
Lith
ostr
atig
raph
ic u
nit
Hyd
roge
olog
ic u
nit
Dat
e of
wel
l con
stru
ctio
n
(mon
th/d
ay/y
ear)
Land
-sur
face
alti
tude
(fe
et a
bove
NAV
D 8
8)
Dep
th o
f wel
l (fe
et b
elow
land
sur
face
)
Dep
th to
gro
undw
ater
(fe
et b
elow
land
sur
face
)
Gro
undw
ater
-lev
el a
ltitu
de
roun
ded
to n
eare
st fo
ot
(feet
abo
ve N
AVD
88)
Gro
undw
ater
-lev
el s
tatu
s
Dat
e of
gro
undw
ater
-lev
el
mea
sure
men
t
Dep
th h
ole
drill
ed
(feet
bel
ow la
nd s
urfa
ce)
Scre
ened
or o
pen
inte
rval
(fe
et b
elow
land
sur
face
)
Leng
th o
f ope
n in
terv
al
(feet
)
Dia
met
er o
f cas
ing
m
ater
ial i
n sc
reen
ed o
r op
en in
terv
al (i
nche
s)
Casi
ng m
ater
ial i
n sc
reen
ed o
r ope
n in
terv
al
Type
of o
peni
ngs
in
inte
rval
Case
d in
terv
al
(feet
abo
ve o
r bel
ow
land
sur
face
)
Dia
met
er o
f cas
ing
m
ater
ial i
n in
terv
al
(inch
es)
Casi
ng m
ater
ial i
n in
terv
al
24-110-01cc 01 01cc 01 420513109504701 42°04ʹ58.5ʺ 109°50ʹ44.4ʺ Sweetwater STO LNEY LA 11/15/1956 6,478 65 26.69 6,451 -- 08/03/2012 72 57–72 15 -- -- X -0.21–57 6 S25-107-02da 01 02da 01 421005109315901 42°10ʹ03.9ʺ 109°31ʹ55.0ʺ Sweetwater STO FRSO FSAC 01/01/1976 6,662 200 -12.34 6,674 F 08/07/2013 200 150–190 40 6 S P -0.62–200 6 S25-107-06cda01 06cda01 420957109370901 42°09ʹ56.7ʺ 109°37ʹ08.7ʺ Sweetwater STO EOCN UND NA 6,745 NA -- -- F 07/30/2012 NA NA -- -- -- -- NA -- --25-107-19aaa01 19aaa01 420759109363201 42°07ʹ59.4ʺ 109°36ʹ31.5ʺ Sweetwater STO FRSO FSAC 06/18/1980 6,765 225 5.89 6,759 P 07/30/2012 228 204–225 21 6 S P -0.6–225 6 S25-107-23ddc01 23ddc01 420710109315601 42°07ʹ12.2ʺ 109°31ʹ57.7ʺ Sweetwater STO WSTC WZWA 11/30/1972 6,726 1,365 67.50 6,659 P 07/30/2012 1,365 2687–1,334 2108 4 S P -1.88–1,364 4 S25-108-10dad01 10dad01 420915109403901 42°09ʹ14.5ʺ 109°39ʹ59.8ʺ Sweetwater STO WSTC WZWA 08/30/1961 6,846 882 92.24 6,754 -- 07/31/2012 882 756–882 126 -- -- X -0.17–756 6 --25-109-04add01 04add01 421025109481901 42°10ʹ22.3ʺ 109°48ʹ06.7ʺ Sweetwater STO FRSO FSAC 09/10/1957 6,661 205 12.92 6,648 -- 08/01/2012 205 102–205 103 -- -- X 0–102 6.63 S25-109-13baa01 13baa01 420901109460001 42°08ʹ58.1ʺ 109°45ʹ17.3ʺ Sweetwater STO FRSO FSAC 09/03/1959 6,830 583 128.71 6,701 -- 08/01/2012 583 NA -- -- -- -- -0.16–583 7 S25-109-17da 01 17da 01 421321109493502 42°08ʹ27.8ʺ 109°49ʹ25.6ʺ Sweetwater STO WKPK WPCU 08/15/1959 6,602 190 56.69 6,545 -- 08/01/2012 193 NA -- -- -- -- -0.31–193 6 S25-109-18dcc01 18dcc01 420814109510201 42°08ʹ13.8ʺ 109°51ʹ02.0ʺ Sweetwater STO WSTC WZWA 10/23/2004 6,965 825 281.42 6,684 -- 08/03/2012 825 662–822 160 5 P P -2.25–664 7 S25-110-15aab01 15aab01 420905109540901 42°09ʹ08.1ʺ 109°54ʹ04.6ʺ Sweetwater STO FRSO FSAC 10/11/1961 6,750 500 80.10 6,670 -- 08/01/2012 500 3211–500 3289 4 Z3 Z3 0–211 6.62 S25-110-21cac01 21cac01 420757109555601 42°07ʹ43.2ʺ 109°55ʹ48.2ʺ Sweetwater STO WKPK WPCU 09/09/1957 6,610 190 38.64 6,571 -- 08/01/2012 190 443–190 4106 6.62 Z4 Z4 40–100 46.62 S4
25-111-02dbc01 02dbc01 421045110002001 42°10ʹ20.5ʺ 110°00ʹ16.3ʺ Sweetwater STO FRSO FSAC 10/10/1959 6,836 480 121.28 6,715 -- 07/07/2014 480 NA -- -- -- -- -0.25–480 7 S25-111-22dbb01 22dbb01 420822110013201 42°07ʹ54.9ʺ 110°01ʹ26.1ʺ Sweetwater STO WSTC WZWA 10/10/1959 6,854 760 204.96 6,649 -- 07/07/2014 775 615–760 145 -- -- X -0.16–615 6 S25-111-30cac01 30cac01 420703110051501 42°07ʹ02.9ʺ 110°05ʹ14.6ʺ Lincoln STO FRSO FSAC 09/11/1981 6,871 705 282.49 6,589 -- 08/02/2012 705 646–705 59 6 S P -0.98–705 6 S25-112-14aab01 14aab01 420919110065301 42°09ʹ19.6ʺ 110°06ʹ53.1ʺ Lincoln STO FRSO FSAC 09/09/1981 7,010 685 399.47 6,611 -- 08/02/2012 685 625–685 60 6 S P -1.99–685 6 S26-107-09cda01 09cda01 421418109345001 42°14ʹ18.0ʺ 109°34ʹ50.3ʺ Sweetwater UNSTO FRSO FSAC 11/20/1979 6,675 174 17.76 6,657 -- 06/29/2012 200 130–180 50 6.62 P P -0.97–200 6.62 P26-107-16ada01 16ada01 421351109341501 42°13ʹ51.4ʺ 109°34ʹ14.7ʺ Sweetwater STO CDBF WZWA 06/10/2012 6,674 80 17.52 6,656 -- 07/30/2012 80 60–80 20 5 N P -3.33–80 5 N26-107-32abb01 32abb01 421127109354601 42°11ʹ27.1ʺ 109°35ʹ46.2ʺ Sweetwater STO FRSO FSAC 09/20/1969 6,785 191 131.69 6,653 P 06/25/2012 200 160–200 40 6.62 S P -2.03–200 6.62 S26-108-10dba01 10dba01 421433109402301 42°14ʹ32.9ʺ 109°40ʹ23.4ʺ Sweetwater STO FRSO FSAC 09/19/1981 6,806 490 59.13 6,747 -- 06/21/2012 490 469–490 21 6 S P -1.5–490 6 S26-108-30bab01 30bab01 421219109433801 42°12ʹ24.2ʺ 109°44ʹ12.1ʺ Sweetwater STO FRSO FSAC 10/20/1961 6,868 618 151.40 6,717 -- 06/21/2012 618 5170–618 5158 6 S P -0.7–618 6 S26-109-05cbc01 05cbc01 421515109501801 42°15ʹ24.9ʺ 109°50ʹ20.3ʺ Sweetwater STO FRSO FSAC 07/07/1959 6,832 207 34.72 6,797 -- 06/14/2012 210 49–210 161 -- -- X -0.03–49 6.63 S26-109-10ccd01 10ccd01 421421109475001 42°14ʹ18.6ʺ 109°47ʹ50.6ʺ Sweetwater STO FRSO FSAC 11/25/1960 6,802 312 57.53 6,744 -- 06/14/2012 312 660–310 650 7 S P -0.14–312 7 S26-110-15dca01 15dca01 421308109541901 42°13ʹ38.8ʺ 109°54ʹ17.7ʺ Sweetwater STO FRSO FSAC 07/20/1959 6,947 316 86.57 6,860 -- 08/01/2012 316 7190–316 766 6 S P -0.2–316 6 S26-110-34dca01 34dca01 421051109543001 42°11ʹ05.0ʺ 109°54ʹ12.0ʺ Sweetwater STO FRSO FSAC 09/04/1957 6,769 280 60.45 6,709 -- 06/20/2012 285 NA -- -- -- -- -1.55–NA 4 P26-111-03cdb01 03cdb01 421532110014301 42°15ʹ32.5ʺ 110°01ʹ43.2ʺ Sweetwater STO WSTC WZWA 09/15/1981 7,246 825 484.66 6,761 R 07/18/2012 825 785–825 40 6 S P -1.26–825 6 S26-111-28cda01 28cda01 421208110025801 42°12ʹ05.0ʺ 110°02ʹ42.2ʺ Sweetwater STO WSTC WZWA 09/09/1969 7,174 710 466.20 6,708 -- 08/02/2012 710 570–710 140 6.62 S P -1.47–710 6.62 S27-107-20cdb01 20cdb01 421749109360601 42°17ʹ49.1ʺ 109°36ʹ05.6ʺ Sublette STO/MIN FRSO FSAC 12/03/2001 6,722 390 -- E6,732 F 06/22/2012 390 270–390 120 6.62 S P -2–390 6.62 S27-107-22adb01 22adb01 421811109331401 42°18ʹ10.7ʺ 109°33ʹ14.1ʺ Sublette STO WSTC WZWA 12/17/2007 6,699 1,100 -9.12 6,708 F 08/07/2013 1,100 875–1,100 8175 6.62 S P -3–1,100 6.62 S27-107-25cdc01 25cdc01 421633109310701 42°16ʹ41.9ʺ 109°31ʹ28.3ʺ Sublette STO CDBF WZWA 01/01/1964 6,674 150 19.45 6,655 -- 06/12/2012 NA NA -- -- -- -- -0.88–NA 6 S27-108-21cba01 21cba01 421800109420701 42°17ʹ59.5ʺ 109°42ʹ06.8ʺ Sublette STO FRSO FSAC 05/03/1977 6,894 700 123.19 6,771 -- 06/26/2012 700 320–400 80 6 P P -0.3–700 6 P
Table 1–1. Wells evaluated for construction of generalized potentiometric-surface map, northern Green River structural basin, Wyoming.—Continued
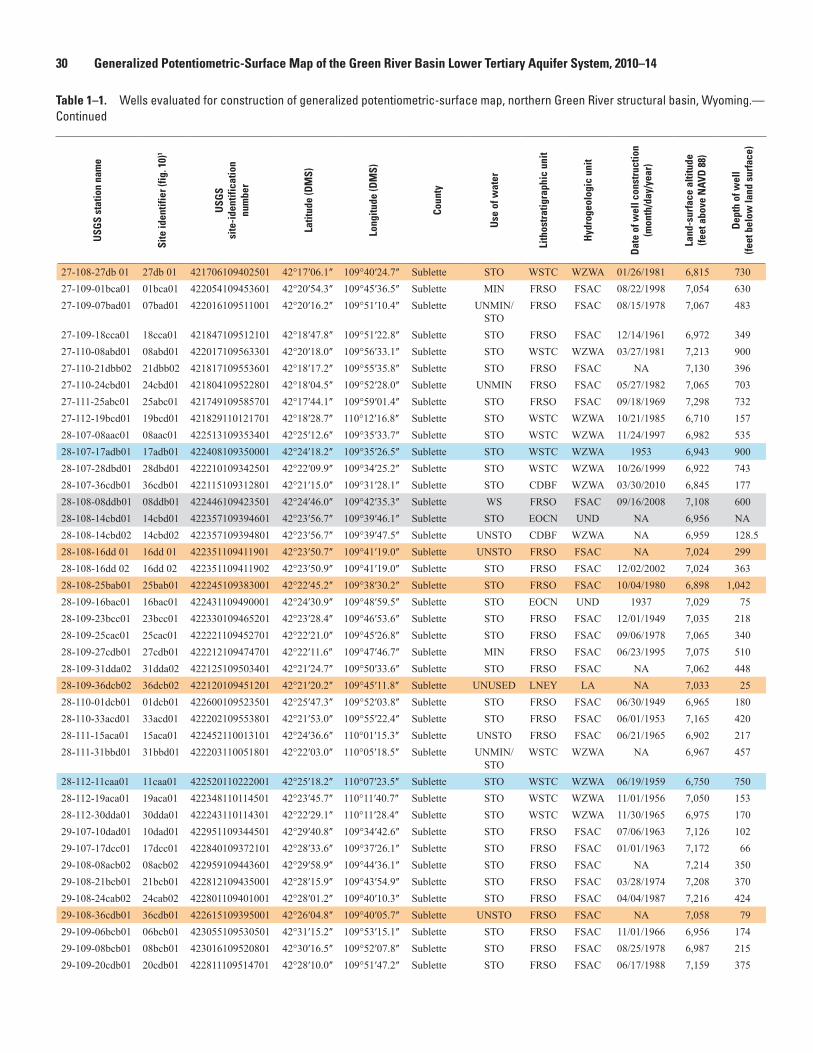
30 Generalized Potentiometric-Surface Map of the Green River Basin Lower Tertiary Aquifer System, 2010–14
USG
S st
atio
n na
me
Site
iden
tifie
r (fig
. 10)
1
USG
S
site
-ide
ntifi
catio
n
num
ber
Latit
ude
(DM
S)
Long
itude
(DM
S)
Coun
ty
Use
of w
ater
Lith
ostr
atig
raph
ic u
nit
Hyd
roge
olog
ic u
nit
Dat
e of
wel
l con
stru
ctio
n
(mon
th/d
ay/y
ear)
Land
-sur
face
alti
tude
(fe
et a
bove
NAV
D 8
8)
Dep
th o
f wel
l (fe
et b
elow
land
sur
face
)
Dep
th to
gro
undw
ater
(fe
et b
elow
land
sur
face
)
Gro
undw
ater
-lev
el a
ltitu
de
roun
ded
to n
eare
st fo
ot
(feet
abo
ve N
AVD
88)
Gro
undw
ater
-lev
el s
tatu
s
Dat
e of
gro
undw
ater
-lev
el
mea
sure
men
t
Dep
th h
ole
drill
ed
(feet
bel
ow la
nd s
urfa
ce)
Scre
ened
or o
pen
inte
rval
(fe
et b
elow
land
sur
face
)
Leng
th o
f ope
n in
terv
al
(feet
)
Dia
met
er o
f cas
ing
m
ater
ial i
n sc
reen
ed o
r op
en in
terv
al (i
nche
s)
Casi
ng m
ater
ial i
n sc
reen
ed o
r ope
n in
terv
al
Type
of o
peni
ngs
in
inte
rval
Case
d in
terv
al
(feet
abo
ve o
r bel
ow
land
sur
face
)
Dia
met
er o
f cas
ing
m
ater
ial i
n in
terv
al
(inch
es)
Casi
ng m
ater
ial i
n in
terv
al
27-108-27db 01 27db 01 421706109402501 42°17ʹ06.1ʺ 109°40ʹ24.7ʺ Sublette STO WSTC WZWA 01/26/1981 6,815 730 -62.90 6,878 F 08/21/2013 730 520–720 200 6.62 P P 0–730 6.62 P27-109-01bca01 01bca01 422054109453601 42°20ʹ54.3ʺ 109°45ʹ36.5ʺ Sublette MIN FRSO FSAC 08/22/1998 7,054 630 245.48 6,809 R 06/14/2012 630 9435–585 980 6 S P -1.78–630 6 S27-109-07bad01 07bad01 422016109511001 42°20ʹ16.2ʺ 109°51ʹ10.4ʺ Sublette UNMIN/
STOFRSO FSAC 08/15/1978 7,067 483 174.60 6,892 -- 06/14/2012 490 NA -- -- -- -- -1.03–490 6 P
27-109-18cca01 18cca01 421847109512101 42°18ʹ47.8ʺ 109°51ʹ22.8ʺ Sublette STO FRSO FSAC 12/14/1961 6,972 349 159.33 6,813 -- 06/14/2012 349 260–349 89 6.88 S P -0.11–349 6.88 S27-110-08abd01 08abd01 422017109563301 42°20ʹ18.0ʺ 109°56ʹ33.1ʺ Sublette STO WSTC WZWA 03/27/1981 7,213 900 382.56 6,830 R 07/17/2012 900 10520–860 10180 6.62 S P -1.59–900 6.62 S27-110-21dbb02 21dbb02 421817109553601 42°18ʹ17.2ʺ 109°55ʹ35.8ʺ Sublette STO FRSO FSAC NA 7,130 396 120.66 7,009 R 07/18/2012 NA NA -- -- -- -- -0.31–NA 6 S27-110-24cbd01 24cbd01 421804109522801 42°18ʹ04.5ʺ 109°52ʹ28.0ʺ Sublette UNMIN FRSO FSAC 05/27/1982 7,065 703 244.72 6,820 -- 07/20/2012 712 11480–660 11100 6.62 S P -0.2–20 14 S27-111-25abc01 25abc01 421749109585701 42°17ʹ44.1ʺ 109°59ʹ01.4ʺ Sublette STO FRSO FSAC 09/18/1969 7,298 732 482.82 6,815 R 07/17/2012 732 490–732 242 6.62 S P -1.37–732 6.62 S27-112-19bcd01 19bcd01 421829110121701 42°18ʹ28.7ʺ 110°12ʹ16.8ʺ Sublette STO WSTC WZWA 10/21/1985 6,710 157 87.61 6,622 -- 07/08/2014 157 107–147 40 5 P P 120–157 126.62; 5 S; P12
28-107-08aac01 08aac01 422513109353401 42°25ʹ12.6ʺ 109°35ʹ33.7ʺ Sublette STO WSTC WZWA 11/24/1997 6,982 535 113.46 6,869 -- 06/13/2012 587 210–587 377 6 S P -2.39–587 6 S28-107-17adb01 17adb01 422408109350001 42°24ʹ18.2ʺ 109°35ʹ26.5ʺ Sublette STO WSTC WZWA 1953 6,943 900 -12.31 6,955 F 08/19/2013 NA NA -- -- -- -- -3–NA 6 S28-107-28dbd01 28dbd01 422210109342501 42°22ʹ09.9ʺ 109°34ʹ25.2ʺ Sublette STO WSTC WZWA 10/26/1999 6,922 743 130.62 6,791 P 06/26/2012 750 630–750 120 6.62 S P -2–750 6.62 S28-107-36cdb01 36cdb01 422115109312801 42°21ʹ15.0ʺ 109°31ʹ28.1ʺ Sublette STO CDBF WZWA 03/30/2010 6,845 177 77.31 6,768 P 06/12/2012 180 160–170 10 5 P P -1.97–180 5 P28-108-08ddb01 08ddb01 422446109423501 42°24ʹ46.0ʺ 109°42ʹ35.3ʺ Sublette WS FRSO FSAC 09/16/2008 7,108 600 328.62 6,779 P 08/20/2013 1,000 475–525 50 6 S P -1.51–545 6 S28-108-14cbd01 14cbd01 422357109394601 42°23ʹ56.7ʺ 109°39ʹ46.1ʺ Sublette STO EOCN UND NA 6,956 NA 97.76 6,858 -- 06/13/2012 NA NA -- -- -- -- -0.73–NA 6 S28-108-14cbd02 14cbd02 422357109394801 42°23ʹ56.7ʺ 109°39ʹ47.5ʺ Sublette UNSTO CDBF WZWA NA 6,959 128.5 84.20 6,875 -- 06/13/2012 NA NA -- -- -- -- -1.49–NA 4 S28-108-16dd 01 16dd 01 422351109411901 42°23ʹ50.7ʺ 109°41ʹ19.0ʺ Sublette UNSTO FRSO FSAC NA 7,024 299 149.11 6,875 -- 07/17/2012 NA NA -- -- -- -- -0.87–NA 4 S28-108-16dd 02 16dd 02 422351109411902 42°23ʹ50.9ʺ 109°41ʹ19.0ʺ Sublette STO FRSO FSAC 12/02/2002 7,024 363 56.69 6,967 -- 06/27/2012 363 13270–330 1340 4.5 P P 0–363 4.5 P28-108-25bab01 25bab01 422245109383001 42°22ʹ45.2ʺ 109°38ʹ30.2ʺ Sublette STO FRSO FSAC 10/04/1980 6,898 1,042 -11.00 6,909 F 07/10/2014 1,042 NA -- -- -- -- 14-2–1,042 147; 4.5 S28-109-16bac01 16bac01 422431109490001 42°24ʹ30.9ʺ 109°48ʹ59.5ʺ Sublette STO EOCN UND 1937 7,029 75 27.18 7,002 -- 06/20/2012 NA NA -- -- -- -- -0.61–75 6 S28-109-23bcc01 23bcc01 422330109465201 42°23ʹ28.4ʺ 109°46ʹ53.6ʺ Sublette STO FRSO FSAC 12/01/1949 7,035 218 67.50 6,968 -- 06/20/2012 218 15190–NA -- -- -- Z15 15-0.62–190 6.62 S28-109-25cac01 25cac01 422221109452701 42°22ʹ21.0ʺ 109°45ʹ26.8ʺ Sublette STO FRSO FSAC 09/06/1978 7,065 340 115.12 6,950 -- 06/13/2012 340 290–340 50 6.62 S P -1.39–340 6.62 S28-109-27cdb01 27cdb01 422212109474701 42°22ʹ11.6ʺ 109°47ʹ46.7ʺ Sublette MIN FRSO FSAC 06/23/1995 7,075 510 131.53 6,943 -- 06/20/2012 510 290–490 200 6 S P -2.1–510 6 S28-109-31dda02 31dda02 422125109503401 42°21ʹ24.7ʺ 109°50ʹ33.6ʺ Sublette STO FRSO FSAC NA 7,062 448 219.44 6,843 R 06/14/2012 NA NA -- -- -- -- -2.4–NA 6 S28-109-36dcb02 36dcb02 422120109451201 42°21ʹ20.2ʺ 109°45ʹ11.8ʺ Sublette UNUSED LNEY LA NA 7,033 25 21.00 7,012 -- 07/17/2012 NA NA -- -- -- -- -1.7–NA 6 S28-110-01dcb01 01dcb01 422600109523501 42°25ʹ47.3ʺ 109°52ʹ03.8ʺ Sublette STO FRSO FSAC 06/30/1949 6,965 180 44.52 6,920 P 06/19/2012 200 NA -- -- -- -- -1.1–200 6 S28-110-33acd01 33acd01 422202109553801 42°21ʹ53.0ʺ 109°55ʹ22.4ʺ Sublette STO FRSO FSAC 06/01/1953 7,165 420 316.24 6,849 -- 07/17/2012 420 NA -- -- -- -- 16-0.96–420 6 Z16
28-111-15aca01 15aca01 422452110013101 42°24ʹ36.6ʺ 110°01ʹ15.3ʺ Sublette UNSTO FRSO FSAC 06/21/1965 6,902 217 96.85 6,805 -- 08/02/2012 217.5 17100–215 1760 6.62 S P -0.17–215 6.62 S28-111-31bbd01 31bbd01 422203110051801 42°22ʹ03.0ʺ 110°05ʹ18.5ʺ Sublette UNMIN/
STOWSTC WZWA NA 6,967 457 223.38 6,744 -- 07/18/2012 NA NA -- -- -- -- -2.61–NA 6 S
28-112-11caa01 11caa01 422520110222001 42°25ʹ18.2ʺ 110°07ʹ23.5ʺ Sublette STO WSTC WZWA 06/19/1959 6,750 750 -10.4 6,760 F 07/09/2014 4,909 NA -- -- -- -- 18-2.5–NA 187 S28-112-19aca01 19aca01 422348110114501 42°23ʹ45.7ʺ 110°11ʹ40.7ʺ Sublette STO WSTC WZWA 11/01/1956 7,050 153 80.58 6,969 -- 07/08/2014 153 90–153 63 6 S P -1–153 6 S28-112-30dda01 30dda01 422243110114301 42°22ʹ29.1ʺ 110°11ʹ28.4ʺ Sublette STO WSTC WZWA 11/30/1965 6,975 170 116.51 6,858 -- 07/08/2014 170 143–160 17 6 S P -1–170 6 S29-107-10dad01 10dad01 422951109344501 42°29ʹ40.8ʺ 109°34ʹ42.6ʺ Sublette STO FRSO FSAC 07/06/1963 7,126 102 25.10 7,101 P 06/28/2012 102 55–102 47 6.62 S P -0.1–102 6.62 S29-107-17dcc01 17dcc01 422840109372101 42°28ʹ33.6ʺ 109°37ʹ26.1ʺ Sublette STO FRSO FSAC 01/01/1963 7,172 66 34.35 7,138 -- 06/28/2012 92 NA -- -- -- -- -0.95–92 6.62 S29-108-08acb02 08acb02 422959109443601 42°29ʹ58.9ʺ 109°44ʹ36.1ʺ Sublette STO FRSO FSAC NA 7,214 350 103.68 7,110 P 07/31/2012 NA NA -- -- -- -- -1.15–NA 6 S29-108-21bcb01 21bcb01 422812109435001 42°28ʹ15.9ʺ 109°43ʹ54.9ʺ Sublette STO FRSO FSAC 03/28/1974 7,208 370 272.62 6,935 -- 07/31/2012 370 19283–365 1927 7 S P -1–370 7 S29-108-24cab02 24cab02 422801109401001 42°28ʹ01.2ʺ 109°40ʹ10.3ʺ Sublette STO FRSO FSAC 04/04/1987 7,216 424 297.99 6,918 -- 07/31/2012 450 325–345 20 7 S P -0.3–450 5 S29-108-36cdb01 36cdb01 422615109395001 42°26ʹ04.8ʺ 109°40ʹ05.7ʺ Sublette UNSTO FRSO FSAC NA 7,058 79 37.90 7,020 -- 07/31/2012 -- -- -- -- -- -- -0.85–NA 6 S29-109-06bcb01 06bcb01 423055109530501 42°31ʹ15.2ʺ 109°53ʹ15.1ʺ Sublette STO FRSO FSAC 11/01/1966 6,956 174 114.64 6,841 -- 08/02/2012 174 145–170 25 6 S P -1–174 6 S29-109-08bcb01 08bcb01 423016109520801 42°30ʹ16.5ʺ 109°52ʹ07.8ʺ Sublette STO FRSO FSAC 08/25/1978 6,987 215 125.34 6,862 -- 06/18/2012 220 20140–220 2060 6.62 S P -1.13–220 6.62 S29-109-20cdb01 20cdb01 422811109514701 42°28ʹ10.0ʺ 109°51ʹ47.2ʺ Sublette STO FRSO FSAC 06/17/1988 7,159 375 281.49 6,878 -- 07/17/2012 375 21280–365 2140 4 P P 21-1.45–375 216; 4 S; P21
Table 1–1. Wells evaluated for construction of generalized potentiometric-surface map, northern Green River structural basin, Wyoming.—Continued

Appendix 1 31
USG
S st
atio
n na
me
Site
iden
tifie
r (fig
. 10)
1
USG
S
site
-ide
ntifi
catio
n
num
ber
Latit
ude
(DM
S)
Long
itude
(DM
S)
Coun
ty
Use
of w
ater
Lith
ostr
atig
raph
ic u
nit
Hyd
roge
olog
ic u
nit
Dat
e of
wel
l con
stru
ctio
n
(mon
th/d
ay/y
ear)
Land
-sur
face
alti
tude
(fe
et a
bove
NAV
D 8
8)
Dep
th o
f wel
l (fe
et b
elow
land
sur
face
)
Dep
th to
gro
undw
ater
(fe
et b
elow
land
sur
face
)
Gro
undw
ater
-lev
el a
ltitu
de
roun
ded
to n
eare
st fo
ot
(feet
abo
ve N
AVD
88)
Gro
undw
ater
-lev
el s
tatu
s
Dat
e of
gro
undw
ater
-lev
el
mea
sure
men
t
Dep
th h
ole
drill
ed
(feet
bel
ow la
nd s
urfa
ce)
Scre
ened
or o
pen
inte
rval
(fe
et b
elow
land
sur
face
)
Leng
th o
f ope
n in
terv
al
(feet
)
Dia
met
er o
f cas
ing
m
ater
ial i
n sc
reen
ed o
r op
en in
terv
al (i
nche
s)
Casi
ng m
ater
ial i
n sc
reen
ed o
r ope
n in
terv
al
Type
of o
peni
ngs
in
inte
rval
Case
d in
terv
al
(feet
abo
ve o
r bel
ow
land
sur
face
)
Dia
met
er o
f cas
ing
m
ater
ial i
n in
terv
al
(inch
es)
Casi
ng m
ater
ial i
n in
terv
al
27-108-27db 01 27db 01 421706109402501 42°17ʹ06.1ʺ 109°40ʹ24.7ʺ Sublette STO WSTC WZWA 01/26/1981 6,815 730 -62.90 6,878 F 08/21/2013 730 520–720 200 6.62 P P 0–730 6.62 P27-109-01bca01 01bca01 422054109453601 42°20ʹ54.3ʺ 109°45ʹ36.5ʺ Sublette MIN FRSO FSAC 08/22/1998 7,054 630 245.48 6,809 R 06/14/2012 630 9435–585 980 6 S P -1.78–630 6 S27-109-07bad01 07bad01 422016109511001 42°20ʹ16.2ʺ 109°51ʹ10.4ʺ Sublette UNMIN/
STOFRSO FSAC 08/15/1978 7,067 483 174.60 6,892 -- 06/14/2012 490 NA -- -- -- -- -1.03–490 6 P
27-109-18cca01 18cca01 421847109512101 42°18ʹ47.8ʺ 109°51ʹ22.8ʺ Sublette STO FRSO FSAC 12/14/1961 6,972 349 159.33 6,813 -- 06/14/2012 349 260–349 89 6.88 S P -0.11–349 6.88 S27-110-08abd01 08abd01 422017109563301 42°20ʹ18.0ʺ 109°56ʹ33.1ʺ Sublette STO WSTC WZWA 03/27/1981 7,213 900 382.56 6,830 R 07/17/2012 900 10520–860 10180 6.62 S P -1.59–900 6.62 S27-110-21dbb02 21dbb02 421817109553601 42°18ʹ17.2ʺ 109°55ʹ35.8ʺ Sublette STO FRSO FSAC NA 7,130 396 120.66 7,009 R 07/18/2012 NA NA -- -- -- -- -0.31–NA 6 S27-110-24cbd01 24cbd01 421804109522801 42°18ʹ04.5ʺ 109°52ʹ28.0ʺ Sublette UNMIN FRSO FSAC 05/27/1982 7,065 703 244.72 6,820 -- 07/20/2012 712 11480–660 11100 6.62 S P -0.2–20 14 S27-111-25abc01 25abc01 421749109585701 42°17ʹ44.1ʺ 109°59ʹ01.4ʺ Sublette STO FRSO FSAC 09/18/1969 7,298 732 482.82 6,815 R 07/17/2012 732 490–732 242 6.62 S P -1.37–732 6.62 S27-112-19bcd01 19bcd01 421829110121701 42°18ʹ28.7ʺ 110°12ʹ16.8ʺ Sublette STO WSTC WZWA 10/21/1985 6,710 157 87.61 6,622 -- 07/08/2014 157 107–147 40 5 P P 120–157 126.62; 5 S; P12
28-107-08aac01 08aac01 422513109353401 42°25ʹ12.6ʺ 109°35ʹ33.7ʺ Sublette STO WSTC WZWA 11/24/1997 6,982 535 113.46 6,869 -- 06/13/2012 587 210–587 377 6 S P -2.39–587 6 S28-107-17adb01 17adb01 422408109350001 42°24ʹ18.2ʺ 109°35ʹ26.5ʺ Sublette STO WSTC WZWA 1953 6,943 900 -12.31 6,955 F 08/19/2013 NA NA -- -- -- -- -3–NA 6 S28-107-28dbd01 28dbd01 422210109342501 42°22ʹ09.9ʺ 109°34ʹ25.2ʺ Sublette STO WSTC WZWA 10/26/1999 6,922 743 130.62 6,791 P 06/26/2012 750 630–750 120 6.62 S P -2–750 6.62 S28-107-36cdb01 36cdb01 422115109312801 42°21ʹ15.0ʺ 109°31ʹ28.1ʺ Sublette STO CDBF WZWA 03/30/2010 6,845 177 77.31 6,768 P 06/12/2012 180 160–170 10 5 P P -1.97–180 5 P28-108-08ddb01 08ddb01 422446109423501 42°24ʹ46.0ʺ 109°42ʹ35.3ʺ Sublette WS FRSO FSAC 09/16/2008 7,108 600 328.62 6,779 P 08/20/2013 1,000 475–525 50 6 S P -1.51–545 6 S28-108-14cbd01 14cbd01 422357109394601 42°23ʹ56.7ʺ 109°39ʹ46.1ʺ Sublette STO EOCN UND NA 6,956 NA 97.76 6,858 -- 06/13/2012 NA NA -- -- -- -- -0.73–NA 6 S28-108-14cbd02 14cbd02 422357109394801 42°23ʹ56.7ʺ 109°39ʹ47.5ʺ Sublette UNSTO CDBF WZWA NA 6,959 128.5 84.20 6,875 -- 06/13/2012 NA NA -- -- -- -- -1.49–NA 4 S28-108-16dd 01 16dd 01 422351109411901 42°23ʹ50.7ʺ 109°41ʹ19.0ʺ Sublette UNSTO FRSO FSAC NA 7,024 299 149.11 6,875 -- 07/17/2012 NA NA -- -- -- -- -0.87–NA 4 S28-108-16dd 02 16dd 02 422351109411902 42°23ʹ50.9ʺ 109°41ʹ19.0ʺ Sublette STO FRSO FSAC 12/02/2002 7,024 363 56.69 6,967 -- 06/27/2012 363 13270–330 1340 4.5 P P 0–363 4.5 P28-108-25bab01 25bab01 422245109383001 42°22ʹ45.2ʺ 109°38ʹ30.2ʺ Sublette STO FRSO FSAC 10/04/1980 6,898 1,042 -11.00 6,909 F 07/10/2014 1,042 NA -- -- -- -- 14-2–1,042 147; 4.5 S28-109-16bac01 16bac01 422431109490001 42°24ʹ30.9ʺ 109°48ʹ59.5ʺ Sublette STO EOCN UND 1937 7,029 75 27.18 7,002 -- 06/20/2012 NA NA -- -- -- -- -0.61–75 6 S28-109-23bcc01 23bcc01 422330109465201 42°23ʹ28.4ʺ 109°46ʹ53.6ʺ Sublette STO FRSO FSAC 12/01/1949 7,035 218 67.50 6,968 -- 06/20/2012 218 15190–NA -- -- -- Z15 15-0.62–190 6.62 S28-109-25cac01 25cac01 422221109452701 42°22ʹ21.0ʺ 109°45ʹ26.8ʺ Sublette STO FRSO FSAC 09/06/1978 7,065 340 115.12 6,950 -- 06/13/2012 340 290–340 50 6.62 S P -1.39–340 6.62 S28-109-27cdb01 27cdb01 422212109474701 42°22ʹ11.6ʺ 109°47ʹ46.7ʺ Sublette MIN FRSO FSAC 06/23/1995 7,075 510 131.53 6,943 -- 06/20/2012 510 290–490 200 6 S P -2.1–510 6 S28-109-31dda02 31dda02 422125109503401 42°21ʹ24.7ʺ 109°50ʹ33.6ʺ Sublette STO FRSO FSAC NA 7,062 448 219.44 6,843 R 06/14/2012 NA NA -- -- -- -- -2.4–NA 6 S28-109-36dcb02 36dcb02 422120109451201 42°21ʹ20.2ʺ 109°45ʹ11.8ʺ Sublette UNUSED LNEY LA NA 7,033 25 21.00 7,012 -- 07/17/2012 NA NA -- -- -- -- -1.7–NA 6 S28-110-01dcb01 01dcb01 422600109523501 42°25ʹ47.3ʺ 109°52ʹ03.8ʺ Sublette STO FRSO FSAC 06/30/1949 6,965 180 44.52 6,920 P 06/19/2012 200 NA -- -- -- -- -1.1–200 6 S28-110-33acd01 33acd01 422202109553801 42°21ʹ53.0ʺ 109°55ʹ22.4ʺ Sublette STO FRSO FSAC 06/01/1953 7,165 420 316.24 6,849 -- 07/17/2012 420 NA -- -- -- -- 16-0.96–420 6 Z16
28-111-15aca01 15aca01 422452110013101 42°24ʹ36.6ʺ 110°01ʹ15.3ʺ Sublette UNSTO FRSO FSAC 06/21/1965 6,902 217 96.85 6,805 -- 08/02/2012 217.5 17100–215 1760 6.62 S P -0.17–215 6.62 S28-111-31bbd01 31bbd01 422203110051801 42°22ʹ03.0ʺ 110°05ʹ18.5ʺ Sublette UNMIN/
STOWSTC WZWA NA 6,967 457 223.38 6,744 -- 07/18/2012 NA NA -- -- -- -- -2.61–NA 6 S
28-112-11caa01 11caa01 422520110222001 42°25ʹ18.2ʺ 110°07ʹ23.5ʺ Sublette STO WSTC WZWA 06/19/1959 6,750 750 -10.4 6,760 F 07/09/2014 4,909 NA -- -- -- -- 18-2.5–NA 187 S28-112-19aca01 19aca01 422348110114501 42°23ʹ45.7ʺ 110°11ʹ40.7ʺ Sublette STO WSTC WZWA 11/01/1956 7,050 153 80.58 6,969 -- 07/08/2014 153 90–153 63 6 S P -1–153 6 S28-112-30dda01 30dda01 422243110114301 42°22ʹ29.1ʺ 110°11ʹ28.4ʺ Sublette STO WSTC WZWA 11/30/1965 6,975 170 116.51 6,858 -- 07/08/2014 170 143–160 17 6 S P -1–170 6 S29-107-10dad01 10dad01 422951109344501 42°29ʹ40.8ʺ 109°34ʹ42.6ʺ Sublette STO FRSO FSAC 07/06/1963 7,126 102 25.10 7,101 P 06/28/2012 102 55–102 47 6.62 S P -0.1–102 6.62 S29-107-17dcc01 17dcc01 422840109372101 42°28ʹ33.6ʺ 109°37ʹ26.1ʺ Sublette STO FRSO FSAC 01/01/1963 7,172 66 34.35 7,138 -- 06/28/2012 92 NA -- -- -- -- -0.95–92 6.62 S29-108-08acb02 08acb02 422959109443601 42°29ʹ58.9ʺ 109°44ʹ36.1ʺ Sublette STO FRSO FSAC NA 7,214 350 103.68 7,110 P 07/31/2012 NA NA -- -- -- -- -1.15–NA 6 S29-108-21bcb01 21bcb01 422812109435001 42°28ʹ15.9ʺ 109°43ʹ54.9ʺ Sublette STO FRSO FSAC 03/28/1974 7,208 370 272.62 6,935 -- 07/31/2012 370 19283–365 1927 7 S P -1–370 7 S29-108-24cab02 24cab02 422801109401001 42°28ʹ01.2ʺ 109°40ʹ10.3ʺ Sublette STO FRSO FSAC 04/04/1987 7,216 424 297.99 6,918 -- 07/31/2012 450 325–345 20 7 S P -0.3–450 5 S29-108-36cdb01 36cdb01 422615109395001 42°26ʹ04.8ʺ 109°40ʹ05.7ʺ Sublette UNSTO FRSO FSAC NA 7,058 79 37.90 7,020 -- 07/31/2012 -- -- -- -- -- -- -0.85–NA 6 S29-109-06bcb01 06bcb01 423055109530501 42°31ʹ15.2ʺ 109°53ʹ15.1ʺ Sublette STO FRSO FSAC 11/01/1966 6,956 174 114.64 6,841 -- 08/02/2012 174 145–170 25 6 S P -1–174 6 S29-109-08bcb01 08bcb01 423016109520801 42°30ʹ16.5ʺ 109°52ʹ07.8ʺ Sublette STO FRSO FSAC 08/25/1978 6,987 215 125.34 6,862 -- 06/18/2012 220 20140–220 2060 6.62 S P -1.13–220 6.62 S29-109-20cdb01 20cdb01 422811109514701 42°28ʹ10.0ʺ 109°51ʹ47.2ʺ Sublette STO FRSO FSAC 06/17/1988 7,159 375 281.49 6,878 -- 07/17/2012 375 21280–365 2140 4 P P 21-1.45–375 216; 4 S; P21
Table 1–1. Wells evaluated for construction of generalized potentiometric-surface map, northern Green River structural basin, Wyoming.—Continued

32 Generalized Potentiometric-Surface Map of the Green River Basin Lower Tertiary Aquifer System, 2010–14
Table 1–1. Wells evaluated for construction of generalized potentiometric-surface map, northern Green River structural basin, Wyoming.—Continued
USG
S st
atio
n na
me
Site
iden
tifie
r (fig
. 10)
1
USG
S
site
-ide
ntifi
catio
n
num
ber
Latit
ude
(DM
S)
Long
itude
(DM
S)
Coun
ty
Use
of w
ater
Lith
ostr
atig
raph
ic u
nit
Hyd
roge
olog
ic u
nit
Dat
e of
wel
l con
stru
ctio
n
(mon
th/d
ay/y
ear)
Land
-sur
face
alti
tude
(fe
et a
bove
NAV
D 8
8)
Dep
th o
f wel
l (fe
et b
elow
land
sur
face
)
Dep
th to
gro
undw
ater
(fe
et b
elow
land
sur
face
)
Gro
undw
ater
-lev
el a
ltitu
de
roun
ded
to n
eare
st fo
ot
(feet
abo
ve N
AVD
88)
Gro
undw
ater
-lev
el s
tatu
s
Dat
e of
gro
undw
ater
-lev
el
mea
sure
men
t
Dep
th h
ole
drill
ed
(feet
bel
ow la
nd s
urfa
ce)
Scre
ened
or o
pen
inte
rval
(fe
et b
elow
land
sur
face
)
Leng
th o
f ope
n in
terv
al
(feet
)
Dia
met
er o
f cas
ing
m
ater
ial i
n sc
reen
ed o
r op
en in
terv
al (i
nche
s)
Casi
ng m
ater
ial i
n sc
reen
ed o
r ope
n in
terv
al
Type
of o
peni
ngs
in
inte
rval
Case
d in
terv
al
(feet
abo
ve o
r bel
ow
land
sur
face
)
Dia
met
er o
f cas
ing
m
ater
ial i
n in
terv
al
(inch
es)
Casi
ng m
ater
ial i
n in
terv
al
29-109-23cd 01 23cd 01 422747109481601 42°27ʹ46.9ʺ 109°48ʹ15.7ʺ Sublette STO FRSO FSAC 05/25/1995 7,099 316 100.42 6,999 R 08/21/2013 NA 280–310 30 5.5 P P -0.41–310 5.5 P29-109-33ddb01 33ddb01 422618109500401 42°26ʹ17.9ʺ 109°50ʹ04.1ʺ Sublette STO FRSO FSAC 11/17/1992 7,054 253 152.67 6,901 P 06/20/2012 254 234–254 20 5.5 P P 22-1.13–254 228.62; 5.5 S; P22
29-110-22bcd01 22bcd01 422838109564501 42°28ʹ37.9ʺ 109°56ʹ45.0ʺ Sublette UNMIN WSTC WZWA 11/24/2003 7,049 750 242.54 6,806 -- 06/21/2012 750 404–698 294 6 S P -0.31–740 6 S29-111-28dca01 28dca01 422740110041701 42°27ʹ39.8ʺ 110°04ʹ17.3ʺ Sublette STO WSTC WZWA 12/22/1970 6,703 336 -- E6,713 F 06/21/2012 336 280–336 56 4 I P 230–336 236; 4 I29-111-29ddb01 29ddb01 422745110052201 42°27ʹ45.3ʺ 110°05ʹ21.5ʺ Sublette DOM WSTC WZWA 08/03/1995 6,818 217.84 110.83 6,707 R 09/15/2010 -- 24130–211 2460 4.5 P P 24-1.16–211 249.5; 4.5 S; P24
29-111-33abb01 33abb01 422726110042901 42°27ʹ31.8ʺ 110°04ʹ33.0ʺ Sublette DOM/STO
WSTC WZWA 04/07/1947 6,694 350 -- E6,704 F 07/09/2014 350 NA -- -- -- -- 0–NA 4 G
30-107-02add02 02add02 423557109333501 42°35ʹ57.2ʺ 109°33ʹ35.0ʺ Sublette STO EOCN UND 2014 7,211 NA25 19.81 7,191 -- 07/10/2014 NA NA -- -- -- -- -1.1–NA 6 P30-107-06ddb01 06ddb01 423539109382201 42°35ʹ39.5ʺ 109°38ʹ23.4ʺ Sublette STO FRSO FSAC 12/06/1960 7,266 147 67.26 7,199 -- 06/27/2012 153 2680–153 2623 7 S P -1–153 7 S30-107-13cba01 13cba01 423408109331501 42°34ʹ04.4ʺ 109°33ʹ18.3ʺ Sublette UNSTO FRSO FSAC 07/05/1941 7,295 250 67.84 7,227 -- 07/10/2014 260 27168–260 2792 6 S P;
X27-0.35–188 6 S
30-107-24bdb01 24bdb01 423328109330901 42°33ʹ27.5ʺ 109°33ʹ09.0ʺ Sublette STO CDBF WZWA 05/08/2007 7,355 150 2848.11 287,307 P 06/27/2012 150 80–100 20 4.5 N P 0–150 4.5 N30-107-32aca01 32aca01 423140109370301 42°31ʹ40.4ʺ 109°37ʹ20.8ʺ Sublette STO FRSO FSAC 10/14/1966 7,321 222 135.92 7,185 -- 06/28/2012 233 199–228 29 6 S P -0.5–233 6 S
30-108-19cb 01 19cb 01 423312109461701 42°33ʹ11.5ʺ 109°46ʹ16.6ʺ Sublette STO EOCN UND NA 7,278 339 171.2 7,107 -- 06/27/2012 NA NA -- -- -- -- -2–NA 6 S30-108-21bda01 21bda01 423325109433501 42°33ʹ25.3ʺ 109°43ʹ35.5ʺ Sublette STO/MIN WSTC WZWA NA 7,300 504 68.71 7,231 -- 07/10/2014 NA NA -- -- -- -- -1.1–NA 6 S30-109-05ada01 05ada01 423622109510301 42°36ʹ14.9ʺ 109°51ʹ04.1ʺ Sublette STO WSTC WZWA 01/01/1960 6,852 450 -- E6,862 F 07/09/2014 NA NA -- -- -- -- 0–NA 4 S30-109-19cab01 19cab01 423320109525701 42°33ʹ38.5ʺ 109°52ʹ59.7ʺ Sublette STO WSTC WZWA 03/27/1974 7,171 555 314.42 6,857 -- 06/28/2012 555 29325–550 2925 297; 5.5 S P 29-0.78–555 297; 5.5 S30-110-08ba 01 08ba 01 423555109584701 42°35ʹ54.5ʺ 109°58ʹ52.7ʺ Sublette STO FRSO FSAC 07/15/1971 7,150 397 314.86 6,835 -- 07/09/2014 397 375–395 20 -- S P -0.65–395 7 S30-110-22aaa01 22aaa01 423405109554901 42°34ʹ05.1ʺ 109°55ʹ48.6ʺ Sublette OBS ALVM QA 08/24/2010 6,813 16 3.17 6,810 A 07/09/2014 22 6–16 10 4 K P 0–16 4 K30-110-22aaa02 22aaa02 423405109554902 42°34ʹ05.1ʺ 109°55ʹ48.7ʺ Sublette OBS WSTC WZWA 08/25/2010 6,813 200 -14.95 6,828 F 09/27/2010 210 160–200 40 4 R R 0–160 4 S30-111-03adc01 03adc01 423638110030101 42°36ʹ37.7ʺ 110°03ʹ01.0ʺ Sublette DOM WSTC WZWA NA 6,870 425 13.00 6,857 R 09/13/2010 NA NA -- -- -- -- 6–NA 6 S31-108-13daa01 13daa01 423913109392701 42°39ʹ18.4ʺ 109°39ʹ24.1ʺ Sublette STO FRSO FSAC 06/30/1967 7,230 251 91.7 7,138 -- 07/09/2014 251 3092–250 3069 6 S P -1.2–251 6 S31-110-26cdb01 26cdb01 423733109552401 42°37ʹ46.5ʺ 109°55ʹ24.7ʺ Sublette STO WSTC WZWA 06/15/1965 7,085 400 223.02 6,862 R 07/09/2014 400 365–388 23 6 S P -0.55–400 6 S
1Figure 10 shows only 84 of 93 wells listed in appendix 1 (see text).2Four open intervals in well, 687–720; 1,012–1,044; 1,173–1,206; and 1,324–1,334 feet.3Plan to set 4-inch liner 211–500 feet noted on 6/9/1965; originally open interval was not cased.4Original well completion had 6.62-inch steel casing to 100 feet, which was perforated from 43 to 59 feet. The remaining 90 feet of the hole, 100–190 feet, was not
cased. At some point, 4-inch diameter PVC casing was added, the extent and open interval of that casing is unknown.5Two open intervals in well, 170–190 and 480–618 feet.6Two open intervals in well, 60–80 and 280–310 feet.7Two open intervals in well, 190–220 and 280–316 feet.8Six open intervals in well, 75–100, 175–200, 275–300, 475–500, 775–800, and 1,050–1,100 feet.9Three open intervals in well, 435–455, 500–520, and 545–585 feet.10Two open intervals in well, 520–580 and 740–860 feet.11Five open intervals in well, 480–500, 520–540, 560–580, 600–620, and 640–660 feet.12Surface casing is 6.62-inch steel from 0–98 feet; 5-inch PVC casing is installed from 97 to 157 feet.13Two open intervals in well, 270–290 and 310–330 feet.14Casing is 7-inch steel from -2 to 409 feet and 4.5-inch steel from 105 to 1,042 feet.151956 well form indicates first opening at 190 feet; 1965 form indicates open hole 190–218 feet. Permit indicated well cased to 219 feet with gravel pack and
unknown perforations.16Casing from 230 to 420 is recorded as 6-inch diameter “pumping pipe.”
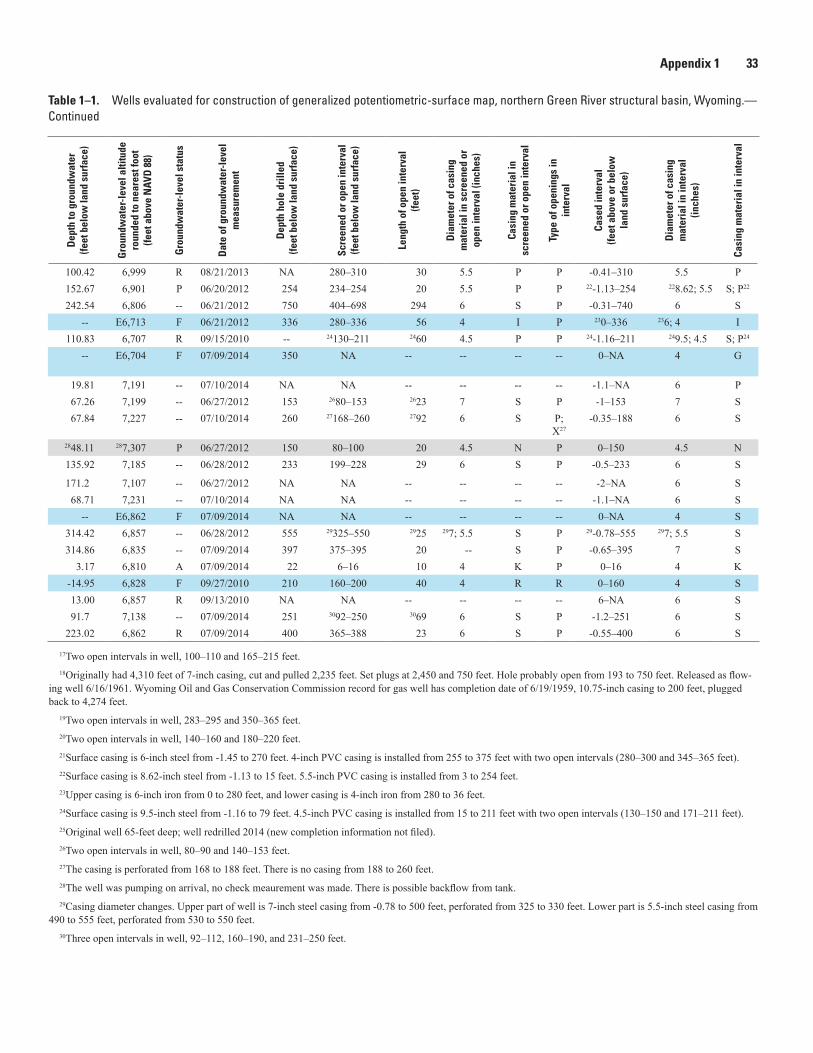
Appendix 1 33
USG
S st
atio
n na
me
Site
iden
tifie
r (fig
. 10)
1
USG
S
site
-ide
ntifi
catio
n
num
ber
Latit
ude
(DM
S)
Long
itude
(DM
S)
Coun
ty
Use
of w
ater
Lith
ostr
atig
raph
ic u
nit
Hyd
roge
olog
ic u
nit
Dat
e of
wel
l con
stru
ctio
n
(mon
th/d
ay/y
ear)
Land
-sur
face
alti
tude
(fe
et a
bove
NAV
D 8
8)
Dep
th o
f wel
l (fe
et b
elow
land
sur
face
)
Dep
th to
gro
undw
ater
(fe
et b
elow
land
sur
face
)
Gro
undw
ater
-lev
el a
ltitu
de
roun
ded
to n
eare
st fo
ot
(feet
abo
ve N
AVD
88)
Gro
undw
ater
-lev
el s
tatu
s
Dat
e of
gro
undw
ater
-lev
el
mea
sure
men
t
Dep
th h
ole
drill
ed
(feet
bel
ow la
nd s
urfa
ce)
Scre
ened
or o
pen
inte
rval
(fe
et b
elow
land
sur
face
)
Leng
th o
f ope
n in
terv
al
(feet
)
Dia
met
er o
f cas
ing
m
ater
ial i
n sc
reen
ed o
r op
en in
terv
al (i
nche
s)
Casi
ng m
ater
ial i
n sc
reen
ed o
r ope
n in
terv
al
Type
of o
peni
ngs
in
inte
rval
Case
d in
terv
al
(feet
abo
ve o
r bel
ow
land
sur
face
)
Dia
met
er o
f cas
ing
m
ater
ial i
n in
terv
al
(inch
es)
Casi
ng m
ater
ial i
n in
terv
al
29-109-23cd 01 23cd 01 422747109481601 42°27ʹ46.9ʺ 109°48ʹ15.7ʺ Sublette STO FRSO FSAC 05/25/1995 7,099 316 100.42 6,999 R 08/21/2013 NA 280–310 30 5.5 P P -0.41–310 5.5 P29-109-33ddb01 33ddb01 422618109500401 42°26ʹ17.9ʺ 109°50ʹ04.1ʺ Sublette STO FRSO FSAC 11/17/1992 7,054 253 152.67 6,901 P 06/20/2012 254 234–254 20 5.5 P P 22-1.13–254 228.62; 5.5 S; P22
29-110-22bcd01 22bcd01 422838109564501 42°28ʹ37.9ʺ 109°56ʹ45.0ʺ Sublette UNMIN WSTC WZWA 11/24/2003 7,049 750 242.54 6,806 -- 06/21/2012 750 404–698 294 6 S P -0.31–740 6 S29-111-28dca01 28dca01 422740110041701 42°27ʹ39.8ʺ 110°04ʹ17.3ʺ Sublette STO WSTC WZWA 12/22/1970 6,703 336 -- E6,713 F 06/21/2012 336 280–336 56 4 I P 230–336 236; 4 I29-111-29ddb01 29ddb01 422745110052201 42°27ʹ45.3ʺ 110°05ʹ21.5ʺ Sublette DOM WSTC WZWA 08/03/1995 6,818 217.84 110.83 6,707 R 09/15/2010 -- 24130–211 2460 4.5 P P 24-1.16–211 249.5; 4.5 S; P24
29-111-33abb01 33abb01 422726110042901 42°27ʹ31.8ʺ 110°04ʹ33.0ʺ Sublette DOM/STO
WSTC WZWA 04/07/1947 6,694 350 -- E6,704 F 07/09/2014 350 NA -- -- -- -- 0–NA 4 G
30-107-02add02 02add02 423557109333501 42°35ʹ57.2ʺ 109°33ʹ35.0ʺ Sublette STO EOCN UND 2014 7,211 NA25 19.81 7,191 -- 07/10/2014 NA NA -- -- -- -- -1.1–NA 6 P30-107-06ddb01 06ddb01 423539109382201 42°35ʹ39.5ʺ 109°38ʹ23.4ʺ Sublette STO FRSO FSAC 12/06/1960 7,266 147 67.26 7,199 -- 06/27/2012 153 2680–153 2623 7 S P -1–153 7 S30-107-13cba01 13cba01 423408109331501 42°34ʹ04.4ʺ 109°33ʹ18.3ʺ Sublette UNSTO FRSO FSAC 07/05/1941 7,295 250 67.84 7,227 -- 07/10/2014 260 27168–260 2792 6 S P;
X27-0.35–188 6 S
30-107-24bdb01 24bdb01 423328109330901 42°33ʹ27.5ʺ 109°33ʹ09.0ʺ Sublette STO CDBF WZWA 05/08/2007 7,355 150 2848.11 287,307 P 06/27/2012 150 80–100 20 4.5 N P 0–150 4.5 N30-107-32aca01 32aca01 423140109370301 42°31ʹ40.4ʺ 109°37ʹ20.8ʺ Sublette STO FRSO FSAC 10/14/1966 7,321 222 135.92 7,185 -- 06/28/2012 233 199–228 29 6 S P -0.5–233 6 S
30-108-19cb 01 19cb 01 423312109461701 42°33ʹ11.5ʺ 109°46ʹ16.6ʺ Sublette STO EOCN UND NA 7,278 339 171.2 7,107 -- 06/27/2012 NA NA -- -- -- -- -2–NA 6 S30-108-21bda01 21bda01 423325109433501 42°33ʹ25.3ʺ 109°43ʹ35.5ʺ Sublette STO/MIN WSTC WZWA NA 7,300 504 68.71 7,231 -- 07/10/2014 NA NA -- -- -- -- -1.1–NA 6 S30-109-05ada01 05ada01 423622109510301 42°36ʹ14.9ʺ 109°51ʹ04.1ʺ Sublette STO WSTC WZWA 01/01/1960 6,852 450 -- E6,862 F 07/09/2014 NA NA -- -- -- -- 0–NA 4 S30-109-19cab01 19cab01 423320109525701 42°33ʹ38.5ʺ 109°52ʹ59.7ʺ Sublette STO WSTC WZWA 03/27/1974 7,171 555 314.42 6,857 -- 06/28/2012 555 29325–550 2925 297; 5.5 S P 29-0.78–555 297; 5.5 S30-110-08ba 01 08ba 01 423555109584701 42°35ʹ54.5ʺ 109°58ʹ52.7ʺ Sublette STO FRSO FSAC 07/15/1971 7,150 397 314.86 6,835 -- 07/09/2014 397 375–395 20 -- S P -0.65–395 7 S30-110-22aaa01 22aaa01 423405109554901 42°34ʹ05.1ʺ 109°55ʹ48.6ʺ Sublette OBS ALVM QA 08/24/2010 6,813 16 3.17 6,810 A 07/09/2014 22 6–16 10 4 K P 0–16 4 K30-110-22aaa02 22aaa02 423405109554902 42°34ʹ05.1ʺ 109°55ʹ48.7ʺ Sublette OBS WSTC WZWA 08/25/2010 6,813 200 -14.95 6,828 F 09/27/2010 210 160–200 40 4 R R 0–160 4 S30-111-03adc01 03adc01 423638110030101 42°36ʹ37.7ʺ 110°03ʹ01.0ʺ Sublette DOM WSTC WZWA NA 6,870 425 13.00 6,857 R 09/13/2010 NA NA -- -- -- -- 6–NA 6 S31-108-13daa01 13daa01 423913109392701 42°39ʹ18.4ʺ 109°39ʹ24.1ʺ Sublette STO FRSO FSAC 06/30/1967 7,230 251 91.7 7,138 -- 07/09/2014 251 3092–250 3069 6 S P -1.2–251 6 S31-110-26cdb01 26cdb01 423733109552401 42°37ʹ46.5ʺ 109°55ʹ24.7ʺ Sublette STO WSTC WZWA 06/15/1965 7,085 400 223.02 6,862 R 07/09/2014 400 365–388 23 6 S P -0.55–400 6 S
17Two open intervals in well, 100–110 and 165–215 feet.18Originally had 4,310 feet of 7-inch casing, cut and pulled 2,235 feet. Set plugs at 2,450 and 750 feet. Hole probably open from 193 to 750 feet. Released as flow-
ing well 6/16/1961. Wyoming Oil and Gas Conservation Commission record for gas well has completion date of 6/19/1959, 10.75-inch casing to 200 feet, plugged back to 4,274 feet.
19Two open intervals in well, 283–295 and 350–365 feet.20Two open intervals in well, 140–160 and 180–220 feet.21Surface casing is 6-inch steel from -1.45 to 270 feet. 4-inch PVC casing is installed from 255 to 375 feet with two open intervals (280–300 and 345–365 feet).22Surface casing is 8.62-inch steel from -1.13 to 15 feet. 5.5-inch PVC casing is installed from 3 to 254 feet.23Upper casing is 6-inch iron from 0 to 280 feet, and lower casing is 4-inch iron from 280 to 36 feet.24Surface casing is 9.5-inch steel from -1.16 to 79 feet. 4.5-inch PVC casing is installed from 15 to 211 feet with two open intervals (130–150 and 171–211 feet).25Original well 65-feet deep; well redrilled 2014 (new completion information not filed).26Two open intervals in well, 80–90 and 140–153 feet.27The casing is perforated from 168 to 188 feet. There is no casing from 188 to 260 feet.28The well was pumping on arrival, no check meaurement was made. There is possible backflow from tank.29Casing diameter changes. Upper part of well is 7-inch steel casing from -0.78 to 500 feet, perforated from 325 to 330 feet. Lower part is 5.5-inch steel casing from
490 to 555 feet, perforated from 530 to 550 feet.30Three open intervals in well, 92–112, 160–190, and 231–250 feet.
Table 1–1. Wells evaluated for construction of generalized potentiometric-surface map, northern Green River structural basin, Wyoming.—Continued

Publishing support provided by: Rolla Publishing Service Center
For more information concerning this publication, contact: Director, Wyoming-Montana Water Science Center U.S. Geological Survey 3162 Bozeman Ave Helena, MT 59601 (406) 457-5900
Or visit the Wyoming-Montana Water Science Center Web site at: http://wy-mt.water.usgs.gov/

Back cover. Upper left photograph: Measurement of groundwater level in a stock well. The windmill is located directly above the well and provides the power to operate the pump in the well. Water removed from the well is pumped into the water storage device constructed of corrugated steel located left of the well. Photograph by Sarah Davis, U.S. Geological Survey. Upper right photograph: Flowing stock well providing water to livestock. Photograph by Sarah Davis, U.S. Geological Survey. Lower right photograph: Measurement of groundwater level in a stock well. Corrugated steel culvert has been used to surround and protect the wellhead. Water pumped from the well is delivered to the stock trough on the left side of the photograph via the steel pipe coming out of the left side of the corrugated culvert. Photograph by Michelle Taylor, formerly of the U.S. Geological Survey. Bottom center photograph: Stock well, stock troughs, and storage tank. Water from many stock wells in the Green River structural basin is pumped into storage tanks to provide water for later use. Hillside in the background of the photograph is composed of fine-grained rocks of the Laney Member of the Green River Formation. Photograph by Michelle Taylor, formerly of the U.S. Geological Survey.

Bartos and others—Generalized Potentiom
etric-Surface Map of the Green River Basin Low
er Tertiary Aquifer System, 2010–14—
SIR 2015–5090
ISSN 2328-0328 (online)http://dx.doi.org/10.3133/sir20155090


