

Lawrence�
Livermore�
National�
Laboratory
UCRL-CR-129838
Hydrous Pyrolysis of Pole Treating Chemicals:
A) Initial Measurment of Hydrous Pyrolysis Rates for Napthalene and Pentachlorophenol;
B) Solubility of Flourene at Temperatures Up To 150°C
Prepared for the Southern California Edison Co.
Roald N. LeifRoger D. Aines
Kevin G. Knauss
November 15, 1997

DISCLAIMER
This document was prepared as an account of work sponsored by an agency of the United StatesGovernment. Neither the United States Government nor the University of California nor any of theiremployees, makes any warranty, express or implied, or assumes any legal liability or responsibility forthe accuracy, completeness, or usefulness of any information, apparatus, product, or process disclosed,or represents that its use would not infringe privately owned rights. Reference herein to any specificcommercial product, process, or service by trade name, trademark, manufacturer, or otherwise, doesnot necessarily constitute or imply its endorsement, recommendation, or favoring by the United StatesGovernment or the University of California. The views and opinions of authors expressed herein donot necessarily state or reflect those of the United States Government or the University of California,and shall not be used for advertising or product endorsement purposes.
Work performed under the auspices of the U.S. Department of Energy by Lawrence Livermore NationalLaboratory under Contract W-7405-ENG-48.

2
Abstract
The temperature dependencies of the hydrous pyrolysis/oxidation (HPO) aqueous phase
oxidation reactions of naphthalene and pentachlorophenol have been determined for phosphate
buffered systems using Dickson-type reaction vessels. The HPO experimental temperatures
ranged from 114°C to 148°C for naphthalene and 114°C to 137°C for pentachlorophenol. The loss
of the organic species was used to determine activation energies of 95.8 kJ/mole for naphthalene
oxidation and 84.8 kJ/mole for pentachlorophenol oxidation. Aqueous concentrations of target
compounds and reaction intermediates were determined by gas chromatography and compound
identification was verified by gas chromatography - mass spectrometry. During the experiments
the pollutants were completely mineralized, as indicated by a stoichiometric production of inorganic
carbon in the case of naphthalene and inorganic carbon and chloride in the case of
pentachlorophenol. HPO of pentachlorophenol produced 2,3,5,6-tetrachlorophenol as an
intermediate, whereas no intermediates amenable by GC were observed during the HPO of
naphthalene.
Measurements of the aqueous solubility of fluorene in an unbuffered solution have been
made covering the temperature range from 20°C to 150°C. There is very good agreement between
this data set and data previously published covering the lower temperature range (20°C to 75°C).
Extension of the solubility measurements to higher temperatures covers the in situ temperatures
achievable during field application of HPO and demonstrated a nearly exponential rise in aqueous
solubility as a function of temperature, with a 10 fold increase in aqueous fluorene solubility going
from 75°C to 125°C and a 20 fold increase in going from 75°C to 150°C.
Introduction
Southern California Edison's Visalia Pole Yard site is currently contaminated with a
DNAPL mixture composed of pole-treating creosote and an oil-based carrier fluid containing
pentachlorophenol. Bioremediation of these organic pollutants is extremely slow and therefore
thermal treatment of the site, such as used in the recent Dynamic Underground Stripping (DUS)
demonstration (Newmark and Aines, 1995), is being used for removal of the free product. As part
of the final removal process, Southern California Edison has also implemented HPO, an in situ
method of destroying organic contaminants using stoichiometric amounts of supplemental oxygen
in the form of injected air. Their primary need for HPO is for the destruction of residual DNAPL
components not readily removed by the DUS process.

3
During Fiscal Year 1996, initial laboratory-based feasibility experiments were conducted to
investigate the HPO of actual DNAPL material with excess dissolved O2 under conditions similar
to those achievable during thermal remediation. The experiments demonstrated that dissolved O2
readily reacted with the compounds present in the DNAPL mixture, also known as BYS, to form
partially oxidized products ranging from oxygenated intermediates, such as phenols and carboxylic
acids (Fig. 1), to the fully oxidized product CO2 (Fig. 2). Next, a series of experiments was
initiated to study the rates of HPO for the two model compounds naphthalene and
pentachlorophenol. Naphthalene is the most abundant component in the PAH class of compounds
that makes up BYS and pentachlorophenol is a fungicide/pesticide that was used as a wood
treatment preservative and also present in the BYS. The initial emphasis was on determining the
rate dependency on dissolved O2 at temperatures (100° and 125°C) easily achieved in thermal
remediation. We found that at dissolved O2 concentrations as high or higher than the stoichiometric
amount required to oxidize the dissolved naphthalene or pentachlorophenol, the rates were
independent of O2 concentration.
In addition to the HPO study, experiments were begun to measure the aqueous solubility of
naphthalene as a function of temperature. Results from the naphthalene solubility experiments are
shown in Fig. 3. Sampling difficulties occurred above 50°C. The large scatter in the data above
50°C was most likely caused by an unheated transfer tube from the vessel to the sampling valve
causing the naphthalene to come out of solution during sampling. Another potential problem for
naphthalene high temperature aqueous solubility runs was neutrally buoyant aqueous and organic
phases. At temperatures greater than 80°C, the density of naphthalene and the density of water
approach each other, and at 100°C the densities are equivalent at 0.96 g/cm3. Because naphthalene
becomes neutrally buoyant near 100°C, it is not possible to obtain meaningful samples for aqueous
solubility measurements in this temperature range using the present experimental design.
As a result of the above difficulties, high temperature aqueous solubility measurements for
naphthalene were suspended and another set of high temperature aqueous solubility measurements
was begun for fluorene. The difficulty of a neutrally buoyant analyte is avoided with fluorene and
all subsequent solubility experiments were run with a heated transfer line. The aqueous solubility
of fluorene was measured to 100°C, extending the solubility measurements beyond the maximum
temperature of 75°C reported by Wauchope and Getzen (1972).
During Fiscal Year 1997 we extended the investigation into the study of the kinetics of
HPO destruction for the two model compounds naphthalene and pentachlorophenol. We also
extended the measurement of high temperature aqueous fluorene solubility to 150°C. This report
describes the procedures and results from FY97.

4
Methods
Preparation of stock solutions
The naphthalene and pentrachlorophenol HPO experiments were run in aqueous solutions
buffered at a pH of 7 using an inorganic phosphate buffer. All stock solutions were made using
deionized water and aerated for 15 minutes by bubbling with air to ensure the stock solutions start
with initial dissolved oxygen concentrations of approximately 8 ppm. To ensure that the
naphthalene and pentachlorophenol HPO experiments had stoichiometric excesses of oxygen, solid
naphthalene was added in amounts not exceeding aqueous concentrations of 2.7 ppm, and
pentachlorophenol was added in amounts not exceeding aqueous concentrations of 14.8 ppm. The
stock solutions were loaded in the reaction vessels after the organic compounds became fully
dissolved in the water.
The fluorene solubility experiments were run in deionized water and required no solution
preparation. Typically, 2.5 g of solid fluorene was added to a vessel containing about 230g of
deionized water.
Vessel sampling protocol
The static autoclave experiments are run in Dickson-type, gold-bag rocking autoclaves. The
reaction vessels use a flexible gold bag sealed with a high purity titanium head and are contained
within a large super-alloy steel pressure vessel. The vessel is loaded into a furnace capable of being
continuously rocked through a 180° arc. Their design allows periodic sampling of the reaction cell
under in situ conditions throughout the course of an experiment without disturbing the temperature
and pressure of the run. Experimental pressure is held at a constant pressure by adding or
removing distilled water from around the sealed gold bag using a precise constant pressure HPLC
syringe pump at a total pressure of 500 psi, sufficient to keep the system single phase. Therefore
no headspace gas is present and all gases remain dissolved in the liquid phase. This makes
sampling, and subsequent mass balance calculations, significantly easier. During the experiment
the solution contacts only Au and passivated Ti so that unwanted surface catalytic effects are
eliminated. The sampled fluids and dissolved gases were analyzed using a variety of analytical
techniques described below.
Analytical
Gas Chromatography . Laboratory analyses of the aqueous organic compounds were
conducted on a Hewlett-Packard 5890 gas chromatograph equipped with an flame ionization
detector. Samples were introduced by direct injection mode on a 30 m (0.53 mm i.d.) fused silica
capillary column coated with methylpolysiloxane (DB-5, J & W Scientific; film thickness 0.5 µm).

5
The GC oven temperature was programmed at isothermal for 2 min. at 60˚C, 12˚C/min. to 270˚C,
and isothermal for 2 min. with helium as the carrier gas. Data were acquired and integrated using
the Hewlett Packard Chemstation software. Quantitation was done using a multilevel external
standard calibration curve.
Gas chromatography-mass spectrometry . Gas chromatography-mass spectrometry (GC-
MS) was performed on a Hewlett Packard 6890 gas chromatograph equipped with a 30 m x 0.25
mm i.d. HP-5ms (5% phenylmethylsiloxane) capillary column (0.25 µm film thickness) coupled to
a Hewlett Packard 6890 Series Mass Selective Detector (MSD) operated at 70 eV over the mass
range 35-450 dalton and a cycle time of 1.1 s. The GC oven temperature was programmed at
isothermal for 2 min. at 50˚C, 8˚C/min. to 300˚C, and isothermal for 6.75 min., with the injector
at 250˚C, and helium as the carrier gas. The MS data were processed with an on-line Hewlett
Packard personal computer. Quantitation was done using relative response factors of internal
standards.
Ion Chromatography . Chloride was determined using a Hewlett Packard 1090M HPLC
coupled to a Waters 431 conductivity detector. Data were processed using an on-line Hewlett
Packard personal computer using Chemstation software.
Total Inorganic Carbon . Samples submitted total inorganic analysis were analyzed using
an OI Model 524 analyzer. A weighed sample was injected in a purge vessel containing a 25%
phosphoric acid solution which is continuously purged with nitrogen gas. The dissolved inorganic
carbon is converted to CO2 and swept into a non-dispersive infrared detector where the total
inorganic carbon, in the form of carbon dioxide, is measured.
Dissolved Oxygen . Dissolved oxygen in the naphthalene and pentachlorophenol HPO
experiments was measured using Microelectrodes Inc. Model OM-4 oxygen membrane sensor.
The sampled were allowed to come to room temperature in a gas-tight syringe before measureing
dissolved oxygen to avoid drift due to temperature differences.
Results and Discussion
Oxidation of Naphthalene
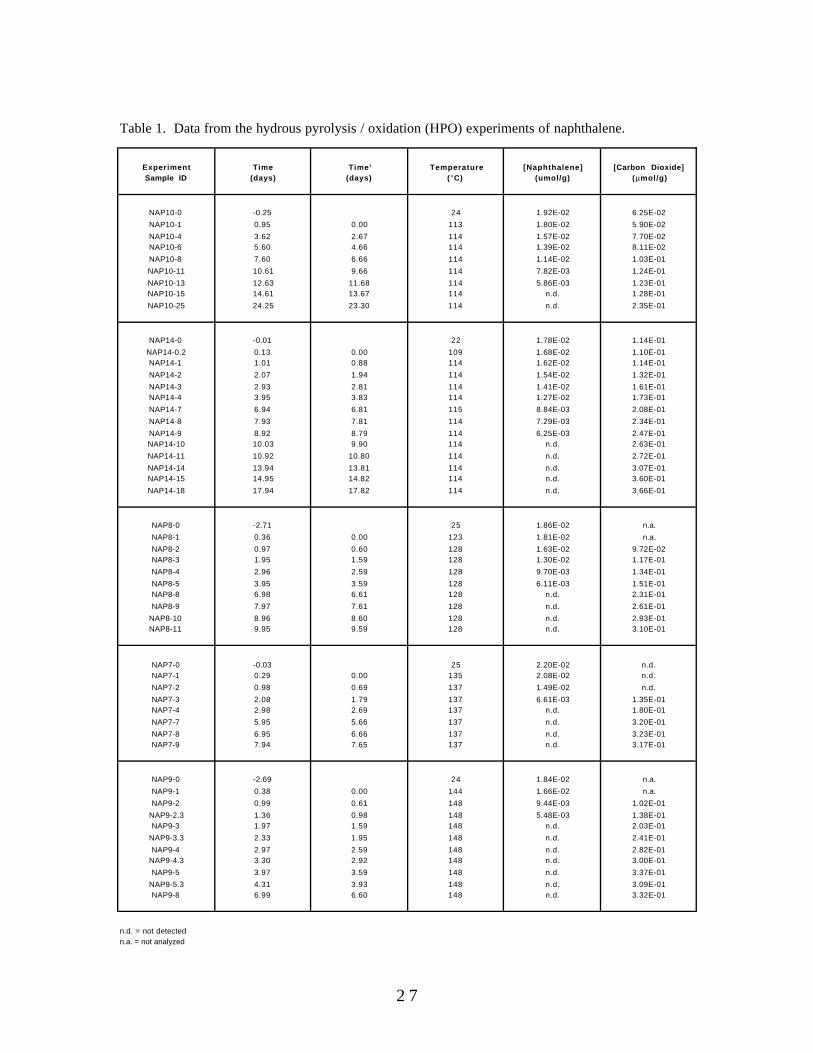
The experiments used to generate the Arrhenius plot for naphthalene oxidation are listed in
Table 1. This set of experiments consists of five experiments at four different temperatures
spanning a temperature range from 114°C to 148°C. Replicate experiments were performed at
114°C. Table 1 reports all the data as a function of time for the five experiments. The data in Table
1 is presented in graphical form for each of the five experiments in Fig. 4 to Fig. 8. Fig. 9 is a plot
of naphthalene concentration as a function of time for the five experiments. The slope of the plot

6
of [naphthalene] vs. time at t=0 is by definition the initial rate of the reaction. Because the data
points for each individual experiment were fairly linear, the initial rates were determined using data
points of naphthalene concentrations as low as 5 x10⁻⁶ mol/kg. Fig. 10 is the Arrhenius plot
generated from the rates calculated from the plots in Fig. 9. The activation energy under these
conditions was determined to be 95.8 kJ/mol.
Oxidation of Pentachlorophenol
The experiments used to generate the Arrhenius plot for pentachlorophenol oxidation are
listed in Table 2. This set of experiments consists of three experiments at three different
temperatures spanning a temperature range from 114°C to 137°C. Table 2 reports all the data as a
function of time for the three experiments. The data in Table 2 is presented in graphical form for
each of the three experiments in Fig. 11 to Fig. 13. Fig. 14 is a plot of pentachlorophenol
concentration as a function of time for the three experiments. The slope of the plot of aqueous
pentachlorophenol concentration vs. time at t=0 (initial rate of the reaction) was determined using
the method of Chandler et al. (1987) by fitting the concentration-time data to a polynomial
expression and calculating the slope of the tangent at t=0. Fig. 15 is the Arrhenius plot generated
from the rates calculated from the plots in Fig. 14. The activation energy under these conditions
was determined to be 84.8 kJ/mol. The data set for the HPO of pentachlorophenol is presently
being supplemented and refined by additional experiments.
High Temperature Aqueous Solubility of Fluorene
The experimental results used to generate the fluorene aqueous solubility plot are listed in
Table 3. The data listed in Table 3 is plotted in Fig. 16 and the symbols indicate from which
direction the equilibrium concentration was approached, either from under-saturation or over-
saturation. There was good agreement between the two data sets at each temperature and therefore
indicates that the reported values represent the equilibrium solubility of fluorene at the selected
temperatures. Fig. 17 is a plot of aqueous fluorene solubility vs. temperature at the lower
temperature range for literature data and measurements from this study.
Summary
Data have been reported for the HPO destruction rates for naphthalene and
pentachlorophenol, components that are representative of two compound classes present in the
soils and groundwater of the Southern California Edison poleyard complex in Visalia, Ca. High
temperature aqueous solubility values for fluorene have also been measured up to 150°C. The

7
reported data contribute to a better fundamental understanding of the aqueous geochemistry of
these organic compounds and are valuable for assessing the behavior of these compounds when
subjected to field HPO conditions.
References
Chandler W. D., Lee, E. J. and Lee D. G. (1987) Computer-assisted analysis of reaction rate
data. J. Chem. Ed. 64, 878-881.
Mackay D. and Shui W. Y. (1977) Aqueous solubility of polynuclear aromatic hydrocarbons. J.
Chem. Eng. Data 22, 399-402.
May W. E., Wasik S. P. and Freeman D. H. (1978) Determination of the solubility behavior of
some polycyclic aromatic hydrocarbons in water. Anal. Chem. 50, 997-1000.
Newmark R. L. and Aines R. D. (1995) Summary of the LLNL gasoline spill demonstration -
Dynamic Underground Stripping Project. Lawrence Livermore National Laboratory,
UCRL-ID-120416.
Wauchope R. D. and Getzen F. W. (1972) Temperature dependence of solubilities in water and
heats of fusion of solid aromatic hydrocarbons. J. Chem. Eng. Data 17, 38-41.

8
List of Tables
Table 1. Data from the hydrous pyrolysis / oxidation (HPO) experiments of naphthalene.
Table 2. Data from the hydrous pyrolysis / oxidation (HPO) experiments of pentachlorophenol.
Table 3. Data from the aqueous solubility measurements of fluorene.

9
List of Figures
Figure 1. Organic compounds in pole tar experiments, measured by EPA method 8270A.
Figure 2. Oxygen consumption and carbon dioxide production during pole tar experiment BYS02.
Figure 3. Aqueous solubility measurements of naphthalene vs. temperature from experimentsNPS01 and NPS02.
Figure 4. Naphthalene destruction and carbon dioxide production during HPO experiment NAP10(114°C).
Figure 5. Naphthalene destruction and carbon dioxide production during HPO experiment NAP14(114°C).
Figure 6. Naphthalene destruction and carbon dioxide production during HPO experiment NAP08(128°C).
Figure 7. Naphthalene destruction and carbon dioxide production during HPO experiment NAP07(137°C).
Figure 8. Naphthalene destruction and carbon dioxide production during HPO experiment NAP09(148°C).
Figure 9. Summary plot of naphthalene destruction during HPO experiments (114°C to 148°C).
Figure 10. Arrhenius plot of naphthalene destruction during HPO experiments (114°C to 148°C).
Figure 11. Concentrations of pentachlorophenol, 2,3,5,6-tetrachlorophenol, carbon dioxide andchloride ion during HPO experiment PCP08 (114°C).
Figure 12. Concentrations of pentachlorophenol, 2,3,5,6-tetrachlorophenol, carbon dioxide andchloride ion during HPO experiment PCP07 (124°C).
Figure 13. Concentrations of pentachlorophenol, 2,3,5,6-tetrachlorophenol, carbon dioxide andchloride ion during HPO experiment PCP09 (137°C).
Figure 14. Summary plot of pentachlorophenol destruction during HPO experiments (114°C to137°C).
Figure 15. Arrhenius plot of pentachlorophenol destruction during HPO experiments (114°C to137°C).
Figure 16. Aqueous solubility measurements of fluorene vs. temperature from experimentsFLU02, FLU03, FLU04 and FLU06.
Figure 17. Aqueous solubility measurements of fluorene vs. temperature (20°C to 75°C).

1 0
0
1000
2000
3000
4000
5000
6000
7000
Ph
en
ol
2-M
eth
ylp
he
no
l
4-M
eth
ylp
he
no
l
2,4
-Dim
eth
ylp
he
no
l
Ben
zoic
Aci
d
Na
ph
tha
len
e
2-M
eth
yln
ap
hth
ale
ne
Ac
en
ap
hth
en
e
Dib
en
zofu
ran
Flu
ore
ne
Ph
en
an
thre
ne
An
thra
ce
ne
Flu
ora
nth
en
e
Py
ren
e
Be
nzo
[a]a
nth
rac
en
e
Ch
rys
en
e
Unreacted
Partially Reacted
Fully Reacted
Aq
ueo
us
Co
nce
ntr
atio
n (
ug
/L)
Production of PartiallyOxidized Intermediates
Destruction of PolycyclicAromatic Hydrocarbons
Note : All compounds were belowdetection limit after complete reaction at 120°C
Oxidative Destruction of Aqueous Creosote Components
Figure 1. Organic compounds in pole tar experiments, measured by EPA method 8270A.

1 1
0 .0
5 .0
10 .0
15 .0
20 .0
0 5 1 0 1 5 2 0 2 5 3 0 3 5
HPO - Neat BYS Dissolved in WaterBYS02
pH = 6.6 to 3.0, T = 70°C to 120°C
[CO2]
[O2]
Co
nce
ntr
atio
n -
(u
mo
l/g
)
Time (d)
7 0 ° C 9 0 ° C 100 °C 120 °C
Figure 2. Oxygen consumption and carbon dioxide production during pole tar experiment BYS02.

1 2
0
1 0 0
2 0 0
3 0 0
4 0 0
5 0 0
2 0 4 0 6 0 8 0 1 0 0 1 2 0
Aqueous Solubility of Naphthalene
approach from undersaturationWauchope and Getzen (1972)
[Nap
hth
alen
e] -
(m
g/k
g)
Temp. (°C)
Figure 3. Aqueous solubility measurements of naphthalene vs. temperature from experimentsNPS01 and NPS02.

1 3
0.000
0 .005
0 .010
0 .015
0 .020
0 .025
0 .00
0 .05
0 .10
0 .15
0 .20
0 .25
0 5 1 0 1 5 2 0 2 5
HPO - NaphthaleneNAP10
pH = 7, T = 114°C
[Naphthalene] [CO2]
[Nap
hth
alen
e] -
(u
mo
l/g
)
[CO
2 ] - (um
ol/g
)
Time (d)
Figure 4. Naphthalene destruction and carbon dioxide production during HPO experiment NAP10(114°C).

1 4
0.000
0 .010
0 .020
0 .030
0 .040
0 .050
0 .00
0 .10
0 .20
0 .30
0 .40
0 .50
0 5 1 0 1 5 2 0
HPO - NaphthaleneNAP14
pH = 7, T = 114°C
[Naphthalene] [CO2]
[Nap
hth
alen
e] -
(u
mo
l/g
)
[CO
2 ] - (um
ol/g
)
Time (d)
Figure 5. Naphthalene destruction and carbon dioxide production during HPO experiment NAP14(114°C).

1 5
0.000
0 .010
0 .020
0 .030
0 .040
0 .00
0 .10
0 .20
0 .30
0 .40
0 2 4 6 8 1 0
HPO - NaphthaleneNAP08
pH = 7, T = 128°C
[Naphthalene] [CO2]
[Nap
hth
alen
e] -
(u
mo
l/g
)
[CO
2 ] - (um
ol/g
)
Time (d)
Figure 6. Naphthalene destruction and carbon dioxide production during HPO experiment NAP08(128°C).

1 6
0.000
0 .010
0 .020
0 .030
0 .040
0 .00
0 .10
0 .20
0 .30
0 .40
0 1 2 3 4 5 6 7
HPO - NaphthaleneNAP07
pH = 7, T = 137°C
[NAP] - umol/g [CO2] - umol/g
[Nap
hth
alen
e] -
(u
mo
l/g
)
[CO
2 ] - (um
ol/g
)
Time (d)
Figure 7. Naphthalene destruction and carbon dioxide production during HPO experiment NAP07(137°C).

1 7
0.000
0 .010
0 .020
0 .030
0 .040
0 .00
0 .10
0 .20
0 .30
0 .40
0 1 2 3 4 5 6 7
HPO - NaphthaleneNAP09
pH = 7, T = 148°C
[Naphthalene] [CO2]
[Nap
hth
alen
e] -
(u
mo
l/g
)
[CO
2 ] - (um
ol/g
)
Time (d)
Figure 8. Naphthalene destruction and carbon dioxide production during HPO experiment NAP09(148°C).

1 8
5.00 10-6
1.00 10-5
1.50 10-5
2.00 10-5
2.50 10-5
0 500000 1 106 1.5 106
HPO - Naphthalene
NAP10 (114°C)NAP14 (114°C)NAP8 (128°C)NAP7 (137°C)NAP9 (148°C)
y = 1.8401e-05 + -1.2359e-11x R= 0.99774
y = 1.7306e-05 + -1.45e-11x R= 0.99731
y = 1.8239e-05 + -3.8675e-11x R= 0.99964
y = 2.0628e-05 + -9.1253e-11x R= 0.99941
y = 1.6536e-05 + -1.3193e-10x R= 0.99965
[Nap
hth
alen
e] -
(m
ol/
kg)
Time (s)
Figure 9. Summary plot of naphthalene destruction during HPO experiments (114°C to 148°C).

1 9
-11 .0
-10.8
-10.6
-10.4
-10.2
-10.0
-9 .8
0 .00235 0.0024 0.00245 0.0025 0.00255 0.0026
HPO - NaphthaleneArrhenius Plot
pH = 7, T = 114°C - 148°C
y = 2.0724 + -5004.9x R= 0.99062
log
rat
e (m
ol/
kg-s
)
1/T (K)
Eact
= 95.8 kJ/mole
Figure 10. Arrhenius plot of naphthalene destruction during HPO experiments (114°C to 148°C).

2 0
0 .00
0 .01
0 .02
0 .03
0 .04
0 .05
0 .06
0 .07
0 .00
0 .10
0 .20
0 .30
0 .40
0 .50
0 .60
0 .70
0 5 1 0 1 5 2 0
HPO - PentachlorophenolPCP08
pH = 7, T = 114°C
[PCP]
[TCP]
[CO2]
[Cl- ]
[PC
P]
and
[T
CP
] -
(um
ol/g
)
[CO
2 ] & [C
l -] - (um
ol/g
)
Time (d)
Figure 11. Concentrations of pentachlorophenol, 2,3,5,6-tetrachlorophenol, carbon dioxide andchloride ion during HPO experiment PCP08 (114°C).

2 1
0 .00
0 .01
0 .02
0 .03
0 .04
0 .05
0 .06
0 .00
0 .10
0 .20
0 .30
0 .40
0 .50
0 .60
0 2 4 6 8 1 0 1 2 1 4
HPO - PentachlorophenolPCP07
pH = 7, T = 124°C
[PCP]
[TCP]
[CO2]
[Cl-]
[PC
P]
and
[T
CP
] -
(um
ol/g
)
[CO
2 ] & [C
l -] - (um
ol/g
)
Time (d)
Figure 12. Concentrations of pentachlorophenol, 2,3,5,6-tetrachlorophenol, carbon dioxide andchloride ion during HPO experiment PCP07 (124°C).

2 2
0 .00
0 .01
0 .02
0 .03
0 .04
0 .05
0 .00
0 .10
0 .20
0 .30
0 .40
0 .50
0 2 4 6 8 1 0
HPO - PentachlorophenolPCP09
pH = 7, T = 137°C
[PCP]
[TCP]
[CO2]
[Cl- ]
[PC
P]
and
[T
CP
] -
(um
ol/g
) [CO
2 ] and
[Cl -] - (u
mo
l/g)
Time (d)
Figure 13. Concentrations of pentachlorophenol, 2,3,5,6-tetrachlorophenol, carbon dioxide andchloride ion during HPO experiment PCP09 (137°C).

2 3
0.00 100
1.00 10-5
2.00 10-5
3.00 10-5
4.00 10-5
5.00 10-5
6.00 10-5
0.00 100 1.00 105 2.00 105 3.00 105 4.00 105 5.00 105 6.00 105
HPO - Pentachlorophenol
PCP07 (124°C)
PCP08 (114°C)
PCP09 (137°C)
[PC
P]
- (m
ol/
kg)
Time (s)
Y = M0 + M1*x + ... M8*x8 + M9*x9
3.6086e-05M0
-2.4972e-10M1
5.7556e-16M2
0.99668R
Y = M0 + M1*x + ... M8*x8 + M9*x9
4.468e-05M0
-1.7704e-10M1
2.2465e-16M2
0.99882R
Y = M0 + M1*x + ... M8*x8 + M9*x9
3.7595e-05M0
-7.5963e-10M1
4.6158e-15M2
1R
Figure 14. Summary plot of pentachlorophenol destruction during HPO experiments (114°C to137°C).

2 4
-9 .80
-9 .70
-9 .60
-9 .50
-9 .40
-9 .30
-9 .20
-9 .10
0.0024 0.00245 0.0025 0.00255 0.0026
HPO - PentachlorophenolArrhenius Plot
pH = 7, T = 114°C - 137°C
y = 1.6369 + -4426.5x R= 0.97207
log
rat
e (m
ole
/kg
-s)
1/T (K)
Eact = 84.8 kJ/mole
Figure 15. Arrhenius plot of pentachlorophenol destruction during HPO experiments (114°C to137°C).

2 5
0
1 0 0
2 0 0
3 0 0
4 0 0
5 0 0
6 0 0
7 0 0
0 2 0 4 0 6 0 8 0 1 0 0 1 2 0 1 4 0 1 6 0
Aqueous Solubility of Fluorene
approach from oversaturationapproach from undersaturationaverage value
[Flu
ore
ne]
- (
mg
/kg
)
Temp. (°C)
FLU4-82b
FLU6-21a
Figure 16. Aqueous solubility measurements of fluorene vs. temperature from experimentsFLU02, FLU03, FLU04 and FLU06.

2 6
0
1 0
2 0
3 0
4 0
5 0
0 2 0 4 0 6 0 8 0 1 0 0
Aqueous Solubility of Fluorene
approach from oversaturationapproach from undersaturationWauchope and Getzen (1972)Mackay and Shui (1977)May et al. (1978)
[Flu
ore
ne]
- (
mg
/kg
)
Temp. (°C)
Figure 17. Aqueous solubility measurements of fluorene vs. temperature (20°C to 75°C).
2 7
Table 1. Data from the hydrous pyrolysis / oxidation (HPO) experiments of naphthalene.
Experiment Time Time' Temperature [Naphthalene] [Carbon Dioxide]Sample ID (days) (days) (°C) (umol/g) (µmol/g)
NAP10-0 -0.25 24 1.92E-02 6.25E-02
NAP10-1 0.95 0.00 113 1.80E-02 5.90E-02
NAP10-4 3.62 2.67 114 1.57E-02 7.70E-02NAP10-6 5.60 4.66 114 1.39E-02 8.11E-02
NAP10-8 7.60 6.66 114 1.14E-02 1.03E-01
NAP10-11 10.61 9.66 114 7.82E-03 1.24E-01
NAP10-13 12.63 11.68 114 5.86E-03 1.23E-01NAP10-15 14.61 13.67 114 n.d. 1.28E-01
NAP10-25 24.25 23.30 114 n.d. 2.35E-01
NAP14-0 -0.01 22 1.78E-02 1.14E-01
NAP14-0.2 0.13 0.00 109 1.68E-02 1.10E-01NAP14-1 1.01 0.88 114 1.62E-02 1.14E-01
NAP14-2 2.07 1.94 114 1.54E-02 1.32E-01
NAP14-3 2.93 2.81 114 1.41E-02 1.61E-01NAP14-4 3.95 3.83 114 1.27E-02 1.73E-01
NAP14-7 6.94 6.81 115 8.84E-03 2.08E-01
NAP14-8 7.93 7.81 114 7.29E-03 2.34E-01
NAP14-9 8.92 8.79 114 6.25E-03 2.47E-01NAP14-10 10.03 9.90 114 n.d. 2.63E-01
NAP14-11 10.92 10.80 114 n.d. 2.72E-01
NAP14-14 13.94 13.81 114 n.d. 3.07E-01NAP14-15 14.95 14.82 114 n.d. 3.60E-01
NAP14-18 17.94 17.82 114 n.d. 3.66E-01
NAP8-0 -2.71 25 1.86E-02 n.a.
NAP8-1 0.36 0.00 123 1.81E-02 n.a.
NAP8-2 0.97 0.60 128 1.63E-02 9.72E-02NAP8-3 1.95 1.59 128 1.30E-02 1.17E-01
NAP8-4 2.96 2.59 128 9.70E-03 1.34E-01
NAP8-5 3.95 3.59 128 6.11E-03 1.51E-01NAP8-8 6.98 6.61 128 n.d. 2.31E-01
NAP8-9 7.97 7.61 128 n.d. 2.61E-01
NAP8-10 8.96 8.60 128 n.d. 2.93E-01NAP8-11 9.95 9.59 128 n.d. 3.10E-01
NAP7-0 -0.03 25 2.20E-02 n.d.NAP7-1 0.29 0.00 135 2.08E-02 n.d.
NAP7-2 0.98 0.69 137 1.49E-02 n.d.
NAP7-3 2.08 1.79 137 6.61E-03 1.35E-01NAP7-4 2.98 2.69 137 n.d. 1.80E-01
NAP7-7 5.95 5.66 137 n.d. 3.20E-01
NAP7-8 6.95 6.66 137 n.d. 3.23E-01NAP7-9 7.94 7.65 137 n.d. 3.17E-01
NAP9-0 -2.69 24 1.84E-02 n.a.
NAP9-1 0.38 0.00 144 1.66E-02 n.a.
NAP9-2 0.99 0.61 148 9.44E-03 1.02E-01
NAP9-2.3 1.36 0.98 148 5.48E-03 1.38E-01NAP9-3 1.97 1.59 148 n.d. 2.03E-01
NAP9-3.3 2.33 1.95 148 n.d. 2.41E-01
NAP9-4 2.97 2.59 148 n.d. 2.82E-01NAP9-4.3 3.30 2.92 148 n.d. 3.00E-01
NAP9-5 3.97 3.59 148 n.d. 3.37E-01
NAP9-5.3 4.31 3.93 148 n.d. 3.09E-01NAP9-8 6.99 6.60 148 n.d. 3.32E-01
n.d. = not detectedn.a. = not analyzed

2 8
Table 2. Data from the hydrous pyrolysis / oxidation (HPO) experiments of pentachlorophenol.
Experiment Time Time' Temperature [Pentachlorophenol] [Tetrachlorophenol] [Carbon Dioxide] [Chloride]Sample ID (days) (days) (°C) (umol/g) (umol/g) (µmol/g) (µmol/g)
PCP8-0 -0.02 21 0.0462 n.d. n.d. n.d.
PCP8-0.2 0.21 0.00 112 0.0448 n.d. n.d. n.d.
PCP8-1 0.97 0.76 114 0.0340 0.0225 0.0540 0.0309
PCP8-2 2.11 1.90 114 0.0210 0.0403 0.0785 0.0940
PCP8-3 3.22 3.01 114 0.0149 0.0493 0.0926 0.0950
PCP8-4 3.97 3.76 114 0.0104 0.0375 0.1016 -
PCP8-4.1 4.11 3.90 114 n.a. n.a. n.a. 0.1145
PCP8-7 6.96 6.74 114 0.0079 0.0320 0.1353 0.1457
PCP8-8 8.00 7.78 114 n.d. 0.0319 0.1417 0.1598
PCP8-9 8.97 8.75 114 n.d. 0.0289 0.1637 0.1681
PCP8-10 10.13 9.92 114 n.d. 0.0248 0.1776 0.1811
PCP8-11 10.95 10.74 114 n.d. 0.0233 0.1859 0.1822
PCP8-14 13.96 13.75 114 n.d. 0.0136 0.2317 0.2244
PCP8-15 14.96 14.75 114 n.d. 0.0117 0.2382 0.2293
PCP8-16 15.95 15.74 114 n.d. 0.0065 0.2728 0.2280
PCP7-0 -2.93 23 0.0408 n.d. n.d. n.d.
PCP7-1 0.29 0.00 122 0.0366 0.0084 n.d. 0.0064
PCP7-1.7 1.04 0.75 123 0.0211 0.0360 0.0522 0.0609
PCP7-2 2.01 1.72 124 0.0127 0.0462 0.0925 0.1089
PCP7-3 3.06 2.77 124 0.0090 0.0403 0.1158 0.1390
PCP7-4 4.04 3.75 124 n.d. 0.0335 0.1388 0.1567
PCP7-7 7.01 6.72 124 n.d. 0.0191 0.2288 0.2049
PCP7-8 7.99 7.70 124 n.d. 0.0144 0.2479 0.2322
PCP7-9 8.99 8.69 124 n.d. 0.0058 0.2802 0.2404
PCP7-14 14.01 13.72 124 n.d. n.d. 0.3646 0.2843
PCP9-0 -3.00 22 0.0517 n.d. 0.0530 0.0054
PCP9-0.4 0.37 0.00 132 0.0376 0.0189 0.0734 0.0280
PCP9-1 1.01 0.64 137 0.0097 0.0376 0.1292 0.1085
PCP9-1.4 1.32 0.95 137 0.0063 0.0364 0.1547 0.1358
PCP9-2 2.03 1.66 137 0.0080 0.0235 0.2170 0.1876
PCP9-2.4 2.32 1.95 137 n.d. 0.0193 0.2482 0.2024
PCP9-3 3.19 2.82 137 n.d. 0.0078 0.3124 0.2499
PCP9-4 4.01 3.64 137 n.d. 0.0026 0.3780 0.2651
PCP9-7 7.02 6.65 137 n.d. n.d. 0.3838 0.2857
PCP9-8 8.02 7.65 137 n.d. n.d. 0.3729 0.2854
n.d. = not detected
n.a. = not analyzed

2 9
Table 3. Data from the aqueous solubility measurements of fluorene.
Experiment FLU2 Experiment FLU3 Experiment FLU4 Experiment FLU6
Sample ID T (°C) [Fluorene] Sample ID T (°C) [Fluorene] Sample ID T (°C) [Fluorene] Sample ID T (°C) [Fluorene]
(mg/kg) (mg/kg) (mg/kg) (mg/kg)
FLU2-11a 25 1.3 FLU3-21a 100 67.5 FLU4-10a 21 1.2 FLU6-20a 151 463.2
FLU2-11b 25 1.5 FLU3-21b 100 70.9 FLU4-10b 21 1.2 FLU6-20b 151 459.5
FLU2-14a 25 1.3 FLU3-22a 101 70.5 FLU4-11a 21 1.2 FLU6-21a 151 616.1
FLU2-14b 25 1.5 FLU3-22b 101 73.5 FLU4-11b 21 1.1 FLU6-21b 151 452.5FLU2-17a 25 1.3 FLU3-23a 101 70.9 FLU4-12a 21 1.1 FLU6-22a 151 451.5
FLU2-17b 25 1.5 FLU3-23b 101 74.1 FLU4-12b 21 1.5 FLU6-22b 151 463.6
FLU2-22a 52 6.3 FLU3-28a 75 21.6 FLU4-31a 100 70.2 FLU6-23a 151 444.9
FLU2-22b 52 6.2 FLU3-28b 75 21.7 FLU4-31b 100 73.7 FLU6-23b 151 450.8FLU2-23a 52 6.1 FLU3-29a 75 21.4 FLU4-32a 100 73.0 FLU6-28a 126 226.2
FLU2-23Bb 52 6.5 FLU3-29b 75 21.8 FLU4-32b 100 73.2 FLU6-28b 126 236.4
FLU2-24a 52 6.2 FLU3-30a 75 22.8 FLU4-33a 100 68.0 FLU6-29a 126 220.4
FLU2-24b 52 6.3 FLU3-30b 75 22.0 FLU4-33b 100 74.4 FLU6-29b 126 212.6FLU2-28a 77 22.9 FLU3-35a 52 7.3 FLU4-66a 126 217.3 FLU6-30a 126 211.7
FLU2-28b 77 21.4 FLU3-35b 52 7.2 FLU4-66b 126 213.2 FLU6-30b 126 223.4
FLU2-29a 77 22.6 FLU3-36a 51 6.2 FLU4-67a 126 209.0 FLU6-34a 126 201.0
FLU2-29b 77 22.1 FLU3-36b 51 6.3 FLU4-67b 126 218.6 FLU6-34b 126 233.0FLU2-30a 77 21.0 FLU3-37a 51 5.6 FLU4-70a 126 231.7 FLU6-40a 126 215.6
FLU2-30b 77 20.3 FLU3-37b 51 6.3 FLU4-70b 126 213.3 FLU6-40b 126 208.1
FLU2-35a 101 63.6 FLU3-38a 51 5.7 FLU4-80a 151 466.4 FLU6-49a 100 60.4
FLU2-35b 101 62.1 FLU3-38b 51 5.8 FLU4-80b 151 459.0 FLU6-49b 100 64.6FLU2-36a 101 64.2 FLU3-49a 20 0.8 FLU4-81a 151 471.8 FLU6-50a 100 62.1
FLU2-36b 101 62.0 FLU3-49b 20 0.8 FLU4-81b 151 454.8 FLU6-50b 100 67.2
FLU2-37a 101 70.6 FLU3-50a 20 0.8 FLU4-82a 151 472.3 FLU6-51a 100 67.3
FLU2-37b 101 69.9 FLU3-50b 20 0.8 FLU4-82b 151 513.3 FLU6-51b 100 64.2FLU3-51a 20 0.8
FLU3-51b 20 0.8

Technical Inform
ation Departm
ent • Lawrence Liverm
ore National Laboratory
University of C
alifornia • Livermore, C
alifornia 94551


