

1
IEEJ © 2020, All rights reserved

2
IEEJ © 2020, All rights reserved
Ken Koyama, IEEJ, February 19th 2020
Energy consumption Changes (2017-2050)
Reference Scenario
0
1,000
2,000
3,000
4,000
5,000
1980 1990 2000 2010 2020 2030 2040 2050
Mtoe
Industry
Transport
Buildings, etc.
Non-energy use
Gen. & trans. losses
Other transf.
387
500
868
892
1,058
1,079
0.9%
1.4%
0.8%
0.7%
1.0%
0.9%
Other transf.
Non-energy use
Industry
Buildings, etc.
Transport
Gen. & trans. losses
Mtoe CAGR
Source: “IEEJ Outlook 2020” (IEEJ, October 2019)
Outlook for World Final Energy DemandTransportation sector is an important source for the growth

3
IEEJ © 2020, All rights reserved
Ken Koyama, IEEJ, February 19th 2020
By region By sector
0
20
40
60
80
100
120
140
1980 1990 2000 2017 2030 2040 2050
Mb/d
Intl. bunkers
Oceania
Africa
Oth. Europe/Eurasia
Advanced Europe
Middle East
Asia
Latin America
North America
64 67
76
92
104
112118
0
20
40
60
80
100
120
140
1980 1990 2000 2017 2030 2040 2050
Mb/d
Transformation
Non-energy use
Buildings, etc.
Transport
Industry
Source: “IEEJ Outlook 2020” (IEEJ, October 2019)
Outlook for World Oil Demand by region/sectorAsia and Transportation drives the growth
Reference Scenario

4
IEEJ © 2020, All rights reserved
Ken Koyama, IEEJ, February 19th 2020
StockNew sales
96%
63%
43%38%
14%
22%
25% 36%
31%
8%
14%
13%
20%
6%
17%12%
34%
0%
20%
40%
60%
80%
100%
2017 2030 2050 2030 2050
Reference ATS
Fuel cell vehicle
Battery electric
vehicle
Plug-in hybrid
vehicle
Hybrid vehicle
Natural gas
vehicle
Conventional
engine vehicle
97%
78%
49%
64%
20%
13%
25%
23%
35%
4%
12%
7%
18%
3%13%
5%
26%
2017 2030 2050 2030 2050
Reference ATS
Advanced Technologies Scenario
Source: “IEEJ Outlook 2020” (IEEJ, October 2019)
Outlook for World Share of Passenger VehicleATS sees 80% plus ZEVs in 2050

5
IEEJ © 2020, All rights reserved
Ken Koyama, IEEJ, February 19th 2020
New sale-basis Stock-basis
Fuel efficiency of passenger vehicle
Note: Litres of gasoline equivalent
21.8
27.8
33.8
14.1
17.9
21.0
23.9
0
10
20
30
40
2017 2030 2040 2050
km/L
Advanced
Technologies
Reference
17.3
23.1
29.1
12.8
15.7
18.7
21.7
0
10
20
30
40
2017 2030 2040 2050
km/L
Advanced
Technologies
Reference
Source: “IEEJ Outlook 2020” (IEEJ, October 2019)
Outlook for World Fuel Efficiency of Passenger VehicleATS sees 34% improvement of fuel efficiency (stock base) in 2050
Advanced Technologies Scenario

6
IEEJ © 2020, All rights reserved
Ken Koyama, IEEJ, February 19th 2020
By region By energy source
Note: Solid lines stand for Advanced Technologies Scenario anddotted lines stand for Reference Scenario.
Source: “IEEJ Outlook 2020” (IEEJ, October 2019)
Advanced Technologies Scenario
Outlook for World Primary Energy DemandATS sees “Oil Demand Peak” and other important change in energy mix

7
IEEJ © 2020, All rights reserved
Ken Koyama, IEEJ, February 19th 2020
Oil demand peaks by rapid penetration of ZEVs
Oil consumption by cars in Non-OECD, which continues to increase rapidly in the Reference Scenario, also declines from around 2030. It is as much as one third of the Reference Scenario in 2050.
⛽ Oil consumption ⛽ Oil for Road [Peak Oil Demand Case]
In the Peak Oil Demand Case, oil consumption hits a peak of 98 Mb/d around 2030 then declines. The reduction from the Reference Scenario is 7 Mb/d and 33 Mb/d in 2030 and in 2050, respectively.
Note: Dotted lines are the Reference Scenario
<Peak Oil Demand Case>
Source: “IEEJ Outlook 2018” (IEEJ, October 2017)

8
IEEJ © 2020, All rights reserved
Ken Koyama, IEEJ, February 19th 2020
Economic impacts of peak oil demand
Although the Middle East obtains the relative gain, its net oil export decreases of $1.6 trillion or 13% of nominal GDP is significant.
On the other hand, the most benefiting country from net oil import decreases is India, the second largest oil consumer, followed by China, which has more car fleet than in any other countries. The United States has little impact despite of its consumption scale since it is almost oil self-sufficient.
⛽ Changes in net oil exports/imports and ratios to nominal GDP [2050]
Note: Europe excludes the former Soviet Union
<Peak Oil-Demand Analysis>
Source: “IEEJ Outlook 2018” (IEEJ, October 2017)

9
IEEJ © 2020, All rights reserved
Ken Koyama, IEEJ, February 19th 2020
Reference material

10
IEEJ © 2020, All rights reserved
Ken Koyama, IEEJ, February 19th 2020
By sector By energy source
0
2,000
4,000
6,000
8,000
10,000
12,000
14,000
1980 1990 2000 2017 2030 2040 2050
Mtoe
Non-energy use
Buildings, etc.
Transport
Industry
5,369
6,264
7,030
9,717
11,420
12,39213,035
0
2,000
4,000
6,000
8,000
10,000
12,000
14,000
1980 1990 2000 2017 2030 2040 2050
Mtoe
Others
Electricity
Natural gas
Oil
Coal
Source: “IEEJ Outlook 2020” (IEEJ, October 2019)
Outlook for World Final Energy Demand by sector/energyTransportation/oil is an important source for the growth
Reference material
Reference Scenario

11
IEEJ © 2020, All rights reserved
Ken Koyama, IEEJ, February 19th 2020
By energy sourceBy sector
0
1,000
2,000
3,000
4,000
5,000
6,000
7,000
1980 1990 2000 2017 2030 2040 2050
Mtoe
Non-energy use
Buildings, etc.
Transport
Industry
1,133
1,554
1,992
3,793
4,828
5,369
5,751
0
1,000
2,000
3,000
4,000
5,000
6,000
7,000
1980 1990 2000 2017 2030 2040 2050
Mtoe
Others
Electricity
Natural gas
Oil
Coal
Source: “IEEJ Outlook 2020” (IEEJ, October 2019)
Outlook for Asian Final Energy Demand by sector/energyTransportation/oil is an important source for the growth
Reference material
Reference Scenario
12
IEEJ © 2020, All rights reserved
Ken Koyama, IEEJ, February 19th 2020
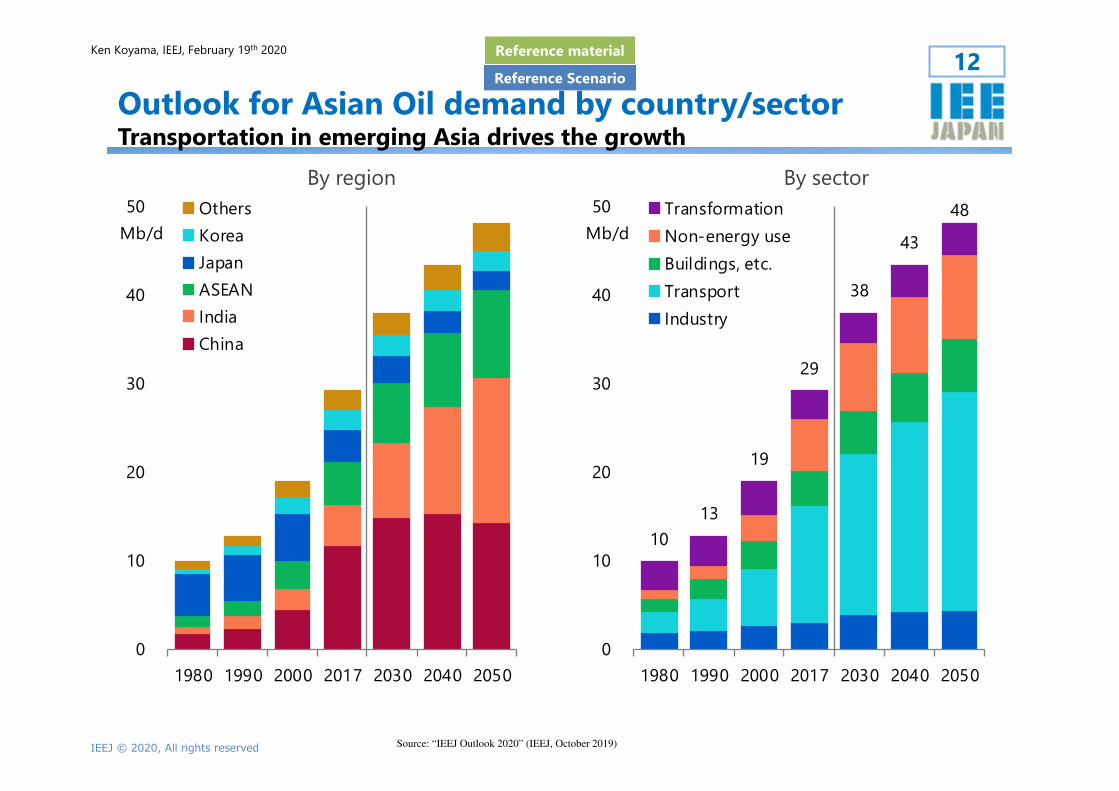
Outlook for Asian Oil demand by country/sectorTransportation in emerging Asia drives the growth
By region By sector
0
10
20
30
40
50
1980 1990 2000 2017 2030 2040 2050
Mb/d
Others
Korea
Japan
ASEAN
India
China
10
13
19
29
38
43
48
0
10
20
30
40
50
1980 1990 2000 2017 2030 2040 2050
Mb/d
Transformation
Non-energy use
Buildings, etc.
Transport
Industry
Source: “IEEJ Outlook 2020” (IEEJ, October 2019)
Reference material
Reference Scenario


