
2010
Julie North
8/20/2010
Illinois State University Parking and Transportation Services Transportation Demand Management
Plan
Table of Contents
Executive Summary…………………………………………………………………………...2
TDM programmatic sustainable strategies ..……………………………………………………3
TDM Program Mission…………………………………………………………………………4
TDM Strategies Currently in Place …………………………………………………………...4-5
Transit Survey Analysis ……………………………………………………………………….6
Transit History ………………………………………………………………………………..6-7
Illinois Department of Transportation – Downstate Assistance Program (DOAP)………….....8
Universal Access Program……………...………………………………………………………9
ISU Enrollment & Employees………….…………………………………………………...…..9
Fare Calculations and Remedies………………………………………………………………10
Transit Survey Results Analysis…………………………………………………......…….11-20
Community Recommendations for Improving ISU Transportation Options………………….20
Parking Space Utilization Review………..………………………………………………….21
Parking Space Inventory………………...…………………………………………………21-22
Parking Culture…………….……………………………………………………...……….22-23
Parking Lot Utilization………………….……………………………………………………..23
Individually Reserved Red Zone Spaces………………………………………………………23
Measuring Demand………………………………………………………………………...23-24
Elasticity of Supply and Demand.....…………………………………………………………..24
Attachment “A” Area #1 Page 4……………………………………..………………………..24
Attachment “A” Area #1 Page 6………………………..……………………………………..25
Attachment “A” Area #2, Page 12...………………………………..……………………...25-26
Attachment “A” Area #2, Page 15……………………...……………………………………..26
Attachment “A” Area #3, Page 14…………………………………………………………….26
Attachment “A” Area #3, Page 19……………………...……………………………………..26
Attachment “A” Area #3, Page 16……………………..……………………………………...26
Attachment “A” Area #3, Page 17………………..…………………………………………...26
Attachment “A” Area #3, Page 17………………………..…………………………………...27
Other Space Vacancies…..…………………………………………………………………….27
1
S104 & S105 Attachment “A” Area #3, Pages 41-42…………………………………………27
Gregory Street Lot……………………………………………………………………………..28
Space Utilization Graph….……………………………………………………………………29
Master Planning Collaboration………………….……………………………………………..30
TDM Summary and Recommendations………………………………...…………………..31
Process Improvements…………………………………………………………………………32
Utilization Review Improvement……………………………………………………………...33
School Street Garage…………………………………………………………………………..33
North University Garage………………………………………………………………………34
SLB F58…………………………………………………………………………………...…..34
G86N…………………………………………………………………………………………..34
Lot G81………………………………………………………………………………………..34
Lot G82………………………………………………………………………………………..35
Lot G53………………………………………………………………………………………..35
Lot G73………………………………………………………………………………………..35
Citations……………………………………………………………………………………….36
2
Illinois State University
Parking and Transportation Services
Transportation Demand Management - Strategies and Goals
Executive Summary
Transportation Demand Management or TDM (also called Mobility Management) “refers
to various strategies that change travel behavior (how, when and where people travel) in order to
increase transit system efficiency and achieve planning objectives”
(http://www.vtpi.org/tdm/tdm12.htm). This TDM plan will examine the data from a transit survey
and will be used to address a variety of problems as well as create and develop innovative transportation
management strategies.
This TDM is intended to serve as a guide to expanding the Parking and Transportation
Services (PTS) mission to incorporate strategies of a TDM program at Illinois State University
(ISU). A TDM aspires to improve the efficiency of the transportation system and to maximize
the use of existing transportation options by:
Increasing the number of people per vehicle (including shuttles, buses &
carpools).
Maximizing the use of underutilized travel times (by time-of-day and day-of-
week) and travel routes – including transit routes and pedestrian/bicycle paths and
matching academic classroom scheduling grids.
Reducing personal trip frequency and increasing transit frequencies.
Full utilization of existing parking space on campus.
The benefits of TDM programs and strategies include:
Decreased need for parking space; resulting in a more pedestrian-friendly campus.
Reduced auto-related emissions and improved air quality.
Decreased traffic congestion.
3
Increased travel options for students, faculty, staff and visitors.
Improving livability within the campus environment.
Transit and travel trends identified through our recent transit survey and space utilization
audit indicate that today‟s faculty, staff and students prefer to remain auto-dependent. In 2001,
ISU recognized a need for transit programs as they related to late night student activities. Since
then, the existing partnership with the local public transit provider has grown considerably,
although actual ridership is questionable and specific areas of service need improvements if we
can expect our ridership to grow. PTS must also consider the addition of a new parking space
approach.
TDM programmatic sustainable strategies include:
Altering parking-cost structure and permitting program.
Increasing utilization of existing empty parking spaces.
Consider replacing the existing Rideshare Matching program.
Marketing and promotions.
Full utilization of Hertz/Connect vehicles.1
Carpool parking lots.
Guaranteed Ride Home Program2
1 In 2009 ISU entered into a contract to place four Hertz-Connect vehicles on campus in active locations,
such as retail and residential facilities. PTS expenses in the first year were $6,000 for placement of four
vehicles. Utilization is hovering around 12% (average of three vehicles utilization). Plans are in place for
additional marketing and promotional opportunities. (Cardinal, 2010)
2 A guaranteed ride home program is usually negotiated in a transit agreement; at Portland State
University free taxi service is provided for individuals who commute by bus and need to leave campus for
illness or emergencies.
4
TDM Program Mission
Recognizing the need to develop a TDM related mission for PTS as we transition to a
more comprehensive multimodal transportation services operation, the data presented in this
analysis has established opportunities whereby ISU and PTS can:
Promote a balanced, multimodal transportation system that promotes choices for
ridership and influences the demand for an improved transit and parking system.
TDM will provide information and education about transit options and offer incentives
and programs that discourage Single Occupant Vehicle (SOV)3 travel.
Realize that TDM is an essential component of an overall sustainable transportation
solution for the campus.
TDM Strategies Currently in Place
ISU PTS has developed a partnership with MssMedia, an advertising company that
provides transit and bike shelters to universities at no cost, with the exception of the installation
of concrete pads and bicycle racks. We have identified locations for nine new transit shelters
and six bicycle shelters (see Attachment “B”). These shelters will provide advertising space to
national and local vendors and the university will receive 10% of the revenue from advertising.
The revenue recognized will be utilized for future TDM program changes including increased
bus frequencies and transit technology.
ISU PTS has negotiated a three-year contract with Bloomington-Normal Public Transit
System (B-NPTS) for the Universal Access (UA) transit services. The Universal Access transit
3 While it is important to understand the short-term prevalence of single-occupant vehicles on campus, it
is also important for the university to emphasize and expand upon other forms of transportation and
recognize their role in creating a sustainable campus.
5
agreement provides “free” transit for ISU faculty, staff and students on the eleven fixed routes of
the B-NPTS service.
The three-year time period allows for the university and B-NPTS to jointly host transit
technology presentations and to collaborate on the acquisition of an integrated transit technology
program. ISU faculty, staff and students who utilize B-NPTS transit services need electronic
access to bus schedules, snow route information, boarding times, frequencies, and for trip
planning. In order for B-NPTS to be competitive and increase ridership, the ability to text and to
access the internet is essential for today‟s students and the ISU community at large. PTS is
interested in investing in new transit technology to improve communications, audit ridership and
assist in the development of a new ridership calculation methodology.
In ISU President Bowman‟s State of the University Address on September 15, 2009, he
stated, “We continue to add to our portfolio of alternative transportation options. Last year our
nationally recognized Reggie Ride bike program was unveiled, and it has been very successful.
In addition to Reggie Ride and Universal Access, where all faculty, staff and students can ride
the public transit system for free, we have two new options this year. There is an electronic ride
share board on the Parking and Transportation Web site to assist people in finding carpooling
options. And just two weeks ago, we announced that car sharing is coming to campus. Connect,
by Hertz, allows people to rent cars for as little as an hour, with fuel and insurance included in
the rental price” (ISU President, 2009).
6
Illinois State University
Office of Parking and Transportation Services
Transit Survey Analysis
Fall 2009
Transit History
Illinois State University (ISU) has been in a partnership with the Bloomington-Normal
Public Transit System (B-NPTS) to provide active transportation to and from the ISU campus
since 2001.
In 2001, the Office of Student Affairs along with central administration advocated for a
safe “night ride” and “late night ride” transit program for ISU students living on and off campus.
The NITERIDE and Late NITE RIDE programs are still in service today. Although these
programs were initiated by the Office of Student Affairs, the decision was made to transfer
administration and funding responsibilities to Parking and Transportation Services (PTS).
In 2004, PTS assumed responsibility for the management and financial support of these
two transit programs. In addition, the Universal Access Program (UA) transit program was
created. The UA transit program provides free transit for ISU faculty, staff, and students on the
B-NPTS‟s eleven fixed routes. This service was contracted as a separate transit service from the
night transit shuttles. On a holistic level, students in a learning environment adapt quickly to
new technology and the propensity of changing cultures means providing as many options for
students as possible. Included in this cross culture activity is the need for more food options,
housing options, and parking and transportation options.
In 2005, the Redbird Express Shuttle program was created, which provides shuttle
service to and from the campus on a daily basis. Residential students who park in remote
parking lots or live in apartment buildings in close proximity and students who live further north
of the main campus utilize this service extensively. The shuttle services provided to the campus
are distinctly diverse in service and in cost.
The shuttle programs operate ten months out of the University‟s fiscal year. The
following table represents historical financial transit costs specific to ISU‟s contractual
7
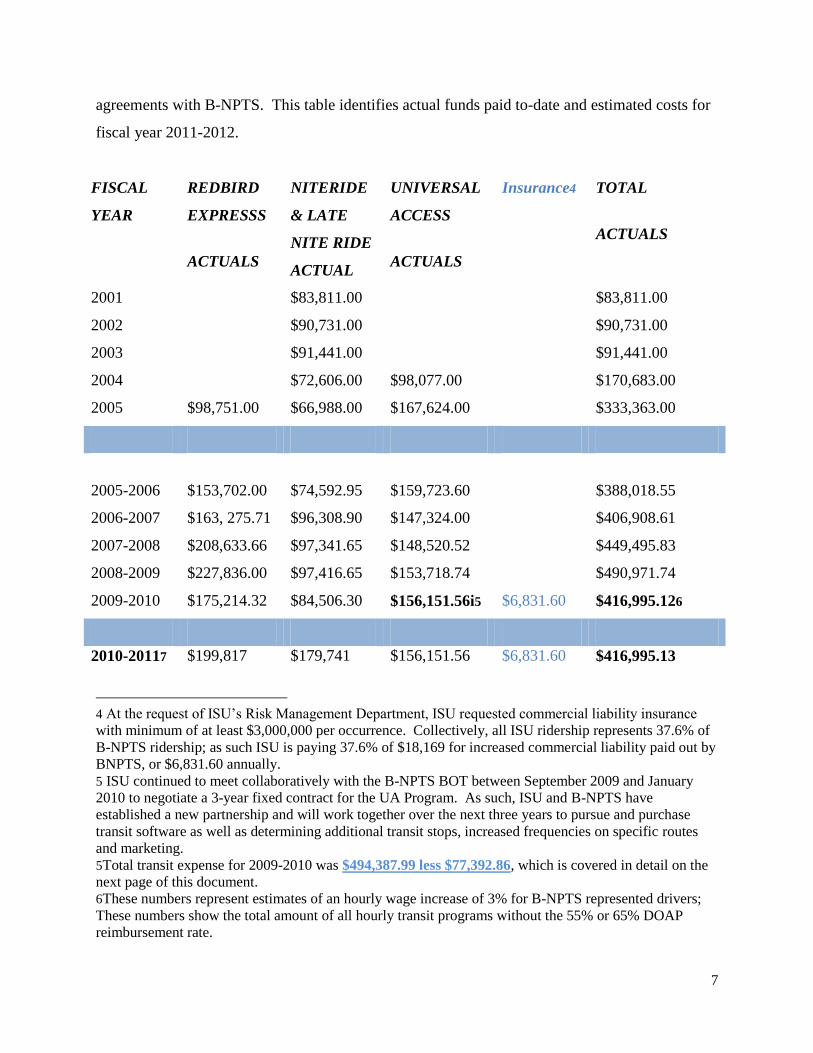
agreements with B-NPTS. This table identifies actual funds paid to-date and estimated costs for
fiscal year 2011-2012.
FISCAL
YEAR
REDBIRD
EXPRESSS
ACTUALS
NITERIDE
& LATE
NITE RIDE
ACTUAL
UNIVERSAL
ACCESS
ACTUALS
Insurance4 TOTAL
ACTUALS
2001 $83,811.00 $83,811.00
2002 $90,731.00 $90,731.00
2003 $91,441.00 $91,441.00
2004 $72,606.00 $98,077.00 $170,683.00
2005 $98,751.00 $66,988.00 $167,624.00 $333,363.00
2005-2006 $153,702.00 $74,592.95 $159,723.60 $388,018.55
2006-2007 $163, 275.71 $96,308.90 $147,324.00 $406,908.61
2007-2008 $208,633.66 $97,341.65 $148,520.52 $449,495.83
2008-2009 $227,836.00 $97,416.65 $153,718.74 $490,971.74
2009-2010 $175,214.32 $84,506.30 $156,151.56i5 $6,831.60 $416,995.126
2010-20117 $199,817 $179,741 $156,151.56 $6,831.60 $416,995.13
4 At the request of ISU‟s Risk Management Department, ISU requested commercial liability insurance
with minimum of at least $3,000,000 per occurrence. Collectively, all ISU ridership represents 37.6% of
B-NPTS ridership; as such ISU is paying 37.6% of $18,169 for increased commercial liability paid out by
BNPTS, or $6,831.60 annually.
5 ISU continued to meet collaboratively with the B-NPTS BOT between September 2009 and January
2010 to negotiate a 3-year fixed contract for the UA Program. As such, ISU and B-NPTS have
established a new partnership and will work together over the next three years to pursue and purchase
transit software as well as determining additional transit stops, increased frequencies on specific routes
and marketing.
5Total transit expense for 2009-2010 was $494,387.99 less $77,392.86, which is covered in detail on the
next page of this document.
6These numbers represent estimates of an hourly wage increase of 3% for B-NPTS represented drivers;
These numbers show the total amount of all hourly transit programs without the 55% or 65% DOAP
reimbursement rate.
8
2011-2012 $156,151.56 $6,831.60
Illinois Department of Transportation – Downstate Operator Assistance Program (DOAP)
The Redbird Express, Nite Ride and Late Nite Ride transit costs are based on service
hours provided, the employee contractual hourly rate, and additional labor for holidays. B-NPTS
applies for financial subsidy through a grant process and historically has received the annual
Illinois Department of Transportation Downstate Operator Assistance Program (DOAP) subsidy
based upon a range of 55-65% of their operating budget annually8.
“In general, 1) an eligible participant receives an annual appropriation from the general
assembly each year based either upon their previous year appropriation or a new appropriation
based upon their need, and 2) an eligible participant who receives an appropriation must apply to
the Illinois Department of Transportation for the DOAP funds” (Spacek, 2010).
Based on the amount of DOAP funds received by B-NPTS, ISU receives a percentage
reimbursement of the hourly labor expenses. In 2009, ISU received a reimbursement in the
amount of $77,392.86. These reimbursements reduce the amount of these contracts each year.
These shuttle transit programs have the highest utilization rate.
In reviewing transit programs at other universities, the cost of the ISU shuttle services on
campus is much less than funding a separate or additional campus shuttle. An example of
expensive shuttle services is the University of Illinois campus in Urbana-Champaign (UIUC).
UIUC paid the Mass Transit District (MTD) $755,000 to cover fixed route operating costs, fixed
route capital costs, and student access to the city system. The parking shuttle services for 2010
costs were $420,083, inclusive of the larger amount, and an additional $120,000 was paid by the
University for faculty/staff Transit.
8 The Division of Public and Intermodal Transportation‟s mission is to support public and specialized
transportation throughout Illinois by providing technical support and financial resources to local
governments, public and specialized transportation operators, and rail operators. Funds are distributed
through the Downstate Operator Assistance Program (DOAP) on an annual basis.
9
When ISU compares the cost of the current shuttle system, it is significantly less than
what the University of Illinois is currently paying as well as other universities and schools in the
Midwestern region.
PTS supports the current B-NPTS shuttle costs, however, PTS has taken steps to evaluate
the UA program, and survey the ISU campus on utilization of all transit programs available to
the community.
Universal Access Program
The UA program provides a “fare free” trip to anyone who displays an ISU Identification
card when boarding any of the eleven fixed routes that serve the Bloomington-Normal area. The
ISU campus ID must be shown to the driver when boarding. The UA agreement is the most
expensive of all three transit programs. This contract is a twelve-month agreement and the cost
is based on the number of boarding rides. According to B-NPTS, these ridership numbers
represent ISU faculty staff and students who boarded the eleven fixed routes 271,682 times in
2008 and 284,546 times in 2009. These numbers represent a 4.73% increase in UA ridership.
PTS became concerned about the increases in ridership as well as the increased cost of
this transit program. In an effort to understand how ridership is calculated and the financial
impact PTS met with B-NPTS Board of Trustees (BOT) throughout summer and fall of 2009 and
spring semester of 2010. The UA program could be improved, especially in their ridership
calculation methodology. Given the ISU population census, these ridership numbers are
extremely high.
ISU Enrollment & Employees
ISU enrollment has been capped for many years at approximately 21,000 students. ISU
employs around 3,800 faculty and staff. Based upon the 2009 ridership count of 284,546 divided
by the 25,000 people in the ISU community, each individual would have boarded one of the
eleven fixed route buses 11 times. B-NPTS has indicated that the ISU community represents
37.6% of their ridership. Currently, there is no technology in place in the bus fleet nor does the
University have a way to audit ridership. The current boarding practice is to show an ISU ID
10
card to the driver. There are no expiration dates on any of the ISU ID cards. Therefore, anyone
who has an ISU ID card, regardless of whether or not they attend school here or work here can
ride for free.
Over the last five years, ISU has researched transit funding methodologies at other
universities and has worked with various consultants to evaluate B-NPTS‟ calculation structure.
The following section provides an overview of the current fare calculation of B-NPTS and
recommends of various remedies.
Fare Calculation and Remedies
Through our conversations with B-NPTS we discovered that ISU was being charged
twice for a single trip because passengers were counted each time they boarded a bus. At a $0.54
per boarding trip, ISU was paying $1.08 for a trip that included a transfer to a second bus. Other
B-NPTS customers pay only one time and use a transfer slip to board the second bus when it is
necessary to use two buses to complete a single trip. This inequity was discussed with B-NPTS
in July 2009. B-NPTS and ISU considered alternative formula calculations.
Historically, ISU and B-NPTS costs have been based on calculating ridership. “The
relatively low level of ridership is not overloading buses or adding significant costs to B-NPTS
bus service. Ridership has stabilized and is varying no more than 11% over the six years of the
program. As a consequence, university representatives met with the B-NPTS Board of Trustees
(BOT) to negotiate a three-year fixed contract agreement in the amount of $156,151.56. “In the
event that the number of ISU Universal Access Boardings increase or decrease more than ten
percent from the previous agreement year, either party has the right to reopen the agreement for
the purpose of renegotiating the Agreement renewal price based on the increased or decreased
Boardings” (Legal, 2010-2014).
ISU legal and risk management services requested an increase in commercial automobile
liability insurance from $1M to $3M for each occurrence. Since ISU represents 37.6% of the
total ridership of UA, ISU offered to pay 37.6% of the cost of the increase in liability insurance.
ISU‟s commitment is $6,831.60 annually.
In an effort to find out if ISU faculty, staff and students utilize the fixed routes and shuttle
services, PTS launched a survey in fall semester 2009. In an effort to promote sustainability and
11
active transportation, the survey included a wide variety of questions related to multimodal forms
of transportation as well as identifying the potential eco9 benefits.
Transit Survey Results Analysis
Research data regarding ISU ridership was unavailable. PTS wanted to measure ridership
on all of the existing transit programs. The transit survey was launched by PTS via the web on
November 16, 2009 and closed on December 16, 2009.
The goals of this survey were to identify transit ridership, understand trip demographics,
determine transit utilization and fixed route utilization; identify non-transit use; establish the
benefits of alternative transportation; transit access methodologies; residential intersections
closest to transit stops; transit access and route frequencies. There were eight drop-down view
templates so that those taking the survey could comment, make suggestions, and
recommendations.
In an effort to identify ridership demographics, the first question was: “Are you a faculty
member, staff member or student”? There were 783 responses to our survey. Of these 783
responders, 7% represented ISU faculty, 38% represented Staff, and 55% represented students.
In an effort to determine where faculty, staff and students travel from to the campus and to
calculate the carbon footprint the second question was “What is the zip code where you live”?
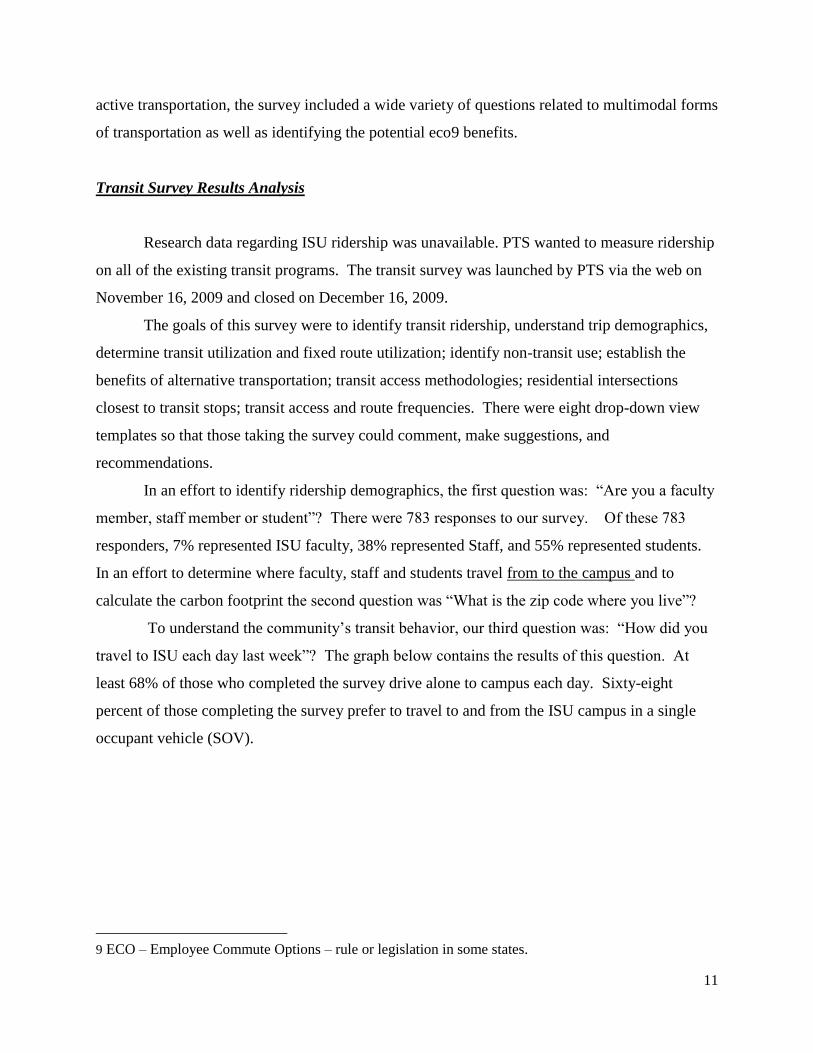
To understand the community‟s transit behavior, our third question was: “How did you
travel to ISU each day last week”? The graph below contains the results of this question. At
least 68% of those who completed the survey drive alone to campus each day. Sixty-eight
percent of those completing the survey prefer to travel to and from the ISU campus in a single
occupant vehicle (SOV).
9 ECO – Employee Commute Options – rule or legislation in some states.
12
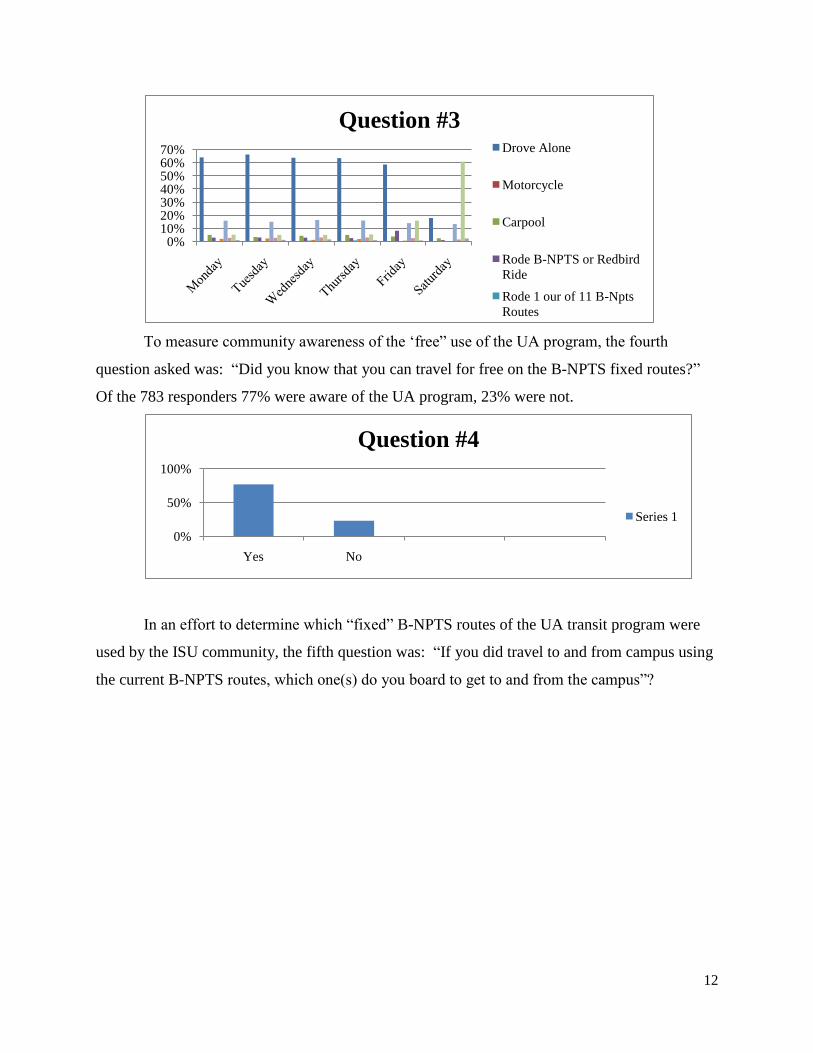
To measure community awareness of the „free” use of the UA program, the fourth
question asked was: “Did you know that you can travel for free on the B-NPTS fixed routes?”
Of the 783 responders 77% were aware of the UA program, 23% were not.
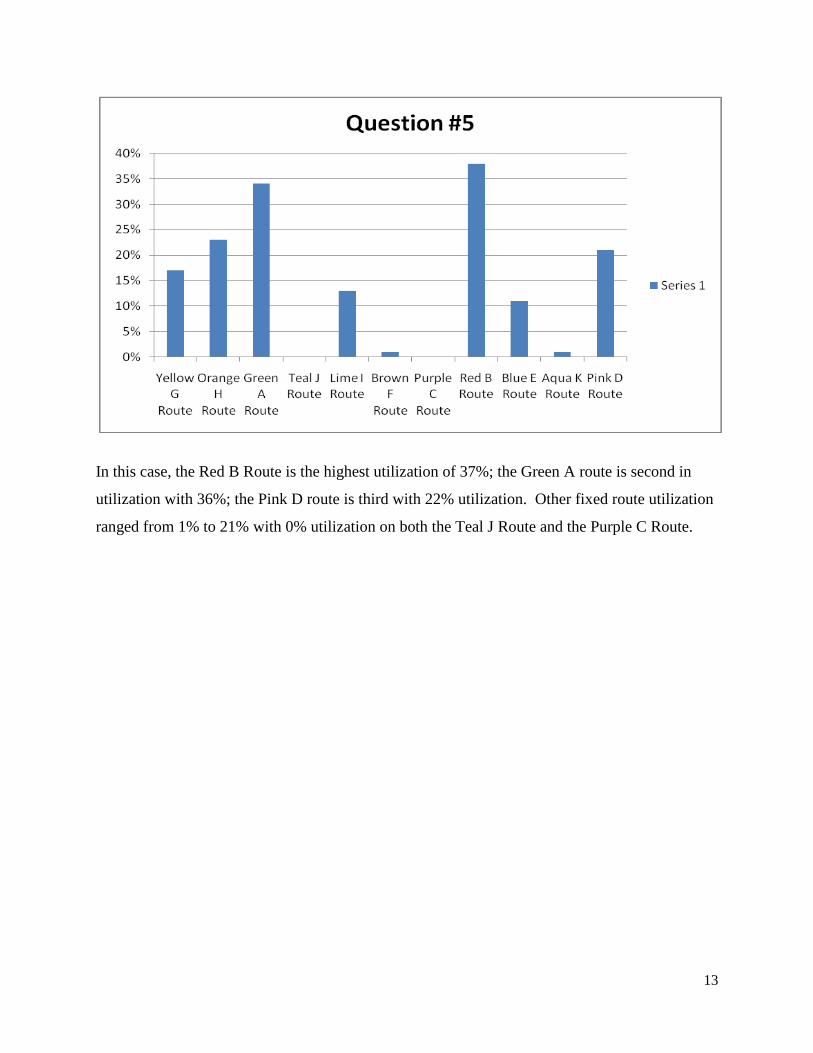
In an effort to determine which “fixed” B-NPTS routes of the UA transit program were
used by the ISU community, the fifth question was: “If you did travel to and from campus using
the current B-NPTS routes, which one(s) do you board to get to and from the campus”?
0%10%20%30%40%50%60%70%
Question #3Drove Alone
Motorcycle
Carpool
Rode B-NPTS or Redbird
Ride
Rode 1 our of 11 B-Npts
Routes
0%
50%
100%
Yes No
Question #4
Series 1
13
In this case, the Red B Route is the highest utilization of 37%; the Green A route is second in
utilization with 36%; the Pink D route is third with 22% utilization. Other fixed route utilization
ranged from 1% to 21% with 0% utilization on both the Teal J Route and the Purple C Route.
14
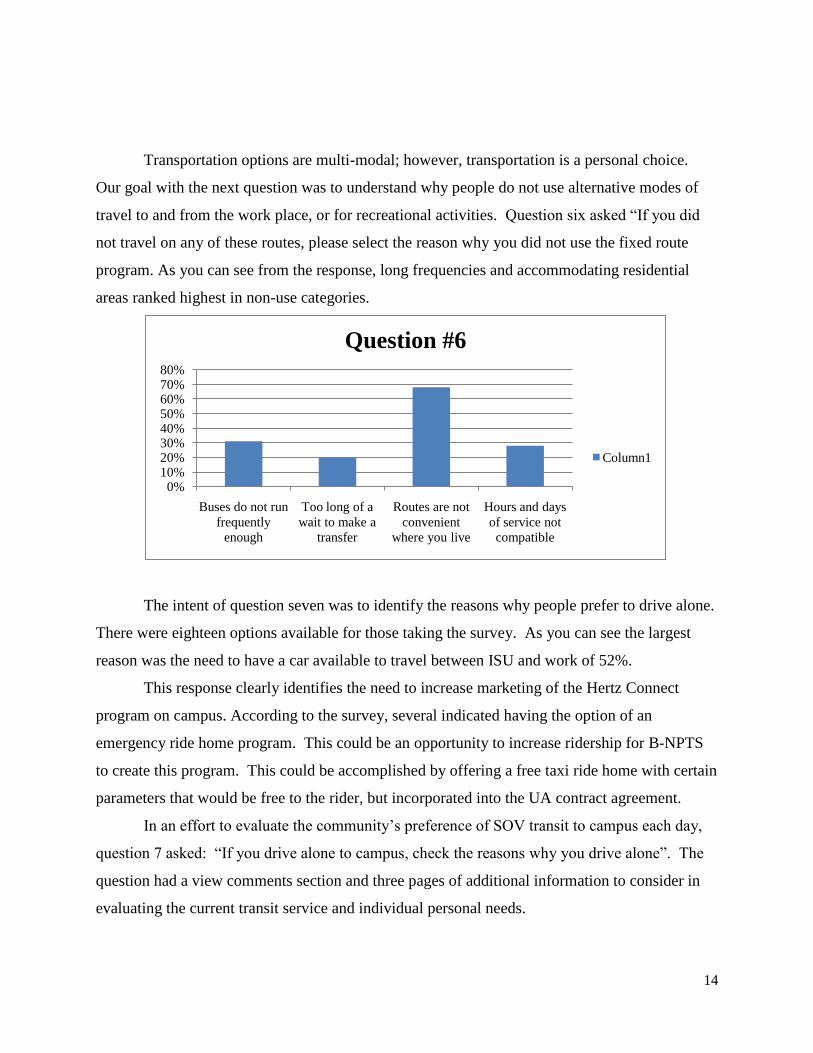
Transportation options are multi-modal; however, transportation is a personal choice.
Our goal with the next question was to understand why people do not use alternative modes of
travel to and from the work place, or for recreational activities. Question six asked “If you did
not travel on any of these routes, please select the reason why you did not use the fixed route
program. As you can see from the response, long frequencies and accommodating residential
areas ranked highest in non-use categories.
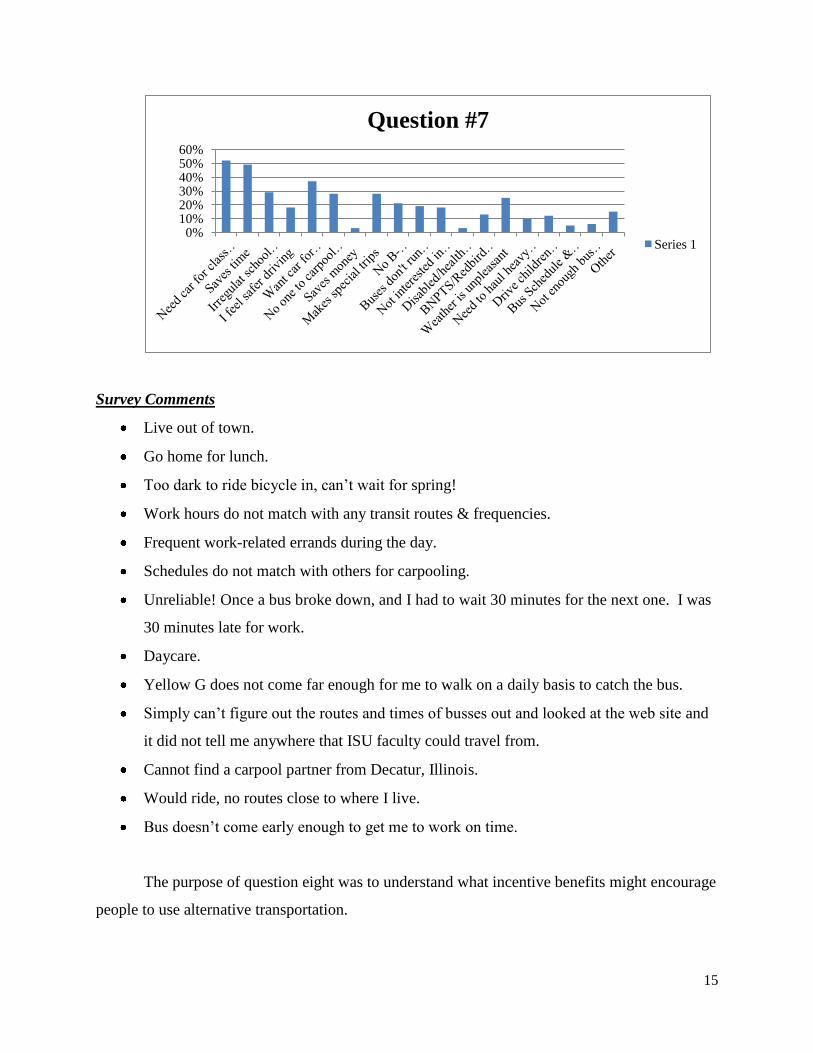
The intent of question seven was to identify the reasons why people prefer to drive alone.
There were eighteen options available for those taking the survey. As you can see the largest
reason was the need to have a car available to travel between ISU and work of 52%.
This response clearly identifies the need to increase marketing of the Hertz Connect
program on campus. According to the survey, several indicated having the option of an
emergency ride home program. This could be an opportunity to increase ridership for B-NPTS
to create this program. This could be accomplished by offering a free taxi ride home with certain
parameters that would be free to the rider, but incorporated into the UA contract agreement.
In an effort to evaluate the community‟s preference of SOV transit to campus each day,
question 7 asked: “If you drive alone to campus, check the reasons why you drive alone”. The
question had a view comments section and three pages of additional information to consider in
evaluating the current transit service and individual personal needs.
0%10%20%30%40%50%60%70%80%
Buses do not run
frequently
enough
Too long of a
wait to make a
transfer
Routes are not
convenient
where you live
Hours and days
of service not
compatible
Question #6
Column1
15
Survey Comments
Live out of town.
Go home for lunch.
Too dark to ride bicycle in, can‟t wait for spring!
Work hours do not match with any transit routes & frequencies.
Frequent work-related errands during the day.
Schedules do not match with others for carpooling.
Unreliable! Once a bus broke down, and I had to wait 30 minutes for the next one. I was
30 minutes late for work.
Daycare.
Yellow G does not come far enough for me to walk on a daily basis to catch the bus.
Simply can‟t figure out the routes and times of busses out and looked at the web site and
it did not tell me anywhere that ISU faculty could travel from.
Cannot find a carpool partner from Decatur, Illinois.
Would ride, no routes close to where I live.
Bus doesn‟t come early enough to get me to work on time.
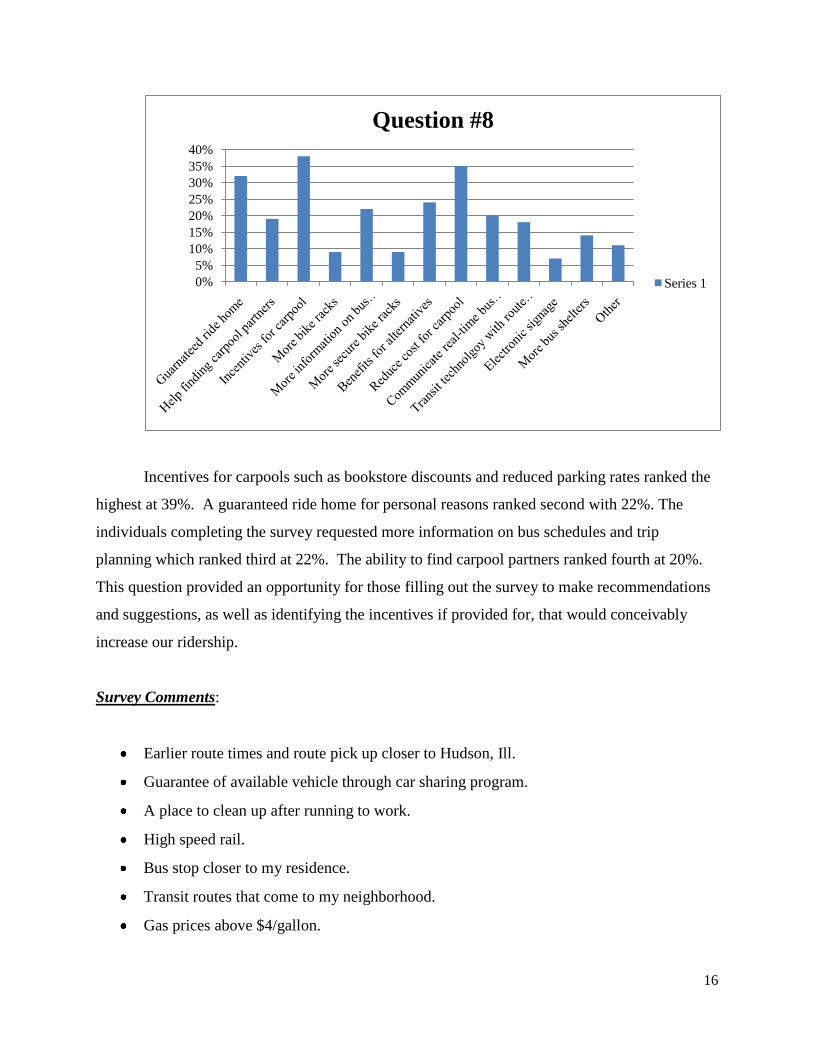
The purpose of question eight was to understand what incentive benefits might encourage
people to use alternative transportation.
0%10%20%30%40%50%60%
Question #7
Series 1
16
Incentives for carpools such as bookstore discounts and reduced parking rates ranked the
highest at 39%. A guaranteed ride home for personal reasons ranked second with 22%. The
individuals completing the survey requested more information on bus schedules and trip
planning which ranked third at 22%. The ability to find carpool partners ranked fourth at 20%.
This question provided an opportunity for those filling out the survey to make recommendations
and suggestions, as well as identifying the incentives if provided for, that would conceivably
increase our ridership.
Survey Comments:
Earlier route times and route pick up closer to Hudson, Ill.
Guarantee of available vehicle through car sharing program.
A place to clean up after running to work.
High speed rail.
Bus stop closer to my residence.
Transit routes that come to my neighborhood.
Gas prices above $4/gallon.
0%
5%
10%
15%
20%
25%
30%
35%
40%
Question #8
Series 1
17
More marked/designated bus stops.
More routes.
Not having to travel for an hour due to bus transfers when it takes 15 minutes to drive to
ISU in my car.
Less travel time on bus routes.
Easier to understand bus route information (Website is very difficult to make heads or
tails of).
I commute an hour and a half and have no one to carpool with.
More convenient stops, longer hours.
Riding your bike in Bloomington-Normal is dangerous because of traffic and lack of
sidewalks; shorter bus rides.
The time the bus arrives to my apartment is never the same time and infrequent.
I would ride if the H route could be expanded to my area.
There is no public transport from Fairbury, very late schedule.
Guaranteed drive lanes for carpools, etc., to arrive most efficiently.
Shuttles/buses/Tram/Amtrak pick up from smaller communities where a large number of
employees live.
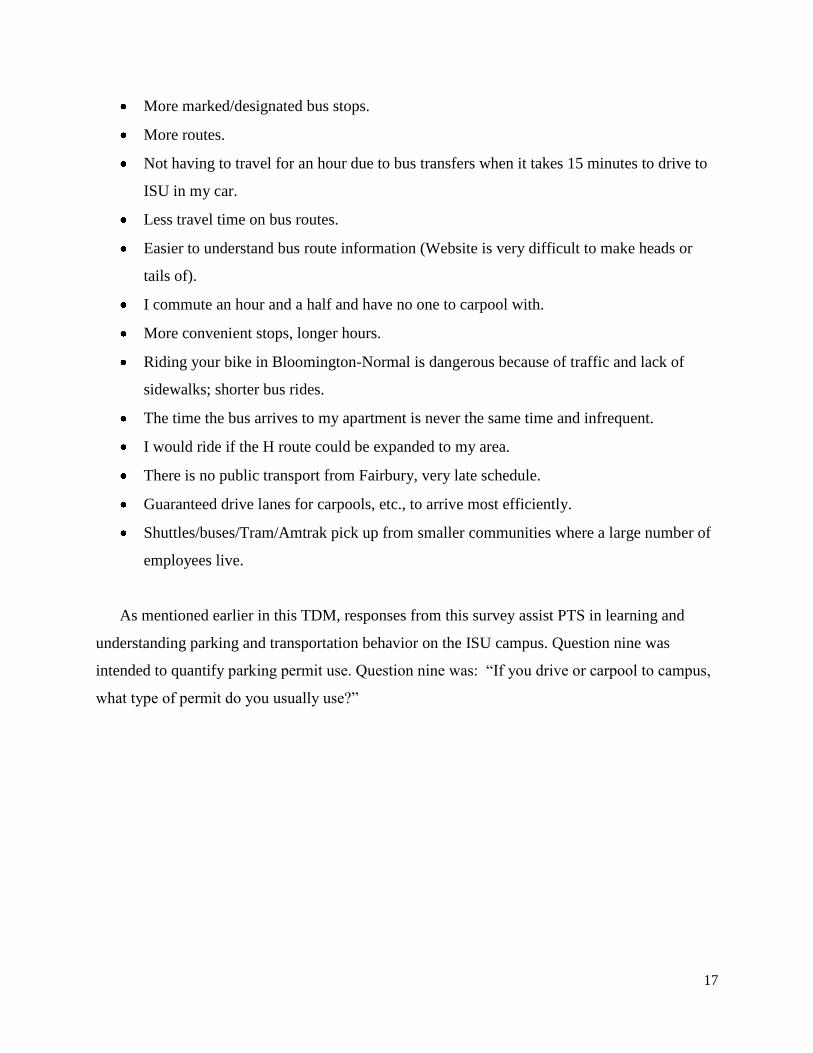
As mentioned earlier in this TDM, responses from this survey assist PTS in learning and
understanding parking and transportation behavior on the ISU campus. Question nine was
intended to quantify parking permit use. Question nine was: “If you drive or carpool to campus,
what type of permit do you usually use?”
18
Clearly, 74% of those responding park with an ISU parking permit; 12% parking with a
daily permit, at a meter or in a pay lot.
The nature of questions ten and eleven were open-ended for comments. Valid
recommendations regarding transit improvements will be summarized and listed in the
conclusion of the transit survey section of the TDM.
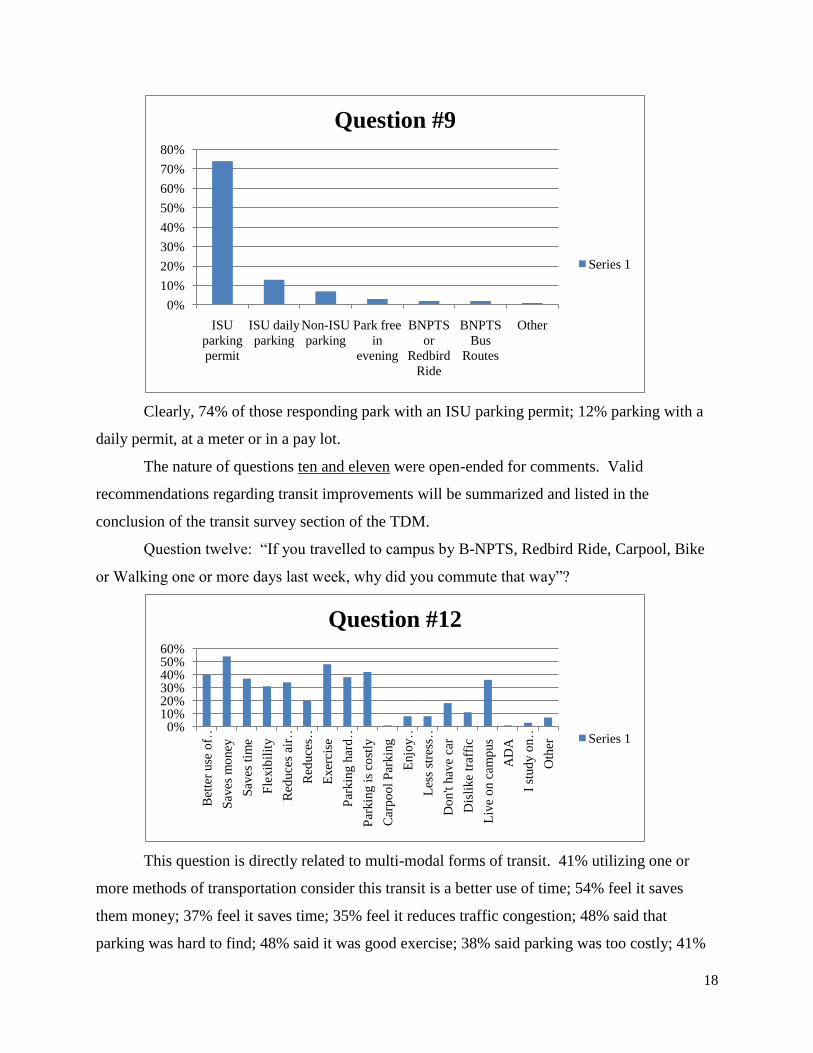
Question twelve: “If you travelled to campus by B-NPTS, Redbird Ride, Carpool, Bike
or Walking one or more days last week, why did you commute that way”?
This question is directly related to multi-modal forms of transit. 41% utilizing one or
more methods of transportation consider this transit is a better use of time; 54% feel it saves
them money; 37% feel it saves time; 35% feel it reduces traffic congestion; 48% said that
parking was hard to find; 48% said it was good exercise; 38% said parking was too costly; 41%
0%
10%
20%
30%
40%
50%
60%
70%
80%
ISU
parking
permit
ISU daily
parking
Non-ISU
parking
Park free
in
evening
BNPTS
or
Redbird
Ride
BNPTS
Bus
Routes
Other
Question #9
Series 1
0%10%20%30%40%50%60%
Bet
ter
use
of …
Sav
es m
oney
Sav
es t
ime
Fle
xib
ilit
y
Red
uce
s ai
r …
Red
uce
s …
Exer
cise
Par
kin
g h
ard
…
Par
kin
g i
s co
stly
Car
po
ol
Par
kin
g
Enjo
y …
Les
s st
ress
…
Do
n't
hav
e ca
r
Dis
like
traf
fic
Liv
e o
n c
amp
us
AD
A
I st
ud
y o
n …
Oth
er
Question #12
Series 1
19
stated the desire to have special parking available for carpools. In an effort to compare and
identify traffic patterns and transit frequencies, this question is an estimate of the number of
hours spent on a normal academic day on the ISU campus.
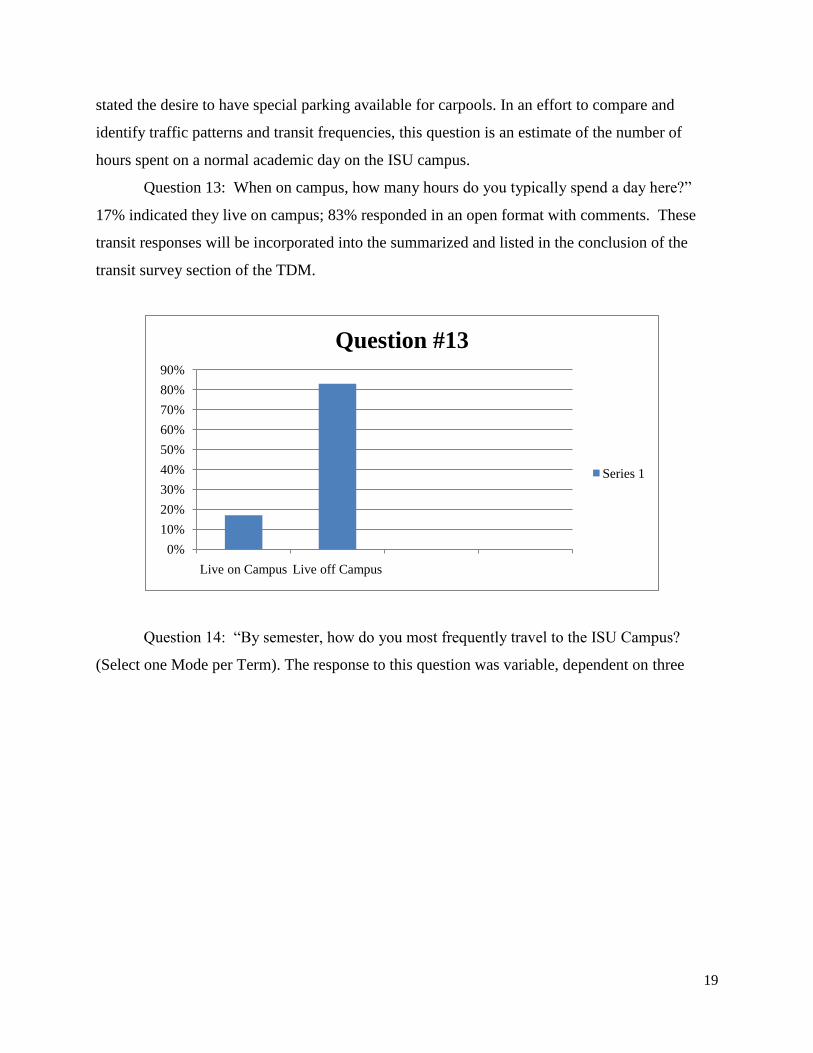
Question 13: When on campus, how many hours do you typically spend a day here?”
17% indicated they live on campus; 83% responded in an open format with comments. These
transit responses will be incorporated into the summarized and listed in the conclusion of the
transit survey section of the TDM.
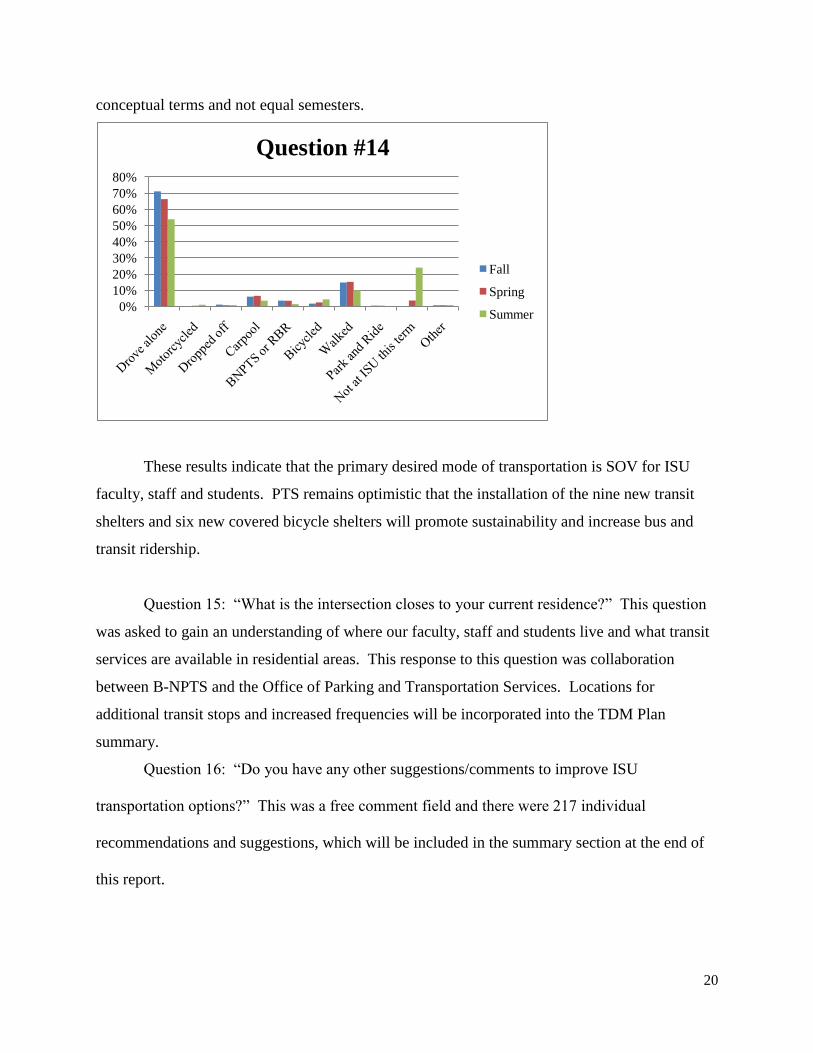
Question 14: “By semester, how do you most frequently travel to the ISU Campus?
(Select one Mode per Term). The response to this question was variable, dependent on three
0%
10%
20%
30%
40%
50%
60%
70%
80%
90%
Live on Campus Live off Campus
Question #13
Series 1
20
conceptual terms and not equal semesters.
These results indicate that the primary desired mode of transportation is SOV for ISU
faculty, staff and students. PTS remains optimistic that the installation of the nine new transit
shelters and six new covered bicycle shelters will promote sustainability and increase bus and
transit ridership.
Question 15: “What is the intersection closes to your current residence?” This question
was asked to gain an understanding of where our faculty, staff and students live and what transit
services are available in residential areas. This response to this question was collaboration
between B-NPTS and the Office of Parking and Transportation Services. Locations for
additional transit stops and increased frequencies will be incorporated into the TDM Plan
summary.
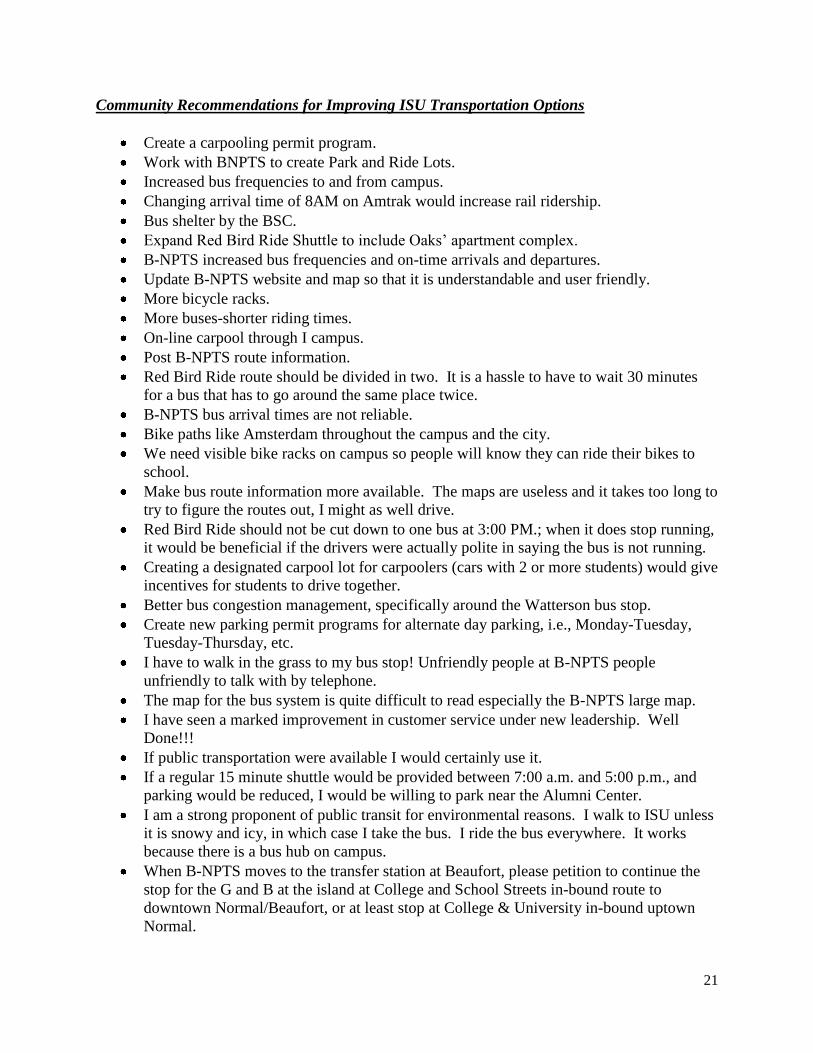
Question 16: “Do you have any other suggestions/comments to improve ISU
transportation options?” This was a free comment field and there were 217 individual
recommendations and suggestions, which will be included in the summary section at the end of
this report.
0%
10%
20%
30%
40%
50%
60%
70%
80%
Question #14
Fall
Spring
Summer
21
Community Recommendations for Improving ISU Transportation Options
Create a carpooling permit program.
Work with BNPTS to create Park and Ride Lots.
Increased bus frequencies to and from campus.
Changing arrival time of 8AM on Amtrak would increase rail ridership.
Bus shelter by the BSC.
Expand Red Bird Ride Shuttle to include Oaks‟ apartment complex.
B-NPTS increased bus frequencies and on-time arrivals and departures.
Update B-NPTS website and map so that it is understandable and user friendly.
More bicycle racks.
More buses-shorter riding times.
On-line carpool through I campus.
Post B-NPTS route information.
Red Bird Ride route should be divided in two. It is a hassle to have to wait 30 minutes
for a bus that has to go around the same place twice.
B-NPTS bus arrival times are not reliable.
Bike paths like Amsterdam throughout the campus and the city.
We need visible bike racks on campus so people will know they can ride their bikes to
school.
Make bus route information more available. The maps are useless and it takes too long to
try to figure the routes out, I might as well drive.
Red Bird Ride should not be cut down to one bus at 3:00 PM.; when it does stop running,
it would be beneficial if the drivers were actually polite in saying the bus is not running.
Creating a designated carpool lot for carpoolers (cars with 2 or more students) would give
incentives for students to drive together.
Better bus congestion management, specifically around the Watterson bus stop.
Create new parking permit programs for alternate day parking, i.e., Monday-Tuesday,
Tuesday-Thursday, etc.
I have to walk in the grass to my bus stop! Unfriendly people at B-NPTS people
unfriendly to talk with by telephone.
The map for the bus system is quite difficult to read especially the B-NPTS large map.
I have seen a marked improvement in customer service under new leadership. Well
Done!!!
If public transportation were available I would certainly use it.
If a regular 15 minute shuttle would be provided between 7:00 a.m. and 5:00 p.m., and
parking would be reduced, I would be willing to park near the Alumni Center.
I am a strong proponent of public transit for environmental reasons. I walk to ISU unless
it is snowy and icy, in which case I take the bus. I ride the bus everywhere. It works
because there is a bus hub on campus.
When B-NPTS moves to the transfer station at Beaufort, please petition to continue the
stop for the G and B at the island at College and School Streets in-bound route to
downtown Normal/Beaufort, or at least stop at College & University in-bound uptown
Normal.
22
Illinois State University Parking Space Utilization Review
2009-2010
The transit survey results have laid the foundation for the beginning of a comprehensive
TDM Plan. In order to understand supply and demand for parking space on the ISU campus,
PTS staff counted each parking lot space, and garage spaces on the ISU campus. The goal of this
utilization review was to understand parking space utilization on campus, as well as, identify
those areas which justify reallocation or re-designation.
The space utilization review includes the reorganization of the Parking Advisory
Committee (PAC) and their role in disseminating parking policy and change to various
constituents within our community. This review includes the parking space analysis, potential
reorganization of space, and opportunities for programmatic changes in the permitting process.
Parking Space Inventory
During the 2009 fall semester at Illinois State University (ISU) the Office of Parking and
Transportation Services (PTS) completed a manual inventory of each parking space on campus.
This inventory includes the total number of spaces, the location of each space, the use of the
space, metered spaces, Service Vehicle spaces, Business Permit spaces, and ADA spaces. Each
space was counted manually and this process was a very laborious task, however, understanding
the actual supply leads to determining the demand. The PTS manages and maintains the
following types and quantities of parking spaces on the ISU campus including any spaces under
existing lease agreements:
8723 parking spaces
786 numbered reserved spaces
397 red zone reserved surface spaces
23
1630 faculty spaces
2064 student storage spaces
1882 commuter spaces
378 metered spaces
866 pay lot spaces
179 ADA spaces
566 other spaces (Business Permit & Service Vehicle)
Parking Culture
Prior to making any changes in the parking program, one must understand the parking
culture on campus. Parking is a challenge on any college campus. Established travel and
parking behaviors in place for five to ten years are definitely difficult to change.
In an academic environment, decisions regarding changes in the parking program must
be data driven. Parking outreach and shared strategies are a must to adequately educate the
community on the cost of parking as well as the cost of active transportation. Traditionally, there
is a Parking Advisory Council or group on each campus that represents the various
constituencies within the university community.
In fall of 2009, under new leadership, PTS reconvened the ISU Parking Advisory
Committee (PAC). Historically, the PAC was never fully utilized and decisions were made prior
to meetings without additional input or discussion. PTS rewrote the bylaws and the mission of
the PAC. Proposed rate increases effective July 1, 2010 were reviewed and approved by the
24
PAC and also shared with their constituencies prior to submitting the rates to the President‟s
Cabinet for final approval.
This process allowed for a communication exchange with PTS and the community at
large. PAC has also reviewed the data related to the average empty space counts and have
agreed with our proposed changes in space allocation and utilization.
Parking Lot Space Utilization
Building off of the fall 2009 physical inventory, in the beginning of Spring Semester,
January 2010, parking lots were counted by identifying the number of average empty spaces in
each garage and each surface lot. The data from these lot counts represents the existing supply
and demand on the ISU campus, and data that will justify reallocation of spaces within the
permit criteria established.
Individually Reserved Red Zone Spaces
In spring semester 2009 a decision was made to remove the “individually reserved”
signage and create a “red reserved zone” in the newly renovated South University Garage
(SUG) project. This decision was made without any outreach to the ISU parking community.
Unfortunately, this decision had a negative impact on the community as well as PTS. In an
effort to mitigate the damage to the community, PTS took steps to understand the supply and
demand on campus.
Measuring Demand
During the first two weeks of the spring semester, each parking lot and garage space was
counted at 9:00 a.m., 11:00 a.m., 1:00 p.m., and 3:00 p.m. The average number of empty spaces
was documented. Attachment “A” to this TDM plan contains spreadsheets identifying the
25
average number of empty spaces in each parking lot and parking garage on campus. At each
meeting of the PAC, these reports with quantifiable data are discussed. Specifically, space
utilization in three parking locations on campus, one that was considered for a conversion to red
zone reserved, and two more were discussed in a meeting this summer, for a potential change in
fall semester 2011.
Elasticity of Supply and Demand
“The demand for a product is the amount that buyers are willing and able to purchase. Quantity
demanded is the demand at a particular price, and is represented as the demand curve. The supply of a
product is the amount that producers are willing and able to bring to the market for sale. Quantity
supplied is the amount offered for sale at a particular price. The main determinant of supply/demand is the
price of the product”. (http://www.basiceconomics.info/supply-and-demand.php).
As related to ISU parking supply and demand, our data assessment confirms that parking patrons
will purchase an individually designated reserve space, as opposed to a red zone reserved parking space.
Customers are willing to pay the highest amount of annual parking at the rate of $378.00 versus reserved
zone permit at the rate of $314.00.
The following parking areas are highlighted because of the need to change their specific
allocations and operations. Further discussion on some of these areas will be found in the summary and
recommendations section of this document.
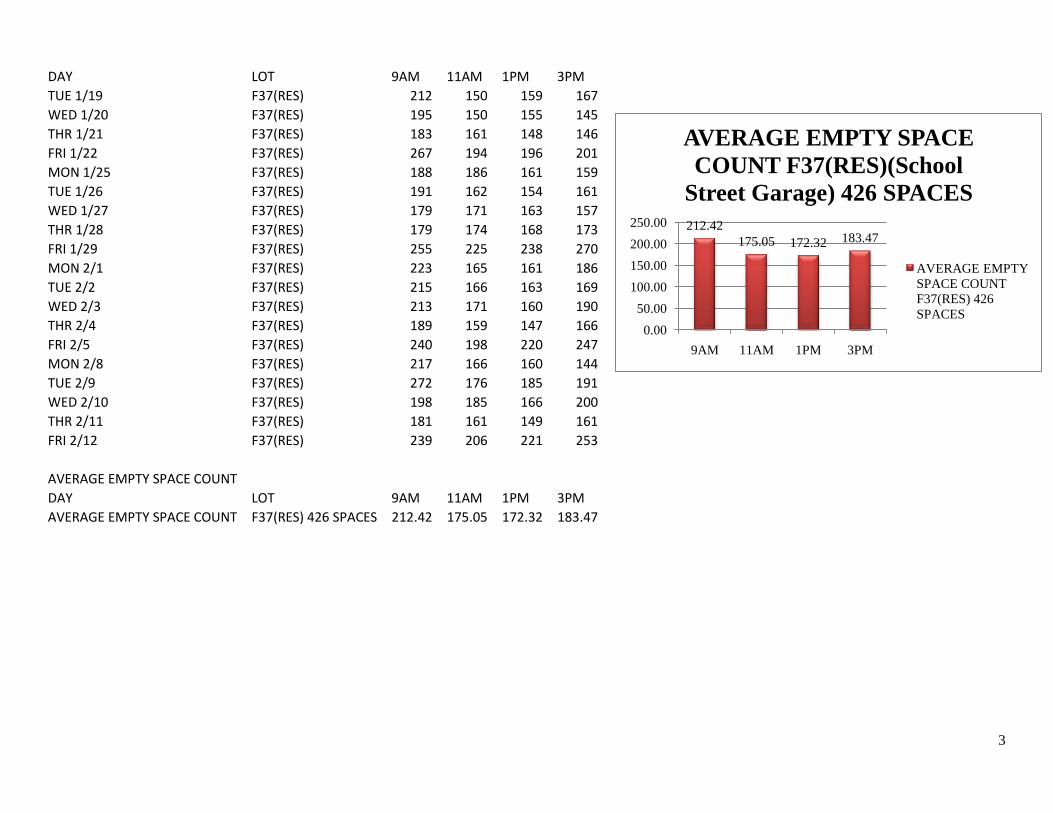
Attachment “A” Area 1, Page 4
This page contains the average empty individually reserved spaces in the School Street
Garage (SSG). There are 426 individually reserved parking spaces in the SSG. According to
our chart, during the day time between the hours of 11:00 a.m. and 3:00 p.m. the average number
of empty spaces is between 175 and 183. The empty count assists the University in identifying
elasticity10 in parking demand and underutilization of existing space.
Attachment “A” Area 1, Page 6
10 Elasticity: In economics, elasticity is the ratio of the percent change in one variable to the percent change in
another variable. It is a tool for measuring the responsiveness of a function to changes in parameters in a unit-less
way (Wikapedia.com). This same economic theory works with parking supply and demand.
26
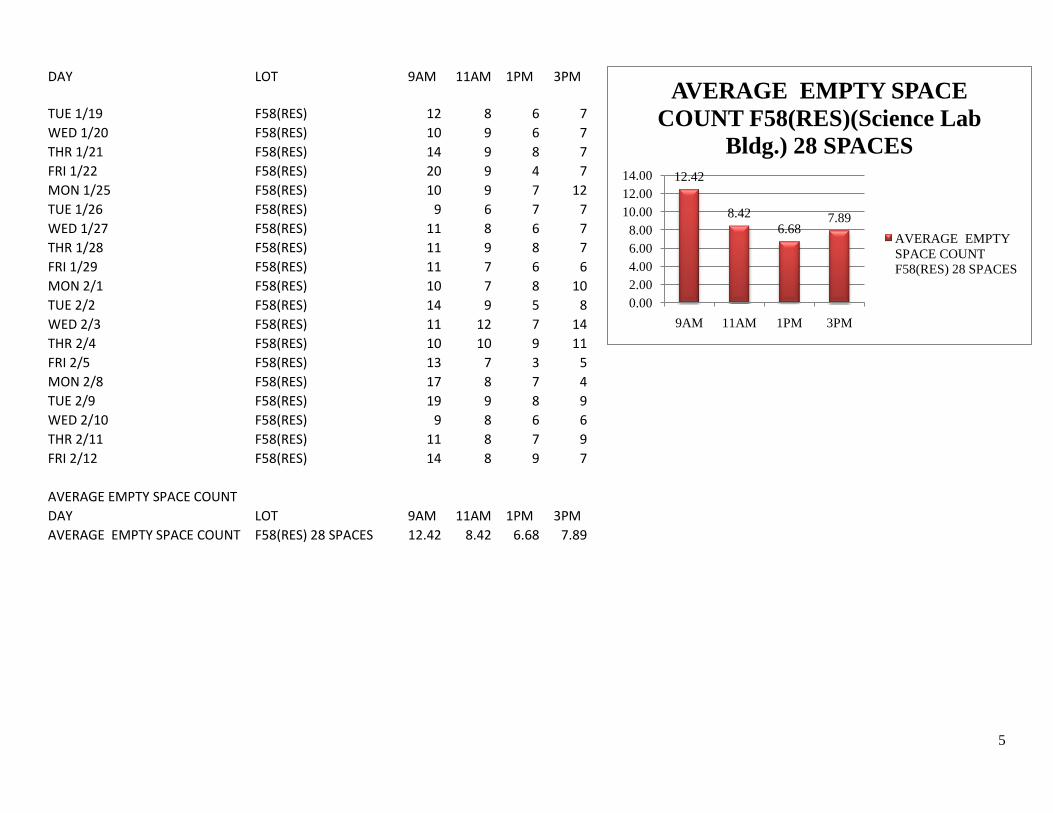
This graph represents the number of average empty spaces in the individually reserved
parking spaces in the Science Laboratory Building parking lot. There are twenty-eight
reserved spaces. On a daily basis there are between seven and eight empty spaces. Based upon
this information and the opening of the Uptown Crossing building in the near future, the PAC
initially agreed that we move forward in converting these twenty-eight individually reserved
spaces into a red zone reserved area.
Historically, parking space accommodations for this specific group did not take into
consideration the need to have access to science labs at various times throughout the work day
and night. After meeting with the SLB parkers and understanding their needs, the PAC
Committee unanimously passed the following recommendation: SLB F58: As planned,
continue to create a “mini-zone” of 6 spaces that were vacated by individually reserved parkers
leaving or retiring into a red zone reserved spaces. Continue with proposed configuration of
switching out 3 service vehicle spaces to business permit spaces and 1 vacated space (126) into a
business permit space. All other spaces will remain the same.
This lot also has eight meters as well as Service Vehicle, ADA, and Business Permit
spaces that will accommodate the activities of the university departments who will be relocated
into the Uptown Crossing suite.
There are few individually reserved signed spaces in F43 & F26. The reconfiguration of
the removal of individually-signed spaces in these lots is an ongoing attrition process.
Attachment “A” Area 2, Page 12
Prior to fall term 2009, faculty and staff relocated due to the Stevenson and Turner
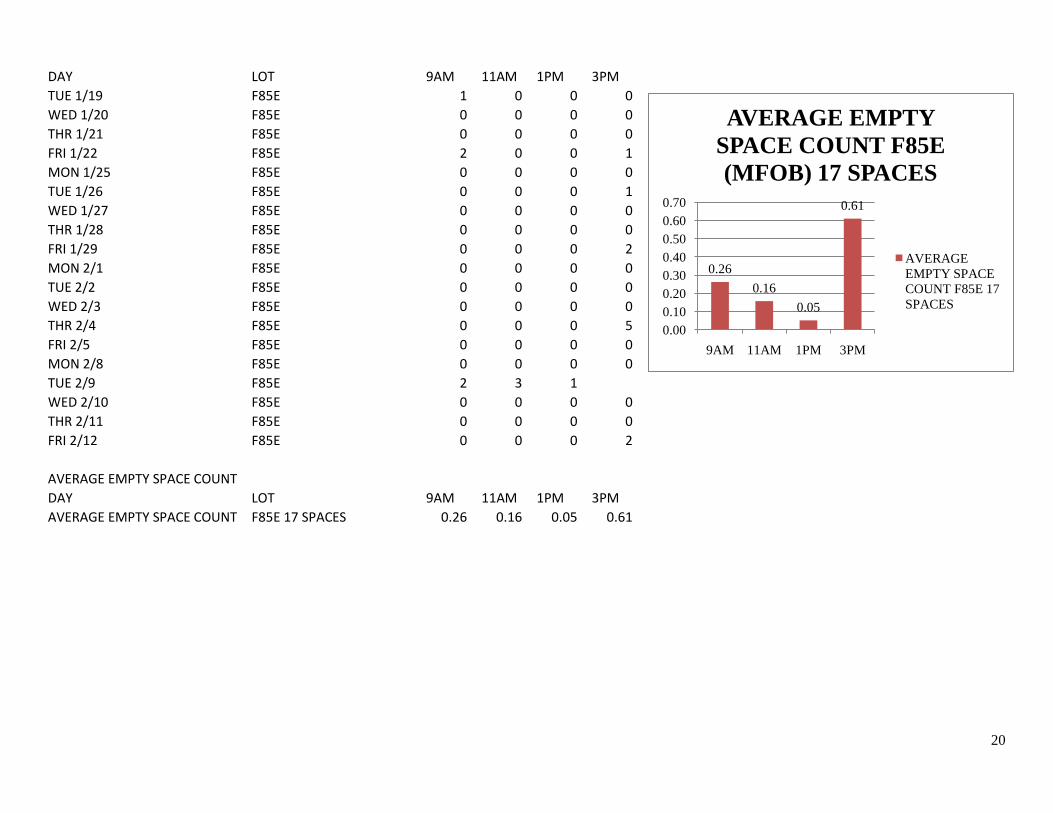
building renovations and needed parking accommodations in close proximity to the MFOB
which was placed on top of a red zone/commuter lot G85E. As such, twelve commuter spaces
next to the MFOB were reallocated to red zone faculty/staff surface spaces.
In addition, G86N, Attachment “A” Area 2, page 15 which was originally a commuter
lot with 44 spaces, was divided in half. 22 red zone faculty/staff spaces were created and 22
commuter spaces remained designated in the lot. Out of these 44 spaces, at least 12 on each side
are empty throughout the day.
27
Attachment “A” Area 3, Page 14
This sheet represents the average number of individually reserved empty spaces located
in North University Garage (NUG). There are 197 individually reserved spaces. According to
the graph of these spaces, anywhere from 70 to 80 reserve spaces sit empty all day.
Attachment “A” Area 3, Page 19
Lot G81 has 102 spaces. This lot serves as overflow event parking for a maximum of
three events during the entire year. The revenue from selling this lot during athletic events is less
than $4,000.
Attachment “A” Area 3, Page 16
Lot G53 has 148 parking spaces. The average empty spaces between 9:00 a.m. and 3:00
p.m. are 50-60.
Attachment “A” Area 3, Page 17
G73 has 273 spaces. This lot is referred to as the Ropp Lot. The average empty space on
a daily basis in this lot is 128-165. This lot has been used for special athletic events that PTS has
not charged for in the past.
Attachment “A” Area 3, Page 17
G82 has 287 spaces. The average empty spaces on a daily basis range are 204-224. This
lot is located next to the Outdoor Track. This lot is used to accommodate baseball games, which
we have not charged for in the past.
Other Space Vacancies
28
The following lots show additional minimal vacancies:
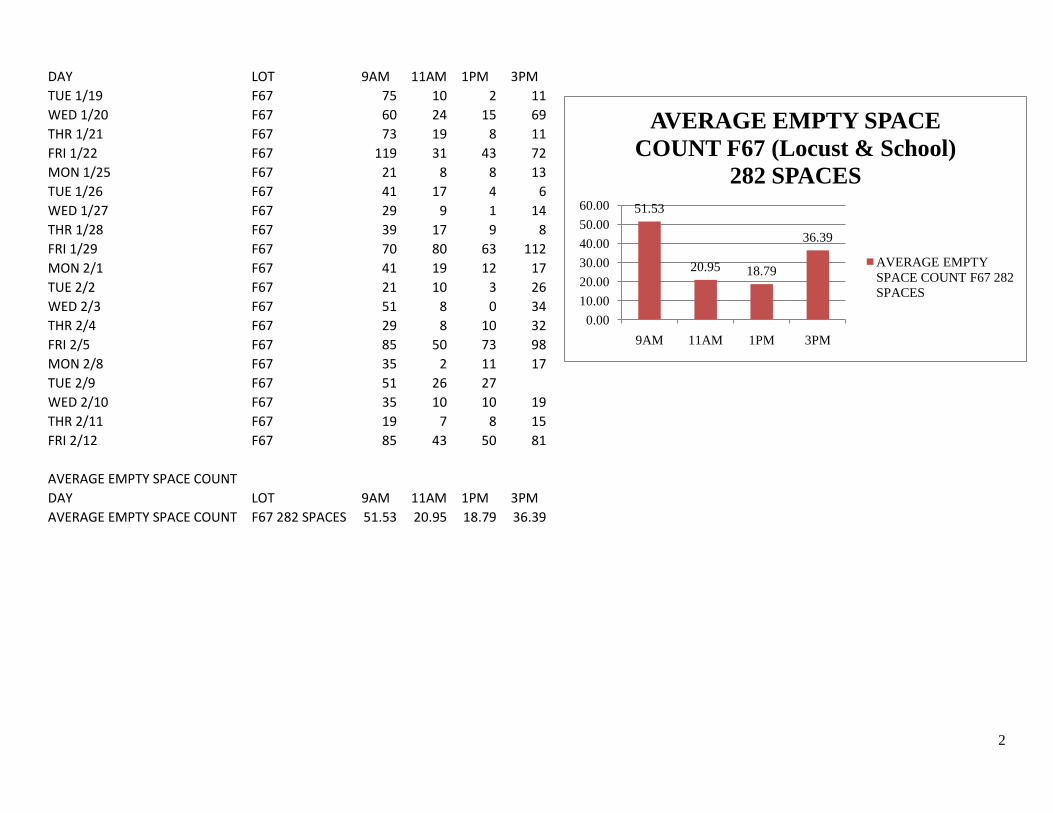
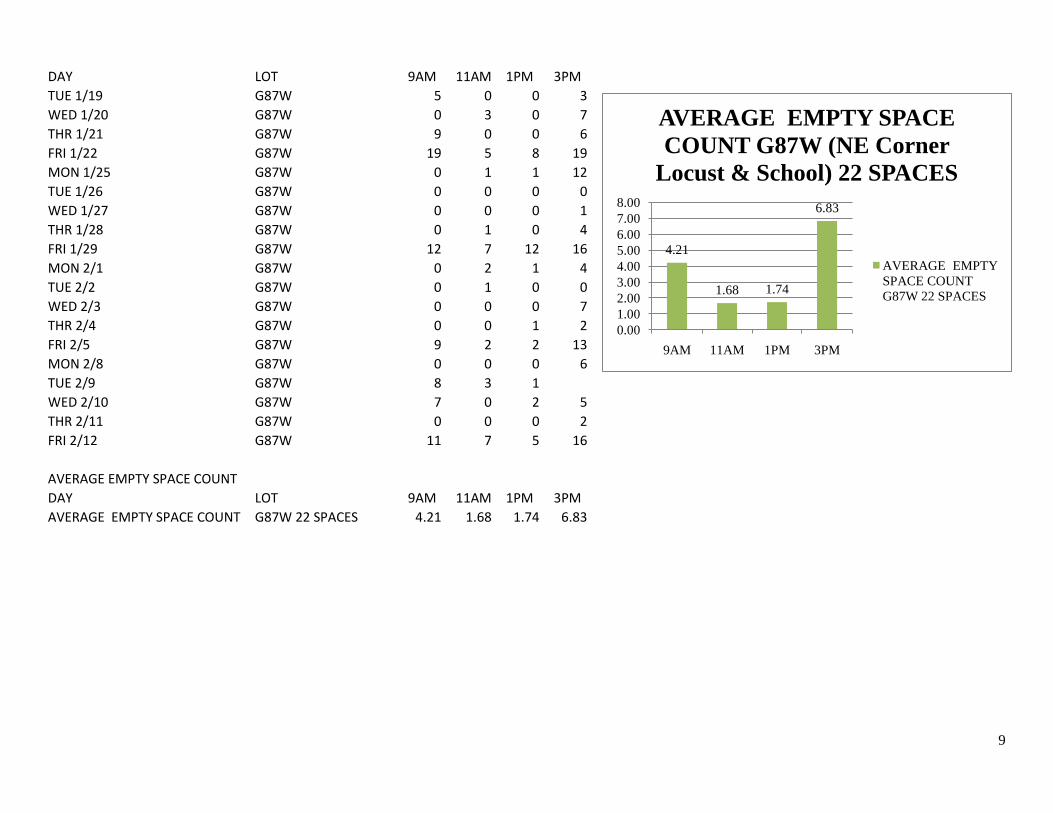
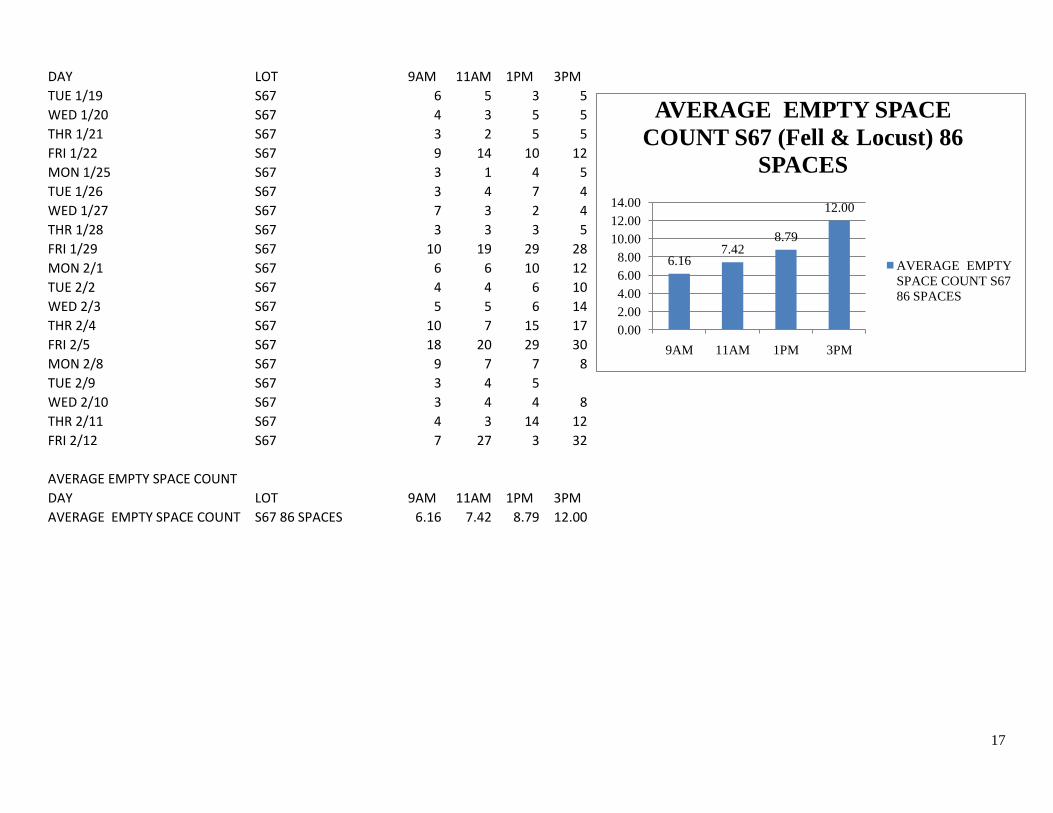
F67, 282 spaces (Locust & School); Average empty spaces 36-51.
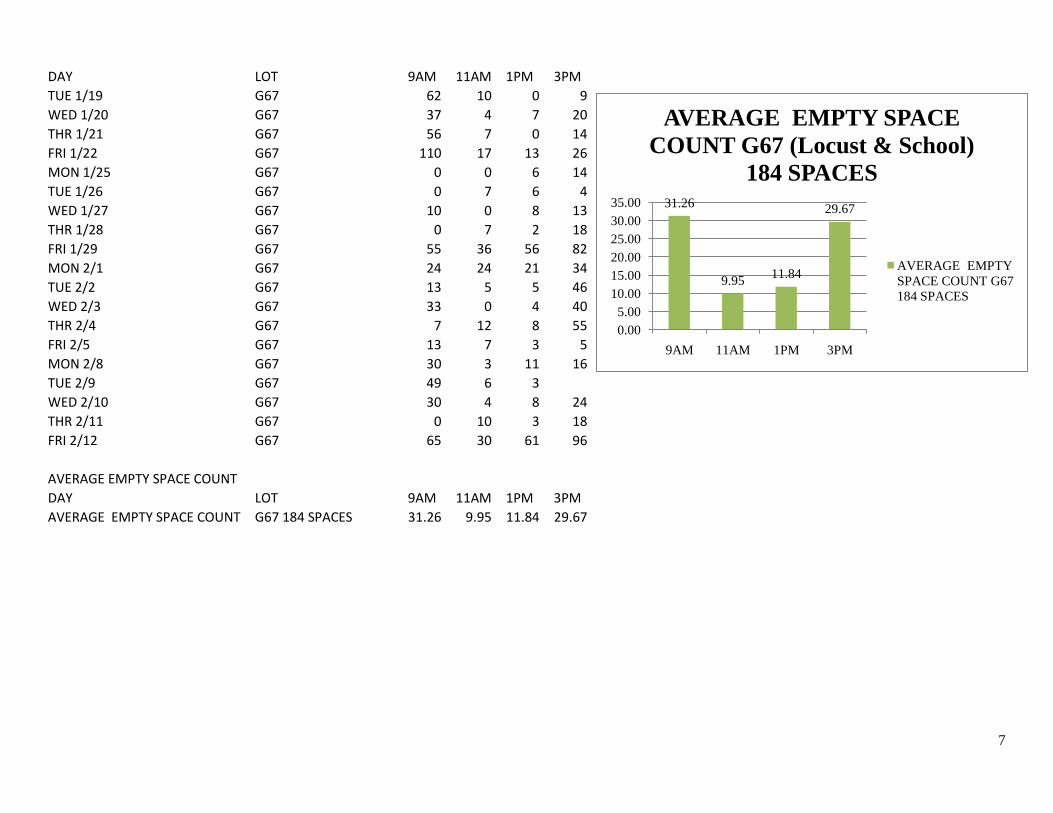
G57, 184 spaces (Locust and School); Average empty spaces 29-31.
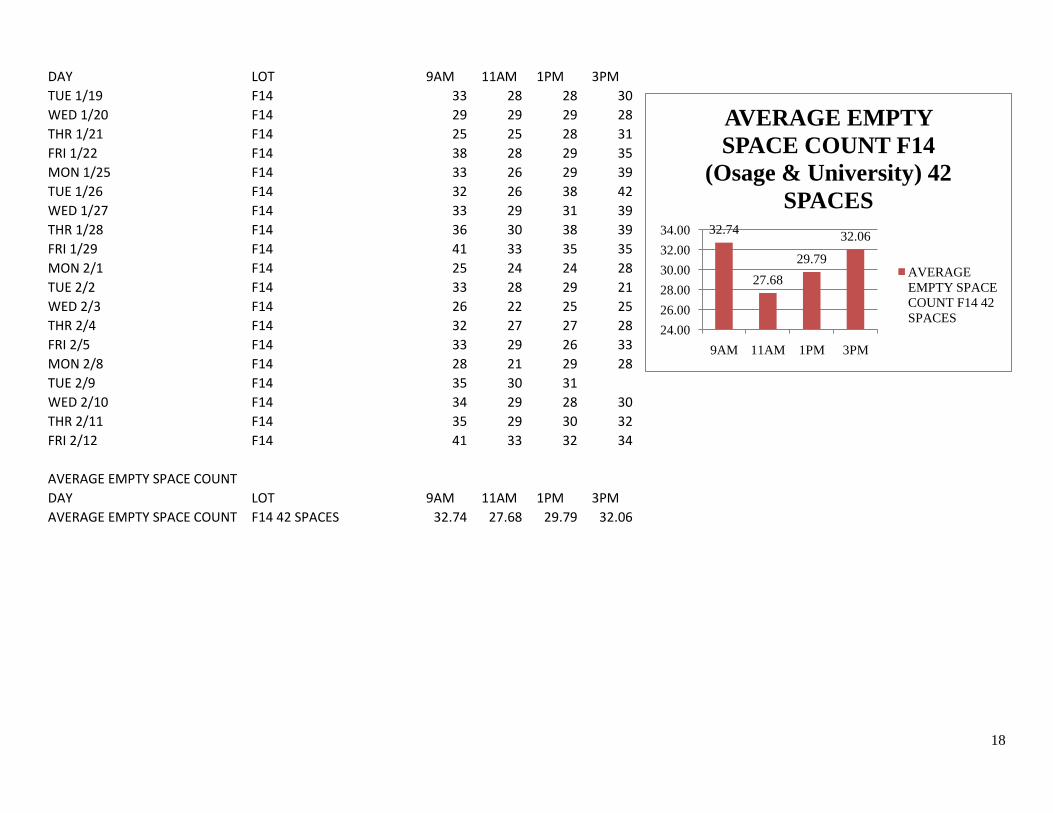
F14, 42 spaces (Osage & University): Average empty spaces 27-32.
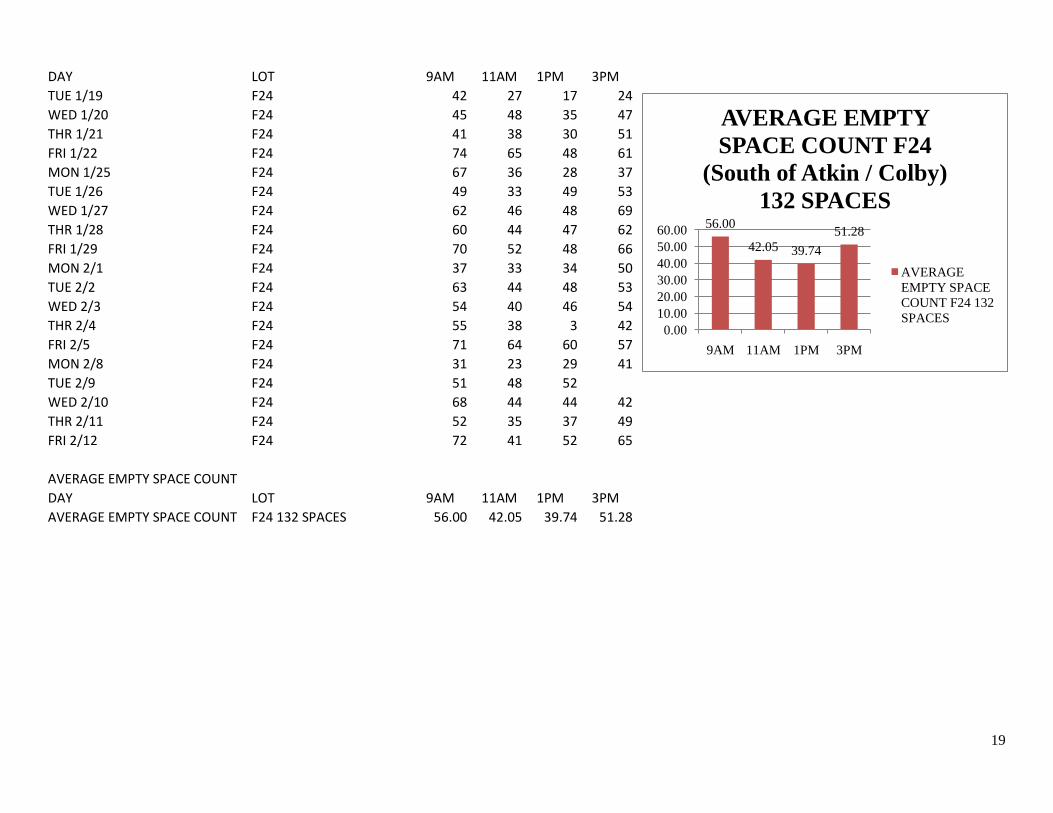
F24, 132 spaces (South of Atkin/Colby); Average empty spaces 39-56
S104 & S105 Attachment “A” Area 3, Pages 41-42
Traders Circle West (S104) has 409 spaces. The average empty space varies between
277 and 283 on a daily basis. Traders Circle Interior (S105) has 404 spaces. This lot is
completely empty each day of the year.
PTS pays the debt service on S105 for the ISU Foundation in the amount of $55,000
annually as well as pays property taxes in the area of $10,000 annually. PTS has a separate
agreement with Snyder Corporation which subsidizes the nite ride transit program in the amount
of $14,420 annually. In addition, PTS receives revenue from the Pointe Apartments for transit
services of $14,420 annually. In exchange for transit for Lincoln College students, PTS receives
$1,600 annually. These three agreements generate $29,400 in revenue annually.
Direct revenue loss due to 404 empty spaces in S105 is $31,916. Revenue loss due to
283 empty spaces in S104 is $22,357. The PTS subsidy (loss of revenue of empty spaces &
lease costs) for S105 is $119,273.
Gregory Street Lot
The Gregory Street Lot is located north of the Motorcycle Safety office. Although PTS
has paid over $200,000 to resurface this lot, it remains empty on a daily basis. The only time this
lot is used is during basketball season. Many people park in this lot and PTS provides free
29
transit by bus for those who park and ride. PTS also pays $9,000+ annually for external bus
transit to accommodate those attending athletic events.
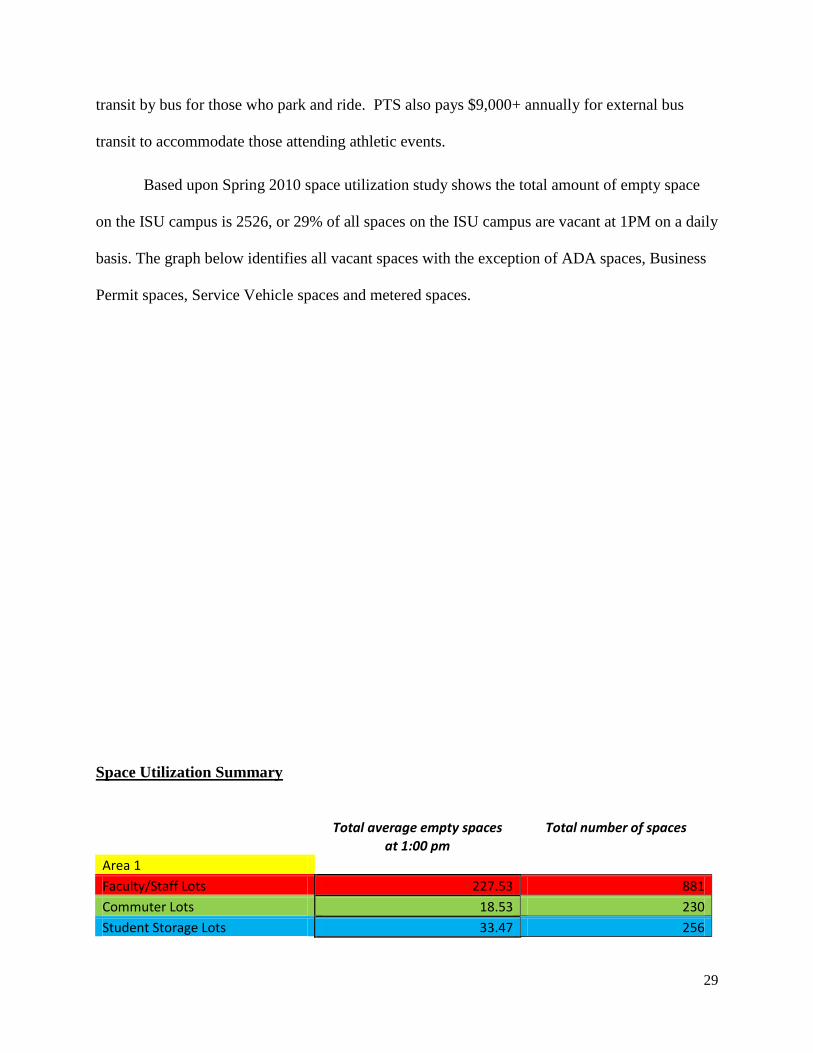
Based upon Spring 2010 space utilization study shows the total amount of empty space
on the ISU campus is 2526, or 29% of all spaces on the ISU campus are vacant at 1PM on a daily
basis. The graph below identifies all vacant spaces with the exception of ADA spaces, Business
Permit spaces, Service Vehicle spaces and metered spaces.
Space Utilization Summary
Total average empty spaces Total number of spaces
at 1:00 pm
Area 1 Faculty/Staff Lots 227.53 881
Commuter Lots 18.53 230
Student Storage Lots 33.47 256
30
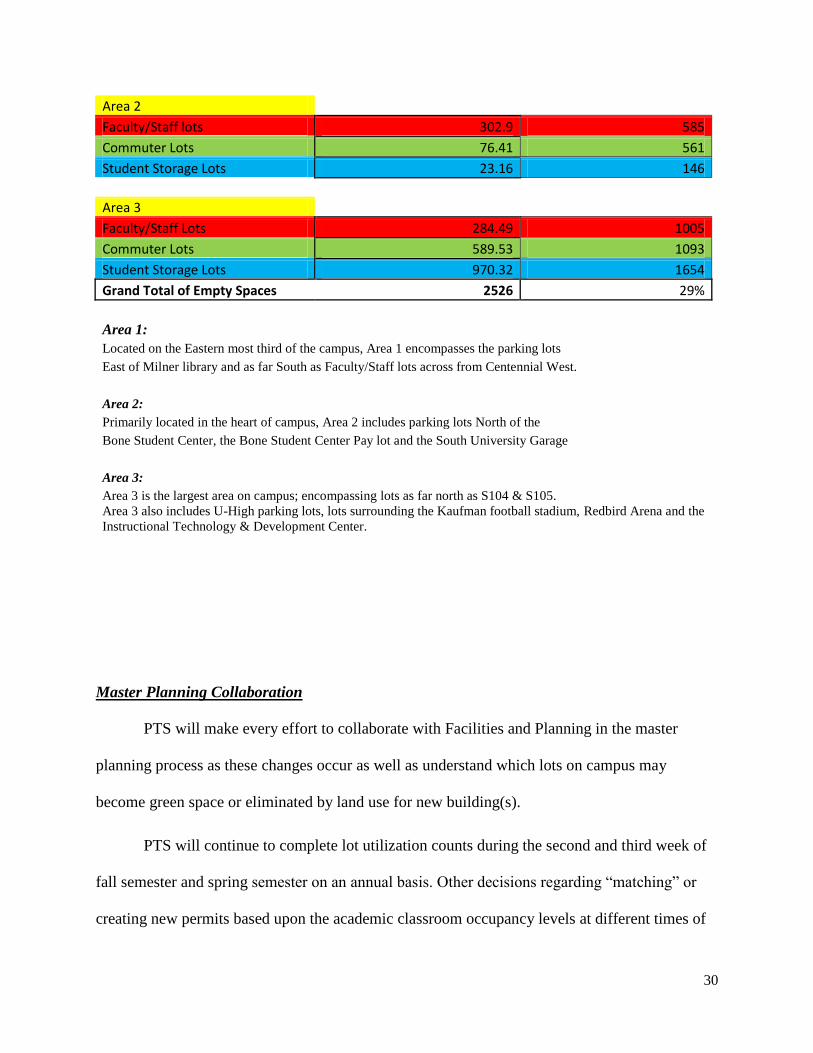
Area 2 Faculty/Staff lots 302.9 585
Commuter Lots 76.41 561
Student Storage Lots 23.16 146
Area 3 Faculty/Staff Lots 284.49 1005
Commuter Lots 589.53 1093
Student Storage Lots 970.32 1654
Grand Total of Empty Spaces 2526 29%
Area 1:
Located on the Eastern most third of the campus, Area 1 encompasses the parking lots
East of Milner library and as far South as Faculty/Staff lots across from Centennial West.
Area 2:
Primarily located in the heart of campus, Area 2 includes parking lots North of the
Bone Student Center, the Bone Student Center Pay lot and the South University Garage
Area 3:
Area 3 is the largest area on campus; encompassing lots as far north as S104 & S105.
Area 3 also includes U-High parking lots, lots surrounding the Kaufman football stadium, Redbird Arena and the
Instructional Technology & Development Center.
Master Planning Collaboration
PTS will make every effort to collaborate with Facilities and Planning in the master
planning process as these changes occur as well as understand which lots on campus may
become green space or eliminated by land use for new building(s).
PTS will continue to complete lot utilization counts during the second and third week of
fall semester and spring semester on an annual basis. Other decisions regarding “matching” or
creating new permits based upon the academic classroom occupancy levels at different times of
31
the week or semester presents another opportunity to meet the parking needs of the faculty, staff
and students.
TDM Summary and Recommendations
Fall semester 2009, President Bowman made a request for a revised Campus Master Plan.
University and local community members responded with a wide and diverse spectrum of ideas
and suggestions. “The ISU Capital Planning and Budget Team and the Steering Team began
their aggressive program to gather information last fall. Their ultimate goal is producing the new
Master Plan, a document that will serve as Illinois State‟s vision for a campus building growth
32
and renewal of buildings along with outdoor spaces to unify all functions of the
University….More parking along with an improved Milner Library facility…. (Relations,
2012)”.
Ideally, the data and recommendations of this TDM Plan should become integrated on a
holistic level with the ISU Campus Master Plan. This TDM Plan focuses on transportation
solutions for all members of the community; dependence on SOV driving that negatively affects
transit efficiencies and adversely impacts parking space utilization campus-wide; and offers
recommendations on multiple levels while increasing the viability of alternative (active)
transportation which will require a shift from the current paradigm of relatively cheap on-campus
parking to a multimodal system that makes it convenient, quick and safe for students, faculty,
staff and visitors to access transit, carpool, ride a bike, or walk.
This Transportation Demand Management Plan is intended to serve as a guide to expand
Parking and Transportation‟s mission and to incorporate various parking strategies at Illinois
State University. By utilizing the data collected within this Plan, PTS aspires to improve the
efficiency of a comprehensive transportation system and to maximize the use of existing
transportation options by implementing the recommendations outlined in this section. A
balanced, multi-modal transportation system promotes choices for ridership and supports the
33
livability of the entire campus environment. This TDM provides information and education
about transit options and offers recommendations for improvement.
As discussed earlier, benefits of TDM programs and strategies include a decreased need
for parking spaces; increased travel options for students, faculty, staff and visitors; decreased
traffic congestion; reduction in auto-related emissions; and improved air quality.
While it is recognized that implementation of the following recommendations will
require continued discussions with all campus stakeholders and will also require a significant
amount of time until fully completed. As time passes, some of these recommendations will be
influenced by other university decisions and may not come to full fruition. At this time, with
today‟s knowledge and data, PTS recommends the following:
Process Improvements
Collaborate with B-NPTS BOT to publish all new transit maps, including individual
fixed route maps to be placed in student housing.
Improve transit routes and accessibility throughout campus.
Improve transit route efficiency by increasing trip frequencies in all existing service.
Increasing bike rack availability and replacing with new designs.
Pursue interactive transit technology for individual route planning through multiple
media resources such as cell phones, text messaging and direct internet access to real-
time transit travel information.
Create bike-friendly streets and paths.
Continue to promote remote parking away from congested areas and shuttle drivers into
the heart of campus on buses.
Create and implement a new marketing campaign in collaboration with B-NPTS.
34
Post bus schedules and rider information inside the nine new transit shelters.
Post bus schedules and rider information inside the six new bike shelters.
Organize members of the ISU community to support a carpool initiative and create a new
carpool program. Carpool spaces would be incorporated into areas in all garages and
ramps, as well as close-in surface lots.
Collaborate with the Student Body President in the formation of a bicycle transit
committee to pursue the concept of a bicycle co-op on campus.
Utilization Review Improvements
It is further recommended as opportunities arise resulting from implementation of the
Campus Master Plan, that smaller lots located on the interior of campus be converted to green
space. This further supports sustainability initiatives as well as creates a more pedestrian
friendly environment.
School Street Garage
In order to improve utilization, the PAC recommends the removal of each individually reserved
parking signs and supports the conversion of these 426 spaces into a red reserved zone. This change
would become effective fall semester of 2011.
North University Garage
In order to improve utilization, the PAC recommends the removal of each individually reserved
parking signs and supports the conversion of these 197 spaces into a red reserved zone. This change
would become effective fall semester of 2011.
35
SLB F58
Further review of this lot will continue through FY2011. Changes in allocations may occur as a
result of the review and implementation of red reserved zones elsewhere on campus.
G86N
The impact of the additional MFOB placed on the G85E lot will further reduce the
number of commuter spaces in G85E (surface lot) in an effort to accommodate parking patrons
from the Mennonite Nursing Program. Consideration should be given to convert G86N to a
reserved carpool lot, fall 2011.
Lot G81
PTS recommends conversion of this lot to a Student Storage Lot. This lot is adjacent to
S81 which is used for student housing parking, and the demand for student storage is greater than
any other type of parking on campus and for residents in the recently approved Cardinal Court
renovation. Once approved, PTS will begin selling space in this location for our housing
residents for fall 2011 semester. The additional revenue for parking is estimated to be $26,000.
Lot G82
PTS recommends charging for parking in this lot for athletic events, or consider
reorganizing this lot into a mixed-use program, or new permit program. Discussions with the
PAC will take place fall semester 2010.
G53
PTS recommends charging for parking for football and basketball events.
36
PTS will sell additional commuter permits for this lot.
G73
PTS recommends charging for parking in this lot for athletic events, or consider
reorganizing this lot into a mixed use or new permit program. Discussions with the PAC will
take place fall semester 2010.
Attachment “A” Space Utilization Reports by campus area
Attachment “B” New Transit and Bicycle Locations
Citations
Cardinal, E. (2010, April 30). Sustainability Coordinator, ISU.
ISU President, Al . Boman. (2009). State of the University Address.
Legal, B.-N. &. (2010-2014). Universal Access Contractual Agreement.
Relations, I. M. (2012). Campus Master Plan revision underway.
37
Spacek, D. (2010). Public Transportation Bureau Chief. Illinois Department of Transportation; Division
of Public and Intermodal Transportation.
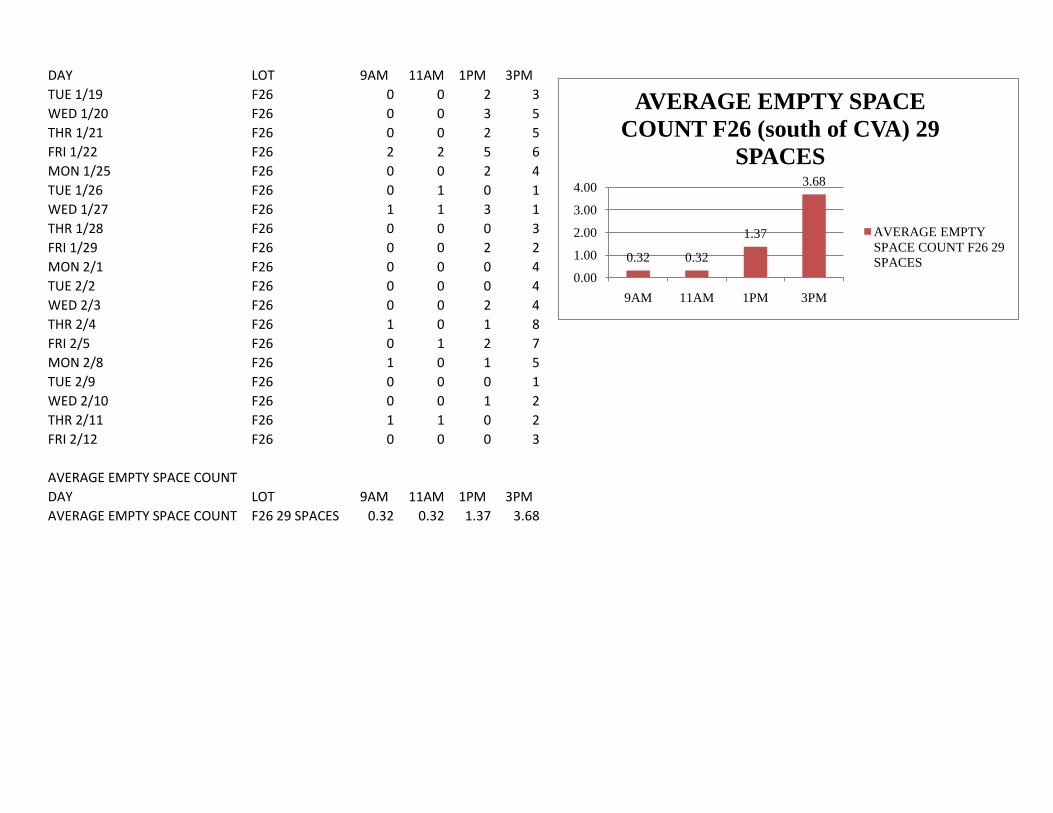
DAY LOT 9AM 11AM 1PM 3PM
TUE 1/19 F26 0 0 2 3
WED 1/20 F26 0 0 3 5 THR 1/21 F26 0 0 2 5 FRI 1/22 F26 2 2 5 6 MON 1/25 F26 0 0 2 4 TUE 1/26 F26 0 1 0 1 WED 1/27 F26 1 1 3 1 THR 1/28 F26 0 0 0 3 FRI 1/29 F26 0 0 2 2 MON 2/1 F26 0 0 0 4 TUE 2/2 F26 0 0 0 4 WED 2/3 F26 0 0 2 4 THR 2/4 F26 1 0 1 8 FRI 2/5 F26 0 1 2 7 MON 2/8 F26 1 0 1 5 TUE 2/9 F26 0 0 0 1 WED 2/10 F26 0 0 1 2 THR 2/11 F26 1 1 0 2 FRI 2/12 F26 0 0 0 3
AVERAGE EMPTY SPACE COUNT DAY LOT 9AM 11AM 1PM 3PM
AVERAGE EMPTY SPACE COUNT F26 29 SPACES 0.32 0.32 1.37 3.68
0.32 0.32
1.37
3.68
0.00
1.00
2.00
3.00
4.00
9AM 11AM 1PM 3PM
AVERAGE EMPTY SPACE
COUNT F26 (south of CVA) 29
SPACES
AVERAGE EMPTY
SPACE COUNT F26 29
SPACES
1
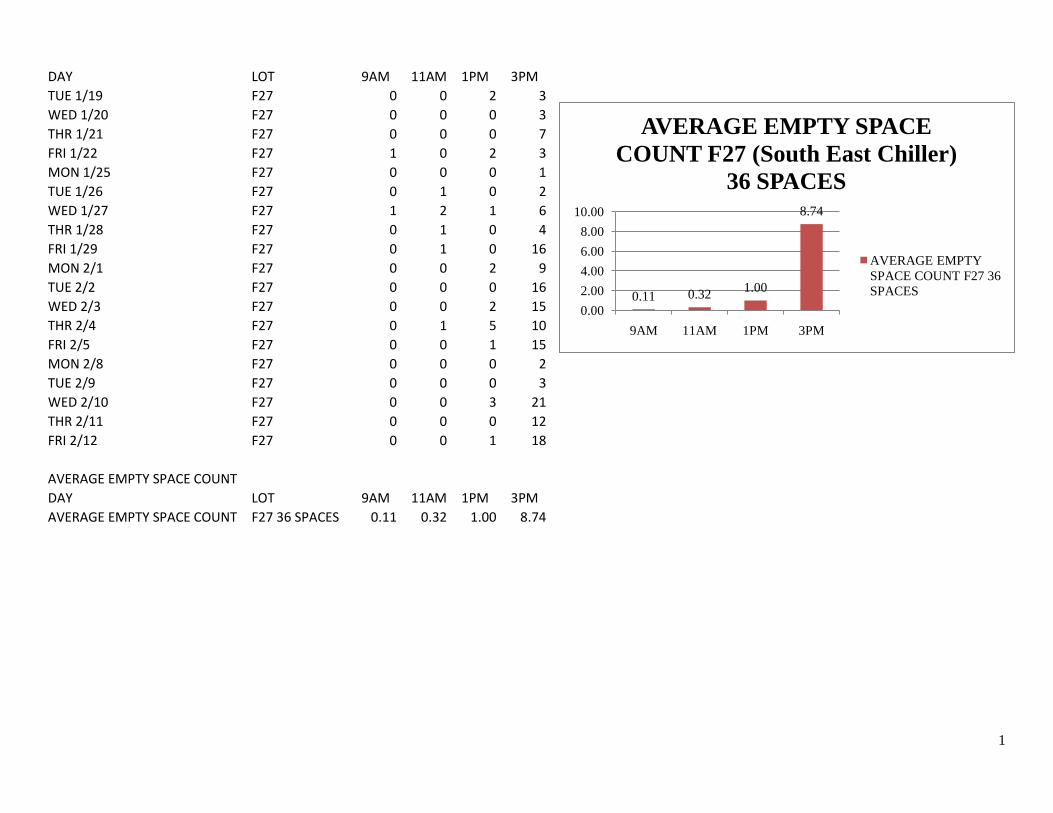
DAY LOT 9AM 11AM 1PM 3PM TUE 1/19 F27 0 0 2 3
WED 1/20 F27 0 0 0 3 THR 1/21 F27 0 0 0 7 FRI 1/22 F27 1 0 2 3 MON 1/25 F27 0 0 0 1 TUE 1/26 F27 0 1 0 2 WED 1/27 F27 1 2 1 6 THR 1/28 F27 0 1 0 4 FRI 1/29 F27 0 1 0 16 MON 2/1 F27 0 0 2 9 TUE 2/2 F27 0 0 0 16 WED 2/3 F27 0 0 2 15 THR 2/4 F27 0 1 5 10 FRI 2/5 F27 0 0 1 15 MON 2/8 F27 0 0 0 2 TUE 2/9 F27 0 0 0 3
WED 2/10 F27 0 0 3 21 THR 2/11 F27 0 0 0 12 FRI 2/12 F27 0 0 1 18
AVERAGE EMPTY SPACE COUNT DAY LOT 9AM 11AM 1PM 3PM
AVERAGE EMPTY SPACE COUNT F27 36 SPACES 0.11 0.32 1.00 8.74
0.11 0.321.00
8.74
0.00
2.00
4.00
6.00
8.00
10.00
9AM 11AM 1PM 3PM
AVERAGE EMPTY SPACE
COUNT F27 (South East Chiller)
36 SPACES
AVERAGE EMPTY
SPACE COUNT F27 36
SPACES
2
DAY LOT 9AM 11AM 1PM 3PM
TUE 1/19 F67 75 10 2 11
WED 1/20 F67 60 24 15 69
THR 1/21 F67 73 19 8 11
FRI 1/22 F67 119 31 43 72
MON 1/25 F67 21 8 8 13
TUE 1/26 F67 41 17 4 6
WED 1/27 F67 29 9 1 14
THR 1/28 F67 39 17 9 8
FRI 1/29 F67 70 80 63 112
MON 2/1 F67 41 19 12 17
TUE 2/2 F67 21 10 3 26
WED 2/3 F67 51 8 0 34
THR 2/4 F67 29 8 10 32
FRI 2/5 F67 85 50 73 98
MON 2/8 F67 35 2 11 17
TUE 2/9 F67 51 26 27 WED 2/10 F67 35 10 10 19
THR 2/11 F67 19 7 8 15 FRI 2/12 F67 85 43 50 81
AVERAGE EMPTY SPACE COUNT DAY LOT 9AM 11AM 1PM 3PM
AVERAGE EMPTY SPACE COUNT F67 282 SPACES 51.53 20.95 18.79 36.39
51.53
20.95 18.79
36.39
0.00
10.00
20.00
30.00
40.00
50.00
60.00
9AM 11AM 1PM 3PM
AVERAGE EMPTY SPACE
COUNT F67 (Locust & School)
282 SPACES
AVERAGE EMPTY
SPACE COUNT F67 282
SPACES
3
DAY LOT 9AM 11AM 1PM 3PM TUE 1/19 F37(RES) 212 150 159 167
WED 1/20 F37(RES) 195 150 155 145
THR 1/21 F37(RES) 183 161 148 146
FRI 1/22 F37(RES) 267 194 196 201
MON 1/25 F37(RES) 188 186 161 159
TUE 1/26 F37(RES) 191 162 154 161
WED 1/27 F37(RES) 179 171 163 157
THR 1/28 F37(RES) 179 174 168 173
FRI 1/29 F37(RES) 255 225 238 270
MON 2/1 F37(RES) 223 165 161 186
TUE 2/2 F37(RES) 215 166 163 169
WED 2/3 F37(RES) 213 171 160 190
THR 2/4 F37(RES) 189 159 147 166
FRI 2/5 F37(RES) 240 198 220 247
MON 2/8 F37(RES) 217 166 160 144
TUE 2/9 F37(RES) 272 176 185 191 WED 2/10 F37(RES) 198 185 166 200 THR 2/11 F37(RES) 181 161 149 161 FRI 2/12 F37(RES) 239 206 221 253
AVERAGE EMPTY SPACE COUNT DAY LOT 9AM 11AM 1PM 3PM
AVERAGE EMPTY SPACE COUNT F37(RES) 426 SPACES 212.42 175.05 172.32 183.47
212.42
175.05 172.32 183.47
0.00
50.00
100.00
150.00
200.00
250.00
9AM 11AM 1PM 3PM
AVERAGE EMPTY SPACE
COUNT F37(RES)(School
Street Garage) 426 SPACES
AVERAGE EMPTY
SPACE COUNT
F37(RES) 426
SPACES
4
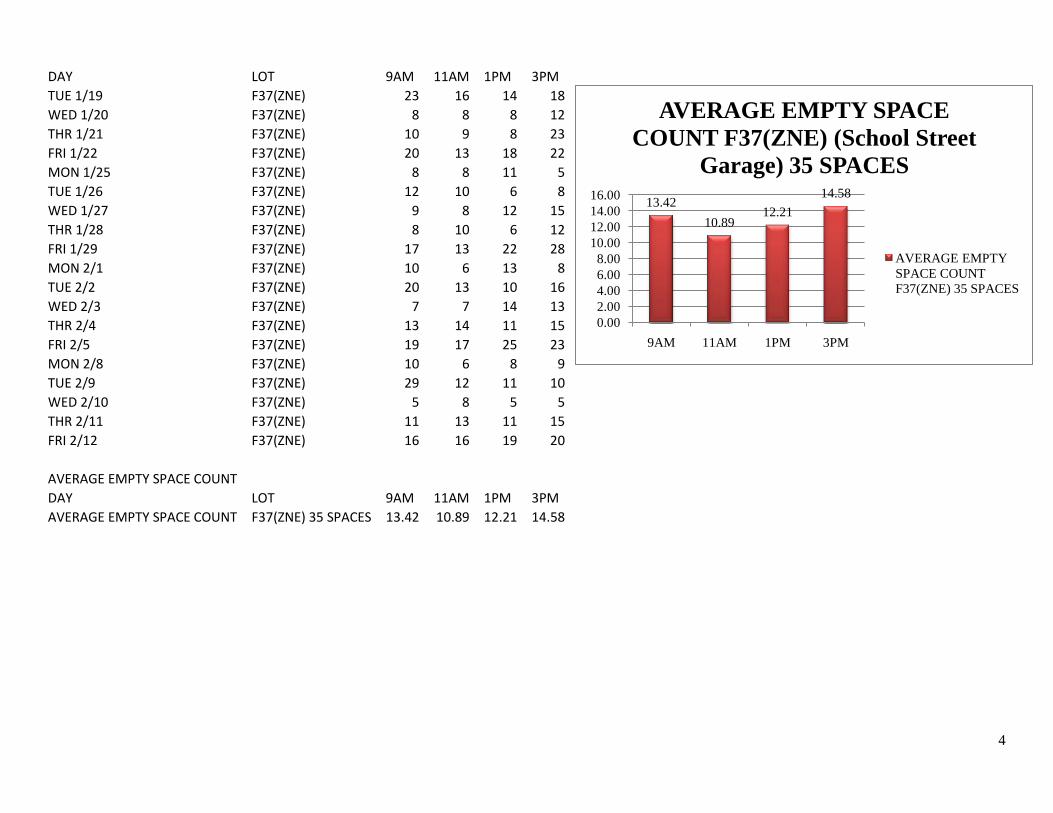
DAY LOT 9AM 11AM 1PM 3PM TUE 1/19 F37(ZNE) 23 16 14 18
WED 1/20 F37(ZNE) 8 8 8 12 THR 1/21 F37(ZNE) 10 9 8 23 FRI 1/22 F37(ZNE) 20 13 18 22 MON 1/25 F37(ZNE) 8 8 11 5 TUE 1/26 F37(ZNE) 12 10 6 8 WED 1/27 F37(ZNE) 9 8 12 15 THR 1/28 F37(ZNE) 8 10 6 12 FRI 1/29 F37(ZNE) 17 13 22 28 MON 2/1 F37(ZNE) 10 6 13 8 TUE 2/2 F37(ZNE) 20 13 10 16 WED 2/3 F37(ZNE) 7 7 14 13 THR 2/4 F37(ZNE) 13 14 11 15 FRI 2/5 F37(ZNE) 19 17 25 23 MON 2/8 F37(ZNE) 10 6 8 9 TUE 2/9 F37(ZNE) 29 12 11 10
WED 2/10 F37(ZNE) 5 8 5 5 THR 2/11 F37(ZNE) 11 13 11 15 FRI 2/12 F37(ZNE) 16 16 19 20
AVERAGE EMPTY SPACE COUNT DAY LOT 9AM 11AM 1PM 3PM
AVERAGE EMPTY SPACE COUNT F37(ZNE) 35 SPACES 13.42 10.89 12.21 14.58
13.42
10.8912.21
14.58
0.00
2.00
4.00
6.00
8.00
10.00
12.00
14.00
16.00
9AM 11AM 1PM 3PM
AVERAGE EMPTY SPACE
COUNT F37(ZNE) (School Street
Garage) 35 SPACES
AVERAGE EMPTY
SPACE COUNT
F37(ZNE) 35 SPACES
5
DAY LOT 9AM 11AM 1PM 3PM
TUE 1/19 F58(RES) 12 8 6 7
WED 1/20 F58(RES) 10 9 6 7 THR 1/21 F58(RES) 14 9 8 7 FRI 1/22 F58(RES) 20 9 4 7 MON 1/25 F58(RES) 10 9 7 12 TUE 1/26 F58(RES) 9 6 7 7 WED 1/27 F58(RES) 11 8 6 7 THR 1/28 F58(RES) 11 9 8 7 FRI 1/29 F58(RES) 11 7 6 6 MON 2/1 F58(RES) 10 7 8 10 TUE 2/2 F58(RES) 14 9 5 8 WED 2/3 F58(RES) 11 12 7 14 13
THR 2/4 F58(RES) 10 10 9 11 FRI 2/5 F58(RES) 13 7 3 5 MON 2/8 F58(RES) 17 8 7 4 TUE 2/9 F58(RES) 19 9 8 9 WED 2/10 F58(RES) 9 8 6 6 THR 2/11 F58(RES) 11 8 7 9 FRI 2/12 F58(RES) 14 8 9 7
AVERAGE EMPTY SPACE COUNT DAY LOT 9AM 11AM 1PM 3PM
AVERAGE EMPTY SPACE COUNT F58(RES) 28 SPACES 12.42 8.42 6.68 7.89
12.42
8.42
6.687.89
0.00
2.00
4.00
6.00
8.00
10.00
12.00
14.00
9AM 11AM 1PM 3PM
AVERAGE EMPTY SPACE
COUNT F58(RES)(Science Lab
Bldg.) 28 SPACES
AVERAGE EMPTY
SPACE COUNT
F58(RES) 28 SPACES
6
DAY LOT 9AM 11AM 1PM 3PM TUE 1/19 JULIAN (RES) 14 14 15 10
WED 1/20 JULIAN (RES) 18 24 24 18 THR 1/21 JULIAN (RES) 17 20 13 13 FRI 1/22 JULIAN (RES) 15 12 15 12 MON 1/25 JULIAN (RES) 9 22 18 16 TUE 1/26 JULIAN (RES) 17 20 17 13 WED 1/27 JULIAN (RES) 17 22 17 16 THR 1/28 JULIAN (RES) 17 12 18 13 FRI 1/29 JULIAN (RES) 14 13 15 26 MON 2/1 JULIAN (RES) 15 12 10 15 TUE 2/2 JULIAN (RES) 12 14 15 15 WED 2/3 JULIAN (RES) 15 16 9 14 THR 2/4 JULIAN (RES) 11 15 11 13 FRI 2/5 JULIAN (RES) 19 15 17 20 MON 2/8 JULIAN (RES) 16 9 16 10 TUE 2/9 JULIAN (RES) 19 16 23
WED 2/10 JULIAN (RES) 13 13 9 13 THR 2/11 JULIAN (RES) 7 11 9 11 FRI 2/12 JULIAN (RES) 13 15 17 17
AVERAGE EMPTY SPACE COUNT DAY LOT 9AM 11AM 1PM 3PM
AVERAGE EMPTY SPACE COUNT JULIAN(RES) 45 SPACES 14.63 15.53 15.16 14.72
14.63
15.53
15.16
14.72
14.00
14.20
14.40
14.60
14.80
15.00
15.20
15.40
15.60
9AM 11AM 1PM 3PM
AVERAGE EMPTY SPACE
COUNT JULIAN(RES) 45
SPACES
AVERAGE EMPTY
SPACE COUNT
JULIAN(RES) 45
SPACES
7
DAY LOT 9AM 11AM 1PM 3PM TUE 1/19 G67 62 10 0 9
WED 1/20 G67 37 4 7 20 THR 1/21 G67 56 7 0 14 FRI 1/22 G67 110 17 13 26 MON 1/25 G67 0 0 6 14 TUE 1/26 G67 0 7 6 4 WED 1/27 G67 10 0 8 13 THR 1/28 G67 0 7 2 18 FRI 1/29 G67 55 36 56 82 MON 2/1 G67 24 24 21 34 TUE 2/2 G67 13 5 5 46 WED 2/3 G67 33 0 4 40 THR 2/4 G67 7 12 8 55 FRI 2/5 G67 13 7 3 5 MON 2/8 G67 30 3 11 16 TUE 2/9 G67 49 6 3
WED 2/10 G67 30 4 8 24 THR 2/11 G67 0 10 3 18 FRI 2/12 G67 65 30 61 96
AVERAGE EMPTY SPACE COUNT DAY LOT 9AM 11AM 1PM 3PM
AVERAGE EMPTY SPACE COUNT G67 184 SPACES 31.26 9.95 11.84 29.67
31.26
9.9511.84
29.67
0.00
5.00
10.00
15.00
20.00
25.00
30.00
35.00
9AM 11AM 1PM 3PM
AVERAGE EMPTY SPACE
COUNT G67 (Locust & School)
184 SPACES
AVERAGE EMPTY
SPACE COUNT G67
184 SPACES
8
DAY LOT 9AM 11AM 1PM 3PM TUE 1/19 G87E 21 7 0 2
WED 1/20 G87E 21 3 1 0 THR 1/21 G87E 22 5 0 7 FRI 1/22 G87E 24 18 2 5 MON 1/25 G87E 13 1 4 0 TUE 1/26 G87E 10 4 1 4 WED 1/27 G87E 19 0 3 10 THR 1/28 G87E 12 4 3 2 FRI 1/29 G87E 23 19 21 23 MON 2/1 G87E 19 3 8 10 TUE 2/2 G87E 8 3 0 14 WED 2/3 G87E 20 0 2 16 THR 2/4 G87E 8 3 1 16 FRI 2/5 G87E 21 16 19 24 MON 2/8 G87E 21 0 0 7 TUE 2/9 G87E 22 8 8
WED 2/10 G87E 21 4 8 8 THR 2/11 G87E 9 4 0 8 FRI 2/12 G87E 22 14 13 23
AVERAGE EMPTY SPACE COUNT DAY LOT 9AM 11AM 1PM 3PM
AVERAGE EMPTY SPACE COUNT G87E 24 SPACES 17.68 6.11 4.95 9.94
17.68
6.11 4.95
9.94
0.00
5.00
10.00
15.00
20.00
9AM 11AM 1PM 3PM
AVERAGE EMPTY SPACE
COUNT G87E (Locust St.
East of School St.) 24
SPACES
AVERAGE EMPTY
SPACE COUNT
G87E 24 SPACES
9
DAY LOT 9AM 11AM 1PM 3PM TUE 1/19 G87W 5 0 0 3
WED 1/20 G87W 0 3 0 7
THR 1/21 G87W 9 0 0 6
FRI 1/22 G87W 19 5 8 19
MON 1/25 G87W 0 1 1 12
TUE 1/26 G87W 0 0 0 0
WED 1/27 G87W 0 0 0 1
THR 1/28 G87W 0 1 0 4
FRI 1/29 G87W 12 7 12 16
MON 2/1 G87W 0 2 1 4
TUE 2/2 G87W 0 1 0 0
WED 2/3 G87W 0 0 0 7
THR 2/4 G87W 0 0 1 2
FRI 2/5 G87W 9 2 2 13
MON 2/8 G87W 0 0 0 6
TUE 2/9 G87W 8 3 1 WED 2/10 G87W 7 0 2 5
THR 2/11 G87W 0 0 0 2 FRI 2/12 G87W 11 7 5 16
AVERAGE EMPTY SPACE COUNT DAY LOT 9AM 11AM 1PM 3PM
AVERAGE EMPTY SPACE COUNT G87W 22 SPACES 4.21 1.68 1.74 6.83
4.21
1.68 1.74
6.83
0.00
1.00
2.00
3.00
4.00
5.00
6.00
7.00
8.00
9AM 11AM 1PM 3PM
AVERAGE EMPTY SPACE
COUNT G87W (NE Corner
Locust & School) 22 SPACES
AVERAGE EMPTY
SPACE COUNT
G87W 22 SPACES
10
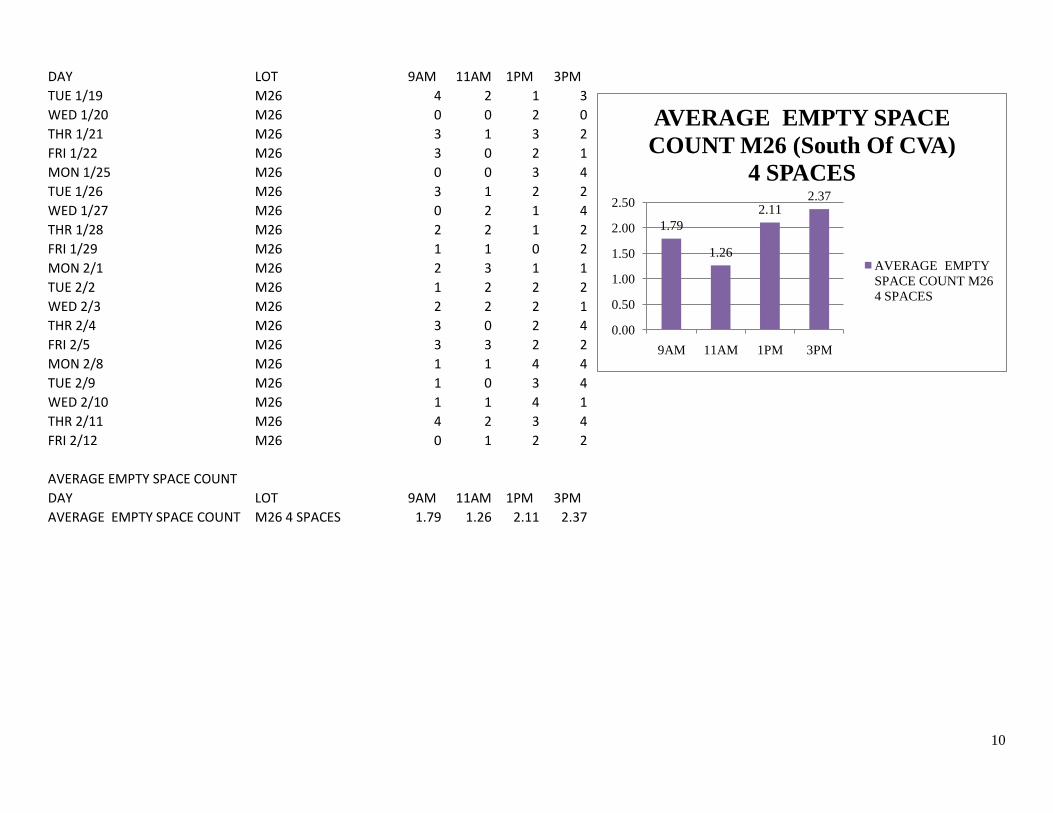
DAY LOT 9AM 11AM 1PM 3PM TUE 1/19 M26 4 2 1 3
WED 1/20 M26 0 0 2 0 THR 1/21 M26 3 1 3 2 FRI 1/22 M26 3 0 2 1 MON 1/25 M26 0 0 3 4 TUE 1/26 M26 3 1 2 2 WED 1/27 M26 0 2 1 4 THR 1/28 M26 2 2 1 2 FRI 1/29 M26 1 1 0 2 MON 2/1 M26 2 3 1 1 TUE 2/2 M26 1 2 2 2 WED 2/3 M26 2 2 2 1 THR 2/4 M26 3 0 2 4 FRI 2/5 M26 3 3 2 2 MON 2/8 M26 1 1 4 4 TUE 2/9 M26 1 0 3 4
WED 2/10 M26 1 1 4 1 THR 2/11 M26 4 2 3 4 FRI 2/12 M26 0 1 2 2
AVERAGE EMPTY SPACE COUNT DAY LOT 9AM 11AM 1PM 3PM
AVERAGE EMPTY SPACE COUNT M26 4 SPACES 1.79 1.26 2.11 2.37
1.79
1.26
2.112.37
0.00
0.50
1.00
1.50
2.00
2.50
9AM 11AM 1PM 3PM
AVERAGE EMPTY SPACE
COUNT M26 (South Of CVA)
4 SPACES
AVERAGE EMPTY
SPACE COUNT M26
4 SPACES
11
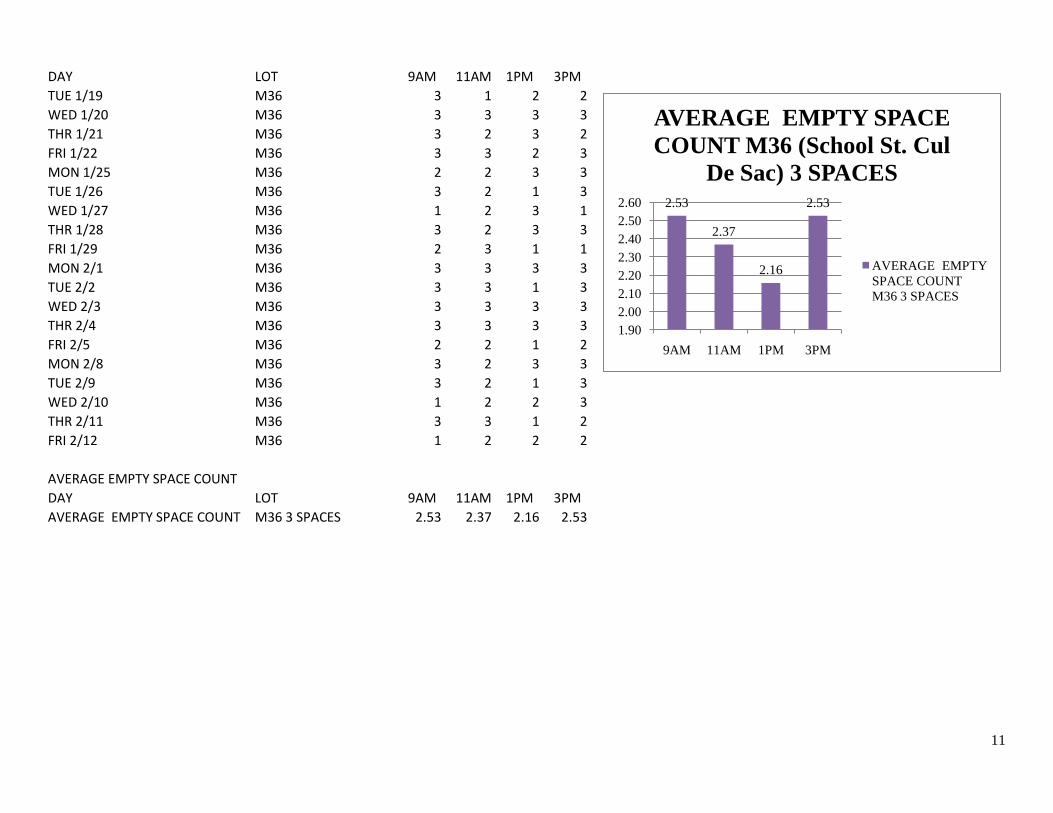
DAY LOT 9AM 11AM 1PM 3PM TUE 1/19 M36 3 1 2 2
WED 1/20 M36 3 3 3 3 THR 1/21 M36 3 2 3 2 FRI 1/22 M36 3 3 2 3 MON 1/25 M36 2 2 3 3 TUE 1/26 M36 3 2 1 3 WED 1/27 M36 1 2 3 1 THR 1/28 M36 3 2 3 3 FRI 1/29 M36 2 3 1 1 MON 2/1 M36 3 3 3 3 TUE 2/2 M36 3 3 1 3 WED 2/3 M36 3 3 3 3 THR 2/4 M36 3 3 3 3 FRI 2/5 M36 2 2 1 2 MON 2/8 M36 3 2 3 3 TUE 2/9 M36 3 2 1 3
WED 2/10 M36 1 2 2 3 THR 2/11 M36 3 3 1 2 FRI 2/12 M36 1 2 2 2
AVERAGE EMPTY SPACE COUNT DAY LOT 9AM 11AM 1PM 3PM
AVERAGE EMPTY SPACE COUNT M36 3 SPACES 2.53 2.37 2.16 2.53
2.53
2.37
2.16
2.53
1.90
2.00
2.10
2.20
2.30
2.40
2.50
2.60
9AM 11AM 1PM 3PM
AVERAGE EMPTY SPACE
COUNT M36 (School St. Cul
De Sac) 3 SPACES
AVERAGE EMPTY
SPACE COUNT
M36 3 SPACES
12
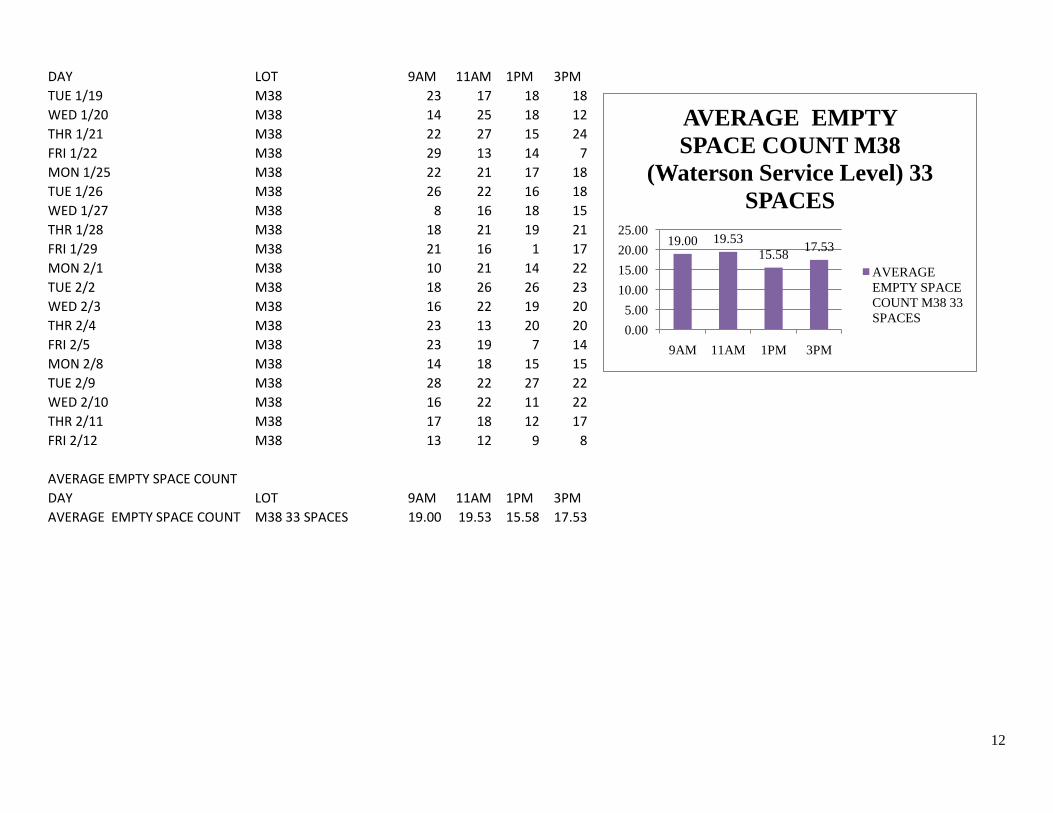
DAY LOT 9AM 11AM 1PM 3PM
TUE 1/19 M38 23 17 18 18 WED 1/20 M38 14 25 18 12 THR 1/21 M38 22 27 15 24 FRI 1/22 M38 29 13 14 7 MON 1/25 M38 22 21 17 18 TUE 1/26 M38 26 22 16 18 WED 1/27 M38 8 16 18 15 THR 1/28 M38 18 21 19 21 FRI 1/29 M38 21 16 1 17 MON 2/1 M38 10 21 14 22 TUE 2/2 M38 18 26 26 23 WED 2/3 M38 16 22 19 20 THR 2/4 M38 23 13 20 20 FRI 2/5 M38 23 19 7 14 MON 2/8 M38 14 18 15 15 TUE 2/9 M38 28 22 27 22
WED 2/10 M38 16 22 11 22 THR 2/11 M38 17 18 12 17 FRI 2/12 M38 13 12 9 8
AVERAGE EMPTY SPACE COUNT DAY LOT 9AM 11AM 1PM 3PM
AVERAGE EMPTY SPACE COUNT M38 33 SPACES 19.00 19.53 15.58 17.53
19.00 19.53
15.5817.53
0.00
5.00
10.00
15.00
20.00
25.00
9AM 11AM 1PM 3PM
AVERAGE EMPTY
SPACE COUNT M38
(Waterson Service Level) 33
SPACES
AVERAGE
EMPTY SPACE
COUNT M38 33
SPACES
13
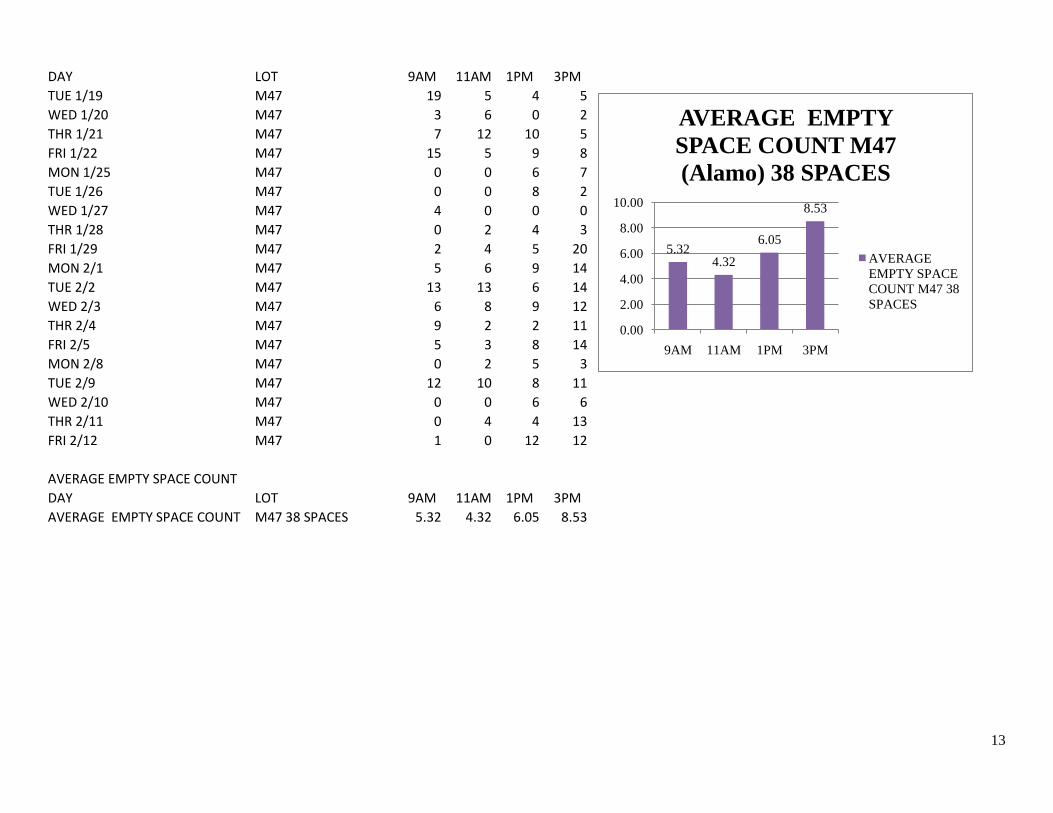
DAY LOT 9AM 11AM 1PM 3PM TUE 1/19 M47 19 5 4 5
WED 1/20 M47 3 6 0 2 THR 1/21 M47 7 12 10 5 FRI 1/22 M47 15 5 9 8 MON 1/25 M47 0 0 6 7 TUE 1/26 M47 0 0 8 2 WED 1/27 M47 4 0 0 0 THR 1/28 M47 0 2 4 3 FRI 1/29 M47 2 4 5 20 MON 2/1 M47 5 6 9 14 TUE 2/2 M47 13 13 6 14 WED 2/3 M47 6 8 9 12 THR 2/4 M47 9 2 2 11 FRI 2/5 M47 5 3 8 14 MON 2/8 M47 0 2 5 3 TUE 2/9 M47 12 10 8 11
WED 2/10 M47 0 0 6 6 THR 2/11 M47 0 4 4 13 FRI 2/12 M47 1 0 12 12
AVERAGE EMPTY SPACE COUNT DAY LOT 9AM 11AM 1PM 3PM
AVERAGE EMPTY SPACE COUNT M47 38 SPACES 5.32 4.32 6.05 8.53
5.324.32
6.05
8.53
0.00
2.00
4.00
6.00
8.00
10.00
9AM 11AM 1PM 3PM
AVERAGE EMPTY
SPACE COUNT M47
(Alamo) 38 SPACES
AVERAGE
EMPTY SPACE
COUNT M47 38
SPACES
14
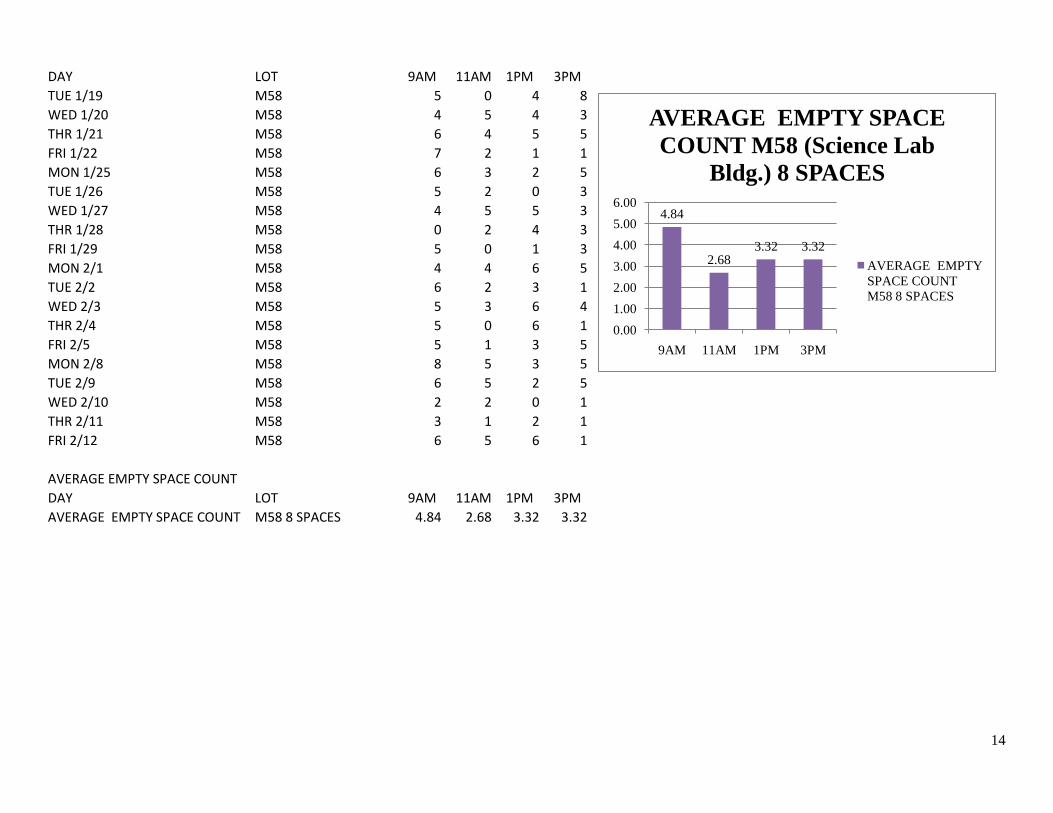
DAY LOT 9AM 11AM 1PM 3PM TUE 1/19 M58 5 0 4 8
WED 1/20 M58 4 5 4 3
THR 1/21 M58 6 4 5 5
FRI 1/22 M58 7 2 1 1
MON 1/25 M58 6 3 2 5
TUE 1/26 M58 5 2 0 3
WED 1/27 M58 4 5 5 3
THR 1/28 M58 0 2 4 3
FRI 1/29 M58 5 0 1 3
MON 2/1 M58 4 4 6 5
TUE 2/2 M58 6 2 3 1
WED 2/3 M58 5 3 6 4
THR 2/4 M58 5 0 6 1
FRI 2/5 M58 5 1 3 5
MON 2/8 M58 8 5 3 5
TUE 2/9 M58 6 5 2 5 WED 2/10 M58 2 2 0 1 THR 2/11 M58 3 1 2 1 FRI 2/12 M58 6 5 6 1
AVERAGE EMPTY SPACE COUNT DAY LOT 9AM 11AM 1PM 3PM
AVERAGE EMPTY SPACE COUNT M58 8 SPACES 4.84 2.68 3.32 3.32
4.84
2.683.32 3.32
0.00
1.00
2.00
3.00
4.00
5.00
6.00
9AM 11AM 1PM 3PM
AVERAGE EMPTY SPACE
COUNT M58 (Science Lab
Bldg.) 8 SPACES
AVERAGE EMPTY
SPACE COUNT
M58 8 SPACES
15
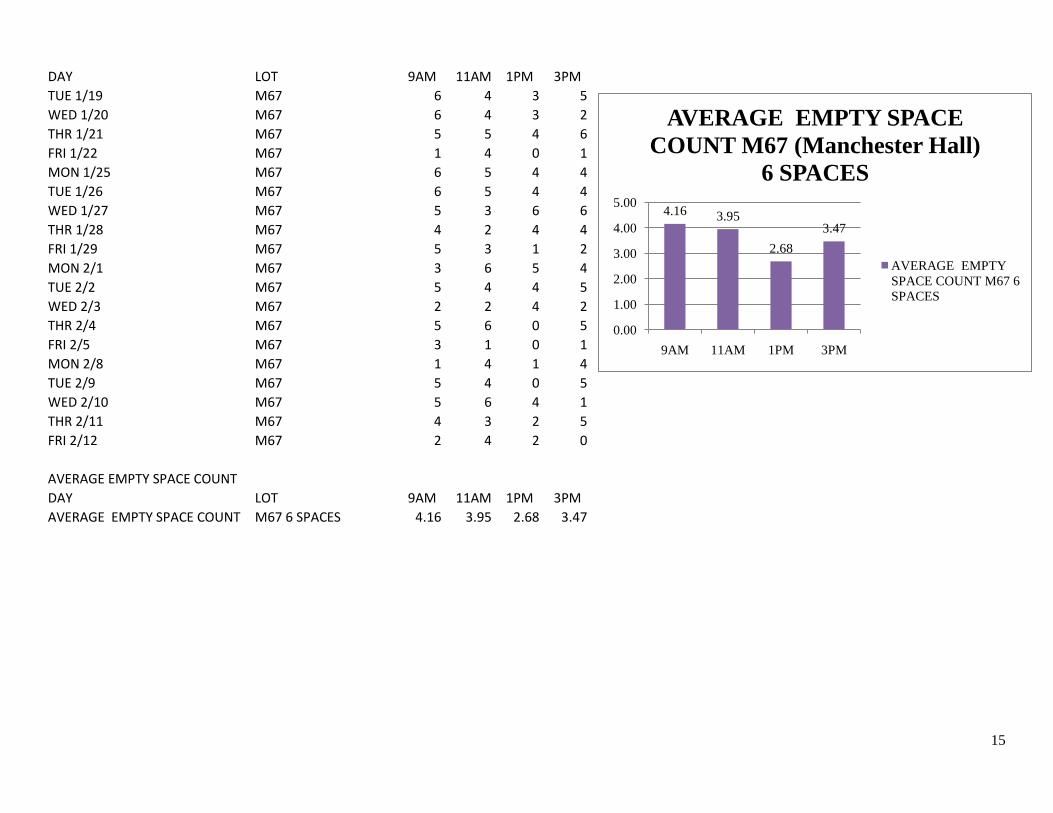
DAY LOT 9AM 11AM 1PM 3PM TUE 1/19 M67 6 4 3 5
WED 1/20 M67 6 4 3 2 THR 1/21 M67 5 5 4 6 FRI 1/22 M67 1 4 0 1 MON 1/25 M67 6 5 4 4 TUE 1/26 M67 6 5 4 4 WED 1/27 M67 5 3 6 6 THR 1/28 M67 4 2 4 4 FRI 1/29 M67 5 3 1 2 MON 2/1 M67 3 6 5 4 TUE 2/2 M67 5 4 4 5 WED 2/3 M67 2 2 4 2 THR 2/4 M67 5 6 0 5 FRI 2/5 M67 3 1 0 1 MON 2/8 M67 1 4 1 4 TUE 2/9 M67 5 4 0 5
WED 2/10 M67 5 6 4 1 THR 2/11 M67 4 3 2 5 FRI 2/12 M67 2 4 2 0
AVERAGE EMPTY SPACE COUNT DAY LOT 9AM 11AM 1PM 3PM
AVERAGE EMPTY SPACE COUNT M67 6 SPACES 4.16 3.95 2.68 3.47
4.16 3.95
2.68
3.47
0.00
1.00
2.00
3.00
4.00
5.00
9AM 11AM 1PM 3PM
AVERAGE EMPTY SPACE
COUNT M67 (Manchester Hall)
6 SPACES
AVERAGE EMPTY
SPACE COUNT M67 6
SPACES
16
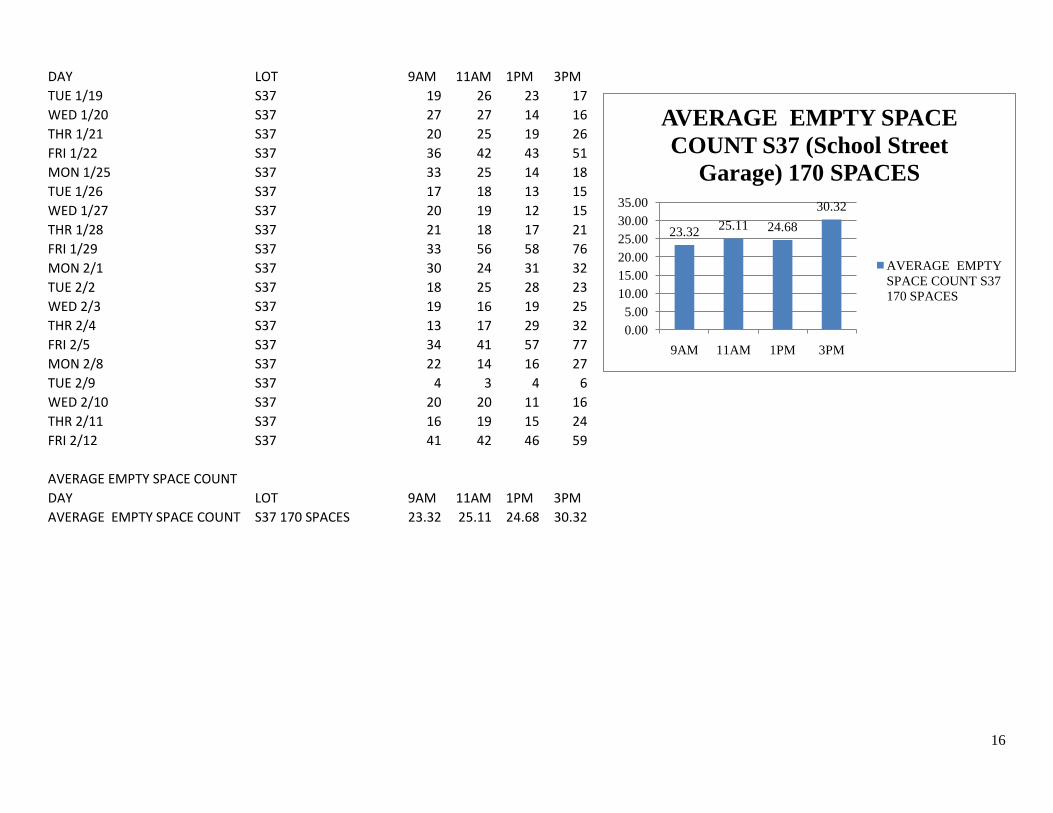
DAY LOT 9AM 11AM 1PM 3PM TUE 1/19 S37 19 26 23 17
WED 1/20 S37 27 27 14 16
THR 1/21 S37 20 25 19 26
FRI 1/22 S37 36 42 43 51
MON 1/25 S37 33 25 14 18
TUE 1/26 S37 17 18 13 15
WED 1/27 S37 20 19 12 15
THR 1/28 S37 21 18 17 21
FRI 1/29 S37 33 56 58 76
MON 2/1 S37 30 24 31 32
TUE 2/2 S37 18 25 28 23
WED 2/3 S37 19 16 19 25
THR 2/4 S37 13 17 29 32
FRI 2/5 S37 34 41 57 77
MON 2/8 S37 22 14 16 27
TUE 2/9 S37 4 3 4 6 WED 2/10 S37 20 20 11 16 THR 2/11 S37 16 19 15 24 FRI 2/12 S37 41 42 46 59
AVERAGE EMPTY SPACE COUNT DAY LOT 9AM 11AM 1PM 3PM
AVERAGE EMPTY SPACE COUNT S37 170 SPACES 23.32 25.11 24.68 30.32
23.3225.11 24.68
30.32
0.00
5.00
10.00
15.00
20.00
25.00
30.00
35.00
9AM 11AM 1PM 3PM
AVERAGE EMPTY SPACE
COUNT S37 (School Street
Garage) 170 SPACES
AVERAGE EMPTY
SPACE COUNT S37
170 SPACES
17
DAY LOT 9AM 11AM 1PM 3PM
TUE 1/19 S67 6 5 3 5 WED 1/20 S67 4 3 5 5 THR 1/21 S67 3 2 5 5 FRI 1/22 S67 9 14 10 12 MON 1/25 S67 3 1 4 5 TUE 1/26 S67 3 4 7 4 WED 1/27 S67 7 3 2 4 THR 1/28 S67 3 3 3 5 FRI 1/29 S67 10 19 29 28 MON 2/1 S67 6 6 10 12 TUE 2/2 S67 4 4 6 10 WED 2/3 S67 5 5 6 14 THR 2/4 S67 10 7 15 17 FRI 2/5 S67 18 20 29 30 MON 2/8 S67 9 7 7 8 TUE 2/9 S67 3 4 5
WED 2/10 S67 3 4 4 8 THR 2/11 S67 4 3 14 12 FRI 2/12 S67 7 27 3 32
AVERAGE EMPTY SPACE COUNT DAY LOT 9AM 11AM 1PM 3PM
AVERAGE EMPTY SPACE COUNT S67 86 SPACES 6.16 7.42 8.79 12.00
6.167.42
8.79
12.00
0.00
2.00
4.00
6.00
8.00
10.00
12.00
14.00
9AM 11AM 1PM 3PM
AVERAGE EMPTY SPACE
COUNT S67 (Fell & Locust) 86
SPACES
AVERAGE EMPTY
SPACE COUNT S67
86 SPACES
18
DAY LOT 9AM 11AM 1PM 3PM TUE 1/19 F14 33 28 28 30
WED 1/20 F14 29 29 29 28 THR 1/21 F14 25 25 28 31 FRI 1/22 F14 38 28 29 35 MON 1/25 F14 33 26 29 39 TUE 1/26 F14 32 26 38 42 WED 1/27 F14 33 29 31 39 THR 1/28 F14 36 30 38 39 FRI 1/29 F14 41 33 35 35 MON 2/1 F14 25 24 24 28 TUE 2/2 F14 33 28 29 21 WED 2/3 F14 26 22 25 25 THR 2/4 F14 32 27 27 28 FRI 2/5 F14 33 29 26 33 MON 2/8 F14 28 21 29 28 TUE 2/9 F14 35 30 31
WED 2/10 F14 34 29 28 30 THR 2/11 F14 35 29 30 32 FRI 2/12 F14 41 33 32 34
AVERAGE EMPTY SPACE COUNT DAY LOT 9AM 11AM 1PM 3PM
AVERAGE EMPTY SPACE COUNT F14 42 SPACES 32.74 27.68 29.79 32.06
32.74
27.68
29.79
32.06
24.00
26.00
28.00
30.00
32.00
34.00
9AM 11AM 1PM 3PM
AVERAGE EMPTY
SPACE COUNT F14
(Osage & University) 42
SPACES
AVERAGE
EMPTY SPACE
COUNT F14 42
SPACES
19
DAY LOT 9AM 11AM 1PM 3PM TUE 1/19 F24 42 27 17 24
WED 1/20 F24 45 48 35 47 THR 1/21 F24 41 38 30 51 FRI 1/22 F24 74 65 48 61 MON 1/25 F24 67 36 28 37 TUE 1/26 F24 49 33 49 53 WED 1/27 F24 62 46 48 69 THR 1/28 F24 60 44 47 62 FRI 1/29 F24 70 52 48 66 MON 2/1 F24 37 33 34 50 TUE 2/2 F24 63 44 48 53 WED 2/3 F24 54 40 46 54 THR 2/4 F24 55 38 3 42 FRI 2/5 F24 71 64 60 57 MON 2/8 F24 31 23 29 41 TUE 2/9 F24 51 48 52
WED 2/10 F24 68 44 44 42 THR 2/11 F24 52 35 37 49 FRI 2/12 F24 72 41 52 65
AVERAGE EMPTY SPACE COUNT DAY LOT 9AM 11AM 1PM 3PM
AVERAGE EMPTY SPACE COUNT F24 132 SPACES 56.00 42.05 39.74 51.28
56.00
42.05 39.74
51.28
0.00
10.00
20.00
30.00
40.00
50.00
60.00
9AM 11AM 1PM 3PM
AVERAGE EMPTY
SPACE COUNT F24
(South of Atkin / Colby)
132 SPACES
AVERAGE
EMPTY SPACE
COUNT F24 132
SPACES
20
DAY LOT 9AM 11AM 1PM 3PM TUE 1/19 F85E 1 0 0 0
WED 1/20 F85E 0 0 0 0 THR 1/21 F85E 0 0 0 0 FRI 1/22 F85E 2 0 0 1 MON 1/25 F85E 0 0 0 0 TUE 1/26 F85E 0 0 0 1 WED 1/27 F85E 0 0 0 0 THR 1/28 F85E 0 0 0 0 FRI 1/29 F85E 0 0 0 2 MON 2/1 F85E 0 0 0 0 TUE 2/2 F85E 0 0 0 0 WED 2/3 F85E 0 0 0 0 THR 2/4 F85E 0 0 0 5 FRI 2/5 F85E 0 0 0 0 MON 2/8 F85E 0 0 0 0 TUE 2/9 F85E 2 3 1
WED 2/10 F85E 0 0 0 0 THR 2/11 F85E 0 0 0 0 FRI 2/12 F85E 0 0 0 2
AVERAGE EMPTY SPACE COUNT DAY LOT 9AM 11AM 1PM 3PM
AVERAGE EMPTY SPACE COUNT F85E 17 SPACES 0.26 0.16 0.05 0.61
0.26
0.16
0.05
0.61
0.00
0.10
0.20
0.30
0.40
0.50
0.60
0.70
9AM 11AM 1PM 3PM
AVERAGE EMPTY
SPACE COUNT F85E
(MFOB) 17 SPACES
AVERAGE
EMPTY SPACE
COUNT F85E 17
SPACES
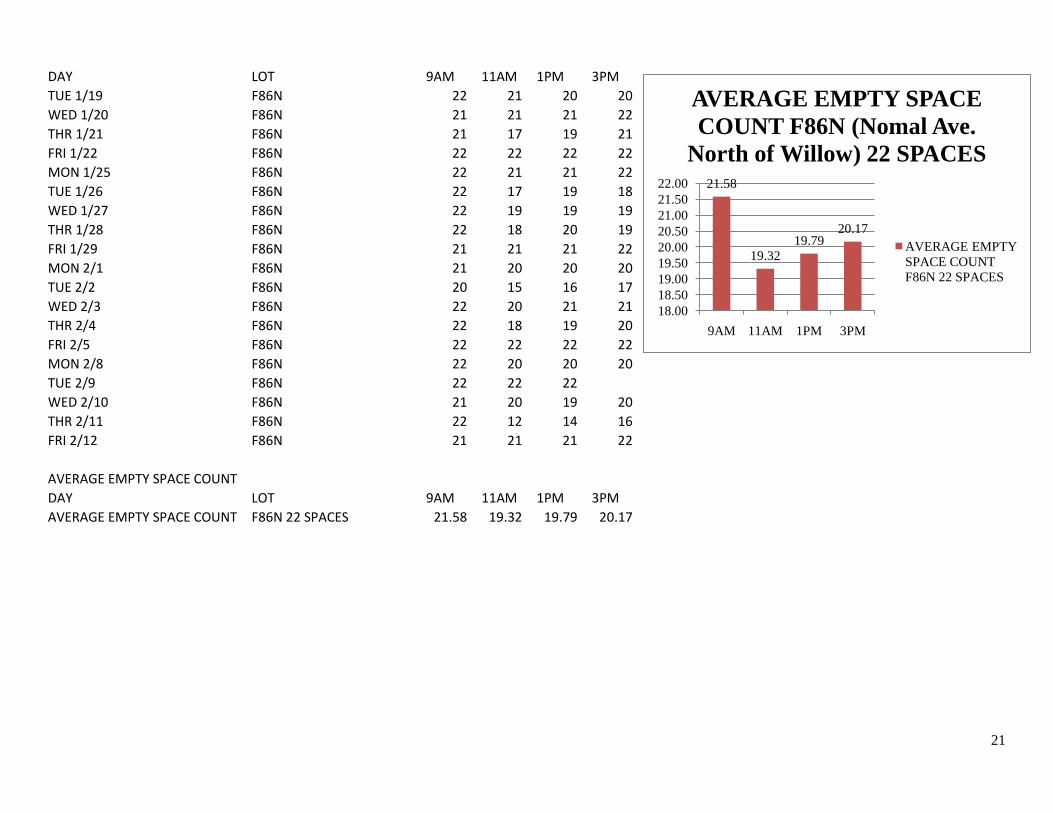
21
DAY LOT 9AM 11AM 1PM 3PM
TUE 1/19 F86N 22 21 20 20 WED 1/20 F86N 21 21 21 22 THR 1/21 F86N 21 17 19 21 FRI 1/22 F86N 22 22 22 22 MON 1/25 F86N 22 21 21 22 TUE 1/26 F86N 22 17 19 18 WED 1/27 F86N 22 19 19 19 THR 1/28 F86N 22 18 20 19 FRI 1/29 F86N 21 21 21 22 MON 2/1 F86N 21 20 20 20 TUE 2/2 F86N 20 15 16 17 WED 2/3 F86N 22 20 21 21 THR 2/4 F86N 22 18 19 20 FRI 2/5 F86N 22 22 22 22 MON 2/8 F86N 22 20 20 20
TUE 2/9 F86N 22 22 22 WED 2/10 F86N 21 20 19 20
THR 2/11 F86N 22 12 14 16 FRI 2/12 F86N 21 21 21 22
AVERAGE EMPTY SPACE COUNT DAY LOT 9AM 11AM 1PM 3PM
AVERAGE EMPTY SPACE COUNT F86N 22 SPACES 21.58 19.32 19.79 20.17
21.58
19.32
19.7920.17
18.00
18.50
19.00
19.50
20.00
20.50
21.00
21.50
22.00
9AM 11AM 1PM 3PM
AVERAGE EMPTY SPACE
COUNT F86N (Nomal Ave.
North of Willow) 22 SPACES
AVERAGE EMPTY
SPACE COUNT
F86N 22 SPACES
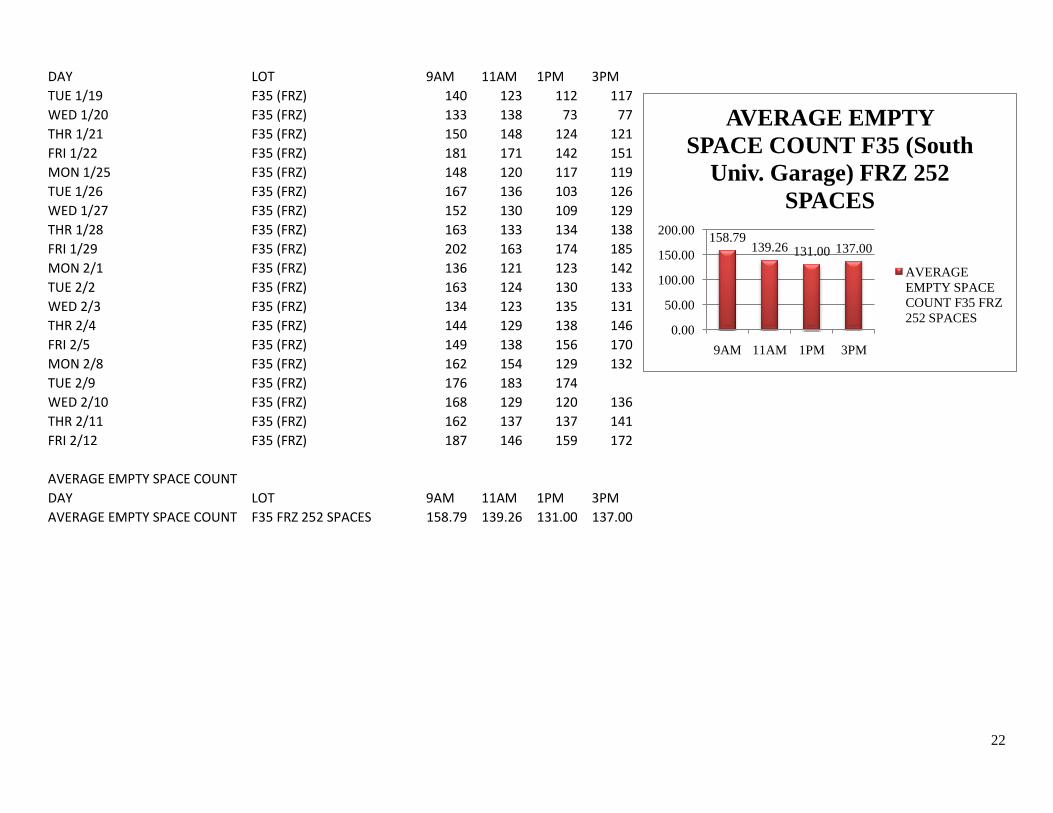
22
DAY LOT 9AM 11AM 1PM 3PM TUE 1/19 F35 (FRZ) 140 123 112 117
WED 1/20 F35 (FRZ) 133 138 73 77 THR 1/21 F35 (FRZ) 150 148 124 121 FRI 1/22 F35 (FRZ) 181 171 142 151 MON 1/25 F35 (FRZ) 148 120 117 119 TUE 1/26 F35 (FRZ) 167 136 103 126 WED 1/27 F35 (FRZ) 152 130 109 129 THR 1/28 F35 (FRZ) 163 133 134 138 FRI 1/29 F35 (FRZ) 202 163 174 185 MON 2/1 F35 (FRZ) 136 121 123 142 TUE 2/2 F35 (FRZ) 163 124 130 133 WED 2/3 F35 (FRZ) 134 123 135 131 THR 2/4 F35 (FRZ) 144 129 138 146 FRI 2/5 F35 (FRZ) 149 138 156 170 MON 2/8 F35 (FRZ) 162 154 129 132 TUE 2/9 F35 (FRZ) 176 183 174
WED 2/10 F35 (FRZ) 168 129 120 136 THR 2/11 F35 (FRZ) 162 137 137 141 FRI 2/12 F35 (FRZ) 187 146 159 172
AVERAGE EMPTY SPACE COUNT DAY LOT 9AM 11AM 1PM 3PM
AVERAGE EMPTY SPACE COUNT F35 FRZ 252 SPACES 158.79 139.26 131.00 137.00
158.79139.26 131.00 137.00
0.00
50.00
100.00
150.00
200.00
9AM 11AM 1PM 3PM
AVERAGE EMPTY
SPACE COUNT F35 (South
Univ. Garage) FRZ 252
SPACES
AVERAGE
EMPTY SPACE
COUNT F35 FRZ
252 SPACES
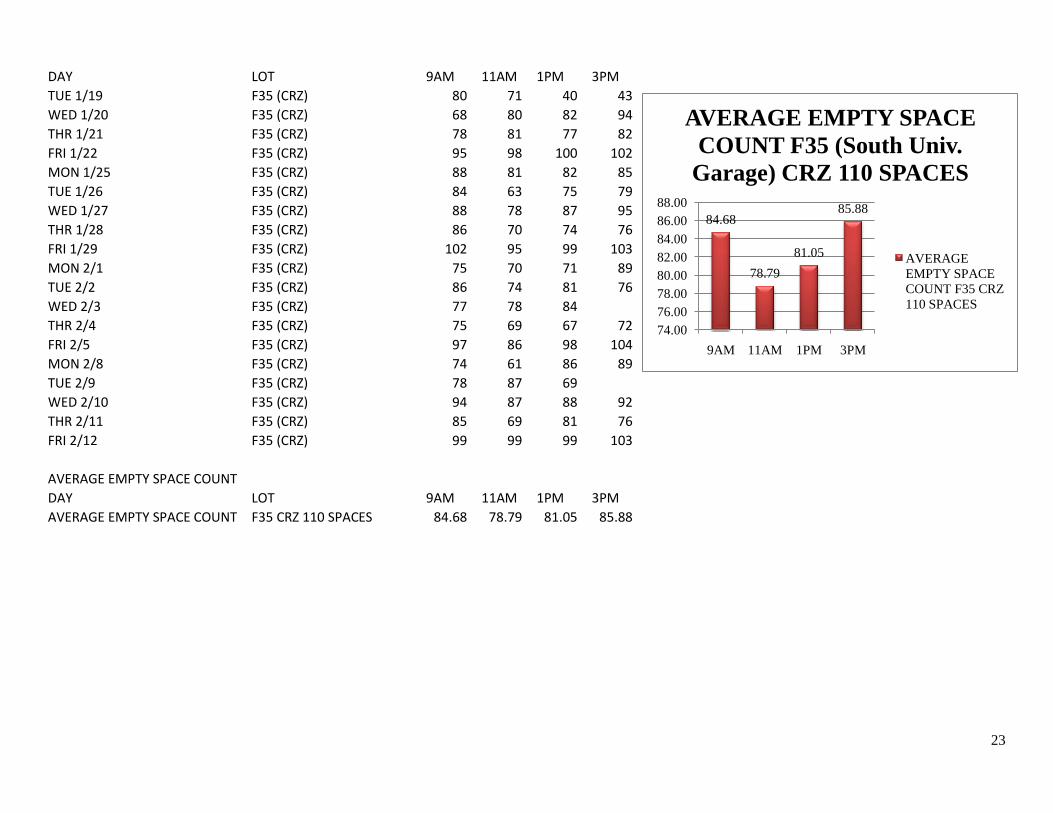
23
DAY LOT 9AM 11AM 1PM 3PM
TUE 1/19 F35 (CRZ) 80 71 40 43 WED 1/20 F35 (CRZ) 68 80 82 94 THR 1/21 F35 (CRZ) 78 81 77 82 FRI 1/22 F35 (CRZ) 95 98 100 102 MON 1/25 F35 (CRZ) 88 81 82 85 TUE 1/26 F35 (CRZ) 84 63 75 79 WED 1/27 F35 (CRZ) 88 78 87 95 THR 1/28 F35 (CRZ) 86 70 74 76 FRI 1/29 F35 (CRZ) 102 95 99 103 MON 2/1 F35 (CRZ) 75 70 71 89 TUE 2/2 F35 (CRZ) 86 74 81 76 WED 2/3 F35 (CRZ) 77 78 84
THR 2/4 F35 (CRZ) 75 69 67 72 FRI 2/5 F35 (CRZ) 97 86 98 104 MON 2/8 F35 (CRZ) 74 61 86 89 TUE 2/9 F35 (CRZ) 78 87 69
WED 2/10 F35 (CRZ) 94 87 88 92 THR 2/11 F35 (CRZ) 85 69 81 76 FRI 2/12 F35 (CRZ) 99 99 99 103
AVERAGE EMPTY SPACE COUNT DAY LOT 9AM 11AM 1PM 3PM
AVERAGE EMPTY SPACE COUNT F35 CRZ 110 SPACES 84.68 78.79 81.05 85.88
84.68
78.79
81.05
85.88
74.00
76.00
78.00
80.00
82.00
84.00
86.00
88.00
9AM 11AM 1PM 3PM
AVERAGE EMPTY SPACE
COUNT F35 (South Univ.
Garage) CRZ 110 SPACES
AVERAGE
EMPTY SPACE
COUNT F35 CRZ
110 SPACES
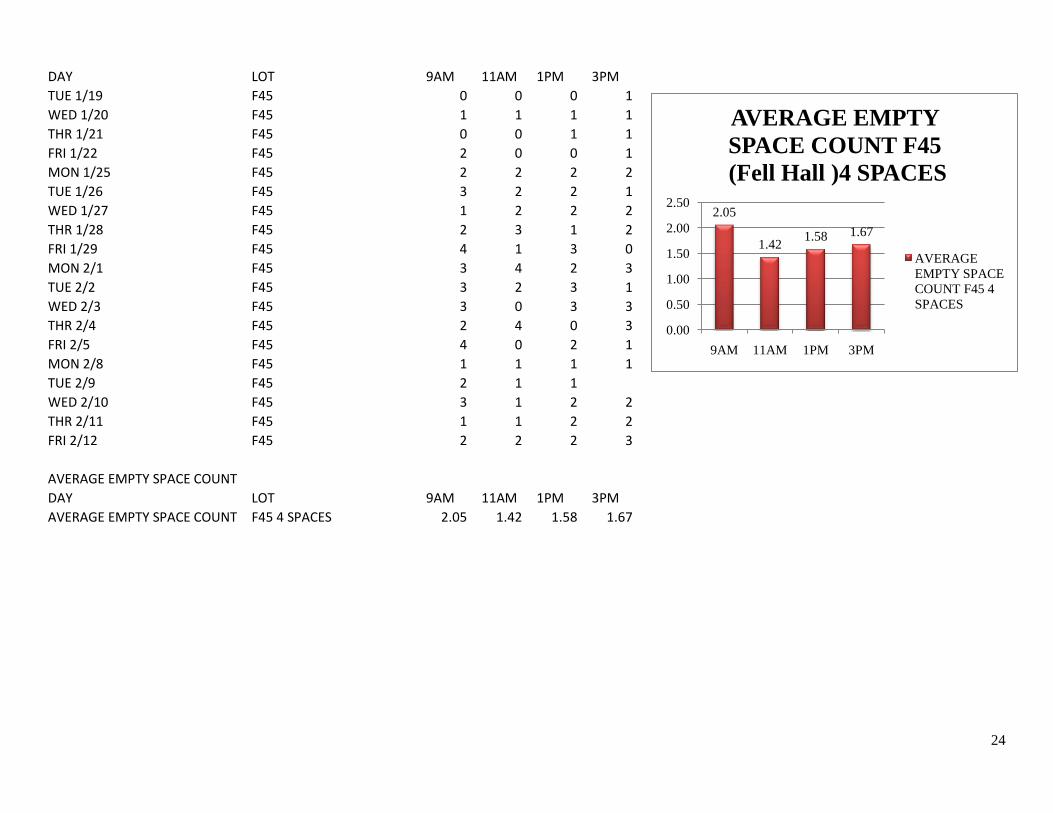
24
DAY LOT 9AM 11AM 1PM 3PM TUE 1/19 F45 0 0 0 1
WED 1/20 F45 1 1 1 1 THR 1/21 F45 0 0 1 1 FRI 1/22 F45 2 0 0 1 MON 1/25 F45 2 2 2 2 TUE 1/26 F45 3 2 2 1 WED 1/27 F45 1 2 2 2 THR 1/28 F45 2 3 1 2 FRI 1/29 F45 4 1 3 0 MON 2/1 F45 3 4 2 3 TUE 2/2 F45 3 2 3 1 WED 2/3 F45 3 0 3 3 THR 2/4 F45 2 4 0 3 FRI 2/5 F45 4 0 2 1 MON 2/8 F45 1 1 1 1 TUE 2/9 F45 2 1 1
WED 2/10 F45 3 1 2 2 THR 2/11 F45 1 1 2 2 FRI 2/12 F45 2 2 2 3
AVERAGE EMPTY SPACE COUNT DAY LOT 9AM 11AM 1PM 3PM
AVERAGE EMPTY SPACE COUNT F45 4 SPACES 2.05 1.42 1.58 1.67
2.05
1.421.58 1.67
0.00
0.50
1.00
1.50
2.00
2.50
9AM 11AM 1PM 3PM
AVERAGE EMPTY
SPACE COUNT F45
(Fell Hall )4 SPACES
AVERAGE
EMPTY SPACE
COUNT F45 4
SPACES

25
DAY LOT 9AM 11AM 1PM 3PM
TUE 1/19 F55 1 1 1 0 WED 1/20 F55 1 1 1 0 THR 1/21 F55 2 1 1 1 FRI 1/22 F55 2 1 2 1 MON 1/25 F55 1 1 2 1 TUE 1/26 F55 1 1 1 1 WED 1/27 F55 1 0 0 1 THR 1/28 F55 1 0 0 1 FRI 1/29 F55 1 0 2 0 MON 2/1 F55 0 1 1 1 TUE 2/2 F55 1 0 0 1 WED 2/3 F55 0 0 0 1 THR 2/4 F55 2 0 0 0 FRI 2/5 F55 1 1 0 0 MON 2/8 F55 1 1 1 1 TUE 2/9 F55 1 1 1
WED 2/10 F55 1 1 1 1 THR 2/11 F55 2 0 1 1 FRI 2/12 F55 2 1 0 1
AVERAGE EMPTY SPACE COUNT DAY LOT 9AM 11AM 1PM 3PM
AVERAGE EMPTY SPACE COUNT F55 2 SPACES 1.16 0.63 0.79 0.72
1.16
0.630.79 0.72
0.00
0.50
1.00
1.50
9AM 11AM 1PM 3PM
AVERAGE EMPTY
SPACE COUNT F55
(DeGarmo Hall) 2
SPACES
AVERAGE
EMPTY SPACE
COUNT F55 2
SPACES
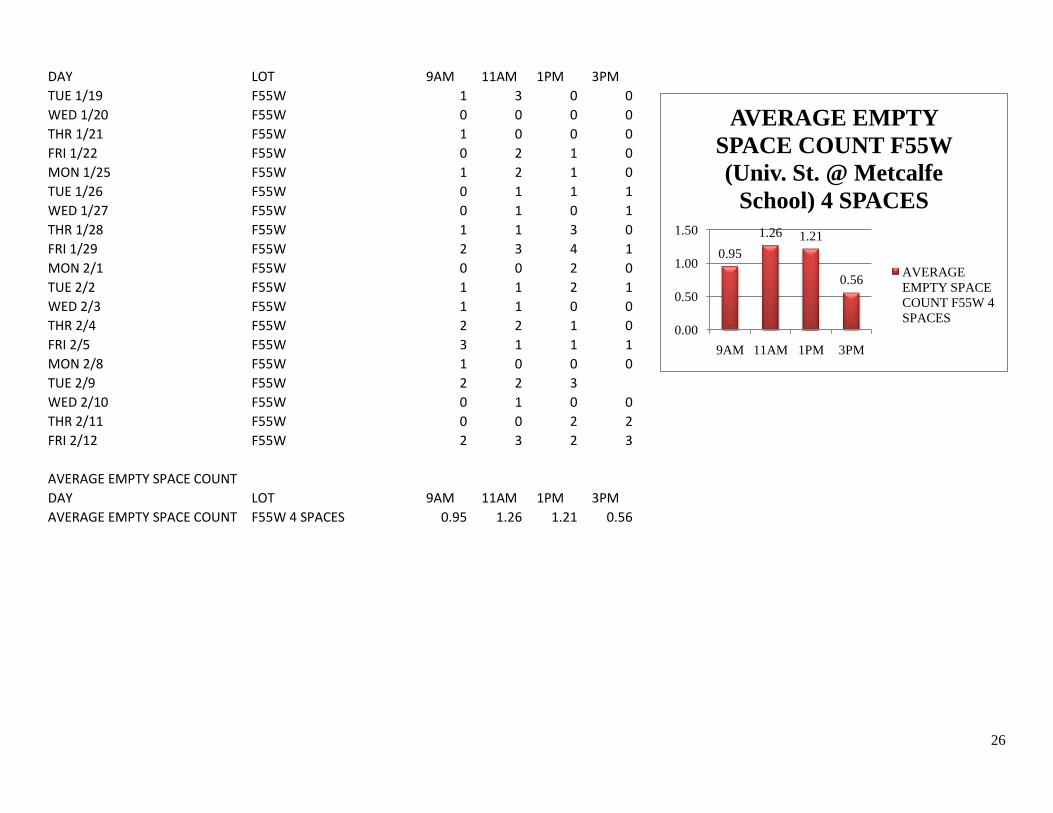
26
DAY LOT 9AM 11AM 1PM 3PM TUE 1/19 F55W 1 3 0 0
WED 1/20 F55W 0 0 0 0
THR 1/21 F55W 1 0 0 0
FRI 1/22 F55W 0 2 1 0
MON 1/25 F55W 1 2 1 0
TUE 1/26 F55W 0 1 1 1
WED 1/27 F55W 0 1 0 1
THR 1/28 F55W 1 1 3 0
FRI 1/29 F55W 2 3 4 1
MON 2/1 F55W 0 0 2 0
TUE 2/2 F55W 1 1 2 1
WED 2/3 F55W 1 1 0 0
THR 2/4 F55W 2 2 1 0
FRI 2/5 F55W 3 1 1 1
MON 2/8 F55W 1 0 0 0
TUE 2/9 F55W 2 2 3 WED 2/10 F55W 0 1 0 0
THR 2/11 F55W 0 0 2 2 FRI 2/12 F55W 2 3 2 3
AVERAGE EMPTY SPACE COUNT DAY LOT 9AM 11AM 1PM 3PM
AVERAGE EMPTY SPACE COUNT F55W 4 SPACES 0.95 1.26 1.21 0.56
0.95
1.26 1.21
0.56
0.00
0.50
1.00
1.50
9AM 11AM 1PM 3PM
AVERAGE EMPTY
SPACE COUNT F55W
(Univ. St. @ Metcalfe
School) 4 SPACES
AVERAGE
EMPTY SPACE
COUNT F55W 4
SPACES
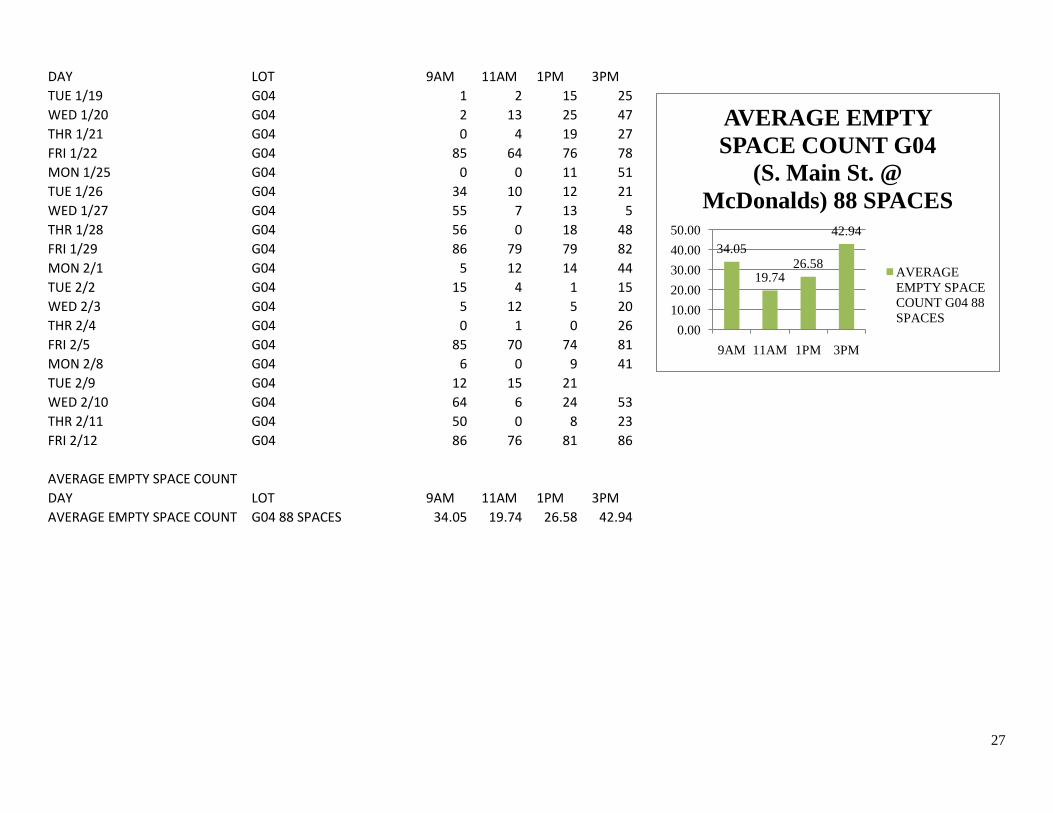
27
DAY LOT 9AM 11AM 1PM 3PM TUE 1/19 G04 1 2 15 25
WED 1/20 G04 2 13 25 47 THR 1/21 G04 0 4 19 27 FRI 1/22 G04 85 64 76 78 MON 1/25 G04 0 0 11 51 TUE 1/26 G04 34 10 12 21 WED 1/27 G04 55 7 13 5 THR 1/28 G04 56 0 18 48 FRI 1/29 G04 86 79 79 82 MON 2/1 G04 5 12 14 44 TUE 2/2 G04 15 4 1 15 WED 2/3 G04 5 12 5 20 THR 2/4 G04 0 1 0 26 FRI 2/5 G04 85 70 74 81 MON 2/8 G04 6 0 9 41 TUE 2/9 G04 12 15 21
WED 2/10 G04 64 6 24 53 THR 2/11 G04 50 0 8 23 FRI 2/12 G04 86 76 81 86
AVERAGE EMPTY SPACE COUNT DAY LOT 9AM 11AM 1PM 3PM
AVERAGE EMPTY SPACE COUNT G04 88 SPACES 34.05 19.74 26.58 42.94
34.05
19.7426.58
42.94
0.00
10.00
20.00
30.00
40.00
50.00
9AM 11AM 1PM 3PM
AVERAGE EMPTY
SPACE COUNT G04
(S. Main St. @
McDonalds) 88 SPACES
AVERAGE
EMPTY SPACE
COUNT G04 88
SPACES
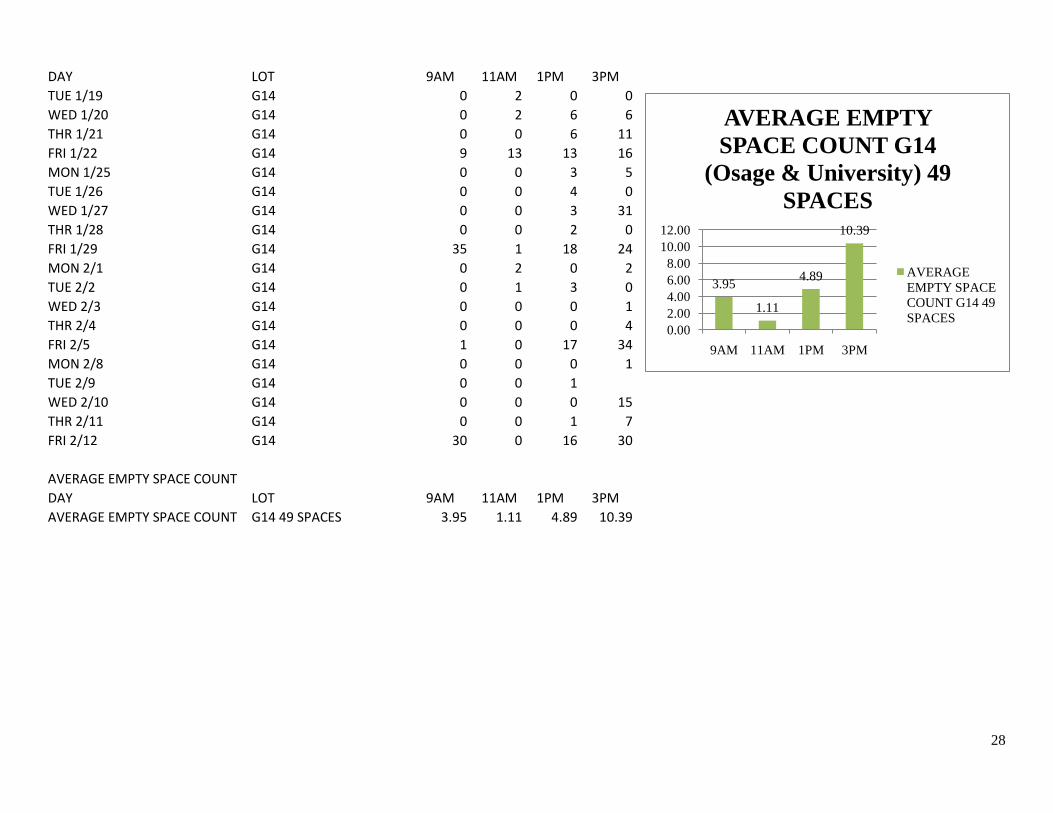
28
DAY LOT 9AM 11AM 1PM 3PM TUE 1/19 G14 0 2 0 0
WED 1/20 G14 0 2 6 6 THR 1/21 G14 0 0 6 11 FRI 1/22 G14 9 13 13 16 MON 1/25 G14 0 0 3 5 TUE 1/26 G14 0 0 4 0 WED 1/27 G14 0 0 3 31 THR 1/28 G14 0 0 2 0 FRI 1/29 G14 35 1 18 24 MON 2/1 G14 0 2 0 2 TUE 2/2 G14 0 1 3 0 WED 2/3 G14 0 0 0 1 THR 2/4 G14 0 0 0 4 FRI 2/5 G14 1 0 17 34 MON 2/8 G14 0 0 0 1 TUE 2/9 G14 0 0 1
WED 2/10 G14 0 0 0 15 THR 2/11 G14 0 0 1 7 FRI 2/12 G14 30 0 16 30
AVERAGE EMPTY SPACE COUNT DAY LOT 9AM 11AM 1PM 3PM
AVERAGE EMPTY SPACE COUNT G14 49 SPACES 3.95 1.11 4.89 10.39
3.95
1.11
4.89
10.39
0.00
2.00
4.00
6.00
8.00
10.00
12.00
9AM 11AM 1PM 3PM
AVERAGE EMPTY
SPACE COUNT G14
(Osage & University) 49
SPACES
AVERAGE
EMPTY SPACE
COUNT G14 49
SPACES
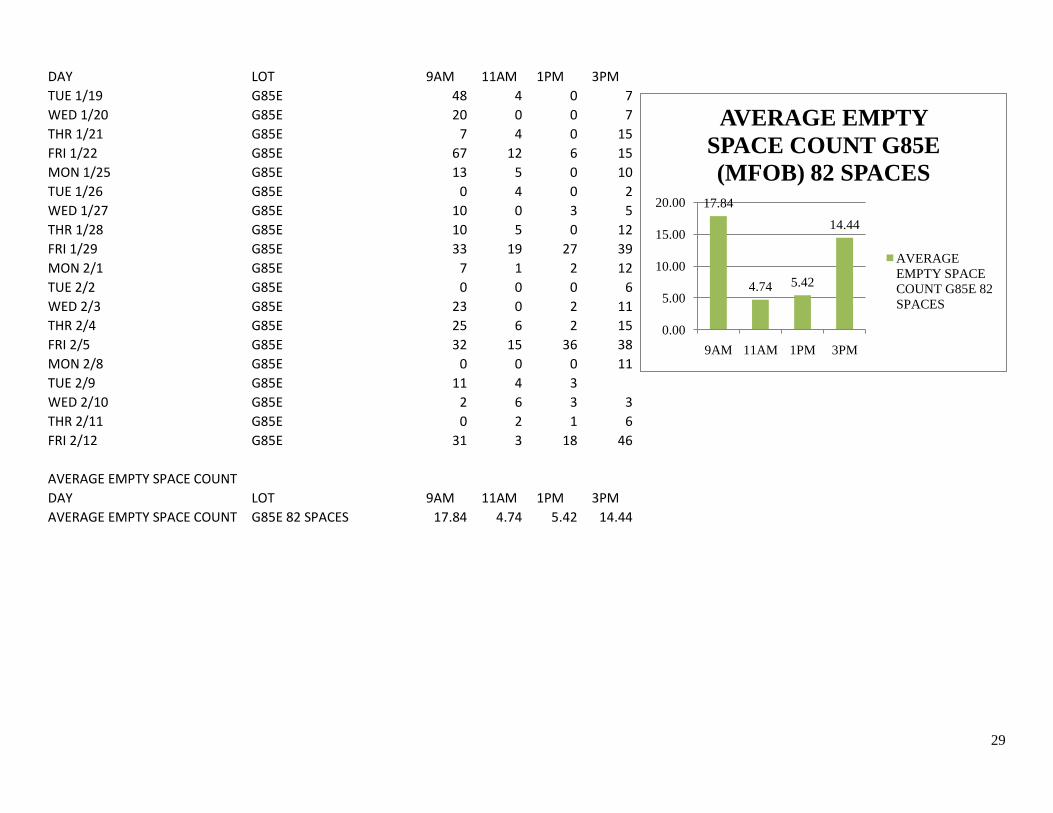
29
DAY LOT 9AM 11AM 1PM 3PM TUE 1/19 G85E 48 4 0 7
WED 1/20 G85E 20 0 0 7 THR 1/21 G85E 7 4 0 15 FRI 1/22 G85E 67 12 6 15 MON 1/25 G85E 13 5 0 10 TUE 1/26 G85E 0 4 0 2 WED 1/27 G85E 10 0 3 5 THR 1/28 G85E 10 5 0 12 FRI 1/29 G85E 33 19 27 39 MON 2/1 G85E 7 1 2 12 TUE 2/2 G85E 0 0 0 6 WED 2/3 G85E 23 0 2 11 THR 2/4 G85E 25 6 2 15 FRI 2/5 G85E 32 15 36 38 MON 2/8 G85E 0 0 0 11 TUE 2/9 G85E 11 4 3
WED 2/10 G85E 2 6 3 3 THR 2/11 G85E 0 2 1 6 FRI 2/12 G85E 31 3 18 46
AVERAGE EMPTY SPACE COUNT DAY LOT 9AM 11AM 1PM 3PM
AVERAGE EMPTY SPACE COUNT G85E 82 SPACES 17.84 4.74 5.42 14.44
17.84
4.74 5.42
14.44
0.00
5.00
10.00
15.00
20.00
9AM 11AM 1PM 3PM
AVERAGE EMPTY
SPACE COUNT G85E
(MFOB) 82 SPACES
AVERAGE
EMPTY SPACE
COUNT G85E 82
SPACES
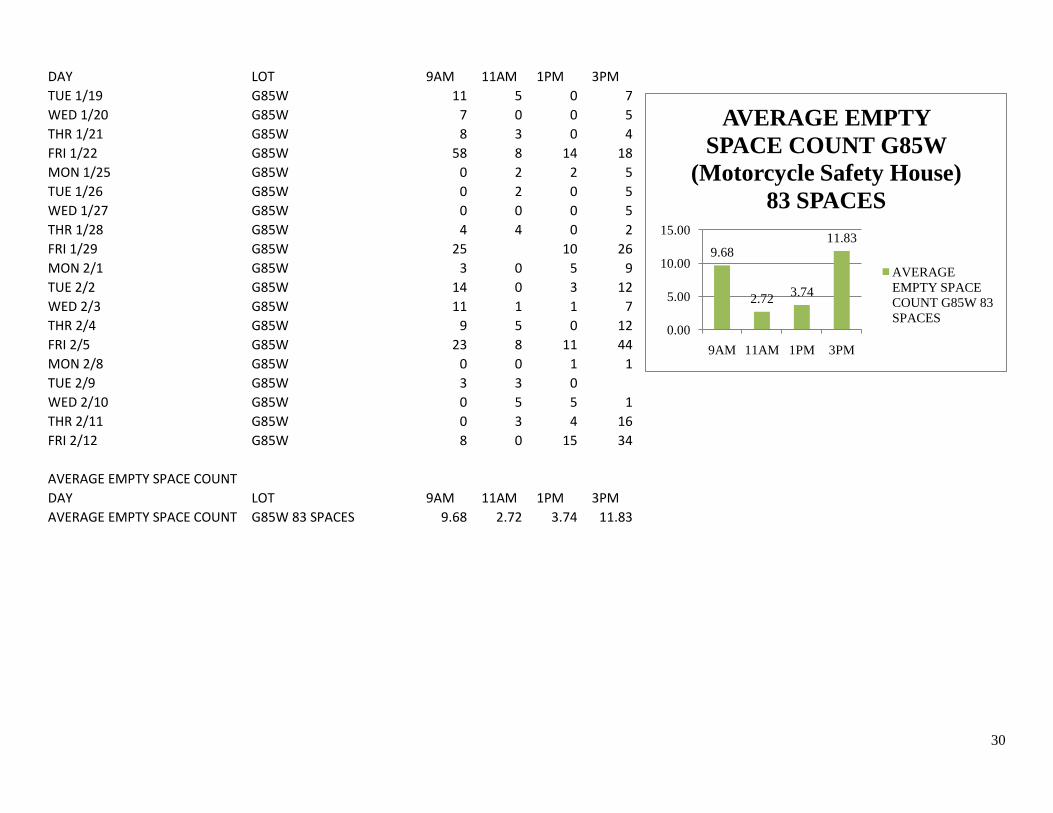
30
DAY LOT 9AM 11AM 1PM 3PM
TUE 1/19 G85W 11 5 0 7 WED 1/20 G85W 7 0 0 5 THR 1/21 G85W 8 3 0 4 FRI 1/22 G85W 58 8 14 18 MON 1/25 G85W 0 2 2 5 TUE 1/26 G85W 0 2 0 5 WED 1/27 G85W 0 0 0 5 THR 1/28 G85W 4 4 0 2 FRI 1/29 G85W 25
10 26
MON 2/1 G85W 3 0 5 9 TUE 2/2 G85W 14 0 3 12 WED 2/3 G85W 11 1 1 7 THR 2/4 G85W 9 5 0 12 FRI 2/5 G85W 23 8 11 44 MON 2/8 G85W 0 0 1 1 TUE 2/9 G85W 3 3 0
WED 2/10 G85W 0 5 5 1 THR 2/11 G85W 0 3 4 16 FRI 2/12 G85W 8 0 15 34
AVERAGE EMPTY SPACE COUNT DAY LOT 9AM 11AM 1PM 3PM
AVERAGE EMPTY SPACE COUNT G85W 83 SPACES 9.68 2.72 3.74 11.83
9.68
2.723.74
11.83
0.00
5.00
10.00
15.00
9AM 11AM 1PM 3PM
AVERAGE EMPTY
SPACE COUNT G85W
(Motorcycle Safety House)
83 SPACES
AVERAGE
EMPTY SPACE
COUNT G85W 83
SPACES
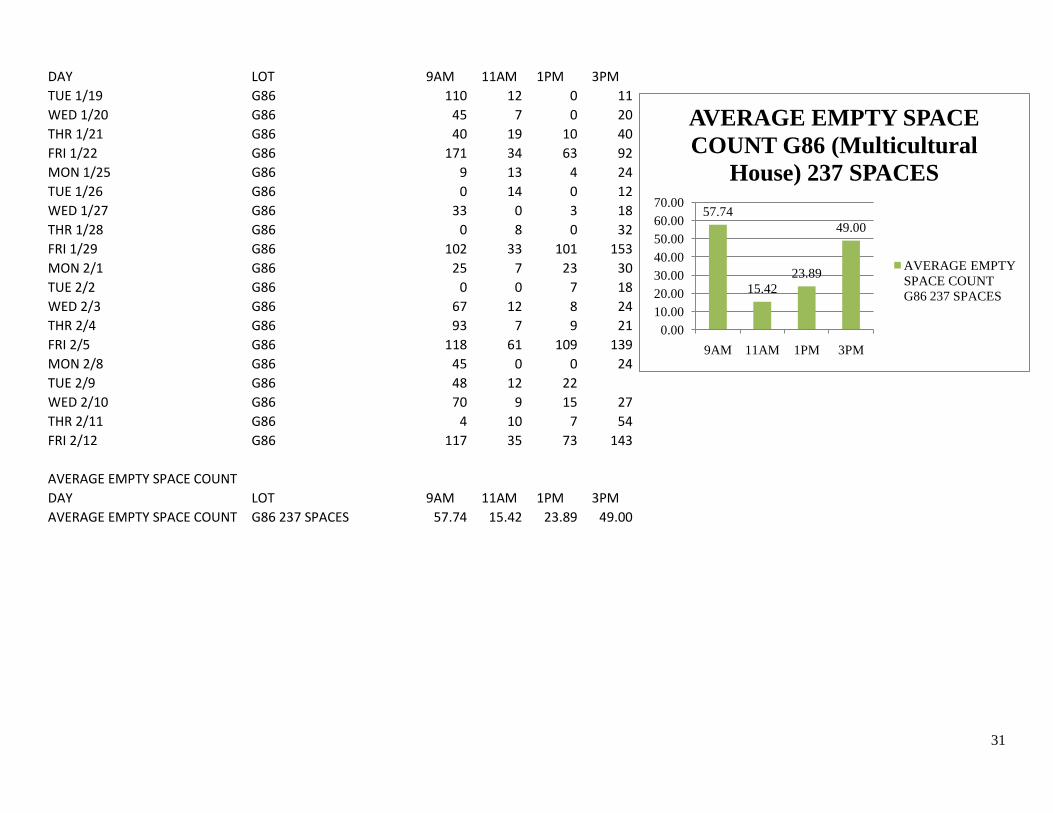
31
DAY LOT 9AM 11AM 1PM 3PM TUE 1/19 G86 110 12 0 11
WED 1/20 G86 45 7 0 20
THR 1/21 G86 40 19 10 40
FRI 1/22 G86 171 34 63 92
MON 1/25 G86 9 13 4 24
TUE 1/26 G86 0 14 0 12
WED 1/27 G86 33 0 3 18
THR 1/28 G86 0 8 0 32
FRI 1/29 G86 102 33 101 153
MON 2/1 G86 25 7 23 30
TUE 2/2 G86 0 0 7 18
WED 2/3 G86 67 12 8 24
THR 2/4 G86 93 7 9 21
FRI 2/5 G86 118 61 109 139
MON 2/8 G86 45 0 0 24
TUE 2/9 G86 48 12 22 WED 2/10 G86 70 9 15 27
THR 2/11 G86 4 10 7 54 FRI 2/12 G86 117 35 73 143
AVERAGE EMPTY SPACE COUNT DAY LOT 9AM 11AM 1PM 3PM
AVERAGE EMPTY SPACE COUNT G86 237 SPACES 57.74 15.42 23.89 49.00
57.74
15.42
23.89
49.00
0.00
10.00
20.00
30.00
40.00
50.00
60.00
70.00
9AM 11AM 1PM 3PM
AVERAGE EMPTY SPACE
COUNT G86 (Multicultural
House) 237 SPACES
AVERAGE EMPTY
SPACE COUNT
G86 237 SPACES
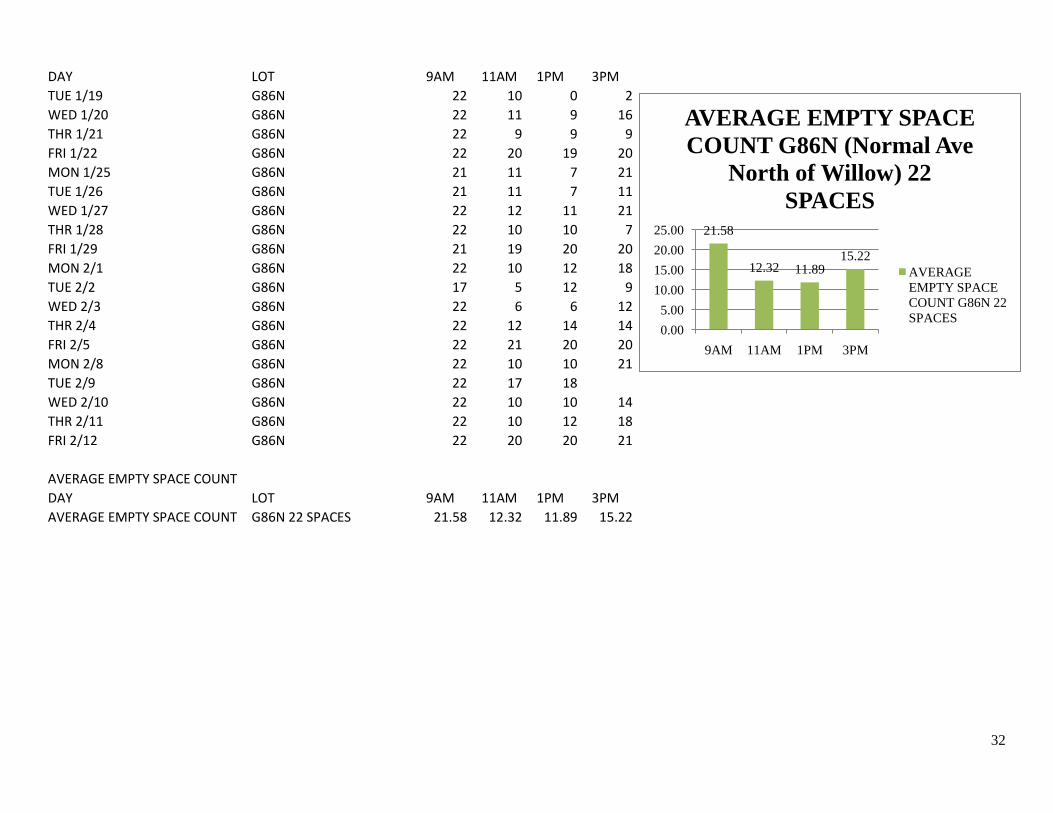
32
DAY LOT 9AM 11AM 1PM 3PM
TUE 1/19 G86N 22 10 0 2 WED 1/20 G86N 22 11 9 16 THR 1/21 G86N 22 9 9 9 FRI 1/22 G86N 22 20 19 20 MON 1/25 G86N 21 11 7 21 TUE 1/26 G86N 21 11 7 11 WED 1/27 G86N 22 12 11 21 THR 1/28 G86N 22 10 10 7 FRI 1/29 G86N 21 19 20 20 MON 2/1 G86N 22 10 12 18 TUE 2/2 G86N 17 5 12 9 WED 2/3 G86N 22 6 6 12 THR 2/4 G86N 22 12 14 14 FRI 2/5 G86N 22 21 20 20 MON 2/8 G86N 22 10 10 21 TUE 2/9 G86N 22 17 18
WED 2/10 G86N 22 10 10 14 THR 2/11 G86N 22 10 12 18 FRI 2/12 G86N 22 20 20 21
AVERAGE EMPTY SPACE COUNT DAY LOT 9AM 11AM 1PM 3PM
AVERAGE EMPTY SPACE COUNT G86N 22 SPACES 21.58 12.32 11.89 15.22
21.58
12.32 11.8915.22
0.00
5.00
10.00
15.00
20.00
25.00
9AM 11AM 1PM 3PM
AVERAGE EMPTY SPACE
COUNT G86N (Normal Ave
North of Willow) 22
SPACES
AVERAGE
EMPTY SPACE
COUNT G86N 22
SPACES
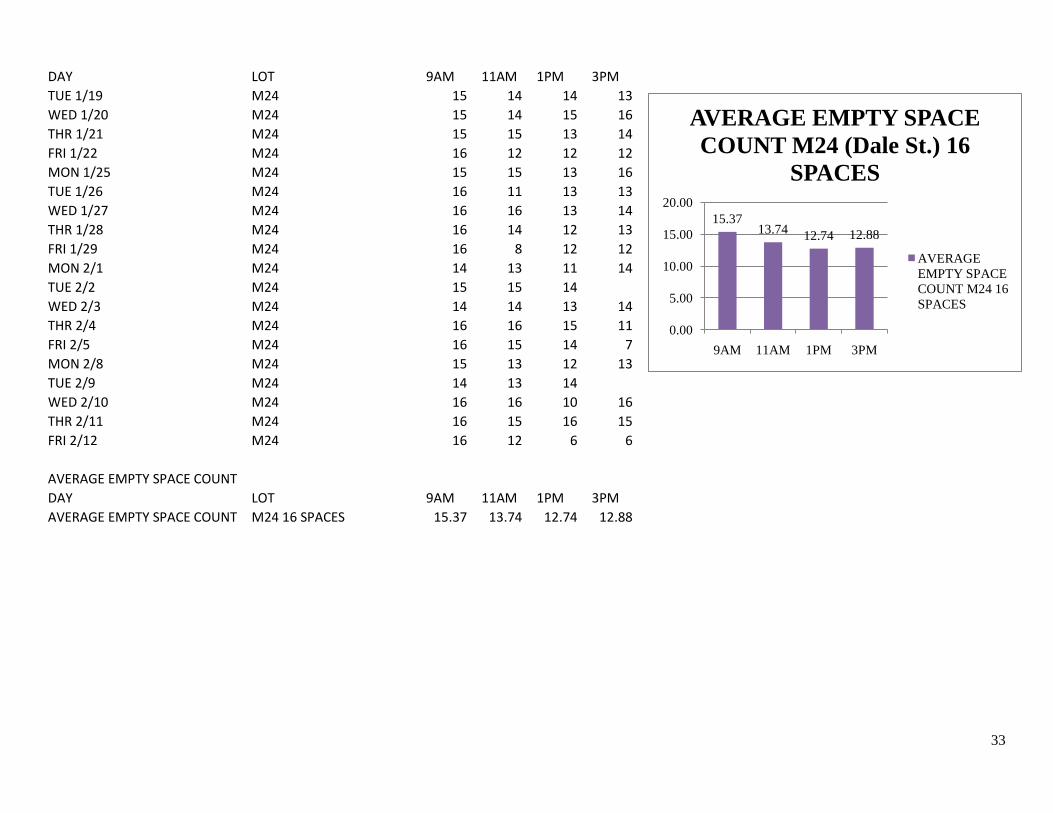
33
DAY LOT 9AM 11AM 1PM 3PM TUE 1/19 M24 15 14 14 13
WED 1/20 M24 15 14 15 16 THR 1/21 M24 15 15 13 14 FRI 1/22 M24 16 12 12 12 MON 1/25 M24 15 15 13 16 TUE 1/26 M24 16 11 13 13 WED 1/27 M24 16 16 13 14 THR 1/28 M24 16 14 12 13 FRI 1/29 M24 16 8 12 12 MON 2/1 M24 14 13 11 14 TUE 2/2 M24 15 15 14
WED 2/3 M24 14 14 13 14 THR 2/4 M24 16 16 15 11 FRI 2/5 M24 16 15 14 7 MON 2/8 M24 15 13 12 13 TUE 2/9 M24 14 13 14
WED 2/10 M24 16 16 10 16 THR 2/11 M24 16 15 16 15 FRI 2/12 M24 16 12 6 6
AVERAGE EMPTY SPACE COUNT DAY LOT 9AM 11AM 1PM 3PM
AVERAGE EMPTY SPACE COUNT M24 16 SPACES 15.37 13.74 12.74 12.88
15.3713.74
12.74 12.88
0.00
5.00
10.00
15.00
20.00
9AM 11AM 1PM 3PM
AVERAGE EMPTY SPACE
COUNT M24 (Dale St.) 16
SPACES
AVERAGE
EMPTY SPACE
COUNT M24 16
SPACES
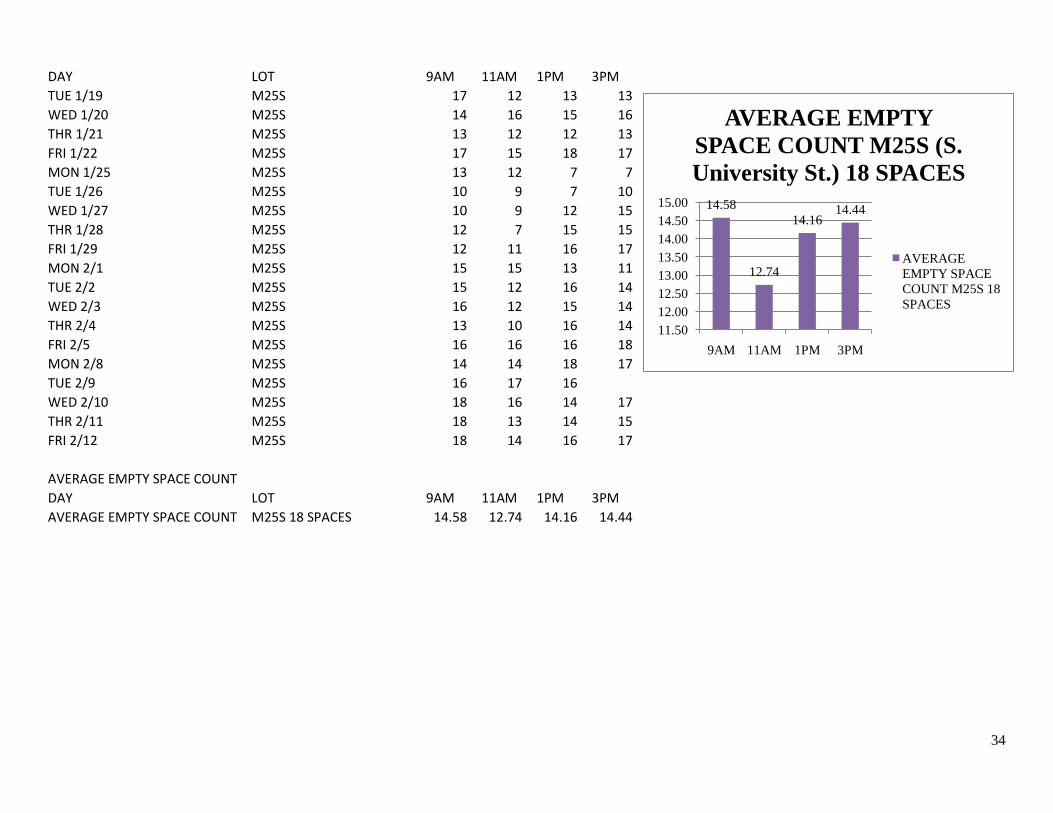
34
DAY LOT 9AM 11AM 1PM 3PM TUE 1/19 M25S 17 12 13 13
WED 1/20 M25S 14 16 15 16 THR 1/21 M25S 13 12 12 13 FRI 1/22 M25S 17 15 18 17 MON 1/25 M25S 13 12 7 7 TUE 1/26 M25S 10 9 7 10 WED 1/27 M25S 10 9 12 15 THR 1/28 M25S 12 7 15 15 FRI 1/29 M25S 12 11 16 17 MON 2/1 M25S 15 15 13 11 TUE 2/2 M25S 15 12 16 14 WED 2/3 M25S 16 12 15 14 THR 2/4 M25S 13 10 16 14 FRI 2/5 M25S 16 16 16 18 MON 2/8 M25S 14 14 18 17 TUE 2/9 M25S 16 17 16
WED 2/10 M25S 18 16 14 17 THR 2/11 M25S 18 13 14 15 FRI 2/12 M25S 18 14 16 17
AVERAGE EMPTY SPACE COUNT DAY LOT 9AM 11AM 1PM 3PM
AVERAGE EMPTY SPACE COUNT M25S 18 SPACES 14.58 12.74 14.16 14.44
14.58
12.74
14.1614.44
11.50
12.00
12.50
13.00
13.50
14.00
14.50
15.00
9AM 11AM 1PM 3PM
AVERAGE EMPTY
SPACE COUNT M25S (S.
University St.) 18 SPACES
AVERAGE
EMPTY SPACE
COUNT M25S 18
SPACES
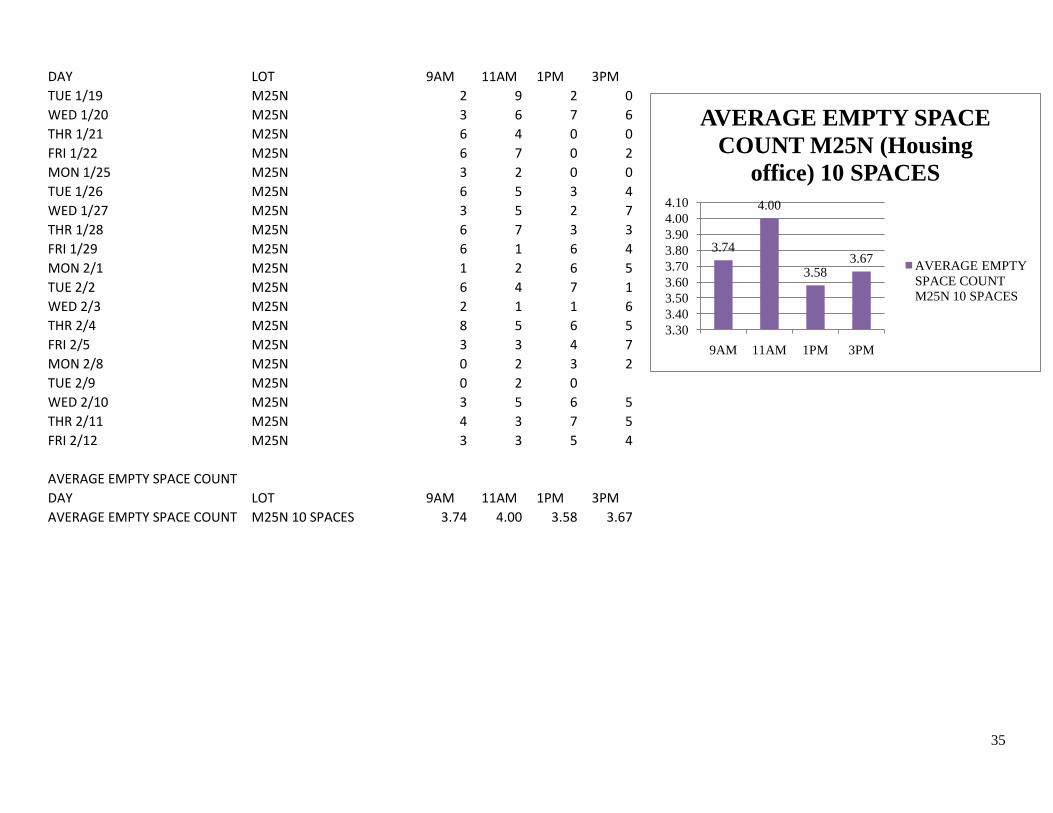
35
DAY LOT 9AM 11AM 1PM 3PM TUE 1/19 M25N 2 9 2 0
WED 1/20 M25N 3 6 7 6 THR 1/21 M25N 6 4 0 0 FRI 1/22 M25N 6 7 0 2 MON 1/25 M25N 3 2 0 0 TUE 1/26 M25N 6 5 3 4 WED 1/27 M25N 3 5 2 7 THR 1/28 M25N 6 7 3 3 FRI 1/29 M25N 6 1 6 4 MON 2/1 M25N 1 2 6 5 TUE 2/2 M25N 6 4 7 1 WED 2/3 M25N 2 1 1 6 THR 2/4 M25N 8 5 6 5 FRI 2/5 M25N 3 3 4 7 MON 2/8 M25N 0 2 3 2 TUE 2/9 M25N 0 2 0
WED 2/10 M25N 3 5 6 5 THR 2/11 M25N 4 3 7 5 FRI 2/12 M25N 3 3 5 4
AVERAGE EMPTY SPACE COUNT DAY LOT 9AM 11AM 1PM 3PM
AVERAGE EMPTY SPACE COUNT M25N 10 SPACES 3.74 4.00 3.58 3.67
3.74
4.00
3.583.67
3.30
3.40
3.50
3.60
3.70
3.80
3.90
4.00
4.10
9AM 11AM 1PM 3PM
AVERAGE EMPTY SPACE
COUNT M25N (Housing
office) 10 SPACES
AVERAGE EMPTY
SPACE COUNT
M25N 10 SPACES
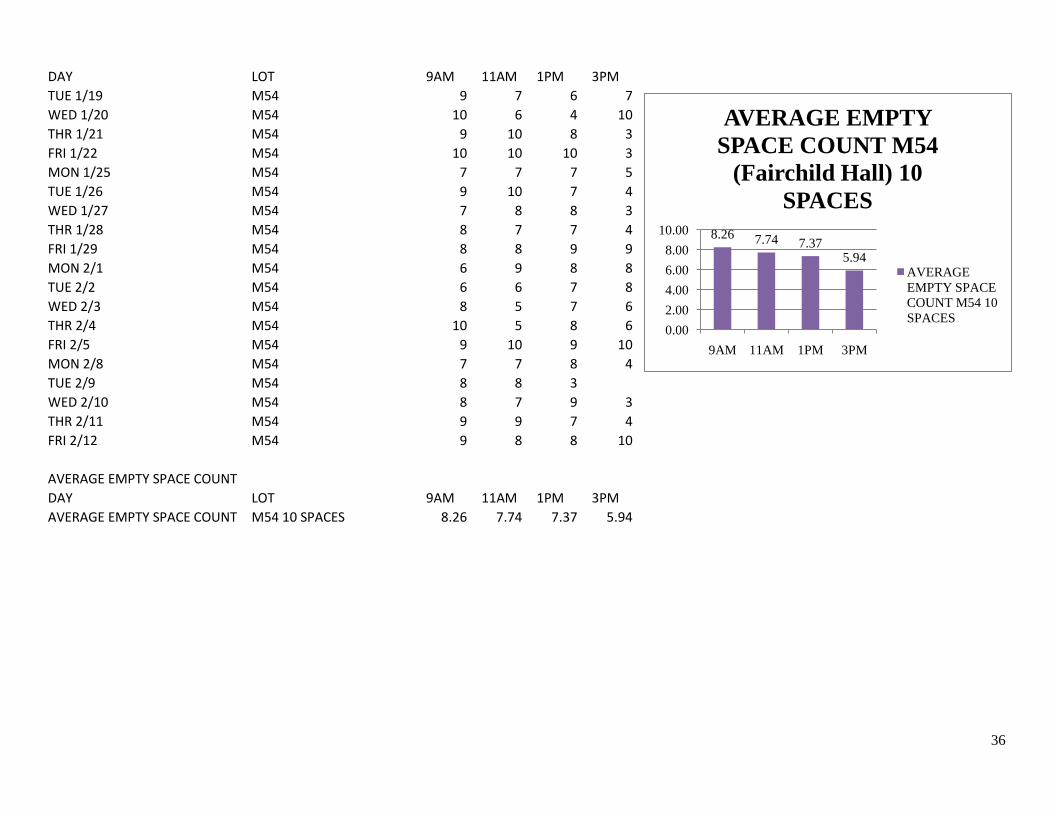
36
DAY LOT 9AM 11AM 1PM 3PM TUE 1/19 M54 9 7 6 7
WED 1/20 M54 10 6 4 10 THR 1/21 M54 9 10 8 3 FRI 1/22 M54 10 10 10 3 MON 1/25 M54 7 7 7 5 TUE 1/26 M54 9 10 7 4 WED 1/27 M54 7 8 8 3 THR 1/28 M54 8 7 7 4 FRI 1/29 M54 8 8 9 9 MON 2/1 M54 6 9 8 8 TUE 2/2 M54 6 6 7 8 WED 2/3 M54 8 5 7 6 THR 2/4 M54 10 5 8 6 FRI 2/5 M54 9 10 9 10 MON 2/8 M54 7 7 8 4 TUE 2/9 M54 8 8 3
WED 2/10 M54 8 7 9 3 THR 2/11 M54 9 9 7 4 FRI 2/12 M54 9 8 8 10
AVERAGE EMPTY SPACE COUNT DAY LOT 9AM 11AM 1PM 3PM
AVERAGE EMPTY SPACE COUNT M54 10 SPACES 8.26 7.74 7.37 5.94
8.26 7.74 7.375.94
0.00
2.00
4.00
6.00
8.00
10.00
9AM 11AM 1PM 3PM
AVERAGE EMPTY
SPACE COUNT M54
(Fairchild Hall) 10
SPACES
AVERAGE
EMPTY SPACE
COUNT M54 10
SPACES
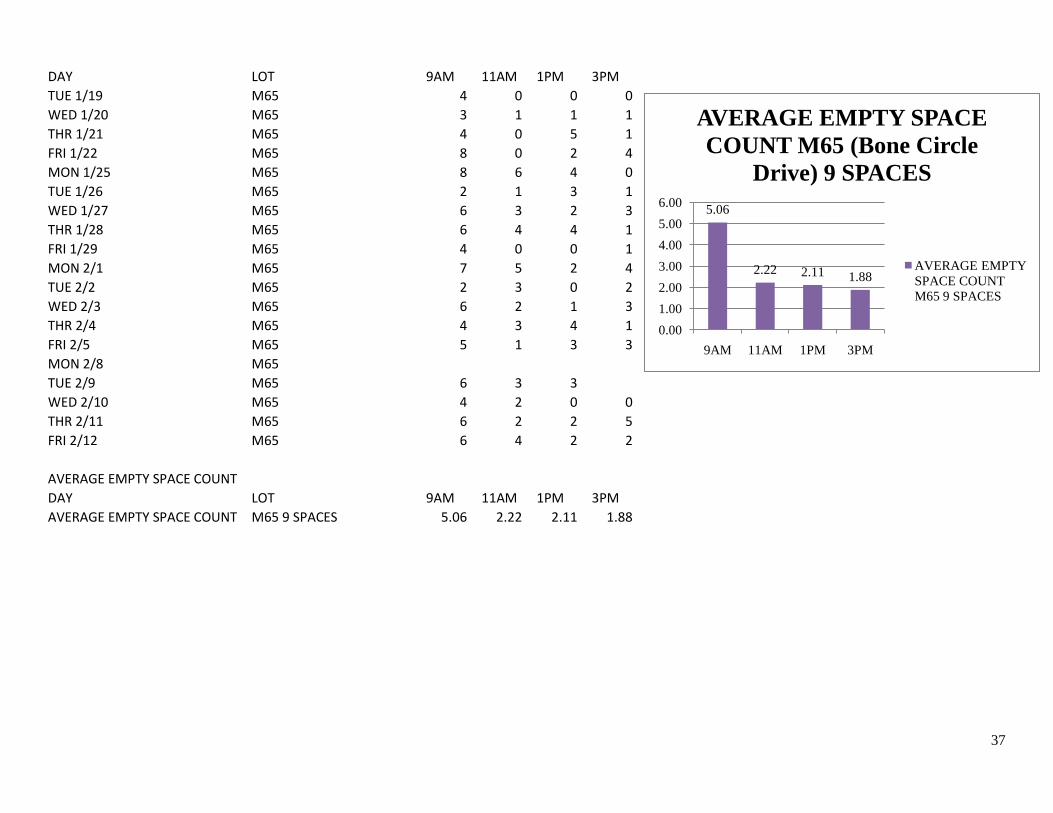
37
DAY LOT 9AM 11AM 1PM 3PM
TUE 1/19 M65 4 0 0 0 WED 1/20 M65 3 1 1 1 THR 1/21 M65 4 0 5 1 FRI 1/22 M65 8 0 2 4 MON 1/25 M65 8 6 4 0 TUE 1/26 M65 2 1 3 1 WED 1/27 M65 6 3 2 3 THR 1/28 M65 6 4 4 1 FRI 1/29 M65 4 0 0 1 MON 2/1 M65 7 5 2 4 TUE 2/2 M65 2 3 0 2 WED 2/3 M65 6 2 1 3 THR 2/4 M65 4 3 4 1 FRI 2/5 M65 5 1 3 3 MON 2/8 M65
TUE 2/9 M65 6 3 3 WED 2/10 M65 4 2 0 0
THR 2/11 M65 6 2 2 5 FRI 2/12 M65 6 4 2 2
AVERAGE EMPTY SPACE COUNT DAY LOT 9AM 11AM 1PM 3PM
AVERAGE EMPTY SPACE COUNT M65 9 SPACES 5.06 2.22 2.11 1.88
5.06
2.22 2.11 1.88
0.00
1.00
2.00
3.00
4.00
5.00
6.00
9AM 11AM 1PM 3PM
AVERAGE EMPTY SPACE
COUNT M65 (Bone Circle
Drive) 9 SPACES
AVERAGE EMPTY
SPACE COUNT
M65 9 SPACES
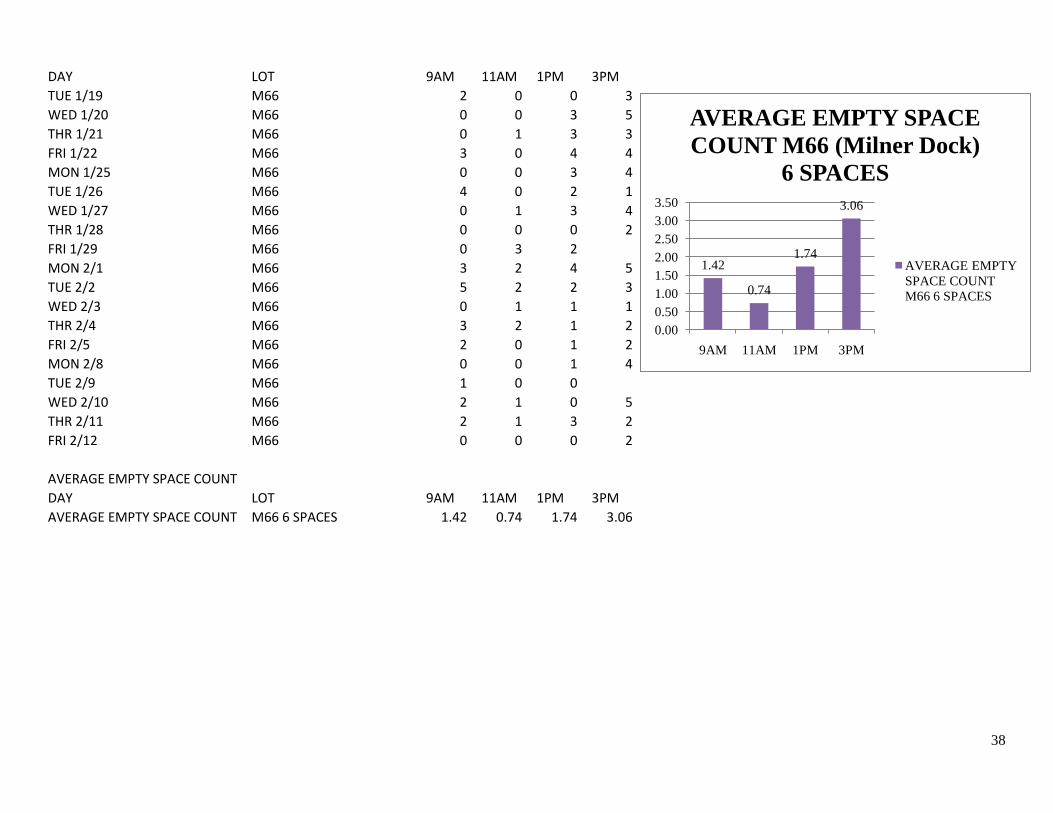
38
DAY LOT 9AM 11AM 1PM 3PM
TUE 1/19 M66 2 0 0 3
WED 1/20 M66 0 0 3 5
THR 1/21 M66 0 1 3 3
FRI 1/22 M66 3 0 4 4
MON 1/25 M66 0 0 3 4
TUE 1/26 M66 4 0 2 1
WED 1/27 M66 0 1 3 4
THR 1/28 M66 0 0 0 2
FRI 1/29 M66 0 3 2 MON 2/1 M66 3 2 4 5
TUE 2/2 M66 5 2 2 3
WED 2/3 M66 0 1 1 1
THR 2/4 M66 3 2 1 2
FRI 2/5 M66 2 0 1 2
MON 2/8 M66 0 0 1 4
TUE 2/9 M66 1 0 0 WED 2/10 M66 2 1 0 5
THR 2/11 M66 2 1 3 2 FRI 2/12 M66 0 0 0 2
AVERAGE EMPTY SPACE COUNT DAY LOT 9AM 11AM 1PM 3PM
AVERAGE EMPTY SPACE COUNT M66 6 SPACES 1.42 0.74 1.74 3.06
1.42
0.74
1.74
3.06
0.00
0.50
1.00
1.50
2.00
2.50
3.00
3.50
9AM 11AM 1PM 3PM
AVERAGE EMPTY SPACE
COUNT M66 (Milner Dock)
6 SPACES
AVERAGE EMPTY
SPACE COUNT
M66 6 SPACES
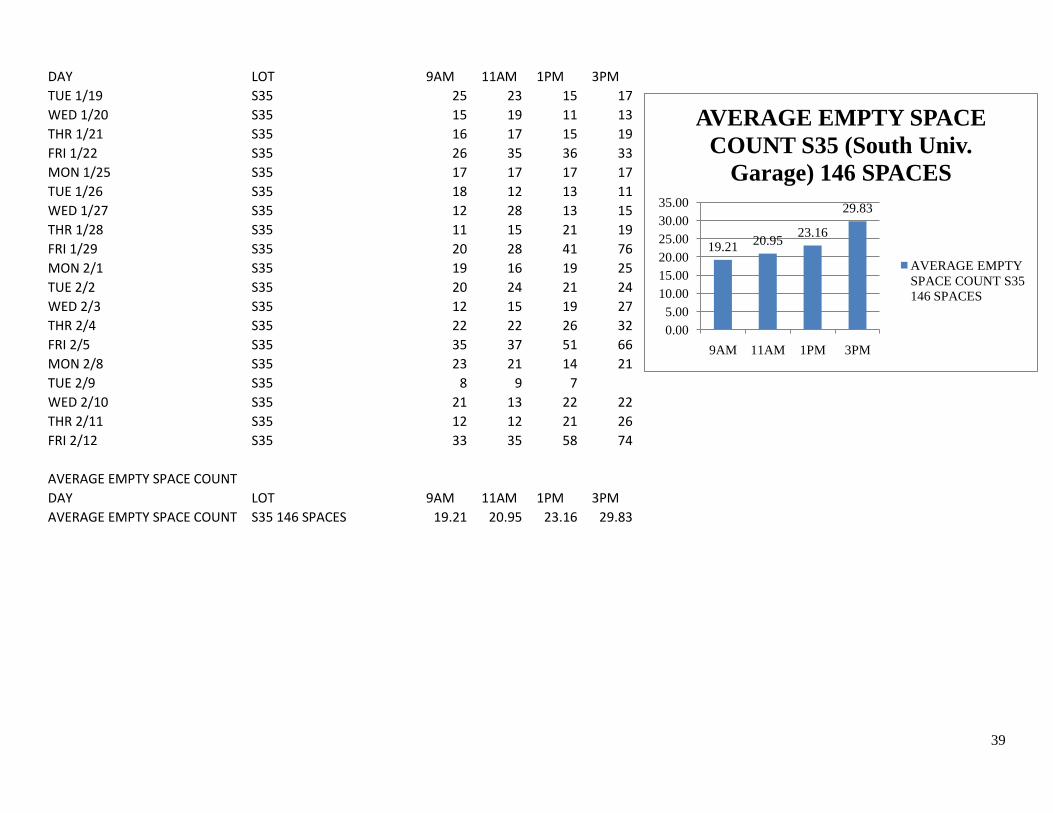
39
DAY LOT 9AM 11AM 1PM 3PM
TUE 1/19 S35 25 23 15 17 WED 1/20 S35 15 19 11 13 THR 1/21 S35 16 17 15 19 FRI 1/22 S35 26 35 36 33 MON 1/25 S35 17 17 17 17 TUE 1/26 S35 18 12 13 11 WED 1/27 S35 12 28 13 15 THR 1/28 S35 11 15 21 19 FRI 1/29 S35 20 28 41 76 MON 2/1 S35 19 16 19 25 TUE 2/2 S35 20 24 21 24 WED 2/3 S35 12 15 19 27 THR 2/4 S35 22 22 26 32 FRI 2/5 S35 35 37 51 66 MON 2/8 S35 23 21 14 21 TUE 2/9 S35 8 9 7
WED 2/10 S35 21 13 22 22 THR 2/11 S35 12 12 21 26 FRI 2/12 S35 33 35 58 74
AVERAGE EMPTY SPACE COUNT DAY LOT 9AM 11AM 1PM 3PM
AVERAGE EMPTY SPACE COUNT S35 146 SPACES 19.21 20.95 23.16 29.83
19.2120.95
23.16
29.83
0.00
5.00
10.00
15.00
20.00
25.00
30.00
35.00
9AM 11AM 1PM 3PM
AVERAGE EMPTY SPACE
COUNT S35 (South Univ.
Garage) 146 SPACES
AVERAGE EMPTY
SPACE COUNT S35
146 SPACES
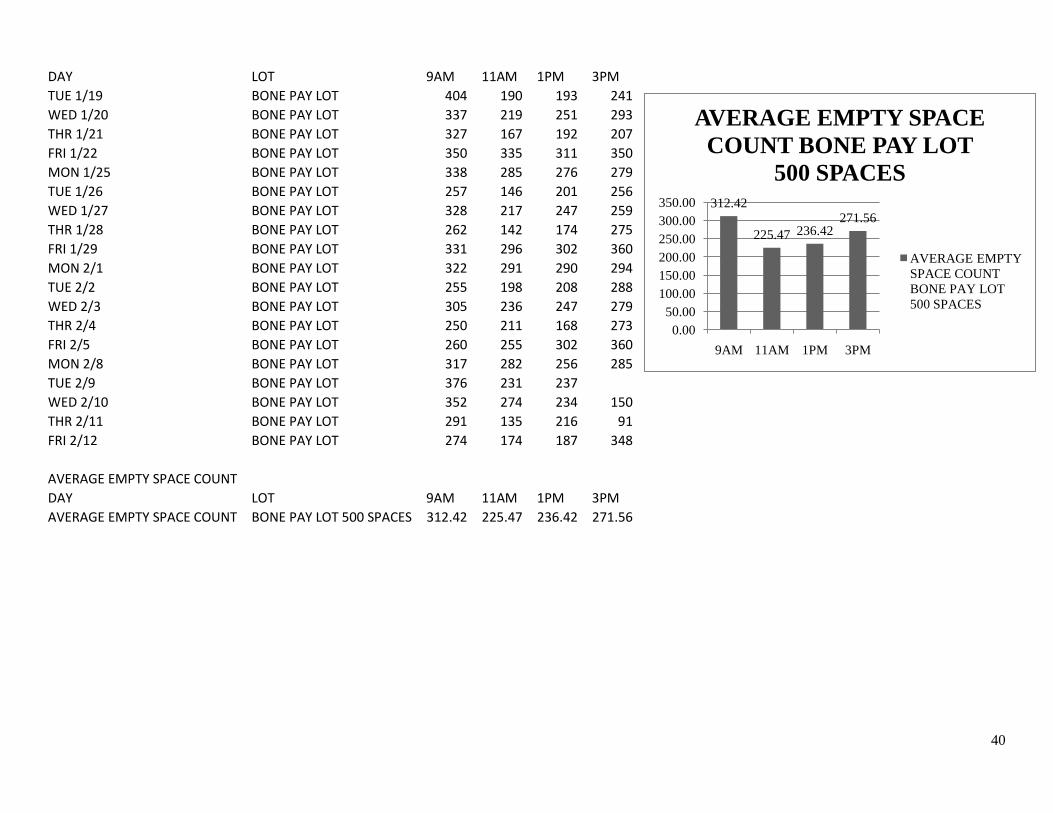
40
DAY LOT 9AM 11AM 1PM 3PM TUE 1/19 BONE PAY LOT 404 190 193 241
WED 1/20 BONE PAY LOT 337 219 251 293 THR 1/21 BONE PAY LOT 327 167 192 207 FRI 1/22 BONE PAY LOT 350 335 311 350 MON 1/25 BONE PAY LOT 338 285 276 279 TUE 1/26 BONE PAY LOT 257 146 201 256 WED 1/27 BONE PAY LOT 328 217 247 259 THR 1/28 BONE PAY LOT 262 142 174 275 FRI 1/29 BONE PAY LOT 331 296 302 360 MON 2/1 BONE PAY LOT 322 291 290 294 TUE 2/2 BONE PAY LOT 255 198 208 288 WED 2/3 BONE PAY LOT 305 236 247 279 THR 2/4 BONE PAY LOT 250 211 168 273 FRI 2/5 BONE PAY LOT 260 255 302 360 MON 2/8 BONE PAY LOT 317 282 256 285 TUE 2/9 BONE PAY LOT 376 231 237
WED 2/10 BONE PAY LOT 352 274 234 150 THR 2/11 BONE PAY LOT 291 135 216 91 FRI 2/12 BONE PAY LOT 274 174 187 348
AVERAGE EMPTY SPACE COUNT DAY LOT 9AM 11AM 1PM 3PM
AVERAGE EMPTY SPACE COUNT BONE PAY LOT 500 SPACES 312.42 225.47 236.42 271.56
312.42
225.47 236.42271.56
0.00
50.00
100.00
150.00
200.00
250.00
300.00
350.00
9AM 11AM 1PM 3PM
AVERAGE EMPTY SPACE
COUNT BONE PAY LOT
500 SPACES
AVERAGE EMPTY
SPACE COUNT
BONE PAY LOT
500 SPACES
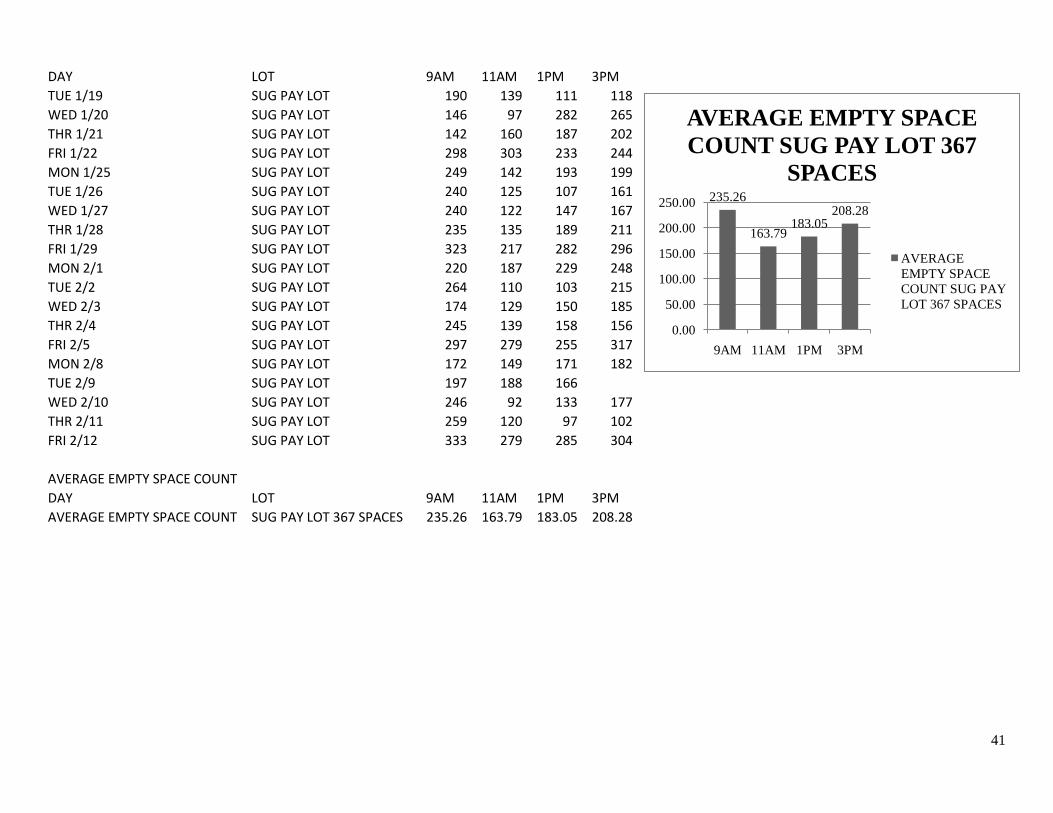
41
DAY LOT 9AM 11AM 1PM 3PM TUE 1/19 SUG PAY LOT 190 139 111 118
WED 1/20 SUG PAY LOT 146 97 282 265 THR 1/21 SUG PAY LOT 142 160 187 202 FRI 1/22 SUG PAY LOT 298 303 233 244 MON 1/25 SUG PAY LOT 249 142 193 199 TUE 1/26 SUG PAY LOT 240 125 107 161 WED 1/27 SUG PAY LOT 240 122 147 167 THR 1/28 SUG PAY LOT 235 135 189 211 FRI 1/29 SUG PAY LOT 323 217 282 296 MON 2/1 SUG PAY LOT 220 187 229 248 TUE 2/2 SUG PAY LOT 264 110 103 215 WED 2/3 SUG PAY LOT 174 129 150 185 THR 2/4 SUG PAY LOT 245 139 158 156 FRI 2/5 SUG PAY LOT 297 279 255 317 MON 2/8 SUG PAY LOT 172 149 171 182 TUE 2/9 SUG PAY LOT 197 188 166
WED 2/10 SUG PAY LOT 246 92 133 177 THR 2/11 SUG PAY LOT 259 120 97 102 FRI 2/12 SUG PAY LOT 333 279 285 304
AVERAGE EMPTY SPACE COUNT DAY LOT 9AM 11AM 1PM 3PM
AVERAGE EMPTY SPACE COUNT SUG PAY LOT 367 SPACES 235.26 163.79 183.05 208.28
235.26
163.79183.05
208.28
0.00
50.00
100.00
150.00
200.00
250.00
9AM 11AM 1PM 3PM
AVERAGE EMPTY SPACE
COUNT SUG PAY LOT 367
SPACES
AVERAGE
EMPTY SPACE
COUNT SUG PAY
LOT 367 SPACES
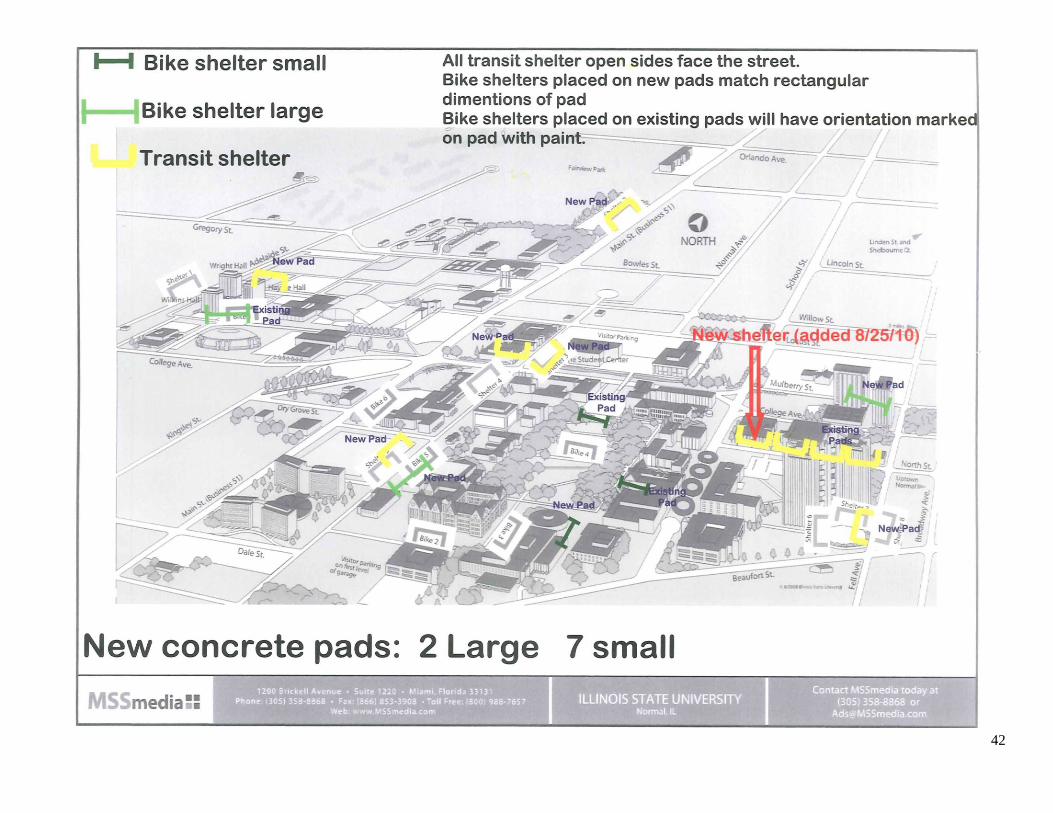
42

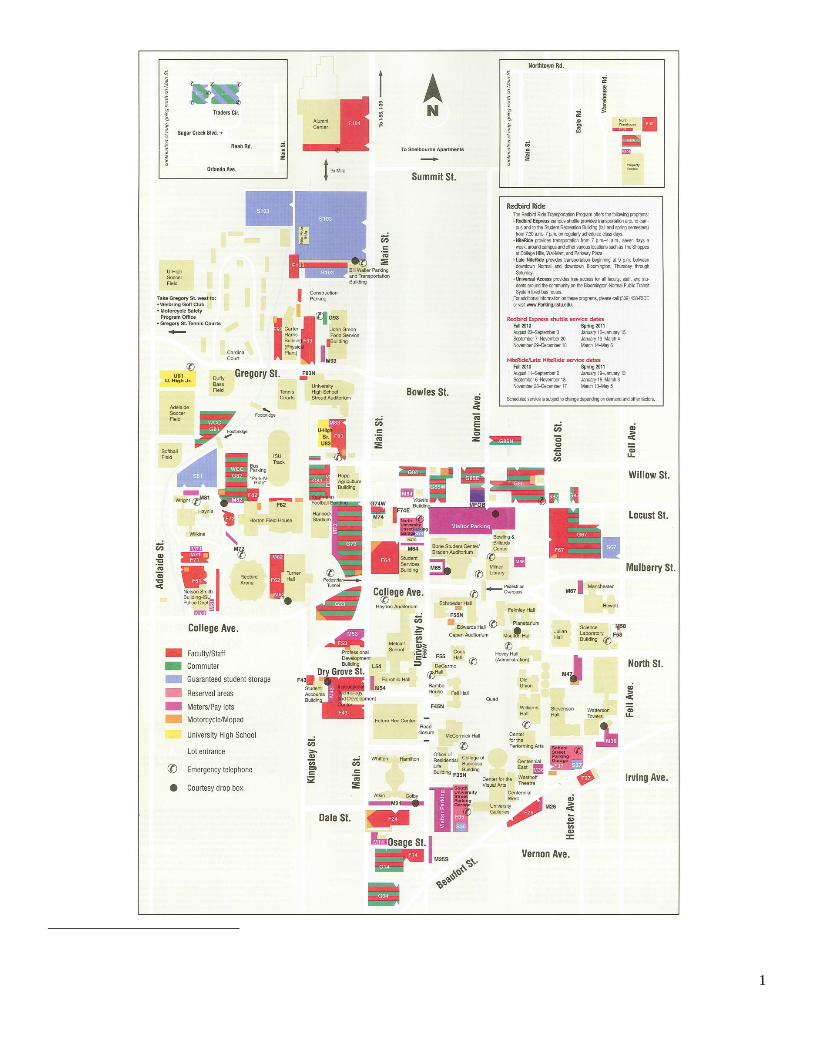
1


