
Impact of a Self-Regulated, Computerized, Social-Emotional Learning Intervention on Disengaged and Delinquent Students At a Continuation High School Kristin M. Bass, Ph.D. and S. Marshall Perry, Ph.D., Research Associates, Rockman et al. Alice Ray, MBA, Principal Investigator, and Sarah Berg, Research Coordinator, Ripple Effects
Direct correspondence and requests for reprints to: Alice Ray, Ripple Effects, 33 New Montgomery Street, Suite 290, San Francisco, CA 94105; [email protected], (415) 227-1669
ABSTRACT
Students who have previously dropped out or been involved in juvenile justice fill the
“school to prison pipeline.” A real world, longitudinal study of Ripple Effects
computerized, social-emotional learning (SEL) intervention examined two questions: To
what degree would these adolescents comply with a mandate to use the self-regulated
intervention? If they complied, what would be the objective and subjective impacts?
Participants were 177 mostly African American and Latino adolescents enrolled in a
continuation school. Treatment group (TG) students were directed to independently
complete 42 multimedia SEL skill-building tutorials, over six weeks. Fifty-nine percent
were minimally compliant. Of those, 96% also addressed issues of personal interest.
Post-intervention, compared to the control group (CG), TG students had significantly
higher GPA, and no difference in absenteeism. The ratio of TG students enrolled in the
district a year later was double that of the CG, p<.05. TG students had zero
suspensions, compared to one for every nine CG students; an important but not
significant result. There was no significant impact on attitudes about marijuana or
alcohol, or locus of control. Because of insufficient baseline administrative data, we
cannot rule out factors other than the intervention, such as differing levels of student
motivation, being responsible for effects.
KEY WORDS: dropout; achievement gap; educational software; disproportionality; juvenile
justice
BACKGROUND
The interrelatedness of school failure,
substance abuse and anti-social behavior
leading to criminality is well established
(Hawkins, Jenson, Catalano, & Lishner, 1988),
though the causal links between them are not.
In some cases, substance abuse leads to
multiple problem behaviors, and problem
behavior leads to truancy and school failure
and/or arrest. In others, school failure leads to
substance abuse, and substance abuse leads to
problem behavior, and then arrest. In still
others, anti-social behavior leads to school
failure, which in turn leads to truancy and
substance abuse, and eventually contact with
the juvenile justice system.
A wide range of risk factors that operate on
multiple domains–individual, peer, family,
school, community and social structures–can
all be precipitators for any or all three of these
negative outcomes (Hawkins et al., 1998,
Lipsey & Derzon, 1998). Regardless of the
specific precipitating factors, their combined
effect is often the same: a lifetime marked by
the effects of early school failure, substance
abuse and early involvement with the justice
system.

Impact of Ripple Effects on disengaged and delinquent students 2
Continuation schools exist to intervene in
this downward spiral. The “continuation”
nomenclature refers to rolling enrollment,
which is a mark of these schools. They often
operate in conjunction with the juvenile court
system. Students frequently attend for one of
three reasons: order of the court; they have
been expelled from regular schools in the
district; or, they are returning after dropping out
for more than two years. In addition, in
California and other border states, some
Hispanic students attend continuation schools
because their parents are seasonal workers who
travel to and from Mexico or Central America.
These events do not neatly coincide with
semester breaks.
Ripple Effects is a comprehensive, student-
centered, self-regulated, computer-based social-
emotional learning (SEL) intervention designed
to reduce risk and increase protective factors
among youth, especially those most vulnerable
to school failure, substance abuse or juvenile
justice involvement. It can be configured to
promote self-efficacy, as well as for other
primary, secondary and tertiary interventions. It
enhances protective factors at the level of the
individual by providing training in core social-
emotional competencies. Research has linked
increased social-emotional competency to
lower dropout rates, increased school
engagement, reduced aggressive behavior,
reduced involvement in the juvenile justice
system, and greater resilience (Benard, 2004;
Elias & Arnold, 2006; Lipsey & Derzon, 1998;
Wilson & Lipsey, 2007; Zins, Weissberg, Wang,
& Walberg, 2004).
Ripple Effects addresses risk factors in other
domains by providing science-based
information and skill training to enable pro-
social decision-making, including the decision
to ask for help. It provides intensive,
individualized guidance and support through
context-specific tutorials. Thousands of
multimedia screens are organized into
hundreds of interactive tutorials that can be
mixed and matched toward these ends. It is in
use in more than 500 school districts, including
dozens of the largest urban districts in the
United States, as well as more than 15 juvenile
justice settings.
Data from two prior studies indicated the
program had promising but not proven positive
effects on school outcomes, when used
independently by students, without adult
mediation of content (Ray, 1999; Stern & Repa,
2000). This article discusses one of six
concurrent studies begun in 2003 to
systematically examine the impacts of Ripple
Effects on attitudes, behavior and academic
performance among diverse groups of
adolescents. National Institute on Drug Abuse
was the primary funder of the series of studies.
Purpose
The purpose of this study was to twofold: to
assess implementation process fidelity, and to
evaluate intervention efficacy of Ripple Effects SEL software on high school students who had
experienced previous school failure or
involvement in the juvenile justice system.
METHODS
Research Design
The school level study was a longitudinal,
repeated measures, (pretest, posttest, follow-up)
randomized controlled trial, with reservations,
conducted under real world conditions, without
any direct involvement of program developers
in delivery of the intervention. Success was
measured by the extent to which exposure to
Ripple Effects changed students’ attitudes,
behavior and academic performance.
Individual students were the unit of analysis.
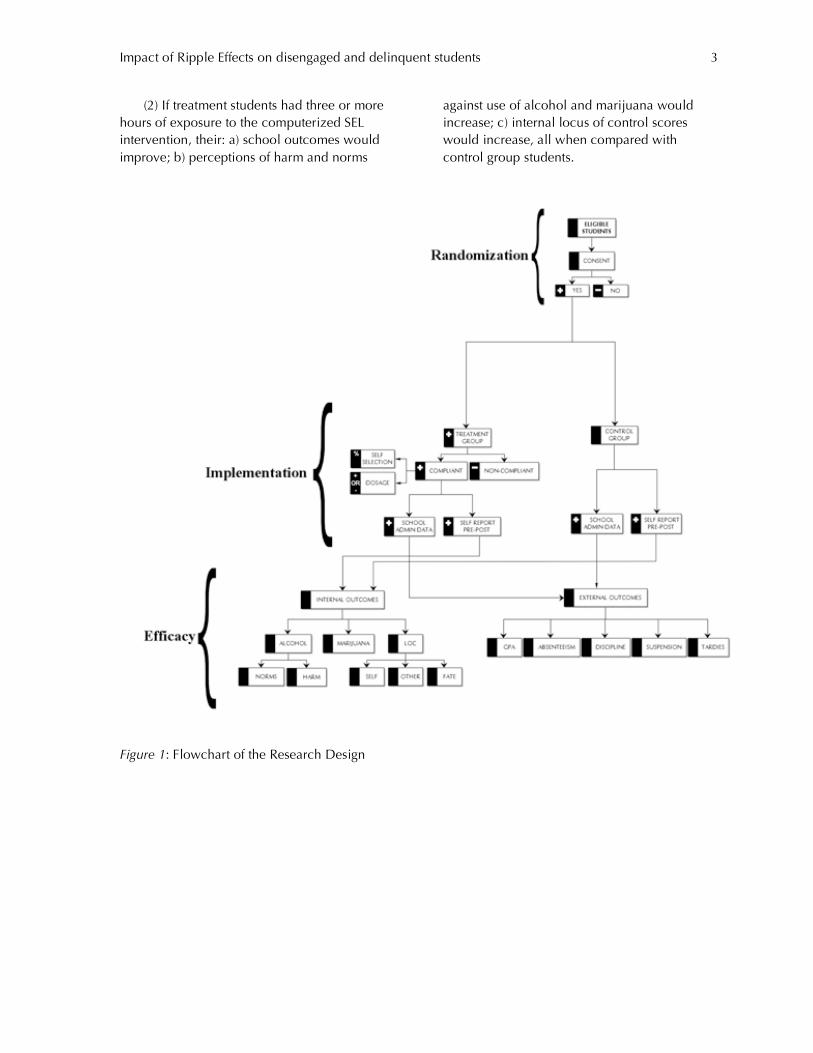
Figure 1 provides a flowchart of the research
design.
We tested these hypotheses:
(1) Under real world school conditions, if
given the opportunity and access to technology:
a) students would comply with group level
requirements for use of the software; b) with no
more than three hours of training on the
intervention, staff would monitor and ensure
that use; and c) students would accept an
invitation to explore additional tutorials of
personal interest.
Impact of Ripple Effects on disengaged and delinquent students 3
(2) If treatment students had three or more
hours of exposure to the computerized SEL
intervention, their: a) school outcomes would
improve; b) perceptions of harm and norms
against use of alcohol and marijuana would
increase; c) internal locus of control scores
would increase, all when compared with
control group students.
Figure 1: Flowchart of the Research Design
Impact of Ripple Effects on disengaged and delinquent students 4
Setting
The setting was a continuation high school
in a violence-ridden neighborhood of a major
city with one of the highest homicide rates in
the United States. The school is part of a district
that had been taken over by a state
administrator, due to financial irregularities and
near insolvency. In the 2003-2004 school year,
this school had 300 students. The school
population reflects the population of the
juvenile justice system overall. That is: poor,
academically unsuccessful, and
disproportionately African American and
Latino. The population of this continuation
school was not just comprised of students at
risk of school failure and/or involvement in the
juvenile justice system; it was comprised of
students who had already failed. They had
dropped out, or been kicked out of school,
and/or had engaged in behavior that put them
under the jurisdiction of the court.
Participants
One hundred seventy-seven students in
grades 9 to 12 participated. They ranged in age
from 16 to 19, and 90% were 16 or 17. Fifty-
nine percent were male, 19% were Limited
English Proficiency, and 66% qualified for Free
or Reduced Lunch, a marker for low
socioeconomic status (SES). Seventy-two
percent of the students were African American,
17% Hispanic, 10% Asian/Pacific Islander, and
1% Caucasian.
Assignment to Condition
The School Administration Student
Information (SASI) computer program sorted
students into advisory periods. The original
design was for half of the advisories to be
assigned to each condition, which occurred.
During the pretest period, it became apparent
that technology capacity constraints required
reducing the treatment group by half. Two of
four classes were dropped, leaving 52 students
in the treatment group. The remaining students
were added to the control group. Soon after, it
became clear that the same technology
constraints impacted the swollen control group.
The vice-principal therefore randomly selected
125 students across all grades, for completion
of pretest, computerized surveys and
enrollment in the study control group. This left
an imbalance between group sizes (TG N=52
vs. CG N=125), which was corrected by
randomly sub-sampling the control group at
post to match the number of treatment group
students who were exposed to the intervention
(TG N=27).
Conditions of Use
Treatment condition. One advisory teacher
monitored treatment group students from both
advisories, for self-regulated completion of 37
tutorials (roughly nine contact hours) over
seven weeks during advisory period, other free
time, or whenever they had her as their teacher.
All students had equal access to the program,
because they all rotated through this facilitator’s
class equally. Some voluntarily came early or
stayed late to do the program. No content was
mediated by the teacher, but she was mandated
to monitor electronic scorecards to track
compliance. After completing their assigned
tutorials, students could use remaining free time
to explore any of the additional 141 tutorials of
their choice.
Control condition. Control group students
participated in “business as usual” during
advisory period, and during other class periods
during which treatment students had access to
the program.
Intervention
The intervention was a subset of tutorials
from Ripple Effects SEL software. At the time of
this study, Ripple Effects’ teen version included
178 multimedia tutorials (390 as of 2008),
designed to build protective factors, reduce risk
factors, and solve problems in non-academic
areas correlated with school success. The
tutorials are reading-independent training
modules, which take about 15 minutes each,
on average, to complete. They are made up of
photos, illustrations, videos, audio, peer-
narrated text, and interactive exercises, with a
hip-hop look and feel.

Impact of Ripple Effects on disengaged and delinquent students 5
The configuration of the intervention
examined here was a “self-efficacy” one. Self-
efficacy is the context-specific belief in one’s
capacity to master what is needed to succeed
(Bandura, 1997). Success in this case was
defined as academic achievement, reduction in
behavioral problems, and positive changes in
attitudes toward alcohol, marijuana and locus
of control. A scope and sequence was designed
to promote cognitive, social and emotional
capacity-building toward those intended ends.
Twenty-one tutorials addressed "core
components" of self-efficacy in the context of
school achievement and prevention of
substance abuse. Of the remaining 157, 16 that
school staff considered to be most relevant to
their particular student population were added.
They were heavily weighted toward building
strengths (13 tutorials), over addressing
problems (two, disputes and quitting habits).
Content was organized into strengths
(assets), problems (behavioral, academic,
social), and reasons (risk factors at individual,
family peer, school, community and social
structure levels). Once students had completed
the required tutorials, they could follow the
built-in links between tutorials, to go deeper
into those topics that interested them.
Learning process. Independent of specific
content, the Whole Spectrum Self-Regulated
Learning System that powers Ripple Effects SEL
software (Figure 2) contains elements that have
been linked to successful development of self-
efficacy: guided mastery, self-regulated
learning, observational learning, systematic self-
reflection, transfer training, and skill rehearsal
(Bandura, 1997; Pajares & Urdan, 2006). All of
these modes of learning are introduced with a
case study scenario (context-specific
application). Additional elements of the system
include continuous assessment of content
mastery through interactive games; reading
independence through peer narration and
illustrations; narrative/story as teaching tool,
including first person video true stories; and,
positive reinforcement for completion of the
learning process through a video game style
point system.
Implementer training. A Ripple Effects
trainer provided four teachers with a single
three-hour training session to orient them to the
software, choose their site-specific tutorials, and
prepare them to introduce the software to
students, assign the tutorials, and use the built-
in data management system to monitor
compliance and track student progress.
Ultimately, only one of the four trained staff
facilitated all student participation in the
intervention.
Figure 2: Diagram of the Whole Spectrum Self-Regulated Learning System

Impact of Ripple Effects on disengaged and delinquent students 6
Outcome Measures
The analysis included multiple, quantitative
and qualitative, process and outcome measures.
Quantitative process measures.Quantitative
process measures included enrollment attrition,
study attrition, intervention attrition
(compliance), dosage and self-selection of
optional tutorials.
We classified as “enrollment attrition” the
percentage of students for whom there was no
pre or post-intervention administrative data,
because their family had moved or they had
been removed from school.
We classified as “study attrition” the
percentage of students who were physically
enrolled in school, but failed to complete the
pre and/or post self-report surveys, whether
because they withdrew consent, were absent,
could not gain access to the technology, or
were not mandated by staff to do so.
We classified as “intervention attrition” the
percentage of students in the treatment group
who had consented to the study but, for
whatever reason, did not comply with minimal
requirement of at least three hours exposure to
the software. We included in efficacy and
dosage analysis all students who had at least
three hours exposure to the software program.
Dosage measured the level of exposure
among students who complied. We defined
engagement with self-selected content as a yes
or no event; we did not analyze that dosage.
Quantitative outcome measures. Quantitative outcome measures included no
fewer than 12 measures of concept mastery,
four objective school achievement measures,
and two self-report measures.
To measure concept mastery, each tutorial
included a set of six multiple-choice questions,
disguised as an interactive game. The tests are
structured such that students cannot complete
the game and earn points until every answer is
correct. Students could experiment with
answers until they arrived at the correct one.
Compliant students had to complete at least 12
of these tests.
The four objective school achievement
measures were grade point average (GPA), days
absent, suspensions, and school enrollment
rates at one-year follow-up.
Quantitative self-report measures included
two computer-based, pre and post surveys on
(1) attitudes toward alcohol and marijuana, and
(2) perceived locus of control. Both self-report
surveys were adaptations of previously
validated instruments. The Monitoring the
Future (MTF) survey measures norms and
perceptions of harm about alcohol, marijuana
and other drugs. The Multi-dimensional Health
Locus of Control scales (MHLC) measure
attribution of life events to internal (Self) or
external (Fate/Other) factors. For both scales,
Ripple Effects adapted the format to peer-
narrated, computerized delivery, with a hip-hop
look and feel, a game-like structure of
reinforcement for any answer, and automated
data collection. For the locus of control scales,
Ripple Effects adapted the “Other” subscale to
include other social forces, such as racism, as
well as other powerful people.
The reliability coefficient for the REMTF
scale on norms and perceptions about alcohol
was 0.74, while the coefficients for marijuana
norms (0.88) and risks (0.85) were sufficiently
high to enable them to be analyzed separately.
The RELC scales for Self and Fate both had pre
and posttest alpha values of 0.70. The alpha
values for the Other scale, which included the
substantive content adaptations, were 0.59 for
the pretest and 0.71 for the posttest. Since the
pretest did not meet the 0.70 criterion, we
analyzed that posttest data alone with
independent samples t-tests.
Qualitative measures. Qualitative process
and outcome measures included direct
observation and interview data on perception of
program usage, barriers to use, and perceived
value from implementer perspectives.
Data Collection
Compliance, dosage and concept mastery. Ripple Effects software automatically collected
data on compliance and dosage rates. Dosage
was directly tied to completion of the
interactive games that measured concept
mastery. If students were awarded points for a

Impact of Ripple Effects on disengaged and delinquent students 7
tutorial, it signified they had successfully
provided all the correct answers to the quiz.
School data. School administrators
provided pre-intervention demographic data,
including Free or Reduced Lunch status,
Limited English Proficiency (LEP), age, gender
and ethnicity. They also provided enrollment
attrition data, and data on GPA, absenteeism,
and suspensions for the first semester of the
year of the study. The school did not have a
system for tracking discipline referrals, so was
unable to provide this data. The school district
provided prior year and follow-up year school
outcome data.
Self-report data. During the Fall of 2003, as
part of their regular school activities, students
completed the two computer-based surveys
described above, before and within two weeks
after the eight-week intervention. At least 12
weeks elapsed from teacher training to final
survey.
Qualitative data. At several points along the
way, the study coordinator conducted and
documented phone and in-person interviews
with the school administrator, and the site
program facilitator. Site visits by Ripple Effects
technology support staff provided observational
data on implementation conditions and school
climate issues.
Methods of Analysis
SPSS was used to run all of the analyses.
Several methods of analysis were used, each
appropriate to the kind of data being analyzed.
For administrative post intervention data
with normal distribution (GPA), we ran
independent-samples t-tests comparing the
means of the treatment and control groups.
For administrative data factors with non-
parametric distribution, such as absenteeism
and suspensions, we ran the same tests, but also
the Games-Howell posthoc test for pair-wise
comparisons. Severely unequal variances can
lead to increased Type I or Type II error, and,
with smaller sample sizes, this effect can be
increased. Games-Howell corrections are used
when variances and group sizes are unequal.
The set of control variables included
ethnicity, gender, LEP, and free or reduced
lunch status, as a measure of socioeconomic
status.
For the self-report data with pre and post
values (the REMTF norms and risks scales, and
the Fate and Self RELC scales), we ran repeated-
measures ANOVAs with a between-subjects
factor (study group) correction. For the Other
RELC scale, since the pretest did not meet the
0.70 criterion, we analyzed that posttest data
alone with independent-samples t-tests.
To establish dosage, Ripple Effects software
created a password-protected file for each
student and tracked completion of interactive
exercises for each tutorial, assigning 100 points
per exercise. This data was exported from each
computer, with names decoupled from
identifying numbers, and then data aggregated
in centralized files. Dosage was calculated from
the point count of each student’s total number
of completed interactive exercises, which
divided by an average completion rate of four
per hour, resulted in per-student hours of
exposure.
To see if the number of hours of exposure
to Ripple Effects was associated with differences
in outcomes, we ran bivariate Pearson product-
moment correlations. In cases where there was
pretest data, we ran partial correlations on the
posttest data that controlled for the effect of the
pretest covariate. For each set of correlations,
we used the Bonferroni method to minimize the
chances of making a Type I error.
To compare long term effects on students
who may be dispersed among many schools,
we conducted independent-samples t-tests
comparing the means of the treatment and
control groups of school district level
enrollment data, one year post-intervention.
To account for the unbalanced treatment
and control group sizes, we randomly sub-
sampled the control group to match the
treatment group size.
All means presented in the text and tables
are the raw values unadjusted for the
covariates.
Impact of Ripple Effects on disengaged and delinquent students 8
RESULTS
Baseline Equivalence
Analysis of pretest surveys indicated no
significant baseline differences between
treatment and control groups for any self-report
variable (norms or risk related to alcohol and
marijuana, or locus of control). Almost two
years after the initial data collection, the school
district provided administrative data on
absenteeism, suspension rates and GPA from
the academic year prior to the start of the
intervention. That administrative baseline data
covered only 7% of the total sample, with as
few as three intervention-compliant students
(5%) and 10 control group students (8%) with
GPA data. The 10 control group students did
not match the subsample of the control group
that we had previously done to match group
sizes, so we were unable to conduct ANOVAs.
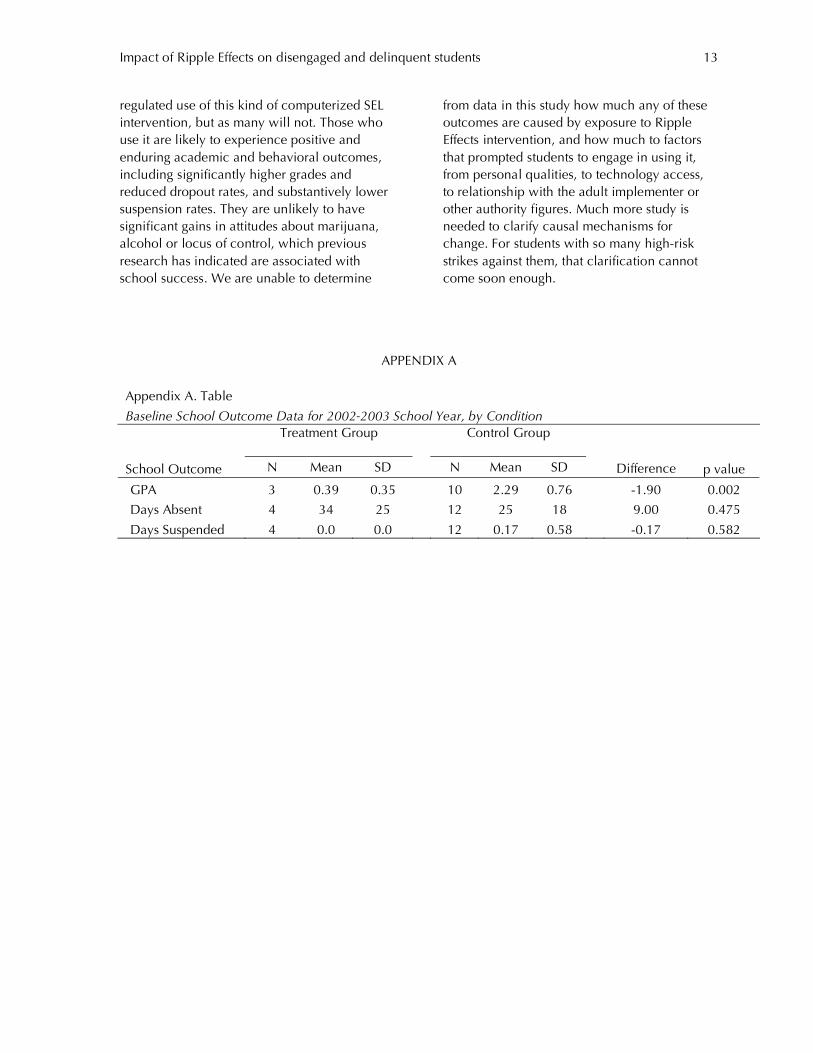
We have appended the results of independent-
samples t tests from the sample we were able to
obtain (Appendix A). The treatment group had a
lower GPA, higher absenteeism, and lower
suspension rates, compared to the control
group. Thus, ANOVA may have resulted in
significant differences favoring the treatment
group. However, the sample size was too small
to perform that test.
Process Outcomes
Technology-related delays. Several delays
due to testing, computer system failures, and
one power blackout shortened the duration of
actual exposure to the intervention to six
weeks.
Enrollment attrition. Administrative post-
intervention data was not available for 13% of
students: 12% of the treatment group
(remaining N=46) and 14% of the control group
(remaining N=108).
Intervention attrition (non-compliance). Non-compliance with at least three hours
exposure to the intervention among students
who remained in the study was 41%, or 19
students. Of the 19, 14 had some exposure to
the software, while five had none.
The remaining 27 compliant TG students,
and a randomly sub-sampled group of control
group students, were included in the school
outcomes efficacy analysis.
Study attrition. No students formally
withdrew consent. The electronic monitoring of
program usage, coupled with reports by
facilitators, enabled researchers to verify that no
control group students had contact with the
intervention. Pre or post self-report data was not
available for 27% of students; 22% of the entire
treatment group (compliant and non-
compliant), and 30% of the control group. For
compliant students, just 16 had completed both
pre and post tests, and were included in the
self-report efficacy analysis.
Dosage. Mean dosage for students who
complied was 56% (20 tutorials, or roughly five
contact hours). Participation in self-selection option.
Ninety-six percent of students that complied
with the software intervention elected to
explore unassigned tutorials related to topics of
personal interest. They explored an average of
15 self-selected tutorials. Thirty-seven percent
of non-compliant treatment group students also
chose to use the intervention to privately
explore issues of personal interest.
Quantitative Outcomes
Concept mastery. Analysis of points
awarded for multiple choice games provided
evidence that treatment group students
demonstrated at least short term mastery of no
fewer than 12 key concepts, and an average of
21.
School achievement measures. There is a
significant difference of about half a grade
between Ripple Effects students and control
group students who did not go through the
program, p<.05, Cohen’s d = 0.68. The groups
had no significant differences in rates of
absenteeism. The treatment group had fewer
suspensions than the control group. While not
statistically significant, the treatment group
suspension rate of zero is clinically important
for this population. All values are reported in
Table 1.
Impact of Ripple Effects on disengaged and delinquent students 9
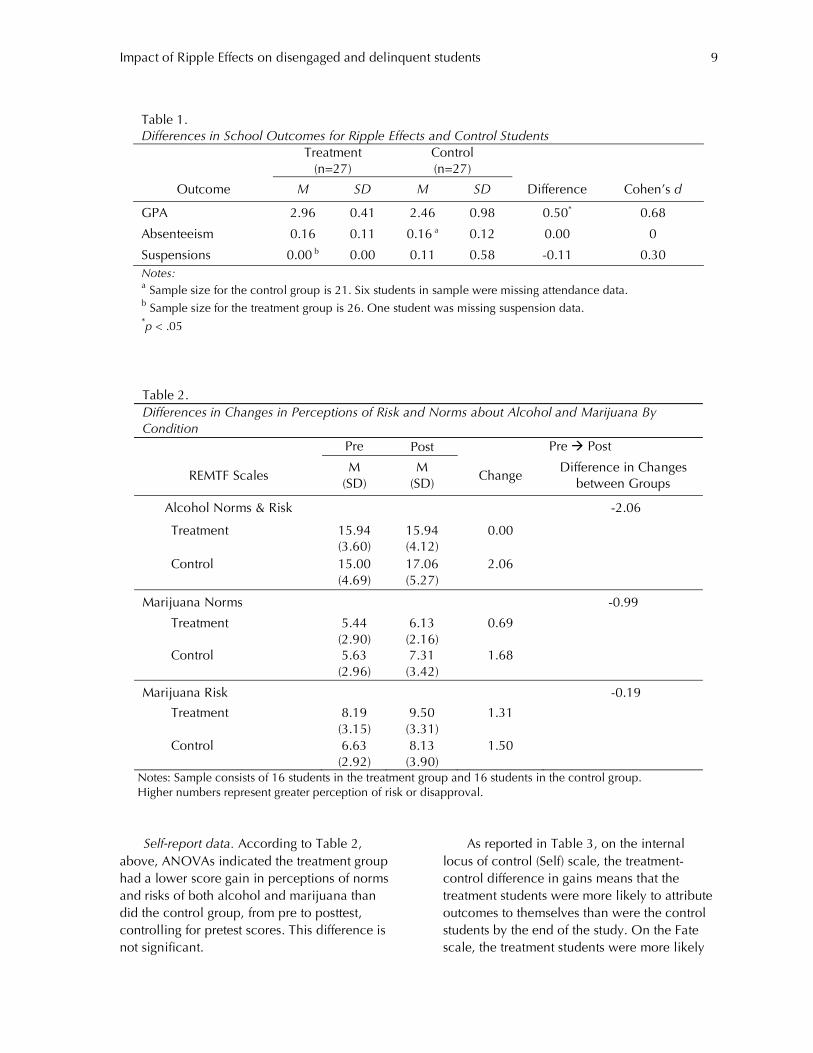
Table 1.
Differences in School Outcomes for Ripple Effects and Control Students Treatment
(n=27) Control (n=27)
Outcome M SD M SD Difference Cohen’s d
GPA 2.96 0.41 2.46 0.98 0.50* 0.68
Absenteeism 0.16 0.11 0.16 a 0.12 0.00 0
Suspensions 0.00 b 0.00 0.11 0.58 -0.11 0.30
Notes: a Sample size for the control group is 21. Six students in sample were missing attendance data. b Sample size for the treatment group is 26. One student was missing suspension data. *p < .05
Table 2. Differences in Changes in Perceptions of Risk and Norms about Alcohol and Marijuana By Condition
Pre Post Pre Post
REMTF Scales M
(SD) M
(SD) Change
Difference in Changes between Groups
Alcohol Norms & Risk -2.06
Treatment 15.94 (3.60)
15.94 (4.12)
0.00
Control 15.00 (4.69)
17.06 (5.27)
2.06
Marijuana Norms -0.99
Treatment 5.44 (2.90)
6.13 (2.16)
0.69
Control 5.63 (2.96)
7.31 (3.42)
1.68
Marijuana Risk -0.19
Treatment 8.19 (3.15)
9.50 (3.31)
1.31
Control 6.63 (2.92)
8.13 (3.90)
1.50
Notes: Sample consists of 16 students in the treatment group and 16 students in the control group. Higher numbers represent greater perception of risk or disapproval.
Self-report data. According to Table 2,
above, ANOVAs indicated the treatment group
had a lower score gain in perceptions of norms
and risks of both alcohol and marijuana than
did the control group, from pre to posttest,
controlling for pretest scores. This difference is
not significant.
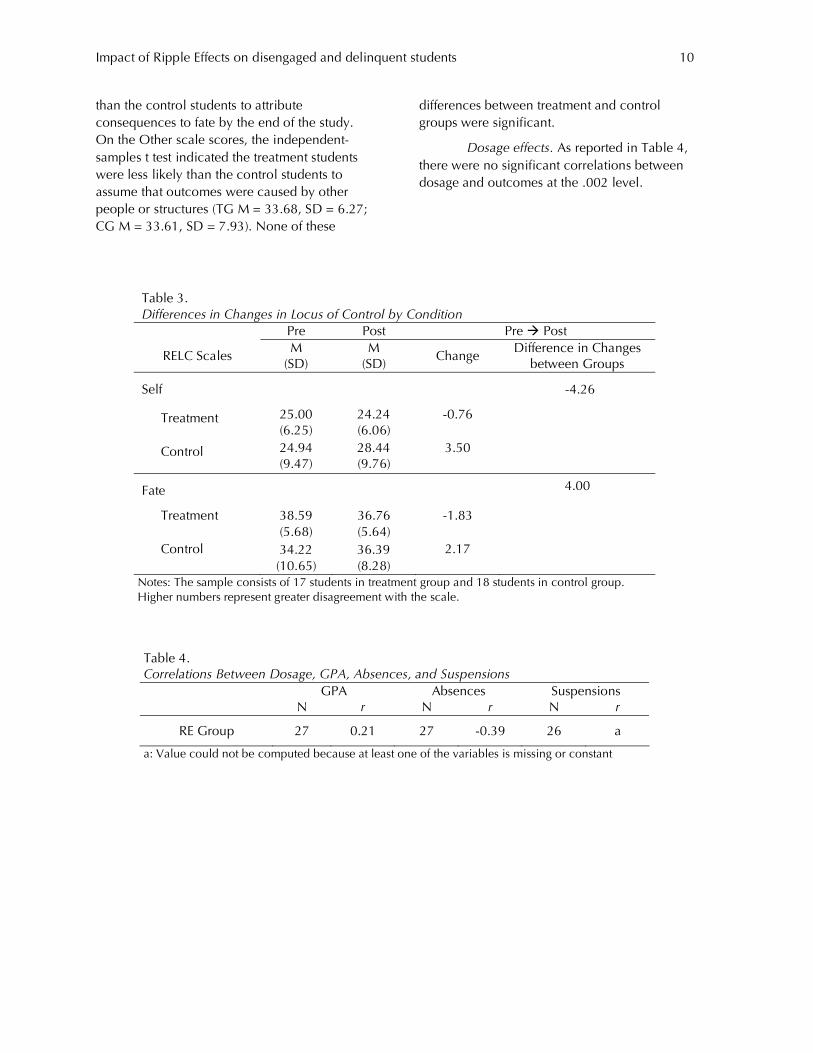
As reported in Table 3, on the internal
locus of control (Self) scale, the treatment-
control difference in gains means that the
treatment students were more likely to attribute
outcomes to themselves than were the control
students by the end of the study. On the Fate
scale, the treatment students were more likely
Impact of Ripple Effects on disengaged and delinquent students 10
than the control students to attribute
consequences to fate by the end of the study.
On the Other scale scores, the independent-
samples t test indicated the treatment students
were less likely than the control students to
assume that outcomes were caused by other
people or structures (TG M = 33.68, SD = 6.27;
CG M = 33.61, SD = 7.93). None of these
differences between treatment and control
groups were significant.
Dosage effects. As reported in Table 4,
there were no significant correlations between
dosage and outcomes at the .002 level.
Table 3. Differences in Changes in Locus of Control by Condition
Pre Post Pre Post
RELC Scales M
(SD) M
(SD) Change
Difference in Changes between Groups
Self -4.26
Treatment 25.00 (6.25)
24.24 (6.06)
-0.76
Control 24.94 (9.47)
28.44 (9.76)
3.50
Fate
4.00
Treatment 38.59 (5.68)
36.76 (5.64)
-1.83
Control 34.22 (10.65)
36.39 (8.28)
2.17
Notes: The sample consists of 17 students in treatment group and 18 students in control group. Higher numbers represent greater disagreement with the scale.
Table 4. Correlations Between Dosage, GPA, Absences, and Suspensions
GPA Absences Suspensions N r N r N r
RE Group 27 0.21 27 -0.39 26 a
a: Value could not be computed because at least one of the variables is missing or constant

Impact of Ripple Effects on disengaged and delinquent students 11
Twelve-month Follow-up Enrollment Data
Twelve-month follow-up data indicated
55% of treatment group students and 26% of
control students were still enrolled somewhere
in the school district. This does not include
students from either group who were in 12th
grade at the time of the intervention and were
no longer enrolled. This difference in
enrollment rates between the two groups was
significant, p<.05. We cannot state with
certainty whether the seven 12th graders all
graduated, or some dropped out.
Qualitative Data
Staff interviews revealed that the differential
rate in study attrition between control and
treatment groups was not directly attributable to
student choice, but did correlate with student
behavioral data. The 60 control group students
who did not complete the posttest survey were
missing from school one or more times during
the two week period of testing, when they
would have been pulled from class to complete
the computerized survey.
Staff interviews also indicated that there
was little actual direct monitoring of student
electronic scorecards to ensure compliance.
The fact that students could complete the
intervention when they wanted, made it
difficult for one teacher to track. The high
completion rate of student choice tutorials (15
on average, compared to 21 required tutorials)
suggests that while the monitor may have
observed students working on the intervention,
they may have been completing self-selected
rather than required tutorials.
Follow up interview data with staff was
aligned with follow up administrative data. That
is, that Ripple Effects students had lower
dropout rates than treatment group students,
and went on to have higher graduation rates in
the following three years.
The vice-principal at the time of the study
became the school’s principal two years later
and, based on her observations of the
intervention’s impact, decided to complete
Ripple Effects’ trainer certification course,
trained her entire staff in the software, and
implemented both the teen and the staff
versions school-wide. She attributes her
school’s rise in graduation rates to the
intervention, but does not have data to
substantiate this belief.
DISCUSSION
Implications for Practice
Training in social-emotional competencies,
not academic content, resulted in significant,
positive academic change in high school
students who had previously failed. Twice as
many of those students, as their control group
counterparts, remained enrolled in school a
year later. Thus, although proffered as a social-
emotional learning intervention, Ripple Effects
can as rightly be considered a dropout
prevention and academic achievement
intervention.
These finding are consistent with a growing
body of literature about the impact on school
success of live SEL instruction (Elias & Arnold,
2006; Zins et al., 2004); but there are
differences from previous findings as well. The
intervention was short; effective dosage was
low; program implementers received minimal
training (three hours); yet change was swift and
enduring. The intervention occurred in two, 25
minute sessions, plus free time, over six weeks.
Significant results were observed in the very
first grading period after the intervention, and
again at one-year follow-up. Three hours of
contact was enough to produce results.
All of these things run counter to prior
research findings about what works with live
interventions. We are unable to explain why. It
is certainly possible that there is greater
emotional openness in a private, non-judging
computer-based environment, than in a regular
classroom. The modeling presented in the
videos is faithful to proven strategies, so it may
be more effective than modeling students see in
the classroom. The intervention photos, images,
sound, videos and games all include
representations of diverse youth, so these
African American and Latino students may have
more closely identified with the material.
Student self-regulated use of a multi-modal

Impact of Ripple Effects on disengaged and delinquent students 12
system provides a better chance of matching
each individual’s learning style, which can
accelerate learning. All but one student who
used the program chose to privately explore
one or more topics of interest to them,
effectively augmenting standardized instruction
with personalized guidance and counseling.
This combination may have intensified effects.
Despite the potential for positive effect, a
substantial number of students who were
selected to receive the intervention, failed to
engage in even very minimum exposure. Taking
into account the real world conditions of both
the study and this particular school, the 41%
intervention attrition rate is moderate.
Nonetheless, it leaves many students behind.
This demonstrates that, especially for students
who are exposed through court order, use must
be mandated, not just invited; and compliance
monitored carefully, without violating the
important element of privacy. For any mandate
to be effective it must be consistent with overall
school climate and policy, which may not have
been the case at this continuation school.
Limitations of Study
Problems with method of randomization. The school agreed to randomization and relied
on its school scheduling software for advisory
period to ensure it, but our discussion with the
vendor suggested their confidence may have
been misplaced. It is possible that the computer
scheduling of advisory periods involved an
algorithm to create demographically balanced
classrooms. The large gaps in baseline data
would have largely prohibited stratifying by
academic ability, absenteeism or behavior.
Technically, this is a study weakness. As a
practical matter, it is likely to have ensured
baseline equivalence among a population for
whom little prior year data was available, and
could add reason for further confidence in the
results. On the other hand, reliance on the vice-
principal to randomly trim the original control
group to a size that technology capacity could
accommodate, by randomly pulling students
from class, undoubtedly biased that group
somewhat toward students with better
attendance, as school staff had reported. Thus
absenteeism for the control group may be
underreported and could account for the lack of
significant differences between the two groups
on that measure.
Lack of baseline school data and possible intervention attrition bias. Although we can be
fairly sure there was group level equivalence at
pretest, the lack of individual baseline data is a
weakness. 41% percent of the assigned
treatment group students did not have minimal
exposure to the intervention, and so were
excluded from analysis of efficacy (though not
from process analysis). There may well have
been baseline differences between student who
complied with use of the program, and those
who did not. Whatever factor was involved in
that self-selection may independently account
for at least part of the difference in outcomes.
Although available baseline data was spotty,
the little data that was available was not
inconsistent with this possibility.
Assignment of instructor to condition. The
assignment of one teacher to the treatment
condition may not have been random.
However, that teacher had no role in mediating
any content. Based on experience with other
schools in parallel studies and beyond, we
consider the choice of teacher to be relevant to
study attrition rates, but not to intervention
effects related to student exposure. For all of
these reasons, we submit this study as a
randomized controlled trial with reservations.
Small sample size. Finally, the smaller
sample size leaves open the possibility of Type
1 error, even with the Games-Howell
correction. For instance, treatment group
suspension rates went to zero, a substantive,
but not significant result. Since there are no
negative suspension rates, it was
mathematically impossible with the control
group rates so low, to find a significant
difference, even if it were there.
CONCLUSIONS
The evidence supports several conclusions.
Some students with multiple risk factors and a
history of non-compliance and/or
disengagement, will voluntarily engage in self-
Impact of Ripple Effects on disengaged and delinquent students 13
regulated use of this kind of computerized SEL
intervention, but as many will not. Those who
use it are likely to experience positive and
enduring academic and behavioral outcomes,
including significantly higher grades and
reduced dropout rates, and substantively lower
suspension rates. They are unlikely to have
significant gains in attitudes about marijuana,
alcohol or locus of control, which previous
research has indicated are associated with
school success. We are unable to determine
from data in this study how much any of these
outcomes are caused by exposure to Ripple
Effects intervention, and how much to factors
that prompted students to engage in using it,
from personal qualities, to technology access,
to relationship with the adult implementer or
other authority figures. Much more study is
needed to clarify causal mechanisms for
change. For students with so many high-risk
strikes against them, that clarification cannot
come soon enough.
APPENDIX A
Appendix A. Table
Baseline School Outcome Data for 2002-2003 School Year, by Condition
Treatment Group Control Group
School Outcome N Mean SD N Mean SD Difference p value
GPA 3 0.39 0.35 10 2.29 0.76 -1.90 0.002
Days Absent 4 34 25 12 25 18 9.00 0.475
Days Suspended 4 0.0 0.0 12 0.17 0.58 -0.17 0.582
Impact of Ripple Effects on disengaged and delinquent students 14
ACKNOWLEDGEMENTS
This study was funded by the National
Institute on Drug Abuse of the National
Institutes of Health, SBIR Fast Track Grants R44 DA13325-01A1, and R44 DA013325-03. It is
one of a series of collaborative projects
between the program developers (Ripple
Effects), Oakland and Southern Humboldt
county schools and school districts, and
research analysts (Rockman et al). As CEO of
Ripple Effects, Principal Investigator Alice Ray
is an interested party. We gratefully
acknowledge the early contribution of Michael
Roona in framing theoretical questions to be
addressed. Preliminary summary findings of the
group of studies were presented as a poster at
the May 2007 Annual Meeting of the Society
for Prevention Research. Correspondence
concerning this article should be addressed to
Alice Ray, Ripple Effects, San Francisco,
California. Email: [email protected].
REFERENCES
Author names withheld. (2008). Summary of findings from six studies on effectiveness of a computerized social-emotional learning program to reduce risk and increase protective factors among adolescents. Manuscript in preparation.
Bandura, A. (1997). Self-efficacy: The exercise of control. New York: W. H. Freeman.
Benard, B. (2004). Resiliency: What we have learned. San Francisco: WestEd.
Elias, M.J., & Arnold, H. (2006). The educator's guide to emotional intelligence and academic achievement: Social-emotional learning in the classroom. Thousand Oaks,
CA: Corwin Press.
Hawkins, J.D., Jenson, J.M., Catalano, R.F. &
Lishner, D.M. (1988). Delinquency and
Drug Abuse: Implications for Social
Services. Social Service Review, 62(2), 258-
284.
Lipsey, M.W., & Derzon. J.H. (1998) Predictors
of violent or serious delinquency in
adolescence and early adulthood: A
synthesis of longitudinal research. In R.
Loeber & D.P. Farrington (Eds.). Serious and violent juvenile offenders: Risk factors and successful interventions. Thousand Oaks,
CA: Sage.
Pajares, F., & Urdan, T. (Eds.). (2006). Self-efficacy beliefs of adolescents. Greenwich,
CT: Information Age Publishing.
Ray, A. (1999). Impact on passivity-assertiveness-aggression of short term, computer-based, skill building in assertiveness: a pilot study. San Francisco:
Ripple Effects.
Stern, R., & Repa, J. T. (2000). The study of the efficacy of computerized skill building for adolescents: Reducing aggression and increasing pro-social behavior. Unpublished manuscript.
Wilson, S. J., & Lipsey, M. W. (2007). School-
based interventions for aggressive and
disruptive behavior: Update of a meta-
analysis. American Journal of Preventive Medicine, 33 (Supplement 2), S130-S143.
Zins, J. E., Weissberg, R. P., Wang, M. C., &
Walberg. H. J. (Eds.). (2004). Building academic success on social and emotional learning: What does the research say? New
York: Teachers College Press.


