11
Ghazanfar AliGlobal Change Impact Studies Center, Islamabad
Impact of Climate Change on Fresh Impact of Climate Change on Fresh Water Resources of PakistanWater Resources of Pakistan
IUCN Climate Change Seminar, Muzaffarabad, Azad Jammu & Kashmir18 March 2008

22
Water Resources of PakistanWater Resources of Pakistan
Some Characteristics of PakistanSome Characteristics of Pakistan‘‘s s Water ResourcesWater Resources
Climate Change ConcernsClimate Change Concerns
Implications and AdaptationImplications and Adaptation
33
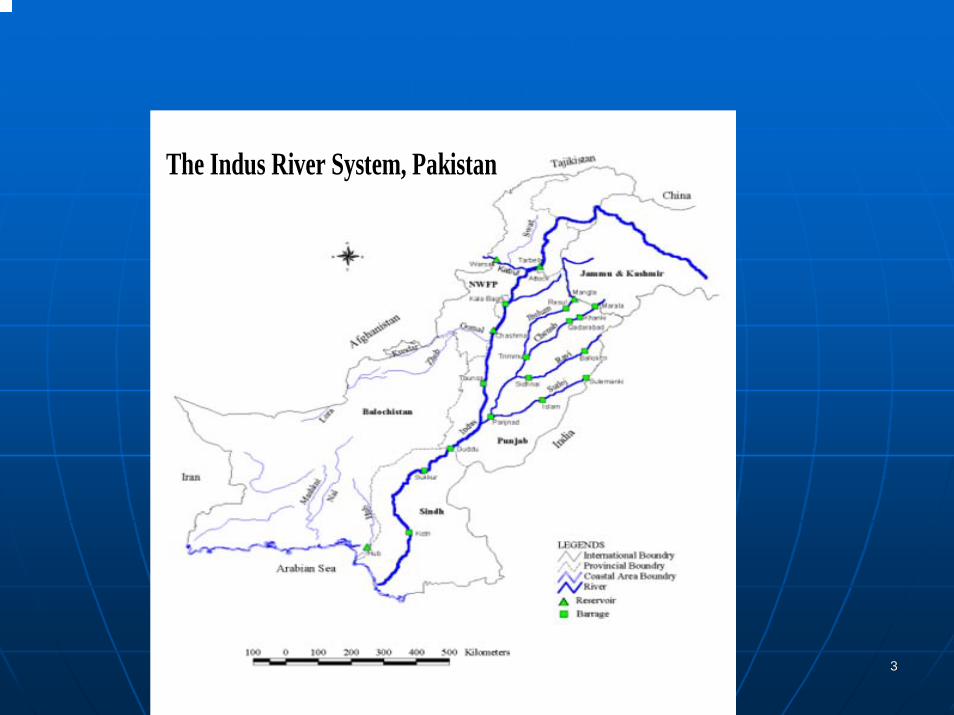
The Indus River System, Pakistan
44
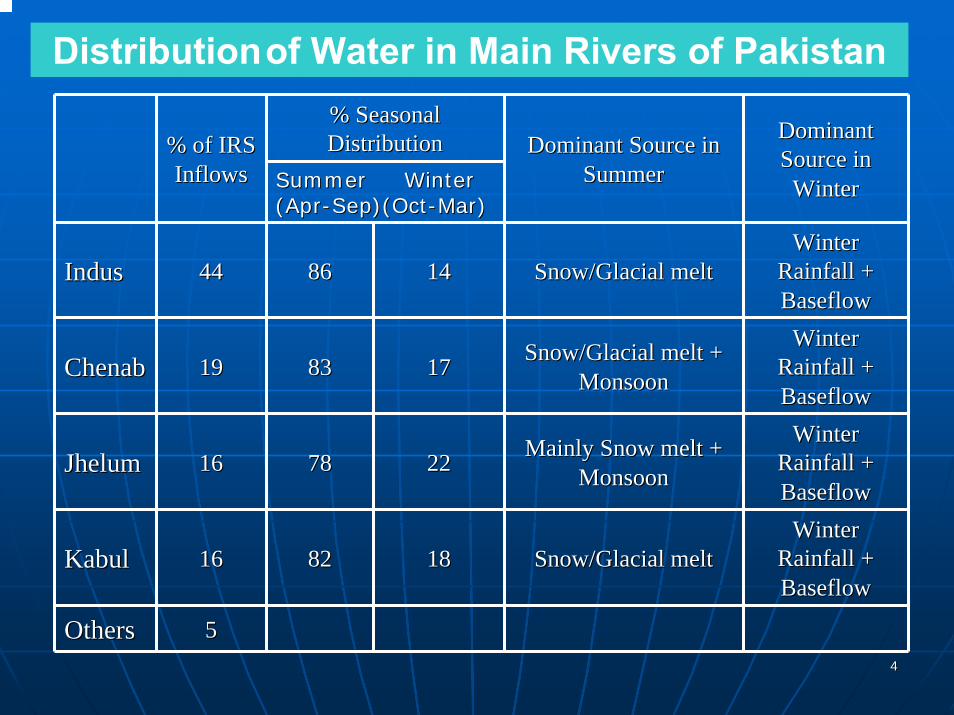
Distributionof Water in Main Rivers of Pakistan% Seasonal % Seasonal DistributionDistribution% of IRS % of IRS
InflowsInflows Summer Winter Summer Winter (Apr(Apr--Sep)(OctSep)(Oct--Mar)Mar)
Dominant Source in Dominant Source in SummerSummer
Dominant Dominant Source in Source in
WinterWinter
IndusIndus 4444 8686 1414 Snow/Glacial meltSnow/Glacial meltWinter Winter
Rainfall + Rainfall + BaseflowBaseflow
ChenabChenab 1919 8383 1717 Snow/Glacial melt + Snow/Glacial melt + MonsoonMonsoon
Winter Winter Rainfall + Rainfall + BaseflowBaseflow
JhelumJhelum 1616 7878 2222 Mainly Snow melt + Mainly Snow melt + MonsoonMonsoon
Winter Winter Rainfall + Rainfall + BaseflowBaseflow
KabulKabul 1616 8282 1818 Snow/Glacial meltSnow/Glacial meltWinter Winter
Rainfall + Rainfall + BaseflowBaseflow
OthersOthers 55

55
Some Concerns of PakistanSome Concerns of Pakistan‘‘s Water Resourcess Water Resources
Decreasing Per Capita Water AvailabilityDecreasing Per Capita Water Availability
Large IntraLarge Intra--annual Variability in Annual River Flowsannual Variability in Annual River Flows
Inadequate Storage Capacity and Capacity Loss with Inadequate Storage Capacity and Capacity Loss with TimeTime
Inadequate Discharge to Sea for Preventing Sea Inadequate Discharge to Sea for Preventing Sea Water Intrusion and Other Related IssuesWater Intrusion and Other Related Issues
66
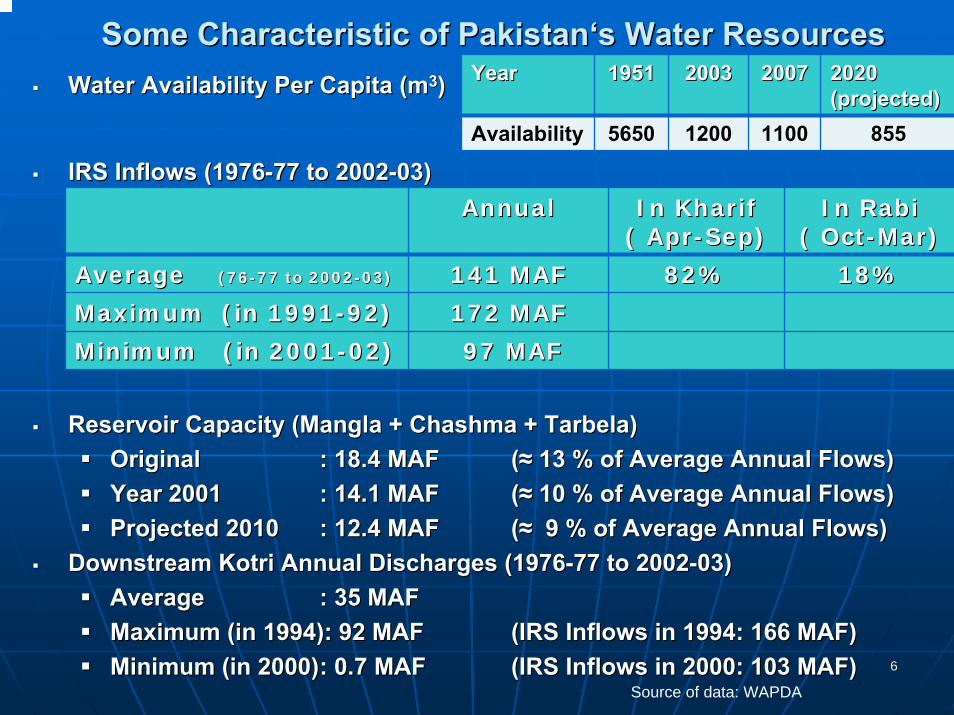
Some Characteristic of PakistanSome Characteristic of Pakistan‘‘s Water Resources s Water Resources Water Availability Per Capita (mWater Availability Per Capita (m33))
IRS Inflows (1976IRS Inflows (1976--77 to 200277 to 2002--03)03)
Reservoir Capacity (Reservoir Capacity (ManglaMangla + + ChashmaChashma + Tarbela)+ Tarbela)Original Original : 18.4 MAF: 18.4 MAF ((≈≈ 13 % of Average Annual Flows)13 % of Average Annual Flows)Year 2001Year 2001 : 14.1 MAF: 14.1 MAF ((≈≈ 10 % of Average Annual Flows)10 % of Average Annual Flows)Projected 2010Projected 2010 : 12.4 MAF: 12.4 MAF ((≈≈ 9 % of Average Annual Flows)9 % of Average Annual Flows)
Downstream Downstream KotriKotri Annual Discharges (1976Annual Discharges (1976--77 to 200277 to 2002--03)03)AverageAverage : 35 MAF: 35 MAFMaximum (in 1994): 92 MAFMaximum (in 1994): 92 MAF (IRS Inflows in 1994: 166 MAF)(IRS Inflows in 1994: 166 MAF)Minimum (in 2000)Minimum (in 2000): 0.7 MAF: 0.7 MAF (IRS Inflows in 2000: 103 MAF)(IRS Inflows in 2000: 103 MAF)
AnnualAnnual In In KharifKharif( Apr( Apr--Sep)Sep)
In RabiIn Rabi( Oct( Oct--Mar)Mar)
Average Average (76(76--77 to 200277 to 2002--03)03) 141 MAF141 MAF 82%82% 18%18%
Maximum (in 1991Maximum (in 1991--92)92) 172 MAF172 MAF
Minimum (in 2001Minimum (in 2001--02)02) 97 MAF97 MAF
Source of data: WAPDA
YearYear 19511951 20032003 20072007 2020 2020 (projected)(projected)
AvailabilityAvailability 56505650 12001200 11001100 855855
77
Climate ChangeClimate Change
““the greatest challenge facing the the greatest challenge facing the world at the beginning of the centuryworld at the beginning of the century””
World Economic ForumWorld Economic ForumDavosDavos, Switzerland 2000, Switzerland 2000

Melting of HKH glaciers and its Implications for:
Average Annual River FlowsPattern of Seasonal Flows Inter Annual Variability of Flows
Increase in Frequency and Intensity of Extreme Precipitation Events and its Implication forFloods and Droughts
Sea-level Rise and its Implications
Major Climate Change related Concerns for Water Resources of Pakistan

Rate of Change (oC per decade)
1850 –2005
───────────── 0.045
1905 –2005
───────────── 0.074
1955 –2005
───────────── 0.128
1980 –2005
───────────── 0.177
Warmest 12 years:2005, 2007, 1998, 2002, 2003, 2006, 2004, 2001, 1997, 1995,
2000, 1999
Average Global Temperature OC1999 ───────────── 14.38
2000 1995
──────────────────────────
14.4014.48
...
1998 20072005
───────────────────────────────────────
14.5714.6014.63
1010
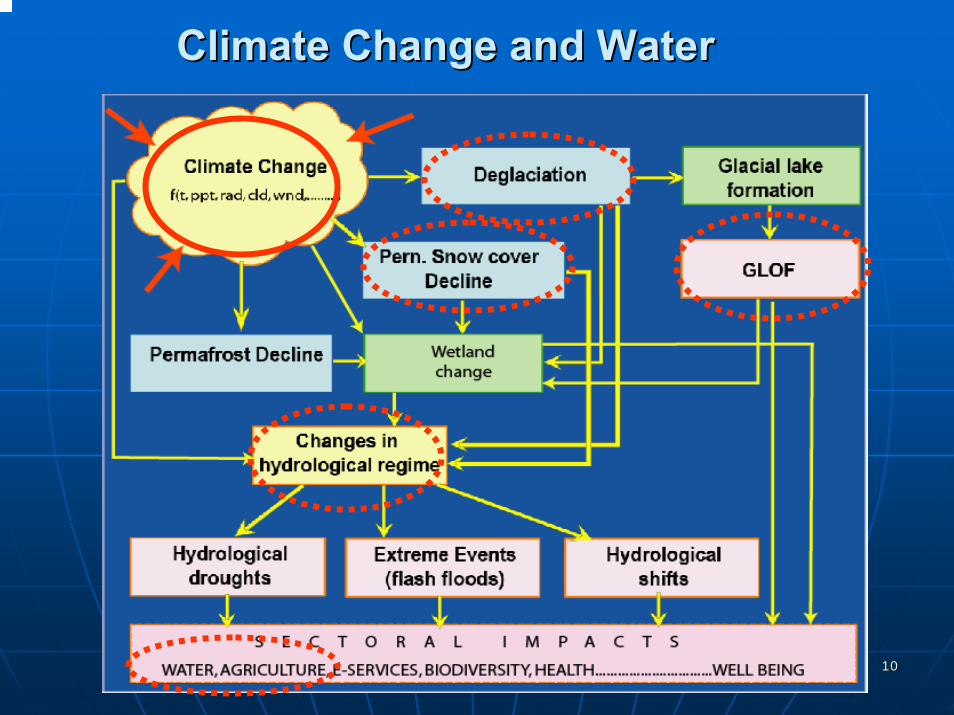
Climate Change and WaterClimate Change and Water

1111
Upper Indus Basin (UIB), Northern PakistanUpper Indus Basin (UIB), Northern Pakistan
Afghanistan
India
Pakistan
China

1212
DeDe--glaciations World Wideglaciations World Wide
According to According to HaeberliHaeberli and and HoelzleHoelzle (2001) of the (2001) of the World Glacier Monitoring Service (WGMS), the World Glacier Monitoring Service (WGMS), the measurements taken over the last century measurements taken over the last century ““clearly clearly reveal a general shrinkage of mountain glaciers on reveal a general shrinkage of mountain glaciers on a global scalea global scale””
It was forecast by IPCC in its Second Assessment It was forecast by IPCC in its Second Assessment Report (1996) that up to a quarter of global Report (1996) that up to a quarter of global mountain glacier mass could disappear by 2050 mountain glacier mass could disappear by 2050 and up to half could be lost by 2100.and up to half could be lost by 2100.

1313
Glaciers in Pakistan cover 13,680 sq. km area which Glaciers in Pakistan cover 13,680 sq. km area which is 13% of mountain regions of the Upper Indus Basin is 13% of mountain regions of the Upper Indus Basin (UIB)(UIB)
Glacial and snow melt water makes more than 80% Glacial and snow melt water makes more than 80% contribution to the flows of UIB riverscontribution to the flows of UIB rivers
““Glaciers in Himalayas are receding faster than in any Glaciers in Himalayas are receding faster than in any other part of the world and, if the present rate other part of the world and, if the present rate continues, the likelihood of their disappearing by the continues, the likelihood of their disappearing by the year 2035 is very highyear 2035 is very high””. .
A conclusion reached by the 1999 report of the Working Group of A conclusion reached by the 1999 report of the Working Group of Himalayan Glaciology (WGHG) of the International Commission for Himalayan Glaciology (WGHG) of the International Commission for Snow and Snow and Ice (ICSI).Ice (ICSI).
Snow & Glacier Melt ContributionSnow & Glacier Melt Contribution
1414
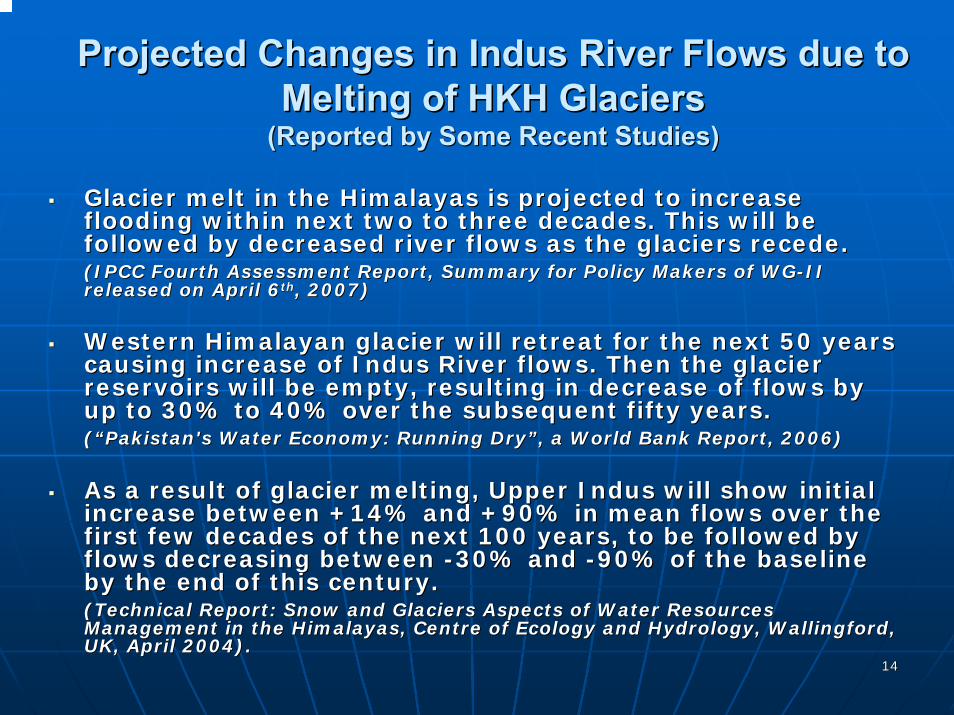
Projected Changes in Indus River Flows due to Projected Changes in Indus River Flows due to Melting of HKH Glaciers Melting of HKH Glaciers
(Reported by Some Recent Studies)(Reported by Some Recent Studies)
Glacier melt in the Himalayas is projected to increase Glacier melt in the Himalayas is projected to increase flooding within next two to three decades. This will be flooding within next two to three decades. This will be followed by decreased river flows as the glaciers recede.followed by decreased river flows as the glaciers recede.(IPCC Fourth Assessment Report, Summary for Policy Makers of WG(IPCC Fourth Assessment Report, Summary for Policy Makers of WG--II II released on April 6released on April 6thth, 2007), 2007)
Western Himalayan glacier will retreat for the next 50 years Western Himalayan glacier will retreat for the next 50 years causing increase of Indus River flows. Then the glacier causing increase of Indus River flows. Then the glacier reservoirs will be empty, resulting in decrease of flows by reservoirs will be empty, resulting in decrease of flows by up to 30% to 40% over the subsequent fifty years.up to 30% to 40% over the subsequent fifty years.((““Pakistan's Water Economy: Running DryPakistan's Water Economy: Running Dry””, a World Bank Report, 2006), a World Bank Report, 2006)
As a result of glacier melting, Upper Indus will show initial As a result of glacier melting, Upper Indus will show initial increase between +14% and +90% in mean flows over the increase between +14% and +90% in mean flows over the first few decades of the next 100 years, to be followed by first few decades of the next 100 years, to be followed by flows decreasing between flows decreasing between --30% and 30% and --90% of the baseline 90% of the baseline by the end of this century.by the end of this century.(Technical Report: Snow and Glaciers Aspects of Water Resources (Technical Report: Snow and Glaciers Aspects of Water Resources Management in the Himalayas, Centre of Ecology and Hydrology, WaManagement in the Himalayas, Centre of Ecology and Hydrology, Wallingford, llingford, UK, April 2004).UK, April 2004).

1515
Recent Conflicting Reports about Recession of Recent Conflicting Reports about Recession of Himalayan GlaciersHimalayan Glaciers
In 2005, Hewitt reported widespread evidence of In 2005, Hewitt reported widespread evidence of glacier expansion in the late 1990s in the Central glacier expansion in the late 1990s in the Central Karakoram, in contrast to a worldwide decline of Karakoram, in contrast to a worldwide decline of mountain glaciers. mountain glaciers.
((K.HewittK.Hewitt in Mountain Research and Development Vol. 25, No.4, Nov 2005)in Mountain Research and Development Vol. 25, No.4, Nov 2005)
Based on surveys between 1997 and 2002, he Based on surveys between 1997 and 2002, he reported that some of the large Karakoram glaciers reported that some of the large Karakoram glaciers --40 to 70 km in length 40 to 70 km in length -- exhibited 5 to 15 m of exhibited 5 to 15 m of thickening over substantial ablation zone areas, thickening over substantial ablation zone areas, locally more than 20 m.locally more than 20 m.
These conflicting findings make the impact of These conflicting findings make the impact of climate change on Karakoram glaciers and Indus climate change on Karakoram glaciers and Indus River flows very uncertain. River flows very uncertain.

Climate Change research remained essentially neglected in Pakistan until recently;
2001: Establishment of a multi-disciplinary effort in this direction proposed by Dr. Ishfaq Ahmad, Special Advisor to the Prime Minister;
May 2002: Global Change Impact Studies Centre (GCISC) established with seed money provided by Ministry of Sc & Tech; GCISC now being supported by Planning Commission.
January 2005: Prime Minister’s Committee on Climate Change established, with GCISC as its Secretariat.
Dec., 2006: GCISC attached to National Centre for Physics as an autonomous organization.
Climate Change Science Studies in Pakistan
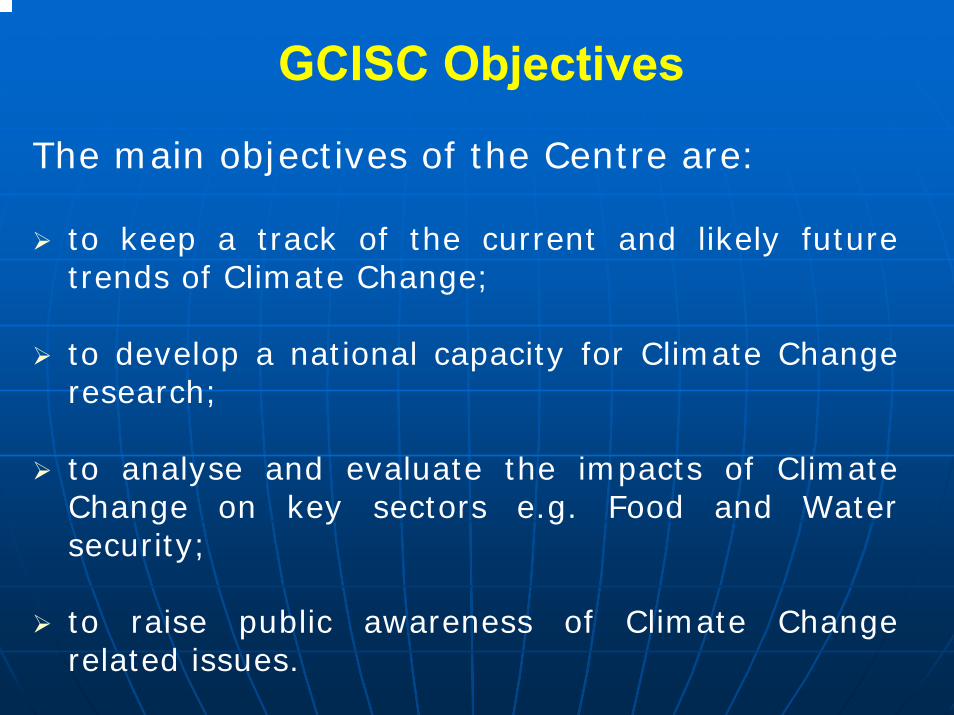
GCISC Objectives
The main objectives of the Centre are:
to keep a track of the current and likely future trends of Climate Change;
to develop a national capacity for Climate Change research;
to analyse and evaluate the impacts of Climate Change on key sectors e.g. Food and Water security;
to raise public awareness of Climate Change related issues.
1818
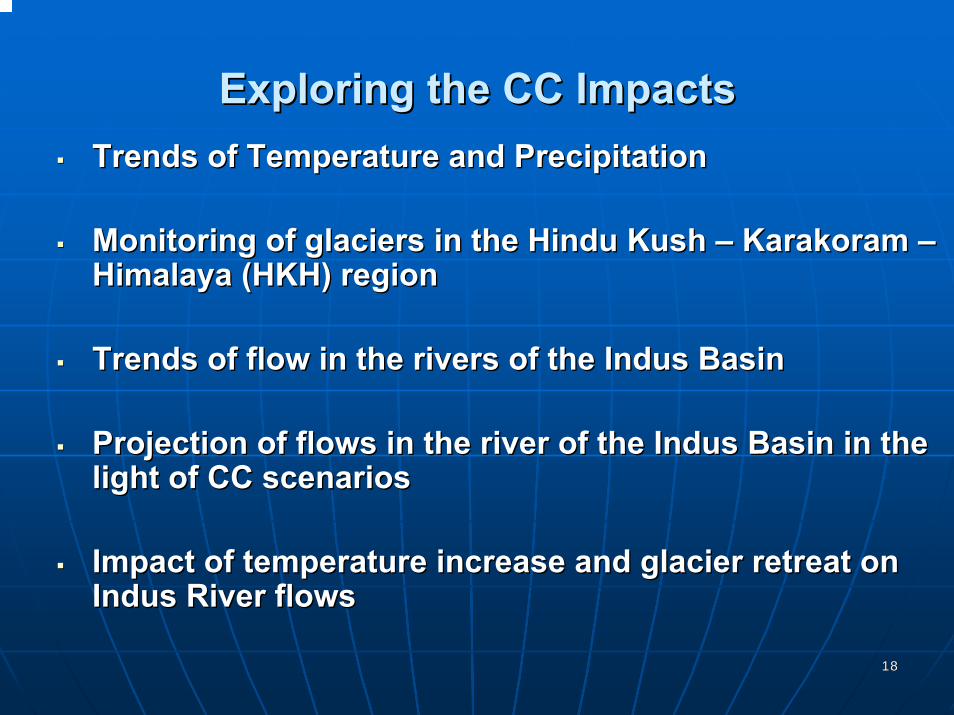
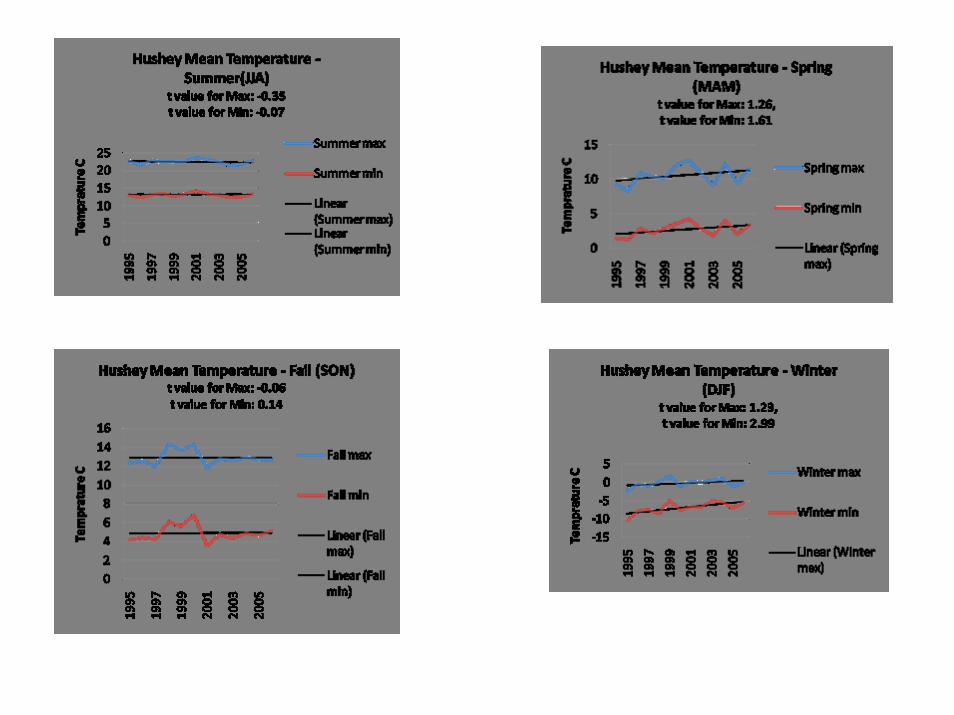
Exploring the CC ImpactsExploring the CC ImpactsTrends of Temperature and PrecipitationTrends of Temperature and Precipitation
Monitoring of glaciers in the Hindu Monitoring of glaciers in the Hindu KushKush –– Karakoram Karakoram ––Himalaya (HKH) region Himalaya (HKH) region
Trends of flow in the rivers of the Indus BasinTrends of flow in the rivers of the Indus Basin
Projection of flows in the river of the Indus Basin in the Projection of flows in the river of the Indus Basin in the light of CC scenarioslight of CC scenarios
Impact of temperature increase and glacier retreat on Impact of temperature increase and glacier retreat on Indus River flowsIndus River flows
Temperature and Precipitation Trends

2020
Mean Temperature (°C) Trend 1901-2000 for Pakistan
y = 0.006x + 8.3804
19
19.6
20.2
20.8
21.4
1900 1905 1910 1915 1920 1925 1930 1935 1940 1945 1950 1955 1960 1965 1970 1975 1980 1985 1990 1995 2000
Increase = 0.6°C Significant at 99% level
(CRU data)

2121
Annual Precipitation (mm) Trend 1901-2000 for Pakistan
y = 0.633x - 951.37
100
200
300
400
500
1900 1905 1910 1915 1920 1925 1930 1935 1940 1945 1950 1955 1960 1965 1970 1975 1980 1985 1990 1995 2000
Increase = 63 mm or (+ 25%) Significant at 99% level
(CRU data)

UIB Map showing High Elevation Met Stations

Khunjerab DCP Station (Elevation 4730 m.a.s.l)
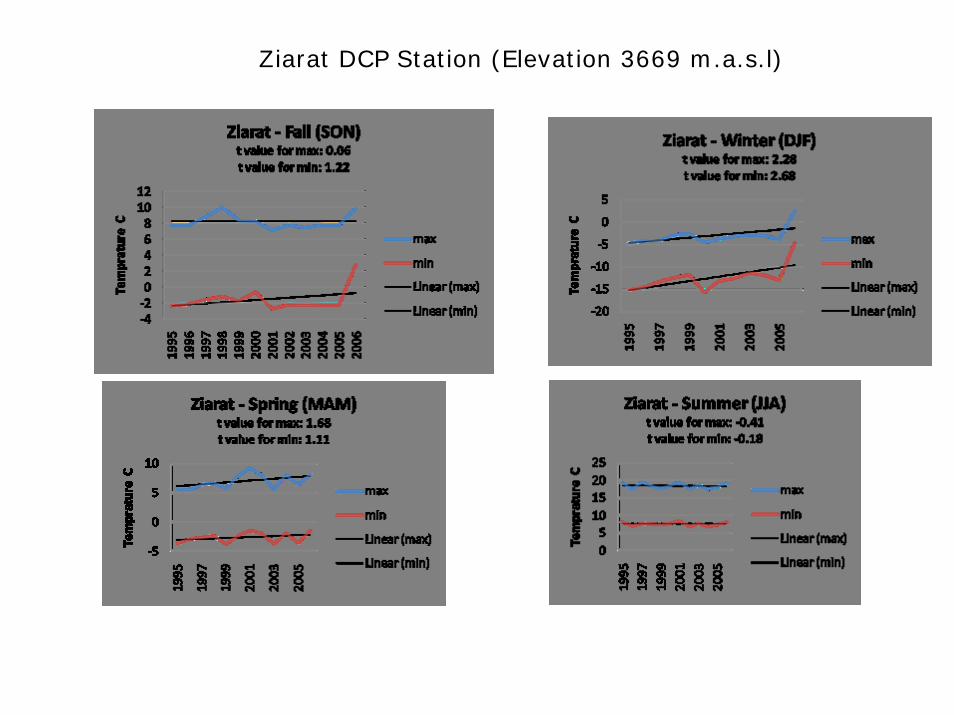
Ziarat DCP Station (Elevation 3669 m.a.s.l)
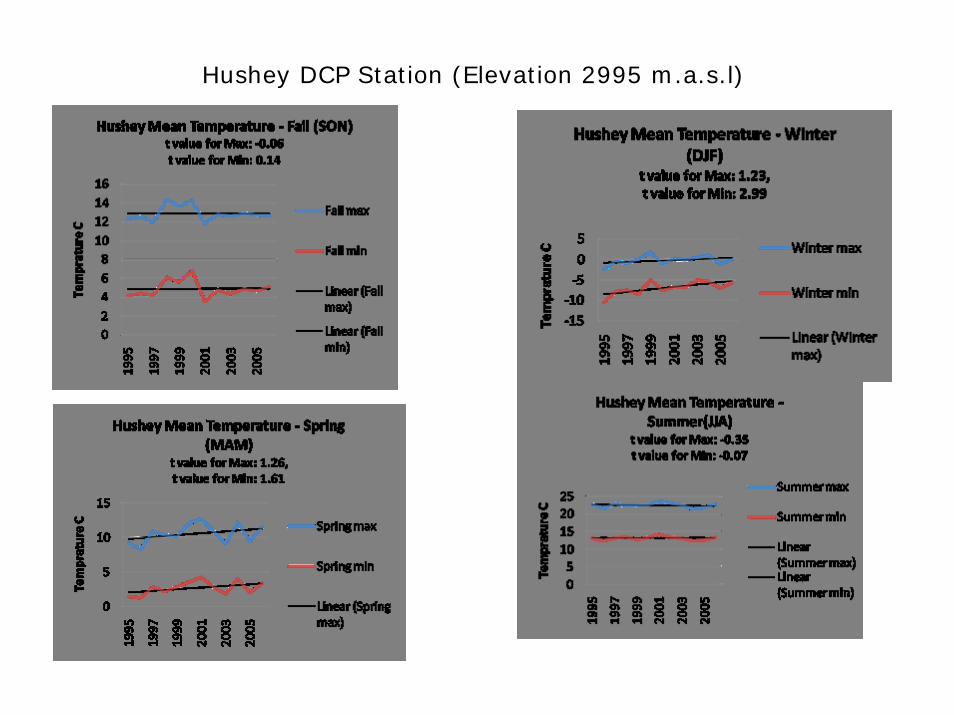
Hushey DCP Station (Elevation 2995 m.a.s.l)
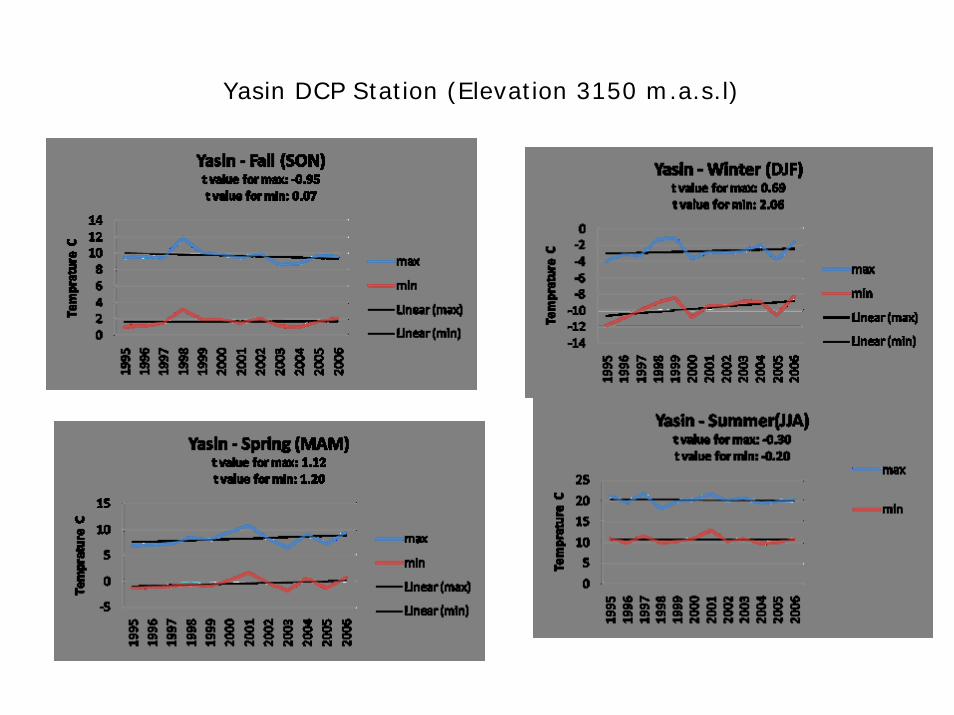
Yasin DCP Station (Elevation 3150 m.a.s.l)

Naltar DCP Station (Elevation 2810 m.a.s.l)

2828
(a)
(b)
Grids covering geographical areas of:
a) Northern (FHN) andb) Southern (FHS) parts of Pakistan
(b)
Northern and Southern Parts of Pakistan
2929
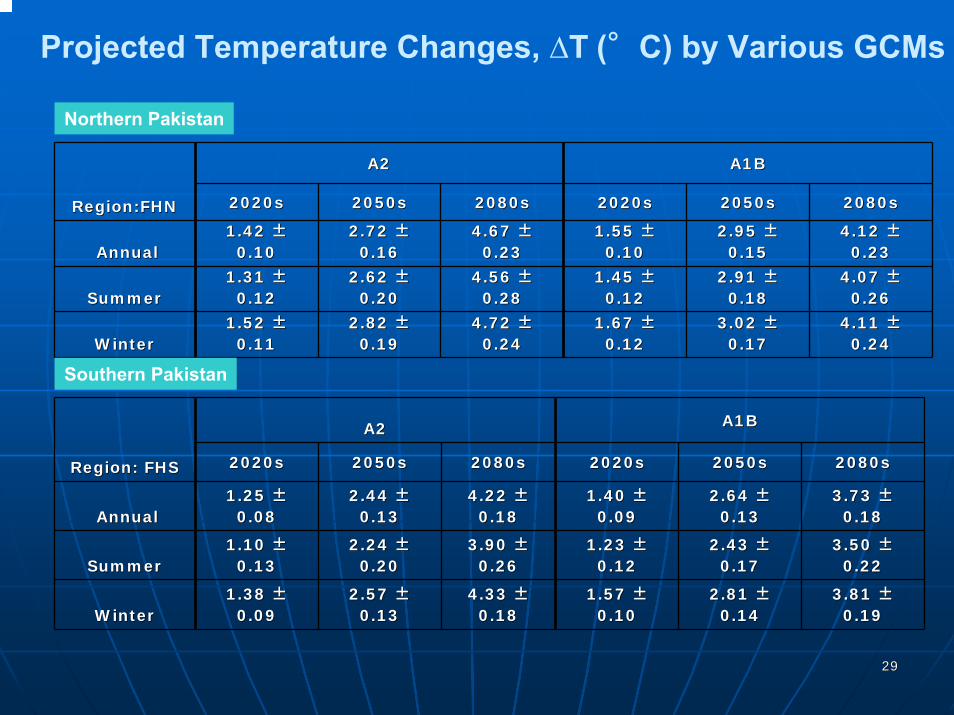
Projected Temperature Changes, ∆T (°C) by Various GCMs
A2 A2 A1B A1B
Region:FHNRegion:FHN 2020s2020s 2050s2050s 2080s2080s 2020s2020s 2050s2050s 2080s2080s
AnnualAnnual1.42 1.42 ±±0.100.10
2.72 2.72 ±±0.160.16
4.67 4.67 ±±0.230.23
1.55 1.55 ±±0.100.10
2.95 2.95 ±±0.150.15
4.12 4.12 ±±0.230.23
SummerSummer1.31 1.31 ±±0.120.12
2.62 2.62 ±±0.200.20
4.56 4.56 ±±0.280.28
1.45 1.45 ±±0.120.12
2.91 2.91 ±±0.180.18
4.07 4.07 ±±0.260.26
WinterWinter1.52 1.52 ±±0.110.11
2.82 2.82 ±±0.190.19
4.72 4.72 ±±0.240.24
1.67 1.67 ±±0.120.12
3.02 3.02 ±±0.170.17
4.11 4.11 ±±0.240.24
Region: FHSRegion: FHS
A2 A2 A1B A1B
2020s2020s 2050s2050s 2080s2080s 2020s2020s 2050s2050s 2080s2080s
AnnualAnnual1.25 1.25 ±±0.080.08
2.44 2.44 ±±0.130.13
4.22 4.22 ±±0.180.18
1.40 1.40 ±±0.090.09
2.64 2.64 ±±0.130.13
3.73 3.73 ±±0.180.18
SummerSummer1.10 1.10 ±±0.130.13
2.24 2.24 ±±0.200.20
3.90 3.90 ±±0.260.26
1.23 1.23 ±±0.120.12
2.43 2.43 ±±0.170.17
3.50 3.50 ±±0.220.22
WinterWinter1.38 1.38 ±±0.090.09
2.57 2.57 ±±0.130.13
4.33 4.33 ±±0.180.18
1.57 1.57 ±±0.100.10
2.81 2.81 ±±0.140.14
3.81 3.81 ±±0.190.19
Northern Pakistan
Southern Pakistan

3030
Projected Changes in Average Temperature of Northern and Southern Pakistan
(Corresponding to IPCC A2 Scenario)
0
1
2
3
4
5
6
1990s 2020s 2050s 2080s
Period
Tem
pera
ture
Cha
nge
(°C
)
northern pp pakistan southern pp pakistanNorthern Pakistan Southern Pakistan

3131
Projected Precipitation Changes, ∆P (%) by Various GCMs
A2 A2 A1B A1B
Region: FHNRegion: FHN 2020s2020s 2050s2050s 2080s2080s 2020s2020s 2050s2050s 2080s2080s
AnnualAnnual2.22 2.22 ±±2.292.29
3.61 3.61 ±±3.213.21
1.13 1.13 ±±3.953.95
--0.740.74±±1.481.48
--1.781.78±±2.182.18
--0.730.73±±3.083.08
SummerSummer5.52 5.52 ±±3.693.69
7.63 7.63 ±±6.526.52
1.08 1.08 ±±8.358.35
1.33 1.33 ±±3.033.03
1.81 1.81 ±±4.744.74
1.98 1.98 ±±5.745.74
WinterWinter--0.66 0.66 ±±
2.332.330.71 0.71 ±±3.213.21
--2.24 2.24 ±±4.104.10
--2.60 2.60 ±±1.871.87
--4.72 4.72 ±±2.572.57
--4.10 4.10 ±±3.103.10
Region: FHSRegion: FHS
A2 A2 A1B A1B
2020s2020s 2050s2050s 2080s2080s 2020s2020s 2050s2050s 2080s2080s
AnnualAnnual3.05 3.05 ±±5.125.12
6.40 6.40 ±±7.487.48
4.28 4.28 ±±9.469.46
--3.20 3.20 ±±4.314.31
--0.32 0.32 ±±5.535.53
--0.89 0.89 ±±7.917.91
SummerSummer12.46 12.46 ±±
9.779.7742.19 42.19 ±±27.0027.00
51.07 51.07 ±±39.7839.78
11.21 11.21 ±±10.9910.99
24.14 24.14 ±±18.0618.06
37.57 37.57 ±±34.0034.00
WinterWinter--7.53 7.53 ±±
6.066.06--12.90 12.90 ±±
6.576.57--20.51 20.51 ±±
9.059.05--16.13 16.13 ±±
4.724.72--9.92 9.92 ±±
7.257.25--15.10 15.10 ±±
7.617.61
Northern Pakistan
Southern Pakistan
3232
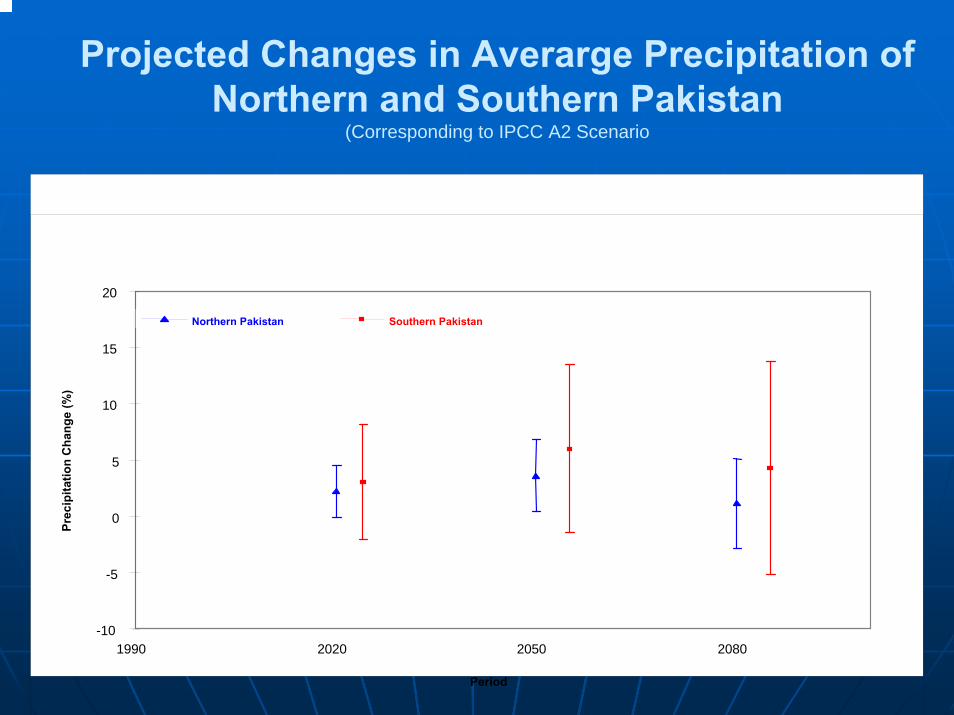
Projected Changes in Averarge Precipitation of Northern and Southern Pakistan
(Corresponding to IPCC A2 Scenario
-10
-5
0
5
10
15
20
1990 2020 2050 2080
Period
Prec
ipita
tion
Cha
nge
(%)
northern pp pakistan southern pp pakistanNorthern Pakistan Southern Pakistan

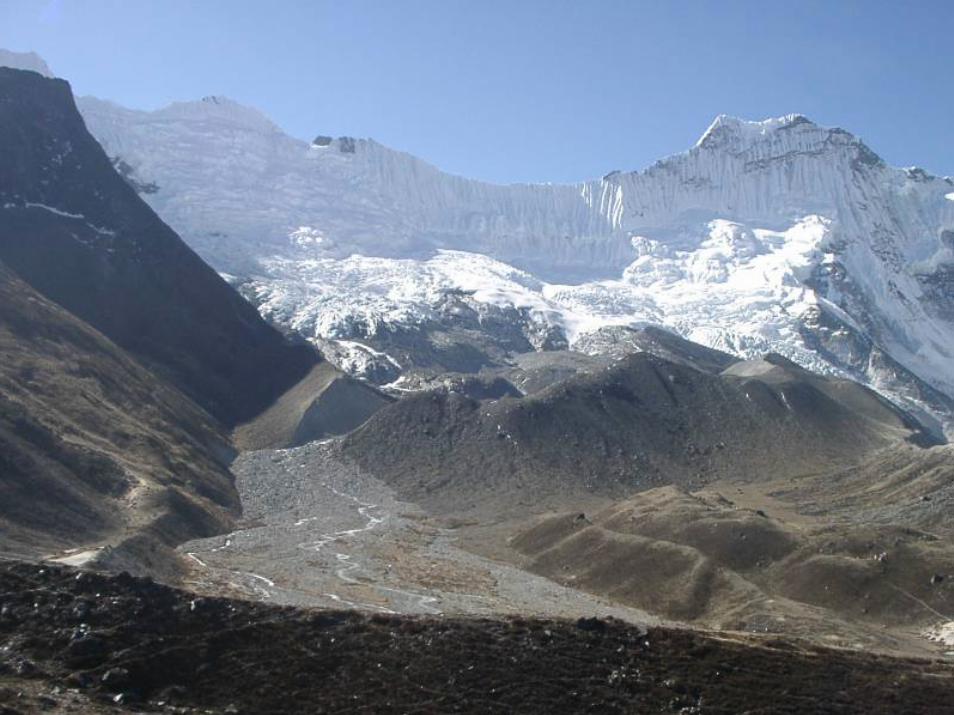
Temporal Analysis of HKH Glacier

3434
Comparative 3D View of Main Biafo Glacier with Overlaid Digitized Boundary of the Glacier
1992 2000

3535
Observed Temporal Changes in Observed Temporal Changes in BiafoBiafo Glacier, Glacier, Central Karakoram, Northern PakistanCentral Karakoram, Northern Pakistan
Assuming that there are no significant measurement errors over aAssuming that there are no significant measurement errors over and above nd above those arising from the resolution of the satellite imagery, the those arising from the resolution of the satellite imagery, the following following results were obtained: results were obtained:
BiafoBiafoGlacierGlacier
19921992AA
20002000BB
ChangeChangeBB--AA
RemarksRemarks
Length Length ((km)km)
60.212 60.212 ±±0.0300.030
60.020 60.020 ±±0.0300.030
--0.192 0.192 ±±0.0430.043
SignificanSignificant t Decrease Decrease (99% (99% Certainty)Certainty)
Area Area ((kmkm²²))
131.642 131.642 ±±1.8061.806
133.159 133.159 ±±1.8011.801
1.517 1.517 ±±2.5512.551
No No SignificanSignificant Changet Change
Width Width ((km)km)calculated calculated as Area/ as Area/ LengthLength
2.186 2.186 ±±0.0300.030
2.219 2.219 ±±0.0300.030
0.033 0.033 ±±0.0430.043
No No SignificanSignificant Changet Change

3636
Pictorial View of the Digitized Snouts of Studied Glaciers of the Hunza River Basin, Northern Pakistan
Landsat image;Resolution 30m

Trends of River Flows in the Upper Indus Basin

3838
Indus at Kalabagh Annual Inflows (1922-2001) y = 0.0395x + 88.285t : (0.677) (32.5)
0
20
40
60
80
100
120
140
1922
1926
1930
1934
1938
1942
1946
1950
1954
1958
1962
1966
1970
1974
1978
1982
1986
1990
1994
1998
Years
Change in Flows per decade : (0.44 ± 0.65)% ≈ (0.395 ± 0.584) MAF
Ann
ual I
nflo
ws
(MA
F)
Data Source: Indus River System Authority (IRSA)
Trend in Annual inflows of Indus at Kalabagh

3939
Indus at Tarbela Annual Inflows (1961-2004) y = -0.0673x + 62.245t : (-0.72) (26.02)
0102030405060708090
1961
1963
1965
1967
1969
1971
1973
1975
1977
1979
1981
1983
1985
1987
1989
1991
1993
1995
1997
1999
2001
2003
Years
Change in Flows per decade : (-1.10 ± 1.54)% ≈ (-0.673 ± 0.935) MAF
Ann
ual I
nflo
ws
(MA
F)
Data Source: Indus River System Authority (IRSA)
Trend in Annual inflows of Indus at Tarbela
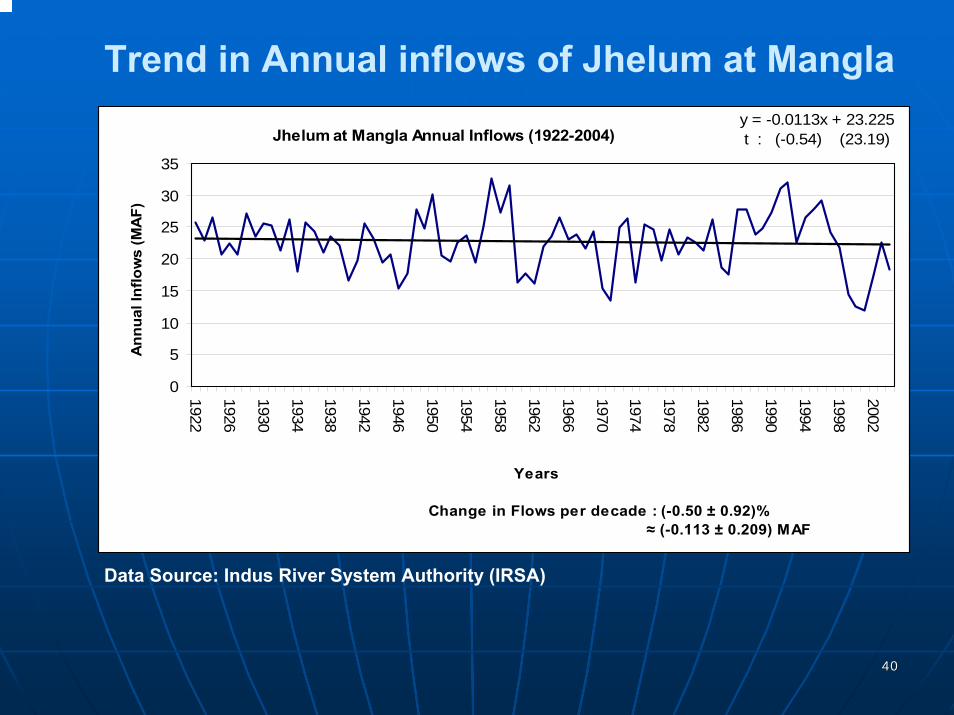
4040
Jhelum at Mangla Annual Inflows (1922-2004)y = -0.0113x + 23.225t : (-0.54) (23.19)
0
5
10
15
20
25
30
35
1922
1926
1930
1934
1938
1942
1946
1950
1954
1958
1962
1966
1970
1974
1978
1982
1986
1990
1994
1998
2002
Years
Change in Flows per decade : (-0.50 ± 0.92)% ≈ (-0.113 ± 0.209) MAF
Ann
ual I
nflo
ws
(MA
F)
Trend in Annual inflows of Jhelum at Mangla
Data Source: Indus River System Authority (IRSA)
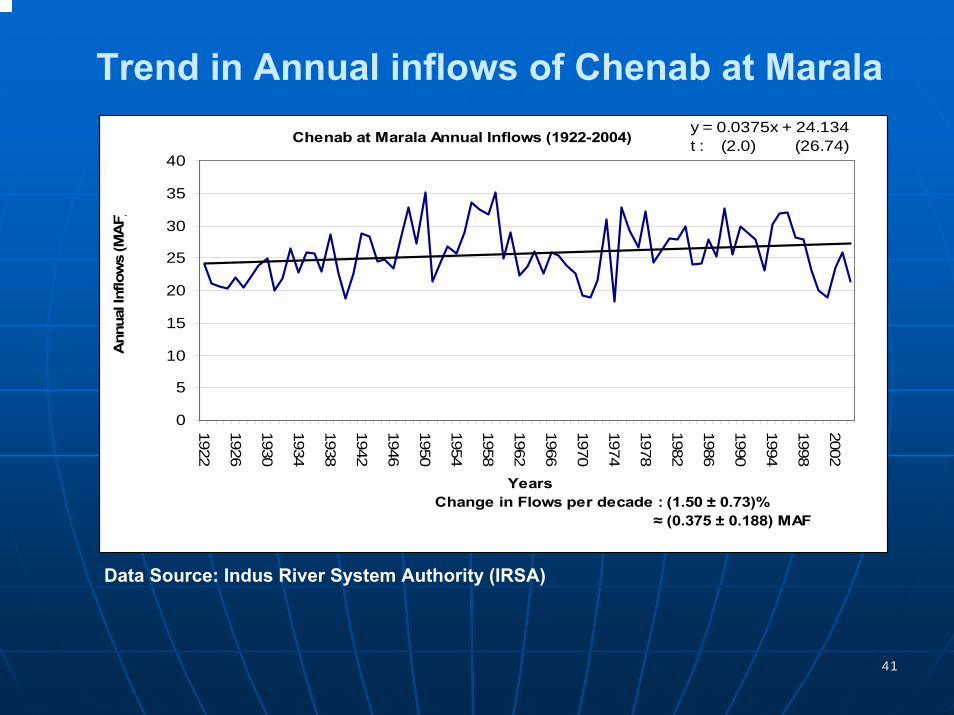
4141
Chenab at Marala Annual Inflows (1922-2004)y = 0.0375x + 24.134t : (2.0) (26.74)
0
5
10
15
20
25
30
35
40
1922
1926
1930
1934
1938
1942
1946
1950
1954
1958
1962
1966
1970
1974
1978
1982
1986
1990
1994
1998
2002
Years Change in Flows per decade : (1.50 ± 0.73)%
≈ (0.375 ± 0.188) MAF
Ann
ual I
nflo
ws
(MA
F)
Data Source: Indus River System Authority (IRSA)
Trend in Annual inflows of Chenab at Marala
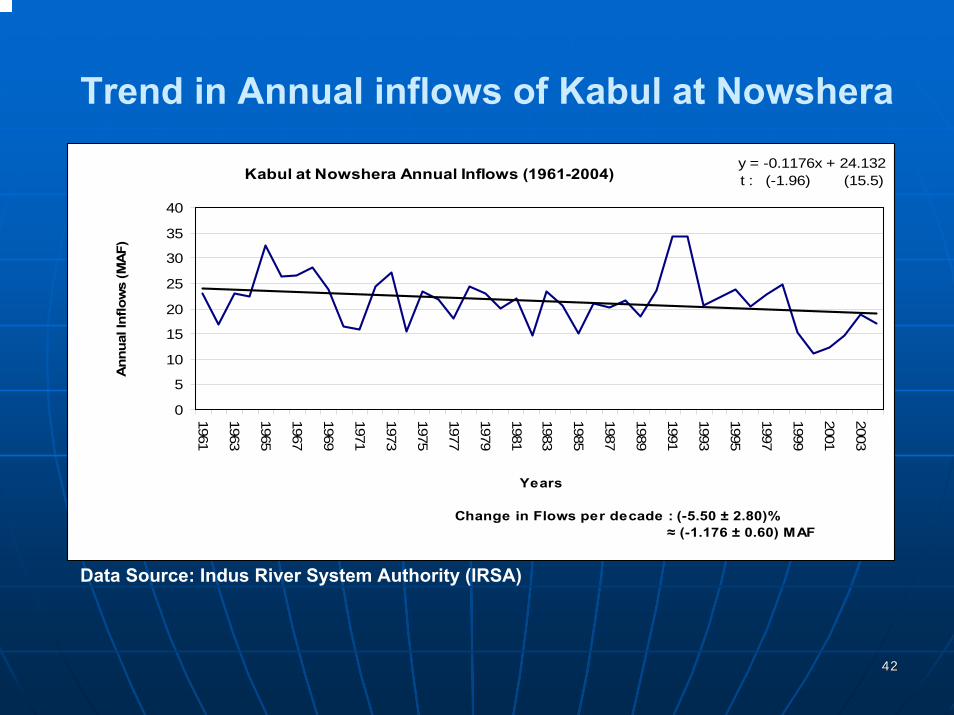
4242
Kabul at Nowshera Annual Inflows (1961-2004)y = -0.1176x + 24.132t : (-1.96) (15.5)
0
5
10
15
20
25
30
35
40
1961
1963
1965
1967
1969
1971
1973
1975
1977
1979
1981
1983
1985
1987
1989
1991
1993
1995
1997
1999
2001
2003
Years
Change in Flows per decade : (-5.50 ± 2.80)% ≈ (-1.176 ± 0.60) MAF
Ann
ual I
nflo
ws
(MA
F)
Data Source: Indus River System Authority (IRSA)
Trend in Annual inflows of Kabul at Nowshera
4343
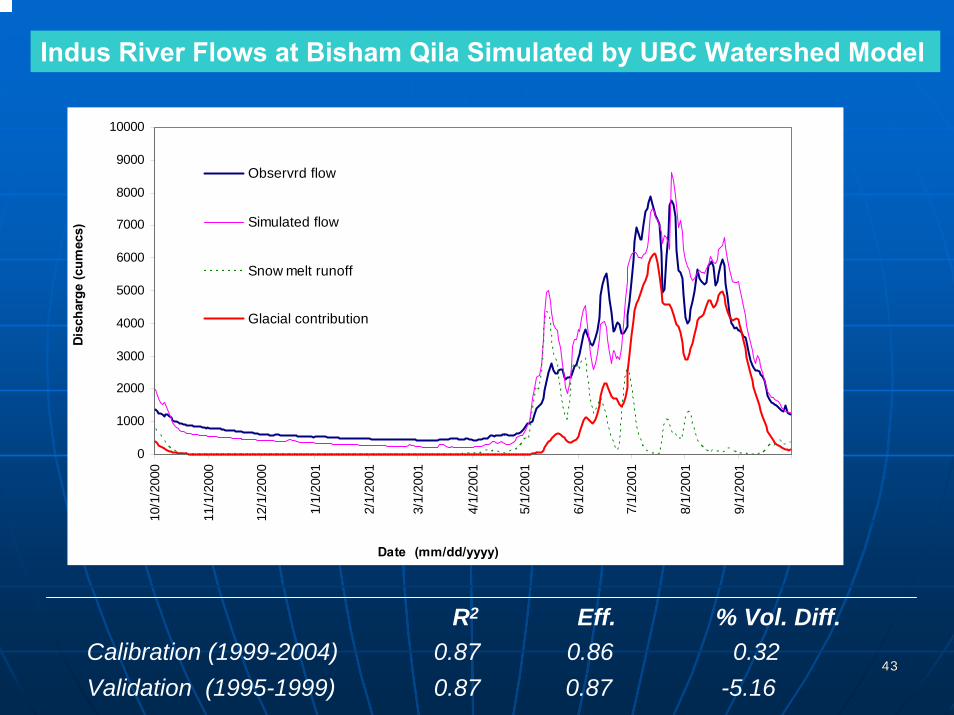
Indus River Flows at Bisham Qila Simulated by UBC Watershed Model
R2 Eff. % Vol. Diff.Calibration (1999-2004) 0.87 0.86 0.32Validation (1995-1999) 0.87 0.87 -5.16
0
1000
2000
3000
4000
5000
6000
7000
8000
9000
10000
10/1
/200
0
11/1
/200
0
12/1
/200
0
1/1/
2001
2/1/
2001
3/1/
2001
4/1/
2001
5/1/
2001
6/1/
2001
7/1/
2001
8/1/
2001
9/1/
2001
Date (mm/dd/yyyy)
Dis
char
ge (c
umec
s)
Observrd flow
Simulated flow
Snow melt runoff
Glacial contribution

4444
Mean Monthly Flow s for the Period of R ecord 1995-2004
0
1000
2000
3000
4000
5000
6000
7000Ja
n
Feb
Mar
Apr
May
Jun
Jul
Aug
Sep Oct
Nov
Dec
Dis
char
ge (C
umec
s)
Base Runoff CCS Runoff
Base Glac ier melt CCS Glac ier melt
Impact of Climate Change and Glacier Retreat on UIB FlowsAssumed Climate Change Scenario (CCS):
Δ Temp: +3°C, Δ Glacier Area: - 50%
Main Results: 1. Annual flows reduced by 15%2. Intra-Annual flow pattern considerably changed

4545
Measures for Water Security
Since an understanding of the response of Karakoram glaciers to climate change is very crucial for the assessment of Indus River flows, GCISC will work in collaboration with GLIMS, NASA and ICIMOD to establish the nature of temporal changes these glaciers have gone through during the last 2-3 decades
At the same time GCISC will enhance its capacity to make use of UBC, DHSVM and other watershed models for making quantitative assessment of the changes in the pattern and amount of river flows resulting from glacier melting and changes in the climatic parameters.
Two important climate change related impacts are: (1) Increase in frequency and intensity of extreme precipitation events such as flood and droughts and (2) rise in sea level. Both these impacts call for increased reservoir capacity in order to provide regulated supplies of water for irrigation as well as for preventing increasing sea water intrusion.
In case the Karakoram glaciers are found to be receding, additional increased water reservoir capacity will be required in order to compensate for the loss of regulation by natural reservoirs (glaciers).

Concluding RemarksConcluding Remarks
Timely ResponseTimely Response
Study of Climate Change Impacts on Study of Climate Change Impacts on Regional BasisRegional Basis
Role of an EconomistRole of an Economist
Effective Procedures to Dissemination of Effective Procedures to Dissemination of Research Results to Policy makers and Research Results to Policy makers and Stake holders.Stake holders. 4646
4747
Thank you

Searching Climate change Impact on Indus River Flows


5252
Climate Change Climate Change –– A RealityA RealityThere is now a consensus among the scientific community that GloThere is now a consensus among the scientific community that Global bal Warming has occurred due to human induced anthropogenic activitiWarming has occurred due to human induced anthropogenic activities es (mainly due to burning of fossil fuel).(mainly due to burning of fossil fuel).
The Global Warming is causing :The Global Warming is causing :
Accelerated Rate of Snow and Glacier MeltAccelerated Rate of Snow and Glacier Melt
Sea level RiseSea level Rise
Intense Rain StormsIntense Rain Storms
Floods and DroughtsFloods and Droughts
Heat and Cold WavesHeat and Cold Waves
Loss of BiodiversityLoss of Biodiversity
The increased intensity & frequency of extreme climate events liThe increased intensity & frequency of extreme climate events linked to nked to global warming will cause large scale disasters.global warming will cause large scale disasters.