

Implementation in Diverse Settings
of the Literacy Assessment and Monitoring Programme (LAMP)
Lessons for Sustainable Development Goal 4 (SDG 4)

UNESCO
The constitution of the United Nations Educational, Scientific and Cultural Organization (UNESCO) was adopted by 20
countries at the London Conference in November 1945 and entered into effect on 4 November 1946. The
Organization currently has 195 Member States and 10 Associate Members.
The main objective of UNESCO is to contribute to peace and security in the world by promoting collaboration among
nations through education, science, culture and communication in order to foster universal respect for justice, the
rule of law, and the human rights and fundamental freedoms that are affirmed for the peoples of the world, without
distinction of race, sex, language or religion, by the Charter of the United Nations.
To fulfil its mandate, UNESCO performs five principal functions: 1) prospective studies on education, science, culture
and communication for tomorrow's world; 2) the advancement, transfer and sharing of knowledge through research,
training and teaching activities; 3) standard-setting actions for the preparation and adoption of internal instruments
and statutory recommendations; 4) expertise through technical cooperation to Member States for their
development policies and projects; and 5) the exchange of specialized information.
UNESCO Institute for Statistics
The UNESCO Institute for Statistics (UIS) is the statistical office of UNESCO and is the UN depository for global
statistics in the fields of education, science, technology and innovation, culture and communication.
The UIS was established in 1999. It was created to improve UNESCO's statistical programme and to develop and
deliver the timely, accurate and policy-relevant statistics needed in today’s increasingly complex and rapidly
changing social, political and economic environments.
Published in 2017 by:
UNESCO Institute for Statistics
P.O. Box 6128, Succursale Centre-Ville
Montreal, Quebec H3C 3J7 Canada
Tel: +1 514-343-6880
Email: [email protected]
http://www.uis.unesco.org
ISBN 978-92-9189-219-8
Ref: UIS/2017/LIT/TD/13
© UNESCO-UIS 2017
This publication is available in Open Access under the Attribution-ShareAlike 3.0 IGO (CC-BY-SA 3.0 IGO) license
(http://creativecommons.org/licenses/by-sa/3.0/igo/). By using the content of this publication, the users accept to be bound by the
terms of use of the UNESCO Open Access Repository (http://www.unesco.org/open-access/terms-use-ccbysa-en).
The designations employed and the presentation of material throughout this publication do not imply the expression of any
opinion whatsoever on the part of UNESCO concerning the legal status of any country, territory, city or area or of its authorities or
concerning the delimitation of its frontiers or boundaries.
The ideas and opinions expressed in this publication are those of the authors; they are not necessarily those of UNESCO and do not
commit the Organization.
3 LAMP: Implementation in Diverse Settings
Foreword
With the adoption of Sustainable Development Goal 4 (SDG 4), the world has pledged to provide inclusive
and equitable quality education and the promotion of lifelong learning by 2030. Five of the ten targets of the
global education goal focus on learning, with Target 4.6 specifically stating that all youth and a substantial
portion of adults should achieve literacy and numeracy.
As the official source of cross-nationally comparable education data, the UNESCO Institute for Statistics has
been given the mandate to produce a new generation of indicators on education quality, equity and learning,
including reading and numeracy skills. The indicators will be used not just to monitor progress but to help
countries and the wider international education community better target their policies and initiatives to
achieve SDG 4.
Clearly, no single organization can achieve this alone so the Institute works with a wide range of partners –
including policymakers, national statistical offices, technical experts, international and regional
organizations, as well as donors and civil society groups – through a series of initiatives, such as the Global
Alliance to Monitor Learning, the Technical Cooperation Group on SDG 4-Education 2030 Indicators and the
Inter-Agency Group on Education Inequality Indicators. Through this collaborative approach, we are
developing the methodologies, metrics, data sources and consensus needed to measure learning outcomes
globally, with a specific focus on functional literacy skills among youth and adult populations.
The challenges are daunting, at times, but far from insurmountable. Instead of trying to “re-invent the wheel”,
we are building on the tremendous efforts made over the past 20 years. In particular, a growing number of
countries are conducting learning assessments and many have found innovative ways to transfer this
experience, which has mostly focused on the achievement of schooled individuals, into the realm of adult
literacy.
While these experiences set the foundations for the new international statistical work in literacy, they are
limited to a rather small set of affluent countries, mostly OECD Member States. To monitor and achieve SDG
4, we must focus on the vast majority of countries that face very different circumstances, priorities and
challenges in terms of literacy skills.
We can therefore learn from the experience of the Literacy Assessment and Monitoring Programme (LAMP),
which was first launched by the UIS in 2003 to develop (on the basis of previous experiences) a methodology
that could be used beyond the realm of European languages and industrialised countries to inform
governments, education and learning experts, and the community in general about what people are actually
able to do when confronted with written materials.

4
LAMP: Implementation in Diverse Settings
LAMP can be seen as a methodological endeavour into uncharted territory. The need to provide sound
information, especially concerning the least-skilled in a population or those who are “learning to read”, posed
several challenges. One of the major challenges stemmed from the fact that the process of acquiring reading
skills is strongly influenced by the specific characteristics of the languages and scripts used by a given
population. Thus, LAMP had to contend with a significant amount of diversity, which also applies to the
institutional dynamics in each of the countries the UIS had partnered with.
As we move forward with the SDG 4 indicators, it is important to release this report and learn from the
experiences and results of LAMP. This report shows the complexities of a diverse group of countries, who
face very different challenges but share a common commitment to address the specific needs of their adult
populations in terms of literacy skills. Through LAMP, we gain a unique perspective on the diversity of human
literacy experiences.
This report was made possible thanks to the commitment of the different national teams responsible for
implementing LAMP. Their contributions were further enriched by a team of specialists within and outside
the UIS. Together, the report team brings a unique and pragmatic view on how to resolve the technical issues
that will certainly arise in producing the data needed to monitor SDG 4. The UIS is deeply grateful for these
contributions that have allowed us to explore this uncharted territory successfully through the identification
of some key challenges as well as their solutions.
The information presented in this volume shows that literacy challenges are extremely complex and that
this complexity cannot be overlooked by societies that are committed to guaranteeing the universal right to
education. At the same time, despite the difficulties encountered when trying to measure and compare
results, the report shows how information generated following a sound approach and meeting basic quality
standards can provide significant clues as to how those challenges can be addressed. It also shows that the
methodology, with the necessary adaptations, can be used across different cultures, languages and scripts.
Silvia Montoya
Director
UNESCO Institute for Statistics

5
LAMP: Implementation in Diverse Settings
Acknowledgements
The UIS wishes to express its gratitude to the national teams, institutions and individuals who have provided
support to the development of LAMP:
The LAMP national teams in Jordan, Mongolia, Palestine and Paraguay, countries for which data are
included in this report.
The LAMP national teams in Afghanistan, El Salvador, Morocco, Niger and Viet Nam, where the LAMP
field tests were completed, but for different reasons main assessments have not been conducted as
of today.
The team in the People’s Democratic Republic of Lao, which has completed the LAMP main
assessment and disseminated the data.
Statistics Canada and the Educational Testing Service (ETS), which provided invaluable support,
especially in the first years, by sharing their experience in previous studies and authorising the UIS
to use some copyrighted materials.
We would especially like to thank the Members of the LAMP Global Advisory Board for offering their time
and expertise on a pro bono basis over the course of several years. Their insightful and challenging
contributions made our annual meetings an invaluable source of inspiration, encouragement and ideas to
ponder. Likewise, the UIS would like to thank Matthew Johnson, Ismael Sanz Labrador, Francisco Javier Garcia
Crespo, Ruth Martín Escanilla, Luis Sanz San Miguel, María Elena Brenlla, Pierre Brochu, Luis Crouch, Sheren
Hamed, Anthony Nitko and Seamus Hegarty, who reviewed the report.
Finally, this report is dedicated to all LAMP respondents in all countries, who literally opened their homes to
us; told us about their education, their work, their leisure and their households; and showed us some of the
things they can (or cannot) do with written words and numbers. They did this with the understanding that
this project would help improve the quality of education in their countries (and maybe in other countries as
well). We are all indebted to each one of them.
6
LAMP: Implementation in Diverse Settings
Abbreviations
ALL Adult Literacy and Lifeskills Survey
CONFINTEA International Conference on Adult Education
OECD Organisation for Economic Co-operation and Development
DGEEC General Direction for Statistics and Censuses (Paraguay)
DIF Differential Item Functioning
DOS Department of Statistics (Jordan)
EFA Education for All
ETS Educational Testing Service
GDP Gross Domestic Product
GED Global Education Digest
GMR Global Monitoring Report
GRALE Global Report on Adult Learning and Education
HDI Human Development Index
IALS International Adult Literacy Survey
IEA International Association for the Evaluation of Educational Achievement
IRT Item response theory
ISCO International Standardized Classification of Occupations
ISRS International Survey of Reading Skills
KNALS Kenya National Adult Literacy Survey
LAMP Literacy Assessment and Monitoring Programme
LCA Latent class analysis
MECS Ministry of Education, Culture and Sciences of Mongolia
MOE Ministry of Education
NAfKE National Assessment for Knowledge Economy (Jordan)
NALS National Adult Literacy Survey
NCHRD National Centre for Human Resources Development (Jordan)
OEI Organization of Ibero-American States

7
LAMP: Implementation in Diverse Settings
PCBS Palestinian Central Bureau of Statistics
PDN Prose, Document and Numeracy
PIAAC Programme for the International Assessment of Adult Competencies
PIRLS Progress in International Reading Literacy Study
PISA Programme for International Student Assessment
RC Reading Components
RCA Reading Components assessment
SACMEQ Southern and Eastern Africa Consortium for Monitoring Educational Quality
SES Socio-economic status
STEM Science, Technology, Engineering and Mathematics
STEP Skills towards Employment and Productivity
TIMSS Trends in International Mathematics and Science Study
UIS UNESCO Institute for Statistics
UNDP United Nations Development Programme
UNESCO United Nations Educational, Scientific and Cultural Organization
WHO World Health Organization
WLE Weighted Least-Squares Estimation

8
LAMP: Implementation in Diverse Settings
Table of contents
Foreword ....................................................................................................................................................................... 3
Acknowledgements...................................................................................................................................................... 5
Abbreviations ................................................................................................................................................................ 6
Executive summary .................................................................................................................................................... 15
Chapter 1. Introduction ............................................................................................................................................. 21
1.1 Literacy Assessment and Monitoring Programme (LAMP) ........................................................ 21
1.2 The scope of LAMP .......................................................................................................................... 21
1.3 Why LAMP was developed ............................................................................................................. 23
1.4 Commonality and differences between IALS/ALL and LAMP .................................................... 24
1.5 Foundation of LAMP methodological choices ............................................................................. 25
1.6 Organization of this report ............................................................................................................ 26
Chapter 2. Literacy and the right to education ...................................................................................................... 27
2.1What is literacy? ................................................................................................................................ 27
2.2 Literacy and the right to education............................................................................................... 27
2.3 Literacy’s impact on people’s well-being ...................................................................................... 28
2.4 Summary .......................................................................................................................................... 29
Chapter 3. The three domains measure by LAMP ................................................................................................. 30
3.1 The impact of the evolution of literacy on the LAMP assessment ........................................... 30
3.2 Earlier attempts to assess literacy through surveys ................................................................... 31
3.3 Introduction of better literacy assessments ................................................................................ 32
3.4 Measures of reading and numeracy skills ................................................................................... 33
i) Reading: Prose and Document .................................................................................................. 33
ii) Quantitative or numeracy skills? .............................................................................................. 37
3.5 Performance level descriptions for Prose, Document and Numeracy domains .................... 38
3.6 The correlations between skills domains..................................................................................... 38
3.7 Reading Components and “Learning to Read” ............................................................................ 41
Chapter 4. LAMP and other sources of information on literacy .......................................................................... 42
4.1 LAMP and literacy rates .................................................................................................................. 42
i) How are literacy rates produced?.............................................................................................. 42
ii) How are literacy rates used? ..................................................................................................... 43
iii) LAMP is not a tool to produce literacy rates .......................................................................... 45
iv) Can LAMP replace literacy rates in international comparisons? ......................................... 45
v) Can LAMP help us understand literacy rates? ........................................................................ 46
vi) Both LAMP and literacy rates have advantages .................................................................... 46
4.2 Can LAMP be used to evaluate a literacy programme? ............................................................. 47
4.3 LAMP is not a household survey ................................................................................................... 48
9
LAMP: Implementation in Diverse Settings
Chapter 5. The overall process of design, development and implementation of LAMP .................................. 50
5.1 Landmarks in the initial design of LAMP: 2003-2006 ................................................................. 50
5.2 The field test and improvement process: 2006-2010................................................................. 52
i) The language scope of LAMP: Languages, families and scripts ............................................ 53
ii) Lessons learned from the field test and the resulting changes made ................................ 54
5.3 The final design of LAMP ................................................................................................................ 55
5.4 Countries implementing and collecting data for the main assessment: 2010-2011 ............. 56
Chapter 6. LAMP literacy and numeracy results for countries ............................................................................ 61
6.1 Literacy levels in Prose Reading .................................................................................................... 61
6.2 Literacy levels in Document Reading ............................................................................................ 63
6.3 Numeracy levels .............................................................................................................................. 65
6.4 Summary .......................................................................................................................................... 67
Chapter 7. The performance of socio-demographic subgroups of LAMP literacy and numeracy
measures ................................................................................................................................................ 68
7.1 Literacy, numeracy and learning: Schooling and non-formal education ................................ 68
i) Background on schooling and non-formal education in the four countries that
used LAMP ....................................................................................................................................... 69
ii) Educational attainment and LAMP results .............................................................................. 71
7.2 Literacy, numeracy and gender ..................................................................................................... 76
i) The situation of men and women in countries that administered LAMP ............................ 77
ii) Literacy and numeracy skills of men and women in countries administering LAMP ....... 79
7.3 Literacy, numeracy and the lifespan: Age and cohort ................................................................ 82
7.4 Literacy, numeracy and legacies: Parental education, occupation and socio-economic
status ................................................................................................................................................ 90
i) Parents’ education as an indicator for socio-economic status .............................................. 90
ii) Parents’ education, parents’ occupation and LAMP literacy and numeracy measures .... 91
7.5 Literacy, numeracy and location: Urban and rural ................................................................... 100
i) General differences between rural and urban populations in the LAMP sample ............ 100
ii) Literacy and numeracy of rural and urban residents .......................................................... 100
7.6 Literacy, numeracy and leisure: The use of skills at home ...................................................... 103
7.7 Literacy, numeracy and livelihood: The use of skills at work .................................................. 107
i) Employment and literacy and numeracy scores on LAMP .................................................. 107
ii) Occupational level and literacy and numeracy scores on LAMP ....................................... 107
ii) The use of reading and numeracy skills in the workplace related to literacy and
numeracy scores on LAMP .......................................................................................................... 109
7.8 Summary ........................................................................................................................................ 114
Chapter 8. A case study of literacy and language: Mother tongue, home language and bilingual status... 116
8.1 A tale of two languages: Bilingualism, diglossia and literacy in Paraguay ............................. 116
8.2 Hypotheses about performance on LAMP ................................................................................ 120
8.3 Results ............................................................................................................................................ 121

10
LAMP: Implementation in Diverse Settings
Chapter 9. The LAMP Reading Components assessment .................................................................................. 125
9.1 Description of the Reading Components assessment ............................................................. 125
i) General content of the Reading Components assessment ................................................. 126
ii) The languages and scripts assessed ...................................................................................... 127
iii) The nature of the Reading Components tasks .................................................................... 128
iv) Why is there no score for Reading Components as with LAMP Prose, Document
or Numeracy? ................................................................................................................................ 128
v) How the Reading Components profiles were created ......................................................... 129
9.2 Main results of the Reading Components assessment ........................................................... 129
i) Overview ..................................................................................................................................... 129
ii) Country-specific performances in the Reading Components assessment ....................... 129
9.3 Summary ........................................................................................................................................ 138
Chapter 10. Summary and conclusions ................................................................................................................ 140
10.1 The development and design of LAMP .................................................................................... 140
10.2 Results and implications of implementing LAMP ................................................................... 143
10.3 Results of the Reading Components section of LAMP ........................................................... 146
10.4 Possibility of using LAMP for specific in-depth studies .......................................................... 147
10.5 Summary of the experience with LAMP ................................................................................... 148
References ................................................................................................................................................................ 153
Glossary ..................................................................................................................................................................... 159
Annex 1. Support for the validity of having three major domains in LAMP .................................................... 163
Annex 2. Anchoring process and performance level definitions....................................................................... 165
Annex 3. Jordan: Summary of samples sizes, means, standard deviations and standard errors of
means ........................................................................................................................................................................ 168
Annex 4. Mongolia: Summary of samples sizes, means, standard deviations and standard errors
of means.................................................................................................................................................................... 170
Annex 5. Palestine: Summary of samples sizes, means, standard deviations and standard errors
of means.................................................................................................................................................................... 172
Annex 6. Paraguay: Summary of samples sizes, means, standard deviations and standard errors
of means.................................................................................................................................................................... 174
Annex 7. Jordan: Percentage of respondents at each LAMP Prose Reading level for various
demographic categories ......................................................................................................................................... 176
Annex 8. Jordan: Percentage of respondents at each LAMP Document Reading level for various
demographic categories ......................................................................................................................................... 178

11
LAMP: Implementation in Diverse Settings
Annex 9. Jordan: Percentage of respondents at each LAMP Numeracy Reading level for various
demographic categories ......................................................................................................................................... 180
Annex 10. Mongolia: Percentage of respondents at each LAMP Prose Reading level for various
demographic categories ......................................................................................................................................... 182
Annex 11. Mongolia: Percentage of respondents at each LAMP Document Reading level for various
demographic categories ......................................................................................................................................... 184
Annex 12. Mongolia: Percentage of respondents at each LAMP Numeracy Reading level for various
demographic categories ......................................................................................................................................... 186
Annex 13. Palestine: Percentage of respondents at each LAMP Prose Reading level for various
demographic categories ......................................................................................................................................... 188
Annex 14. Palestine: Percentage of respondents at each LAMP Document Reading level for various
demographic categories ......................................................................................................................................... 190
Annex 15. Palestine: Percentage of respondents at each LAMP Numeracy Reading level for various
demographic categories ......................................................................................................................................... 192
Annex 16. Paraguay: Percentage of respondents at each LAMP Prose Reading level for various
demographic categories ......................................................................................................................................... 194
Annex 17. Paraguay: Percentage of respondents at each LAMP Document Reading level for various
demographic categories ......................................................................................................................................... 196
Annex 18. Paraguay: Percentage of respondents at each LAMP Numeracy Reading level for various
demographic categories ......................................................................................................................................... 198
Annex 19. How the socio-economic status index was computed ..................................................................... 200
Annex 20. An explanation of the LAMP ordinal index of literacy and numeracy practices ........................... 210
List of tables
3.1 Performance levels for the Prose, Document and Numeracy domains ...................................................... 39
3.2 Coefficients of correlation between Prose, Document and Numeracy scores ........................................... 40
3.3 Correlation between Prose, Document and Numeracy scores after controlling for schooling ................ 40
5.1 Countries that participated in the field testing ................................................................................................ 52
5.2 Languages and scripts that were field tested to develop LAMP ................................................................... 53
5.3 Countries, implementing partners and sample sizes for the main assessment ........................................ 57
7.1 Participation (in percentage) in literacy programmes (%) .............................................................................. 69
7.2 Participation in non-formal education programmes (%) ............................................................................... 70
7.3 Participation in formal education, mean years of schooling and educational attainment (%) ................. 71

12
LAMP: Implementation in Diverse Settings
7.4 Profiles by gender in medians (in age) or percentages .................................................................................. 78
7.5 Educational attainment (highest completed level of education) and type of occupation of
parents (%) .................................................................................................................................................................. 91
7.6 Respondents’ profiles by gender in median age or percentages ............................................................... 101
8.1 Distribution of the two main spoken languages among Prose, Document and Numeracy
respondents .............................................................................................................................................................. 117
8.2 Distribution of the two main mother tongues among Prose, Document and Numeracy
respondents .............................................................................................................................................................. 117
8.3 Distribution of home language and first language read among Prose, Document and Numeracy
respondents .............................................................................................................................................................. 118
8.4 Profile of Prose, Document and Numeracy respondents by Spanish mother tongue ............................ 119
8.5 Distribution of respondents by home language and mother tongue ........................................................ 122
9.1 Country-specific Reading Components assessment: Languages and orthographies .............................. 127
9.2 Paraguay’s Reading Components assessment: Mean percentage correct for each untimed literacy
subtest per profile (n = 724 respondents) ............................................................................................................ 130
9.3 Paraguay’s Reading Components assessment: Mean score expressed as percentage of the maximum
possible score for each timed subtest by profile (n = 724) ................................................................................ 131
9.4 Paraguay’s relationship between Reading Components assessment profiles and self-reported
reading ability (n = 3,786) ........................................................................................................................................ 132
9.5 Mongolia’s Reading Components assessment: Mean percentage correct for each untimed literacy
subtest per profile (n = 590 respondents) ............................................................................................................ 133
9.6 Mongolia’s Reading Components assessment: Mean score expressed as percentage of the maximum
possible score for each timed subtest by profile (n = 590) ................................................................................ 133
9.7 Mongolia’s relationship between Reading Components assessment profiles and self-reported
reading ability (n = 3,914) ........................................................................................................................................ 134
9.8 Jordan’s Reading Components assessment: Mean percentage correct for each untimed literacy
subtest per profile (n = 438 respondents) ............................................................................................................ 135
9.9 Jordan’s Reading Components assessment: Mean score expressed as percentage of the
maximum possible score for each timed subtest by profile (n = 438) ............................................................. 136
9.10 Jordan’s relationship between Reading Components assessment profiles and self-reported
reading ability (n = 2,383) ........................................................................................................................................ 136
9.11 Palestine’s Reading Components assessment: Mean percentage correct for each untimed
literacy subtest per profile (n = 777 respondents) .............................................................................................. 137
9.12 Palestine’s Reading Components Assessment: Mean score expressed as percentage of the
maximum possible score for each timed subtest by profile (n = 777) ............................................................. 138
List of figures
5.1 The instruments comprising LAMP ................................................................................................................... 57
6.1 Prose score means and confidence intervals by country .............................................................................. 61
6.2 LAMP Prose Performance Levels comparison ................................................................................................. 62
6.3 Document score means and confidence intervals by country ...................................................................... 63
6.4 LAMP Document Performance Levels comparison ........................................................................................ 64
6.5 Numeracy score means and confidence intervals by country ...................................................................... 66
6.6 LAMP Numeracy Performance Levels comparison ......................................................................................... 66
7.1 Mean Prose Reading scores by highest completed education level ............................................................ 72

13
LAMP: Implementation in Diverse Settings
7.2 Mean Document Reading scores by highest completed education level .................................................... 72
7.3 Mean Numeracy scores by highest completed education level .................................................................... 73
7.4 Mean scores differences between adults who completed primary education and adults who
completed lower secondary education................................................................................................................... 74
7.5 Mean scores differences between adults who completed lower secondary education and adults
who completed upper secondary education ......................................................................................................... 75
7.6 Proficiency levels in Numeracy by educational attainment ........................................................................... 76
7.7 Performance levels in Numeracy by sex .......................................................................................................... 80
7.8 Differences in mean scores between males and females ............................................................................. 80
7.9 Mean scores (adjusted for educational attainment) differences between males and females ............... 81
7.10 Mean scores differences between the 15-24 and 40-64 age groups ......................................................... 85
7.11 Mean scores (adjusted for educational attainment) differences between the 15-24 and 40-64 age
groups .......................................................................................................................................................................... 85
7.12 Numeracy average score and 95% confidence interval limits by age group and by country ................. 87
7.13 Relationship between age and Prose, Document and Numeracy skills in LAMP countries .................... 89
7.14 Mean score differences between respondents with secondary educated mothers and
respondents with post-secondary educated mothers.......................................................................................... 92
7.15 Mean score differences (adjusted for educational attainment) between respondents with
secondary educated mothers and respondents with post-secondary educated mothers ............................. 93
7.16 Mean score differences between respondents with secondary educated fathers and
respondents with post-secondary educated fathers ............................................................................................ 94
7.17 Mean score differences (adjusted for educational attainment) between respondents with
secondary educated fathers and respondents with post-secondary educated fathers .................................. 95
7.18 Mean score differences between respondents with at least one parent employed in a high-skilled
occupation and respondents with parents in low-skilled occupations .............................................................. 96
7.19 Mean score (adjusted for educational attainment) differences between respondents with at least
one parent in a high-skilled occupation and respondents with parents in lower-skilled occupations .......... 97
7.20 Mean score differences between respondents with the highest SES and respondents with the
lowest SES ................................................................................................................................................................... 99
7.21 Mean score differences (adjusted for educational attainment) between respondents with the
highest SES and respondents with the lowest SES ................................................................................................ 99
7.22 Mean scores differences between urban and rural residents .................................................................. 102
7.23 Mean scores (adjusted for educational attainment) differences between urban and rural
residents .................................................................................................................................................................... 102
7.24 Literacy practices outside work by educational attainment ...................................................................... 104
7.25 Mean scores differences between broadcast media users and mobile phone users ........................... 105
7.26 Mean score differences (adjusted for educational attainment) between broadcast media users
and mobile phone users ......................................................................................................................................... 105
7.27 Mean score differences between mobile phone users and computer users ......................................... 106
7.28 Mean score (adjusted for educational attainment) differences between mobile phone users and
computer users ........................................................................................................................................................ 106
7.29 Mean score differences between employed and unemployed respondents ......................................... 107
7.30 Mean score (adjusted for educational attainment) differences between employed and
unemployed respondents ...................................................................................................................................... 108
7.31 Mean score differences between high-skilled and low-skilled employed respondents ........................ 108

14
LAMP: Implementation in Diverse Settings
7.32 Mean score (adjusted for educational attainment) differences between high-skilled and
low-skilled employed respondents ........................................................................................................................ 109
7.33 Literacy and numeracy practices at work related to educational attainment ........................................ 110
7.34 Mean score differences between respondents with low diversity and respondents with medium
diversity of literacy and numeracy practices at work ......................................................................................... 111
7.35 Mean score (adjusted for educational attainment) differences between respondents with low
diversity and respondents with medium diversity of literacy and numeracy practices at work .................. 111
7.36 Mean score differences between respondents with no practice and respondents with medium
diversity of literacy practices at work .................................................................................................................... 112
7.37 Mean score differences (adjusted for educational attainment) between respondents with no
practice and medium diversity of literacy practices at work ............................................................................. 112
7.38 Mean score differences between respondents with low diversity and respondents with medium
diversity of numeracy practices at work ............................................................................................................... 113
7.39 Mean score (adjusted for educational attainment) differences between respondents with low
diversity and respondents with medium diversity of numeracy practices at work ........................................ 113
8.1 Language most spoken at home and language in which the respondent first learnt to read ............... 118
8.2 Mean score difference between native Spanish-speakers and other respondents ................................. 121
8.3 Mean adjusted score difference between native Spanish-speakers and other respondents ................ 121
8.4 Mean score difference monolingual and bilingual Spanish-speakers ....................................................... 123
List of boxes
3.1 Example of Prose Reading Item: Medco Aspirin ............................................................................................. 34
3.2 Example of a Document Reading item: Fireworks .......................................................................................... 35
3.3 Example of a Document Reading item: Female teachers .............................................................................. 36
3.4 Example of a Numeracy Reading item: Bottles ............................................................................................... 37
4.1 Can illiteracy be eradicated? .............................................................................................................................. 44
7.1 Towards gender equity in education and learning in Jordan ........................................................................ 83
7.2 What are age and cohort effects? ...................................................................................................................... 84

15
LAMP: Implementation in Diverse Settings
Executive Summary
In 2003, the UNESCO Institute for Statistics (UIS) started the Literacy Assessment and Monitoring Programme
(LAMP) in partnership with several countries and organizations in order to develop a new methodology for
measuring literacy and numeracy skills among youth and adults (aged 15 years and up) to improve the
available body of statistical evidence. Its design was inspired by surveys conducted mostly in member
countries of the Organization for Economic Co-operation and Development (OECD): the International Adult
Literacy Survey (IALS) and the Adult Literacy and Lifeskills Survey (ALL), which are thus far the most significant
efforts in cross-national measurement of literacy and numeracy. Addressing their strengths and weaknesses
helped shape LAMP in its early years.
LAMP was designed with UNESCO’s notion of the "plurality of literacy" in mind, which emphasises the social,
economic and cultural bounding of literacy. It explores the distribution of different skills among populations
and the need to use those skills in everyday life situations. Therefore, LAMP can meaningfully inform about
core elements of people's right to education.
What does LAMP measure?
LAMP tests in three domains: reading of continuous texts (prose), reading of non-continuous texts
(document) and numeracy skills. Prose skills enable individuals to read texts organized in paragraphs, with
indentation and headings that reveal its structure and purpose. Document skills are applied to non-
continuous texts in different formats (tables, schedules, charts, maps, etc.) where readers can use different
strategies to enter and extract information. Finally, numeracy skills enable individuals to perform short
mathematical tasks that require computing; estimating; and understanding notions of shape, length,
volume, currency and other measures. The assessment tasks are intended to be meaningful to respondents
in everyday life settings: home and family; health and safety; community and citizenship; consumption; work;
and leisure and recreation.
In addition to these three domains, LAMP explores factors associated with lower performance in order to
gain useful information for literacy interventions. In fact, the UIS specifically commissioned an original
framework for the measurement of reading components. Assuming that reading requires both word
recognition and comprehension skills, this module tests how people apply these skills to process written
texts. The ability to name letters and numbers, process sentences rather than just decoding words and read
paragraphs fluently are proficiency indicators that describe the population according to their reading skills.
Finally, LAMP also gathered data on each respondent’s socio-economic background and use of written
materials in various daily-life contexts, thus providing key analytical elements to characterise the population.
Assessment development approach
The procedures that the UIS applied during the development of this assessment assured that LAMP would
be:
Comparable across countries, languages and scripts (for reading and numeracy skills)
Country-, language- and script-specific (for pre-reading skills)
Country-specific for socio-economic and socio-demographic information.

16
LAMP: Implementation in Diverse Settings
For each of the three domains (Prose reading, Document reading and Numeracy), LAMP used item response
theory methodology to develop the assessment scale. This allowed all countries’ results to be placed on the
same metric for easy comparison. LAMP also divided the metric for each domain into three performance
levels so that scores on the metric could be described in terms of the specific literacy or numeracy skills that
the score represents. These levels of performance are progressive (or developmental) in the sense that if a
person scores at a higher level, all skills described as lower level performances can also be performed along
with those at the higher level. Chapter 3 defines the skills persons scoring at each performance level can
perform.
The metric and performance levels that LAMP provides cannot be used to create literacy rates. LAMP
measures literacy and numeracy on a continuous metric. Therefore, it does not produce dichotomous
results that are converted easily into a ‘rate’.
Household-based assessment
It should be noted that LAMP assessed literacy and numeracy using a household-based sampling design.
Following a carefully designed sampling plan, households were randomly selected to represent the
demographics of a country. Then, within a selected household a randomly selected adult (15 years or older)
was administered the LAMP assessment individually. This process is unlike school-based assessments that
assess students within selected schools. It is also unlike general household surveys for which literacy
assessment is not the main intent but which might include a small module for collecting information on
literacy as part of a broader data collection effort.
LAMP items were derived from several sources and revised for new field testing using input from
participating countries. Among the sources were items from the International Adult Literacy Survey (IALS)
and the Adult Literacy and Lifeskills Survey (ALL), items especially written for LAMP by participating countries
with the intention of using them across all countries, and items that were developed specifically for use
within a specific country.
Fieldtesting LAMP
The LAMP assessment items were field tested in eight countries with a wide array of languages and scripts
(from 2006 to 2010). Languages and scripts included Arabic (Arabic script), Mongolian (Cyrillic script) and
languages with a Roman script – French, Fulfulde, Hausa, Kanuri, Tamasheq, Zarma, Spanish and
Vietnamese. Field testing in this diverse context allowed the development team to improve the items and to
select items that, when adapted and translated, functioned well across several countries.
Final design of LAMP
The final design of LAMP consists of a battery of instruments that includes: i) Background Questionnaire; ii) a
filter test to determine whether a lower or higher level test is appropriate for an individual; iii) Module A for
lower performance assessment; iv) Reading Components for assessment of pre-reading skills that are lower
than Module A; and v) Module B for higher level performance assessment.

17
LAMP: Implementation in Diverse Settings
Countries implementing LAMP
Four countries implemented the final version of LAMP on a sampling basis: Jordan, Mongolia, Palestine and
Paraguay. Participant rates were high – in fact, they were above average rates for other international adult
literacy assessments.
General findings of the LAMP study
Identifying participants’ skills
The findings of the LAMP assessment for the four countries can be summarised by describing the estimated
percentages of the countries’ populations that perform at different levels in Prose reading, Document
reading and Numeracy.
With regard to Prose reading the distribution of respondents in the four countries is as follows:
a. Level 1. Less than 30% of respondents could only: Identify literal, concrete information in reading-to-
do passages (e.g. job vacancy notices, product labels and vaccination information) or simple one-
paragraph passages.
b. Level 2. 41% to 51% of the respondents could do everything in (a) above and in addition could:
Identify literal information in reading-to-do or reading-to-learn passages. Respondents could
paraphrase, understand more ‘academic’ language and write full-sentence answers.
c. Level 3. 20% to 31% of the respondents could do everything in both (a) and (b) above, and in addition
could: Identify literal information in longer, more challenging reading-to-learn texts (1-10
paragraphs) with linguistically dense passages or when the required information is in the middle or
end of the passage.
With regard to Document reading in the four countries:
a. Level 1. Less than 35% could only: Identify a single piece of information in a simple reading-to-do or
reading-to-learn document (passages, graphs or tables)
b. Level 2. 35% to 54% of the respondents could do everything in (a) above and in addition could:
Understand reading-to-learn graphs or tables that included two or three variables with descriptive
labels, compare or contrast numerical information or processes, and coordinate and match parallel
information (e.g. time and activity data in one table).
c. Level 3. 21% to 38% of the respondents could do everything in both (a) and (b) above, and in addition
could: Understand complex documents and integrate information from complex sources (densely
packed tables, multiple graphs in order to identify numerical values, given a set criterion); and fill out
complex forms by turning personal data into categorical variables.
18
LAMP: Implementation in Diverse Settings
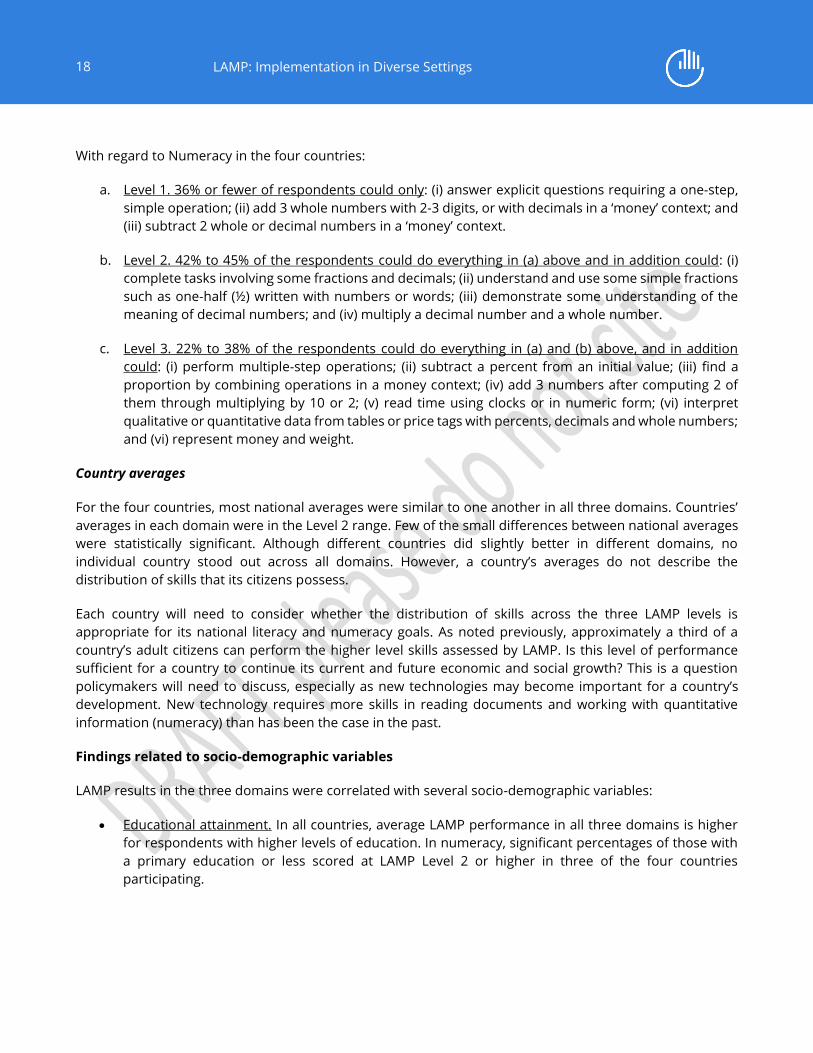
With regard to Numeracy in the four countries:
a. Level 1. 36% or fewer of respondents could only: (i) answer explicit questions requiring a one-step,
simple operation; (ii) add 3 whole numbers with 2-3 digits, or with decimals in a ‘money’ context; and
(iii) subtract 2 whole or decimal numbers in a ‘money’ context.
b. Level 2. 42% to 45% of the respondents could do everything in (a) above and in addition could: (i)
complete tasks involving some fractions and decimals; (ii) understand and use some simple fractions
such as one-half (½) written with numbers or words; (iii) demonstrate some understanding of the
meaning of decimal numbers; and (iv) multiply a decimal number and a whole number.
c. Level 3. 22% to 38% of the respondents could do everything in (a) and (b) above, and in addition
could: (i) perform multiple-step operations; (ii) subtract a percent from an initial value; (iii) find a
proportion by combining operations in a money context; (iv) add 3 numbers after computing 2 of
them through multiplying by 10 or 2; (v) read time using clocks or in numeric form; (vi) interpret
qualitative or quantitative data from tables or price tags with percents, decimals and whole numbers;
and (vi) represent money and weight.
Country averages
For the four countries, most national averages were similar to one another in all three domains. Countries’
averages in each domain were in the Level 2 range. Few of the small differences between national averages
were statistically significant. Although different countries did slightly better in different domains, no
individual country stood out across all domains. However, a country’s averages do not describe the
distribution of skills that its citizens possess.
Each country will need to consider whether the distribution of skills across the three LAMP levels is
appropriate for its national literacy and numeracy goals. As noted previously, approximately a third of a
country’s adult citizens can perform the higher level skills assessed by LAMP. Is this level of performance
sufficient for a country to continue its current and future economic and social growth? This is a question
policymakers will need to discuss, especially as new technologies may become important for a country’s
development. New technology requires more skills in reading documents and working with quantitative
information (numeracy) than has been the case in the past.
Findings related to socio-demographic variables
LAMP results in the three domains were correlated with several socio-demographic variables:
Educational attainment. In all countries, average LAMP performance in all three domains is higher
for respondents with higher levels of education. In numeracy, significant percentages of those with
a primary education or less scored at LAMP Level 2 or higher in three of the four countries
participating.

19
LAMP: Implementation in Diverse Settings
Sex. Men scored higher than women in numeracy in all countries even when scores were adjusted
for levels of educational attainment. For prose reading, after taking educational attainment into
account, women generally had an advantage over men. In document reading, after taking
educational attainment into account, the men had an advantage over women.
Age. When the full range of age was plotted against LAMP scores, there was a downward curvilinear
relationship. In all four countries’ scores, on all domains, there tended to be a slight peak in
performance around age 35, then scores dropped as age increased.
Parents’ education. Participants with parents who attained post-secondary education scored
significantly higher than participants whose parents had lower educational attainment.
Parents’ occupation. Participants with parents in high-skilled occupations also scored higher in all
LAMP domains, even after adjusting scores for the participants’ own educational attainment. The
differences, however, were small.
Socio-economic status. Participants whose parents had the highest socio-economic status scored
higher than participants whose parents had the lowest socio-economic status, after adjusting the
scores for the participants’ own level of educational attainment.
Location. Participants from urban areas scored higher on average than participants from rural areas,
after taking into account the participants’ levels of educational attainment. However, after
adjustment the differences between urban and rural participants became very small.
Use of technology. Participants who used mobile phones had higher scores than participants who
relied solely on media broadcasts. In addition, those using computers had higher scores than those
using only mobile phones. This advantage for computer users persisted even after adjusting for
educational attainment – though the advantage in mean difference was much smaller after
adjustment.
Employment status. Participants who were employed had higher scores than unemployed
participants, even after taking into account educational attainment.
Occupational level. Participants with high-skilled occupations had higher LAMP scores, although this
advantage became very small after adjustment for educational attainment.
Use of skills at work. The more participants used their reading and numeracy skills in their work, the
higher were their LAMP scores. This advantage persisted in most countries when scores were
adjusted for education level of the participants although, here again, the advantage was not great.
Thus, LAMP scores are related to many socio-demographic variables but the relationships are generally less
strong after participants’ educational attainment levels are taken into account. Education seems to be the
key factor to attaining literacy and numeracy as measured by LAMP.
LAMP data suggest that policies aimed at increasing gender parity in the distribution of reading and
numeracy skills should go beyond school attendance. Those policies should also target increased
participation of both genders in the labour market and the use of skills both at work and for leisure.

20
LAMP: Implementation in Diverse Settings
As access to schooling approaches gender parity, female employment rates are still lagging behind those of
males.
As for literacy practices for leisure, they have the potential to help narrow the gap in the other two skills
domains. This type of use seems to be relatively gender-neutral as compared to the workplace. Policymakers
should find ways to foster it not only among females but also among older respondents and rural residents –
older rural women, in particular.
In-depth study of the language variable in Paraguay
The LAMP performance in Paraguay was studied in more detail, especially in relation to bilingualism. Native
Spanish-speakers outperformed other respondents by at least 50 points (half a standard deviation) in all
LAMP domains, before controlling for other factors. After introducing a number of control variables (sex,
age, location, parental occupation, maternal education, respondent’s years of schooling, literacy practices at
home and occupational skill demand), this advantage is substantially reduced (to 12-15 points) in Prose and
Document reading, and it ceases to be statistically significant in Numeracy.
This has some important implications. For those who have sufficient command of the Spanish language,
having a second mother tongue, which in most cases is Guarani, is associated with higher performance in at
least one domain (Document reading) or even two (Numeracy and Document reading). This is an important
finding as the advantage of having Spanish as a mother tongue may be wrongly perceived as a disadvantage
of having Guarani as a mother tongue. No such disadvantage is found in LAMP data. In fact, as mentioned
before, for those speaking Spanish well enough, speaking a second language at a similar level of proficiency
(whether this is Guarani or another language) is associated with higher performance in at least one domain.
Thus, the relationships between language and literacy are complex but certainly relevant for policy purposes
in the Paraguayan case. LAMP could be used to study other bilingual situations where more in-depth
information is relevant to policymaking.
Conclusions
All in all, LAMP demonstrated that measuring adults’ prose and document reading and numeracy with a
household-based assessment can be done well and that the results from several countries can be placed on
a common metric that allows comparison. The metric can be related to specific literacy and numeracy skills
so that scores on it can be interpreted by describing the distribution of a country’s adult population in
relation to their ability to perform these skills. The distribution of the population over each level of
competence in prose and document reading, and in numeracy may have more important implications for
policy and intervention programmes than simply the study of average results. For countries wishing to use
the LAMP approach, details can be found in a technical annex that is a companion to this report. It would
also be advisable to contact the UIS learning outcomes unit for more information and guidance.
21
LAMP: Implementation in Diverse Settings
Chapter 1. Introduction
Literacy is at the heart of the fundamental human right to education. Reading, writing and computing
are essential to enabling people to learn continuously throughout their lifespans; to exercise other
fundamental rights; to possess agency; to store, retrieve, and communicate information, ideas and
expectations; to be more productive; and to access a broader set of opportunities that are instantiated
in written form using specific languages and scripts. It is not only a right but a constituent of essential
freedoms.
Literacy is a manifold phenomenon that cuts across the lives of individuals, families, local communities
and nations. No statistical measure can encompass literacy and capture it in all its complexity. Thus, a
quantitative effort to capture literacy should aim at maximising the quality of the information
generated – in terms of both its usability and sound technical attributes – while making users fully
aware of its limitations.
1.1 Literacy Assessment and Monitoring Programme (LAMP)
The UNESCO Institute for Statistics (UIS) developed a quantitative methodology for assessing literacy
and numeracy with the cooperation of several countries over a period of six years (2006-2011). This
methodology, called the Literacy Assessment and Monitoring Programme (LAMP), is described in this
country summary report along with the results of its application in four countries: Jordan, Mongolia,
Palestine, and Paraguay. This report presents a look at literacy and numeracy through the LAMP lens.
Although it only manages to scratch the surface of this wealth of data, it aims to provide the lessons
that may be drawn to inform policy as the ultimate goal.
1.2 The scope of LAMP
In defining the scope of LAMP, the UIS identified key factors that would be amenable to statistical
treatment based on available tools, standards and techniques. The purpose was to maximise the
information that could be obtained from an educational assessment while focusing on some main
areas.
LAMP was developed to yield sound information on:
reading (prose and document) and numeracy skills of individuals
pre-reading skills of those who are “learning to read”1
individuals’ perceptions about their reading, writing and computing abilities
inequities in the distribution of skills across different subpopulations
literate environment and the sustainability of skills
associations between the different variables that LAMP measures.
1 The expression “learning to read” is generally used to refer to those individuals who have not yet
mastered reading competency.

22
LAMP: Implementation in Diverse Settings
The findings of LAMP shed light on core elements needed to manage written materials. In other words,
LAMP was created to yield information in three domains:2
Reading skills: expressed as the ability to decode various texts (i.e. continuous
phrases/paragraphs called ‘prose literacy’, and schematic texts, such as those included in
forms, maps or timetables, called ‘document literacy’).
Numeracy skills: expressed as the ability to perform basic arithmetic operations and
calculations.
Reading Components: Exploration of the elements that could explain low performance,
referred to as reading components. These are the basic operations involved in decoding and
understanding texts and numbers (i.e. alphanumerical perceptual knowledge – letter and
number recognition, word recognition, vocabulary, sentence processing and passage fluency).
Therefore, LAMP focuses on reading and leaves writing aside. Reliably testing reading skills is
demanding enough on respondents to the battery of instruments required. Including a module on
writing would only add complexity that might compromise the whole effort.
LAMP is implemented as a household assessment rather than a household survey. It is not a separate
module that can be attached to a household survey designed to collect other information. In typical
household surveys, households are sampled and information is gathered about the household on a
number of variables. In LAMP, households within a country are selected according to an appropriate
sampling plan, then a member of the household who is 15 years or older is selected at random and
LAMP is administered to that person to assess the person’s literacy and numeracy.
The procedures that the UIS has applied in the development of this assessment assure that LAMP is:
comparable across countries, languages and scripts (for reading and numeracy skills)
country-, language- and script-specific (for pre-reading skills)
country-specific (for socio-economic status and some other socio-demographic information).
On the other hand, LAMP does not assess or evaluate:
writing skills (although respondents use writing to answer reading and even numeracy items)
oral language skills (although respondents are required to use these skills in the assessment)
the effectiveness of literacy programmes or other educational programmes (although it
collects information regarding the enrolment of respondents in such programmes)
social or community practices that involve the use of written materials.
The fact that LAMP does not cover certain areas does not mean they are not relevant. Rather, the
LAMP approach was not suitable to address them or including them would have rendered the project
unfeasible by demanding too much from respondents and/or national teams.
The details on the construction and contents of the LAMP assessment are described later in this report.
2 Chapter 2 provides more complete descriptions of the domains mentioned here.

23
LAMP: Implementation in Diverse Settings
1.3 Why LAMP was developed
In particular, the assessment strives to address two major needs: i) to describe the actual distribution
of reading and numeracy skills of people within a country; and ii) to explore in detail the current level
of abilities of those at the lower end of the distribution scale.
The first need results from understanding literacy as a complex set of skills that exist over different
continua (reading, numeracy) which are not theoretically commensurate, and therefore, not
representable as a unique dimension. These trends became evident at the Sixth International
Conference on Adult Education (CONFINTEA VI) held in Belém do Pará, Brazil in 2009, where
participants agreed to the Belém Framework for Action, which states that: “we commit ourselves to …
ensuring that all surveys and data collection recognise literacy as a continuum… [and] investing in a
process to develop a set of comparable indicators for literacy as a continuum and for adult education”
(UNESCO, 2010b, p. 38 and 41). This view applies not only to assessment but also to instruction:
“Effective programmes approach literacy as a continuum, where learning is a continuous process both
within and outside educational settings, and throughout life” (UNESCO, 2013, p. 9). “In the case of the
International Adult Literacy Survey (IALS) and LAMP, the broad and multi-dimensional definition of
literacy was broken down into three domains: reading, writing and numeracy. Each can be seen as a
continuum of skills that can be further differentiated into sub-dimensions” (p.25).
Providing this type of information requires a particular variety of data collection – an education
assessment. Over the past years, some countries have employed different strategies to help improve
their understanding of literacy levels: adding questions to their population censuses or household
surveys, conducting specific studies, etc. Nevertheless, producing reliable information on reading and
numeracy skills entails paying attention to a complex set of elements that if overlooked can easily
compromise the validity and reliability of any measurement effort.
For instance, a straightforward approach could consist of asking respondents in a household survey
to read aloud a simple sentence and for the interviewer to provide a score using some specific rubric.
If the scoring rubric defines a correct response as any instance where the respondent is able to utter
a plausible pronunciation of the sentence, there would be a serious validity issue: sounding a sentence
shows the ability of a person to decode a text, and while decoding is a central ability underlying the
capacity to read, it is distinct from it. Reading entails grasping meaning and not just sounding written
words.
Furthermore, when testing different populations (within a single country or across countries), it is
reasonable to assume that they are not homogeneous in terms of their exposure to texts of different
nature. A ‘simple’ sentence about an everyday life situation will not be equally simple to everyone in
the target population, thus yielding information that will be biased. A single-sentence-test is not a
reliable test at all.
For reasons like those mentioned above, testing literacy skills cannot be accomplished just by adding
a few questions to an existing household survey. Further challenges appear when we attempt to
generate information that would be comparable across countries, languages and scripts.

24
LAMP: Implementation in Diverse Settings
The field of educational assessment has developed extensively over the past decades and as a result
of this process, standards have already been identified for the proper design and implementation of
such an enquiry. Postlethwaite (2004) summarised most of these elements. LAMP adheres to these
standards while applying and adjusting some of them since LAMP is not a school-based survey and
cannot be expected to function as one.
1.4 Commonality and differences between IALS/ALL and LAMP
The similarities and differences between IALS/ALL and LAMP are:
Institutional discourses and intentionality: LAMP and IALS/ALL are based on different
organizational settings. IALS and ALL were developed by the Organisation for Economic Co-
operation and Development (OECD) to address increasing concerns about competitiveness
and the importance of skill development in the current economy. LAMP does not preclude
economic emphases on skill development but is based on the broader set of foundations
provided by the principles, values and mandates of the UN system.
Cultural diversity: IALS and ALL were conducted primarily in OECD countries and exclusively in
European languages. The introduction of testing in other contexts poses several challenges
that IALS does not address. LAMP was developed with an awareness of these issues and
promotes the value of diversity. LAMP’s approach has to avoid any form of ethnocentrism,
which was less of an issue for international studies conducted in countries sharing basic
commonalities, such as those belonging to the Western world. While IALS and ALL were
conducted mainly in industrialised countries with European languages written in the Roman
alphabet, LAMP focuses on developing countries with a wider array of language families and
scripts.
Country ownership: Country ownership is a major concern for LAMP. The involvement of
UNESCO’s Member States is a key element to ensure diversity and an adequate institutional
support. It must be stressed that LAMP is not a private endeavour. UNESCO, as an international
civil service organization, is mandated to protect the public interest. Therefore, LAMP and all
of its components must be regarded as a public good. Of course, some elements must be kept
confidential to protect the integrity of the whole effort but this is inherent to testing and is not
a way of protecting a private interest.
Statistical evidence and the complexity of literacy: LAMP has been developed with the
understanding that statistical evidence can provide a significant input for policymaking but it
cannot be treated as the only evidence that matters. Literacy is a complex and manifold
phenomenon (e.g. Street, 1998; UNESCO, 2004) and while data can provide significant insight,
they are not necessarily sufficient to provide a detailed understanding. Therefore, other
approaches are welcome even if the UIS, given its specialization as a statistical agency, would
not be expected to play a role in them.
25
LAMP: Implementation in Diverse Settings
An international study design versus the need for the self-reliant and sustained production of
data: LAMP was conceived primarily as an attempt to enable countries to produce more robust
data on literacy in a sustainable and self-reliant manner. UNESCO has produced a number of
statistical tools over the past decades that countries have been using independently to build
and develop their own statistical systems in fields such as education. LAMP is one of those
tools. Thus, the ultimate goal of LAMP is not to produce an international report but to
contribute to the development of national capacities.
The universe of skills to be measured: LAMP shares with IALS/ALL a common approach to three
operationally defined domains for measuring literacy skills: prose, document and numeracy.
This is framed by two major factors: i) the robustness of defining those domains as central
elements for measurement; and ii) the need to have a common ground for comparisons. Thus,
LAMP shares with IALS/ALL the frameworks required to define what is measured. Both
measure the same domains in similar ways. At the same time, LAMP makes a sustained effort
to ensure that cultural and power-related issues are explicitly dealt with.
Reading components: In order to improve the potential benefits of LAMP data in policymaking,
the systematic observation of people’s abilities in relation to basic reading components was
introduced in the design. LAMP is the first international attempt to study these abilities in a
diversity of languages. This feature is unique to LAMP and differentiates it from any existing
international study. It makes the programme particularly valuable as it allows countries to
identify which skills negatively affect performance when they are lacking, thereby providing
critical information for designing policy interventions. The reading components module of
LAMP introduces a dimension that is strongly intertwined with the specificities of each
language and script used in the assessments. In addition to its own potential for the generation
of information, the reading components of LAMP are a reminder against ethnocentrism.
1.5 Foundation of LAMP methodological choices
The Belém Framework for Action presents the “key elements for understanding literacy today: (a) literacy
as a continuum; (b) sustainable literacy as a target; (c) literacy as an empowering tool that enables
participants to continue as lifelong learners; and (d) an enriched literate environment as essential
support for continuing education, training and skills development beyond basic literacy skills (UNESCO,
2010a, p. 6; UNESCO, 2013, p. 21). These four elements contribute to the methodological development
choices made by LAMP: (a) if literacy is conceived as a continuum, it must be assessed by using a
battery of items of varying levels of difficulty in order to reflect a wide range of ability (in each of the
three domains); (b) if literacy must be sustainable, background questions must probe the use of skills
at work and at home, which are deemed to contribute to skill maintenance; (c) if literacy enables
lifelong learning, assessments must also collect data on participation in formal, non-formal and
informal learning over a lifespan; and (d) if the literate environment is essential, assessments must
collect information on the availability of written materials both in the household and the community.
This report presents a first look at these four elements through the LAMP lens. Although it only
manages to scratch the surface of this wealth of data, it aims to provide an overview of future analytical
possibilities and the lessons that may be drawn to inform policy as the ultimate goal.

26
LAMP: Implementation in Diverse Settings
1.6 Organization of this report
This report describes the development of LAMP and presents the international results of administering
it within four countries: Jordan, Mongolia, Palestine and Paraguay. The report is organized into 10
chapters. Chapter 1 gives an overview of LAMP. It describes the scope of LAMP, why it was developed
and the methodological choices that were made during its development. Chapter 2 places LAMP in the
literacy and right to education framework. It describes the conceptual framework for literacy, why
developing literacy is so important and why it is necessary for a nation to monitor its progress in
developing literacy and numeracy for its citizens using an assessment like LAMP. Chapter 3 briefly
reviews earlier attempts to assess literacy and numeracy and how LAMP has extended the progress
others have made in this field. It describes the content of LAMP, how it is organised and how it is
administered to collect information about a nation’s literacy and numeracy rates. Chapter 4 discusses
the differences and similarities of LAMP and other indicators of literacy and numeracy. It describes
how LAMP differs from indicators of literacy rates and the limitations of using literacy rates instead of
directly assessing individuals’ literacy performance. It describes the limited role that LAMP might play
in evaluating literacy programmes. It explains the distinction between LAMP as a household-based
assessment of literacy and typical household surveys. Chapter 5 describes how LAMP was developed
and improved by field testing versions of LAMP in many countries. It describes what was learned from
field testing and how those lessons were applied to improve LAMP. Chapter 6 describes the literacy
and numeracy results obtained by applying LAMP to representative national samples of adult citizens
in four countries. Each country’s results are described and illustrated. Chapter 7 is a more fine-grained
look at LAMP’s results in the four countries. It presents the results from each country by
subpopulations. The LAMP assessment results for each country are then presented in relation to seven
socio-demographic variables that have a bearing on formulating a country’s literacy development
policies. Chapter 8 is an in-depth case study of using LAMP to assess bilingual literacy and numeracy
in Paraguay. Chapter 9 explains how the LAMP project had to develop an assessment component to
assess people who are not yet literate or numerate but have learned some components of literacy
upon which they can build additional skills. This is called the Reading Components assessment and
reaches down to lower skill levels of literacy that typical literacy assessments of adults cannot measure
very well. Chapter 10 summarises and draws some conclusions about the LAMP experience.

27
LAMP: Implementation in Diverse Settings
Chapter 2. Literacy and the right to education
This chapter provides the rationale for LAMP and situates the programme in the context of other
information available on the educational outcomes of adults. This section also focuses on the
importance of literacy and the need to find better ways to measure it. Literacy matters because it is
part of the right to education and because it is a correlate (and cause) of personal well-being outcomes.
2.1 What is literacy?
How does UNESCO define literacy? Over the years, UNESCO has made four key statements either
defining or characterising literacy – words marked in bold indicate the new elements introduced
explicitly by each statement (UIS, 2009, pp. 13-14):
a) A person is literate who can with understanding both read and write a short simple
statement on his [or her] everyday life (UNESCO, 1958);
b) A person is functionally literate who can engage in all those activities in which literacy is
required for effective functioning of his or her group and community and also for enabling
him [or her] to continue to use reading, writing and calculation for his [or her] own and the
community’s development (UNESCO, 1978);
c) Literacy is the ability to identify, understand, interpret, create, communicate and compute,
using printed and written materials associated with varying contexts. Literacy involves a
continuum of learning in enabling individuals to achieve their goals, to develop their
knowledge and potential, and to participate fully in their community and wider society (set in
2003 and published in UNESCO, 2004); and
d) Finally, the notion of "plurality of literacy" (2004) was advanced to stress the social
dimensions of literacy in relation to both acquisition and application. Therefore, literacy is seen
as comprising diverse practices embedded in socioeconomic, political, cultural and linguistic
contexts, acquired in school and outside of school. It also involves family and community
contexts; the media in various forms of technology; skills for further learning; and the world of
work and life in general. Thus, this concept of literacy emphasises the literacy challenge as
making societies literate and not simply as making individuals literate (UNESCO, 2004).
2.2 Literacy and the right to education
Within the more general framework of the right to education, UNESCO has consistently recognised
literacy’s special status as a gateway to further schooling, as well as the trigger of a number of other
skills. “Literacy, broadly conceived as the basic knowledge and skills needed by all in a rapidly changing
world, is a fundamental human right. In every society, literacy is a necessary skill in itself and one of
the foundations of other life skills” (UIE, 1997, p. 4).
UNESCO has also specifically recognised literacy as a right that applies to adult populations, not just
children: “Literacy is a right. It is implicit in the right to education. It is recognized as a right, explicitly

28
LAMP: Implementation in Diverse Settings
for both children and adults, in certain international conventions. It is included in key international
declarations” (UNESCO, 2006, p.136).
CONFINTEA linked literacy to “the learning continuum” that encompasses formal, non-formal and
informal learning: “Literacy is an indispensable foundation that enables young people and adults to
engage in learning opportunities at all stages of the learning continuum. The right to literacy is an
inherent part of the right to education. It is a prerequisite for the development of personal, social,
economic and political empowerment. Literacy is an essential means of building people's capabilities
to cope with the evolving challenges and complexities of life, culture, economy and society” (UNESCO,
2010, p. 38).
2.3 Literacy’s impact on people’s well-being
“Literacy is also a catalyst for participation in social, cultural, political and economic activities, and for
learning throughout life” (UIE, 1997, p. 4).
Mere observation shows that highly literate people tend to be richer, healthier and more socially and
politically influential than their less skilled peers. It is even more obvious that individuals with low
literacy skills are more likely to be poor, vulnerable and disenfranchised. However, this is what we call
‘correlational evidence’ – it does not prove that these differences in wealth and well-being are actually
an effect of skills. In fact, the role of reading and numeracy skills is difficult to disentangle from
schooling and its other possible benefits, such as the credentials, status and social capital that also
come with it.
This is particularly true of all the studies that, over the years, have simply used years of schooling (or
other measures of educational attainment) as a proxy for skills, instead of assessing them directly. If
successful, what most of these studies really demonstrate is that education and more specifically
schooling, but not necessarily skills, make a difference in people’s well-being.
Furthermore, participation in education is not equitable. It is associated with socio-demographic
factors that predate it, such as the socioeconomic status of an individual’s family of origin. As a result,
highly skilled people may be healthier (or happier or more engaged in society) not necessarily as a
result of their skills or even their education but of the fact that they were born into a wealthy or well-
connected family, which also happened to provide them with greater access to education. To sum up,
many studies that claim that skills have positive effects on an individual’s well-being fail to consider
alternative explanations. Of course, the point here is not to argue that skills do not have these positive
effects but demonstrating these effects requires ingenious approaches.
A systematic review of literature by DeWalt et al. (2004) confirms that low literacy, which is related to
weak knowledge on health and healthcare, is also associated with a range of adverse health outcomes,
such as a poorer health status, less access to medical screening and disease prevention as well as an
increased risk of hospitalisation. The effects of literacy on health also spread to other members of the
household, such as children, given that literacy proficient mothers make more effective use of
healthcare institutions by taking better advantage of the available advice and information on childcare
and health as well as being more inclined to report any treatment ineffectiveness in their children to
medical staff (Borooah, 2009).

29
LAMP: Implementation in Diverse Settings
Several studies also outline that an individual's labour market prospects are harmed by low levels of
literacy and numeracy, especially for those at the lower end of the proficiency scale (Robinson, 1998),
and that literacy and numeracy proficiency are positively correlated with earnings (Rivera-Batiz, 1992;
Green and Riddell, 2003; Ponczek and Rocha, 2011).
These more focused studies actually demonstrate that skills do have a direct impact on people’s quality
of life. This evidence should provide additional incentives for improvements in the quality of education
as it shows that the skills that people develop at school actually make a difference in their lives. This
cannot be attributed solely to family background, educational credentials or increased social capital
linked to schooling.
Recently, the Survey of Adult Skills, carried out as part of the Programme for the International
Assessment of Adult Competencies (PIAAC), found that adults (aged 16 years and over) (a) with low
literacy skills were twice as likely to be unemployed; (b) who were high-literacy workers had 60% higher
wages than lower-literacy workers; and (c) with low levels of literacy and numeracy had poorer health,
lower civic engagement and less trust in the government (OECD, 2013a). Countries with higher levels
of inequality in literacy and numeracy also had higher levels of inequality in income.
2.4 Summary
This chapter reviewed the history of the UNESCO definition of literacy and described how the definition
evolved. LAMP was developed on the basis of the latest UNESCO definition. The importance of
assessing and monitoring a nation’s literacy is based on the belief that literacy is a fundamental right
that can be developed through education. Literacy and numeracy are essential to people’s well-being
and to their ability to develop to the fullest. These ideas were reviewed in this chapter and represent
the underlying rationale for the development of LAMP.

30
LAMP: Implementation in Diverse Settings
Chapter 3. The three domains measured by LAMP
This chapter reviews how the evolution of the notion of literacy has had an impact on the ways in
which it has been assessed over the years. In terms of measurement, this section reviews previous
attempts to assess literacy and then presents an overview of the current approach, including the skill
domains assessed, the proposed performance levels and some sample items.
3.1 The impact of the evolution of literacy on the LAMP assessment
The evolution of UNESCO’s discourse on literacy described in Chapter 2 was accompanied by changes
in the way literacy was assessed at each stage:
1. Skill domains: In 1958, the concept of ‘literacy’ encompassed reading and writing. In 1978,
calculation became part of the concept. UNESCO’s 2003 statement appears to add a variety of sub-
skills (identify, interpret, create and communicate) but, for the first time, writing was not explicitly
mentioned. The 2004 UNESCO statement introduced the notion of “plurality of literacy” and with it,
potentially, a very wide array of skills.
2. Social scope: Between 1978 and 2003, successive statements expanded the focus from the
individual to his or her community and to the wider society.
3. Texts: In accordance with the individual-community-society expansion, the texts in which an
individual must demonstrate proficiency evolved from “a short simple statement on his [or her]
everyday life” in 1958 to “printed and written materials associated with varying contexts” in 2003.
4. Dichotomy versus continuum: The 1958 statement defined what it means to be literate and,
by contrast, illiterate; the similarly dichotomous definition from 1978 focused on who is functionally
literate or illiterate. The 2003 statement introduced the idea of a continuum, which can be interpreted
in two ways: (a) literacy enables individuals to participate in the learning continuum that includes
formal, non-formal and informal education, and (b) literacy itself should be measured on a continuum.
Finally, the notion of “plurality of literacy” from 2004 seems to go beyond the notion of a single
dimension continuum.
As mentioned previously, CONFINTEA also expressed a commitment to collecting data that recognised
that literacy was a continuum of ability and that this continuum should be represented in a way where
comparable data and indicators are developed based on the concept of a literacy continuum (UNESCO,
2010a).
This evolution of the concept of literacy by UNESCO over the years has huge implications for the
monitoring of literacy at the national and global levels. As a result, the UIS responded directly to a need
to operationalise the concept for LAMP, which would become UNESCO’s first foray into large-scale
assessment and monitoring of adult literacy skills. By the time LAMP was being developed, writing was
no longer included in the UNESCO conception of literacy so writing was not included in the scope of
LAMP’s operational definition. The omission of writing from the literacy concept was fortuitous seeing
as LAMP is a household-based assessment that would probably be unable to assess writing directly.

31
LAMP: Implementation in Diverse Settings
3.2 Earlier attempts to assess literacy through surveys
For several decades now, some population censuses or household surveys (e.g. labour, health or
demographic surveys) in a number of countries have included short statements or short passages for
respondents to read – often aloud and sometimes accompanied by one or more simple reading
comprehension questions. This practice was clearly informed by the 1958 definition and while it was
initially an improvement over the most widespread alternative at the time (self-report or report by the
head of the household or other informant), it fell short in light of the subsequent UNESCO literacy
conceptions, starting with the introduction of calculations in 1978 but particularly in 2003 with the call
to assess the ability to read a variety of texts that referred to a variety of contexts.
The limitations of using the method of reading a single statement or short passage as a reliable
indicator of literacy appear obvious in light of more recent conceptions of literacy. These limitations
include:
1. Unreliability: The small number of words to be read and questions to be answered led to
unreliable estimates of reading accuracy and comprehension, respectively.
2. Limited validity: The use of only one passage led to an extremely narrow definition of reading,
necessarily focused on one type of text (either narrative or expository).
3. Confounding reading with other skills: Occasionally, the use of widely known passages (e.g.
patriotic poems, excerpts from the constitution, etc.) led to validity problems since the test actually
measured general knowledge rather than reading skills. For instance, in one survey, a map of the
respondents’ country and surroundings was presented and respondents were asked to read the map
and name the neighbouring countries. Many may have known the answer without reading the map –
a skill they may or may not have had.
4. Limiting reading to decoding only: In some cases, the sentence or passage was not
accompanied by questions. As a result, ‘reading’ was operationally defined as the ability to decode and
utter the printed words presented on the page. This was clearly at odds even with the 1958 definition,
which emphasised the need to read ‘with understanding’.
5. Use of administrators untrained in reading assessment: The questions were administered as
part of a household survey by interviewers with no assessment experience. This should prompt us to
exercise caution when using these surveys as sources for the improvement of educational
programmes. Detailed scoring rubrics may not have been provided in order to ensure consistency in
the administration of these questions, which may have been treated as any other question on the
questionnaire.
These practices have not disappeared from some surveys. Even though they may have been an
improvement over self-reporting – although for the reasons detailed above, that too may be
debatable – one of their unintended consequences in the long run was that they created the illusion
of an actual assessment of reading and failed to list or provide an explanation of all the associated
limitations. As a result, in some cases this may have delayed – and may still continue to delay – the
introduction of more rigorous approaches that would be truly worthy of being called an assessment.

32
LAMP: Implementation in Diverse Settings
3.3 Introduction of better literacy assessments
Literacy assessment changed in the 1990s with the introduction of the International Adult Literacy
Survey (IALS) (Kirsch, 2001), which was in turn based on and named after the USA’s National Adult
Literacy Survey (NALS) (Kirsch et al., 1993). The IALS assessment was the comparative assessment of
adult literacy skills by using household-based samples.
LAMP and other similar assessments, such as IALS, Adult Literacy and Lifeskills Survey (ALL: OECD and
Statistics Canada, 2005), PIAAC (Programme for the International Assessment of Adult Competencies:
OECD, 2013a, 2013b, 2013c) and STEP (Skills toward Employment and Productivity: Valerio et al., 2014),
were based on the work of a number of specialists in a wide array of fields and share a number of
advantages over the one-paragraph approaches. These include:
1. Differentiation from general knowledge: The skill domains to be measured (e.g. reading and
numeracy) are clearly defined and differentiated from others, such as general knowledge. This is
necessary to ensure the validity of the results.
2. More representative of skill domains: Several stimuli of different types (narrative and
expository texts, charts, tables, etc.) are presented and a number of different questions involving
different tasks (literal and inferential comprehension, arithmetical operations, etc.) are demanded of
the respondent so as to cover as much as possible of each skill domain – within certain constraints,
such as the duration of the assessment. This thorough coverage of the wider scope of the domain of
assessment is also necessary to guarantee the validity of the measurement.
3. Improved reliability: Several items related to similar tasks and skills are presented. This
increases the reliability of the scores.
4. Quality assurance: A set of quality assurance procedures for assessments is implemented
along the entire process. These safeguards include: double scoring (two people independently scoring
the same answers) in order to minimise scorer bias; analysis of Differential Item Functioning (DIF) to
flag items that could be unfair to some groups; dimensionality analysis to confirm that the different
domains should be analysed separately instead of merged with each other; and many others.
Assessments like LAMP, however, can be more costly and operationally demanding. They may also be
unfeasible in the context of least developed countries, post-conflict situations or some displaced
populations. There is still hope, however, for worldwide high-quality assessment of literacy skills. As
we accumulate knowledge from various international assessments, we may be able to produce more
parsimonious and streamlined tests that will help monitor progress towards the achievement of adult
literacy goals on a global scale. Perhaps the optimal solution for a global monitoring tool lies
somewhere between those full-blown assessments and the one-paragraph or one-sentence
approaches.

33
LAMP: Implementation in Diverse Settings
3.4 Measures of reading and numeracy skills
LAMP, like IALS and ALL before it as well as PIAAC, focuses on reading and numeracy only because
there are operational difficulties associated with testing writing in a household-based assessment. This
section defines the three skill domains (Prose, Document and Numeracy), presents examples of items3
from each domain, describes the types of tasks that respondents at different levels of proficiency can
perform, and discusses the rationale for keeping the Prose and Document domains separate instead
of merging them into one Reading domain.
LAMP is the first international household-based assessment to test Reading Components, which are
also briefly described here.
i) Reading: Prose and Document
Unlike PIAAC and like IALS and ALL, LAMP makes a distinction between two types of reading skills:
prose and document. ‘Prose’ refers to the comprehension of continuous texts, typically organized in
paragraphs (see Box 3.1). ‘Document’ refers to the comprehension of discontinuous texts, typically not
organized in paragraphs, such as tables, graphs, schedules and forms (see Boxes 3.2 and 3.3).
There are advantages and disadvantages to preserving the distinction between these two domains.
Some experts4 contend that the skills needed to read those two types of texts are inherently different
and that both have to be learned. This means that the distinction is not just theoretically defensible
but it is also relevant for policy and instruction. Additionally, ample evidence shows that from a socio-
demographic point of view, there are some differences between these two domains. Gender is one of
the relevant factors here – in a wide array of school-based and household-based assessments, females
tend to outperform males in Prose while males do better in Document (OECD, 2002). Therefore, in
order to keep track of the gender gap in reading skills, it may be a good idea to keep these two domains
separate – at least in LAMP countries. In addition, the explicit teaching of ‘document’ reading skills may
be relatively recent in some of these countries’ educational curricula. This may produce “cohort
effects”, leading younger age groups to perform better in this specific domain. This type of information
may be very relevant for policy purposes. Furthermore, the UIS has conducted a validity study (see
Annex 1) to empirically answer this question using the data collected from the four countries. The
results support the claim to report reading skills in two separate domains (Prose and Document) rather
than one combined domain (Reading).
3 The examples presented here are items shared with LAMP by ALL, and already made public by
ALL. In the foreseeable future, it is possible that some of the items specifically developed for
LAMP by the participating countries will be made public as well, but a decision has yet to be made
regarding which ones. This is a delicate decision since once the contents of an item are disclosed,
it limits the possibilities for its future use. 4 Including John Strucker (Harvard Graduate School of Education) in a discussion held during the LAMP
Global Advisory Board (Montreal, 6-7 May 2010), as a result of which a validity study regarding the reporting of reading skills in two domains was conducted.

34
LAMP: Implementation in Diverse Settings
Box 3.1. Example of Prose Reading item: Medco Aspirin
MEDCO ASPIRIN 500
INDICATIONS: Headaches, muscle pains, rheumatic pains, toothaches, earaches. RELIEVES COMMON COLD SYMPTOMS.
DOSAGE: ORAL. 1 or 2 tablets every 6 hours, preferably accompanied by food, for not longer than 7 days. Store in a cool, dry place.
CAUTION: Do not use for gastritis or peptic ulcer. Do not use if taking anticoagulant drugs. Do not use for serious liver illness or bronchial asthma. If taken in large doses and for an extended period, may cause harm to kidneys. Before using this medication for chicken pox or influenza in children, consult with a doctor about Reyes Syndrome, a rare but serious illness. During lactation and pregnancy, consult with a doctor before using this product, especially in the last trimester of pregnancy. If symptoms persist, or in case of an accidental overdose, consult a doctor. Keep out of reach of children.
INGREDIENTS: Each tablet contains 500 mg acetylsalicylic acid. Excipient c.b.p. 1 tablet. Reg. No. 88246
Made in Canada by STERLING PRODUCTS, INC. 1600 Industrial Blvd., Montreal, Quebec H9J 3P1
Reprinted with permission
Question: What is the maximum number of days you should take this medicine?
Answer: Seven or 7
Note: This is a released item that originally appeared in IALS. It was one of the easiest prose literacy
tasks in IALS.
Source: Kirsch, 2001, p. 21.

35
LAMP: Implementation in Diverse Settings
Box 3.2. Example of a Document Reading item: Fireworks
<Fireworks in the Netherlands> <Victims of fireworks>
<In millions of US dollars> <Number of injuries>
. . . . .
31
. . .
. . .
. .
. . . .
28
. 1992
. . .
.
25
24
23
1991
22
.
20
1990 .
1989 .
1988 . .
1987 .
. . . .
1986
Question 1: 26. According to the charts, what was the value, in <US dollars>, of <fireworks> sold in the <Netherlands> in 1991?
Answer: ($)28 million [million is a required part of the answer]
Question 2: 27. Describe the relationship between sales of <fireworks> and <injuries due to fireworks>.
Answer: As sales increase so do injuries [Accept “they both went up” without requiring a causal relationship to be implied]
Note: These items are released items that first appeared in IALS. The items were of moderate
difficulty in IALS.
Source: Kirsch, 2001, p. 29.
What are the disadvantages of this separation between ‘Prose’ and ‘Document’? The main one is that
this approach requires separate test items for the assessment of each domain. It is also a problem
because as readers we often encounter texts that combine these two types of information. Examples
of these may be a newspaper or magazine article or even a textbook that combines text in paragraph
form (Prose) with tables and charts (Document), sometimes forcing the reader to integrate both
sources of information in order to make inferences about the meaning of this complex text as a whole.
0
200
400
600
800
1000
1200
83 84 85 86 87 88 89 90

36
LAMP: Implementation in Diverse Settings
Box 3.3. Example of a Document Reading item: Female teachers
FEW DUTCH WOMEN AT THE BLACKBOARD
There is a low percentage of women teachers in the Netherlands compared to other countries.
In most of the other countries, the majority of teachers are women. However, if we include the
figures for inspectors and school principals, the proportion shrinks considerably and women
are a minority elsewhere.
Luxem
bourg
Ital
y
Fra
nce
Irel
and
Unit
ed
Kin
gdom
Spai
n
Bel
giu
m
Gre
ece
Den
mar
k
Net
her
lands
Percentage of women teachers (kindergarten, elementary, and secondary)
Question 1: What is the percentage of women in the teaching profession in Greece?
Answer: Mentions ONE of the following: 51.2(%) or 51(%)
Question 2: In which country, other than the Netherlands, are women in the teaching profession in the minority?
Answer: Denmark
Note: This item is a released item that originally appeared in IALS. It was one of the easiest
document literacy items in that assessment.
Source: Kirsch, 2001, p. 28.
Perhaps in a future revision of LAMP, it may be possible to keep the domains separate but to include
some test stimuli that combine both types of information. These stimuli could be accompanied by a
combination of two types of items: several that assess each domain separately (either Prose or
Document) and a few others that focus on the ability to integrate information from both types of texts,
and that may contribute to the estimation of skills in both domains.

37
LAMP: Implementation in Diverse Settings
ii) Quantitative or numeracy skills?
While IALS had a ‘quantitative’ domain, ALL, LAMP and PIAAC assessed numeracy instead. What is the
difference? ‘Numeracy’ refers to mathematical operations performed with the possibility of written
support. In that regard, it is different from what some scholars call “oral quantitative skills”, colloquially
referred to as “mental calculations”, in that these do not include written support.
Numeracy is more likely to depend on the ability to read, especially when test items approach what
mathematics teachers call “word problems”. However, as shown in the following sample item, it is
possible to conceive of numeracy items where the linguistic information in the stimulus is kept to a
minimum (see Box 3.4). For example, the first part of the cognitive test is orally presented to the
respondents. However, after the first part, the respondent still has to read the question and provide
the answer in writing, either with words or numbers.
Box 3.4. Example of a Numeracy Reading item: Bottles
Question: In total, how many bottles are there in the two full cases?
Answer: 48
Note: This is a released item that appeared on the ALL test. It was an easy item on the numeracy
assessment.
Source: OECD and Statistics Canada, 2005, p. 298.

38
LAMP: Implementation in Diverse Settings
3.5 Performance level descriptions for Prose, Document and Numeracy domains
Each LAMP skill domain has been divided into three performance levels. The details of how this was
done are explained in Annex 2. Levels were established using a process that involved several steps.
Initially, a statistical criterion was applied and responses from four countries were pooled to estimate
participants’ abilities – the top 30% of respondents were labelled as Level 3; the bottom 30% as Level
1; the remaining 40% in the middle as Level 2. Next, the resulting groupings’ item responses were
analysed by subject matter experts in reading and numeracy who provided descriptions of what
respondents whose scores placed them into one of the groups could do. It is important to note that
these level designations are specific to LAMP. A level does not have the same meaning as the same
numbered level in another assessment (e.g. Level 1 in LAMP does not have the same meaning as Level
1 in PIAAC).
Table 3.1 presents, for each domain, the type of tasks that a respondent at each level would be able
to do.
3.6 The correlations between skill domains
It should not be assumed that performances on the three LAMP domains are unrelated. As shown in
Table 3.2, within each country, LAMP scores across the three different skill domains are correlated.
These correlations are:
highest between Prose and Document scores (0.84-0.92). This result is to be expected given that
both of these domains assess reading skills, albeit of different types of texts.
lowest between Prose and Numeracy scores (0.77-0.80). This is also plausible since these two
domains have the least overlap with each other in terms of the skills assessed. However, these
correlations are still rather high.
remarkably consistent across countries for Document and Numeracy scores (0.82-0.83), which are
also rather high.
All of these correlations are similar to those found in ALL between Prose, Document and Numeracy
and in PIAAC between literacy and numeracy (OECD, 2013a), as well as in other international learning
outcome assessments.

39
LAMP: Implementation in Diverse Settings
Table 3.1. Performance levels for the Prose, Document and Numeracy domains
Prose
Continuous texts, typically organized
in paragraphs
Document
Discontinuous texts (e.g. tables, graphs,
forms)
Numeracy
Mathematical operations with access to
written support5
LEVEL 1 At this level, individuals can identify
literal, concrete information in reading-to-
do passages (e.g. job vacancy notices,
product labels, and vaccination
information) or simple one-paragraph
passages, provided that i) language is
identical in passages and questions;
ii) only everyday colloquial vocabulary is
required; and iii) choices or distractors
are absent from the questions.
Respondents can produce answers that
require minimal action (e.g. circling,
underlining, copying a short fragment of
text).
Lowest level respondents with no Prose
reading skills are included here.
At this level, individuals can identify a single
piece of information in simple reading-to-do
or reading-to-learn documents (passages,
graphs or tables) provided that i) language is
mostly identical in stimuli materials and
questions; ii) only one or two variables are
included in the materials; and iii) only a few
choices or distractors are present in the
questions (although potentially these are
always present).
Lowest level respondents with no Document
reading skills are included here.
At this level, individuals can, when presented with
material communicating information in a familiar
context that offers easy access to quantitative
information because of its visual representation
and minimal text, answer explicit questions
requiring a one-step, simple operation; can add 3
whole numbers with 2-3 digits or with decimals in
a ‘money’ context; and can subtract 2 whole or
decimal numbers in a ‘money’ context. Questions
contain no choices or distractors.
Lowest level respondents with no Numeracy skills
are included here.
LEVEL 2 In addition to performing the skills in
Prose Reading Level 1, individuals at this
level can identify literal information in
reading-to-do or reading-to-learn
passages when the required information
appears in reading-to-do passages in a
brief, clearly marked section or in
reading-to-learn passages near the
beginning of the text; and when i)
language is not identical in passages and
questions; and ii) questions do not have
choices. Respondents can paraphrase,
understand more ‘academic’ language,
and write full-sentence answers.
In addition to performing the skills in
Document Reading Level 1, individuals at this
level can understand reading-to-learn graphs
or tables that include two or three variables
with descriptive labels, compare or contrast
numerical information or process, and
coordinate and match parallel information
(e.g. time and activity data in one table),
provided that language is mostly identical in
stimuli, and when questions have several
distractors.
In addition to performing the skills in Numeracy
Level 1, individuals at this level, when presented
with material communicating information in a
familiar context, can complete tasks involving
some fractions and decimals; can understand and
use some simple fractions such as one-half (½)
written with numbers or words; can demonstrate
some understanding of the meaning of decimal
numbers; and can multiply a decimal number and
a whole number.
LEVEL 3 In addition to performing the skills in
Prose Reading Levels 1 and 2, individuals
at this level can identify literal
information in longer, more challenging
reading-to-learn texts (1-10 paragraphs)
with linguistically dense passages or
when the required information is in the
middle or end of the passage, not the
beginning, and when questions may or
may not have choices or distractors.
In addition to performing the skills in
Document Reading Levels 1 and 2, individuals
at this level can understand complex
documents and integrate information from
complex sources (densely packed tables,
multiple graphs) in order to identify
numerical values, given a set criterion; fill out
complex forms by turning personal data into
categorical variables; and when language
differs in passages and questions or is
‘academic’ (e.g. value, rates).
In addition to performing the skills in Numeracy
Levels 1 and 2, individuals at this level, when
presented with complex tasks with several visual
representations and when asked explicit questions
that may or may not have choices or distractors,
can perform multiple-step operations that require
multiplication (maybe by repeated addition) and
then division (maybe by repeated subtraction); can
subtract a percent from an initial value; can find a
proportion by combining operations in a money
context (sometimes with decimals); can add 3
numbers (sometimes with decimals) after
computing 2 of them through multiplying by 10 or
2; can read time using clocks or in numeric form;
can interpret qualitative or quantitative data from
tables or price tags with percentages, decimals and
whole numbers; and can represent money and
weight (using appropriate measurement units).
5 Numeracy thus differs from oral quantitative skills or “mental calculations”. However, some
respondents may have performed the numeracy tasks without paper and pencil until the very
end, only reporting their final results in writing.

40
LAMP: Implementation in Diverse Settings
Table 3.2. Coefficients of correlation between Prose, Document and Numeracy
scores
Prose vs. Document Document vs. Numeracy Prose vs. Numeracy
Jordan 0.92 0.82 0.77
Mongolia 0.84 0.82 0.80
Palestine 0.90 0.83 0.80
Paraguay 0.87 0.82 0.77
Source: LAMP, 2010-2011.
Even though all of the correlations are relatively high, it is not possible to say that any of them are too
high. In other words, a correlation of 0.97 or more between two domains would call into question the
need to keep those domains separate unless there were very powerful substantive reasons for it.
These correlations that are high but not too high seem to confirm that these are three different
domains with some strong associations with one another rather than just two domains.
Scores from all three skill domains are, as we will see later, strongly correlated with the individual’s
level of schooling. However, after controlling for schooling, the correlations between domains persist
and remain remarkably high and consistent as shown in Table 3.3. The relationship between the three
skill domains is thus not entirely due to the educational attainment of respondents. Furthermore, the
same patterns observed before continue to apply here: correlations tend to be highest between Prose
and Document and lowest between Prose and Numeracy.
Table 3.3. Correlation between Prose, Document and Numeracy scores after
controlling for schooling
Prose vs. Document Document vs. Numeracy Prose vs. Numeracy
Jordan 0.84 0.70 0.61
Mongolia 0.75 0.73 0.69
Palestine 0.80 0.68 0.62
Paraguay 0.76 0.68 0.61
Source: LAMP, 2010-2011.

41
LAMP: Implementation in Diverse Settings
3.7 Reading Components and “Learning to Read”
LAMP introduced the ‘Reading Components’ items as an attempt to measure the pre-reading skills of
those respondents who would not be able to answer the Prose and Document questions due to limited
reading comprehension skills, limited writing skills or both but who were not totally lacking in any
reading-related skills. As a result, the Reading Components sections differ from Prose and Document
in two main ways. First, the former extends the range of assessed abilities downward to include so-
called precursors (i.e. letter naming and word recognition). Second, they prompt oral rather than
written answers from respondents. Although, in theory, the abilities tested by the Reading
Components lead to those tested in the Prose and Document booklets, the results from the Reading
Components, due to their format, cannot simply be put on the same scale as either the Prose or
Document domain. As such, the Reading Components will be analysed separately in Chapter 9.

42
LAMP: Implementation in Diverse Settings
Chapter 4. LAMP and other sources of information on literacy
This section situates the programme in the context of other information available on literacy rates,
evaluation of literacy as well as other educational programmes, and household surveys.
4.1 LAMP and literacy rates
One frequent misconception about LAMP is that it is a device to produce more accurate literacy rates.
This section explores the roles of literacy rates alongside comparative assessments of adult literacy
like LAMP.
i) How are literacy rates produced?
The Global Education Digest (GED) was the UIS’s annual compendium of education statistics, published
between 2003 and 2012. It published literacy rates since 2006. More recent statistics can be found in
the UIS Data Centre at http://data.uis.unesco.org. The GED glossary defines literacy as “the ability to
read and write, with understanding, a simple statement related to one’s daily life. It involves a
continuum of reading and writing skills, and often includes basic arithmetic skills (numeracy)” (UIS,
2006, p.179).
As for the indicator itself, literacy rates are defined as “The number of literate persons in a given age
group, expressed as a percentage of the total population in that age group” (UIS, 2006, p.183).
According to Literacy for Life: EFA Global Monitoring Report 2006, “in practice, experts determined an
individual’s literacy level by one of three methods:
1. Respondents reported their literacy level as part of a census questionnaire or survey
instrument (self-declaration).
2. Another individual – typically, the head of the household – reported on the literacy level of
household members (third-party assessment).
3. The number of years of schooling completed was used as a proxy measure to distinguish the
‘literate’ from the ‘non-literate’ (educational attainment proxy)” (UNESCO, 2006, p. 163).
The literacy rates disseminated by the UIS combine those three methods. Each has its own
shortcomings, which the UIS has documented: “For all the countries where census or household survey
data are used (nearly all), the estimates of literacy are likely to be over-estimates relative to what would
have been the results of a test” (Carr-Hill, 2008, p. 33).
The so-called ‘third-party assessment’ method seems to be at a further disadvantage, even compared
to self-declaration: “For some countries, there is also the problem of proxy responses by the head of
household which may well further inflate the estimates” (Carr-Hill, 2008, p. 33). Its impact is greater
among some groups: “There may be proxy responses from up to 30% of households, and these will
affect reported literacy and may exaggerate the rates for children, women and dependents” (Carr-Hill,
2008, p. 19).

43
LAMP: Implementation in Diverse Settings
Finally, when it comes to the educational attainment proxy, the UIS only uses it for a small number of
countries “to impute literacy rates for countries for which the regular “dichotomous” literacy data are
not available. …Data that are based on a proxy of educational attainment are used only for estimating
purposes and are not disseminated at the individual country or territory level” (UIS, 2008, p. 12).
“The vast majority of these [literacy] rates consist of estimates based on national censuses, household
surveys and educational attainment data. They combine several approaches to questioning (self-
reported or reported by someone else in the household), yielding information of limited reliability.
However, this method of measuring literacy ignores substantive conceptual developments over the
past 50 years, in particular the understanding of literacy as a continuum” (UNESCO, 2006, p. 33).
This notion also links literacy with the notions of life-long and life-wide learning, and with the need to
sustain all three through action that goes beyond a narrow definition of education policy: “Literacy is
a continuum, not a dichotomy. Learning and using literacy skills is a continuous, context-bound
process that takes place both within and outside explicitly educational settings and throughout life.
This understanding implies concerted development of cross-sectorial policy” (UNESCO, 2006, p. 35).
To sum up, literacy should be measured directly, on a continuum, and understood as a continuous
process throughout life.
ii) How are literacy rates used?
Literacy rates are widely used by international organizations, although a decline has been observed
recently, as exemplified by the United Nations Development Programme’s (UNDP’s) Human
Development Index (HDI). For the purpose of monitoring countries’ progress towards certain goals,
international organizations often use adult literacy rates either as a stand-alone indicator or as part of
composite indices. The youth literacy rate (for the population 15-24 years) was an official indicator for
Millennium Development Goal 2 on universal primary education (United Nations, 2015). Both the
youth and adult literacy rates (for the population 15 years and older) are among the thematic
indicators for Sustainable Development Goal 4 on education (UIS, 2016).
The best-known example was probably the pre-2011 HDI, which combined three dimensions: “a long
and healthy life”, measured by life expectancy at birth; “a decent standard of living”, measured by
Gross Domestic Product (GDP) per capita; and the ‘knowledge’ dimension, where the adult literacy rate
accounted for two thirds of its value (the remaining third was the combined gross enrolment ratio
across primary, secondary and tertiary education). For a hypothetical country looking to “move up” in
these rankings, increasing literacy rates may have appeared as a relatively fast, easy and inexpensive
way to do it – as compared to increasing life expectancy, school enrolment or GDP (see Box 4.1).
However, this misapprehension is based on a narrow understanding of what literacy really is, and on
an underestimation of the level of policy efforts that would be required to increase it in a sustainable
way. That said, literacy is clearly a worthy investment for any country.
Literacy rates are at a crossroads between two professional cultures. On the one hand, National
Statistical Offices may appreciate literacy rates because they provide a single numeric indicator
comparable, for instance, to the unemployment rate. On the other hand, education officers may be
sceptical about their usefulness in guiding policy; at the national or subnational level, some

44
LAMP: Implementation in Diverse Settings
policymakers and practitioners would admit their frustration at these rates, claiming that they are not
particularly helpful for their work.
Although literacy rates have been criticised because they normally do not stem from direct
assessments, they are a fast and affordable way of collecting socially relevant information about
literacy and thus remain useful for analysis and monitoring purposes, even if they may represent self-
perceptions rather than actual skills.
Box 4.1. Can illiteracy be eradicated?
For decades, maybe even centuries, the seemingly greater progress achieved in medicine and
public health has cast a long shadow on the comparatively meagre returns on education policy.
Never has this been more evident than in the late 1950s and early 1960s, when the World Health
Organization started a global campaign to eradicate smallpox, ending with an official declaration
of success in 1980. How was smallpox eradicated? By undertaking massive vaccination campaigns
that made it impossible for the pathogen to survive in enough quantities to cause an outbreak.
Smallpox was ‘eradicated’ in the word’s etymological sense: it was rooted out, its very cause
removed forever, wiped off the face of the Earth. This eradication through vaccination – the only
example of such an accomplishment so far – was so successful that the routine administration of
shots against smallpox has stopped, because it is no longer needed.
Not coincidentally, in 1964, UNESCO released its Declaration on Eradication of Illiteracy in the United
Nations Development Decade. The influence of the medical example was evident: “The magnitude
of the task that needs to be carried out if illiteracy is to be wiped out, is as vast as it is urgent”
(UNESCO, 1964).
However, even back in 1964, UNESCO was already aware that, even after ‘eradication’, and unlike
smallpox, illiteracy may have the ability to rise from its own ashes: “The eradication of mass
illiteracy and provision for the maintenance and widespread use of literacy should therefore be
treated in development plans as an essential complement of formal education as one of the
foundations of self-sustaining economic growth” (UNESCO, 1964). Why would it be necessary to
maintain and use literacy even after the eradication of illiteracy? Well, because illiteracy is not like
smallpox at all: being illiterate or literate is not a simple binary variable as literacy is a continuum
of skills; and the causes of the lack of literacy skills as well as the process of development and
maintenance of these skills are much more complex. There is no vaccine that can protect against
illiteracy. Literacy must be fostered through widespread lifelong exposure to (and ideally,
production of) written materials. Although the global need for initial literacy instruction is indeed
urgent, we should be sceptical of a quick fix to a problem that is inherently complex and that will
require a sustained effort from a number of stakeholders.

45
LAMP: Implementation in Diverse Settings
iii) LAMP is not a tool to produce literacy rates
There are several practical reasons why LAMP is not the most effective tool to produce literacy rates:
1. LAMP does not assess writing skills. Although LAMP items are open-ended, and therefore require a
modicum of writing, this is not enough to assess this skill. Why is there no writing test in LAMP? While
universally recognised as one of the pillars of literacy, this skill is generally absent from large-scale
assessments. It was omitted on grounds of practicality. Writing is difficult to assess: scoring hundreds
(or thousands) of essays can be costly, time-consuming and ultimately, unreliable. Also, this type of
test is difficult to administer in households (as opposed to schools) because writing requires the
respondent to be highly motivated and concentrated, which may not be a realistic expectation in this
setting.
2. LAMP tests skills in a few specific languages per country. Those may or may not be all the languages
used for reading in a given country. LAMP will provide an estimate for a person’s reading and numeracy
skills only in the language in which this person took the test, which may not be the language in which
this person is most skilled. For instance, in Paraguay, Spanish was the only language of assessment;
therefore, reading skills in other languages used (Guarani, Portuguese, etc.) were not assessed,
although examinees did provide a self-declaration on these skills.
3. In addition, the production of literacy rates is not consistent with the LAMP approach: “When literacy
is conceived as a continuum, there is no definite line between ‘literate’ and ‘non-literate’. Rather,
literacy becomes a kind of moving target. Therefore, the dichotomy reflected in the widespread use of
the terms ‘illiterates’ and ‘literates’ … creates a conceptual problem” (UNESCO, 2013, p. 25).
Meanwhile, “the evolving notion of literacy as a continuum has increased interest in the direct
measurement of skills levels in many countries” (UNESCO, 2013, p. 25).
4. Finally, conducting LAMP in order to produce literacy rates would not be efficient. If the purpose
was simply to obtain a rate (i.e. a one-dimensional, dichotomous measure), LAMP or any other similar
effort would not be the fastest or most affordable way to do this.
iv) Can LAMP replace literacy rates in international comparisons?
One of the main purposes of literacy rates is for comparison across countries and regions. This is
possible because literacy rates are available for most countries of the world – although it is debatable
whether literacy rates produced through different methods are comparable. By comparison, direct
assessments of reading skills are available for a relatively small number of countries. It remains to be
seen whether in the foreseeable future, full-blown direct assessment of skills will replace literacy rates
based on self-declaration or third-party assessment. The Incheon Declaration and Framework for Action
increases the focus on these skills and as a result, on this type of measurement (UNESCO, 2016).
“A number of challenges stem from these internationally adopted commitments as they seek to
measure literacy both as a continuum and through the use of comparable indicators. The requirement
to measure literacy skills levels as a continuum is incompatible with a clear line between ‘literate’ and
‘illiterate’ individuals. … This does not preclude the possibility of defining a threshold in each

46
LAMP: Implementation in Diverse Settings
continuum considered acceptable at one time. This threshold has to be specified in terms of the actual
skills and tasks an individual can perform, and can be revisited and redefined according to changing
needs and challenges” (UNESCO, 2013, p. 25).
v) Can LAMP help us understand literacy rates?
LAMP directly assesses each respondent’s prose, document and numeracy skills. In addition,
respondents also provide a self-report of four different skills: reading, writing, numeracy and oral
quantitative skills (sometimes called ‘mental calculations’). As a result, LAMP allows us to compare a
person’s self-assessment of a given skill – for instance numeracy – with results from the direct
assessment of that same skill. This will help us understand to what extent people overestimate (or
sometimes underestimate) their own skills in their self-declarations.
However, what we learn from LAMP alone about the relationship of self-estimates to the direct
assessment of literacy may not be generalizable to other methods and contexts. Why not? The LAMP
interview is not identical to a census or household survey. In a census, for instance, most respondents
know that their skills will not be tested. Therefore, when asked to declare their skills, they may be
inclined to inflate them because self-reporting of having high skills is socially desirable. In LAMP,
however, respondents know from the beginning that they will be tested so they may be humbler or
more realistic in their declarations. They may still have a tendency to overestimate their skills but this
will probably not be as pronounced as in the case of a census.
vi) Both LAMP and literacy rates have advantages
Literacy rates are simple, widespread and relatively fast and inexpensive to produce. However, as
compared to direct assessments, they can be less valid – due to social desirability bias, among many
other reasons – and more difficult to interpret since they are based on self-perceptions, which may be
affected by many factors. If they are based on simple one-sentence assessments as opposed to self-
reporting, their reliability is likely to be low because of the shortness of the reading sample – although
even a simple reading test is superior to self- or third-party-declaration of literacy skills. Most
importantly, their use for policy purposes may be limited since they do not provide enough
information on the specific skills that the population has or lacks.
Results from LAMP or other direct assessments of literacy skills will be more reliable and valid since
they measure the desired construct in a direct way through a battery of carefully designed and
fieldtested items. These assessments provide more useful inputs for policy design by describing
respondents’ skills along a developmental reading or numeracy continuum. For instance, in reading, a
developmental continuum may range from knowledge of the alphabet to making an inference after
reading a passage. In numeracy, a developmental continuum may range from knowing digits to being
able to solve a complex word problem that entails combining several arithmetical operations or
applying relatively complex concepts like calculating the ‘average’.
On the other hand, direct assessments may be costly, time-consuming and require an important
operational and technical capacity at the country level. Further efforts should be devoted to finding
ways to streamline these assessments in order to make them simpler, faster and less costly, without
compromising the validity, reliability and, most importantly, policy-relevance of their results.
47
LAMP: Implementation in Diverse Settings
4.2 Can LAMP be used to evaluate a literacy programme?
LAMP aims to take a snapshot of the stock of skills of a nation at a given point in time. As such, it differs
from programme evaluations in a number of ways.
The evaluation of an educational programme is a complex and delicate undertaking that may have
serious consequences on policy. Therefore, it requires an approach that takes into account many
different components of a programme, including inputs, processes, implementations, outputs and
outcomes. It should also measure the outcomes of interest several times – at least once before the
programme and once immediately after. This section shows that LAMP is not an appropriate
mechanism to evaluate a programme. Nevertheless, some parts of the LAMP instruments could be
used as part of the evaluation of a programme.
Are adult literacy programmes as effective as primary schools in teaching people to read? Results from
assessments like LAMP alone cannot answer that question. However, a related question could be
answered: can literacy programme graduates read as proficiently as primary school graduates? LAMP
may answer this question provided that the sample contains enough graduates from each
programme.
How are these two questions different? In trying to answer the first, one may compare the skills of
graduates from those two programmes and, based on any differences between them, draw the
conclusion that one is more effective than the other. This conclusion would be unjustified as other
factors may explain those differences. For instance, student profiles for the programmes may differ –
for instance, only one programme’s incoming students may come from rural areas or poor
households. As a result, judging the programmes’ effectiveness by looking only at their graduates’ skills
may not only be unfair but simply incorrect.
The second question (can literacy programme graduates read as proficiently as primary school
graduates?) is easier to answer. It suffices to compare the skills of the two groups without drawing any
unfounded conclusions as to why the differences arose. If a significant difference is found, however,
this does not necessarily reflect the programmes’ effectiveness. Is this information still useful for policy
purposes? Yes, because it still reflects the skill profiles of respondents who have graduated from
different programmes. As such, a country can make a broad prediction of the stock of skills by looking
at how many people graduate from each programme.
LAMP by itself cannot evaluate the impact of specific literacy or educational programmes. It provides
a snapshot of the distribution of literacy skills among all adults. Thorough programme evaluation
entails more than outcomes assessment. It also collects data on inputs and processes: curricula are
reviewed, instructional materials examined, classroom interactions observed and the degree of
implementation of a programme is assessed.

48
LAMP: Implementation in Diverse Settings
LAMP is not a curriculum-based assessment. Instead, it focuses on skills deemed useful for everyday
life, whether they are explicitly featured in educational curricula or not. Conversely, when educational
programmes are evaluated, tests are aligned with curricula in order to assess whether the curricula
have been taught. Could LAMP be curriculum-based? No. As an international assessment targeting
both unschooled and schooled adults with varying levels of educational attainment, it should not be
aligned to a specific curriculum.
LAMP is cross-sectional so each person is tested only once. Programme evaluations, on the other hand,
should be longitudinal, preferably panels, where the same individuals are tested repeatedly. Panels
include a pre-test (before the programme starts) and a post-test (as the programme ends), and often
a maintenance test to ensure that the new skills are sustainable. Should LAMP be a panel? In a
household-based assessment, it is extremely difficult to follow up on a specific sample of individuals
over time.
LAMP is correlational (as opposed to experimental): LAMP collects information without manipulating
any variables. Programme evaluations, on the other hand, should ideally follow a controlled design.
This ensures that the observed increases in skills are indeed a result of the programme. Whenever
possible, programme evaluations should:
1. Collect data for both an experimental group (which receives the intervention that is being
evaluated) and a comparison group (which either does not receive the intervention at all
or receives it at a later date).
2. Randomly assign individuals to the experimental and comparison groups.
All this allows evaluators to be reasonably certain that the changes observed can indeed be attributed
to the programme. On the other hand, this raises ethical and operational challenges. Moreover,
experiments also tend to be very costly, which limits the size of the samples used. That, in turn, may
raise questions about whether their results can be generalised to the overall population. Assessments
like LAMP can be administered among much larger samples, which increases their ability to describe
the skills of the population at large. However, experiments are much more powerful in their ability to
explain and predict, and to evaluate the effectiveness of specific interventions.
As a result, a combination of household-based assessments like LAMP that reach wide samples and
controlled programme evaluations (based around literacy centres, for instance) using smaller samples
may be an approach that succeeds in both describing the skills of the population and finding ways to
foster them. Some LAMP instruments could potentially be used across both instances.
4.3 LAMP is not a household survey
LAMP is an assessment. This means that rather than just collecting information on individuals or
households, it tests individuals’ skills under conditions that are intended to be as standardised as
possible to prevent procedural inconsistencies from affecting the results. Although household surveys
should also be standardised, the importance of this issue is far greater in the field of assessments.

49
LAMP: Implementation in Diverse Settings
To reduce inconsistencies and bias in data collection, interviewers should be well trained in the
following implementation process:
1. Selection of the respondent within the household must be done according to precise
randomisation procedures. Interviewers should be prepared to explain these procedures in simple
terms. They should anticipate resistance from household members (especially the head of the
household) who may object to a particular respondent having been selected, especially when the
latter was female, elderly, unschooled, disabled or anyone other than the head of the household.
2. Scoring should receive special attention, particularly when field scoring is used to allocate
respondents to different booklets, since it is a skill that most survey interviewers do not master.
Scoring rubrics should be detailed and training on this topic should be extensive, especially in
assessments with an oral component. Interviewers scoring consistency should be monitored and
improved until she or he reaches the appropriate level of competencies.
3. Confidentiality of the content of cognitive test items is crucial in order to guarantee that it will be
possible to use them in subsequent cycles of the assessments. This normally does not apply to
questions in a household survey.
4. Presence of third parties during the interview should be curtailed whenever possible to avoid
interference and because it would be embarrassing for respondents if their shortcomings were
revealed to other household members or even to their neighbours. In this regard, assessments
should ideally be treated in a similar way as surveys focusing on sensitive topics such as sexual
practices or substance use. In practice, however, this may be unfeasible, especially in rural areas.
Also, in its current form and due to its length and complexity, LAMP cannot be attached to a household
survey as a ‘module’ on literacy. However, lessons learnt from LAMP may be used as the basis for the
development of such a module if demand for it exists, and if certain special procedures are put in
place to guarantee its correct administration. Although LAMP is not a household survey and its
assessment components could not simply be attached to one, data from LAMP and from existing
household surveys can be used in conjunction in order to maximise the usefulness of their results.
Having established the difference between household surveys and assessments, such as LAMP, it is
now worth mentioning one issue of particular importance that is equally critical to both of them:
‘Non-responses’ at the household and individual level should be carefully monitored by keeping track
of the profile of non-respondents in terms of gender, age, schooling and relationship to the head of
the household. They should also be minimised by conducting media campaigns and liaising with local
authorities or community leaders in advance of the field operation as well as using a battery of
interviewing techniques and even providing material incentives to respondents or households in order
to encourage their participation. Non-response rates should be calculated, used for weighting the data
prior to analysis and disclosed when reporting assessment results (e.g. Pike, 2007). Protocols for
substitution by other respondents – in the case of LAMP, from a different household – and for adjusting
for non-response, need to be explicitly developed and used.
50
LAMP: Implementation in Diverse Settings
Chapter 5. The overall process of design, development and implementation of
LAMP
5.1 Landmarks in the initial design of LAMP: 2003-2006
This section presents certain landmarks in the process of designing the LAMP instruments and field
procedures. It is based on discussions held during a number of international workshops where experts
from the participating countries 6 , cooperating countries, international agencies and consulting
organizations7 discussed the design of these instruments and field procedures, and gradually achieved
consensus on most of them while occasionally agreeing to disagree on others. It also documents how
some early concerns from countries would prove to be justified later in the implementation process.
This issue will be revisited in Section 5.2 since it is one of the main contributions that LAMP can make
to the field of international assessment in general, and in developing countries in particular.
The participants in the various workshops held during this first phase raised several important issues
that were addressed:
Test framework and item distribution. Country participants expressed concern over both the
project design and literacy frameworks presented. In particular, they were concerned that the
existing prose, document and numeracy (PDN) frameworks did not adequately take local
contexts into account. Consequently, they felt that the existing PDN items did not represent a
wide enough distribution of difficulty, especially at the lower end of the literacy scales and
would not work well in their countries without adaptations beyond those permitted in the
translation and adaptation guidelines. They also felt that the spread of numeracy items was
too narrow, measuring principally one aspect of numeracy – the notion of percentage.
Item development, background questionnaire and sampling. It was agreed with countries that
there would be four types of items in LAMP:
1. International PDN items (common to all LAMP countries) drawn from previous
surveys (IALS and ALL) and used to establish the link to the LAMP items.
2. Common PDN items developed by LAMP countries to compare results across them.
3. National PDN items specific to each country.
4. Reading Components (RC) items 8 , which would be specific to each country and
language.
Countries proposed reviewing the breakdown of PDN items by category, increasing the proportion of
LAMP common and national items; and creating a template to homogenize item construction. The
PDN items and associated issues discussed were:
6 El Salvador, Kenya, Mongolia, Morocco, Niger and Palestine participated in LAMP international
workshops in the first phase of the project. 7 Educational Testing Service (ETS), Statistics Canada, OECD and World Bank. 8 For a detailed description of the Reading Components instruments, see Chapter 9.

51
LAMP: Implementation in Diverse Settings
Sampling. The issue of cost and operational challenges in those countries that might conduct
literacy assessment in more than one language was raised. However, only one country (Niger)
conducted literacy assessments in more than one language (see Table 5.1). Only two of the
language groups (French and Hausa) had sufficient response rates to be useful for collecting
field test data. A follow-up determined that the other languages did not have an extensive
written literature. Even those who spoke these languages well often did not recognise the
written version of the words whose meanings they knew well.
A further issue about sampling that was raised was that the selection of only one respondent
per household may create difficult situations between household members and the
interviewer. The LAMP staff did not systematically document whether such issues arose during
the administration of the assessment (see Maddox, 2014 for some observations on this matter
in Mongolia).
Background Questionnaire. The contents of the Background Questionnaire were unanimously
approved in February 2005.
Reading Components. Decisions were made to allow each country to produce its own word
recognition lists and to make the decoding exercises optional. The sentence processing items,
on the other hand, would be common. Countries expressed concern about ‘absurd’ items (e.g.
“rain comes from the ground” and “a circle is square”). The sentence processing items were
designed so that a respondent would not need any special knowledge to decide whether the
sentence was true or false once it was read. As a result, some of the items were tautological
and obviously true if one could read the sentence. Similarly, the false items were obviously
false once read and may appear to be nonsensical.
Implementation delays and other issues. Countries raised concerns about delays in
implementation, which affected motivation at the country level; the need for capacity building,
technology transfer and technical support; financial support; sensitivity to countries’ issues;
and also process issues, such as communication and transparency. Towards the end of this
first phase, Kenya dropped out of the programme, citing the delays in the implementation
process as the reason for its decision. The country would go on to conduct its own survey, the
Kenya National Adult Literacy Survey (KNALS) and kindly acknowledged LAMP as a source of
inspiration for its methodology.
The introduction of this methodology in a new set of countries with marked cultural differences – as
compared to the IALS countries but also among each other – posed a number of challenges. Some
were unexpected but others were foreseen by the national teams and the UIS’s technical partner
(Educational Testing Service). The lessons to be learnt here are very simple: to pay attention to the
opinion of the national experts and to negotiate between participating countries and the technical
partner since they both have a unique understanding of the issues that may arise during
implementation.

52
LAMP: Implementation in Diverse Settings
5.2 The field test and improvement process: 2006-2010
The process of field testing the instruments and procedures was used to improve their quality and
adjust them to the contexts in which they would be used (see Table 5.1). Out of the eight field tests that
were conducted during this period, six were observed directly (the two exceptions being Jordan and
Palestine) by one or more members of the LAMP team in Montreal, who accompanied interviewers
and supervisors into the respondents’ households in a wide array of urban and rural locations,
including the Gobi Desert in Mongolia and the Sahel in Niger. This provided the UIS staff opportunities
to:
(i) Support the training of interviewers, supervisors, scorers and data entry personnel
(ii) Observe the instruments and procedures at work in the field with a view to adjusting
them according to a country’s cultural difference, yet to remain within the framework
to maintain consistency and comparability among participating countries
(iii) Collect qualitative data to inform the analysis (e.g. in Reading Components)
(iv) Deliver feedback to the national team on the quality of their field procedures
(v) Learn as much as possible about respondents’ languages, scripts, cultures and
environments.
Table 5.1. Countries that participated in the field testing
Country Data collection Languages (scripts) Number of cases
Palestine Sept. – Dec. 2006 Arabic (Arabic) 565
Morocco July 2007 Arabic (Arabic) 647
Mongolia Dec. 2007 Mongolian (Cyrillic) 567
Niger Mar. – Apr. 2008 French, Fulfulde, Hausa, Kanuri,
Tamasheq, Zarma (Roman)
2,093
El Salvador Nov. – Dec. 2008 Spanish (Roman) 559
Viet Nam Dec. 2009 – Jan. 2010 Vietnamese (Roman) 622
Jordan Feb. 2010 Arabic (Arabic) 509
Paraguay Mar. – Apr. 2010 Spanish (Roman) 622
Note: Afghanistan and Lao PDR are not included here as field testing was performed after 2010 in
these countries.

53
LAMP: Implementation in Diverse Settings
i) The language scope of LAMP: Languages, families and scripts
While IALS and ALL had confined themselves to European languages written in the Roman alphabet,
LAMP broke a number of barriers from the start. Between 2006 and 2014, it was field tested in ten
countries in a combined total of 13 languages that belong to seven different families (see Table 5.2).
Reading of those languages was assessed in four different scripts: two alphabets (Cyrillic and
Roman); one consonantal alphabet or abjad (Arabic); and one alphasyllabary or abugida (People’s
Democratic Republic of Lao).
Table 5.2. Languages and scripts that were fieldtested to develop LAMP
Families Languages Scripts
Arabic Cyrillic Lao Roman
Afro-Asiatic
Arabic
Jordan,
Morocco,
Palestine
Hausa Niger
Tamasheq Niger
Altaic Mongolian Mongolia
Austro-Asiatic Vietnamese Viet Nam
Indo-European
Dari Afghanistan
French Niger
Pashto Afghanistan
Spanish El Salvador,
Paraguay
Niger-Congo Fulfulde Niger
Nilo-Saharan Kanuri Niger
Zarma Niger
Tai Kadai Lao Lao PDR
This diversity of languages posed a number of challenges. For instance, Nilo-Saharan languages
(Kanuri and Zarma of Niger) and Mongolian – which belongs to the unrelated Altaic family – all share
one common trait: in a sentence, the object precedes the verb. However, in English, French and
Spanish, it is usually the other way around. This was one of the reasons why a forced-choice cloze of
the type “He visited the (city/book)”, where the respondent has to choose the object based on the verb
that precedes it (based on the English word order), could not be used in those countries as part of the
Passage Fluency exercise. This was one of several factors that led to a thorough reformulation of that
task, which was transformed into a series of conventional passages, each followed by six traditional
comprehension questions.

54
LAMP: Implementation in Diverse Settings
Script diversity also presented some challenges. Although readers of the Roman alphabet are often
puzzled by the fact that Arabic is read from right to left, that feature does not pose any actual issues
for the comparative analysis of reading across scripts. However, Arabic is also a consonantal alphabet.
This means that the so-called ‘short’ vowels can be omitted. This does not normally pose problems in
everyday reading situations, where the proficient reader can rely on the context to disambiguate the
meaning of the word. However, in Word Recognition exercises where each word is presented in
isolation, there is room for ambiguity. There are several possible strategies to deal with this issue but
a consensus has yet to be reached on which would be the most appropriate one.
Since the Mongolian language puts the verb before subject, items that were in the cloze format in the
Reading Components were replaced by open-ended questions for reading comprehension in the last
two sections of Reading Components. These sections were re-formatted from cloze-format to open-
ended reading comprehension.
In Arabic, there is no upper and lower case so in Reading Components for Arabic countries (Palestine
and Jordan), only one section is used: letter naming. This only applies to Arabic-speaking countries.
There were two items (the content of which referenced bicycle frames) from IALS by ETS that were
used as common items in the PDN booklets (they appeared in Books 1 and 2). These two items were
removed from the assessments of all countries since respondents were consistently misinterpreting
them across all countries (as per the feedback from countries).
ii) Lessons learned from the field test and the resulting changes made
The following are some of the important changes made to the LAMP assessment as a result of the field
testing:
Learned from Morocco. The field observation in Morocco revealed how diglossia would impact
the assessment of Reading Components and how contact between Arabic (the language of
assessment) and other languages would affect, for instance, the Digit Naming, Letter Naming
and Oral Vocabulary tasks (e.g. through the use of Berber, French and Spanish names for some
numbers, letters and objects, respectively).
Learned from Mongolia. The field test operation in Mongolia was accompanied by an
ethnographer, Bryan Maddox, from the University of East Anglia, who has since written about
the experience (Maddox, 2014). His observations shed light on the implementation of LAMP.
Learned from Niger. The field observation in Niger, conducted in six different languages
(French, Fulfulde, Hausa, Kanuri, Tamasheq and Zarma) from four different families (Afro-
Asiatic, Indo-European, Niger-Congo and Nilo-Saharan) proved to be one of the richest in
lessons learnt. It ultimately led to substantial changes in the structure of the Sentence
Processing and Passage Fluency exercises for all countries. For the Sentence Processing
exercise, it led to a substantive reduction in the number of sentences as well as a small
reduction in the proportion of false sentences. For the Passage Fluency exercise, it led to its
transformation from a forced-choice cloze to a traditional passage with reading
comprehension questions. The field test also found that, as expected by authorities in Niger,
some respondents of these languages sometimes wrote them down by using the Arabic script,
called ajami meaning “foreign”.

55
LAMP: Implementation in Diverse Settings
Learned from Paraguay. By March 2010, when the field test was conducted in Paraguay, the
order of the Reading Components exercises had changed based on input from previous
observations. This field test offered the opportunity to confirm the advantages of the updated
order before moving on to the round of main assessments. It also added more evidence that
led to the reform of the Passage Fluency task. Finally, it offered an opportunity to witness the
assessment at work in a pervasively bilingual (Spanish-Guarani) environment.
By the end of this process, field procedures were streamlined and fine-tuned, and several instruments
had undergone significant improvements:
A few PDN items were dropped and several others were modified.
The Reading Components were reordered with some sections streamlined (in particular
Sentence Processing), while others were reformulated (Oral Vocabulary and Passage Fluency).
The Respondent Booklet disappeared as parts of it were merged with other tools.
The Background Questionnaire underwent important changes.
The Enumeration Area Information sheet was added to provide background information on
the immediate environment of the respondents.
A Supervisor Daily Report form was created to monitor the data collection activities and to
track non-responses in particular.
In addition, data from the field tests were used for another important purpose: to identify suitable cut-
scores to match low- and high-literate individuals to the booklet with the appropriate difficulty level.
This process is used to reduce assessment time yet provide sufficient accuracy in the estimation of
their competencies. In the main assessments, respondents were allocated to either a low-difficulty
(Module A) or high-difficulty (Module B) form of the test. The decision to allocate a given individual to
a given module was based on his or her score in the first test instrument, the so-called ‘filter’, which
contained 17 items. The decision to set the cut-off score for the filter equal to 8 (the minimum score
required for allocation to Module B) was made by analysing field test data and incorporating input
from subject matter experts.
Last but certainly not least, our new understanding of the participating countries gave us a fresh
perspective on the data.
5.3 The final design of LAMP
LAMP uses a battery of instruments (see Figure 5.1) that includes:
The Background Questionnaire. This instrument, which is administered first, gathers
information about the respondent and his or her family and settings; his or her educational
attainment and experience; the language learned and spoken; his or her self-reported literacy;
his or her literacy and numeracy practices at work and outside work; and his or her main
economic activity and that of his or her parents or guardians. This instrument is a key element
to gain a meaningful understanding of the social, demographic and economic background of
the respondent that may contribute to shaping his or her skills.

56
LAMP: Implementation in Diverse Settings
The filter test. The filter test is administered after the Background Questionnaire. This is a
booklet with 17 items that establish whether the respondent likely possesses lower or higher
levels of literacy skills. It helps in deciding what sort of instruments should be used to gain a
more in-depth picture of the respondent's skills. The score from the filter test determines
whether the respondent will take the module for those with lower performance (Module A) or
the module for those with higher performance (Module B). All respondents that score less than
8 are assigned to Module A while all those who score 8 points or higher are assigned to Module
B.
Module A for those with lower performance. This module is composed of two instruments.
One instrument, the locator test, supplements the information produced by the filter test with
more detail and establishes more precisely where the respondent stands in relation to the
lower skill levels. It includes Prose, Document and Numeracy items. The other instrument, the
Reading Components, enables an in-depth exploration of the elements that might be
preventing the respondent from achieving a better performance.
The Reading Components. This instrument is part of Module A and is administered to those
with lower literacy skills. It is aimed to collect in-depth information on a reader’s ability and
efficiency in processing the elements of the written language – letters/characters, words (and
non-words), sentences and larger, continuous text segments. It also provides a measure of
basic oral vocabulary and of speed of response. Each country that implemented LAMP
developed a set of component measures unique to its language, script and culture based on
the guidelines specified in the Reading Components framework (UIS, 2009).
Module B for those with higher performance. This module is one test but there are two
versions (Booklet 1 and Booklet 2). The respondent is randomly assigned to Booklet 1 or
Booklet 2. Both include Prose, Document and Numeracy items that supplement the
information produced by the filter test with more detail and establish more precisely where
the respondent stands in relation to the higher skill levels.
5.4 Countries implementing and collecting data for the main assessment: 2010-2011
The data collection for the group of four countries in the main assessment took place between
November 2010 and October 2011. Prior to the field operations, instruments and procedures went
through an extensive review, which benefitted from the experience of conducting the field test in these
countries as well as four others who did not go forth with the main assessment.
Field procedures were also fine-tuned as a result of the validation process. As mentioned in the
previous section, a cut-off was determined for assigning respondents to test modules based on filter
test scores.
Four countries implemented the LAMP main assessment: Jordan, Mongolia, Palestine and Paraguay.
The countries’ sample sizes were between 2,666 and 4,666 cases (see Table 5.3). Response rates were
high – in fact, they were above average rates compared to other international assessments of adult
literacy skills (OECD, 2013a; 2013b). The demographics of the participating countries are described in
the following paragraphs.

57
LAMP: Implementation in Diverse Settings
Figure 5.1. The instruments comprising LAMP
Table 5.3. Countries, implementing partners and sample sizes for the main
assessment
Country Implementing partners Sample size Completed
Jordan National Centre for Human Resources Development
(NCHRD), Department of Statistics (DOS), Ministry of
Education (MoE)
2,666 November 2010
Mongolia Ministry of Education, Culture and Sciences of
Mongolia (MECS); Institute of Education 4,000 November 2010
Palestine Palestinian Central Bureau of Statistics (PCBS) 3,630 July 2011
Paraguay Ministry of Education and Culture (MEC), Organization
of Ibero-American States (OEI), General Direction for
Statistics and Censuses (DGEEC)
4,666 October 2011
Sampling implemented in country
In each country, respondents were selected on the basis of a set of criteria to ensure representative
samples. A country went through at least three stages of sampling: The first stage involved selecting
enumeration areas (clusters) from the national master sample. The second stage involved the
systematic sampling of households from a list of all households from the selected enumeration areas.
The third stage involved randomly selecting an individual aged 15 years or over within a household.
All members of the household selected were eligible for inclusion in the sample but only one eligible
member from each household was selected.
Background Questionnaire
(social and demographic
variables)
Filter
(17 PDN items)
Score ≤ 7Module A (locator)
Reading Component
Score ≥ 8
Module B (randomly
assign Booklet 1 or Booklet 2)
Booket 1 (PDN items)
Booklet 2 (PDN items)

58
LAMP: Implementation in Diverse Settings
Jordan
Demographics. The Hashemite Kingdom of Jordan is a small country of 89,342 km2 in the
Middle East, bound by Syria, Iraq, Saudi Arabia, Israel and the Palestinian West Bank. The
population reached 6,455,000 inhabitants by mid-July 2010. Jordan has a young population
with 35.1% of residents younger than age 15 years and only 3.4% aged 65 years or over, with
a median age of 22.5 years (United Nations Department of Economic and Social Affairs,
Population Division, 2013b). The Jordanian population is highly urbanised with approximately
78% of Jordanians living in urban localities (Department of Statistics, 2004) with this percentage
having continuously increased for two decades (United Nations Department of Economic and
Social Affairs, Population Division, 2013b.)
Economy. The Jordanian economy mostly relies on its service sector – mainly tourism,
transport and communication as well as finance and banking. This sector provides jobs to
79.2% of the employed population. In 2011, male participation in the labour force was
recorded at 67.1% -- more than four times the participation of females, which has increased in
the past decades but remains low at 15.6%. Jordan has one of the lowest employment-to-
population ratios in the world at 37%9 (World Bank, 2014). The poverty rate stood at 14.9% in
2010 (World Bank, 2014). Jordan ranks 95th on the Human Development Index (HDI) and its
value of 0.698 means the country falls under the “medium human development category”
(United Nations Development Programme, 2011).
Education. Basic education in Jordan consists of two compulsory cycles – six years of primary
and four years of lower secondary schooling. In 2011, Jordan reported a net secondary
enrolment rate10 of 87.9%, a mean years of schooling11 of 9.9, and a school-life expectancy12
of 13.2 years (UIS, 2014b).
Mongolia
Demographics. Mongolia is an Eastern Asian country, landlocked between China and Russia.
The population reached 2,713,000 inhabitants by mid-July 2010 with 27% younger than age 15
years, only 3.8% aged 65 years or over and a median age of 25.7 years (United Nations
Department of Economic and Social Affairs, Population Division, 2013b). Slightly more than
half (57%) of the population lives in urban areas (World Health Organization, 2011). The rest of
9 Based on ILO estimates. 10 Net enrolment rate is reported for both sexes. It is the ratio of children of official secondary
school age who are enrolled in secondary school to the population of official secondary school
age. 11 Average number of completed years of education of a country’s population, excluding years spent
repeating individual grades. Mean years of schooling are based on ISCED 1 or higher and
reported for the population 25 years and up and for both sexes (UIS 2014a). Data are based on
UIS estimates. 12 The total number of years of schooling that a child entering the school system could expect to
receive in the future, assuming that the probability of his or her enrolment is equal to prevailing
participation rates.

59
LAMP: Implementation in Diverse Settings
the population lives in rural areas in a nomadic or semi-nomadic way or resides in soum13
centres. Approximately one third of the total population lives in the capital, Ulaanbaatar, which
only occupies 0.3% of the territory (Tsogtsaikhan, 2008).
Economy. Mongolia’s economy has been traditionally based on agriculture, the sector
employing 32.5% of the working population and contributing to 14.5% of the GDP in 2011. The
male participation rate in the labour force was reported at 68.1% in 2011 while female
participation was slightly lower at 55.6% (World Bank, 2014). Mongolia ranks 110th on the HDI
and its value of 0.653 places Mongolia below the average of other Asian countries, placing the
country in the “medium human development” category (United Nations Development
Programme, 2011).
Education. Basic education in Mongolia consists of two cycles – five years of primary and four
years of lower secondary schooling. In 2011, Mongolia reported a net secondary enrolment
rate of 66%, mean years of schooling of 8.814 and a school-life expectancy of 14.8 years (UIS,
2014b).
Palestine
Demographics. The State of Palestine in the Middle East is comprised of the West Bank (5,860
km2)and the Gaza Strip (360 km2). Its population reached 4,013,000 inhabitants by mid-July
2010 (United Nations Department of Economic and Social Affairs, Population Division, 2013a).
The Palestinian population is highly urbanised with approximately 73.8% of Palestinians living
in urban localities in mid-2012, 16.8% in rural areas and 9.4% in refugee camps, which are
generally located in urban areas (Palestinian Central Bureau of Statistics, 2012). Palestine has
a young population structure with 42.1% younger than age 15 years, only 2.8% aged 65 years
or over and a median age of 18.2 years (United Nations Department of Economic and Social
Affairs, Population Division, 2013b).
Economy. The Palestinian economy mostly relies on its service sector, providing jobs to 62.4%
of the employed population. In 2011, a quarter of the Palestinian labour-force remained
unemployed. Male participation in the labour force is recorded at 66.1%, significantly more
than female participation at 14.8%. Additionally, 25.8% of Palestinians live in poverty (World
Bank, 2014). Palestine ranks 114th on the HDI in 2011 and its value of 0.641 places the country
in the “medium human development” category (United Nations Development Programme,
2011).
Education. Basic education in Palestine consists of two cycles – six years of primary and four
years of lower secondary schooling. In 2011, Palestine reported a net secondary enrolment
rate of 80.8%, mean years of schooling of 8.6, and a school-life expectancy of 13.3 years (UIS,
2014b).
13 Administrative subdivision of aimags or provinces, which are the first of the largest administrative
unit. 14 Based on latest available data collected in 2000.

60
LAMP: Implementation in Diverse Settings
Paraguay
Demographics. The Republic of Paraguay is a landlocked state in South America, surrounded
by Argentina, Bolivia and Brazil. The population of Paraguay reached 6,460,000 inhabitants by
mid-July 2010. Paraguay has a relatively young population with approximately 33.5% younger
than age 15 years, only 5.2% aged 65 or over and a median age of 23.1 years (United Nations
Department of Economic and Social Affairs, Population Division, 2013b). Paraguay’s population
is unequally distributed as approximately 97.3% of the people live in the Oriental Region that
represents only 40% of the territory. The population is mainly urban – 62.1% of Paraguayans
live in urban areas in 2011 (United Nations Development Programme, 2011) and this figure
has increased by more than 10 percentage points since 1990 (World Health Organization,
2011).
Economy. The Paraguayan economy is highly dependent on foreign trade and mostly relies on
agriculture that provides jobs to 26.4% of the working population. The male participation rate
in the labour force was reported at 84.8% in 2011 while female participation was lower at
55.1%. The overall unemployment rate is 5.6% (World Bank, 2014). Paraguay ranks 107th on
the HDI and its value of 0.665 places the country in the “medium human development”
category (United Nations Development Programme, 2011).
Education. Basic education in Paraguay consists of six years, comprising the first and second
cycles of compulsory education, after which students receive a leaving certificate. In 2011,
Paraguay reported a net secondary enrolment rate of 62.6%, mean years of schooling of 7.7
and a school-life expectancy of 12.1 years (UIS, 2014b).

61
LAMP: Implementation in Diverse Settings
Chapter 6. LAMP literacy and numeracy results for countries15
This chapter presents the results from the main assessments for the four countries that participated:
Jordan, Mongolia, Palestine and Paraguay. This chapter focuses on average results for Prose,
Document and Numeracy, and the correlations between scores on these assessed domains within
each country. Each country was assessed using LAMP and the scores in each domain were reported
on a scale ranging from 600 to 1,400. The scores in each domain when all countries are pooled have
an average value of 1,000 and the standard deviation of the scores is 100.
6.1 Literacy levels in Prose Reading
Figure 6.1 shows each country’s estimated average score in LAMP Prose Reading along with the
corresponding 95% confidence interval. Each country’s Prose average has been estimated from the
sample to which LAMP was administered and as it is a sample, it contains some error. The 95%
confidence interval shows a range of values (i.e. a country’s average score will be within this range in
95% of all possible samples drawn from the population). A country’s sample average is marked in the
middle of the range, and the top and bottom of the range are shown as well. For example, in Figure
6.1, Jordan’s average was estimated to be 983. The 95% confidence interval ranges from 977 to 989.
Thus, we are 95% confident that Jordan’s true average Prose score is between 977 and 989. The smaller
the range of the confidence interval, the more precise is the estimate of the average in these results.
Figure 6.1. Prose score means and confidence intervals by country
15 Basic statistics, including standard errors of the mean, for this and the remaining chapters of this
document are found in Annexes 3, 4, 5 and 6.

62
LAMP: Implementation in Diverse Settings
Figure 6.1 allows a comparison across countries to determine whether a country’s average is
significantly higher than another’s. When the confidence intervals for some countries overlap, we are
not confident that those countries’ averages are truly different. The countries’ averages are rather
close to one another. In Figure 6.1, only one difference is statistically significant: Mongolia’s average is
higher than Paraguay’s when it comes to Prose skills.
Figure 6.2 shows the percentage of respondents in each country at each of LAMP’s Prose Reading
Performance Levels. Not all LAMP respondents in a country received the same Prose Reading score,
instead, Prose Reading scores are spread along the LAMP score scale. A country’s LAMP Prose Reading
results can also be summarised by displaying the percentage of the respondents who read prose at
each of LAMP’s Prose Performance Levels.
Figure 6.2. LAMP Prose Performance Levels comparison
Figure 6.2 shows that countries vary in the percentage of persons at each level: 20% to 29% at Level 1,
41% to 51% of persons performing at Level 2 and 20% to 31% at Level 3. The largest group of persons
in each country performed at Level 2. Figure 6.2 shows that in Prose Reading in the four countries:
a. Level 1. Less than 30% of respondents can: identify literal, concrete information in reading-to-
do passages (e.g. job vacancy notices, product labels and vaccination information) or simple
one-paragraph passages, provided that (i) language is identical in passages and questions; (ii)
only everyday colloquial vocabulary is required; and (iii) choices or distractors are absent from
the questions. Respondents can produce answers that require minimal action (e.g. circling,
underlining, copying a short fragment of text).
0 10 20 30 40 50 60
Jordan (n=2492)
Mongolia (n=4000)
Palestine (n=3585)
Paraguay (n=3966)
Percentage of respondents at each performance level
Level 1
Level 2
Level 3

63
LAMP: Implementation in Diverse Settings
c. Level 2. 41% to 51% of the respondents can do everything in (a) and in addition can: Identify
literal information in reading-to-do or reading-to-learn passages when the required
information appears in reading-to-do passages in a brief, clearly marked section or in reading-
to-learn passages near the beginning of the text; and when (i) language is not identical in
passages and questions and (ii) questions do not have choices. Respondents can paraphrase,
understand more ‘academic’ language and write full-sentence answers.
d. Level 3. 20% to 31% of the respondents can do everything in both (a) and (b) and in addition
can: Identify literal information in longer, more challenging reading-to-learn texts (1-10
paragraphs) with linguistically dense passages or when the required information is in the
middle or end of the passage – not the beginning – and when questions may or may not have
choices or distractors.
6.2 Literacy levels in Document Reading
When it comes to LAMP Document reading as displayed in Figure 6.3, we find once again that all
national averages are rather close and many confidence interval ranges overlap. Thus, most countries’
averages are not significantly different from one another. There is only one statistically significant
difference in the averages: Jordan’s average is higher than Paraguay’s when it comes to Documents
reading skills.
Figure 6.3. Document score means and confidence intervals by country
Figure 6.4 shows the percentage of respondents in each country at each of LAMP’s Document Reading
Performance Levels. Document reading scores are spread along the LAMP score scale. A country’s
LAMP Document Reading results can be summarised by displaying the percentage of respondents
who read prose at each of LAMP’s Document Performance Levels.
10051000
995991
999995
985977
992 990
975
963
940
960
980
1000
1020
1040
Jordan Mongolia Palestine Paraguay
Do
cum
en
t sc
ore
sca
le
Document Level 2 score range
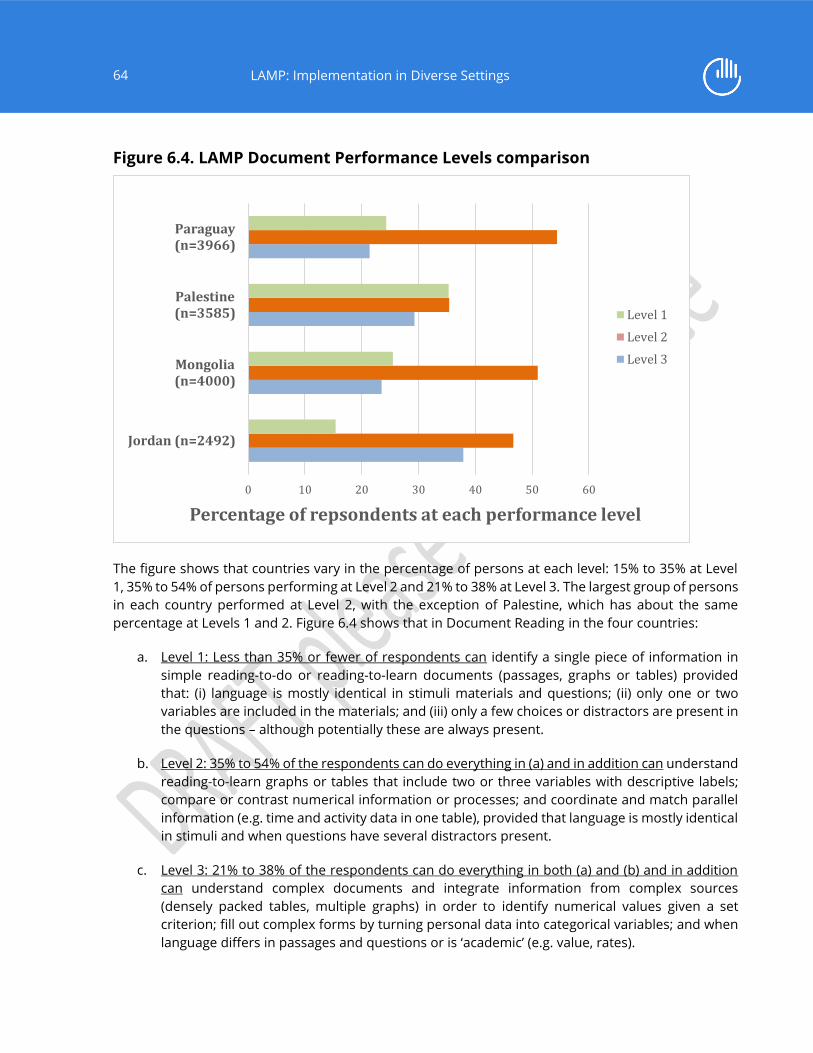
64
LAMP: Implementation in Diverse Settings
Figure 6.4. LAMP Document Performance Levels comparison
The figure shows that countries vary in the percentage of persons at each level: 15% to 35% at Level
1, 35% to 54% of persons performing at Level 2 and 21% to 38% at Level 3. The largest group of persons
in each country performed at Level 2, with the exception of Palestine, which has about the same
percentage at Levels 1 and 2. Figure 6.4 shows that in Document Reading in the four countries:
a. Level 1: Less than 35% or fewer of respondents can identify a single piece of information in
simple reading-to-do or reading-to-learn documents (passages, graphs or tables) provided
that: (i) language is mostly identical in stimuli materials and questions; (ii) only one or two
variables are included in the materials; and (iii) only a few choices or distractors are present in
the questions – although potentially these are always present.
b. Level 2: 35% to 54% of the respondents can do everything in (a) and in addition can understand
reading-to-learn graphs or tables that include two or three variables with descriptive labels;
compare or contrast numerical information or processes; and coordinate and match parallel
information (e.g. time and activity data in one table), provided that language is mostly identical
in stimuli and when questions have several distractors present.
c. Level 3: 21% to 38% of the respondents can do everything in both (a) and (b) and in addition
can understand complex documents and integrate information from complex sources
(densely packed tables, multiple graphs) in order to identify numerical values given a set
criterion; fill out complex forms by turning personal data into categorical variables; and when
language differs in passages and questions or is ‘academic’ (e.g. value, rates).
0 10 20 30 40 50 60
Jordan (n=2492)
Mongolia(n=4000)
Palestine(n=3585)
Paraguay(n=3966)
Percentage of repsondents at each performance level
Level 1
Level 2
Level 3

65
LAMP: Implementation in Diverse Settings
6.3 Numeracy levels
In Numeracy, once again all national averages are rather similar to each other. As shown in Figure 6.5,
the order of the national averages is not the same as in either Prose or Document Reading. The
average scores for Jordan and Paraguay are not statistically different from each other. However, all
other differences are statistically significant: Mongolia’s average score is higher than the average
scores of the other three countries, while Palestine’s is lower than those of the other three countries.
Figure 6.6 shows the percentage of respondents in each country at each of LAMP’s Numeracy
Performance Levels. Numeracy scores are spread along the LAMP score scale. A country’s LAMP
Numeracy results can also be summarised by displaying the percentage of the respondents who
perform at each of LAMP’s Numeracy Levels.
Figure 6.6 shows how countries vary in the percentage of persons at each level: 17% to 36% at Level
1, 42% to 45% of persons performing at Level 2, and 22% to 38% at Level 3. The largest group of
persons in each country performed at Level 2, with the exception of Palestine that has about the same
percentages at Levels 1 and 2. Figure 6.6 shows that in Numeracy in the four countries:
a. Level 1: 36% or fewer of respondents can answer explicit questions requiring a one-step,
simple operation; add 3 whole numbers with 2-3 digits or with decimals in a ‘money’ context;
and subtract 2 whole or decimal numbers in a ‘money’ context when they are presented with
material communicating information in a familiar context with easily accessible quantitative
information due to its visual representations and minimal text. Questions contain no choices
or distractors.
b. Level 2: 42% to 45% of the respondents can do everything in (a) and in addition can complete
tasks involving some fractions and decimals; understand and use some simple fractions such
as one-half (½) written with numbers or words; can demonstrate some understanding of the
meaning of decimal numbers; and multiply a decimal number and a whole number when they
are presented with material communicating information in a familiar context.
c. Level 3: 22% to 38% of respondents can do everything in (a) and (b), and in addition can
perform multiple-step operations that require multiplication (maybe by repeated addition)
and then division (maybe by repeated subtraction); subtract a per cent from an initial value;
find a proportion by combining operations in a money context (sometimes with decimals); add
3 numbers (sometimes with decimals) after computing 2 of them through multiplying by 10 or
2; read time using clocks or in numeric form; interpret qualitative or quantitative data from
tables or price tags with per cents, decimals and whole numbers; and can represent money
and weight using appropriate measurement units when they are presented with complex tasks
with several visual representations and asked explicit questions that may or may not have
choices or distractors.

66
LAMP: Implementation in Diverse Settings
Figure 6.5. Numeracy score means and confidence intervals by country
d.
Figure 6.6. LAMP Numeracy Performance Levels comparison
0 10 20 30 40 50
Jordan (n=2492)
Mongolia (n=4000)
Palestine (n=3585)
Paraguay (n=3966)
Percentage of repsondents at each performance level
Level 1
Level 2
Level 3
1002
1022
975
1011
996
1017
968
998990
1013
961
984
940
960
980
1000
1020
1040
Jordan Mongolia Palestine Paraguay
Nu
me
racy
sco
re
Numeracy Level 2 score range

67
LAMP: Implementation in Diverse Settings
6.4 Summary
Overall, the four countries participating in the LAMP main assessment performed similarly across all
three domains as most national averages are similar to one another; few differences between national
averages are statistically significant; and the ordering of the national averages is not the same for each
domain. This means that different countries do slightly better in different domains and no individual
country stands out across all domains.

68
LAMP: Implementation in Diverse Settings
Chapter 7. The performance of socio-demographic subgroups on LAMP literacy
and numeracy measures16,17
Scores from adult literacy and numeracy assessments (i.e. household-based assessments like LAMP
and PIAAC) are correlated with – although not necessarily explained18 by – a combination of socio-
demographic and policy-sensitive variables. These include gender and the seven ‘Ls’:
Learning (formal schooling, non-formal education, literacy self-report)
Lifespan (age and cohort)
Legacies (parental education and occupation, socio-economic status)
Location (urban-rural)
Leisure (use of reading and numeracy skills outside of work)
Livelihood (use of reading and numeracy skills at work)
Language (mother tongue, home language, bilingual status).
These seven variables provide the structure for this chapter. The variable gender is discussed both
separately and integrated into the sections on the other variables throughout the discussion.
The last variable, language, is discussed in Chapter 8, which presents a case study on language in
Paraguay since the other three countries included in this report are relatively homogeneous in terms
of their populations’ mother tongues and home languages.
7.1 Literacy, numeracy and learning: Schooling and non-formal education
Participation in education remains the best correlate with adult reading and numeracy skills (OECD,
2006; OECD, 2014a). This section describes the populations of LAMP countries in terms of their
participation in non-formal, informal and formal education19, and subsequently describes the link
between learning and skills. Education is such an important predictor of skills that the analyses in
subsequent sections, which will focus on the relationship between skills and other variables (either
socio-demographic variables or practices), will present results adjusted and unadjusted for education.
16 The percentage of respondents in each country who performed at each of the LAMP Performance
Levels is provided in Annexes 7 through 18. These annexes disaggregate the data in the same
way as the data are presented in the text of this chapter. 17 The sample sizes, means, standard deviations and standard errors of measurement for all
disaggregated data presented in this chapter are reported in Annexes 3 to 6. 18 “Predict” does not necessarily mean, “explain”: prediction does not equal causation. 19 Classification of Learning Activities.
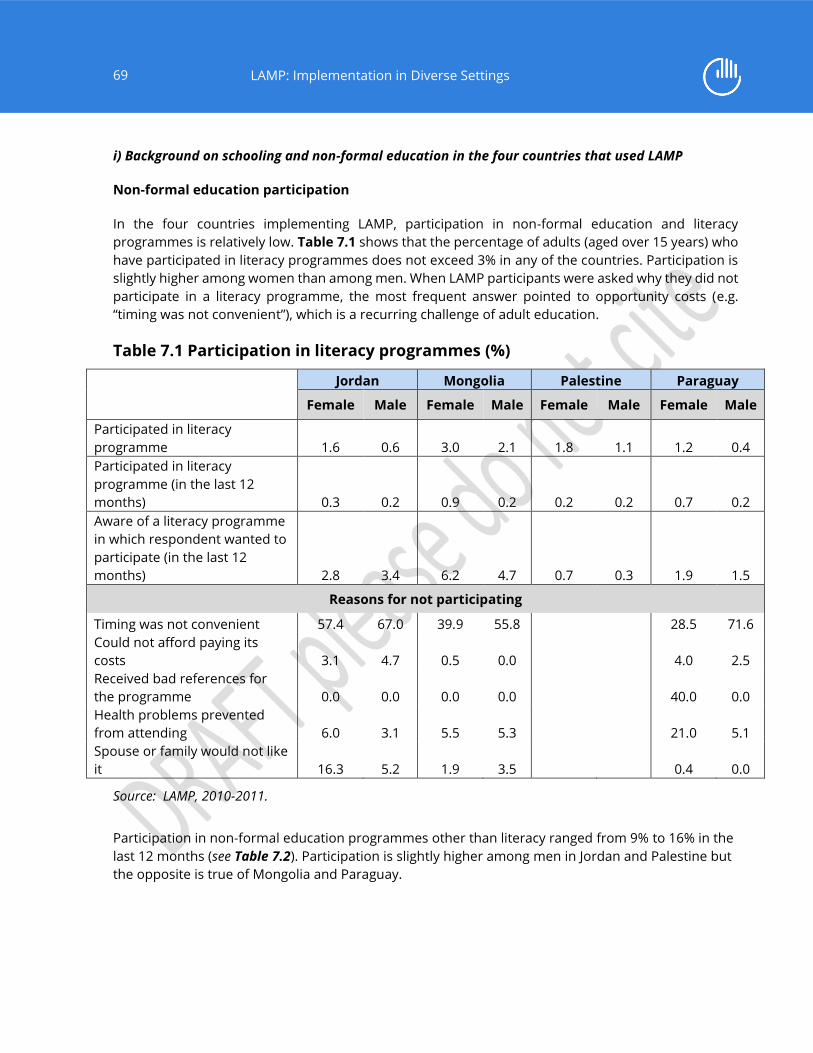
69
LAMP: Implementation in Diverse Settings
i) Background on schooling and non-formal education in the four countries that used LAMP
Non-formal education participation
In the four countries implementing LAMP, participation in non-formal education and literacy
programmes is relatively low. Table 7.1 shows that the percentage of adults (aged over 15 years) who
have participated in literacy programmes does not exceed 3% in any of the countries. Participation is
slightly higher among women than among men. When LAMP participants were asked why they did not
participate in a literacy programme, the most frequent answer pointed to opportunity costs (e.g.
“timing was not convenient”), which is a recurring challenge of adult education.
Table 7.1 Participation in literacy programmes (%)
Jordan Mongolia Palestine Paraguay
Female Male Female Male Female Male Female Male
Participated in literacy
programme 1.6 0.6 3.0 2.1 1.8 1.1 1.2 0.4
Participated in literacy
programme (in the last 12
months) 0.3 0.2 0.9 0.2 0.2 0.2 0.7 0.2
Aware of a literacy programme
in which respondent wanted to
participate (in the last 12
months) 2.8 3.4 6.2 4.7 0.7 0.3 1.9 1.5
Reasons for not participating
Timing was not convenient 57.4 67.0 39.9 55.8 28.5 71.6
Could not afford paying its
costs 3.1 4.7 0.5 0.0 4.0 2.5
Received bad references for
the programme 0.0 0.0 0.0 0.0 40.0 0.0
Health problems prevented
from attending 6.0 3.1 5.5 5.3 21.0 5.1
Spouse or family would not like
it 16.3 5.2 1.9 3.5 0.4 0.0
Source: LAMP, 2010-2011.
Participation in non-formal education programmes other than literacy ranged from 9% to 16% in the
last 12 months (see Table 7.2). Participation is slightly higher among men in Jordan and Palestine but
the opposite is true of Mongolia and Paraguay.
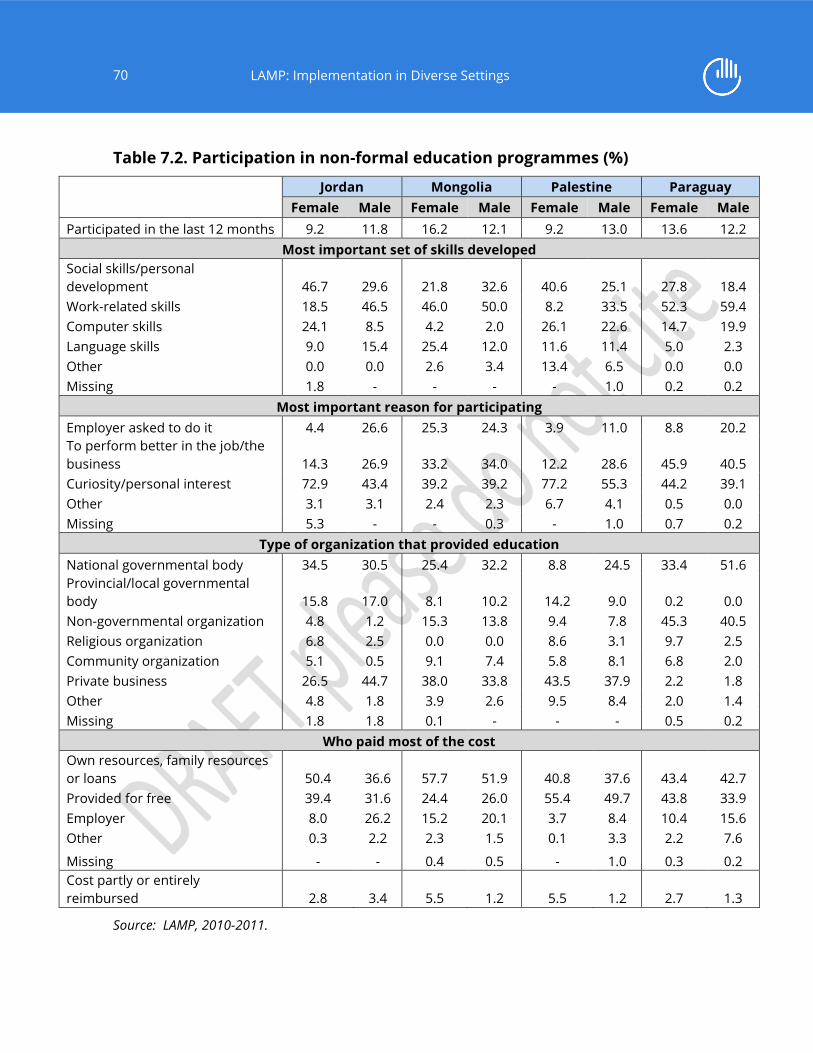
70
LAMP: Implementation in Diverse Settings
Table 7.2. Participation in non-formal education programmes (%)
Jordan Mongolia Palestine Paraguay
Female Male Female Male Female Male Female Male
Participated in the last 12 months 9.2 11.8 16.2 12.1 9.2 13.0 13.6 12.2
Most important set of skills developed
Social skills/personal
development 46.7 29.6 21.8 32.6 40.6 25.1 27.8 18.4
Work-related skills 18.5 46.5 46.0 50.0 8.2 33.5 52.3 59.4
Computer skills 24.1 8.5 4.2 2.0 26.1 22.6 14.7 19.9
Language skills 9.0 15.4 25.4 12.0 11.6 11.4 5.0 2.3
Other 0.0 0.0 2.6 3.4 13.4 6.5 0.0 0.0
Missing 1.8 - - - - 1.0 0.2 0.2
Most important reason for participating
Employer asked to do it 4.4 26.6 25.3 24.3 3.9 11.0 8.8 20.2
To perform better in the job/the
business 14.3 26.9 33.2 34.0 12.2 28.6 45.9 40.5
Curiosity/personal interest 72.9 43.4 39.2 39.2 77.2 55.3 44.2 39.1
Other 3.1 3.1 2.4 2.3 6.7 4.1 0.5 0.0
Missing 5.3 - - 0.3 - 1.0 0.7 0.2
Type of organization that provided education
National governmental body 34.5 30.5 25.4 32.2 8.8 24.5 33.4 51.6
Provincial/local governmental
body 15.8 17.0 8.1 10.2 14.2 9.0 0.2 0.0
Non-governmental organization 4.8 1.2 15.3 13.8 9.4 7.8 45.3 40.5
Religious organization 6.8 2.5 0.0 0.0 8.6 3.1 9.7 2.5
Community organization 5.1 0.5 9.1 7.4 5.8 8.1 6.8 2.0
Private business 26.5 44.7 38.0 33.8 43.5 37.9 2.2 1.8
Other 4.8 1.8 3.9 2.6 9.5 8.4 2.0 1.4
Missing 1.8 1.8 0.1 - - - 0.5 0.2
Who paid most of the cost
Own resources, family resources
or loans 50.4 36.6 57.7 51.9 40.8 37.6 43.4 42.7
Provided for free 39.4 31.6 24.4 26.0 55.4 49.7 43.8 33.9
Employer 8.0 26.2 15.2 20.1 3.7 8.4 10.4 15.6
Other 0.3 2.2 2.3 1.5 0.1 3.3 2.2 7.6
Missing - - 0.4 0.5 - 1.0 0.3 0.2
Cost partly or entirely
reimbursed 2.8 3.4 5.5 1.2 5.5 1.2 2.7 1.3
Source: LAMP, 2010-2011.
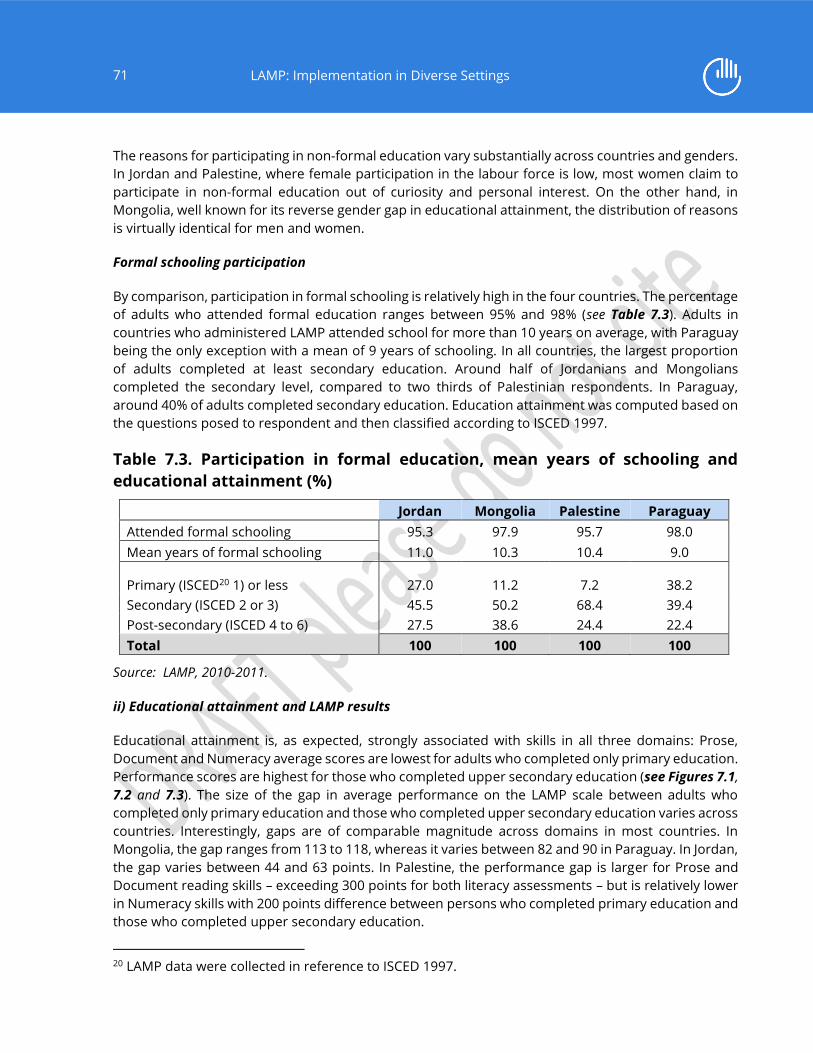
71
LAMP: Implementation in Diverse Settings
The reasons for participating in non-formal education vary substantially across countries and genders.
In Jordan and Palestine, where female participation in the labour force is low, most women claim to
participate in non-formal education out of curiosity and personal interest. On the other hand, in
Mongolia, well known for its reverse gender gap in educational attainment, the distribution of reasons
is virtually identical for men and women.
Formal schooling participation
By comparison, participation in formal schooling is relatively high in the four countries. The percentage
of adults who attended formal education ranges between 95% and 98% (see Table 7.3). Adults in
countries who administered LAMP attended school for more than 10 years on average, with Paraguay
being the only exception with a mean of 9 years of schooling. In all countries, the largest proportion
of adults completed at least secondary education. Around half of Jordanians and Mongolians
completed the secondary level, compared to two thirds of Palestinian respondents. In Paraguay,
around 40% of adults completed secondary education. Education attainment was computed based on
the questions posed to respondent and then classified according to ISCED 1997.
Table 7.3. Participation in formal education, mean years of schooling and
educational attainment (%)
Jordan Mongolia Palestine Paraguay
Attended formal schooling 95.3 97.9 95.7 98.0
Mean years of formal schooling 11.0 10.3 10.4 9.0
Primary (ISCED20 1) or less 27.0 11.2 7.2 38.2
Secondary (ISCED 2 or 3) 45.5 50.2 68.4 39.4
Post-secondary (ISCED 4 to 6) 27.5 38.6 24.4 22.4
Total 100 100 100 100
Source: LAMP, 2010-2011.
ii) Educational attainment and LAMP results
Educational attainment is, as expected, strongly associated with skills in all three domains: Prose,
Document and Numeracy average scores are lowest for adults who completed only primary education.
Performance scores are highest for those who completed upper secondary education (see Figures 7.1,
7.2 and 7.3). The size of the gap in average performance on the LAMP scale between adults who
completed only primary education and those who completed upper secondary education varies across
countries. Interestingly, gaps are of comparable magnitude across domains in most countries. In
Mongolia, the gap ranges from 113 to 118, whereas it varies between 82 and 90 in Paraguay. In Jordan,
the gap varies between 44 and 63 points. In Palestine, the performance gap is larger for Prose and
Document reading skills – exceeding 300 points for both literacy assessments – but is relatively lower
in Numeracy skills with 200 points difference between persons who completed primary education and
those who completed upper secondary education.
20 LAMP data were collected in reference to ISCED 1997.

72
LAMP: Implementation in Diverse Settings
Figure 7.1. Mean Prose Reading scores by highest completed education level
Source: LAMP, 2010-2011.
Figure 7.2. Mean Document Reading scores by highest completed education
level
Source: LAMP, 2010-2011.
Jordan
Mongolia
Palestine
Paraguay
600 700 800 900 1000 1100 1200
Primary Lower secondary Upper secondary
Jordan
Mongolia
Palestine
Paraguay
600 700 800 900 1000 1100 1200
Primary Lower secondary Upper secondary

73
LAMP: Implementation in Diverse Settings
Figure 7.3. Mean Numeracy scores by highest completed education level
Source: LAMP, 2010-2011.
There is a significant advantage for those who completed lower secondary compared to those who
completed only primary education (see Figure 7.4). In the figure, the term ‘advantage’ is the difference
between the means of two groups – in this case, those who completed lower secondary and those
who completed primary. The advantage is statistically significant in Prose and Document Reading
scores in all four countries and it ranges from 40 to 295 points. In Numeracy skills, the mean difference
between the primary and lower secondary groups is statistically significant in all countries except
Jordan. The average advantage in favour of adults who completed lower secondary education ranges
from 35 to 150 points on the Numeracy scale.
Adults who completed upper secondary education also have higher scores on average compared to
those who have completed lower secondary (see Figure 7.5). The advantage, although remaining
statistically significant, is slightly lower in Mongolia, Palestine and Paraguay – it ranges between 33 and
51 points. In Jordan, there is no statistically significant score difference between those two groups in
any domain.
Jordan
Mongolia
Palestine
Paraguay
600 700 800 900 1000 1100 1200
Primary Lower secondary Upper secondary

74
LAMP: Implementation in Diverse Settings
Figure 7.4. Mean scores differences between adults who completed primary
education and adults who completed lower secondary education
Source: LAMP, 2010-2011.
100 50 0 50 100 150 200 250 300
Numeracy
Document
Prose
Numeracy
Document
Prose
Numeracy
Document
Prose
Numeracy
Document
Prose
PY
PS
MN
JO
Advantage completed primary Advantage completed lower secondary

75
LAMP: Implementation in Diverse Settings
Figure 7.5. Mean scores differences between adults who completed lower
secondary education and adults who completed upper secondary education
Source: LAMP, 2010-2011.
The findings showing a positive relationship between the amount of formal education and reading
and numeracy performance are consistent with results from numerous studies that have shown
educational attainment to be a major correlate of adult literacy performance that can be attributed to
formal education (OECD and Statistics Canada, 2000; Desjardins, 2003; OECD, 2013b; OECD 2013c;
Charette and Meng, 1998; Green and Riddell, 2003; OECD and Statistics Canada, 2005).
However, the relationships between educational attainment and literacy and numeracy skills are
complex. A low level of formal educational attainment does not imply low reading or numeracy
proficiency in all cases, and post-secondary education does not guarantee high proficiency. In all four
countries, there is a non-negligible share of adults scoring at the highest proficiency level within the
group who received only primary education, in all three domains. In Jordan and Paraguay, for example,
one out of ten adults with low educational attainment score at the highest level (Level 3) in Numeracy.
Conversely, 5% to 12% of adults with post-secondary education score at the lowest proficiency level in
Jordan, Mongolia and Palestine (see Figure 7.6).
100 50 0 50 100 150 200 250 300
Numeracy
Document
Prose
Numeracy
Document
Prose
Numeracy
Document
Prose
Numeracy
Document
Prose
PY
PS
MN
JO
Advantage Complete lower secondary Advantage Complete upper secondaryJO = Jordan, MN= Mongolia, PS = Palestine, PY = Paraguay

76
LAMP: Implementation in Diverse Settings
Some studies have indicated that the relationship between educational attainment and proficiency
can be attenuated by the influence of some individual literacy practices and experience, especially for
working adults, and also by the effect of aging (OECD, 2014a). Moreover, the relationship may be
observed as the individuals with greater proficiency are more likely to have higher qualifications, given
the examination requirements for entry into higher education in many countries (Green and Riddell,
2003; OECD, 2013a). Therefore, skill acquisition, development and maintenance are a complex
process, and other factors involved deserve further analysis.
Figure 7.6. Proficiency levels in Numeracy by educational attainment
Source: LAMP, 2010-2011.
7.2 Literacy, numeracy and gender
According to OECD and Statistics Canada, “until recently, men have typically obtained more education
than women; and because education is an important determinant of skills development (…),
differences in education may be responsible for differences in the skills of men and women” (OECD
and Statistics Canada, 2005, p. 46). This is why any analysis of the gender distribution of literacy and
numeracy performance should start by describing the situation of men and women within a country –
not just in terms of education but also in relation to employment and everyday practices.
100
80
60
40
20
0
20
40
60
80
100
Pri
mar
y o
r le
ss
Seco
nd
ary
Po
st-s
eco
nd
ary
Pri
mar
y o
r le
ss
Seco
nd
ary
Po
st-s
eco
nd
ary
Pri
mar
y o
r le
ss
Seco
nd
ary
Po
st-s
eco
nd
ary
Pri
mar
y o
r le
ss
Seco
nd
ary
Po
st-s
eco
nd
ary
Jordan Mongolia Palestine Paraguay
Pe
rce
nt
be
low
Le
vel 2
ΙP
erc
en
t ab
ove
Le
vel 2
Level 1 Level 2 Level 3

77
LAMP: Implementation in Diverse Settings
i) The situation of men and women in countries that administered LAMP
The socio-demographic profiles of men and women vary considerably across the four countries (see
Table 7.4).
In terms of education, Mongolia is one of the best known examples of a reverse gender gap as
evidenced in this study by the much higher proportion of women with post-secondary education. This
is also starting to happen, to a lesser degree, in Paraguay. Palestine is approaching gender parity in
education. Jordan still shows women at a disadvantage with lower median years of schooling for
women. While in Mongolia and Paraguay women are slightly more likely to be tertiary students than
men, the reverse is true for Palestine and Jordan.
As for occupational status, women are less likely than men to be employed in all four countries, but
there is also considerable variation among women in the four countries. The female employment rate
is much lower in Palestine (6.7) and Jordan (8.9) than in Mongolia (37.4) and Paraguay (40.2), while the
male employment rate is less variable. The ratio of women-to-men employment rate is highest in
Mongolia.
Among those employed, women are more likely than men to concentrate in high-skilled occupations
in all countries but Jordan. In Palestine, this concentration is quite striking, with 89.4% of all employed
women in these occupations. However, since such a small proportion of women are employed, they
do not represent the majority of the high-skilled workforce. In Mongolia, on the other hand, most
professionals are women as are most clerical support, services workers and sales workers.
In all countries but Jordan, women use their numeracy skills at work as much as men do, and they use
their literacy skills even more. In Jordan, gender parity is found for the use of literacy skills, while
women use their numeracy skills less than men.
In Mongolia and Paraguay, women are slightly more likely than men to be retired, which are consistent
with women’s marginally higher median age, coupled with their typically lower retirement age.
Regarding the use of literacy skills for leisure, there are also some nuances across genders and
countries. While in Mongolia this narrow gap favours women, in Paraguay, there is virtual parity and
in Jordan and Palestine, men have the advantage.
The biggest gender gap is not found in schooling in these countries but in employment. However,
formal schooling should still be controlled for when comparing results by gender for one simple
reason: it remains the single best predictor of skills. However, even after they are adjusted for
schooling, the skills of men and women will reveal the importance of other aspects of their situation –
mainly their participation in their labour force or lack thereof and the occupational categories in which
they tend to concentrate. The use of literacy skills for leisure, however, is promising as one factor that
can help sustain or even further develop skills, and which has the potential to be less biased in terms
of gender.

78
LAMP: Implementation in Diverse Settings
Table 7.4. Profiles by gender in medians (in age) or percentages
Mongolia Jordan Palestine Paraguay
Fe
ma
le
Ma
le
Fe
ma
le
Ma
le
Fe
ma
le
Ma
le
Fe
ma
le
Ma
le
Age 34 33 31 31 30 30 34 33
Urban (%) 71.7 68.0 83.2 83.1 73.3 74.3 62.9 57.6
Primary education or less (%) 11.0 11.3 29.1 25.2 10.9 8.6 38.7 37.9
Secondary education (%) 45.5 55.2 47.0 44.1 65.5 69.1 37.4 41.3
Post-secondary education (%) 43.5 33.5 23.9 30.7 23.6 22.4 24.0 20.8
Years of formal schooling 10.0 10.0 11.0 12.0 11.0 11.0 9.0 9.0
Participated in non-formal education in
the last 12 months (%) 16.2 12.1 9.2 11.8 9.2 13.0 13.6 12.2
Participated in literacy programme (%) 3.0 2.1 1.6 0.6 1.8 1.1 1.2 0.4
Self-reported to read easily (%) 96.7 96.1 92.6 95.0 93.6 92.7 90.8 89.3
Self-reported to write easily (%) 96.3 95.9 92.2 94.5 91.8 91.5 91.2 89.0
Students of all levels participated in
LAMP (%) 18.2 16.1 22.3 27.1 21.6 23.5 20.8 19.4
Employed (%) 37.4 46.8 8.7 51.1 6.8 53.5 40.2 71.7
High-skilled occupation (ISCO 1-5) (%) 67.2 43.8 55.7 56.2 89.4 52.9 67.7 40.5
Managers (%) 7.4 7.8 0.6 4.9 7.0 8.7 8.3 9.5
Professionals (%) 33.7 19.1 3.9 4.8 44.5 11.7 24.9 5.3
Technicians (%) 0.6 6.4 12.6 7.9 15.7 10.0 4.1 8.6
Clerical support workers (%) 8.5 3.7 28.4 16.8 10.3 2.1 7.5 5.4
Service and sales workers (%) 17.0 6.9 10.2 21.7 12.0 20.4 22.9 11.6
Low-skilled occupation (ISCO 6-9) (%) 32.8 56.2 44.3 43.8 10.6 47.1 32.3 59.5
Agricultural workers (%) 0.3 0.3 2.0 2.0 2.3 4.2 5.0 24.9
Craft workers (%) 1.9 1.3 4.1 19.8 1.0 16.1 7.3 18.1
Plant and machine operator (%) 1.6 13.7 0.5 0.9 1.8 7.2 0.8 3.4
Elementary occupations (%) 29.0 40.9 37.8 21.2 5.5 19.7 19.3 13.1
Self-reported literacy practices at work
(0-100) 43.8 31.3 25.0 25.0 33.3 25.0 25.0 18.8
Self-reported numeracy practices at
work (0-100) 66.7 66.7 62.5 75.0 66.7 66.7 57.1 57.1
Self-reported practices at work (0-100) 55.2 45.8 46.9 50.0 50.7 45.1 41.1 35.7
Retired (%) 11.0 6.7 1.3 10.2 0.4 1.6 5.0 3.2
Practices at home (0-100) 55.9 52.9 52.9 58.8 47.1 55.9 52.9 52.9
Source: LAMP, 2010-2011.
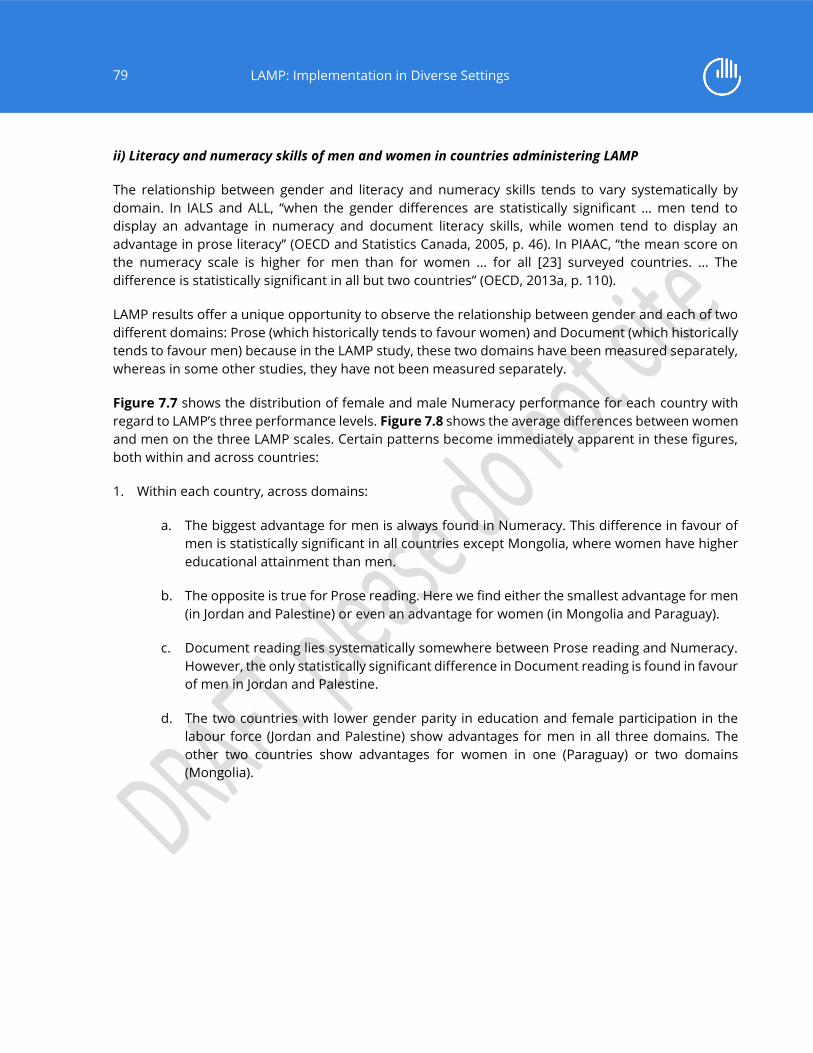
79
LAMP: Implementation in Diverse Settings
ii) Literacy and numeracy skills of men and women in countries administering LAMP
The relationship between gender and literacy and numeracy skills tends to vary systematically by
domain. In IALS and ALL, “when the gender differences are statistically significant … men tend to
display an advantage in numeracy and document literacy skills, while women tend to display an
advantage in prose literacy” (OECD and Statistics Canada, 2005, p. 46). In PIAAC, “the mean score on
the numeracy scale is higher for men than for women … for all [23] surveyed countries. … The
difference is statistically significant in all but two countries” (OECD, 2013a, p. 110).
LAMP results offer a unique opportunity to observe the relationship between gender and each of two
different domains: Prose (which historically tends to favour women) and Document (which historically
tends to favour men) because in the LAMP study, these two domains have been measured separately,
whereas in some other studies, they have not been measured separately.
Figure 7.7 shows the distribution of female and male Numeracy performance for each country with
regard to LAMP’s three performance levels. Figure 7.8 shows the average differences between women
and men on the three LAMP scales. Certain patterns become immediately apparent in these figures,
both within and across countries:
1. Within each country, across domains:
a. The biggest advantage for men is always found in Numeracy. This difference in favour of
men is statistically significant in all countries except Mongolia, where women have higher
educational attainment than men.
b. The opposite is true for Prose reading. Here we find either the smallest advantage for men
(in Jordan and Palestine) or even an advantage for women (in Mongolia and Paraguay).
c. Document reading lies systematically somewhere between Prose reading and Numeracy.
However, the only statistically significant difference in Document reading is found in favour
of men in Jordan and Palestine.
d. The two countries with lower gender parity in education and female participation in the
labour force (Jordan and Palestine) show advantages for men in all three domains. The
other two countries show advantages for women in one (Paraguay) or two domains
(Mongolia).

80
LAMP: Implementation in Diverse Settings
Figure 7.7. Performance levels in Numeracy by sex
Source: LAMP, 2010-2011.
Figure 7.8. Differences in mean scores between males and females
Source: LAMP, 2010-2011.
100
80
60
40
20
0
20
40
60
80
100
Male Female Male Female Male Female Male Female
Pe
rce
nt
be
low
Le
ve
l 2
Ι
Pe
rce
nt
ab
ove
Le
ve
l 2
Level 1 Level 2 Level 3
Jordan Mongolia Palestine
80 60 40 20 0 20 40
Numeracy
Document
Prose
Numeracy
Document
Prose
Numeracy
Document
Prose
Numeracy
Document
Prose
PY
PS
MN
JO
Advantage males Advantage femalesJO = Jordan, MN= Mongolia, PS = Palestine, PY = Paraguay

81
LAMP: Implementation in Diverse Settings
The differences shown in Figure 7.8 can be adjusted for educational attainment. The adjusted mean
differences are shown in Figure 7.9. After taking into account educational attainment, the patterns
become more consistent:
1. In all four countries, men have a statistically significant advantage in Numeracy, ranging from
approximately 15 points in Mongolia to approximately 40 in Jordan and Palestine. The bigger gap
in these two countries may be related to women’s low participation in the labour force, which is
not accounted for in the adjustment.
2. In all four countries, women have the advantage in Prose reading but this is only statistically
significant in Paraguay.
3. In three out of four countries, men have a slight advantage in Documents reading but this is only
statistically significant in Jordan.
These three findings echo those of other household-based international assessments of adults such
as IALS, ALL and PIAAC as well as those of school-based assessments of children such as PIRLS, TIMSS,
and PISA (OECD, 2006: OECD, 2014b). This also confirms the importance of keeping Prose reading and
Document reading as separate domains for LAMP.
Figure 7.9. Mean score (adjusted for educational attainment) differences
between males and females
Source: LAMP, 2010-2011.
80 60 40 20 0 20 40
Numeracy
Document
Prose
Numeracy
Document
Prose
Numeracy
Document
Prose
Numeracy
Document
Prose
PY
PS
MN
JO
Advantage males Advantage femalesJO = Jordan, MN= Mongolia, PS = Palestine, PY = Paraguay

82
LAMP: Implementation in Diverse Settings
This report does not provide data as to why there would be a difference in numeracy that persists
even after taking schooling into account. There are several possible speculations for explaining this
finding that are related to cultural and economic factors rather than biological differences. One of
those speculations is that in countries that administered LAMP, as in OECD countries, “women are less
likely to participate in the labour force” (OECD, 2013a, p. 109). Perhaps as a result, they may be more
likely to lose their numeracy skills once schooling has been completed.
Around the world, it has been found that even highly educated women are less likely than their male
counterparts to choose career paths in Science, Technology, Engineering and Mathematics (STEM).
This phenomenon may have its roots in gender stereotypes that affect the choices that female and
male students make from an early age, consciously or not, to focus their efforts on certain academic
subjects over others (Diekman et al., 2010; Saucerman and Vasquez, 2014; Wang et al., 2013). As a
result, even when boys and girls get the same quantity of schooling, the kind of schooling may differ.
This does not necessarily mean that one gender is afforded a better education than the other
(although that may also happen) but that each gender may have a different schooling experience and
benefit from it more in some subjects than in others (see Box 7.1).
It is worth noting that the two aforementioned speculations may be complementary. Women and men
may have different schooling experiences and therefore make different academic choices.
Subsequently, they may take career paths that require more or less use of their numeracy skills or
even refrain from entering the labour force at all. For women, on average, this may mean less of a
focus on numeracy during school, at work and in life.
7.3 Literacy, numeracy and the lifespan: Age and cohort
In analysing the relationship between age, literacy, numeracy skills and years of schooling, it is
necessary to distinguish between at least two types of so-called ‘effects’: age effects and cohort effects.
Box 7.2 discusses these.
LAMP provides a unique opportunity to observe the differences in age effects on measures of literacy
and numeracy skills since it is the only international assessment of adult literacy skills that includes
those over the age of 65 in the samples. At the same time, it also offers a great opportunity to observe
cohort effects on schooling (and indirectly on skills) because it focuses on educational systems that
have greatly expanded during the respondents’ lifetime.
However, age and cohort effects are difficult to disentangle. This is easier to do in longitudinal studies
that follow a given cohort – or even better, a specific sample of people (known as a panel) over time.
However, in cross-sectional studies like LAMP (or IALS, ALL, PIAAC and STEP) where respondents are
tested only once, we must rely on theory and prior research (especially longitudinal studies) to
attribute performance gaps to age effects or cohort effects (e.g. increases in schooling levels due to
an expanding education system).
In order to explore some possible cohort effects, we can focus on the youngest age group (ages 15 to
24) and the second oldest one (ages 40-64). The oldest group of those aged 65 or over is more likely
to be affected by age effects, both as a result of biological factors and the lack of practice often
associated with retirement. The comparison of people aged 40-64 to the youngest group may allow a
better identification of the potential cohort effects.

83
LAMP: Implementation in Diverse Settings
Box 7.1. Towards gender equity in education and learning in Jordan
In 2011, Jordan ranked 117 out of 135 countries for the gender gap index (World Economic Forum,
2014). Despite ranking in the lowest quintile due to low economic participation and political
empowerment of women, the country has achieved tremendous progress towards equity in
education and health.
Youth literacy rates and enrolment rates in primary, secondary and tertiary education are among
the education indicators where females have been making important progress since the 1990s to
eventually overcome some disparities with males. In 2011, the same proportion of females and
males aged 15-24 years themselves reported being able to read and write (99%). If equality is
almost achieved in access to primary education, more females are enrolled in secondary and
tertiary education (net secondary enrolment rate of 89.4% and 86.5%, and gross tertiary
enrolment rate of 42.8% and 37.2% for females and males, respectively). However, some
disparities remain with almost twice as many estimated female out-of-school children of primary
school age than male (World Bank, 2014), and a lower school life expectancy until lower secondary
for females in 2011 (UIS, 2014b).
Since the mid-2000s, several school-based assessments have shown that Jordanian girls
outperform boys in literacy, mathematics and science. PISA results show that 15-year-old girls
scored on average 55 points higher than boys in reading and 7 points more in mathematics in
2006 (OECD, 2006). These results are consistent with those of the National Assessment for
Knowledge Economy (Independent Evaluation Group, 2011; NCHRD, 2011; NCHRD, 2013) and the
Trends in International Mathematics and Science Study (TIMSS) in Jordan. They are also in line with
the overall trend observed in many countries where girls tend to have better reading proficiency
than their male counterparts. In mathematics, the opposite is often observed in many countries
although Jordanian girls still outperform boys in that domain. The gender gap in favour of female
pupils in Jordan even tends to grow larger over the years. In 2012, the score difference reached
75 points in reading and 21 points in mathematics (OECD, 2012). However, in mathematics, this
trend seems to be more related to a decline in proficiency among boys rather than real progress
for girls (Independent Evaluation Group, 2011). Further exploring gender differences among
pupils will allow better understanding of these trends for effective future action towards closing
the remaining gaps in learning.
Overall, progress towards gender equity in education can be observed in Jordan. To tackle the
remaining barriers, the Ministry of Education started the National Strategy for Gender Inclusion in
2010, aimed at promoting gender equity in education administration and schools through
targeted policies and programmes, including the development of training materials to bring
gender awareness to schools.

84
LAMP: Implementation in Diverse Settings
Box 7.2. What are age and cohort effects?
Age effects, sometimes called ‘maturational effects’, refer to the – partly biological – changes that
occur mostly as a result of an individual’s increasing chronological age. Like our bodies, our minds
first grow up (cognitive maturation) and then grow old (cognitive decline). Increased age is thus
associated with lower levels of cognitive performance. As a result, the relationship between age
and skills is not linear. At the start of the lifecycle, cognitive skills and the reading and numeracy
skills that depend on them will tend to increase with age but at some point, as cognitive decline
begins, all of those skills will start to decrease with age. This decline will occur among all cohorts
as each cohort grows older, independently of time period.
Cohort effects, on the other hand, have less to do with biology and more to do with history. These
changes characterise populations born at a particular point in time and are explained by a time-
specific common experience, independently of aging. For instance, in both OECD and LAMP
countries, younger women perform better in reading and numeracy than older women. This is
partly because younger women had more schooling than their mothers’ generation – maybe they
turned aged 6, 12 or 18 years at a time when more girls were entering primary, secondary or
tertiary education, respectively. All of this goes back to the year when they were born – their birth
cohort.
The mean differences between these two groups for each domain are shown in Figure 7.10. Overall,
the younger age group seems to outperform the older one in all four countries and all three skills
domains – although not all differences are statistically significant. In addition, some interesting
patterns are found across domains within each country:
a. The younger cohort’s advantage in Prose reading and Document reading is always
statistically significant. On the Prose scale, young adults score on average between 21
points and 56 points higher than their older counterparts.
b. The younger cohort’s advantage is larger for Document reading than for Prose reading in
all countries except Paraguay. Respondents aged 15-24 score on average between 27
points and 65 points higher than their older counterparts.
c. For Numeracy, the difference is never statistically significant and it is always the smallest
as compared to the other two domains.
A plausible explanation for this gap is that younger cohorts in these countries have attained more
years of formal schooling than older cohorts. All four countries that administered LAMP experienced
an increase in the quantity of schooling received by their population for several decades. In Jordan, for
instance, the average years of formal schooling of people aged 15-19 increased from six years in 1970
to nine years in 2000 and the percentage of adults that received no education was almost divided by
three during the same period (World Bank, 2014). Therefore, it would be advisable to compare these
two age groups while controlling for schooling. The results of this adjustment for formal schooling are
shown in Figure 7.11.

85
LAMP: Implementation in Diverse Settings
Figure 7.10. Mean scores differences between the 15-24 and 40-64 age groups
Source: LAMP, 2010-2011.
Figure 7.11. Mean scores (adjusted for educational attainment) differences
between the 15-24 and 40-64 age groups
Source: LAMP, 2010-2011.

86
LAMP: Implementation in Diverse Settings
After controlling for formal schooling, there are some changes in the patterns.
a. No consistent pattern is found for Prose reading scores as each of the four countries
yielded different results. The gap previously observed in Prose reading disappears in
Jordan and is slightly reduced in Mongolia, where the 15-24 age group score is on average
16 points higher than in the older group. In Palestine and Paraguay, the advantage is
reversed, with the 40-64 age group scoring respectively 17 points and 5 points higher than
their younger counterparts.
b. The younger cohort’s advantage in Document reading scores remains statistically
significant in Jordan and Mongolia, although it is reduced to 21 points in Jordan.
c. The most remarkable change takes place in Numeracy, where the initial advantage enjoyed
by the younger cohort (although not statistically significant in the first place) is now mostly
reversed. The older cohort does better in three out of four countries (the exception being
Mongolia) but the difference is statistically significant only in Palestine. Adults aged 40-64
score on average 28 points higher than their younger counterparts.
Why do young cohorts outperform older ones in Document reading but not in Prose reading and even
less so in Numeracy after taking schooling into account? There are at least two possible speculations.
One has to do with the differences in the quality of the formal schooling these two age groups may
have received and the other with what happens once people leave school or while they are not in
school.
Differences in the quality of formal schooling as opposed to the quantity of schooling do not
necessarily mean that one group received better schooling than the other, although that is also
possible. What it means is that there may be differences in the school curricula to which each of these
age groups were exposed. For example, in recent years students were taught how to read ‘document’
texts such as tables, charts, schedules and maps but three or four decades ago, the teaching of
document reading skills may not have been as prominent. Consequently, two respondents with the
same quantity of schooling may have different document reading skills, depending on when they
received their schooling. This is another aspect of the cohort effect: the young may do better at
document reading not only because they received more formal schooling but maybe also because
they were taught how to read them in school.
These two age groups, however, probably also differ from each other in terms of how they use their
document skills in everyday life (see Section 7.6 on leisure). As we will see later in section 7.6, young
people are more likely to use the Internet, for instance, and could possibly gain more exposure to texts
that are not organized in linear ways. They may, as a result, be more skilled at finding information in
‘document’ texts. Is this also a cohort effect or is it an age effect that will subside as these respondents
grow older? This study cannot provide an answer to this question. If these cohorts continue to use the
Internet throughout their lives with similar intensity, this will mostly be a cohort effect. If, however,
their Internet use tends to decline as they age, this will also be, to some extent, an age effect or rather
an effect on one’s position in the lifecycle. Only time will tell.

87
LAMP: Implementation in Diverse Settings
Formal schooling and life practices do not exclude each other. We can speculate that current schooling
with its greater focus on document reading probably prepares younger cohorts to better face the kinds
of texts they find on the Internet, therefore increasing the likelihood of these respondents engaging
in that type of reading, thus sustaining and further developing their skills in this way. The LAMP data,
however, do not shed light on this speculation.
Older cohorts have a small, inconsistent but statistically insignificant advantage in Numeracy.
Figure 7.12 shows the Numeracy mean scores together with their confidence intervals for all age
groups. No statistically significant difference can be observed across the 15-24, 25-39 and 40-64 age
groups in any of the countries. However, these groups all show higher proficiency compared to the
oldest age group of 65 or over in all countries.
Figure 7.12. Numeracy average score and 95% confidence interval limits by age
group and by country
Source: LAMP, 2010-2011.
10011015
982
866
10191027
1011
950
976 978
964
786
1003
1017
986
935
9921006
968
840
10121021
1004
927
968 969
951
759
991997
970
911
10101024
997
893
10261034
1018
973985 986
978
812
1014
1036
1001
959
720
760
800
840
880
920
960
1000
1040
15-24 25-39 40-64 65+ 15-24 25-39 40-64 65+ 15-24 25-39 40-64 65+ 15-24 25-39 40-64 65+
Jordan Mongolia Palestine Paraguay

88
LAMP: Implementation in Diverse Settings
In some countries around the world, there is some concern among educational practitioners and
researchers about the deterioration in the quality of mathematics instruction that younger cohorts
are receiving. For instance, Jordan participated in TIMSS in 1999, 2003, 2007 and 2011; its average
mathematics score in the most recent year (406) was significantly lower than in its three previous
TIMSS administrations (424-428). This drop may be due to a number of factors, such as the on-going
expansion of the education system and the influx of refugee populations from neighbouring countries.
TIMSS in Jordan also showed some fluctuations in the average science score between 1999 and 2011.
Further disaggregation of the youngest age group in LAMP may provide additional information on this
issue for young Jordanians as a whole, not just those in school.
On the other hand, a more optimistic speculation is that older cohorts may have kept their numeracy
skills fresh and maybe even developed them further by using them at work (see Section 7.7 on
livelihood).
However, as mentioned above, in LAMP this difference between the younger (age 15-24) and older
(age 40-64) cohort is not statistically significant, except for Palestine. In fact, in Mongolia, the younger
cohort actually does slightly better but the difference is not statistically significant, either.
Figure 7.13 shows the relationship between age and performance on the three scales by individual
age rather than age groups. The analysis does not control for schooling. If the scores remained the
same across all ages or if the scores became lower with age at the same rate, the graphs in Figure 7.13
would be a straight line. In Figure 7.13, however, the relationship between age and proficiency is a
quadratic curve: across the lifespan or strictly speaking, across birth cohorts, scores do not increase
or decrease at a constant rate.
For the most part, literacy and numeracy scores are lower for older cohorts in all countries and all
domains. However, this does not always apply for the youngest age group (aged 15 to 24), especially
in numeracy. Additionally, in Palestine and Jordan, people aged 15-24 also have lower Prose reading
and Document reading compared to the 25-35 age group. Many of these youngest respondents will
still be in school, continuing to develop their skills, so it is plausible for 25-year-olds – who are likely to
have completed their education and left school – to have better skills than 15-year-olds.
Also, within each country, the curves have slightly different shapes depending on the domain. The
reading curves, both in Prose and Document, appear to peak earlier around the ages of 20 or 25. For
Numeracy, the curves peak around the ages of 30 or 35. The interpretations mentioned above may
also apply here: it may be that the quality of instruction younger cohorts have received in reading is
better than in numeracy. But it may also be that numeracy skills are reinforced by participation in the
labour force, especially in high-skilled occupations, which tends to happen a little bit later in life. This
relationship between age and literacy and numeracy scores, including an increase of proficiency with
age to reach a peak followed by a decline, is a common finding in many adult assessments (OECD,
2013a; Shomos and Forbes, 2014). Some studies based on synthetic cohorts, allowing a better
approach of age and cohort effects, also showed that scores are likely to deteriorate with age after a
certain middle age point (Green and Riddell, 2003; Chesters and Sinning, 2013).
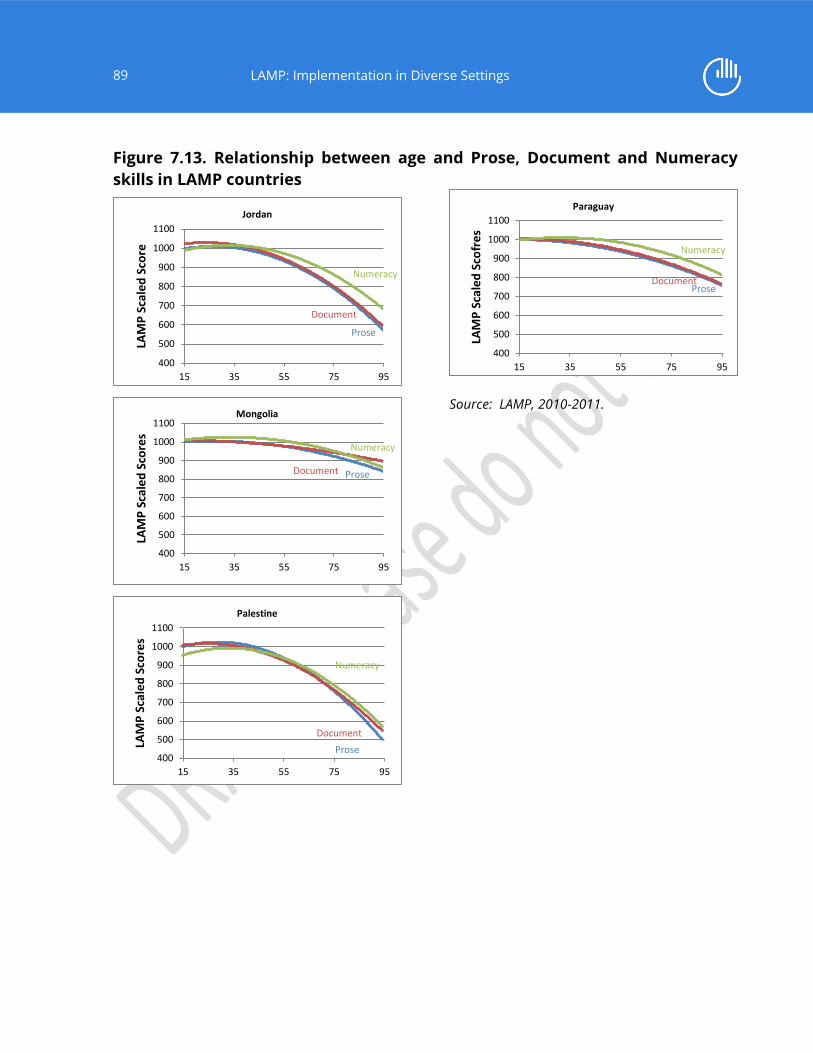
89
LAMP: Implementation in Diverse Settings
Figure 7.13. Relationship between age and Prose, Document and Numeracy
skills in LAMP countries
Source: LAMP, 2010-2011.
Prose
Document
Numeracy
400
500
600
700
800
900
1000
1100
15 35 55 75 95
LAM
P S
cale
d S
core
Jordan
Prose Document
Numeracy
400
500
600
700
800
900
1000
1100
15 35 55 75 95
LAM
P S
cale
d S
core
s
Mongolia
Prose
Document
Numeracy
400
500
600
700
800
900
1000
1100
15 35 55 75 95
LAM
P S
cale
d S
core
s
Palestine
Prose Document
Numeracy
400
500
600
700
800
900
1000
1100
15 35 55 75 95
LAM
P S
cale
d S
cofr
es
Paraguay

90
LAMP: Implementation in Diverse Settings
To sum up, younger cohorts perform better than older cohorts in all four countries and domains only when
we do not control for formal schooling. In most of these countries, the association is statistically significant
for the Prose and Document domains but not for Numeracy. However, once we control for schooling, the
picture changes, with most of the previously observed negative association between age and reading and
numeracy skills being ‘explained away’ by schooling. The association between age and Prose reading is no
longer consistent across countries. The association with Document reading remains consistently negative
but is statistically significant in only two countries. The association with Numeracy is reversed, favouring the
older cohort although not remaining statistically significant for the most part.
7.4 Literacy, numeracy and legacies: Parental education, occupation and socio-economic status
This section examines the association between parental characteristics, such as education and occupation,
and respondents’ characteristics, including education, occupation and skills. The section also explores the
association between the respondents’ socio-economic status and their skills. The information about these
variables was obtained from the Background Questionnaire administered to the LAMP sample in each
country.
i) Parents’ education as an indicator of socio-economic status
Researchers often use the educational attainment of a study respondent’s father and/or mother as a proxy
for the socio-economic status of the family of origin. Sometimes, parental educational attainment is
combined with other variables, such as parental occupation, to produce a composite measure of this latent
trait. This socio-economic status (SES) index can then be used as predictor of other variables, including
schooling and skills.
The decision to use the father’s educational attainment or the mother’s or both (separately or by combining
them into a single measure in one way or another) is not a trivial one. Many studies have shown that
education of both parents (known in combination as ‘parental education’) yields statistically significant
associations with their offspring’s educational outcomes, such as schooling, skills or attitudes towards
learning (Hausman and Szekely, 1999; Woessmann, 2004). Parental education is likely to affect parental
incomes, which in turn modify the share of resources devoted to children’s schooling, among other variables
(Chevalier, 2004; d’Addio, 2007). Parental education also modifies the value parents attach to the education
of children, as well as their willingness and capability to support their children’s education (d’Addio, 2007;
Green and Riddell, 2003). This variable is thus considered as a general proxy of educational and socio-
economic background of children at home (Woessmann, 2004).
The magnitude of the association between parents’ education and their offspring’s educational outcomes
may be larger for maternal education – at least when the respondents are children. In Pakistan, for instance,
“paternal education, occupation and students’ locality seems to cause no significant difference in attitudes
towards science learning of students whereas maternal education and occupation cause significant
difference in attitudes towards learning of science” (Shah et al., 2013, p. 35). As Butcher and Case (1994) put
it, “the effect of mother's education is larger than that of father's, which may reflect that mothers have a
greater influence on children or that mother's education is in part [a proxy] for the wealth of the household”.
In the United Kingdom, Chevalier (2004) found evidence of a larger effect of maternal education on the
probability of not dropping out of school for daughters, whereas paternal education matters for sons only,
suggesting a role model played by parents of the same sex.

91
LAMP: Implementation in Diverse Settings
In addition, the literature suggests that the mechanisms by which parents’ education and respondents’ skills
are related may be different for the father’s and the mother’s education. Although both paternal and
maternal schooling are proxies of SES of the family of origin, the latter may be more relevant as a correlate
of reading and numeracy skills. This predominant role of maternal schooling is not only related to SES but
to the interactions between parents and their children. “Academic socialization theory … posits that the
development of young children is influenced by who parents are through what parents do” (Taylor et al.,
2004). In most societies, mothers tend to be the primary caretakers, thus spending more time with their
children than fathers. As a result, what mothers do (in terms of stimulation, responsiveness, etc.) may matter
more.
Highly schooled people tend to marry other people who are similar to them in that regard and the same
happens at the other end of the educational spectrum. This phenomenon is known as ‘educational
homogamy’ and it must be taken into account when analysing the association between parental education
and respondents’ outcomes because the presence of educational homogamy ‘inflates’ the apparent effect
of each parent’s education on the respondent’s schooling or skills. One may think that either mothers or
fathers have a huge effect on their children but maternal education, in addition to contributing its own effect,
may also be acting as a proxy for paternal education – or vice versa, paternal education may also pick up the
effects of maternal education.21
ii) Parents’ education, parents’ occupation and LAMP literacy and numeracy measures
Table 7.5 summarises the educational attainment of the parents of respondents in the four countries that
administered LAMP.
Table 7.5 Educational attainment (highest completed level of education) and type of
occupation of parents (%)
Jordan Mongolia Palestine Paraguay
Highest education level
completed by mother
Primary education or less 58.6 10.3 37.4 55.5
Secondary education 34.0 60.7 57.2 38.5
Post-secondary education 7.4 29.0 5.4 6.0
Highest education level
completed by father
Primary education or less 46.4 9.9 21.5 54.2
Secondary education 37.1 60.2 65.3 38.8
Post-secondary education 16.5 29.9 13.3 7.1
At least one parent with high-skilled occupation
(ISCO 1-5) 48.3 49.9 37.3 29.3
Source: LAMP, 2010-2011.
21 Paradoxically, the somewhat interchangeable nature of these two variables is one reason why data
analysts are sometimes forced to choose only one of them as the association between them may create
difficulties if they are used together – for instance, when two highly correlated variable are used in a
multiple regression analysis. This is known as multi-collinearity.

92
LAMP: Implementation in Diverse Settings
In Jordan and Paraguay, more than half of all mothers completed primary education or less, whereas around
one third completed secondary education. In Palestine, the majority of mothers completed secondary
education. Mothers have high educational attainment in Mongolia, with 30% having completed post-
secondary education and 60% having completed secondary education. The pattern is very similar for fathers.
Regarding parental occupation, nearly half of respondents have at least one parent with a high-skilled
occupation in Jordan and Mongolia. This proportion is slightly lower in Palestine and Paraguay at 37% and
29%, respectively.
Maternal education and LAMP scores
The associations described in the previous section between parents’ education and the literacy and
numeracy scores of their children may linger long enough to be found among adults assessed in LAMP.
Figure 7.14 shows that children of mothers with post-secondary schooling or higher outperform those of
mothers with only secondary schooling in all countries and domains. This statistically significant advantage
on average score ranges from 32 to 55 points on the Prose reading scale, from 33 to 57 points on the
Document reading scale, and from 35 to 50 points on the Numeracy scale.
Figure 7.14. Mean score differences between respondents with secondary educated
mothers and respondents with post-secondary educated mothers
Source: LAMP, 2010-2011.
Maternal education is also strongly associated with the respondent’s own educational attainment. Once the
latter is controlled for, the association remains statistically significant for most skills domains and countries,
with the notable exception of Paraguay (see Figure 7.15). On the other hand, the association remains
40 20 0 20 40 60 80
Numeracy
Document
Prose
Numeracy
Document
Prose
Numeracy
Document
Prose
Numeracy
Document
Prose
PY
PS
MN
JO
Advantage Mother secondary Advantage Mother post-secondaryJO = Jordan, MN= Mongolia, PS = Palestine, PY = Paraguay

93
LAMP: Implementation in Diverse Settings
statistically significant in all three skills domain in Mongolia. However, the average LAMP score advantages
of respondents with mothers completing post-secondary education are slightly smaller when the
respondents’ own education levels are accounted for – advantages range between 4 and 27 points on the
Prose reading scale, between 20 and 32 points on the Document reading scale, and between 13 and 31
points on the Numeracy scale.
Figure 7.15. Mean score differences (adjusted for educational attainment) between
respondents with secondary educated mothers and respondents with post-
secondary educated mothers
Source: LAMP, 2010-2011.
Paternal education and LAMP scores
An analysis of the association between paternal education and respondents’ skills yields results similar to
maternal education. Before controlling for respondents’ schooling, respondents with fathers who completed
post-secondary education outperform their counterparts with fathers who completed only secondary
education in all countries and domains (see Figure 7.16). This statistically significant average score difference
ranges from 28 to 65 points on the Prose reading scale, from 24 to 72 points on the Document reading scale,
and from 40 to 45 points on the Numeracy scale.
After controlling for the respondents’ own schooling (see Figure 7.17), associations for most countries and
skills domains remain significant, except for Document in Jordan and Numeracy in Paraguay. However, the
40 20 0 20 40 60 80
Numeracy
Document
Prose
Numeracy
Document
Prose
Numeracy
Document
Prose
Numeracy
Document
Prose
PY
PS
MN
JO
Advantage Mother secondary Advantage Mother post-secondaryJO = Jordan, MN= Mongolia, PS = Palestine, PY = Paraguay

94
LAMP: Implementation in Diverse Settings
advantage held by respondents with post-secondary educated fathers becomes slightly lower, ranging from
17 to 34 points on the Prose reading scale, from 8 to 33 points on the Document reading scale, and from 13
to 22 points on the Numeracy scale.
The LAMP findings are in line with previous empirical studies, showing a performance difference in favour
of respondents with the highest parental educational attainment (Charette and Meng, 1998; Woessmann,
2004).
Figure 7.16. Mean score differences between respondents with secondary educated
fathers and respondents with post-secondary educated fathers
Source: LAMP, 2010-2011.
40 20 0 20 40 60 80
Numeracy
Document
Prose
Numeracy
Document
Prose
Numeracy
Document
Prose
Numeracy
Document
Prose
PY
PS
MN
JO
Advantage Father secondary Advantage Father post-secondaryJO = Jordan, MN= Mongolia, PS = Palestine, PY = Paraguay

95
LAMP: Implementation in Diverse Settings
Figure 7.17. Mean score differences (adjusted for educational attainment) between
respondents with secondary educated fathers and respondents with post-
secondary educated fathers
Source: LAMP, 2010-2011.
Parental occupation and LAMP scores
Parental occupation is often used as a proxy for parental income that may have a direct or indirect influence
on children’s educational outcomes. Parents’ level of resources may lead to a greater investment in children’s
education or particular parents’ beliefs and expectations shaping the educational environment at home
(Taubman, 1989; Davis-Kean, 2005).
The analysis of parental occupation in the LAMP study posed a challenge as only a small percentage of the
LAMP respondents’ mothers were employed in the group of respondents that were aged 15 years or older.
For this reason, instead of analysing separately mothers’ and fathers’ occupations, both parents’ occupations
were used to create a single variable as follows: If either parent had an occupation included in categories 1-
5 of the International Standardized Classification of Occupations (ISCO), the household was considered ‘high-
skilled’; in any other situation (i.e. both parents were not employed or employed in a low-skill occupation),
the household was considered ‘low-skilled’. As seen in Figure 7.18, the level of parental occupation is
associated with respondents’ scores in all countries and domains. Respondents with at least one parent
employed in a high-skilled occupation have a statistically significant score advantage (i.e. mean score
difference) compared to their counterparts with parents employed in a low-skilled occupation. This is true
40 20 0 20 40 60 80
Numeracy
Document
Prose
Numeracy
Document
Prose
Numeracy
Document
Prose
Numeracy
Document
Prose
PY
PS
MN
JO
Advantage Father secondary Advantage Father post-secondaryJO = Jordan, MN= Mongolia, PS = Palestine, PY = Paraguay

96
LAMP: Implementation in Diverse Settings
for all domains in all countries. The advantage ranges between 36 and 42 points in Jordan; between 61 and
63 points in Mongolia; between 40 and 51 points in Palestine; and between 63 and 89 points in Paraguay.
After controlling for the respondent’s own level of formal schooling, however, most of these advantages
cease to be statistically significant (see Figure 7.19). Only in Mongolia do the advantages remain statistically
significant in all three domains. In Palestine and in Paraguay, the advantages remain statistically significant
only in Document reading. The difference in mean score advantage in favour of respondents with parents
employed in a high-skilled occupation becomes slightly smaller, not exceeding 21, 12 and 26 points in
Mongolia, Palestine and Paraguay, respectively.
Figure 7.18. Mean score differences between respondents with at least one parent
employed in a high-skilled occupation and respondents with parents in low-skilled
occupations
Source: LAMP, 2010-2011.
100 80 60 40 20 0 20 40 60
Numeracy
Document
Prose
Numeracy
Document
Prose
Numeracy
Document
Prose
Numeracy
Document
Prose
PY
PS
MN
JO
Advantage High-skilled parents Advantage Low-skilled parentsJO = Jordan, MN= Mongolia, PS = Palestine, PY = Paraguay

97
LAMP: Implementation in Diverse Settings
Figure 7.19. Mean score (adjusted for educational attainment) differences between
respondents with at least one parent in a high-skilled occupation and respondents
with parents in lower-skilled occupations
Source: LAMP, 2010-2011.
Socio-economic status and LAMP scores
SES is often measured as a combination of education, income and occupation and is commonly
conceptualised as the social standing or class of an individual or group. However, there is no widespread
agreement on the definition of SES. Different researchers have different ways of constructing this index,
which generally depends on the data collected by a given study.
LAMP data confirm that social stratification is not equal across countries and shows that the discriminatory
power of the variables and indicators used to measure SES is country-specific. Unlike traditional household
surveys, LAMP data do not use the typical method of SES construction that is centred on household income.
The LAMP SES index was created using a variety of household related characteristics.
LAMP excluded the income variable because it was collected in relation to an individual respondent as
opposed to the household. Since LAMP assesses adults aged 15 years and up, significant proportions of the
respondents are students and retirees who generally do not earn income. Therefore, a single respondent’s
income cannot be used as a proxy for household wealth.
100 80 60 40 20 0 20 40 60
Numeracy
Document
Prose
Numeracy
Document
Prose
Numeracy
Document
Prose
Numeracy
Document
Prose
PY
PS
MN
JO
Advantage High-skilled parents Advantage Low-skilled parentsJO = Jordan, MN= Mongolia, PS = Palestine, PY = Paraguay

98
LAMP: Implementation in Diverse Settings
After exploring several methodologies and taking the structure of the background questions and their
response categories into account, we identified ‘latent class analysis’ as the most suitable methodology for
constructing an SES index. The index was constructed separately for each country. In attempting to maximise
ordinal rank positions, only indicators of variables that discriminate (in the measurement sense) were
included in the computation of the specific country’s SES index. While different input indicators were used
in the analysis, each country had four ordered categories or classes of SES by using latent class analysis.
However, it is important to note that members of the same ordinal SES class cannot be compared across
countries.
The SES categories were created using indicators from the following groupings:
Household possessions, including the availability of household appliances, communication devices,
vehicles used for transportation, agricultural land or animals
Housing characteristics and demographic conditions, including building materials for floor, roof and
walls; number of rooms/bedrooms; and availability of a special room for cooking
Education level of the head of the household
Access to utilities and infrastructure, such as sanitation facilities, sources of drinking water, waste
disposal, access to electricity, and sources of energy used for cooking.
A detailed description of the indicators and classes by country can be found in Annex 19.
The following analysis focuses on the two extreme categories for each country. Socio-economic status is
significantly associated with LAMP scores in all countries and domains. Respondents with highest SES have
higher average LAMP scores than their counterparts with lowest SES. The magnitude of the difference
between these two strata, however, varies substantially, being largest in Paraguay and smallest in Jordan.
Figure 7.20 shows that the score advantage ranges between 61 and 87 points in Jordan; 122 and 124 points
in Mongolia; 114 and 155 points in Palestine; and 142 and 162 points in Paraguay.
Once respondents’ schooling is controlled for, the association remains statistically significant in most
domains and countries, with the exceptions of Document reading in Jordan and Prose reading in Paraguay
(see Figure 7.21). Controlling for respondent’s schooling also appears to have an effect on the relative
magnitude of the difference across domains within each country. In other words, once schooling is
controlled for, SES seems to matter more for Numeracy than for the two reading domains (Palestine being
the only exception here). As we will see later, Numeracy also appears to be more closely associated with
employment than the other two skills domains and of course, SES is associated with employment.

99
LAMP: Implementation in Diverse Settings
Figure 7.20. Mean score differences between respondents with the highest SES and
respondents with the lowest SES
Source: LAMP, 2010-2011.
Figure 7.21. Mean score differences (adjusted for educational attainment) between
respondents with the highest SES and respondents with the lowest SES
Source: LAMP, 2010-2011.

100
LAMP: Implementation in Diverse Settings
7.5 Literacy, numeracy and location: Urban and rural
The urban-rural gap in skills is found both in household-based assessments and in student assessments.
This section starts with a brief review of the literature on urban-rural gaps among students and then
presents LAMP results that show similar gaps among the adult population. It should be noted that each of
the four countries that administered LAMP had its own definition of rural and urban and the report here
reflects these country-specific definitions.
Household-based assessments like LAMP reveal an urban-rural gap among adult (schooled or unschooled)
populations. They cannot, however, explain how location and the literate environment density affect the
loss, maintenance or further development of skills in adult life.
i) General differences between rural and urban populations in the LAMP sample
Rural populations in Mongolia and Paraguay have different profiles than their urban counterparts (see
Table 7.6). They have fewer years of formal schooling, participate less in non-formal education and are less
likely to report that they read and write easily, or to be students. They report lower levels of literacy practices
at home. Their parents are less likely to have had high-skilled occupations while their mothers have lower
educational attainment. Rural residents are also slightly less likely to be employed. Among those employed,
rural residents are much less likely to have high-skilled occupations (ISCO 1-5) and consistently report lower
use of both literacy and numeracy skills at work.
In Paraguay, the language of assessment (Spanish) is much more widespread in urban areas as both mother
tongue (60.1% as opposed to 41.7% in rural areas) and home language (54.3% as opposed to 12.1% in rural
areas).
This urban-rural divide is much less pronounced in Jordan and Palestine, where the proportion of people
living in rural areas is also much smaller than in the other LAMP countries. Here, urban and rural residents
have similar levels of schooling and are just as likely to be students.
ii) Literacy and numeracy of rural and urban residents
The urban-rural gap in skills reflects the profiles reviewed above. The association between location and LAMP
scores, as shown in Figure 7.22, is significant in all countries but Palestine. The magnitude of the mean
differences in favour of urban respondents is largest in Paraguay, ranging between 68 and 79 points,
followed by Mongolia with mean differences ranging between 52 and 56 points. In Jordan, the mean
difference ranges between 28 and 42 points.
However, once the respondent’s schooling is controlled for, associations cease to be statistically significant
for most countries and domains (see Figure 7.23). Only in Mongolia, the association remains statistically
significant for all three skills domains.

101
LAMP: Implementation in Diverse Settings
Table 7.6. Respondents’ profiles by gender in median age or percentages
Jordan Mongolia Palestine Paraguay
Urb
an
Ru
ral
Urb
an
Ru
ral
Urb
an
Ru
ral
Urb
an
Ru
ral
Male (%) 51.6 51.8 47.9 52.2 50.9 48.5 48.1 53.7
Age 31 30 32 34 30 29 35 31
Primary education or less (%) 25.7 33.9 5.3 24.8 10.1 9.0 25.9 57.1
Secondary education (%) 44.9 48.6 47.7 56.2 68.5 65.0 42.0 35.4
Post-secondary education (%) 29.4 17.5 47.0 19.0 21.4 26.1 32.1 7.6
Years of formal schooling 12 11 10 8 11 11 11 6
Participated in non-formal education
(in the last 12 months) (%) 10.9 8.9 17.0 7.6 10.2 13.0 15.6 8.8
Participated in literacy programme (%) 1.0 1.1 2.4 2.7 1.1 2.1 0.4 1.4
Reported to read easily (%) 94.1 92.7 98.4 91.7 93.5 92.4 95.3 81.7
Reported to write easily (%) 93.6 92.0 98.2 91.1 92.6 88.1 95.5 81.4
Student (%) 24.7 25.1 21.3 7.4 21.5 27.7 23.2 15.3
Employed (%) 31.4 27.1 43.0 39.8 30.9 25.7 59.0 51.6
High skilled occupation (ISCO 1-5) (%) 56.2 55.6 63.3 32.1 58.4 43.3 64.7 25.0
Managers (%) 4.4 3.6 8.7 4.9 8.7 8.6 11.4 5.0
Professionals (%) 4.9 3.4 30.1 14.7 15.7 9.6 16.4 5.2
Technicians (%) 9.0 6.3 4.3 2.4 10.5 10.1 9.3 3.1
Clerical support workers (%) 18.1 20.7 6.4 4.4 3.2 2.3 8.5 2.2
Service and sales workers (%) 19.9 21.6 13.8 5.7 20.3 12.6 19.2 9.4
Low skilled occupation (ISCO 6-9) (%) 43.8 44.4 36.8 67.9 41.6 56.7 35.3 75.0
Agricultural workers (%) 0.7 10.4 0.3 0.4 2.6 13.3 5.1 39.9
Craft workers (%) 18.6 10.4 1.8 1.2 16.0 13.4 13.2 16.2
Plant and machine operator (%) 0.9 0.5 9.4 5.2 6.6 6.4 2.3 2.7
Elementary occupations (%) 23.6 23.1 25.3 61.2 16.5 23.6 14.8 16.2
Literacy practices at work (0-100) 25.0 18.8 43.8 18.8 25.0 25 31.3 12.5
Numeracy practices work (0-100) 75.0 62.5 66.7 55.6 66.7 66.7 57.1 57.1
Practices at work (0-100) 50.0 40.6 55.2 35.6 45.8 42.7 46.0 30.8
Retired (%) 5.7 6.8 8.6 9.6 1.1 0.8 6.1 1.1
Practices at home (0-100) 55.9 50.0 61.8 41.2 52.9 50.0 58.8 44.1
Years of schooling of the mother 3 0 12 6 6 6 6 3
High skilled parents (ISCO 1-5) 49.3 43.4 56.7 25.5 38.1 32.5 39.5 13.5
Source: LAMP, 2010-2011.

102
LAMP: Implementation in Diverse Settings
Figure 7.22. Mean score differences between urban and rural residents
Source: LAMP, 2010-2011.
Figure 7.23. Mean score (adjusted for educational attainment) differences between
urban and rural residents
Source: LAMP, 2010-2011.

103
LAMP: Implementation in Diverse Settings
7.6 Literacy, numeracy and leisure: The use of skills at home
Although schooling remains the most important predictor of skills, what happens after respondents leave
school may be just as important. There is a growing body of literature on skill loss. Some of it focuses on the
mismatch of skills in the workplace and the subsequent deterioration of the competencies that are not used
in that setting (OECD, 2013a). Actual skill loss cannot be measured directly by a cross-sectional assessment
like LAMP (this limitation also applies to IALS, ALL, PIAAC and STEP), as this would require at least two
measures at different points in time. LAMP can, however, collect information on those practices (at the
workplace and beyond) that are likely to prevent skill loss. This section will focus on the use of skills during
leisure as an output (or at least a correlate) of schooling and a predictor of skills.
Literacy practices are the activities that expose individuals to written materials or formal language at home
and in daily life, outside work. This may be in the form of printed texts, through information and
communication technologies (ICTs) or digital media, and through attendance of cultural activities.
Respondents were asked a series of questions about the literacy-related activities they engage in during
leisure time. These data, which yield information that is subjective and ordinal in nature, was then analysed
and used to construct an index of literacy practices.
First, a set of questions was selected – the answers to which provide indicator data to be included in the
analysis. Some of the questions include:
How often do you read instructions before taking medicine or the labels printed on food product
packages, such as ingredients or nutritional value?
Have you communicated via text messaging?
Have you visited a trade fair, attended a professional conference, visited a museum or an art gallery?
Have you used a computer? Did this computer have access to the Internet?
Have you used the Internet to get in touch with other people through social networks? To search for
information? To read the news?
Second, a latent class analysis was performed separately by country using the same set of variables (see
Annex 20 for the complete list of variables included in the analysis). This technique affords an understanding
of how data cluster together, and highlights the traits that separate groups of users from each other. An
identical number of groups with the same traits that separate them were identified across the four countries
– although the size of these groups differed across countries. These groups can be characterised as follows:
Broadcast media users who in their spare time make little use of their literacy skills (if they have
them) and as a result, may lose them. Most of the exposure to literacy for this group comes from
listening to the radio and watching television.
Mobile phone users who use their literacy skills when they need them (food and medicine labels,
personal finances) but also sometimes for pleasure (books and magazines) and most of all, to stay
in touch with others (texting).
Computer users who rely on their literacy skills for a wide range of leisure activities, involving the
Internet, a variety of print media and cultural events.

104
LAMP: Implementation in Diverse Settings
Third, given that the results of latent class analysis yielded consistent results across the four countries, it
became possible to construct a point-scale of engagement in literacy activities using the selected indicators,
and to choose cut-points along this scale to define the three categories of users: broadcast media, mobile
phone and computer users.
As Figure 7.24 shows, respondents with higher levels of schooling tend to engage to different degrees in the
three practices that involve using reading or numeracy skills. The practices may predict skills independently
of schooling.
Figure 7.24. Literacy practices outside work by educational attainment
Source: LAMP, 2010-2011.
As seen in Figure 7.25, mobile phone users outperform broadcast media users in all countries and domains.
All differences are statistically significant. Within each country, the difference is largest in Prose reading, then
in Documents reading, while Numeracy always shows the smallest difference. This is consistent with the
types of practices that mobile phone users engage in, which involve reading to a greater extent than
numeracy. In terms of variations across countries, Palestine shows the largest differences, ranging between
217 and 282 points, closely followed by Jordan with mean differences ranging between 170 and 240 points.
Mongolia yielded the smallest differences, which range from 60 to 66 points.
Figure 7.26 shows the difference in means after adjusting for schooling. After controlling for respondents’
schooling, all differences remain statistically significant. The relative magnitudes of the differences across
countries become even more obvious, from largest in Palestine and Jordan to smallest in Mongolia. However,
the score advantage in favour of mobile phone users is largely reduced, falling to 21 points in Mongolia and
not exceeding 110 points in Palestine, where that advantage is the largest.

105
LAMP: Implementation in Diverse Settings
Figure 7.25. Mean score differences between broadcast media users and mobile
phone users
Source: LAMP, 2010-2011.
Figure 7.26. Mean score differences (adjusted for educational attainment) between
broadcast media users and mobile phone users
Source: LAMP, 2010-2011.

106
LAMP: Implementation in Diverse Settings
It is also possible to compare mobile phone users and computer users. Figure 7.27 shows that computer
users outperform mobile phone users in all countries and domains. The mean differences are much smaller
between these two groups than between broadcast media users and mobile phone users, varying only
between 40 and 76 points.
Figure 7.28 shows the mean difference after adjusting for schooling. After controlling for respondent’s
schooling, all associations remain statistically significant. However, the score advantage in favour of
computer users is reduced in all domains and in all countries. As for variations across domains, the
magnitude of the difference is largest in Document reading in three of the four countries – the exception
being Mongolia.
Figure 7.27. Mean score differences between mobile phone users and computer
users
Source: LAMP, 2010-2011.
Figure 7.28. Mean score (adjusted for educational attainment) differences between
mobile phone users and computer users
Source: LAMP, 2010-2011.

107
LAMP: Implementation in Diverse Settings
7.7 Literacy, numeracy and livelihood: The use of skills at work
This section focuses on three aspects of the relationship between employment and skills. First, the analysis
presents the differences between respondents who are employed and not employed. Then, for those who
are employed, the analysis focuses on the differences between high-skilled and low-skilled occupational
categories as defined by ISCO. Finally, also for those who are employed, the focus shifts to the workplace
practices reported by the respondents and their association with skills.
i) Employment and literacy and numeracy scores on LAMP
Figure 7.29 shows that respondents who are currently employed systematically outperform those who are
not. The differences are statistically significant in all countries and skills domains with the exception of Prose
and Document reading in Paraguay. Within each country, the difference is largest in Numeracy. The
advantage on the Numeracy scale ranges from 30 to 61 points, with Paraguay having the lowest scores
difference and Palestine the largest.
As seen in Figure 7.30, after controlling for respondent’s schooling, the difference continues to be
statistically significant in Numeracy in all countries but not in the reading domains, with the sole exception
of Prose in Mongolia. However, the advantage in favour of employed respondents is largely reduced after
accounting for educational attainment. The lowest score difference is found in Paraguay, where employed
respondents outperform their unemployed counterparts by 16 points. The largest difference (31 points) is
observed in Palestine.
ii) Occupational level and literacy and numeracy scores on LAMP
Respondents employed in ‘high-skilled’ occupations (those in categories 1-5 of ISCO) outperform other
employed respondents in all countries and skills domains as seen in Figure 7.31. The differences, which are
all statistically significant, are largest in Paraguay, ranging between 96 and 108 points, and smallest in Jordan,
ranging between 40 and 60 points.
Figure 7.29 Mean score differences between employed and unemployed
respondents
Source: LAMP, 2010-2011.

108
LAMP: Implementation in Diverse Settings
Figure 7.30. Mean score (adjusted for educational attainment) differences between
employed and unemployed respondents
Source: LAMP, 2010-2011.
Figure 7.31. Mean score differences between high-skilled and low-skilled employed
respondents
Source: LAMP, 2010-2011.

109
LAMP: Implementation in Diverse Settings
Figure 7.32. Mean score (adjusted for educational attainment) differences between
high-skilled and low-skilled employed respondents
Source: LAMP, 2010-2011.
Figure 7.32 shows the results after adjusting for educational attainment. After adjusting for respondent’s
schooling, several of those associations are no longer statistically significant. Only in Mongolia, the
association between skills and occupational level remains significant in all three domains. Document reading
stands out compared to the other domains since its association with the occupational category remains
positive in all countries and statistically significant in three of the four countries. For Jordan, Prose reading
and Numeracy show an advantage for the low-skilled occupations.
iii) The use of reading and numeracy skills in the workplace related to literacy and numeracy scores on
LAMP
For each educational level, participants were classified into one of three literacy and numeracy work practice
categories: no practice, low diversity practice and high diversity practice. The information on which to base
classification into these categories came from the Background Questionnaire/Literacy and numeracy
activities, similar to those used to classify responses in leisure activities but focussed more on the work
settings used. The bars in Figure 7.33 represent the percentage of participants in each educational
attainment group that engages in these work practices. As Figure 7.33 shows, respondents with higher levels
of schooling tend to engage in a highly diverse array of practices at work that engage their reading or
numeracy skills. For post-secondary educated respondents, 34% to 61% engage in highly diverse reading
and numeracy tasks in their workplace, whereas less than 10% of primary or less educated respondents do
so.

110
LAMP: Implementation in Diverse Settings
Figure 7.33. Literacy and numeracy practices at work by educational attainment
Source: LAMP, 2010-2011.
Figure 7.34 shows the mean LAMP score differences for respondents who engaged in low and medium
diversity of literacy and numeracy tasks at work. Those engaged in medium diversity of literacy and
numeracy tasks score higher on LAMP in all three domains. The use of reading and writing at work as
reported by the respondents is associated with reading skills. Respondents who claim never to read or write
at work systematically perform at a lower level in all countries and domains. The smallest differences are in
Mongolia and Palestine.
Figure 7.35 shows the difference after adjustment for educational attainment. All differences are much
smaller. Thus, educational attainment, which is linked to occupational level, is highly related to the use of
literacy and numeracy at work.
It is also possible to compare LAMP performance for those reporting that they use little or no literacy or
numeracy skills at work with those who report a medium level of diverse use of these skills. Figure 7.36
shows mean differences in each country and in each domain before adjusting for educational attainment.
Figure 7.37 shows the results after adjusting for educational attainment. After controlling for respondents’
schooling, half of those differences cease to be statistically significant but no clear pattern emerges.

111
LAMP: Implementation in Diverse Settings
Figure 7.34. Mean score differences between respondents with low diversity and
respondents with medium diversity of literacy and numeracy practices at work
Source: LAMP, 2010-2011.
Figure 7.35. Mean score (adjusted for educational attainment) differences between
respondents with low diversity and respondents with medium diversity of literacy
and numeracy practices at work
Source: LAMP, 2010-2011.

112
LAMP: Implementation in Diverse Settings
Figure 7.36. Mean score differences between respondents with no practice and
respondents with medium diversity of literacy practices at work
Source: LAMP, 2010-2011.
Figure 7.37. Mean score differences (adjusted for educational attainment) between
respondents with no practice and respondents with medium diversity of literacy
practices at work
Source: LAMP, 2010-2011.

113
LAMP: Implementation in Diverse Settings
Figures 7.38 and 7.39 show differences between the low diversity literacy and numeracy practices and
medium diversity practices groups. Before adjustment for educational attainment, all differences favour the
medium diversity group over the low diversity group in all countries for all domains, except for numeracy in
Palestine. In the Palestine sample, respondents with low diversity have larger mean scores on Prose reading.
After adjustment for educational attainment, all differences become much smaller – in Palestine, this
difference of a larger mean score on average Prose reading still exists. In addition, respondents in Jordan in
the low diversity group now have a higher mean numeracy score. The meaning of this result is unclear.
Figure 7.38. Mean score differences between respondents with low diversity and
respondents with medium diversity of numeracy practices at work
Source: LAMP, 2010-2011.
Figure 7.39. Mean score (adjusted for educational attainment) differences between
respondents with low diversity and respondents with medium diversity of
numeracy practices at work
Source: LAMP, 2010-2011.

114
LAMP: Implementation in Diverse Settings
7.8 Summary
This chapter reports analyses of several socio-demographic variables that were related to respondents’
performance on the three domains measured by LAMP. These variables were gender, learning (educational
attainment), lifespan (age and cohort), legacies (parental education, occupation and SES), location (urban
and rural), leisure (use of reading and numeracy skills outside of work) and livelihood (use of reading and
numeracy skills at work). Consistent with other studies of literacy and numeracy, average LAMP performance
in all three domains is higher for respondents with higher levels of education in all countries. In numeracy,
significant percentages of those with primary education or less scored at LAMP Level 2 or higher in three of
the four countries (Mongolia, Palestine and Paraguay).
When LAMP performance was studied in relation to gender, men scored higher than women in numeracy in
all countries except Mongolia, where women have a higher educational attainment than men. When scores
were adjusted for level of educational attainment, the advantage of men in LAMP numeracy persisted, even
in Mongolia. For Prose reading, there was a small advantage for men over women in two countries (Jordan
and Palestine) but an advantage for women in two other countries (Mongolia and Paraguay). After taking
educational attainment into account, women generally had an advantage over men in Prose reading. In
Document reading, men and women had statistically similar scores in two countries (Mongolia and
Paraguay), while in two other countries (Jordan and Palestine), LAMP Document reading was higher for men.
After taking educational attainment into account, the advantage of men still persisted.
When age was studied in relation to LAMP performance, it was found that younger participants had a
statistically significant advantage in Prose and Document reading. Numeracy was not statistically different
for younger and older respondents, and the differences were generally small. When average differences
were adjusted for educational attainment, the differences in Prose reading between older and younger
participants became smaller and were reversed for Mongolia and Paraguay (i.e. scores for the older
comparison groups were higher). When Document reading average scores were adjusted for education level,
no differences between younger and older groups remained statistically significant. In Numeracy, there were
no statistically significant differences between the age groups except in one country (Mongolia). LAMP is
unique in that it studied numeracy for participants aged 65 and older. The results showed that this group
had statistically lower average numeracy scores in each country. When the full range of ages was studied in
relation to LAMP scores, there was a downward curvilinear relationship. In all four countries, on all domains,
there tended to be a slight peak in performance around age 35, then scores became lower as age increased.
The scores of participants in LAMP were related to maternal education level. Participants with mothers who
attained post-secondary education scored significantly higher than participants who had mothers with lower
educational completion. A similar pattern was observed when fathers’ educational attainment was studied
in relation to participants’ scores. Participants with parents in high-skilled occupations also scored higher in
all LAMP domains. This difference favouring high-skilled occupation parents persisted after adjusting scores
for the participants’ own educational attainment but the differences were smaller. Participants whose
parents had the highest SES scored higher than participants whose parents had the lowest SES. This
advantage persisted after adjusting the scores for the participants’ own level of educational attainment.
Participants from urban areas scored higher on average than participants from rural areas. This was true
even after taking into account the participants’ educational attainment, though after adjustment the
differences between urban and rural participants became very small.
115
LAMP: Implementation in Diverse Settings
Participants who used mobile phones had higher scores than participants who relied solely on media
broadcasts. Further, those using computers had higher scores than those using only mobile phones. This
advantage for computer users persisted even after adjusting for educational attainment, though the
advantage in mean difference was much smaller.
Employed participants had higher scores than unemployed participants, even after taking into account
educational attainment. Participants with high-skilled occupations had higher LAMP scores but when
adjusted for education attainment, this advantage became very small. The more participants used their
reading and numeracy skills at work, the higher their LAMP scores. This advantage persisted in most
countries when scores were adjusted for educational attainment of the participants, although the advantage
was not great.
Thus, LAMP scores are related to many socio-demographic variables but the relationships are generally less
strong after participants’ education levels are taken into account. Education seems to be the key factor for
attaining literacy and numeracy as measured by LAMP.
Some policy implications
These data confirm that policies aimed at increasing gender equity in the distribution of reading and
numeracy skills should go beyond the schooling system. The policies should also target the labour market
and the use of skills both at work and for leisure.
As access to schooling approaches gender parity, female employment rates still lag behind those of males.
Given that those women who are already employed tend to be concentrated in high-skill occupations, an
increase in their overall participation may reduce the skills gap substantially if their occupational profile is
maintained. This may be particularly important for numeracy skills
As for literacy practices for leisure, they have the potential to help narrow the gap in the other two skills
domains. This type of use seems to be relatively gender-neutral as compared to the workplace. Policymakers
should find ways to foster literacy practices not only among women but among older respondents and rural
residents – older rural women, in particular.

116
LAMP: Implementation in Diverse Settings
Chapter 8. A case study of literacy and language: Mother tongue, home language and
bilingual status
Three of the four countries included in this report are fairly homogeneous in the languages spoken at home
or as mother tongues. The exception is Paraguay, where a significant proportion of the population is bilingual
in Guarani and Spanish, and where interesting differences can be found across geographical locations and
social strata.
This chapter will focus on Paraguay to illustrate the kind of in-depth analysis that LAMP data allow. The
chapter is concerned with language although similar analyses could be performed in the future by focusing
on any of the other variables mentioned in this report, such as gender, age, location and socio-economic
status (SES).
The chapter starts with a descriptive analysis similar to other topics presented in this report. Then, in an
effort to focus on language issues, a number of control variables introduced in previous sections are added
to the analysis.22
8.1 A tale of two languages: Bilingualism, diglossia and literacy in Paraguay
“Bilingualism and multilingualism are normal, unremarkable necessities of everyday life for the majority of
the world’s population” (Romaine, 2008, p. 445). Yet, no matter how “normal” this phenomenon may be on
a global scale, Paraguay still stands out as a practical example of societal bilingualism.
Table 8.1 shows that among LAMP respondents, 86% report speaking Guarani well enough to carry a
conversation (responded “Yes” for Guarani) and that 80% claim to be able to do the same in Spanish
(responded “Yes” for Spanish). Based on their self-reports, two thirds of Paraguayan respondents (66.5%)
could be considered Spanish-Guarani bilinguals.
Although clearly both languages are widespread, individuals have different degrees of exposure to each
language. For instance, they may speak Spanish or Guarani as mother tongue or as a second language.23 In
Paraguay, many people have more than one mother tongue. In the LAMP sample, more than three quarters
of Paraguayans (78.7%) report Guarani among their mother tongues while more than half (52.1%) report
Spanish as one of them, and almost a third (32%) report both (see Table 8.2).
22 To enable the use of multiple controls, a slightly different methodology will be used for this section.
Previous sections have used the methodology of plausible values to estimate means. However, the
software used at the UIS for this methodology does not allow for the simultaneous use of several socio-
demographic correlates. For that reason, instead of plausible values, this chapter will use a weighted
least-squares estimation (WLE) method. The main consequence of using this method (in addition to the
possibility of using multiple socio-demographic correlates of skills simultaneously in the analysis) is that
these estimates of skills are only available for respondents who were actually administered the Prose,
Document and Numeracy instruments. As a result, this analysis does not include respondents for whom
the skills estimates were imputed based on their socio-demographic characteristics. 23 ‘Mother tongue’ is defined here as the language that someone first learnt to speak and can still understand in
adulthood.

117
LAMP: Implementation in Diverse Settings
Table 8.1. Distribution of the two main spoken languages in percentage among
Prose, Document and Numeracy respondents
Guarani
Yes No Total
Spanish
Yes 66.5 13.2 79.7
No 19.8 0.5 20.3
Total 86.3 13.7 100.0
Source: LAMP, 2011.
Table 8.2. Distribution of the two main mother tongues in percentage among Prose,
Document and Numeracy respondents
Guarani is mother tongue Total
Yes No
Spanish is mother tongue
Yes 32.3 19.8 52.1
No 46.4 1.5 47.9
Total 78.7 21.3 100.0
Source: LAMP, 2011.
Oftentimes bilingualism is not just about who speaks which language(s). It is also about where, when, to
whom, and for which purpose: “many bilingual communities are characterized by diglossia, … a kind of
functional specialization between languages (referred to as High and Low24) so that the language used within
the home and in other personal domains of interaction between community members is different from the
one used in higher functions such as government, media, education (Ferguson, 1959; Fishman, 1967)”
(Romaine, 2008, p. 454). Some famous examples of this are French and Creole in Haiti; Standard and Dialectal
Arabic; and Ancient and Modern Greek (Romaine, 2008). “For instance, [high or H] is used in public
administration, schooling, mass media, business and commerce, while [low or L] is used within the context
of home and family, social and cultural activities in the community, and correspondence with relations and
friends (Baker, 2006)” (Ito, 2012, p. 3). This distinction is extremely important for literacy.
According to Wei, “Examples of simple binary diglossia include Guarani vs. Spanish in Paraguay” (Wei, 2013,
p. 31). Even if “Guarani has obtained the same official status as Spanish” (Ito, 2012, p. 3), in terms of their
use, Spanish is “the official language of government and education, while Guarani, spoken by 90% of the
population, is … the language of most homes and everyday informal interaction” (Romaine, 2013, p. 454).
24 These terms do not intend to convey a statement of value about the language themselves. They refer to
the social status of the languages as a result of their respective uses for formal and informal
communication. Although not without controversy, they have become the standard terms used to refer
to two languages in a diglossic situation since the introduction of this concept by Ferguson in 1959.

118
LAMP: Implementation in Diverse Settings
LAMP data in Figure 8.1 confirm the different social functions of these two languages: Guarani is the
predominant home language (61%) while almost all respondents (92%) learnt to read in Spanish first.25
Consistently, the vast majority of respondents (86%) declare to be able to read and write “easily” in Spanish
yet only one third report having those same skills in Guarani (35% for reading and 31% for writing) (see
Table 8.3).
Figure 8.1. Language most spoken at home and language in which the respondent
first learnt to read
Source: LAMP, 2011.
Table 8.3 Distribution of home language and first language read in percentage
among Prose, Document and Numeracy respondents
Percentage that declares to be
able to read easily in…
Percentage that declares to
be able to write easily in…
Guarani Spanish Guarani Spanish
35 86 31 86
Source: LAMP, 2011.
25 Although LAMP did not collect extensive data on this, Spanish is usually the means of instruction for all
levels of schooling while Guarani is sometimes taught as a subject. Spanish is much more prevalent in
print media, although there are books and other materials (either translations or originals) published in
Guarani as well.
60.6
1.9
37.2
92.4
2.2 5.7
0%
10%
20%
30%
40%
50%
60%
70%
80%
90%
100%
Language most spoken athome
Language in which therespondent first learnt to
read
Other languages
Spanish
Guarani

119
LAMP: Implementation in Diverse Settings
This distinction between languages in terms of their functions and settings is paralleled by a distinction
between speakers in terms of their social status. “Given that H is used in official domains, the speakers of H
benefit socioeconomically from their ability to speak that language while the speakers of L are
disadvantaged. Consequently, the speakers of L start favouring and learning H, usually to the detriment of
L” (Ito, 2012, p. 3).
Among LAMP respondents, language exposure and proficiency are associated with socio-demographic
factors.26 Native Spanish-speakers (whether mono- or multi-lingual) are younger and have more years of
schooling: 10.5 years as opposed to 7.8 years among non-native speakers (see Table 8.4). They are more
likely to be students, live in urban areas, use computers and have a high-skilled occupation, as well as to
have parents with high-skilled occupations. Their mothers have more schooling: 6.52 years, compared to
3.98 years among non-native speakers. Curiously enough, in a country with relative gender parity in
education, they are also more likely to be male. In summary, native Spanish-speakers have, on average,
higher social status than respondents who do not count Spanish among their mother tongues.
Table 8.4. Profile of Prose, Document and Numeracy respondents by Spanish mother
tongue
Mean
Spanish is mother tongue
Yes No
Years of schooling of the respondent 10.5 7.8
Years of schooling of the respondent’s mother 6.5 3.9
Literacy practices at home (0-100) 63.5 48.2
n 2,016 1,757
Source: LAMP, 2011.
It is worth noting that the situation of Guarani speakers in Paraguay is not comparable to that of linguistic
minorities in many other countries. To begin with, in quantitative terms, Guarani-speakers are actually the
majority.
It may help the reader to compare the Paraguayan situation with other well-known examples of multilingual
societies. In Canada, for instance, there are three main types of linguistic minority situations: aboriginal
peoples; immigrants with a mother tongue other than English or French; and official-language minority
populations (i.e. English speakers in predominantly French-speaking regions such as Quebec, or French
speakers in predominantly English-speaking regions such as New Brunswick, Ontario or Manitoba) (Corbeil,
Chavez, and Pereira, 2010). The situation of Guarani-speakers in Paraguay does not closely resemble any of
those three. Guarani speakers are not necessarily aboriginal – in fact, aboriginal peoples in Paraguay often
speak languages other than Guarani or Spanish. Guarani is not an immigrant language as most immigrants
in Paraguay speak German, Japanese or Portuguese, although many of them learn Guarani once they are
settled. Finally, although Guarani is an official language on par with Spanish, this does not mean the same
26 Oral language proficiency is as reported by respondents, since it was not directly assessed.

120
LAMP: Implementation in Diverse Settings
as in Canada.27 Guarani is not normally used as the means of instruction in school. As a result, based on a
decision made by the national LAMP team, and subsequently supported by the UIS, LAMP did not assess
reading and numeracy in Guarani but only in Spanish.
8.2 Hypotheses about performance on LAMP
How is all of this relevant to reading and numeracy skills? Oral language is related to literacy skills in a
number of ways, including: (1) language as an indicator of social stratification; (2) language match between
the respondent’s skills and the assessment’s demands; and (3) the ‘bilingual advantage’. This section explores
how these three hypotheses predict performance in the three LAMP domains across different language
groups.
1. Language as an indicator of social stratification. Exposure to and proficiency in a given language may
be associated with other characteristics such as location, age and SES of the family of origin. These are
also associated with reading and numeracy skills, as well as with schooling. As a result, part of the
association between language and skills may actually be due to some of those other characteristics, for
which language may be acting as a ‘proxy’.
Prediction: In Paraguay, where exposure to Spanish is positively associated with SES and other socio-
demographic factors, native Spanish-speakers would be expected to outperform other respondents in
all three LAMP domains. However, after controlling for socio-economic factors, this association should
decrease or even disappear – i.e. cease to be statistically significant – at least in some of those domains
(see following hypothesis).
2. Language match. Native speakers of the language of assessment tend to outperform other
respondents in literacy tests.
Prediction: In Paraguay, after controlling for socio-economic factors, native Spanish-speakers would be
expected to outperform other respondents, especially in the Prose and Document domains but
probably less so in Numeracy.
3. The ‘bilingual advantage’. A growing yet controversial field of research deals with the consequences,
either positive or negative, of bilingualism on cognition and literacy development. Although this debate
is beyond the scope of this document (Bialystok, 2012; Kousaie et al., 2014), the relevance of this question
and the richness of the Paraguayan LAMP data warranted some exploration.
Prediction: Among respondents with similar levels of command of the language of assessment (namely,
Spanish), bilingual respondents will outperform monolingual respondents in one or more skills
domains.
27 In Canada, PIAAC used either English or French as the language of assessment. This reflects the fact that
either language is used as means of instruction, depending on the region.
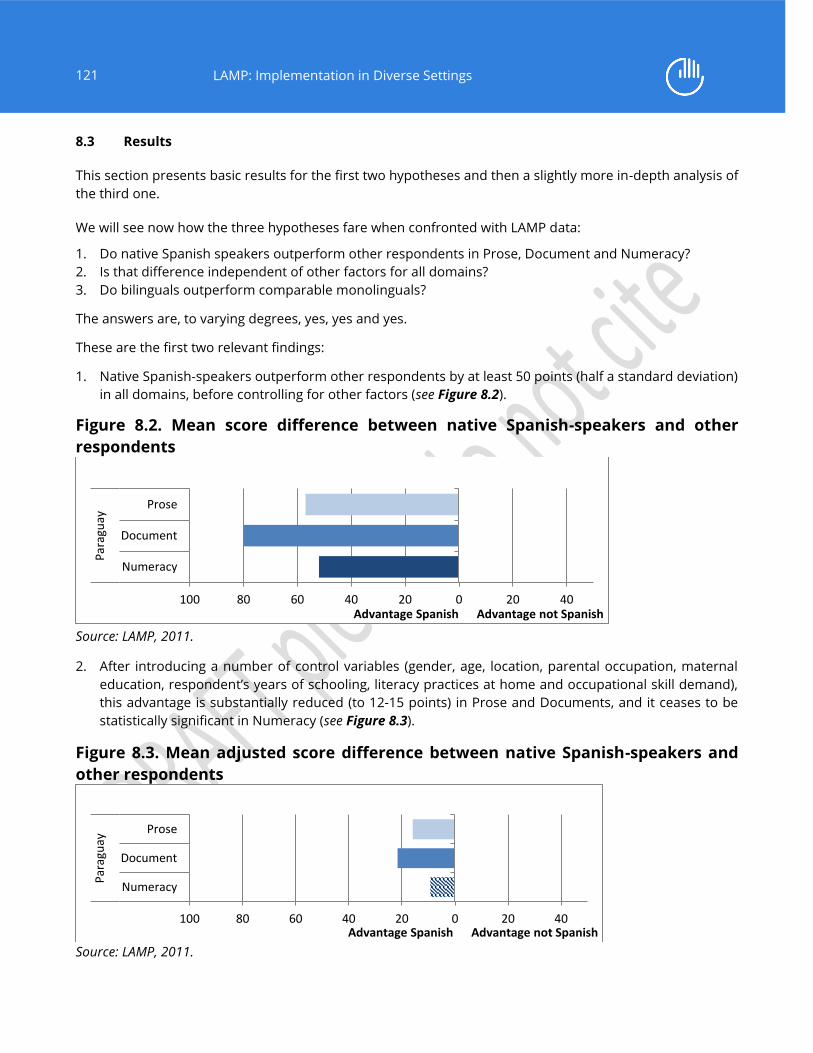
121
LAMP: Implementation in Diverse Settings
8.3 Results
This section presents basic results for the first two hypotheses and then a slightly more in-depth analysis of
the third one.
We will see now how the three hypotheses fare when confronted with LAMP data:
1. Do native Spanish speakers outperform other respondents in Prose, Document and Numeracy?
2. Is that difference independent of other factors for all domains?
3. Do bilinguals outperform comparable monolinguals?
The answers are, to varying degrees, yes, yes and yes.
These are the first two relevant findings:
1. Native Spanish-speakers outperform other respondents by at least 50 points (half a standard deviation)
in all domains, before controlling for other factors (see Figure 8.2).
Figure 8.2. Mean score difference between native Spanish-speakers and other
respondents
Source: LAMP, 2011.
2. After introducing a number of control variables (gender, age, location, parental occupation, maternal
education, respondent’s years of schooling, literacy practices at home and occupational skill demand),
this advantage is substantially reduced (to 12-15 points) in Prose and Documents, and it ceases to be
statistically significant in Numeracy (see Figure 8.3).
Figure 8.3. Mean adjusted score difference between native Spanish-speakers and
other respondents
Source: LAMP, 2011.
100 80 60 40 20 0 20 40
Numeracy
Document
Prose
Par
agu
ay
Advantage Spanish Advantage not Spanish
100 80 60 40 20 0 20 40
Numeracy
Document
Prose
Par
agu
ay
Advantage Spanish Advantage not Spanish
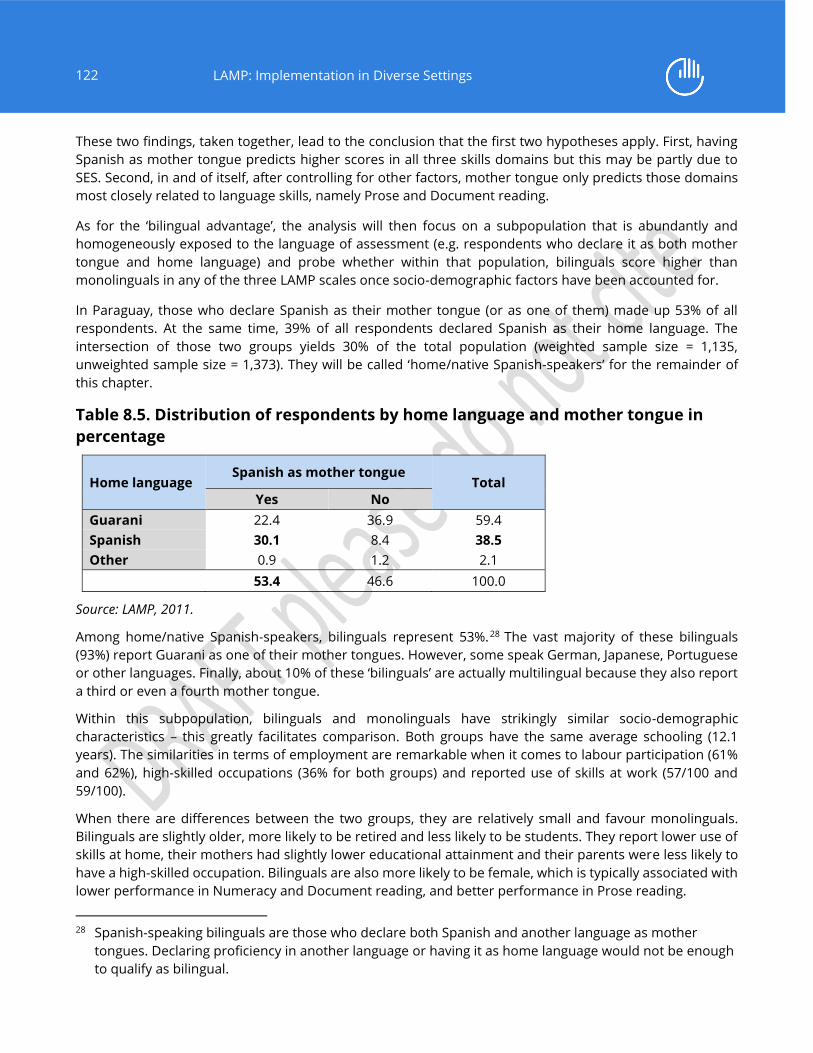
122
LAMP: Implementation in Diverse Settings
These two findings, taken together, lead to the conclusion that the first two hypotheses apply. First, having
Spanish as mother tongue predicts higher scores in all three skills domains but this may be partly due to
SES. Second, in and of itself, after controlling for other factors, mother tongue only predicts those domains
most closely related to language skills, namely Prose and Document reading.
As for the ‘bilingual advantage’, the analysis will then focus on a subpopulation that is abundantly and
homogeneously exposed to the language of assessment (e.g. respondents who declare it as both mother
tongue and home language) and probe whether within that population, bilinguals score higher than
monolinguals in any of the three LAMP scales once socio-demographic factors have been accounted for.
In Paraguay, those who declare Spanish as their mother tongue (or as one of them) made up 53% of all
respondents. At the same time, 39% of all respondents declared Spanish as their home language. The
intersection of those two groups yields 30% of the total population (weighted sample size = 1,135,
unweighted sample size = 1,373). They will be called ‘home/native Spanish-speakers’ for the remainder of
this chapter.
Table 8.5. Distribution of respondents by home language and mother tongue in
percentage
Home language Spanish as mother tongue
Total
Yes No
Guarani 22.4 36.9 59.4
Spanish 30.1 8.4 38.5
Other 0.9 1.2 2.1 53.4 46.6 100.0
Source: LAMP, 2011.
Among home/native Spanish-speakers, bilinguals represent 53%.28 The vast majority of these bilinguals
(93%) report Guarani as one of their mother tongues. However, some speak German, Japanese, Portuguese
or other languages. Finally, about 10% of these ‘bilinguals’ are actually multilingual because they also report
a third or even a fourth mother tongue.
Within this subpopulation, bilinguals and monolinguals have strikingly similar socio-demographic
characteristics – this greatly facilitates comparison. Both groups have the same average schooling (12.1
years). The similarities in terms of employment are remarkable when it comes to labour participation (61%
and 62%), high-skilled occupations (36% for both groups) and reported use of skills at work (57/100 and
59/100).
When there are differences between the two groups, they are relatively small and favour monolinguals.
Bilinguals are slightly older, more likely to be retired and less likely to be students. They report lower use of
skills at home, their mothers had slightly lower educational attainment and their parents were less likely to
have a high-skilled occupation. Bilinguals are also more likely to be female, which is typically associated with
lower performance in Numeracy and Document reading, and better performance in Prose reading.
28 Spanish-speaking bilinguals are those who declare both Spanish and another language as mother
tongues. Declaring proficiency in another language or having it as home language would not be enough
to qualify as bilingual.
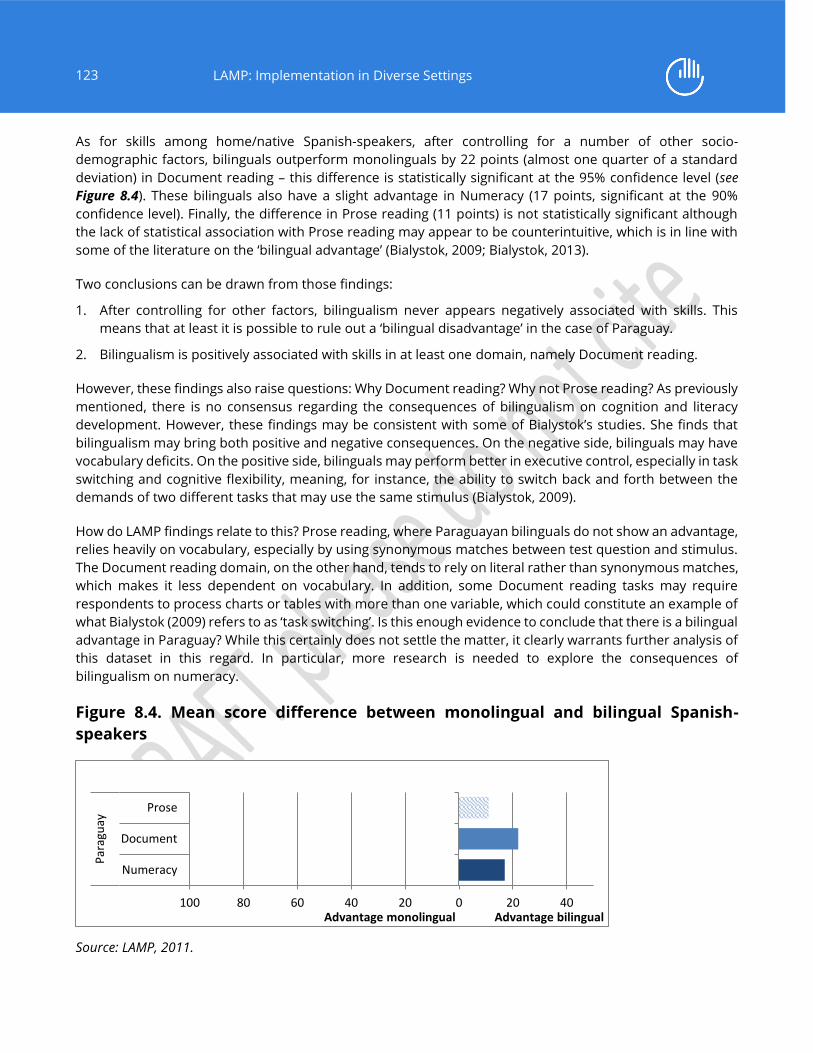
123
LAMP: Implementation in Diverse Settings
As for skills among home/native Spanish-speakers, after controlling for a number of other socio-
demographic factors, bilinguals outperform monolinguals by 22 points (almost one quarter of a standard
deviation) in Document reading – this difference is statistically significant at the 95% confidence level (see
Figure 8.4). These bilinguals also have a slight advantage in Numeracy (17 points, significant at the 90%
confidence level). Finally, the difference in Prose reading (11 points) is not statistically significant although
the lack of statistical association with Prose reading may appear to be counterintuitive, which is in line with
some of the literature on the ‘bilingual advantage’ (Bialystok, 2009; Bialystok, 2013).
Two conclusions can be drawn from those findings:
1. After controlling for other factors, bilingualism never appears negatively associated with skills. This
means that at least it is possible to rule out a ‘bilingual disadvantage’ in the case of Paraguay.
2. Bilingualism is positively associated with skills in at least one domain, namely Document reading.
However, these findings also raise questions: Why Document reading? Why not Prose reading? As previously
mentioned, there is no consensus regarding the consequences of bilingualism on cognition and literacy
development. However, these findings may be consistent with some of Bialystok’s studies. She finds that
bilingualism may bring both positive and negative consequences. On the negative side, bilinguals may have
vocabulary deficits. On the positive side, bilinguals may perform better in executive control, especially in task
switching and cognitive flexibility, meaning, for instance, the ability to switch back and forth between the
demands of two different tasks that may use the same stimulus (Bialystok, 2009).
How do LAMP findings relate to this? Prose reading, where Paraguayan bilinguals do not show an advantage,
relies heavily on vocabulary, especially by using synonymous matches between test question and stimulus.
The Document reading domain, on the other hand, tends to rely on literal rather than synonymous matches,
which makes it less dependent on vocabulary. In addition, some Document reading tasks may require
respondents to process charts or tables with more than one variable, which could constitute an example of
what Bialystok (2009) refers to as ‘task switching’. Is this enough evidence to conclude that there is a bilingual
advantage in Paraguay? While this certainly does not settle the matter, it clearly warrants further analysis of
this dataset in this regard. In particular, more research is needed to explore the consequences of
bilingualism on numeracy.
Figure 8.4. Mean score difference between monolingual and bilingual Spanish-
speakers
Source: LAMP, 2011.
100 80 60 40 20 0 20 40
Numeracy
Document
Prose
Par
agu
ay
Advantage monolingual Advantage bilingual

124
LAMP: Implementation in Diverse Settings
This has some important implications. This section has already established that having Spanish as a mother
tongue is associated with higher performance in all skills domains, and that after controlling for a number
of socio-demographic factors, this advantage persists in the two skills domains most closely related to
language, namely Prose reading and Document reading. At the same time, for those who possess sufficient
command of the Spanish language, having a second mother tongue (which in most cases is Guarani) is
associated with higher performance in at least one domain (Document reading) or even two (Document
reading and Numeracy). This is extremely important because the advantage of having Spanish as a mother
tongue may be wrongly perceived as a disadvantage of having Guarani as a mother tongue. No such
disadvantage is found in LAMP data. In fact, as mentioned before, for those speaking Spanish well enough,
speaking a second language at a similar level of proficiency (whether this is Guarani or another language) is
associated with higher performance in at least one domain.
In summary, mother tongue and bilingual status appear associated with literacy skills in Paraguay. Native
Spanish speakers outperform other respondents in all domains. Although, after controlling for other factors,
this applies only to Prose reading and Document reading and not to Numeracy. Meanwhile, bilingual Spanish
speakers outperform their monolingual counterparts in Document reading. This confirms that the
relationships between language and literacy are complex yet certainly relevant for policy purposes in the
case of Paraguay.

125
LAMP: Implementation in Diverse Settings
Chapter 9. The LAMP Reading Components assessment
LAMP introduced the Reading Components items as an attempt to measure the pre-reading skills of
respondents who would not be able to answer the Prose reading and Document reading questions due to
limited reading comprehension skills, limited writing skills, or both but who were not totally lacking in any
reading-related skills. As a result, the Reading Components assessment differs from Prose reading and
Document reading in two main ways: (1) the Reading Components assessment extends the range of
assessed abilities downward to include so-called precursors skills, such as letter naming and word
recognition; and (2) it prompts oral rather than written answers from respondents. Although, in theory, the
abilities assessed by the Reading Components are necessary to learn the skills tested in the Prose and
Document booklets, due to their format the results from the Reading Components cannot simply be put on
the same scale as either the assessment of the Prose or Document domain. As such, the Reading
Components assessment is analysed separately in this chapter.
9.1 Description of the Reading Components assessment29
In its design, LAMP includes a Reading Components module to be administered to those with very low-level
literacy skills who cannot respond to the Prose or Document reading assessment modules. The Reading
Components module helps identify the elements that contribute to poor performance. The purpose of this
assessment is to collect information in order to better customise policy interventions (e.g. literacy
programmes) by avoiding the assumption that poor performance is explained in every individual in the same
fashion (UNESCO-UIS, 2008). The comprehension or ‘meaning construction’ processes of reading are built
upon a foundation of component skills and knowledge of how one’s writing system works. The evidence for
this knowledge and these skills can be obtained by administering tasks that examine a reader’s ability and
efficiency in processing the elements of the written language – letters/characters, words (and non-words),
sentences and larger, continuous text segments.
The LAMP Reading Components module mainly asks whether the adults surveyed can apply their existing
language and comprehension skills to the processing of printed texts. The component tasks are not designed
to assess separately the level of language skills in the target print literacy system. It is assumed that the
adults surveyed will have basic oral vocabulary, syntactic/grammatical and listening comprehension skills in
the target language. LAMP provides a component measure of basic oral vocabulary to indicate if individuals
have a threshold level of language proficiency. However, an independent measurement of language
proficiency is not a basic feature of the component framework.
Each country that implemented LAMP developed a set of component measures unique to its language, script
and culture, based on the guidelines specified in the Reading Components framework (UNESCO-UIS, 2008).
Since the relationship of a language to the corresponding writing system may be very different depending
on the language, the components and the nature of items and tasks to assess the components needed to
be developed and/or adapted.
29 Most of this section is an adaptation of material extracted from UNESCO-UIS (2009).

126
LAMP: Implementation in Diverse Settings
i) General content of the Reading Components assessment
a) General elements involved in measuring reading component skills. In order to measure reading
component skills, a basic starting point would be to recognise that reading consists of word recognition and
linguistic comprehension. Although each of these components is necessary for reading, neither of them
is sufficient by itself. Another key element pertains to measuring speed or rate of response. This is
a straightforward behavioural proxy for cognitive constructs of automaticity and efficiency.
In addition, the clarity and speed of oral instructions and items needed to be carefully standardised. It was
also important to take into account that dialect, accents and other language variations may make
spoken/oral responses more difficult to score. Finally, if the individual struggles to produce spoken
responses, this will influence speed/efficiency measurements.
b) Alphanumeric recognition. This is the most basic step of sight-to-sound correspondence – matching the
letter name to the printed symbol and vice versa. Letters are a slightly stronger predictor of reading than
numbers but they are generally more strongly correlated with each other than with overall reading.
However, it is conceivable in some settings (e.g. in communities with minimal availability of printed material)
that there is more exposure to and knowledge of printed digits than letters or vice versa. Therefore, LAMP
includes both letter and digit recognition tasks.
c) Visual word recognition. There are two basic behavioural skills indicative of proficiency in word recognition:
i) the accumulation of sight-word knowledge of real words along with accurate and rapid recognition of
frequent words are a strong index of word recognition efficiency and proficiency; and ii) decoding.
d) Word meaning (vocabulary). The measurement of vocabulary in LAMP is not intended to capture the full
extent of vocabulary knowledge but to determine whether an individual's component reading skill levels
reflect his/her proficiency to read texts that he/she could otherwise understand in a listening context.
Respondents are shown line drawings depicting common things and are then asked to provide the verbal
label (e.g. book, chair, cat, etc.). Item writers took care to develop items that were expected to be well known
by most adults in the population. This is necessary as adults may have varying degrees of exposure to the
vocabulary used mostly in the written form of the language in which they are being assessed.
e) Sentence processing. The individual was asked to make true or false judgments based on the content of
sentences either in relation to common knowledge about the world or based on the internal logic of
sentences. Here, the purpose was to assess if the individual can only decode the words or if he/she is able
to grasp the meaning of a sentence.
f) Passage reading. Skilled reading is rapid, efficient and fluent (silent or aloud). LAMP considers fluency to
be more of an observable property that emerges from skilled reading. Fluency is an indicator of whether
visual word identification processes are efficiently feeding language-processing systems (e.g. working
memory) to produce outputs. The tasks were designed to provide a choice between a word that correctly
completes a sentence and an incorrect word. The incorrect item is meant to be obviously wrong to a reader
with some basic comprehension skills. Distracters may be grammatically or semantically wrong. By giving
the participant only a fixed amount of time to perform the task, a measure of reading efficiency is assessed.
LAMP items have been mainly designed to measure previously acquired reading components, knowledge
and skills. The individual either has the skill level to accurately respond to the item or not. There is not much

127
LAMP: Implementation in Diverse Settings
additional information in each item that would require time to think about a response. Therefore, hesitation
in responding is indicative of weak underlying knowledge and skills.
ii) The languages and scripts assessed
First, it is important to describe the language and orthography in which the Reading Components
assessment (RCA) was developed and administered in each country. Table 9.1 offers a summary that
displays the language and the characteristics of each language-specific orthography used in the four
countries that participated in LAMP, including:
a) The type of writing system. The linguistic structure represented by the graphemes (a phoneme or sound
in alphabetic systems; a syllable in syllabaries; or a morpheme in logographies) (Coulmas, 1989).
b) The type of script. The notational form of each writing system (Roman, Greek, etc.) (Coulmas, 1989).
c) The orthographic transparency. An indication of how shallow (or transparent) or deep (or opaque) is the
relationship between graphemes and phonemes (or sounds) in alphabetic writing systems. In other words,
the closer an alphabetic system is to a 1:1 correspondence between graphemes (letter) and phonemes
(sounds), the more transparent it is.
Table 9.1. Country-specific Reading Components assessment: Languages and
orthographies
Reading Components assessment
Language Writing system Script Transparency
Mongolia Mongolian Alphabetic Cyrillic Very transparent
Paraguay Spanish Alphabetic Roman/Latin Fairly transparent
Jordan
Standard Arabic,
South Levantine
Spoken
Alphabetic Arabic Opaque*
(not vowelized)
Palestine
Standard Arabic,
South Levantine
Spoken
Alphabetic Arabic Opaque
(not vowelized)
Note: The only exception to the non-vowelized script was in the Jordan Reading Components assessment
where some of the word lists were vowelized.
As can be observed in Table 9.1, the Reading Components assessment was developed in three languages
for the four countries – Mongolian, Spanish and Standard Arabic (South Levantine Spoken). The Jordanian
and Palestinian versions of the Reading Components are not exactly the same due to decisions made by
each national team in order to reflect differences in usage and instructional methodologies. All of these
languages use alphabetic systems but they vary in the script used and in the approximate level of
orthographic transparency, with the Mongolian Cyrillic script being the most transparent, followed by the
fairly transparent Spanish Roman/Latin script and with the Arabic script being the most opaque of the three
as a result of it being a non-vowelized alphabetic system (sometimes called a consonantal alphabet or abjad).

128
LAMP: Implementation in Diverse Settings
iii) The nature of the Reading Components tasks
The structure of the Reading Components assessment can be summarised as:
Task Untimed Timed
1. Oral receptive vocabulary 26 items (/26)
2-3. Digit naming 10 digits (/10) 45 digits read twice in 20 seconds
(/90)
4-6. Letter naming 28 lower case letters (/28)
28 upper case letters (/28)
45 lower case letters read twice in
20 seconds (/90)
7-8. Word recognition 5 sets of 9 high-frequency words
scored (/45)
60 high-frequency words read
twice in 60 seconds (/120)
9-10. Decoding Not administered Not administered
11. Sentence processing 3 sets of 6 sentences read aloud,
each word scored for accuracy,
each sentence scored for
comprehension (true/false), (/18)
2 sets of 7 sentences read silently
within 30 seconds (for each set),
scored for comprehension
(true/false), (/14)
12. Passage fluency 3 passages (read aloud and
timed) each with 6
comprehension questions
without time limit, passage was
available while answering
questions (/18)
The same 3 passages, previously
read aloud in 50 seconds (for each
passage), each word scored for
accuracy/fluency depending on the
language (/18)
iv) Why is there no score for Reading Components as with LAMP Prose, Document or Numeracy?
Ability estimates for Prose, Document and Numeracy (PDN) were produced by using Item Response Theory
because each of these three domains meet the assumptions of unidimensionality (i.e. all items in each
domain measure the same skill, such as the ability to read prose texts) and local independence – because
getting the correct or incorrect answer in one test item does not affect the process of answering a different
test item.
The Reading Components, however, comprise measures pertaining to reading accuracy, fluency and
comprehension, as well as oral vocabulary. Therefore, the Reading Components as a whole cannot be
considered to assess a unidimensional construct and consequently cannot be analysed by using item
response theory (IRT). Could each subtest then be analysed separately in order to circumvent this problem?
It would be possible to do this with the untimed exercises but not with the timed ones.
Moreover, PDN items used in different countries are translations from a common source and therefore it
was possible to use IRT to put all countries’ results on the same scale for each domain. Reading Components,
on the other hand, were developed separately for each language in each country. As a result, it would not
have been possible to express each country’s results on the same scale, which is one of the main incentives
(among others) to use IRT.

129
LAMP: Implementation in Diverse Settings
v) How the Reading Components profiles were created
Following the example of Strucker, Yamamoto and Kirsch (2007) in their analysis of Reading Components
data from the International Survey of Reading Skills (ISRS – a follow-up of IALS), the UIS team made a decision
to use latent class analysis (LCA) as a way to score the Readings Components responses. Compared to IRT,
LCA has two features that make it particularly attractive for the issue at hand: it makes relatively few
assumptions about the data that are used as inputs (in this case, the scores for each exercise of the Reading
Components instrument) and it produces a relatively intuitive output in which individuals are grouped in a
manageable number of interpretable categories or profiles.
For each country, LCA answered the following three main questions (among others):
1. How many classes (or profiles) are there?
2. How large is each class?
3. Which items distinguish the classes from one another?
The LCA results reflect natural groupings in the data, assigning similar individuals to the same profile.30
Countries may have different numbers of these naturally occurring groups and as a result, more LCA profiles
or fewer. For each country, the decision on the number of profiles will depend on a combination of statistics,
theory and policy. For instance, if the Ministry of Education is planning to provide tailor-made literacy
programmes for different groups of readers, having a large number of different profiles would be
impractical. Thus, the analyst will look for a suitable solution that, while statistically sound, yields fewer
profiles. In the analysis presented in this chapter, each country had 3 or 4 profiles.
9.2 Main results of the Reading Components assessment
i) Overview
In this report, each country’s results are presented separately. It is important to highlight that these
assessments are not directly comparable because they were not designed to allow cross-country
comparisons.
It should also be noted that the Reading Components assessments is not administered to all LAMP
respondents. It is designed for and administered to only those respondents whose reading and numeracy
abilities are too low to be able to be assessed by the other modules of the LAMP assessment.
ii) Country-specific performances in the Reading Components assessment
Paraguay
The RCA in Paraguay was administered in Spanish, a language with an alphabetic writing system, a
Latin/Roman script and a fairly transparent orthography. A total of 724 adults participated in the RCA in
Paraguay. The total Paraguay sample size was 3,966 respondents.
30 Although LCA does not necessarily assign each individual fully to one class, it assigns each individual a
probability of belonging to each of the different classes.
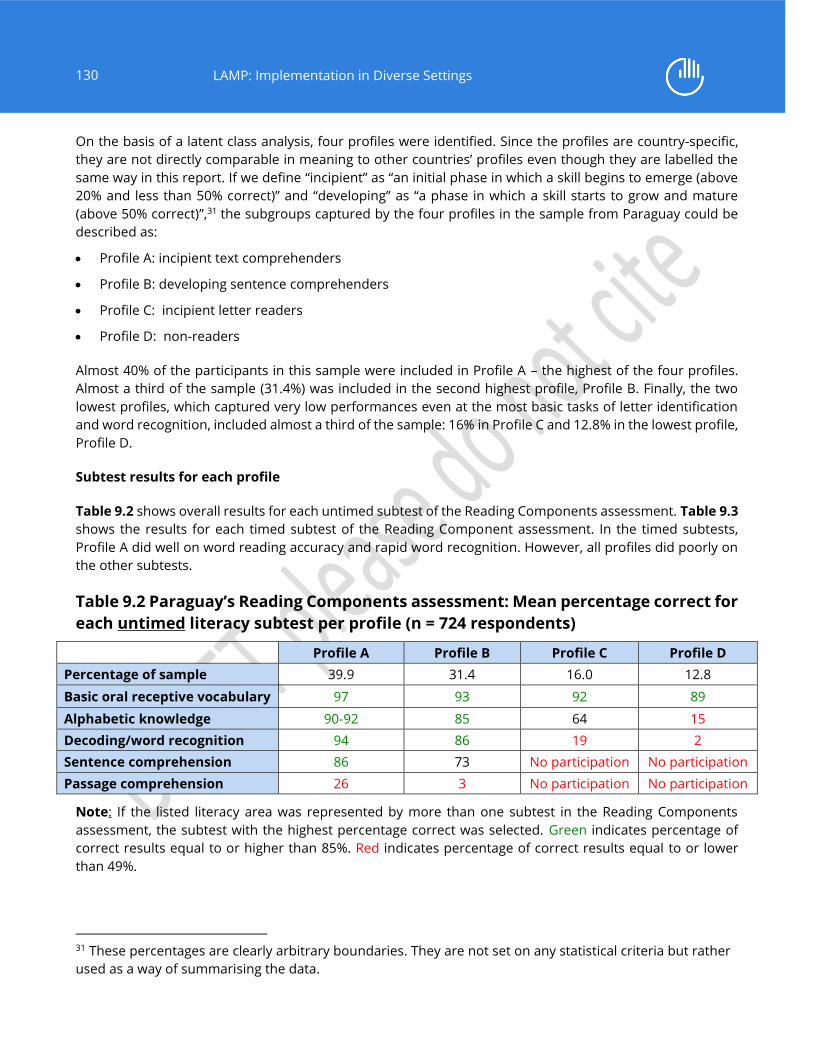
130
LAMP: Implementation in Diverse Settings
On the basis of a latent class analysis, four profiles were identified. Since the profiles are country-specific,
they are not directly comparable in meaning to other countries’ profiles even though they are labelled the
same way in this report. If we define “incipient” as “an initial phase in which a skill begins to emerge (above
20% and less than 50% correct)” and “developing” as “a phase in which a skill starts to grow and mature
(above 50% correct)”,31 the subgroups captured by the four profiles in the sample from Paraguay could be
described as:
Profile A: incipient text comprehenders
Profile B: developing sentence comprehenders
Profile C: incipient letter readers
Profile D: non-readers
Almost 40% of the participants in this sample were included in Profile A – the highest of the four profiles.
Almost a third of the sample (31.4%) was included in the second highest profile, Profile B. Finally, the two
lowest profiles, which captured very low performances even at the most basic tasks of letter identification
and word recognition, included almost a third of the sample: 16% in Profile C and 12.8% in the lowest profile,
Profile D.
Subtest results for each profile
Table 9.2 shows overall results for each untimed subtest of the Reading Components assessment. Table 9.3
shows the results for each timed subtest of the Reading Component assessment. In the timed subtests,
Profile A did well on word reading accuracy and rapid word recognition. However, all profiles did poorly on
the other subtests.
Table 9.2 Paraguay’s Reading Components assessment: Mean percentage correct for
each untimed literacy subtest per profile (n = 724 respondents)
Profile A Profile B Profile C Profile D
Percentage of sample 39.9 31.4 16.0 12.8
Basic oral receptive vocabulary 97 93 92 89
Alphabetic knowledge 90-92 85 64 15
Decoding/word recognition 94 86 19 2
Sentence comprehension 86 73 No participation No participation
Passage comprehension 26 3 No participation No participation
Note: If the listed literacy area was represented by more than one subtest in the Reading Components
assessment, the subtest with the highest percentage correct was selected. Green indicates percentage of
correct results equal to or higher than 85%. Red indicates percentage of correct results equal to or lower
than 49%.
31 These percentages are clearly arbitrary boundaries. They are not set on any statistical criteria but rather
used as a way of summarising the data.
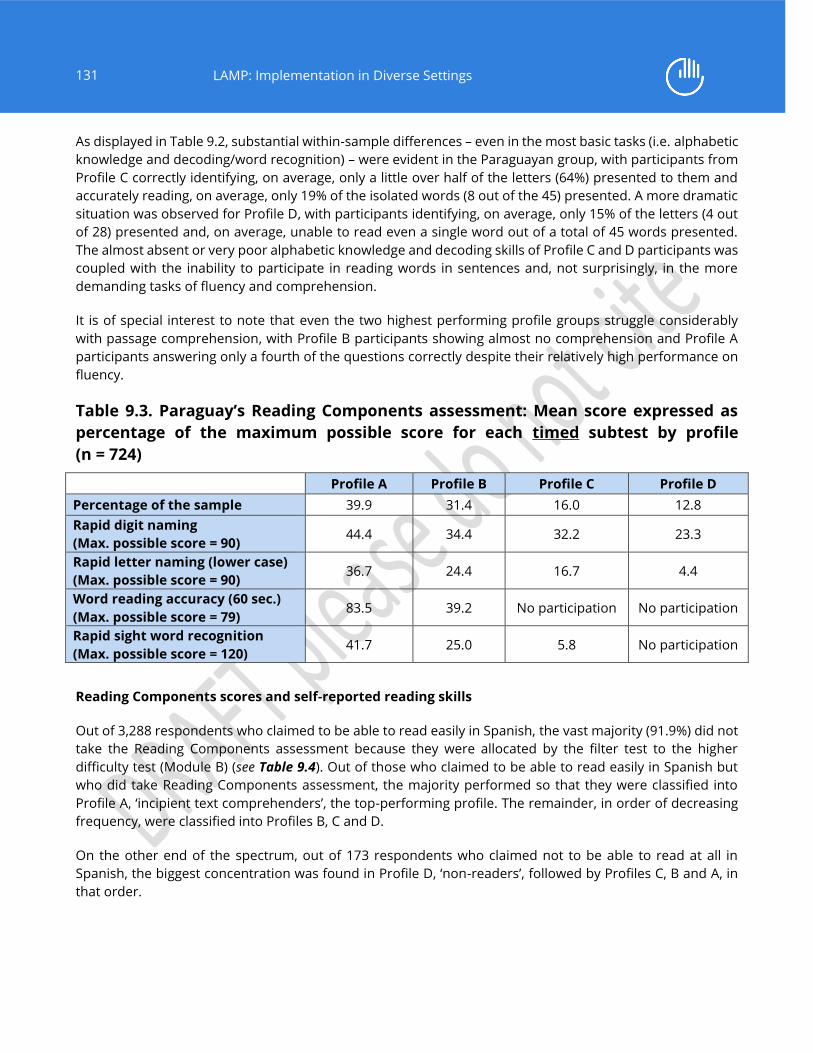
131
LAMP: Implementation in Diverse Settings
As displayed in Table 9.2, substantial within-sample differences – even in the most basic tasks (i.e. alphabetic
knowledge and decoding/word recognition) – were evident in the Paraguayan group, with participants from
Profile C correctly identifying, on average, only a little over half of the letters (64%) presented to them and
accurately reading, on average, only 19% of the isolated words (8 out of the 45) presented. A more dramatic
situation was observed for Profile D, with participants identifying, on average, only 15% of the letters (4 out
of 28) presented and, on average, unable to read even a single word out of a total of 45 words presented.
The almost absent or very poor alphabetic knowledge and decoding skills of Profile C and D participants was
coupled with the inability to participate in reading words in sentences and, not surprisingly, in the more
demanding tasks of fluency and comprehension.
It is of special interest to note that even the two highest performing profile groups struggle considerably
with passage comprehension, with Profile B participants showing almost no comprehension and Profile A
participants answering only a fourth of the questions correctly despite their relatively high performance on
fluency.
Table 9.3. Paraguay’s Reading Components assessment: Mean score expressed as
percentage of the maximum possible score for each timed subtest by profile
(n = 724)
Profile A Profile B Profile C Profile D
Percentage of the sample 39.9 31.4 16.0 12.8
Rapid digit naming
(Max. possible score = 90) 44.4 34.4 32.2 23.3
Rapid letter naming (lower case)
(Max. possible score = 90) 36.7 24.4 16.7 4.4
Word reading accuracy (60 sec.)
(Max. possible score = 79) 83.5 39.2 No participation No participation
Rapid sight word recognition
(Max. possible score = 120) 41.7 25.0 5.8 No participation
Reading Components scores and self-reported reading skills
Out of 3,288 respondents who claimed to be able to read easily in Spanish, the vast majority (91.9%) did not
take the Reading Components assessment because they were allocated by the filter test to the higher
difficulty test (Module B) (see Table 9.4). Out of those who claimed to be able to read easily in Spanish but
who did take Reading Components assessment, the majority performed so that they were classified into
Profile A, ‘incipient text comprehenders’, the top-performing profile. The remainder, in order of decreasing
frequency, were classified into Profiles B, C and D.
On the other end of the spectrum, out of 173 respondents who claimed not to be able to read at all in
Spanish, the biggest concentration was found in Profile D, ‘non-readers’, followed by Profiles C, B and A, in
that order.

132
LAMP: Implementation in Diverse Settings
Table 9.4. Paraguay’s relationship between Reading Components assessment
profiles and self-reported reading ability in percentage (n = 3,786)
Reading Components Profile How well can you read in Spanish?
Total Easily With difficulty Not at all
Allocated to Module B (higher difficulty) 91.9 33.5 82.7
Profile A. Incipient text comprehenders 5.3 24 1.7 6.8
Profile B. Developing sentence
comprehenders 2.5 27.7 21.4 5.5
Profile C. Incipient letter readers 0.2 10.5 30.1 2.4
Profile D. Non-readers 0.1 4.3 41.0 2.3
Unable to read or write 5.8 0.3
Total 100 100 100 100
n 3,288 325 173 3,786
So far, this shows relatively high consistency between self-report and performance in Reading Components
among those who fall on either end of the self-report spectrum.
However, out of those 325 respondents who claim to be able to read in Spanish with difficulty, one third
(33.5%) was still able to score 8 points or more out of 17 in the filter test and therefore were allocated to
Module B and did not take the Reading Components module. Among those who were administered the
Reading Components instruments, the biggest concentration is in Profile B, ‘developing sentence
comprehenders’, closely followed by Profile A, ‘incipient text comprehenders’, the top-performing category.
This shows that those respondents who claim to be able to read in Spanish “with difficulty” form a
heterogeneous group, in which different individuals may be referring to completely different types of
difficulties. Some may find it difficult to comprehend long, dense articles, others may have trouble
understanding sentences and a few may not even be able to name all the letters of the alphabet.
Mongolia
The RCA in Mongolia was administered in Mongolian, a language with an alphabetic writing system, a Cyrillic
script and a transparent orthography. A total of 590 adults participated in the RCA in Mongolia.
Subtest results for each profile
On the basis of a latent class analysis, four profiles were identified. Since the profiles are country-specific,
they are not directly comparable in meaning to other countries’ profiles even though they are labelled the
same way in this report.
If we define “incipient” as “an initial phase in which a skill begins to emerge” and “developing” as “a phase in
which a skill starts to grow and mature”, the subgroups captured by the four profiles in the sample from
Mongolia may be described as:
Profile A: developing text comprehenders
Profile B: incipient text comprehenders
Profile C: developing sentence comprehenders
Profile D: letter readers.

133
LAMP: Implementation in Diverse Settings
Almost 30% of the participants in this sample were included in Profile A, the highest of the four profiles. The
majority of the sample (42.8%) was included in the second highest profile, Profile B. Profile C included 22.6%
and the lowest profile, Profile D, only represented 6.8% of the respondents who were administered the RCA.
Subtest results for each profile
Table 9.5 shows overall results for each untimed subtest of the RCA. Table 9.6 shows the results for each
timed subtest of the RCA.
On the untimed subtests, Profiles A and B did well on all subtests except for passage comprehension, where
they dipped to 53% and 41% correct, respectively. Profile C did reasonably well but Profile D scored lower
across all subtests. On the timed subtests, Profile A and B performed only slightly better on rapid digit
naming and rapid letter naming but performed much better than Profiles C and D on word reading accuracy
and rapid sight word recognition.
Table 9.5. Mongolia’s Reading Components assessment: Mean percentage correct for
each untimed literacy subtest per profile (n = 590 respondents)
Profile A Profile B Profile C Profile D
Percentage of the sample 27.7 42.8 22.6 6.8
Basic oral receptive vocabulary 99 97 93 96
Alphabetic knowledge 99 97 92 59
Decoding/word recognition 99 94 74 11
Sentence comprehension 96 85 58 No participation
Passage comprehension 53 41 No participation No participation
Note: If the listed literacy area was represented by more than one subtest in the Reading Components
assessment, the subtest with the highest percentage correct was selected. Green indicates percentage of
correct results equal to or higher than 85%. Red indicates percentage of correct results equal to or lower
than 49%.
Table 9.6 Mongolia’s Reading Components assessment: Mean score expressed as
percentage of the maximum possible score for each timed subtest by profile (n=590)
Profile A Profile B Profile C Profile D
Sample percent 27.7 42.8 22.6 6.8
Rapid digit naming
(Max. possible score = 90) 51.1 38.9 30.0 23.3
Rapid letter naming (lower
case)
(Max. possible score = 90)
42.2 32.2 23.3 10.0
Word reading accuracy (60 sec.)
(Max. possible score = 58) 98.3 79.3 No participation No participation
Rapid sight word recognition
(Max. possible score = 120) 82.5 45.8 16.7 No participation

134
LAMP: Implementation in Diverse Settings
Reading Components scores and self-reported reading skills
Out of 3,780 respondents who claimed to be able to read easily in Mongolian, the vast majority (89.0%) did
not take the Reading Components assessment because the filter test allocated them to the higher difficulty
test (Module B) (see Table 9.7). Those respondents who did take the RCA seem to be spread across several
different profiles.
On the other end of the spectrum, the 48 respondents who claimed not to be able to read at all in
Mongolian are also spread across the various Reading Components profiles although the majority is found
in the ‘incipient text comprehenders’ profile (Profile B).
Similarly, of the 86 respondents who claimed to be able to read in Mongolian with difficulty, one third
(33.5%) was still able to score 8 points or more out of 17 in the filter test and were therefore allocated to
Module B and did not take the RCA. Among those who were administered the RCA, the biggest
concentration was in Profile B, closely followed by Profile A, “developing text comprehenders”, the top-
performing category. This shows that respondents who claimed to be able to read in Mongolian “with
difficulty” form a heterogeneous group, in which different individuals may be referring to completely
different types of difficulties when self-assessing their reading ability. Some may find it difficult to
comprehend long, dense articles, others may have trouble understanding sentences and a few may not
even be able to name all the letters of the alphabet.
Table 9.7. Mongolia’s relationship between Reading Components assessment
profiles and self-reported reading ability in percentage (n=3,914)
Reading Components Profile How well can you read in Mongolian?
Total Easily With difficulty Not at all
Allocated to Module B (higher
difficulty) 89.0 16.1 86.2
Profile A. Developing text
comprehenders 3.8 3.3 3.8
Profile B. Incipient text
comprehenders 1.7 41.1 55.1 3.3
Profile C. Developing sentence
comprehenders 4.9 36.4 24.4 5.8
Profile D. Letter readers 0.6 3.1 18.0 0.8
Unable to read or write 2.5 0.1
Total 100 100 100 100
n 3,780 86 48 3,914

135
LAMP: Implementation in Diverse Settings
Jordan
A total of 438 adults participated in the RCA in Jordan. Jordan uses an alphabetic writing system and an
Arabic script with an opaque orthography. On the basis of a latent class analysis, three profiles were
identified. Since the profiles are country-specific, they are not directly comparable in meaning to other
countries’ profiles even though they are labelled the same way in this report.
As was done with every country, if we define “incipient” as “an initial phase in which a skill begins to
emerge” and “developing” as “a phase in which a skill starts to grow and mature”, the subgroups captured
by the three profiles developed for Jordan could be described as:
Profile A: incipient text comprehenders
Profile B: developing sentence comprehenders
Profile C: incipient letter readers.
About 30% of the participants in this sample were included in Profile A, the highest of the three profiles.
The majority of the sample (39.2%) was included in the second highest profile: Profile B. Profile C included
29.8% of the sample.
Subtest results for each profile
Table 9.8 shows overall results for each untimed subtest of the RCA. Table 9.9 shows the results for each
timed subtest of the RCA. In the timed subtests, Profile A did well on word reading accuracy and rapid
word recognition. But all profiles did poorly on the other subtests.
The percentage of the sample in each of the profiles is roughly the same, ranging from about 30% to 39% in
each profile. Profile A did well on each untimed subtest, except passage comprehension on which it did
poorly (44%). The mean percentage correct was higher for Profile A than for the other two profiles. On the
timed subtests, Profile A scored higher than the other profiles, but did not do especially well, except in word
reading accuracy on which it averaged 87.5%.
Table 9.8. Jordan’s Reading Components assessment: Mean percentage correct for
each untimed literacy subtest per profile (n=438 respondents)
Profile A Profile B Profile C
Percentage of the sample 31.0 39.2 29.8
Basic oral receptive vocabulary -- -- --
Alphabetic knowledge 100 94 43
Decoding/word recognition 98 71 No participation
Sentence comprehension 93 68 No participation
Passage comprehension 44 No participation No participation
Note: If the listed literacy area was represented by more than one subtest in the Reading Components
assessment, the subtest with the highest percentage correct was selected. Green indicates percentage of
correct results equal to or higher than 85%. Red indicates percentage of correct results equal to or lower
than 49%.

136
LAMP: Implementation in Diverse Settings
Table 9.9. Jordan’s Reading Components assessment: Mean score expressed as
percentage of the maximum possible score for each timed subtest by profile (n=438)
Profile A Profile B Profile C
Percentage of the sample 31.0 39.2 29.8
Rapid digit naming
(Max. possible score = 90) 44.4 37.7 26.7
Rapid letter naming
(Max. possible score = 90) 37.7 32.2 No participation
Word reading accuracy (60 sec.)
(Max. possible score = 48) 87.5 No participation No participation
Rapid sight word recognition
(Max. possible score = 120) 53.3 19.2 No participation
Reading Components scores and self-reported skills
Out of 2,184 respondents who claimed to be able to read easily in Arabic, the vast majority (95.4%) did not
take the Reading Components assessment because they were allocated to the higher difficulty test (Module
B) (see Table 9.10). Out of those who did take the RCA, the majority was in Profile A, “incipient text
comprehenders”, followed by, in order of decreasing frequency, Profile B, “developing sentence
comprehenders” and Profile C, “incipient letter readers”.
On the other end of the spectrum, out of 118 respondents who claimed not to be able to read at all in Arabic,
the biggest concentration was found in Profile C, “incipient letter readers”.
So far, as in Paraguay’s case, these results show relatively high consistency between self-report and
performance in reading components among those who fall on either end of the self-report spectrum.
Table 9.10. Jordan’s relationship between Reading Components assessment profiles
and self-reported reading ability in percentage (n=2,383)
Reading Components Profile How well can you read in Arabic?
Total Easily With difficulty Not at all
Allocated to Module B (higher difficulty) 95.4 20.3 88.1
Profile A. Incipient text comprehenders 2.5 7.5 1.1 2.5
Profile B. Developing sentence
comprehenders 1.4 43.3 21.0 3.8
Profile C. Incipient letter readers 0.3 25.8 39.5 3.2
Unable to read or write 0.4 3.2 38.5 2.4
Total 100 100 100 100
n 2,184 81 118 2,383

137
LAMP: Implementation in Diverse Settings
However, of the 81 respondents who claimed to be able to read in Arabic with difficulty, one fifth (20.3%)
was still able to score 8 points or more out of 17 in the filter test and were therefore allocated to Module B
and did not take the RCA. Among those who were administered the RCA, the biggest concentration is in
Profile B, “developing sentence comprehenders”, followed by Profile C, “incipient letter readers”, the lowest-
performing profile. This shows that respondents who claimed to be able to read in Arabic “with difficulty”
form a heterogeneous group, in which different individuals may be referring to completely different types
of difficulties. Some may find it difficult to comprehend long, dense articles, others may have trouble
understanding sentences and a sizable share is unable to name all the letters of the alphabet.
Palestine
A total of 777 adults participated in the RCA in Palestine. Palestine, like Jordan, uses an alphabetic writing
system and an Arabic script with an opaque orthography. On the basis of a latent class analysis, three profiles
were identified. Since the profiles are country-specific, they are not directly comparable in meaning to other
countries profiles even though they are labelled the same way in this report.
If we define “incipient” as “an initial phase in which a skill begins to emerge” and “developing” as “a phase in
which a skill starts to grow and mature”, the subgroups captured by the three profiles in the sample from
Palestine may be described as:
Profile A: incipient text comprehenders
Profile B: developing sentence comprehenders
Profile C: non readers
About one third (34.2%) of the participants in this sample were classified by the RCA as being in Profile A, the
highest of the three profiles. The biggest concentration of respondents (38.6%) was classified into the second
highest profile, Profile B. Profile C contained 27.3% of the sample.
On the untimed subtests, Profiles A and B performed better than Profile C on all subtests. On the timed
subtests, all profiles performed rather poorly except Profile A on word accuracy.
Table 9.11. Palestine’s Reading Components assessment: Mean percentage correct
for each untimed literacy subtest per profile (n=777 respondents)
Profile A Profile B Profile C
Sample percent 34.2 38.6 27.3
Basic oral receptive vocabulary 97 91 81
Alphabetic knowledge 98 89 18
Decoding/word recognition 98 80 No participation
Sentence comprehension 88 66 No participation
Passage comprehension 47 No participation No participation
Note: If the listed literacy area was represented by more than one subtest in the Reading Components
assessment, the subtest with the highest percentage correct was selected. Green indicates percentage of
correct results equal to or higher than 85%. Red indicates percentage of correct results equal to or lower
than 49%.

138
LAMP: Implementation in Diverse Settings
Table 9.12. Palestine’s Reading Components assessment: Mean score expressed as
percentage of the maximum possible score for each timed subtest by profile (n=777)
Profile A Profile B Profile C
Percentage of the sample 34.2 38.6 27.3
Rapid digit naming
(Max. possible score = 90) 48.9 35.6 27.8
Rapid letter naming
(Max. possible score = 90) 40.0 25.6 No participation
Word reading accuracy (60 sec.)
(Max. possible score = 57) 89.5 No participation No participation
Rapid sight word recognition
(Max. possible score = 120) 54.2 14.2 No participation
No further information (including self-reported data) is available for Palestine.
9.3. Summary
Although one cannot directly compare countries, some general patterns across countries are worth
highlighting.
a. The oral receptive vocabulary task appears to have been too simple to fully capture critical variability
in vocabulary knowledge across groups and, in particular, to more insightfully assess the vocabulary
knowledge of the highest performing groups. Thus, the vocabulary task is not discussed further.
b. In most countries, even the highest performing subgroups (Profile A) experience difficulty in
understanding simple and short passages. That seems to be the case even when, on average, the
participants seem to be doing fine in basic vocabulary, alphabetic knowledge, decoding/word
recognition and sentence processing.
c. For the two highest performing subgroups in each country, there is a large discrepancy between the
performance on the sentence comprehension and the passage comprehension tasks. Sentence
comprehension consistently displayed a much higher percentage correct than passage
comprehension. Given that different item formats were used by each subtest to assess each
construct, it is impossible for our analysis to disentangle whether these discrepancies indicate a true
difference in the ability to understand sentences versus passages, or if this difference is – as we
suspect – also affected by the 50% chance of getting a correct answer in the sentence comprehension
task. Indeed, it is possible that the sentence comprehension item format might have resulted in an
overestimation of participants’ performances. Additionally, the passage comprehension subtest
includes both narrative and expository texts so analysing the comprehension performance of both
types of passages separately might also have offered additional insights into the challenges of
passage comprehension. According to extensive prior research, it could be hypothesized that
expository texts would have posed bigger challenges than narrative texts to participants.

139
LAMP: Implementation in Diverse Settings
d. The timed subtests which assessed fluency (word reading accuracy, rapid sight-word recognition,
rapid letter naming and rapid digit naming tasks) indicate that participants overall displayed slow
processing skills across profiles and across countries. One general trend worth highlighting is that
even when the fluency mean score (i.e. word reading accuracy) for the highest profile participants is
high, just reading words accurately and rapidly does not seem to guarantee passage comprehension.
This can be observed by contrasting the passage comprehension performance and the fluency
performance (word reading accuracy) of the highest profile group in each country. Consistently, and
in line with prior research, it appears to be the case that rapid and accurate word recognition might
be necessary yet not sufficient to achieve passage comprehension. This report does not comment
any further on the timed tasks. Perhaps including a more challenging measure of academic
vocabulary knowledge (in addition to concrete everyday vocabulary) or creating an even more
comprehensive measure of academic language would more accurately capture the linguistic
knowledge required to process school-relevant connected texts (Uccelli et al., 2015).

140
LAMP: Implementation in Diverse Settings
Chapter 10. Summary and conclusions
Literacy is at the heart of the right to education. The knowledge and skills of reading, writing and computing
are essential to learning continuously throughout one’s life span and to one’s full participation in the social
context in which one lives. Literacy and numeracy cut across the lives of individuals, families, local
communities and nations.
10.1 The development and design of LAMP
The UNESCO Institute for Statistics (UIS), with the cooperation of several countries, developed a quantitative
measure of literacy and numeracy over a period of six years from 2006 to 2011. This measure, called the
Literacy Assessment and Monitoring Programme (LAMP), was described in this report along with the results
of its application in four countries: Jordan, Mongolia, Palestine and Paraguay. This report presents a first look
at literacy and numeracy through the LAMP lens.
LAMP was created to measure attainment in four domains:
Two reading skills domains: expressed as the ability to handle various texts, i.e. continuous
phrases/paragraphs, called ‘prose literacy’; and schematic texts, such as those included in forms,
maps or timetables, called ‘document literacy’.
Numeracy skills domain: expressed as the ability to handle basic arithmetic operations and
calculations.
Reading Components domain: Measurement of persons with very low reading ability. This is
expressed as the ability to use basic operations involved in decoding and understanding texts and
numbers (i.e. alphanumerical perceptual knowledge: letter and number recognition; word
recognition; vocabulary; sentence processing; and simple passage fluency).
The procedures that the UIS applied during the development of this assessment assured that LAMP would
be:
Comparable across countries, languages and scripts (for reading and numeracy skills);
Country-, language-, and script-specific (for pre-reading skills);
Country-specific for socio-economic and socio-demographic information.
For the each of the three domains (Prose, Document, and Numeracy), LAMP used item response theory
methodology to develop the assessment. This allowed all countries’ results to be placed on the same metric
for easy comparison. LAMP also divided the metric for each domain into three performance levels so that
scores on the metric could be described in terms of the specific literacy or numeracy skills that the score
represents. These levels of performance are progressive (or developmental) in the sense that if a person
scores at a higher level, all skills described as lower level performances can also be performed along with
those at the higher level. Chapter 3 defines the skills LAMP respondents scoring at each performance level
can perform.
The metric and performance levels that LAMP provides cannot be used to create literacy rates. LAMP does
not assess writing skills per se and writing is often part of the definition of literacy rates. LAMP assesses only

141
LAMP: Implementation in Diverse Settings
one language within each country. Sometimes, several languages are widely used within a country, and a
person may be literate in one or more of them. The language LAMP assesses may not be a language in which
a person is literate. Further, LAMP measures literacy and numeracy on a continuous metric. Therefore, it
does not produce dichotomous results that can be converted easily into a ‘rate’.
It should be noted that LAMP assessed literacy and numeracy using a household-based sampling design.
Following a carefully designed sampling plan, households were randomly selected to represent the
demographics of a country. Then, within a selected household, a randomly selected adult (aged 15 years or
older) was administered the LAMP individually. This process is unlike school-based assessments that assess
students within selected schools. It is also unlike general household surveys for which literacy assessment
is not the main intent but which might include a small module for collecting information on literacy as part
of a broader data collection effort.
LAMP was specifically developed to assess literacy and numeracy for adults, whether or not they were
currently enrolled or previously attended formal schooling. It focused on assessing prose reading, document
reading and practical numeracy skills. Items were selected from several sources for new field testing and
revisions were made for some items. Among the sources were items from IALS and ALL, items especially
written for LAMP by participating countries with the intention of using them across all countries, and items
that were developed specifically for use within only within a specific country.
From 2006 to 2010, the LAMP assessment items were field tested in eight countries with a wide array of
languages and scripts. Languages and scripts used included Arabic (Arabic script), Mongolian (Cyrillic script)
and languages with a Roman script: French, Fulfulde, Hausa, Kanuri, Spanish, Tamasheq, Vietnamese, and
Zarma. Field testing in this diverse context allowed the development team to improve the items and to select
items that, when adapted and translated, functioned well across several countries.
In addition to assessing the three domains, there was a country-specific reading literacy assessment, called
‘Reading Components’, that assessed lower-level or pre-reading skills to evaluate literacy in several language
families and in several different scripts that were not yet fully developed. As this latter assessment was
country specific, a country’s results were not directly comparable to other countries’ results. Reading
Components scores are not put on a common metric.
To develop the Reading Components assessment, decisions were made to allow each country to produce its
own word recognition lists, and to make the decoding exercises optional. The sentence processing items, on
the other hand, would be common. The sentence processing items were designed so that a respondent
would not need any special knowledge to decide whether the sentence was true or false once it was read.
As a result, some of the items were tautological and obviously true, provided that one could read and
understand the sentence. Similarly, the false items were obviously false and may appear to be nonsensical
once read and understood.

142
LAMP: Implementation in Diverse Settings
By the end of the field testing process, procedures for administering LAMP were streamlined and fine-tuned.
Several instruments had undergone significant improvements following the field testing. The changes
include:
A few Prose, Document and Numeracy items were dropped while several others were modified;
The Reading Components assessment was reordered with some of its sections streamlined (in
particular sentence processing), while others were reformulated (namely, oral vocabulary and
passage fluency);
The Respondent Booklet was removed as parts of it were merged with other tools;
The Background Questionnaire underwent important improvements;
An Enumeration Area Information Sheet was added to provide background information on the
immediate environment of the respondents;
A Supervisor Daily Report Form was created to monitor the data collection activities and to track non-
responses.
In addition, data from the field tests were used for another important purpose: to identify a suitable cut-
score to streamline the decision on matching low and high literate individuals to an appropriately difficult
booklet. This resulted in a ‘filter test’ to reduce assessment time yet provide sufficient accuracy in the
estimation of respondents’ competencies. Thus, in the main assessments, respondents were allocated to
either a low-difficulty (Module A) or a high-difficulty (Module B) form of the test. The decision to allocate a
given individual to a given module was based on their score on the filter test, which contained 17 items. The
decision to set the cut-off score for the filter test equal to 8 (the minimum score required for allocation to
Module B) was made by analysing field test data and incorporating input from subject matter experts.
The final design of LAMP consists of a battery of instruments (see Chapter 5 for more details) that includes:
The Background Questionnaire: This instrument is administered first to collect information on the
respondent and his or her family and settings. This instrument is a key element to gain a meaningful
understanding of the social, demographic and economic background of the respondent that may
contribute to shaping his or her skills.
The filter test: This test is administered after the Background Questionnaire. This is a booklet with
17 items that establishes whether the respondent likely possesses lower or higher levels of literacy
skills. It is used to decide whether an easier (Module A) or more difficult (Module B) test should be
used to gain a more in-depth picture of the respondent's skills.
Module A for those with lower performance: This module is composed of two instruments. One
instrument, the ‘locator test’, supplements the information produced by the filter test with more
detail and establishes more precisely where the respondent stands in relation to the lower skill
levels. It includes Prose, Document and Numeracy sections. The other instrument, the Reading
Components, enables an in-depth exploration for low scoring persons of the elements that might be
preventing the respondent from achieving a better performance.

143
LAMP: Implementation in Diverse Settings
The Reading Components: This instrument is part of Module A and is administered to those with
lower literacy skills. It aims to collect in-depth information on a reader’s ability and efficiency in
processing the basic elements of the written language. Each country that implemented LAMP
developed a set of component assessment tasks unique to its language, script and culture, based on
the guidelines specified in the Reading Components framework (UIS, 2009).
Module B for those with higher performance: This module is one test but there are two equivalent
versions (Booklet 1 and Booklet 2). The respondent is randomly assigned to Booklet 1 or Booklet 2.
Both include Prose, Document and Numeracy sections that supplement the information produced
by the filter test to establish more precisely where the respondent stands in relation to the higher
skill levels.
10.2 Results and implications of implementing LAMP
Four countries implemented the final version of LAMP: Jordan, Mongolia, Palestine and Paraguay. The
countries’ sample sizes were between 2,666 and 4,666 cases. Response rates were high. In fact, they were
above average rates for other international assessments of adult literacy skills (OECD, 2013a, 2013b). The
demographics of the countries are described in Chapter 5.
The findings of the LAMP assessment for the four countries can be summarised by describing the estimated
percentages of the countries’ populations that may perform prose reading, document reading and numeracy
tasks. With regard to Prose reading in the four countries:
a. Level 1. Less than 30% of respondents could: identify literal, concrete information in reading-to-do
passages (e.g. job vacancy notices, product labels and vaccination information) or simple one-
paragraph passages, when (i) the language is identical in passages and questions; (ii) only everyday
colloquial vocabulary is required; and (iii) choices or distractors are absent from the questions.
Respondents could produce answers that require minimal action (e.g. circling, underlining, or
copying a short fragment of text).
b. Level 2. 41% to 51% of the respondents could do everything in (a) and in addition could: Identify
literal information in reading-to-do or reading-to-learn passages, when the required information
appears in the reading-to-do passages in a brief, clearly marked section or in reading-to-learn
passages near the beginning of the text; and when (i) the language is not identical in passages and
questions, and (ii) the questions do not have choices. Respondents could paraphrase, understand
more ‘academic’ language and write full-sentence answers.
c. Level 3. 20% to 31% of the respondents could do everything in both (a) and (b) and in addition could:
Identify literal information in longer, more challenging reading-to-learn texts (1-10 paragraphs) with
linguistically dense passages or when the required information is in the middle or end of the passage
(not the beginning) and when questions may or may not have choices or distractors.

144
LAMP: Implementation in Diverse Settings
With regard to Document reading in the four countries:
a. Level 1. Less than 35% or fewer of could: Identify a single piece of information in simple reading-to-
do or reading-to-learn document (passages, graphs or tables) provided that: (i) the language is mostly
identical in stimuli materials and questions; (ii) only one or two variables are included in the
materials; and (iii) only a few choices or distractors are present in the questions (although potentially
these are always present).
b. Level 2. 35% to 54% of the respondents could do everything in (a) and in addition could: Understand
reading-to-learn graphs or tables that included two or three variables with descriptive labels;
compare or contrast numerical information or processes; and coordinate and match parallel
information (e.g. time and activity data in one table), provided that the language is mostly identical
to the stimuli and when questions have several distractors present.
c. Level 3. 21% to 38% of the respondents could do everything in both (a) and (b) and in addition could:
Understand complex documents and integrate information from complex sources (densely packed
tables, multiple graphs) in order to identify numerical values, given a set criterion; and fill out
complex forms by turning personal data into categorical variables when the language differs in
passages and questions or is ‘academic’ (e.g. value, rates).
With regard to Numeracy in the four countries:
a. Level 1. 36% or fewer of respondents could: (i) answer explicit questions requiring a one-step, simple
operation; (ii) add 3 whole numbers with 2-3 digits or with decimals in a ‘money’ context; and (iii)
subtract 2 whole or decimal numbers in a ‘money’ context, when presented with material
communicating information in familiar contexts, and that has easy access to quantitative information
due to its visual representations and minimal text. Questions contained no choices or distractors.
b. Level 2. 42% to 45% of the respondents could do everything in (a) and in addition could: When
presented with material communicating information in a familiar context, (i) complete tasks involving
some fractions and decimals; (ii) understand and use some simple fractions such as one-half (½)
written with numbers or words; (iii) demonstrate some understanding of the meaning of decimal
numbers; and (iv) multiply a decimal number and a whole number.
c. Level 3. 22% to 38% of the respondents could do everything in (a) and (b) and in addition could: When
presented with complex tasks with several visual representations and when asked explicit questions
that may or may not have choices or distractors, (i) perform multiple-step operations that require
multiplication (maybe by repeated addition) and then division (maybe by repeated subtraction); (ii)
subtract a percent from an initial value; (iii) find a proportion by combining operations in a money
context (sometimes with decimals); (iv) add 3 numbers (sometimes with decimals) after computing
2 of them through multiplying by 10 or 2; (v) read time using clocks or in numeric form; (vi) interpret
qualitative or quantitative data from tables or price tags with percents, decimals and whole numbers;
and (vi) represent money and weight (using appropriate measurement units).

145
LAMP: Implementation in Diverse Settings
For the four countries participating in the LAMP main assessment, most national averages are similar to one
another in all three domains (see Chapter 6 for details). Few of the small differences between national
averages are statistically significant. However, the ordering of the national averages is not the same for each
domain. This means that different countries did slightly better in different domains, and no individual
country stood out across all domains. But a country’s averages do not describe the distribution of skills that
its citizens possess.
Each country will need to consider whether the distribution of skills across the three LAMP levels is
appropriate for its national literacy and numeracy goals. As noted previously, approximately a third of a
country’s adult citizens can perform the higher level skills assessed by LAMP. Is this level of performance
sufficient for a country to continue its current and future economic and social growth? This is a question
policymakers will need to discuss, especially as new technologies may become important to a country’s
development. New technology requires more skills in reading documents and working with quantitative
information (numeracy) than has been the case in the past.
Using the information collected through the Background Questionnaire, LAMP results in the three domains
were correlated with several socio-demographic variables. These variables were gender, learning
(educational attainment), lifespan (age and cohort), legacies (parental education, occupation and socio-
economic status), location (urban and rural), leisure (use of reading and numeracy skills outside of work) and
livelihood (use of reading and numeracy skills at work). Consistent with other studies of literacy and
numeracy, in all countries, average LAMP performance in all three domains is higher for respondents that
have higher levels of education. In numeracy, significant percentages of those with primary education or less
scored at LAMP Level 2 or higher in three of the four countries participating.
When LAMP performance was studied in relation to gender, men scored higher than women in numeracy in
all countries even when scores were adjusted for level of educational attainment. It should be noted that
lack of quantitative skills would limit the entry of individuals into advanced education in quantitative-based
occupations and careers, such as science, engineering and medicine, among others. For prose reading, after
taking educational attainment into account, women generally had an advantage over men. In document
reading, after taking educational attainment into account, men had an advantage over women. A policy
question is how to improve performance of women in reading documents as this type of reading becomes
more important in the future.
When age was studied in relation to LAMP performance, it was found that after adjustment for educational
attainment, the differences between younger (age 15-24) and older (age 40-64) participants were small and
generally statistically non-significant in prose and document reading, and in numeracy (see Chapter 7 for
details). LAMP is unique in that it studied numeracy for participants aged 65 and older. The results showed
that this group had statistically lower average numeracy scores in each country. When the full range of age
was plotted against LAMP scores, there was a downward curvilinear relationship. In all four countries’ scores
on all domains, there tended to be a slight peak in performance around age 35, then scores became lower
as age increased.
The scores of participants in LAMP were related to maternal and paternal education level. Participants with
parents who completed post-secondary education scored significantly higher than participants whose
parents possessed lower educational attainment.

146
LAMP: Implementation in Diverse Settings
Participants with parents in high-skilled occupations also scored higher in all LAMP domains, after adjusting
scores for the participants’ own educational attainment – but the differences were small. Participants whose
parents had the highest socio-economic status scored higher than participants whose parents had the
lowest socio-economic status, after adjusting the scores for the participants’ own level of educational
attainment.
Participants from urban areas scored higher on average than participants from rural areas, after taking into
account the participants’ educational attainment. However, after adjustment the differences between urban
and rural participants became very small.
Participants who used mobile phones had higher scores than participants who relied solely on media
broadcasts. In addition, those using computers had higher scores than those using only mobile phones. This
advantage for computer users persisted even after adjusting for educational attainment, though the
advantage in mean difference was much smaller. Thus, access and knowledge on how to use technology
improved scores on LAMP-assessed literacy and numeracy.
Employed participants had higher scores than unemployed participants, even after taking into account
educational attainment. Participants with high-skilled occupations had higher LAMP scores, although when
adjusted for educational attainment, this advantage became very small. The more participants used their
reading and numeracy skills in their work, the higher were their LAMP scores. This advantage persisted in
most countries when scores were adjusted for the educational attainment of participants, although the
advantage was not great.
Thus, LAMP scores are related to many socio-demographic variables but the relationships are generally less
strong after participants’ educational attainment levels are taken into account. Education seems to be the
key factor to attaining literacy and numeracy as measured by LAMP.
These data suggest that policies aimed at increasing gender equity in the distribution of reading and
numeracy skills should go beyond attending school. Policies should also target increased participation of
both genders in the labour market and the use of skills both at work and for leisure.
As access to schooling approaches gender parity, female employment rates are still lagging behind those of
males.
As for literacy practices for leisure, they have the potential to help narrow the gap in the other two skills
domains. This type of use seems to be relatively gender-neutral compared to the workplace. Policymakers
should find ways to foster it not only among women, but also among older respondents and rural residents –
older rural women in particular.
10.3 Results of the Reading Components section of LAMP
LAMP developed the Reading Components assessment because there were participants who had literacy
skills that were too low to be adequately assessed using the methodology that was appropriate for higher
ability participants. The Reading Components assessment was developed to be specific to each participating
country. Although one cannot directly compare countries using the Reading Components assessment
results, some general patterns across countries are worth highlighting.

147
LAMP: Implementation in Diverse Settings
a. The oral receptive vocabulary tasks appeared to have been too simple to fully capture critical
variability in vocabulary knowledge across groups.
b. In most countries, even the highest performing subgroups experience difficulty in understanding
simple and short passages. That seems to be the case even when, on average, the participants seem
to be doing fine in basic vocabulary, alphabetic knowledge, decoding/word recognition and sentence
processing.
c. For the two highest performing subgroups in each country, there is a large discrepancy between the
performance on sentence comprehension and on passage comprehension. Sentence
comprehension consistently displayed a much higher percent correct than passage comprehension.
d. The timed subtests that assessed fluency indicate that participants overall displayed slow processing
skills across profiles and across countries. One general trend worth highlighting is that even when
the average fluency score (i.e. word reading accuracy) is high, simply reading words accurately and
rapidly does not seem to guarantee passage comprehension. Consistently, and in line with other
research, it appears to be the case that rapid and accurate word recognition might be necessary yet
not sufficient to achieve passage comprehension.
10.4 Possibility of using LAMP for specific in-depth studies
The LAMP performance in Paraguay was studied in more detail, especially in relation to bilingualism. Among
LAMP respondents, 86% report speaking Guarani well enough to carry a conversation, and 80% claim to be
able to do the same in Spanish. Based on their self-reports, two thirds of Paraguayan respondents (66.5%)
could be considered Spanish-Guarani bilinguals. Although clearly both languages are widespread,
individuals have different degrees of exposure to each language. For instance, they may speak Spanish or
Guarani as mother tongue or as a second language. In Paraguay, many people have more than one mother
tongue. In the LAMP sample, more than three quarters of Paraguayans (78.7%) report Guarani among their
mother tongues, more than half (52.1%) report Spanish as one of them and almost a third (32%) report both.
Native Spanish-speakers outperform other respondents by at least 50 points (half a standard deviation) in
all LAMP domains, before controlling for other factors. After introducing a number of control variables
(gender, age, location, parental occupation, maternal education, respondent’s years of schooling, literacy
practices at home, and occupational skill demand), this advantage is substantially reduced (to 12-15 points)
in Prose and Document reading, and it ceases to be statistically significant in Numeracy.
This has some important implications. For those who have sufficient command of the Spanish language,
having a second mother tongue, which in most cases is Guarani, is associated with higher performance in at
least one domain (Document reading) or even two (Numeracy and Document reading). This is an important
finding as the advantage of having Spanish as mother tongue may be wrongly perceived as a disadvantage
of having Guarani as mother tongue. No such disadvantage is found in LAMP data. In fact, for those speaking
Spanish well enough, speaking a second language at a similar level of proficiency (whether this is Guarani or
another language) is associated with higher performance in at least one domain.
Thus, the relationships between language and literacy are complex but certainly relevant for policy purposes
in the Paraguayan case. LAMP could be used to study other bilingual situations where more in-depth
information is relevant to policymakers.

148
LAMP: Implementation in Diverse Settings
10.5 Summary of the experience with LAMP
There have been significant advances in the technology of educational assessment over the past 50 years
and, specifically, in the comparison of learning achievements across countries. Following the pioneering
work of IEA in the 1960s, national, regional and international agencies have built up an impressive and well-
established set of comparative assessment tools. Their main focus is literacy, mathematics and science but
some also cover citizenship, computer literacy and health-related knowledge. In terms of sector, the most
common focus has been on primary and lower secondary schooling, with rather less coverage of early years
and adult learning. Many countries have participated in one or more of these assessments but these are
primarily high- and middle-income countries. Only a few low-income countries have taken part in the
rigorous international comparison of learning achievements.
The particular achievement of LAMP has been to address the comparative assessment of achievement in
reading and basic numeracy in low-income countries, and to do so for older populations. Specifically, it
developed tests of reading and numeracy skills for young people aged 15 and older and for adults, and
administered them along with background questionnaires to substantial samples in four countries – Jordan,
Mongolia, Palestine and Paraguay.
This represents significant progress in several respects. Particularly, the focus on out-of-school populations
and those with low achievement levels. While tests such as the International Adult Literacy Survey, the Adult
Literacy and Lifeskills Survey, and the Programme for the International Assessment of Adult Competences
have measured adult literacy, none has focussed on low-income countries in the same way as LAMP. The
number of countries involved was small but they are extremely diverse – both culturally and linguistically.
Administration
LAMP faced – and resolved – major organisational challenges. The countries taking part lacked expertise in
large-scale assessment and considerable capacity building was required. Item development and translation
issues had to be addressed in each country. Extensive field testing was conducted (in six other countries in
addition to the four countries participating in the final study), which led to major changes in test items and
administration protocols.
Sampling and test administration presented considerable logistical challenges. Samples were household-
based, with households randomly selected to represent country demographics; within households, one
adult (aged 15 years or older) was randomly selected to complete the tests. National sample sizes ranged
from 2,666 to 4,666.
Background variables and policy implications
The collection of contextual information on LAMP participants and its use in analysing test results are a
particular strength of the study. A large amount of background data was collected on each participant,
ranging from personal details, education and work backgrounds to reading and numeracy practices. This
made it possible to analyse participants’ achievement levels in terms of (i) prior schooling and non-formal
education, (ii) gender, (iii) age and cohort, (iv) parental characteristics and socioeconomic status, (v) urban
versus rural location, (vi) use of reading and numeracy skills at home and (vii) use of these skills at work.
These analyses enabled a nuanced account of participants’ achievement levels which would not be possible
from looking at their raw scores alone. Indeed, accounts based on raw scores are potentially misleading

149
LAMP: Implementation in Diverse Settings
given the significant impact of some of the background variables. Beyond that, they point to implications for
policies on improving literacy and basic numeracy. These data suggest, for instance, that policies aimed at
increasing gender equity in reading and numeracy skills should go beyond the school system. They also point
to the importance of literacy practices for leisure and their potential to help reduce skill gaps.
It should be noted that the measurement of SES was country-specific. Given the variations in social
stratification across the four countries, it was judged necessary to construct a SES index separately for each
country. This was based on responses to the background questionnaire which covered household
possessions, household characteristics and demographic conditions, education level of the head of
household, and access to utilities and infrastructure, with latent class analysis being used to construct the
index. While this means that direct comparison of countries in terms of this variable should not be
undertaken, the methodology developed is highly relevant to measuring SES and could be adopted with
profit in other studies.
Low performance
LAMP’s focus on low performance is noteworthy, and instructive. By using a filter test, it was possible to
target individuals with limited reading skills and obtain more detailed information on their reading levels
than a test designed for the whole population would permit. These individuals were administered a ‘Reading
Components’ test which sought to measure their pre-reading skills. Typical items included letter naming and
word recognition. The test tended to involve oral rather than written responses because of these
respondents’ limited writing skills.
Unlike the other tests used in LAMP, the Reading Components test was specific to each country. This was
judged necessary in order to take into account the language, orthography and culture found in each country.
The relationship between a language and its writing system, for instance, can be very different depending
on the language, and assessment tasks at early reading levels need to be modified accordingly. Thus, while
the tests in each country were based on an agreed Reading Components framework, direct comparisons
between countries are not possible. In addition, the test lacks unidimensionality and does not lend itself to
analysis by using item response theory, further limiting the possibility of cross-country comparisons.
Some general patterns can be discerned, however, and the exercise was valuable for a number of reasons.
First, it demonstrated that it is possible to gather detailed information on the reading situation of adults with
limited reading skills. Instead of categorising individuals as literate/illiterate, it becomes possible to capture
their performance on the different elements of early reading – letter naming, word recognition, word
meaning, sentence processing, speed of response, and so on. Secondly, it suggested a number of fruitful
hypotheses on the relationships between the different elements of early reading: sentence comprehension
seems to be easier than passage comprehension; expository texts are more challenging than narrative ones;
and speed of response has little association with passage comprehension. Thirdly, the information yield
from the Reading Components test is extremely useful in guiding adult literacy instruction. Individuals with
limited reading skills can differ greatly in their profiles of reading skills, and will progress more effectively if
instruction takes account of those profiles.
LAMP and literacy rates
Literacy is key to learning and is important both in its own right and as a means to open a gateway to other
learning. Measuring literacy has been key to national and international targets, and reading proficiency is an
explicit target in SDG 4.1. Conventionally, literacy rates are determined on the basis of self- (or third-party)

150
LAMP: Implementation in Diverse Settings
reports or a proxy (number of years of schooling). The limitations of these approaches are known. They are
indirect, unreliable and prone to substantial over-reporting. They are, moreover, based on a simplistic notion
of literacy and do not take into account that literacy skills depend on context and sit on a continuum. They
are of course a relatively fast and inexpensive way of generating a measure of literacy that can be expressed
simply.
There is a significant trade-off, however, between ease of use and accuracy. If an indicator is neither accurate
nor relevant, its utility has to be called into question. LAMP does address the weaknesses of conventional
ways of producing literacy rates as it is based on actual competencies rather than reported ones, making it
a direct measure and not a proxy. LAMP reflects the complexity of language in use and the collection of
background data permits in-depth analyses which can guide reform efforts. It is time-consuming and, for
now, relatively expensive. Further work is needed to facilitate its wider use.
LAMP does, however, provide a robust challenge to the use of one-shot and potentially misleading literacy
rates. If ways of streamlining its administration, analysis and reporting can be devised, it will certainly prove
its worth in informing national reform efforts to improve adult literacy. And it may lead to new thinking on
the collection and publication of international comparative data on literacy.
Studying bilingual situations
Given the large number of people worldwide who speak two (or more) languages, the case study of Paraguay
in LAMP is particularly instructive. It is interesting in its own right and is a good example of the kind of in-
depth analysis that LAMP data permit. In Paraguay, a majority of the population are bilingual and fluent in
both Guarani and Spanish (two-thirds of the LAMP sample claimed to be bilingual in the spoken languages).
Bilingual situations entail complex relationships between the two languages in terms of status, context of
use, literacy levels, exposure, use at home and in the community. Typically, these vary from one bilingual
situation to another.
LAMP analysed some of these relationships in Paraguay and produced findings that are relevant to language
teaching and learning in Paraguay. More significantly, however, it provides tools and a methodology for
doing similar in-depth analyses in other bilingual situations, where the implications for policy and pedagogy
may be quite different. Bilingualism is a feature of life in many low-income countries and has implications
for both schooling and labour market participation. Many students are schooled in a language that is not
their mother tongue and, when they leave school, participate in a society and labour market where they
must use a language different from their home language. The Paraguayan case study conducted within LAMP
is instructive as it demonstrates how bilingualism and its interaction with reading achievement can be
studied in depth. In this way, effective language policies both for schools and for society at large can be
formulated on the basis of relevant evidence.

151
LAMP: Implementation in Diverse Settings
LAMP and the SDGs
LAMP is unlikely to be able to make a direct input to measuring the SDGs. However, it provides valuable
information on the development of indicator 4.6.1. LAMP produces relatively detailed information on
participants’ reading and numeracy profiles, where the learning indicator associated with target 4.6 is
couched in terms of the proportion of adults “achieving at least a fixed level of proficiency in functional
literacy and numeracy skills”. In the end, LAMP requires substantial resources to administer and it is unlikely
that a LAMP-like study could be implemented globally.
The experience of LAMP can inform SDG measurement, however. First, it demonstrates that, while
meaningful data can be gathered on low performance, cross-national comparisons of individuals with low
performance are not readily accessible. Given the policy interest in this group, this is a salutary lesson that
must be borne in mind. Policy makers may wish to make comparative statements about this group despite
lacking adequate data, but the LAMP experience and the methodology necessary to study low performance
should serve to dissuade them from doing so.
Secondly, LAMP demonstrates how a given country can build on a global indicator to advance education
reform. Metrics associated with indicator 4.1.1 will locate countries in relation to percentages of students
reaching minimum proficiency levels. This is useful information and yet merely marks a starting point. If – as
may well be the case for many low-income countries – this percentage is low, it becomes necessary to
conduct separate investigations into the low-performance population to determine the nature of their low
performance, with a view to making targeted, effective interventions. This is where the tools and
methodology developed by LAMP become instructive. Even if they cannot be used directly with a school-
based population, they offer the possibility of obtaining a structured account of low performance and point
to ways in which this can be improved for a younger population.
Thirdly, while LAMP does not lend itself to global comparisons, it does permit some limited benchmarking
for countries that are ‘statistical neighbours’. Where countries are clustered together on development
indexes, it can be instructive to compare each other on LAMP subscores. Such benchmarking is not
concerned with rank ordering but with gaining a deeper understanding of a country’s performance levels
and learning how to bring about improvement from studying neighbouring countries’ practices.
Resources
LAMP was resource-intensive and took a great deal of time to complete. If it were to be repeated or carried
out in other countries, however, the demands would not be as great as a methodology and set of tools have
been developed and there is now a body of implementation experience to draw on. Substantial resources
would still be required to run LAMP in a new country. Instruments would need to be translated and some
items might have to be adapted. The Reading Components test and elements of the background
questionnaire such as the SES measure would need to be developed for that country. Field testing would
need to be conducted and modifications made as necessary. In addition, in many countries, capacity
development would be required with respect to sampling; test administration; data entry and scoring;
analysis; and reporting.
The cost entailed, while considerable, should be seen in perspective. If the purpose was just to produce a
national status indicator, the cost might well seem prohibitive and not readily justified. If, however, LAMP
was being administered as part of a national reform effort to improve reading and numeracy levels across

152
LAMP: Implementation in Diverse Settings
a country, its cost as an intelligence-gathering element would be a small proportion of the overall cost of
such a programme. Monitoring should in any case be built into such programmes, and it is likely that the
intelligence produced by a tool such as LAMP would be cost-effective in helping to maximise the use of
programme resources.
Conclusion
LAMP has demonstrated feasibility as a large-scale assessment of adults’ reading and basic numeracy skills
in low-income countries. As an assessment, it was challenging and resource-intensive, but it was done to a
high standard and constitutes an effective proof of concept. It produced detailed information on the
distribution of reading and numeracy skills in the participating countries, with a particular focus on
individuals with low attainment levels. It collected a wide range of background information which enabled
in-depth analyses of patterns of performance which helped both to explain those patterns and to guide
policy on literacy programmes. Its case study of a bilingual country shows how bilingualism and its
interaction with reading achievements can be studied in depth. Finally, LAMP has produced tools and a
methodology which can be used to support literacy improvement in a variety of ways.

153
LAMP: Implementation in Diverse Settings
References
Beaton, A. E. and Allen, N. L. (1992). “Interpreting scales through scale anchoring”. Journal of Educational
Statistics, Vol. 17, No. 2, pp. 191-204.
Borooah, V. (2009). “The Role of Maternal Literacy in Reducing the Risk of Child Malnutrition in India”. Pal,
Manoranjan, Bharati, Premananda, Ghosh, Bholanath and Vasulu, T.S. (eds), Gender and
Discrimination: Health, Nutritional Status and Role of Women in India. Oxford: Oxford University Press,
pp. 141-162.
Butcher, F. and Case, A. (1994). “The effect of sibling sex composition on women’s education and earnings”.
The Quarterly Journal of Economics, Vol. 109, No. 3, pp. 531-563.
Carr-Hill, R. (2008). International literacy statistics: A review of concepts, methodology and current data.
Montreal: UNESCO Institute of Statistics.
http://www.uis.unesco.org/Library/Documents/Literacyreport2008_en.pdf
Charette, M.F. and Meng, R. (1998). “The determinants of literacy and numeracy, and the effect of literacy
and numeracy on our market outcomes”. Canadian Journal of Economics, Vol. 31, No. 3.
Chesters, J., Ryan, C. and Sinning, M. (2013). The returns to literacy skills in Australia. Adelaide: NCVER.
Chevalier, A. (2004). Parental Education and Child’s Education: A Natural Experiment. IZA Discussion Paper
1153, Bonn, Germany: Institute for the Study of Labor (IZA).
Coulmas, F. (1989) The writing systems of the world. Oxford: Basil Blackwell.
d’Addio, A. C. (2007). Intergenerational Transmission of Disadvantage: Mobility or Immobility across
Generations? A Review of the Evidence for OECD Countries. OECD Social, Employment and Migration
Working Papers No. 52. Paris: OECD. http://www.oecd.org/els/38335410.pdf
Davis-Kean, P. E. (2005). “The Influence of Parent Education and Family Income on Child Achievement: The
Indirect Role of Parental Expectations and the Home Environment”. Journal of Family Psychology,
Vol. 19, No. 2, pp. 294–304.
Department of Statistics (2004). Population and Housing Census 2004. Amman: Department of Statistics,
Hashemite Kingdom of Jordan.
Desjardins, R. (2003). “Determinants of literacy proficiency: a lifelong-lifewide learning perspective”.
International Journal of Educational Research, Vol. 39, pp. 205-245.
DeWalt, D.A., Berkman, N.D., Sheridan, S., Lohr, K.N. and Pignone, M.P. (2004). “Literacy and health
outcomes”. Journal of General Internal Medicine, Vol. 19, No. 12, pp. 1228-1239.
Diekman A. B., Brown E. R., Johnston A. M. and Clark E. K. (2010). “Seeking congruity between goals and
roles a new look at why women opt out of science, technology, engineering, and mathematics
careers”. Psychological Sciences, Vol. 21, No. 8, pp. 1051-1057.
Green, D.A. and Craig Riddell, W. (2003). “Literacy and earnings: an investigation of the interaction of
cognitive and unobserved skills in earnings generation”. Labour Economics, Vol. 10, No. 2, pp. 165-
184.

154
LAMP: Implementation in Diverse Settings
Hausman, R. and Szekely, M. (1999). Inequality and the Family in Latin America. Working Paper # 393.
Washington, DC: Office of the Chief Economist, Inter-American Development Bank.
http://www.iadb.org/res/publications/pubfiles/pubwp-393.pdf
Ina V.S., Mullis, I.V.S., Martin, M.O., Gonzalez, E.J. and Chrostow, S.J. (2004). 2003 International Mathematics
Report: Findings from IEA’s Trends in International Mathematics and Science Study at the Fourth and
Eighth Grades. Boston: TIMSS & PIRLS International Study Center, Lynch School of Education, Boston
College.
Independent Evaluation Group (2011). Project Performance Assessment Report Hashemite Kingdom of Jordan.
Report No.: 62732. Education Reform for Knowledge Economy I Program (Tf053276), IEG Public
Sector Evaluation. Washington, DC: World Bank.
https://ieg.worldbankgroup.org/Data/reports/PPAR_Jordan_Higher_Education_Development_Projec
t.pdf
Kirsch, I.S. (2001). The International Adult Literacy Survey (IALS): Understanding What Was Measured. RR-01-25.
Princeton, NJ: Educational Testing Service, Statistics and Research Division.
Kirsch, I. S., Jungeblut, A., Jenkins, L. and Kolstad, A. (1993). Adult literacy in America: A first look at the results
of the National Adult Literacy Survey. Washington, D.C.: U.S. Department of Education.
Lord, F. M. (1980). Applications of item response theory to practical testing problems. Hillsdale, NJ: Lawrence
Erlbaum Associates.
Maddox, B. (2014). “Globalising assessment: an ethnography of literacy assessment, camels and fast food
in the Mongolian Gobi”. Comparative Education, Vol. 50, No. 4, pp. 474-489.
Martin, M.O. and Mullis, I.V.S. (eds.) (2013). TIMSS and PIRLS 2011: Relationships among reading, mathematics,
and science achievement at the fourth grade — implications for early learning. Chestnut Hill, MA:
Boston College.
Mosenthal, P.B. and Kirsch, I.S. (1998). “A new measure for assessing document complexity: The
PMOSE/KIRSCH document readability formula”. Journal of Adolescent and Adult Literacy, Vol. 41, No.
8, pp. 638-657.
Mullis, I. V. S., Martin, M.O. and Foy, P. (2008). TIMSS 2007 International Mathematics Report: Findings from
IEA’s Trends in International Mathematics and Science Study at the Fourth and Eighth Grades Boston.
Chestnut Hill, MA: TIMSS & PIRLS International Study Center, Lynch School of Education, Boston
College.
Mullis, I.V.S., Martin, M.O., Foy, P. and Arora, A. (2012). TIMSS 2011 international results in mathematics.
Chestnut Hill, MA: Boston College.
NCHRD (National Center for Human Resources Development) (2006). National Assessment for Knowledge
Economy (NAfKE) Skills Report 2006. Amman, Jordan: NCHRD.
NCHRD (National Center for Human Resources Development) (2008). National Assessment for Knowledge
Economy (NAfKE) Skills Report 2008. Amman, Jordan: NCHRD.
NCHRD (National Center for Human Resources Development) (2011). National Assessment for Knowledge
Economy (NAfKE) Skills Report 2011. Amman, Jordan: NCHRD.

155
LAMP: Implementation in Diverse Settings
NCHRD (National Center for Human Resources Development) (2013). National Assessment for Knowledge
Economy (NAfKE): Decline Factors/ 2011. ERfKE II Policy Brief, no. 3 Amman, Jordan: NCHRD.
Nunnaly, J. (1978). Psychometric theory. New York: McGraw-Hill.
OECD (2002). Reading for Change – Performance and Engagement across Countries, Paris: OECD Publishing.
https://www.oecd.org/edu/school/programmeforinternationalstudentassessmentpisa/33690986.p
df
OECD (2006). Starting strong II: Early Childhood education and Care. Paris: OECD.
OECD (2013a). OECD Skills Outlook 2013: First Results from the Survey of Adult Skills. Paris: OECD Publishing.
http://dx.doi.org/10.1787/9789264204256-en
OECD (2013b). Skilled for Life? Key Findings from the survey of Adult Skills. Paris: OECD.
https://www.oecd.org/site/piaac/SkillsOutlook_2013_ebook.pdf.
OECD (2013c). The Survey of Adult Skills: Reader’s Companion. Paris: OECD Publishing.
http://dx.doi.org/10.1787/9789264204027-en
OECD (2014a). Education at a Glance 2014: OECD Indicators. Paris: OECD. http://dx.doi.org/10.1787/eag-
2014-en
OECD (2014b). PISA 2012 Technical Report. Paris: OECD. http://www.oecd.org/pisa/pisaproducts/PISA-2012-
technical-report-final.pdf
OECD and Statistics Canada (2000). Literacy in the in Information Age: Final Report of the International Adult
Literacy Survey. Paris: OECD and Canada: the Minister of Industry.
OECD and Statistics Canada (2005). Learning a Living: First Results of the Adult Literacy and Life Skills Survey.
Paris: OECD. http://dx.doi.org/10.1787/9789264010390-en
Palestinian Central Bureau of Statistics (2012). Press release on the Eve of the International Population Day
11/07/2012. Ramallah: Palestine, p. 4.
Pike, G.R. (2007). “Adjusting for non-responses in surveys” (pp. 411-449). J.C. Smart (ed.), Higher education
handbook of theory and research (Vol. XXII). Netherlands: Springer.
Ponczek, V.P. and Rocha, M.B. (2011). “The effects of adult literacy on earnings and employment”.
Economics of Education Review, Vol. 30, No. 4, pp. 755-764.
Postlethwaite, T. N. (2004). Monitoring educational achievement. Fundamentals of Educational Planning
series. Paris: UNESCO International Institute for Educational Planning.
http://unesdoc.unesco.org/images/0013/001390/139059e.pdf
Reynaldo, J. and Santos, A. (1999). “Alpha: A Tool for Assessing the Reliability of Scales”. Journal of
Extensions, Vol. 37, No. 2. http://www.joe.org/joe/1999april/tt3.php
Rivera-Batiz, F. L. (1992). “Quantitative literacy and the likelihood of employment among young adults in
the United States”. Journal of Human Resources, Vol. 27, No. 2, pp. 313-328.
Saucerman, J. and Vasquez, K. (2014). “Psychological Barriers to STEM Participation for Women Over the
Course of Development”. Adultspan Journal, Vol. 13, No. 1, pp. 46-64.

156
LAMP: Implementation in Diverse Settings
Shah, Z. A., Mahmood, N. and Harrison, C. (2013). “Attitude towards Science Learning: An Exploration of
Pakistani Students”. Journal of Turkish Science Education, Vol. 10, No. 2, pp. 35-47.
http://ssrn.com/abstract=2332777
Shomos, A. and Forbes, M. (2014). Literacy and Numeracy Skills and Labour Market Outcomes in Australia.
Productivity Commission Staff Working Paper. Canberra: Australian government.
Street, Brian (1998). “New Literacies in Theory and Practice: What are the implications for language in
education?” Linguistics and Education, Vol. 10, No. 1, pp. 1-24.
Strucker, J., Yamamoto, K. and Kirsch, I. (2007). The Relationship of the Component Skills of Reading to IALS
Performance: Tipping Points and Five Classes of Adult Literacy Learners. NCSALL Reports #29.
Cambridge, MA: National Center for the Study of Adult Learning and Literacy, Harvard Graduate
School of Education.
Taylor, S. E., Sherman, D. K., Kim, H. S., Jarcho, J., Takagi, K. and Dunagan, M. S. (2004). “Culture and social
support: Who seeks it and why?” Journal of Personality and Social Psychology, Vol. 87, pp. 354-362.
Tsogtsaikhan, B. (2008). “Demographic changes and labour migration in Mongolia”. Pacific Economic
Cooperation Council-ABAC Conference, Demographic Change and International Labour Mobility in the
Asia Pacific Region: Implications for Business and Cooperation. Seoul: Pacific Economic Cooperation
Council, p. 25.
Uccelli, P., Barr, C. D., Dobbs, C. L., Phillips Galloway, E., Meneses, A. and Sánchez, E. (2015). “Core Academic
Language Skills (CALS): An expanded operational construct and a novel instrument to chart school-
relevant language proficiency in pre-adolescent and adolescent learners”. Applied Psycholinguistics,
Vol. 5, pp. 1075-1107.
UIE (1997). The Hamburg Declaration: The Agenda for the Future. Fifth International Conference on Adult
Education. Hamburg: UNESCO Institute for Education.
http://www.unesco.org/education/uie/confintea/pdf/con5eng.pdf.
UIS (2006). Global education digest 2006: Comparing education statistics across the world. Montreal: UNESCO
Institute for Statistics. http://www.uis.unesco.org/Library/Documents/ged06-en.pdf
UIS. (2008). Guidelines and methodology for the collection, processing, and dissemination of international
literacy data. Version 3. Montreal: UNESCO Institute for Statistics, Literacy and Adult Education
Statistics Programme. http://www.uis.unesco.org/Library/Documents/LitMethodology2008_en.pdf
UIS (2009). The next generation of literacy statistics: Implementing the Literacy Assessment and Monitoring
Programme (LAMP). Montreal: UNESCO Institute of Statistics.
UIS (2014a). International Standard Classification of Education: ISCED 2011. Montreal: UIS.
http://www.uis.unesco.org/Education/Documents/isced-2011-en.pdf
UIS (2014b). UNESCO Institute for Statistics database. Montreal: UIS. http://data.uis.unesco.org
UIS (2016). Sustainable Development Data Digest: Laying the Foundation to Measure Sustainable
Development Goal 4. Montreal: UIS. http://dx.doi.org/10.15220/978-92-9189-197-9-en.

157
LAMP: Implementation in Diverse Settings
UNESCO (1958). Recommendation concerning the international standardization of educational statistics, in
Records of the General Conference: Tenth session. Paris: UNESCO.
http://unesdoc.unesco.org/images/0011/001145/114584e.pdf
UNESCO (1964). Declaration on the Eradication of Illiteracy in the United Nations Development Decade. General
Conference of UNESCO, 13th session.
http://www.unesco.org/education/information/nfsunesco/pdf/ILLITE_E.PDF
UNESCO (1978). Revised recommendation concerning the International Standardization of Educational Statistics,
in Records of the General Conference: Twentieth session. Paris: UNESCO.
http://unesdoc.unesco.org/images/0011/001140/114032e.pdf
UNESCO (1996). Learning: The Treasure Within. Paris: UNESCO.
UNESCO (2004). The Plurality of Literacy and its Implications for Policies and Programmes. Position paper.
Paris: UNESCO. http://unesdoc.unesco.org/images/0013/001362/136246e.pdf
UNESCO (2005). Aspects of Literacy Assessment: Topics and Issues from the UNESCO Expert Meeting. Paris:
UNESCO. http://unesdoc.unesco.org/images/0014/001401/140125eo.pdf.
UNESCO (2006). Literacy for Life: EFA Global monitoring report. Paris: UNESCO.
http://www.uis.unesco.org/Library/Documents/gmr06-en.pdf
UNESCO (2010a). CONFINTEA VI: Belém Framework for Action: Harnessing the power and potential of adult
learning and education for a viable future. Hamburg: UNESCO Institute for Lifelong Learning.
UNESCO (2010b). CONFINTEA VI: Sixth International Conference on Adult Education: Final Report. Hamburg:
UNESCO Institute for Lifelong Learning. http://www.unesco.org/en/confinteavi
UNESCO (2013). 2nd Global Report on Adult Learning and Education: Rethinking Literacy. Hamburg: UNESCO
Institute for Lifelong Learning. http://unesdoc.unesco.org/images/0022/002224/222407E.pdf
UNESCO (2016) Education 2030. Incheon declaration and framework for action: Towards inclusive and
equitable education and lifelong learning for all. Paris: UNESCO
http://unesdoc.unesco.org/images/0024/002432/243278e.pdf
UNESCO-UIS (2008). Literacy Assessment and Monitoring Programme (LAMP): Framework for the Assessment of
Reading Component Skills. Montreal: UNESCO Institute for Statistics (UIS).
UNESCO-UIS (2009). The Next Generation of Literacy Statistics: Implementing the Literacy Assessment and
Monitoring Programme (LAMP) (Technical Paper No. 1). Montreal: UNESCO Institute for Statistics (UIS).
United Nations (2015). The Millennium Development Goals Report 2015. New York: United Nations.
http://mdgs.un.org/unsd/mdg/Resources/Static/Products/Progress2015/English2015.pdf.
United Nations Department of Economic and Social Affairs, Population Division (2013a). World Population
Prospects: The 2012 Revision, DVD Edition. New York: UNPD.
United Nations Department of Economic and Social Affairs, Population Division (2013b). World Population
Prospects: The 2012 Revision, Volume II: Demographic Profiles. New York: UNPD, p. 870.
United Nations Development Programme (2011). Human Development Report 2011, Sustainability and Equity:
A Better Future for All. New York: UNDP, p. 185.

158
LAMP: Implementation in Diverse Settings
Valerio, A., Puerta, M.L.S., Pierre, G., Rajadel, T. and Monroy Taborda, S. (2014). STEP Skills Measurement
Snapshot. Washington, DC: World Bank.
Wang, M. T., Eccles, J. S. and Kenny, S. (2013). “Not lack of ability but more choice: Individual and gender
differences in choice of careers in science, technology, engineering, and mathematics”.
Psychological Science, Vol. 24, pp. 770–775.
Woessmann, L. (2004). How Equal are Educational Opportunities? Family Background and Student Achievement
in Europe and the US. CESifo Working Paper No. 1162. Category 4: Labour Markets. Munich: CESifo
Group. https://www.cesifo-group.de/ifoHome/publications/working-
papers/CESifoWP/CESifoWPdetails?wp_id=14559558
World Bank (2014). World Bank database. Washington D.C.: World Bank. http://data.worldbank.org
World Economic Forum (2014) The Global Competitiveness Report 2014–2015: Full Data Edition. Geneva:
World Economic Forum.
World Health Organization (2011). World Health Statistics 2011, p. 170.
Zadeh, Z.Y., Farnia, F. and Ungerleider, C. (2010). “How home enrichment mediates the relationship
between maternal education and children's achievement in reading and math”. Early Education &
Development, Vol. 21, No. 4, pp. 568-594.
Zhang, J. (2007). “Conditional covariance theory and DETECT for polytomous items”. Psychometrika, Vol. 72,
pp. 69-91.
Zhang, J. (2010). Literacy review on dimensionality analysis method. Montreal: UIS.
Zhang, J. and Stout, W. F. (1999). “The theoretical DETECT index of dimensionality and its application to
approximate simple structure”. Psychometrika, Vol. 64, pp. 213-249.

159
LAMP: Implementation in Diverse Settings
Glossary
Anchor points. Points on the score scale that divide the LAMP scale into segments so that persons whose
scores are within the same segment perform in similar ways. The segments are called performance levels.
LAMP has three performance levels. Anchor points are sometimes called “cut scores”.
Bilingualism. The use of at least two languages by an individual and the frequent use (as by a community)
of two languages.
Bilingual advantage. A growing yet controversial field of research that deals with the consequences (either
positive or negative) of bilingualism on cognition and literacy development.
Cloze reading assessment format. A reading comprehension assessment method created by replacing
every fifth word (excluding verbs, conjunctions, and articles) with blanks of equal length. The examinee’s task
is to read the passage and put in the missing words.
Continuous text. Narrative, expository, descriptive, argumentative/persuasive or injunctive/instructive text
composed of sentences that may be organised in turn into paragraphs, sections, chapters. For example,
prose found in books and newspaper articles.
Cohort. A group of persons who have a common experience or characteristic within a given period. For
example, all persons who completed primary school between 1995 and 2000.
Confidence interval. A range of values that is a good estimate of an unknown population parameter. A
confidence interval for the mean is a range of values that estimates the actual value of the population mean.
Construct. The trait or characteristic that an assessment instrument has been designed to measure.
Correlation coefficient. A statistical index that quantifies, on a scale of −1 to +1, the degree of relationship
between the scores from one assessment and the scores from another.
Cut-score. A numerical score on a metric that is used to determine whether an examinee’s performance is
sufficient for some purpose. For example, on LAMP whether a person’s LAMP performance is sufficient to
be classified as Level 1, Level 2 or Level 3.
Differential Item Functioning. An approach to studying item fairness at the level of individual test items
rather than looking simply at average differences in an item’s performance. The approach studies whether
persons of the same ability, but from two different groups, performed differently on the item.
Digit naming. The ability to name a numerical symbol or digit (e.g. ‘2’ or ‘5’) when it is used to represent a
number.
Diglossia. A situation where two languages (or two varieties of the same language) are used under different
conditions within a community – often by the same speakers. The term also can be applied to languages
with distinct ‘high’ and ‘low’ (colloquial) varieties, such as Arabic.
Dimensionality analysis. A statistical analysis that evaluates whether all of the items on a test measure
the same dimension or trait.
160
LAMP: Implementation in Diverse Settings
Discontinuous texts. Text that is not organized in a continuous fashion. For instance, charts, graphs,
diagrams, maps, forms and advertisements.
Document skills. The ability to comprehend discontinuous texts, typically not organized in paragraphs, such
as tables, graphs, schedules and forms.
Graphemes. The smallest unit of written language (e.g. letter or group of letters) representing the sounds
in words. For example, the sound /ai / in ‘rain’ is represented by the written letters ‘ai’.
Household-based assessment. A test administered at the household level to capture individuals’ skills
under conditions that are intended to be as standardised as possible to prevent procedural inconsistencies
from affecting the results.
Household survey. The collecting of information on a number of variables by sampling households and
interviewing individuals from those households.
Human Development Index. A composite statistic of life expectancy, education and income per capita
indicators, which are used to rank countries into tiers of human development.
Letter naming. The ability to name letters in an alphabet.
Literacy. The ability to identify, understand, interpret, create, communicate and compute using printed and
written materials associated with varying contexts. Literacy involves a continuum of learning in enabling
individuals to achieve their goals, develop their knowledge and potential, and participate fully in their
community and wider society.
Literacy rate. The number of literate persons in a given age group, expressed as a percentage of the total
population in that age group.
Logographies. The use of letters, symbols or signs to represent an entire word (e.g. $ to represent the word
‘dollar’).
Mean. An average score found by summing all of the scores and dividing by their number. Also known as
the arithmetic mean.
Multilingualism. The ability to speak, understand, read and write three or more languages.
Monolingualism. The ability to speak only one language.
Morpheme. The smallest, meaningful unit of language. A morpheme may be a word or a word part. For
example, ‘s’ in ‘cats’ is a morpheme that conveys number.
Mother tongue. This term is used interchangeably with the term ‘native language’, referring to the first
language one learns to speak, primary language used or one’s dominant language.
Numeracy skills. The ability to perform mathematical operations with the possibility of written support.

161
LAMP: Implementation in Diverse Settings
Open-ended question. An assessment task that does not present possible answers from which the
examinee is to select and that allows more than one correct answer.
Oral quantitative skills. “Mental calculations” in numeracy that do not include written support.
Oral vocabulary skills. Knowledge of vocabulary that does not involve written support.
Partial correlation coefficient. The correlation index between scores on two variables after controlling for
other variables.
Passage fluency exercises. Exercises that capture passage reading fluency that emerges from skilled
reading. This is an indicator of whether visual word identification processes are efficiently feeding language-
processing systems (e.g. working memory) to produce outputs.
Phoneme. The smallest unit of sound.
Precursors. In assessing literacy, this refers to letter naming and word recognition.
Proficiency/Performance levels. Performance level statements about the things an examinee can perform
or do with the subject or content being assessed by the test.
Prose skills. The ability to comprehend continuous texts, typically organized in paragraphs.
Reading Components. Items used to measure the pre-reading skills of individuals who possess limited
reading comprehension skills, limited writing skills or both but who are not totally lacking in any reading-
related skills.
Reliability coefficient. Any of several statistical indices that quantify the amount of consistency in
assessment scores.
Self-report. The information participants provide about themselves regarding a variable in which a
researcher is interested.
Sentence processing exercises. An exercise to assess if an individual can only decode words or is also able
to grasp the meaning of a sentence.
Skill domains. Literacy skills may be differentiated in relation to the types of material or formats in which
written texts appear. For LAMP, this resulted in the identification of three major skill domains: Prose,
Document and Numeracy.
Standard deviation. A statistical index that measures the spread of the scores in a distribution calculated
by taking the square root of the mean squared deviation of the scores from the arithmetic mean of the
scores.
Standard error of the mean. The standard deviation of sample means over all possible samples (of a given
size) drawn from the population.

162
LAMP: Implementation in Diverse Settings
Stimuli. In assessments, this term refers to the question, passage, or prompt that an examinee is given in
order to be able to answer the question(s) the test poses.
Syllabaries. Phonetic writing systems consisting of symbols representing syllables.
Validity. The soundness of one’s interpretations and uses of examinees’ assessment results.

163
LAMP: Implementation in Diverse Settings
Annex 1. Support for the validity of having three major domains in LAMP
Dimensionality
Educational or psychological assessments/tests usually have several content areas or subscales to measure.
Many test frameworks or blueprints often explicitly stipulate that their test items measure several content
areas or subscales. For instance, the Literacy Assessment and Monitoring Programme (LAMP) measures
three scales: Prose, Document and Numeracy. In operational analysis, items are classified according to their
predominant areas, such as prose items, numeracy items, and so forth, and each content-based subset of
items is regarded as unidimensional.
Item response theory (IRT) has been used in the analysis of response data from educational and
psychological tests, including in LAMP. IRT uses probability models to characterise the interaction between
test takers and test items (see Lord, 1980). These models contain both item parameters and examinee
parameter(s), called abilities or traits. IRT assumes that examinee performance on a test can be predicted
and/or explained by the abilities underlying examinee performance on the items. The structure of response
data, resulting from the interaction between test items and test takers, is called the statistical dimensional
structure. If the sample of examinees is representative of the population, the statistical dimensional
structure is the estimate of the dimensional structure of the test. The purpose of a dimensionality analysis
given a set of response data is to identify its statistical dimensional structure of response data and infer the
(true) dimensional structure of the test (Zhang, 2010).
Several statistical methods are available for dimensionality analysis: factor analysis, cluster analysis and
multidimensional scaling. The intuitive idea behind most dimensionality assessment procedures is that all
items within a particular cluster are highly correlated or have high similarities among themselves but have
relatively low correlations or similarities with items in a different cluster. The difficulties of grouping items
into clusters are how to distinguish between high and low correlations/similarities and how to choose the
number of clusters. Therefore, a better similarity measure is needed. DETECT, short for dimensionality
evaluation to enumerate contributing traits, is a statistical procedure that is used to identify the number of
dominant latent dimensions to estimate the degree of multidimensionality, and to assign items to
dimensionally homogeneous clusters when such a structure exists. The DETECT index has been
mathematically proven to be maximised at the correct dimensionally based cluster partition of a test, where
each cluster in this partition corresponds to a distinct dominant dimension under certain reasonable
conditions (Zhang and Stout, 1999; Zhang, 2007).
Due to the two-stage assessment design (respondents completed a first cognitive book, then were assigned
another cognitive book based on their performance on the first book) in LAMP, not all respondents answer
all items. Therefore, there are a lot of missing item responses. Since the data matrix is very sparse, not every
item pair is administered to the same respondents; similarities or distances among some items cannot be
calculated. DETECT was modified and adapted to LAMPs two-stage test design and was applied to identify
the number of dimensions for the LAMP item response data. A dimensionality analysis was performed on
LAMP field test data to provide a solid foundation for the subsequent statistical and psychometric analysis.

164
LAMP: Implementation in Diverse Settings
Specifically, to (1) identify the number of the dimensions of the LAMP item response data32; and (2) provide
statistical evidence/information to make an informed decision for reporting scales – two (Prose plus
Document and Numeracy) or three (Prose, Document and Numeracy) reporting scales were used. The
dimensionality analysis was conducted again on the main survey data. It was applied twice to each of the
four countries. The DETECT index consistently implies a three-dimensional structure, therefore, LAMP is
reported in three scales: Prose, Document and Numeracy.
Domains and performance levels
Basic explanation for the domains
The identification of three major domains (Prose, Document and Numeracy) was the result of recognising
that skills may be differentiated in relation to the types of material or formats in which written texts appear.
This idea was reinforced by the fact that different types of written material do not appear in a similar fashion
across the different milieus of everyday life. For instance, work-related settings involve using documents
such as forms, graphs or charts, while continuous documents are more present in leisure and in the
academic field. Text formats are also associated with purpose and this, in turn, is linked to different reading
strategies.
Prose-related skills involve the ability to process texts formed by sentences organized into paragraphs. These
texts are organized using paragraph setting, indentation and a hierarchy expressed by headings that help
the reader recognise the organization of the text. Document-related skills involve the ability to use non-
continuous texts organized in a way that allows the reader to employ different strategies to enter and extract
information. Rosenthal and Kirsch (1998) suggested that these texts, even if they appear in rather different
formats (tables, schedules, charts, maps, forms, etc.) can be classified into four types: simple list; combined
list; intersected list; or nested list. Using these types, one can produce matrix (identifiable rows and columns),
graphic, locative and entry documents.
Numeracy skills are measured using short tasks with mathematical content that are embedded in
hypothetical contexts that simulate real-life situations. Successfully completing these tasks requires
computing skills; estimating skills; an understanding of notions of shape, length, volume and monetary units;
measuring skills; and understanding some statistical ideas or interpreting simple formulas. Respondents can
use, if they wish, a four-function calculator. Measuring numeracy skills in a comparable manner across
cultures, however, poses very specific challenges since the way people deal with numbers is also culture-
specific. The extreme example of this situation is given by the major differences between operating in
decimal and non-decimal systems.
LAMP, therefore, includes a number of tasks that involve operating with continuous and non-continuous
texts and mathematical operations.
32 The UIS commissioned a paper on dimensionality study using LAMP field test data. The technical report,
Literacy Review on Dimensionality Analysis Method, was completed by Jimning Zhang (University of Illinois
at Urbana-Champaign) in 2010.

165
LAMP: Implementation in Diverse Settings
Annex 2. Anchoring process and performance level definitions
Anchoring process
Constructing scales is important in educational measurement, but interpreting the meanings of scale
scores is always required. The basic idea of scale anchoring is to find out what the respondents at certain
score points on a performance continuum scale know and can do, based on their responses to items that
are located in a segment of the score scale. A few carefully selected scale points define the boundaries of
each segment of the score scale, so that performance within the segment can be described. These selected
points are called ‘anchor points’ or ‘cut scores’ that divide the scale into performance levels, within which
persons perform in similar ways. LAMP has three performance levels.
LAMP established its anchor points using a similar process as described in Beaton and Allen (1992). LAMP
calculated the anchor points as follows (Brenda Tay-Lim, personal correspondence, 14 June 2016). Within
each domain, the four countries’ items were calibrated concurrently. Then, within each domain, the IRT
abilities were estimated for all respondents in the four countries. After estimation, all respondents’ ability
estimates were ranked ordered within each domain. The 30th percentile in each distribution became the
anchor point or cut score for the boundary between Level 1 and Level 2; the 70th percentile became the cut
score for the boundary between Level 2 and Level 3. Table A.2.1 shows the scale values of the cut scores
on both the IRT metric and the LAMP reporting metric.
Table A.2.1. Values of the anchor points (cut scores) that define the boundaries between the LAMP
levels
Cut score for boundary
between Levels 1 and 2
Cut score for boundary
between Levels 2 and 3
Domain
Score on IRT
ability scale
Score on
LAMP
reporting
scale
Score on IRT
ability scale
Score on
LAMP
reporting
scale
Prose -0.4874 951 0.5256 1,052
Document -0.5108 949 0.4759 1,048
Numeracy -0.6505 935 0.5361 1,054
Note: The IRT scale has a mean = 0 and standard deviation = 1. The LAMP reporting
scale has a mean = 1,000 and standard deviation = 100.
It is also likely that in most cases, performance is cumulative. Respondents at high score levels generally
know and can do all that respondents at lower levels know and can do, but they also know and can do
more than respondents at lower levels. Thus, performance level descriptions should describe the increases
in performance between the various anchor points. The items that discriminate between adjacent anchor
points are usually reviewed to see if the specific tasks that they include can be generalised to describe the
level of performance at or above the anchor point from the level of performance below the anchor point.
In this way, what respondents at various scale points know and are able to do can be summarised (Beaton
and Allen, 1992).

166
LAMP: Implementation in Diverse Settings
Performance Level descriptions
The scale anchoring process starts with identifying the item location (from easy to difficult) on a continuum
ability scale. Second, the cut scores defining the performance level boundaries are calculated. Next,
content experts were invited to review the items that are located within each performance level in each
domain to provide a description of what respondents within each level could do (Beaton and Allen, 1992).
Once the review is completed, the description of the performance levels is used to help the general public
understand which skills respondents have if their scaled scores fall within each level. Due to the small
number of items in each domain of LAMP (Prose 24 items, Document 29 items, Numeracy 24 items),
LAMP’s performance levels are limited to three.
Prose Performance Level descriptions
The three performance levels in the Prose domain are described as follows:
- Level 1: Typical respondents can identify literal, concrete information in reading-to-do passages
(e.g. job vacancy notices, product labels, vaccination information) or simple one-paragraph
passages, given certain conditions: i) identical language is used in the passage and the question; ii)
only everyday colloquial vocabulary is required; and iii) distractors are absent. These respondents
can produce answers that require minimal action (e.g. circling, underlining, copying a short
fragment of text).
Since this is the lowest level, respondents with no Prose skills are also included in this category.
- Level 2: Typical respondents can identify literal information in reading-to-do or reading-to-learn
passages, provided that the required information appears: i) in reading-to-do passages, in a brief
and clearly marked section; or ii) in reading-to-learn passages, near the beginning of the text. In
addition, distractors are absent; the language of the passage and the question are not identical.
Respondents can paraphrase, understand more ‘academic’ language and write answers that
require full sentences.
- Level 3: Typical respondents can identify literal information in longer reading-to-learn texts (one to
ten paragraphs), even in those with challenging features, such as: i) potential distractors; ii)
linguistically dense passages; or iii) required information that appears not at the beginning but in
the middle or towards the end of the text. The language of the passage and the question are not
identical. Respondents can paraphrase, understand more ‘academic’ language and write answers
that require full sentences.
Document Performance Level descriptions
The three performance levels in the Document domain are defined as follows:
- Level 1: Typical respondents can identify a single piece of information in simple reading-to-do or
reading-to-learn texts (passages, graphs or tables), given certain conditions: i) mostly identical
language is used in the passage and the question; ii) only one or two variables are included; and iii)
there is little to distract them (although potential distractors are always present).

167
LAMP: Implementation in Diverse Settings
Since this is the lowest level, respondents with no Document skills are also included in this category.
- Level 2: Typical respondents can handle reading-to-learn graphs or tables that include two or three
variables with descriptive labels. They can compare or contrast numerical information or process,
coordinate and match parallel information (e.g. time and activity data in one table). They can do
this even when several distractors are present. However, the language of the passage and the
questions are usually identical.
- Level 3: Typical respondents can handle complex texts and integrate information from complex
sources, densely packed tables or multiple graphs. They can fill out a complex form by turning
personal data into categorical variables or integrate information from dense documents and/or
multiple graphs in order to identify numerical values, given a set criterion. They can do this even if
several distractors are present, the language of the passage and the questions differs, or some of
the language is ‘academic’ (e.g. values, rates).
Numeracy Performance Level descriptions
The three performance levels in the Numeracy domain are defined as follows:
- Level 1: Typical respondents perform well in familiar contexts and when the quantitative
information provided is easily accessible (minimal text and the use of visual representations). The
question must be explicit and ask for a one-step, simple operation. They can easily add three whole
numbers with two and three digits or with decimal numbers in the context of using money. They
can subtract two whole or decimal numbers in the context of using money. No distracting
information is present.
Since this is the lowest level, respondents with no Numeracy skills are also included in this category.
- Level 2: Typical respondents perform well in familiar contexts at tasks where the quantitative
information involves some fractional and decimal numbers. They are able to understand and use
some simple fractions such as one-half (½) written in numerical form or in words. They have a
certain understanding of the meaning of decimal numbers. They can perform multiplications using
a decimal number and a whole number.
- Level 3: Typical respondents can perform complex tasks involving more than one different visual
representation, provided the question is explicit, even when additional (potentially distracting)
information is present. They can perform multiple-step operations: multiply (although maybe by
repeated addition) and then use this answer to find the quotient of a division (although maybe by
repeated subtraction); subtract a percentage from an initial value; find a proportion such as the
price of an item using more than one operation in a money context (sometimes with decimals);
find the sum of three monetary addends (sometimes with decimals) after computing two of them
through multiplication by 10 or 2. They understand measurement units in either the metric or
imperial systems (e.g. pounds) and can read time on a clock or in numeric form. They can interpret
useful qualitative or quantitative information presented in a table or on supermarket tags
containing percentages, decimals and whole numbers, and representing money and weight.

168
LAMP: Implementation in Diverse Settings
Annex 3. Jordan: Summary of sample sizes, means, standard deviations and standard errors of means
LAMP Prose Reading Scaled
Scores
LAMP Document Reading
Scaled Scores
LAMP Numeracy Scaled
Scores
Variable n Mean SD SE Mean SD SE Mean SD SE
Gender (Total) 2,492 983 126 3.220 999 132 3.374 996 106 3.062
----Male 898 993 115 3.935 1,016 125 4.365 1,026 105 4.488
----Female 1,594 974 140 4.267 983 141 4.598 970 103 4.073
Age (Total) 2,492 983 126 3.220 999 132 3.374 996 106 3.062
----15-24 579 1,006 83 4.405 1,030 89 4.698 1,001 85 4.592
----25-39 944 1,004 96 3.575 1,019 110 4.477 1,015 102 4.517
----40-64 714 954 152 7.109 966 154 7.777 982 137 7.519
----65+ 255 805 210 16.704 807 200 16.649 866 171 13.540
Location (Total) 2,492 983 126 3.220 999 132 3.374 996 106 3.062
----Urban 1,870 987 123 3.339 1,004 124 3.597 1,004 106 3.349
----Rural 622 958 147 8.173 976 155 8.647 962 108 6.302
Mother tongue (Total) 2,492 983 127 3.066 999 134 3.554 997 107 3.259
----MT is language of assessment only 2,458 984 125 2.954 1,000 132 3.209 998 106 2.984
----MT is other than assessment language only 6 1,024 92 82.163 1,024 92 82.163 1,024 92 82.163
----MT is language of assessment and other 8 1,036 57 27.981 1,059 71 30.392 1,027 76 31.944
SES (Total) 2,492 983 126 3.220 999 132 3.374 996 106 3.062
----High SES 352 1,026 84 5.528 1,045 107 7.382 1,057 91 5.836
----Medium high SES 559 1,003 102 5.182 1,027 117 6.055 1,018 97 5.863
----Medium low SES 593 937 171 8.201 945 177 8.635 956 133 6.992
----Low SES 988 965 131 4.365 978 128 4.391 970 91 3.638
Respondent's literate practices (Total) 2,492 982 127 3.288 998 134 3.663 996 107 3.264
----Broadcast media consumers 508 759 191 13.585 777 195 12.995 823 142 9.487
----Mobile phone users 1,334 998 82 3.132 1,008 85 2.869 993 91 3.240
----Computer users 638 1,038 46 2.970 1,062 77 4.314 1,050 83 4.596
Respondent's literate environment at community level (Total) 2,492 983 126 3.220 999 132 3.374 996 106 3.062
----High density 1,534 990 119 4.294 1,007 126 4.616 1,009 107 3.996
----Low density 958 966 142 4.860 983 144 4.727 970 108 4.469

169
LAMP: Implementation in Diverse Settings
Employment status (Total) 2,492 982 126 2.955 998 133 3.067 996 107 3.102
----Employed in a high-skill job 337 1,015 95 6.027 1,040 104 6.036 1,046 95 6.452
----Employed in a low-skill job 2,132 975 133 3.920 989 138 3.986 985 107 3.219
----Not working 16 1,018 117 33.055 1,030 72 24.373 1,006 50 17.574
Literacy self-report - reading (Total) 2,492 983 127 3.043 998 133 3.378 996 107 3.005
----Easily 2,118 1,011 75 2.270 1,028 84 2.752 1,015 89 2.858
----Difficulty or Not at all 357 639 103 10.162 654 108 9.527 697 87 7.031
Literacy self-report - computation (Total) 2,492 983 127 3.096 999 134 3.545 997 107 3.130
----Easily 2,071 1,011 78 2.308 1,028 86 2.655 1,016 90 2.749
----Difficulty or Not at all 413 740 186 14.972 754 189 14.747 795 132 11.365
Educational attainment (Total) 2,492 982 126 3.505 998 133 3.607 996 107 3.313
----Primary (ISCED 1) or less 823 865 183 8.144 884 186 7.870 899 133 6.381
----Secondary (ISCED 2 or 3) 1,074 1,015 57 2.489 1,023 72 3.314 1,004 78 3.366
----Post-secondary (ISCED 4 to 6) 577 1,043 47 3.073 1,066 78 4.710 1,064 87 5.081

170
LAMP: Implementation in Diverse Settings
Annex 4. Mongolia: Summary of sample sizes, means, standard deviations and standard errors of means
LAMP Prose Reading
Scaled Scores
LAMP Document Reading
Scaled Scores
LAMP Numeracy
Scaled Scores
Variable n Mean SD SE Mean SD SE Mean SD SE
Gender (Total) 4,000 994 99 2.492 995 93 2.482 1,017 93 2.110
----Male 1,701 986 100 3.691 993 91 3.325 1,018 93 3.184
----Female 2,299 1,001 98 2.722 998 94 2.511 1,017 91 2.594
Age (Total) 4,000 994 99 2.492 995 93 2.482 1,017 93 2.110
----15-24 788 1,008 81 4.004 1,014 80 3.762 1,019 83 3.461
----25-39 1,516 1,000 103 4.529 999 87 3.311 1,027 92 3.501
----40-64 1,419 987 96 3.355 987 93 3.531 1,011 103 3.675
----65+ 277 923 130 10.401 936 106 8.363 950 130 11.576
Location (Total) 4,000 994 99 2.492 995 93 2.482 1,017 93 2.110
----Urban 1,926 1,013 90 2.872 1,012 84 2.586 1,035 85 2.544
----Rural 2,074 957 108 3.467 959 102 3.350 983 97 3.203
Mother tongue (Total) 4,000 994 99 2.253 995 92 2.142 1,017 93 2.084
----MT is language of assessment only 3,752 991 99 2.416 991 92 2.273 1,015 93 2.114
----MT is other than assessment language only 2 971 50 85.569 990 3 5.999 998 38 65.200
----MT is language of assessment and other 211 1,049 72 7.607 1,052 76 7.471 1,060 66 7.566
SES (Total) 4,000 994 99 2.492 995 93 2.482 1,017 93 2.110
----High SES 733 1,046 73 3.536 1,050 79 3.981 1,071 74 3.407
----Medium high SES 1,213 1,000 84 4.456 996 75 3.817 1,020 82 3.943
----Medium low SES 995 990 89 4.806 993 86 4.861 1,016 84 4.434
----Low SES 1,059 920 116 5.645 928 101 5.015 948 93 4.222
Respondent's literate practices (Total) 4,000 994 99 2.725 995 93 2.502 1,017 92 2.225
----Broadcast media consumers 1,510 933 113 3.897 937 100 3.593 962 95 3.237
----Mobile phone users 1,497 998 71 2.888 1,000 71 3.253 1,021 79 3.215
----Computer users 991 1,049 71 3.738 1,045 70 3.425 1,067 75 3.286
Respondent's literate environment at community level 4,000 993 98 3.341 994 92 3.178 1,017 92 2.813
----High density 1,780 1,010 99 3.936 1,010 88 3.384 1,029 88 3.253
----Low density 1,930 974 103 4.052 977 95 4.139 1,003 97 4.003
Employment status (Total) 4,000 994 99 2.401 995 93 2.342 1,017 93 2.140
----Employed in a high-skill job 875 1,043 70 3.430 1,041 72 3.833 1,069 72 3.504
----Employed in a low-skill job 883 971 103 5.560 973 88 4.876 1,000 96 4.709
----Not working 2,239 982 101 3.149 985 94 2.842 1,003 90 2.678

171
LAMP: Implementation in Diverse Settings
Literacy self-report - reading (Total) 4,000 994 98 2.304 995 92 2.053 1,017 92 1.914
----Easily 3,870 1,002 88 2.096 1,002 83 1.899 1,024 87 2.017
----Difficulty or Not at all 125 731 143 21.212 763 135 17.582 799 106 15.524
Literacy self-report - computation (Total) 4,000 994 97 2.566 995 92 2.278 1,017 91 2.156
----Easily 3,353 1,007 85 2.295 1,005 80 2.102 1,028 85 2.199
----Difficulty or Not at all 641 922 136 8.001 937 133 7.546 958 111 6.638
Educational attainment (Total) 4,000 993 99 2.577 995 93 2.460 1,017 91 2.153
----Primary (ISCED 1) or less 432 846 143 9.828 858 135 9.740 886 117 7.890
----Secondary (ISCED 2 or 3) 2,050 987 77 2.555 988 69 2.424 1,009 78 2.636
----Post-secondary (ISCED 4 to 6) 1,517 1,039 72 2.954 1,036 74 2.983 1,060 76 2.652

172
LAMP: Implementation in Diverse Settings
Annex 5. Palestine: Summary of sample sizes, means, standard deviations and standard errors of means
LAMP Prose Reading
Scaled Scores
LAMP Document Reading
Scaled Scores
LAMP Numeracy
Scaled Scores
Variable n Mean SD SE Mean SD SE Mean SD SE
Gender (Total) 3,585 992 153 5.344 985 143 4.919 968 106 3.613
----Male 1,681 1,000 147 5.095 997 140 4.777 995 107 3.518
----Female 1,904 986 159 7.311 973 144 6.450 943 101 4.247
Age (Total) 3,585 992 155 5.720 985 144 5.142 968 107 3.711
----15-24 1,031 1,016 112 6.253 1,020 108 6.605 976 82 4.445
----25-39 1,284 1,018 127 5.371 1,001 117 5.248 978 95 4.235
----40-64 928 965 180 9.634 955 158 8.311 964 132 6.902
----65+ 339 769 215 16.503 769 197 15.124 786 190 13.483
Location (Total) 3,585 992 153 0.028 985 143 4.919 968 106 0.019
----Urban 2,309 995 150 0.035 988 142 6.418 971 105 0.023
----Rural 1,276 981 161 0.050 977 146 8.007 961 112 0.042
Mother tongue (Total) 3,585 992 154 5.388 985 143 5.000 968 107 3.655
----MT is language of assessment only 3,093 980 157 5.654 974 146 5.338 960 108 3.941
----MT is other than assessment language only 3 1,099 99 130.830 1,339 197 220.030 1,065 50 69.059
----MT is language of assessment and other 482 1,071 91 7.721 1,059 93 9.989 1,025 82 7.846
Socio-economic status (Total) 3,585 992 153 5.344 985 143 4.919 968 106 3.613
----High SES 744 1,046 104 5.084 1,036 102 5.989 1,011 88 4.721
----Medium high SES 1,105 1,023 129 6.295 1,018 121 6.291 996 90 4.104
----Medium low SES 1,051 953 169 9.724 943 148 8.199 932 101 6.125
----Low SES 685 891 201 12.370 888 184 11.805 896 133 7.890
Literacy practices (Total) 3,585 992 154 5.514 985 142 4.986 968 107 3.650
----Broadcast media consumers 618 722 187 11.817 724 156 9.815 749 132 8.791
----Mobile phone users 1,748 1,005 110 4.941 993 95 4.175 965 89 3.490
----Computer users 1,215 1,060 85 4.833 1,055 90 5.043 1,021 80 4.568
Literate environment at community level (Total) 3,585 992 153 5.344 985 143 4.919 968 106 3.613
----High density 1,278 1,000 148 8.563 994 138 7.997 973 122 7.163
----Low density 2,307 988 155 7.538 980 144 6.580 964 103 4.477
Employment (Total) 3,585 992 153 5.344 985 143 4.919 968 106 3.613
----Employed in a high-skill job 594 1,053 102 6.389 1,045 102 6.091 1,040 95 6.151
----Employed in a low-skill job 411 985 155 10.860 971 137 10.420 969 111 10.610
----Not working 2,580 979 158 5.582 972 147 5.226 949 102 3.508

173
LAMP: Implementation in Diverse Settings
Literacy self-report - reading (Total) 3,585 992 155 5.720 985 144 5.142 968 107 3.711
----Can read easily 2,986 1,034 94 3.144 1,023 92 3.161 992 87 2.993
----Read with difficulty or not at all 596 661 120 8.720 680 116 8.873 697 93 7.026
Literacy self-report - computation (Total) 3,585 992 153 5.344 985 143 4.919 968 106 3.613
----Can compute easily 2,791 1,031 103 3.756 1,023 100 3.318 995 90 3.225
----Compute with difficulty or not at all 794 833 212 15.797 831 186 13.632 843 113 7.683
Educational attainment (Total) 3,585 992 153 5.512 985 142 5.122 968 107 3.728
----Primary (ISCED 1) or less 398 642 109 8.260 664 116 10.083 715 81 7.292
----Secondary (ISCED 2 or 3) 2,348 994 126 4.507 985 114 3.868 960 91 2.942
----Post-secondary (ISCED 4 to 6) 837 1,079 84 3.784 1,072 86 3.999 1,044 81 4.501

174
LAMP: Implementation in Diverse Settings
Annex 6. Paraguay: Summary of sample sizes, means, standard deviations and standard errors of means
LAMP Prose Reading
Scaled Scores
LAMP Document Reading
Scaled Scores
LAMP Numeracy
Scaled Scores
Variable n Mean SD SE Mean SD SE Mean SD SE
Gender (Total) 3,966 970 135 7.752 977 119 7.307 998 106 6.667
----Male 1,636 964 136 8.990 985 125 8.109 1,014 110 7.230
----Female 2,330 979 131 7.282 972 114 6.868 984 103 6.967
Age (Total) 3,966 970 135 7.752 977 119 7.307 998 106 6.667
----15-24 1,052 995 96 7.606 998 90 7.069 1,003 89 5.860
----25-39 1,244 1,000 113 9.727 1,005 105 9.812 1,017 102 9.898
----40-64 1,247 940 157 11.105 950 131 9.021 986 118 7.929
----65+ 423 877 179 16.292 891 171 14.869 935 139 12.428
Location (Total) 3,966 970 135 7.752 977 119 7.307 998 106 6.667
----Urban 2,090 1,004 114 11.301 1,011 109 10.816 1,026 97 9.702
----Rural 1,876 925 146 7.116 932 122 5.295 959 105 7.115
Mother tongue (Total) 3,966 970 134 7.471 978 119 6.818 997 107 6.719
----MT is language of assessment only 908 1,026 77 8.376 1,035 87 8.842 1,041 94 8.061
----MT is other than assessment language only 1,720 925 151 9.047 932 131 6.711 962 116 7.157
----MT is language of assessment and other 1,332 1,004 106 9.563 1,009 96 10.809 1,019 89 9.364
Socio-economic status (Total) 3,966 970 135 7.752 977 119 7.307 998 106 6.667
----High SES 1,127 1,045 78 6.103 1,060 90 9.115 1,071 86 6.395
----Medium high SES 371 970 125 15.448 970 109 14.564 995 87 10.403
----Medium low SES 1,332 980 113 8.946 985 93 5.273 998 90 5.194
----Low SES 1,136 891 156 12.858 898 128 7.858 929 112 8.638
Literacy practices (Total) 3,966 971 135 7.285 978 120 6.755 998 107 6.586
----Broadcast media consumers 1,013 818 162 12.937 842 148 10.014 882 110 7.958
----Mobile phone users 1,758 990 81 6.042 985 66 4.400 1,003 81 5.923
----Computer users 1,194 1,051 82 5.839 1,061 88 8.565 1,069 86 6.350
Literate environment at community level (Total) 3,966 971 135 7.970 978 120 7.161 998 108 6.580
----High density 2,138 1,008 114 6.525 1,015 108 8.429 1,031 97 7.792
----Low density 1,810 931 141 9.035 938 117 5.508 962 102 6.272

175
LAMP: Implementation in Diverse Settings
Employment (Total) 3,966 970 133 7.688 978 118 6.977 997 106 6.636
----Employed in a high-skill job 1,153 1,029 101 9.616 1,039 98 9.318 1,059 85 6.812
----Employed in a low-skill job 1,137 921 141 11.193 940 119 6.690 964 111 7.010
----Not working 1,669 969 132 7.392 965 118 7.338 979 101 7.324
Literacy self-report - reading (Total) 3,966 970 134 7.471 978 119 6.818 997 107 6.719
----Can read easily 3,369 1,005 94 5.086 1,007 85 5.433 1,020 90 5.270
----Read with difficulty or not at all 591 734 158 11.444 770 148 9.615 818 111 9.066
Literacy self-report - computation (Total) 3,966 971 135 7.285 978 120 6.755 998 107 6.586
----Can compute easily 3,277 1,000 100 6.122 1,005 88 5.682 1,019 91 5.685
----Compute with difficulty or not at all 688 793 176 11.154 812 167 11.888 855 117 9.038
Educational attainment (Total) 3,966 970 133 7.688 978 118 6.977 997 106 6.636
----Primary (ISCED 1) or less 1,612 865 151 10.779 882 129 6.824 917 105 7.398
----Secondary (ISCED 2 or 3) 1,540 1,014 67 3.136 1,008 62 3.532 1,021 80 5.936
----Post-secondary (ISCED 4 to 6) 807 1,062 74 5.717 1,075 83 7.804 1,081 70 4.071

176
LAMP: Implementation in Diverse Settings
Annex 7. Jordan: Percentage of respondents at each LAMP Prose Reading level for various demographic categories
Socio-Demographic Variable n Level 1 Level 2 Level 3
At or
above
cut 1
Gender (Total) 2,492 19.8 49.0 31.2 80.2
----Male 898 18.9 47.8 33.4 81.1
----Female 1,594 21.1 48.0 30.8 78.9
Age (Total) 2,492 19.8 49.0 31.2 80.2
----15-24 579 12.5 60.2 27.2 87.5
----25-39 944 12.4 53.6 34.0 87.6
----40-64 714 28.7 41.2 30.0 71.3
----65+ 255 67.8 10.7 21.5 32.2
Location (Total) 2,492 19.8 49.0 31.2 80.2
----Urban 1,870 19.8 44.0 36.2 80.2
----Rural 622 22.8 61.1 16.1 77.2
Mother tongue (Total) 2,492 18.8 49.1 32.1 81.2
----MT is language of assessment only 2,458 19.7 47.9 32.3 80.3
----MT is other than assessment language only 6 32.4 32.5 35.0 67.6
----MT is language of assessment and other 8 27.0 5.7 67.3 73.0
SES (Total) 2,492 19.8 49.0 31.2 80.2
----High SES 352 14.4 33.1 52.5 85.6
----Medium high SES 559 13.6 50.2 36.2 86.4
----Medium low SES 593 31.5 40.7 27.9 68.5
----Low SES 988 21.0 65.7 13.4 79.0
Respondent's literate practices (Total) 2,492 19.6 49.7 30.8 80.4
----Broadcast media consumers 508 68.7 30.7 0.6 31.3
----Mobile phone users 1,334 19.3 59.6 21.1 80.7
----Computer users 638 5.7 50.3 44.0 94.3
Respondent's literate environment at community level (Total) 2,492 19.8 49.0 31.2 80.2
----High density 1,534 20.2 43.3 36.5 79.8
----Low density 958 19.0 57.7 23.3 81.0
Employment status (Total) 2,492 19.4 48.9 31.7 80.6
----Employed in a high-skill job 337 7.8 47.1 45.1 92.2
----Employed in a low-skill job 2,132 22.3 49.5 28.2 77.7
----Not working 16 10.7 82.4 6.9 89.3

177
LAMP: Implementation in Diverse Settings
Literacy self-report - reading (Total) 2,492 19.5 48.2 32.3 80.5
----Easily 2,118 14.1 53.0 32.9 85.9
----Difficulty or Not at all 357 97.0 3.0 0.0 3.0
Literacy self-report - computation (Total) 2,492 19.6 48.6 31.8 80.4
----Easily 2,071 14.0 51.1 34.9 86.0
----Difficulty or Not at all 413 72.4 27.6 0.0 27.6
Educational attainment (Total) 2,492 19.2 49.6 31.2 80.8
----Primary (ISCED 1) or less 823 55.5 44.2 0.3 44.5
----Secondary (ISCED 2 or 3) 1,074 12.3 58.6 29.0 87.7
----Post-secondary (ISCED 4 to 6) 577 3.4 46.2 50.3 96.6

178
LAMP: Implementation in Diverse Settings
Annex 8. Jordan: Percentage of respondents at each LAMP Document Reading level for various demographic
categories
Socio-Demographic Variable
n Level 1 Level 2 Level 3
At and above
cut 1
Gender (Total) 2,492 15.4 46.7 37.9 84.6
----Male 898 10.6 43.2 46.2 89.4
----Female 1,594 19.9 47.6 32.5 80.1
Age (Total) 2,492 15.4 46.7 37.9 84.6
----15-24 579 7.8 52.7 39.5 92.2
----25-39 944 12.2 50.6 37.2 87.8
----40-64 714 22.1 41.5 36.4 77.9
----65+ 255 55.7 35.1 9.3 44.3
Location (Total) 2,492 15.4 46.7 37.9 84.6
----Urban 1,870 15.9 44.0 40.1 84.1
----Rural 622 19.2 51.9 29.0 80.8
Mother tongue (Total) 2,492 15.2 46.5 38.2 84.8
----MT is language of assessment only 2,458 15.2 45.0 39.8 84.8
----MT is other than assessment language only 6 30.5 34.5 35.0 69.5
----MT is language of assessment and other 8 19.0 19.8 61.2 81.0
SES (Total) 2,492 15.4 46.7 37.9 84.6
----High SES 352 7.9 39.1 53.0 92.1
----Medium high SES 559 9.4 46.5 44.1 90.6
----Medium low SES 593 29.7 50.7 19.6 70.3
----Low SES 988 18.4 50.1 31.4 81.6
Respondent's literate practices (Total) 2,492 15.3 47.3 37.3 84.7
----Broadcast media consumers 508 63.7 32.2 4.1 36.3
----Mobile phone users 1,334 12.5 60.8 26.8 87.5
----Computer users 638 4.7 34.8 60.5 95.3
Respondent's literate environment at community level (Total) 2,492 15.4 46.7 37.9 84.6
----High density 1,534 15.3 45.0 39.7 84.7
----Low density 958 15.2 51.1 33.6 84.8
Employment status (Total) 2,492 15.2 47.2 37.6 84.8
----Employed in a high-skill job 337 7.5 39.1 53.4 92.5
----Employed in a low-skill job 2,132 17.6 47.4 35.0 82.4
----Not working 16 14.5 31.9 53.7 85.5

179
LAMP: Implementation in Diverse Settings
Literacy self-report - reading (Total) 2,492 15.3 46.7 37.9 84.7
----Easily 2,118 9.4 51.6 39.0 90.6
----Difficulty or Not at all 357 92.6 7.4 0.0 7.4
Literacy self-report - computation (Total) 2,492 15.3 46.8 37.9 84.7
----Easily 2,071 9.3 51.1 39.6 90.7
----Difficulty or Not at all 413 73.6 23.7 2.7 26.4
Educational attainment (Total) 2,492 15.3 46.9 37.8 84.7
----Primary (ISCED 1) or less 823 39.2 49.9 10.9 60.8
----Secondary (ISCED 2 or 3) 1,074 11.1 56.0 32.9 88.9
----Post-secondary (ISCED 4 to 6) 577 2.9 37.4 59.7 97.1

180
LAMP: Implementation in Diverse Settings
Annex 9. Jordan: Percentage of respondents at each LAMP Numeracy level for various demographic categories
Socio-Demographic Variable
n Level 1 Level 2 Level 3
At or above
cut 1
Gender (Total) 2,492 25.4 44.6 30.0 74.6
----Male 898 17.2 43.8 39.0 82.8
----Female 1,594 34.1 45.4 20.5 65.9
Age (Total) 2,492 25.4 44.6 30.0 74.6
----15-24 579 26.5 44.9 28.7 73.5
----25-39 944 20.9 50.0 29.2 79.1
----40-64 714 29.2 37.4 33.5 70.8
----65+ 255 52.9 25.3 21.8 47.1
Location (Total) 2,492 25.4 44.6 30.0 74.6
----Urban 1,870 23.2 44.2 32.6 76.8
----Rural 622 34.6 48.5 16.8 65.4
Mother tongue (Total) 2,492 25.5 44.1 30.4 74.5
----MT is language of assessment only 2,458 25.4 44.4 30.2 74.6
----MT is other than assessment language only 6 20.6 44.4 35.0 79.4
----MT is language of assessment and other 8 9.4 41.8 48.9 90.6
SES (Total) 2,492 25.4 44.6 30.0 74.6
----High SES 352 11.1 33.0 55.9 88.9
----Medium high SES 559 18.7 46.8 34.5 81.3
----Medium low SES 593 31.7 41.6 26.7 68.3
----Low SES 988 35.2 48.0 16.7 64.8
Respondent's literate practices (Total) 2,492 25.7 44.6 29.7 74.3
----Broadcast media consumers 508 66.4 22.9 10.7 33.6
----Mobile phone users 1,334 29.2 47.7 23.1 70.8
----Computer users 638 10.8 40.9 48.4 89.2
Respondent's literate environment at community level (Total) 2,492 25.4 44.6 30.0 74.6
----High density 1,534 22.2 42.3 35.5 77.8
----Low density 958 34.5 47.6 18.0 65.5
Employment status (Total) 2,492 25.4 45.1 29.5 74.6
----Employed in a high-skill job 337 13.2 42.2 44.5 86.8
----Employed in a low-skill job 2,132 28.3 45.2 26.5 71.7
----Not working 16 0.0 62.4 37.6 100.0

181
LAMP: Implementation in Diverse Settings
Literacy self-report - reading (Total) 2,492 25.3 45.5 29.2 74.7
----Easily 2,118 19.7 47.9 32.4 80.3
----Difficulty or Not at all 357 96.4 2.7 0.9 3.6
Literacy self-report - computation (Total) 2,492 25.5 44.1 30.4 74.5
----Easily 2,071 19.9 46.5 33.6 80.1
----Difficulty or Not at all 413 79.7 14.9 5.4 20.3
Educational attainment (Total) 2,492 25.9 44.6 29.5 74.1
----Primary (ISCED 1) or less 823 54.9 35.9 9.1 45.1
----Secondary (ISCED 2 or 3) 1,074 23.4 50.4 26.1 76.6
----Post-secondary (ISCED 4 to 6) 577 5.3 40.7 54.0 94.7

182
LAMP: Implementation in Diverse Settings
Annex 10. Mongolia: Percentage of respondents at each LAMP Prose Reading level for various demographic
categories
Socio-Demographic Variable n Level 1 Level 2 Level 3
At or above
cut 1
Gender (Total) 4,000 26.3 48.1 25.6 73.7
----Male 1,701 29.7 46.7 23.7 70.3
----Female 2,299 24.5 45.9 29.7 75.5
Age (Total) 4,000 26.3 48.1 25.6 73.7
----15-24 788 20.8 55.1 24.2 79.2
----25-39 1,516 25.6 48.5 25.8 74.4
----40-64 1,419 29.7 41.7 28.6 70.3
----65+ 277 47.7 36.3 16.0 52.3
Location 4,000 26.3 48.1 25.6 73.7
----Urban 1,926 22.2 43.0 34.8 77.8
----Rural 2,074 38.0 50.9 11.1 62.0
Mother tongue (Total) 4,000 26.9 47.3 25.8 73.1
----MT is language of assessment only 3,752 27.8 47.1 25.1 72.2
----MT is other than assessment language only 2 33.2 56.6 10.3 66.8
----MT is language of assessment and other 211 9.1 46.1 44.9 90.9
SES (Total) 4,000 26.3 48.1 25.6 73.7
----High SES 733 7.4 42.6 50.0 92.6
----Medium high SES 1,213 24.8 54.1 21.0 75.2
----Medium low SES 995 28.7 48.1 23.2 71.3
----Low SES 1,059 53.9 40.5 5.6 46.1
Respondent's literate practices (Total) 4,000 26.3 47.8 26.0 73.7
----Broadcast media consumers 1,510 49.4 39.6 11.0 50.6
----Mobile phone users 1,497 24.9 53.7 21.4 75.1
----Computer users 991 7.0 47.7 45.2 93.0
Respondent's literate environment at community level (Total) 4,000 26.8 47.3 25.9 73.2
----High density 1,780 24.4 42.6 33.0 75.6
----Low density 1,930 29.5 53.6 16.9 70.5
Employment status (Total) 4,000 26.8 47.5 25.7 73.2
----Employed in a high-skill job 875 8.6 47.2 44.3 91.4
----Employed in a low-skill job 883 35.1 44.8 20.1 64.9
----Not working 2,239 31.6 48.2 20.2 68.4
Literacy self-report - reading (Total) 4,000 26.5 47.7 25.8 73.5
----Easily 3,870 24.2 48.8 26.9 75.8
----Difficulty or Not at all 125 94.1 5.4 0.5 5.9

183
LAMP: Implementation in Diverse Settings
Socio-Demographic Variable n Level 1 Level 2 Level 3
At or above
cut 1
Literacy self-report - computation (Total) 4,000 26.8 47.7 25.5 73.2
----Easily 3,353 21.4 50.2 28.3 78.6
----Difficulty or Not at all 641 55.0 36.3 8.7 45.0
Educational attainment (Total) 4,000 26.1 48.1 25.7 73.9
----Primary (ISCED 1) or less 432 80.9 19.1 0.0 19.1
----Secondary (ISCED 2 or 3) 2,050 26.3 54.9 18.8 73.7
----Post-secondary (ISCED 4 to 6) 1,517 12.3 44.1 43.6 87.7

184
LAMP: Implementation in Diverse Settings
Annex 11. Mongolia: Percentage of respondents at each LAMP Document Reading level for various demographic
categories
Socio-Demographic Variable n Level 1 Level 2 Level 3
At or above
cut 1
Gender (Total) 4,000 25.5 51.0 23.5 74.5
----Male 1,701 27.5 49.4 23.1 72.5
----Female 2,299 24.6 50.4 25.1 75.4
Age (Total) 4,000 25.5 51.0 23.5 74.5
----15-24 788 18.7 49.1 32.2 81.3
----25-39 1,516 25.2 49.9 24.9 74.8
----40-64 1,419 28.8 51.4 19.9 71.2
----65+ 277 46.6 35.0 18.5 53.4
Location (Total) 4,000 25.5 51.0 23.5 74.5
----Urban 1,926 19.7 49.4 30.9 80.3
----Rural 2,074 38.7 48.9 12.4 61.3
Mother tongue (Total) 4,000 25.8 50.8 23.4 74.2
----MT is language of assessment only 3,752 26.2 51.9 21.9 73.8
----MT is other than assessment language only 2 0.0 100.0 0.0 100.0
----MT is language of assessment and other 211 10.2 40.4 49.5 89.8
SES (Total) 4,000 25.5 51.0 23.5 74.5
----High SES 733 7.7 43.6 48.6 92.3
----Medium high SES 1,213 23.4 52.5 24.1 76.6
----Medium low SES 995 24.3 56.2 19.4 75.7
----Low SES 1,059 53.7 42.7 3.6 46.3
Respondent's literate practices (Total) 4,000 25.3 51.3 23.4 74.7
----Broadcast media consumers 1,510 48.6 45.6 5.8 51.4
----Mobile phone users 1,497 22.4 57.1 20.4 77.6
----Computer users 991 7.6 44.4 48.0 92.4
Respondent's literate environment at community level (Total) 4,000 26.0 50.5 23.5 74.0
----High density 1,780 21.3 47.6 31.1 78.7
----Low density 1,930 31.6 53.0 15.5 68.4
Employment status (Total) 4,000 25.6 50.9 23.5 74.4
----Employed in a high-skill job 875 7.6 47.6 44.8 92.4
----Employed in a low-skill job 883 37.0 49.1 13.9 63.0
----Not working 2,239 27.6 52.5 19.9 72.4
Literacy self-report - reading (Total) 4,000 25.6 50.8 23.6 74.4
----Easily 3,870 22.9 51.7 25.4 77.1
----Difficulty or Not at all 125 97.8 2.2 0.0 2.2

185
LAMP: Implementation in Diverse Settings
Socio-Demographic Variable n Level 1 Level 2 Level 3
At or above
cut 1
Literacy self-report - computation (Total) 4,000 25.4 51.2 23.3 74.6
----Easily 3,353 21.1 53.2 25.7 78.9
----Difficulty or Not at all 641 49.2 34.1 16.7 50.8
Educational attainment (Total) 4,000 25.4 51.1 23.5 74.6
----Primary (ISCED 1) or less 432 75.1 24.0 0.8 24.9
----Secondary (ISCED 2 or 3) 2,050 26.8 56.3 16.9 73.2
----Post-secondary (ISCED 4 to 6) 1,517 11.2 45.9 42.9 88.8

186
LAMP: Implementation in Diverse Settings
Annex 12. Mongolia: Percentage of respondents at each LAMP Numeracy level for various demographic categories
Socio-Demographic Variable n Level 1 Level 2 Level 3
At or above
cut 1
Gender (Total) 4,000 17.1 45.0 37.9 82.9
----Male 1,701 16.9 45.8 37.3 83.1
----Female 2,299 17.4 43.3 39.3 82.6
Age (Total) 4,000 17.1 45.0 37.9 82.9
----15-24 788 17.0 43.9 39.1 83.0
----25-39 1,516 14.3 43.2 42.4 85.7
----40-64 1,419 20.3 44.5 35.1 79.7
----65+ 277 35.2 38.1 26.7 64.8
Location (Total) 4,000 17.1 45.0 37.9 82.9
----Urban 1,926 10.8 44.2 45.0 89.2
----Rural 2,074 29.2 47.7 23.1 70.8
Mother tongue (Total) 4,000 17.3 44.6 38.1 82.7
----MT is language of assessment only 3,752 17.6 45.9 36.5 82.4
----MT is other than assessment language only 2 0.0 86.3 13.7 100.0
----MT is language of assessment and other 211 2.9 41.0 56.1 97.1
SES (Total) 4,000 17.1 45.0 37.9 82.9
----High SES 733 1.8 35.2 62.9 98.2
----Medium high SES 1,213 14.2 50.3 35.5 85.8
----Medium low SES 995 17.7 44.0 38.3 82.3
----Low SES 1,059 41.9 46.5 11.7 58.1
Respondent's literate practices (Total) 4,000 17.1 44.7 38.2 82.9
----Broadcast media consumers 1,510 36.3 47.5 16.2 63.7
----Mobile phone users 1,497 12.9 52.1 35.0 87.1
----Computer users 991 3.9 34.4 61.7 96.1
Respondent's literate environment at community level (Total) 4,000 17.2 45.4 37.4 82.8
----High density 1,780 13.6 44.3 42.1 86.4
----Low density 1,930 22.5 45.7 31.9 77.5
Employment status (Total) 4,000 17.3 45.2 37.5 82.7
----Employed in a high-skill job 875 3.7 36.6 59.6 96.3
----Employed in a low-skill job 883 21.3 46.6 32.1 78.7
----Not working 2,239 22.0 46.8 31.2 78.0
Literacy self-report - reading (Total) 4,000 16.8 45.5 37.8 83.2
----Easily 3,870 15.1 45.0 39.9 84.9
----Difficulty or Not at all 125 82.6 15.8 1.6 17.4

187
LAMP: Implementation in Diverse Settings
Literacy self-report - computation (Total) 4,000 17.2 44.8 38.0 82.8
----Easily 3,353 13.2 46.7 40.1 86.8
----Difficulty or Not at all 641 40.1 35.7 24.3 59.9
Educational attainment (Total) 4,000 16.8 45.7 37.5 83.2
----Primary (ISCED 1) or less 432 64.7 33.0 2.3 35.3
----Secondary (ISCED 2 or 3) 2,050 17.1 53.2 29.7 82.9
----Post-secondary (ISCED 4 to 6) 1,517 5.8 38.6 55.6 94.2

188
LAMP: Implementation in Diverse Settings
Annex 13. Palestine: Percentage of respondents at each LAMP Prose Reading level for various demographic
categories
Socio-Demographic Variable n Level 1 Level 2 Level 3
At or above
cut 1
Gender (Total) 3,585 25.9 40.8 33.3 74.1
----Male 1,681 26.3 42.1 31.7 73.7
----Female 1,904 26.3 38.4 35.3 73.7
Age (Total) 3,585 26.2 40.6 33.2 73.8
----15-24 1,031 17.2 49.4 33.4 82.8
----25-39 1,284 18.5 43.9 37.6 81.5
----40-64 928 38.6 33.0 28.3 61.4
----65+ 339 73.3 13.1 13.7 26.7
Location (Total) 3,585 25.9 40.8 33.3 74.1
----Urban 2,309 23.0 42.9 34.0 77.0
----Rural 1,276 31.2 38.5 30.3 68.8
Mother tongue (Total) 3,585 26.2 40.7 33.0 73.8
----MT is language of assessment only 3,093 28.8 41.2 30.0 71.2
----MT is other than assessment language only 3 8.9 14.1 77.0 91.1
----MT is language of assessment and other 482 7.1 39.8 53.1 92.9
Socio-economic status (Total) 3,585 25.9 40.8 33.3 74.1
----High SES 744 11.5 40.8 47.7 88.5
----Medium high SES 1,105 19.3 43.0 37.7 80.7
----Medium low SES 1,051 35.5 38.8 25.6 64.5
----Low SES 685 50.9 35.6 13.5 49.1
Literacy practices (Total) 3,585 26.1 41.1 32.8 73.9
----Broadcast media consumers 618 82.2 9.5 8.3 17.8
----Mobile phone users 1,748 27.3 44.8 27.9 72.7
----Computer users 1,215 8.7 42.7 48.6 91.3
Literate environment at community level (Total) 3,585 25.9 40.8 33.3 74.1
----High density 1,278 19.2 42.9 37.9 80.8
----Low density 2,307 30.2 40.8 29.0 69.8
Employment (Total) 3,585 25.9 40.8 33.3 74.1
----Employed in a high-skill job 594 12.2 44.2 43.6 87.8
----Employed in a low-skill job 411 33.0 41.0 26.0 67.0
----Not working 2,580 28.1 40.1 31.8 71.9
Literacy self-report - reading (Total) 3,585 26.2 40.6 33.2 73.8
----Can read easily 2,986 16.6 47.3 36.1 83.4
----Read with difficulty or not at all 596 96.6 3.4 0.0 3.4

189
LAMP: Implementation in Diverse Settings
Socio-Demographic Variable n Level 1 Level 2 Level 3
At or above
cut 1
Literacy self-report - computation (Total) 3,585 25.9 40.8 33.3 74.1
----Can compute easily 2,791 16.8 46.1 37.1 83.2
----Compute with difficulty or not at all 794 61.7 25.2 13.1 38.3
Educational attainment (Total) 3,585 25.7 42.1 32.3 74.3
----Primary (ISCED 1) or less 398 96.0 3.3 0.7 4.0
----Secondary (ISCED 2 or 3) 2,348 27.5 45.2 27.4 72.5
----Post-secondary (ISCED 4 to 6) 837 2.6 40.4 57.1 97.4

190
LAMP: Implementation in Diverse Settings
Annex 14. Palestine: Percentage of respondents at each LAMP Document Reading level for various demographic
categories
Socio-Demographic Variable n Level 1 Level 2 Level 3
At or above
cut 1
Gender (Total) 3,585 35.3 35.4 29.3 64.7
----Male 1,681 30.6 38.1 31.3 69.4
----Female 1,904 38.8 33.6 27.6 61.2
Age (Total) 3,585 36.0 34.0 30.0 64.0
----15-24 1,031 21.6 42.7 35.7 78.4
----25-39 1,284 33.6 36.7 29.7 66.4
----40-64 928 48.0 24.0 27.9 52.0
----65+ 339 76.3 16.1 7.6 23.7
Location (Total) 3,585 35.3 35.4 29.3 64.7
----Urban 2,309 32.8 36.1 31.1 67.2
----Rural 1,276 40.6 32.8 26.6 59.4
Mother tongue (Total) 3,585 35.4 35.0 29.7 64.6
----MT is language of assessment only 3,093 39.3 32.5 28.2 60.7
----MT is other than assessment language only 3 0.0 14.3 85.7 100.0
----MT is language of assessment and other 482 8.7 44.1 47.2 91.3
Socio-economic status (Total) 3,585 35.3 35.4 29.3 64.7
----High SES 744 17.2 34.2 48.6 82.8
----Medium high SES 1,105 25.4 41.6 33.0 74.6
----Medium low SES 1,051 51.1 27.1 21.8 48.9
----Low SES 685 59.1 24.9 16.0 40.9
Literacy practices (Total) 3,585 35.3 35.2 29.4 64.7
----Broadcast media consumers 618 88.8 6.8 4.4 11.2
----Mobile phone users 1,748 35.6 38.8 25.6 64.4
----Computer users 1,215 10.2 41.4 48.4 89.8
Literate environment at community level (Total) 3,585 35.3 35.4 29.3 64.7
----High density 1,278 33.0 38.0 29.0 67.0
----Low density 2,307 36.5 34.4 29.0 63.5
Employment (Total) 3,585 35.3 35.4 29.3 64.7
----Employed in a high-skill job 594 14.5 38.5 47.0 85.5
----Employed in a low-skill job 411 39.9 41.7 18.5 60.1
----Not working 2,580 38.8 33.5 27.7 61.2
Literacy self-report - reading (Total) 3,585 36.0 34.0 30.0 64.0
----Can read easily 2,986 23.6 39.0 37.4 76.4
----Read with difficulty or not at all 596 96.3 3.7 0.0 3.7

191
LAMP: Implementation in Diverse Settings
Socio-Demographic Variable n Level 1 Level 2 Level 3
At or above
cut 1
Literacy self-report - computation (Total) 3,585 35.3 35.4 29.3 64.7
----Can compute easily 2,791 23.9 38.2 37.9 76.1
----Compute with difficulty or not at all 794 69.4 24.4 6.2 30.6
Educational attainment (Total) 3,585 35.4 35.5 29.1 64.6
----Primary (ISCED 1) or less 398 96.9 2.2 0.9 3.1
----Secondary (ISCED 2 or 3) 2,348 38.6 37.6 23.8 61.4
----Post-secondary (ISCED 4 to 6) 837 6.1 32.6 61.4 93.9
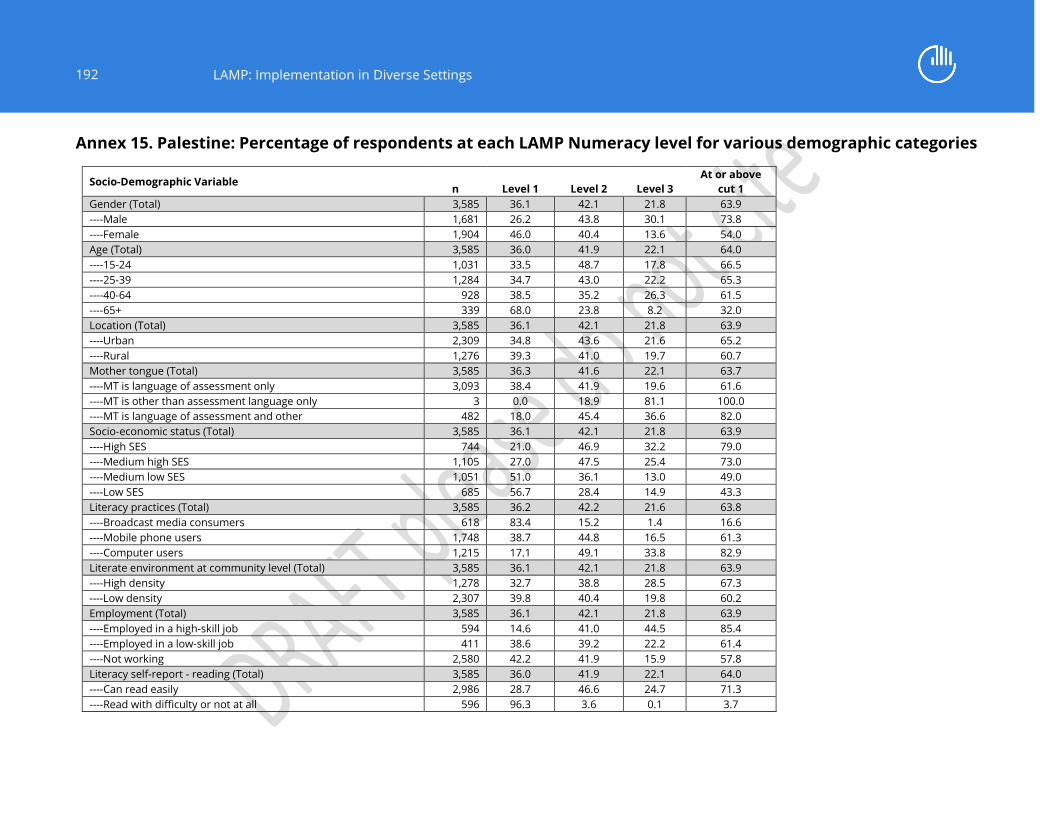
192
LAMP: Implementation in Diverse Settings
Annex 15. Palestine: Percentage of respondents at each LAMP Numeracy level for various demographic categories
Socio-Demographic Variable n Level 1 Level 2 Level 3
At or above
cut 1
Gender (Total) 3,585 36.1 42.1 21.8 63.9
----Male 1,681 26.2 43.8 30.1 73.8
----Female 1,904 46.0 40.4 13.6 54.0
Age (Total) 3,585 36.0 41.9 22.1 64.0
----15-24 1,031 33.5 48.7 17.8 66.5
----25-39 1,284 34.7 43.0 22.2 65.3
----40-64 928 38.5 35.2 26.3 61.5
----65+ 339 68.0 23.8 8.2 32.0
Location (Total) 3,585 36.1 42.1 21.8 63.9
----Urban 2,309 34.8 43.6 21.6 65.2
----Rural 1,276 39.3 41.0 19.7 60.7
Mother tongue (Total) 3,585 36.3 41.6 22.1 63.7
----MT is language of assessment only 3,093 38.4 41.9 19.6 61.6
----MT is other than assessment language only 3 0.0 18.9 81.1 100.0
----MT is language of assessment and other 482 18.0 45.4 36.6 82.0
Socio-economic status (Total) 3,585 36.1 42.1 21.8 63.9
----High SES 744 21.0 46.9 32.2 79.0
----Medium high SES 1,105 27.0 47.5 25.4 73.0
----Medium low SES 1,051 51.0 36.1 13.0 49.0
----Low SES 685 56.7 28.4 14.9 43.3
Literacy practices (Total) 3,585 36.2 42.2 21.6 63.8
----Broadcast media consumers 618 83.4 15.2 1.4 16.6
----Mobile phone users 1,748 38.7 44.8 16.5 61.3
----Computer users 1,215 17.1 49.1 33.8 82.9
Literate environment at community level (Total) 3,585 36.1 42.1 21.8 63.9
----High density 1,278 32.7 38.8 28.5 67.3
----Low density 2,307 39.8 40.4 19.8 60.2
Employment (Total) 3,585 36.1 42.1 21.8 63.9
----Employed in a high-skill job 594 14.6 41.0 44.5 85.4
----Employed in a low-skill job 411 38.6 39.2 22.2 61.4
----Not working 2,580 42.2 41.9 15.9 57.8
Literacy self-report - reading (Total) 3,585 36.0 41.9 22.1 64.0
----Can read easily 2,986 28.7 46.6 24.7 71.3
----Read with difficulty or not at all 596 96.3 3.6 0.1 3.7
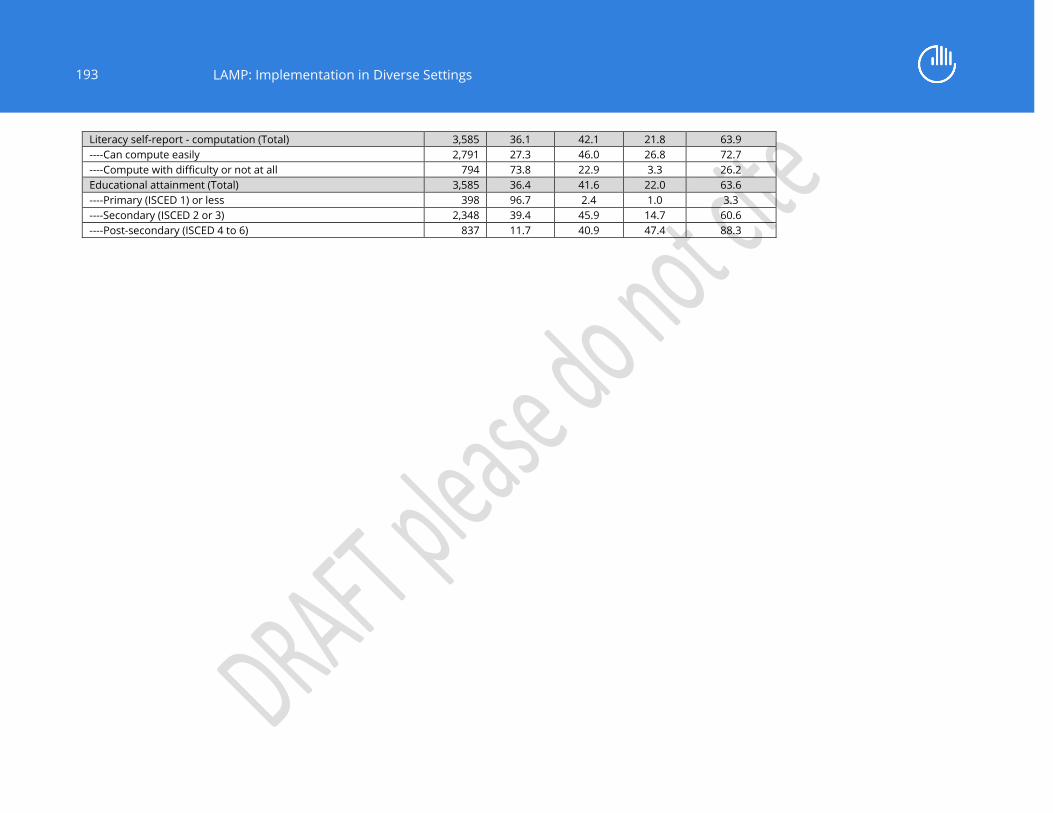
193
LAMP: Implementation in Diverse Settings
Literacy self-report - computation (Total) 3,585 36.1 42.1 21.8 63.9
----Can compute easily 2,791 27.3 46.0 26.8 72.7
----Compute with difficulty or not at all 794 73.8 22.9 3.3 26.2
Educational attainment (Total) 3,585 36.4 41.6 22.0 63.6
----Primary (ISCED 1) or less 398 96.7 2.4 1.0 3.3
----Secondary (ISCED 2 or 3) 2,348 39.4 45.9 14.7 60.6
----Post-secondary (ISCED 4 to 6) 837 11.7 40.9 47.4 88.3

194
LAMP: Implementation in Diverse Settings
Annex 16. Paraguay: Percentage of respondents at each LAMP Prose Reading level for various demographic
categories
Socio-Demographic Variable n Level 1 Level 2 Level 3
At or above
cut 1
Gender 3,966 29.1 50.8 20.1 70.9
----Male 1,636 35.0 52.6 12.3 65.0
----Female 2,330 25.6 48.0 26.4 74.4
Age 3,966 29.1 50.8 20.1 70.9
----15-24 1,052 23.2 63.3 13.4 76.8
----25-39 1,244 21.9 52.3 25.7 78.1
----40-64 1,247 36.3 39.5 24.2 63.7
----65+ 423 55.5 34.1 10.5 44.5
Location 3,966 29.1 50.8 20.1 70.9
----Urban 2,090 20.8 51.0 28.2 79.2
----Rural 1,876 41.8 47.8 10.4 58.2
Mother tongue 3,966 29.4 50.2 20.4 70.6
----MT is language of assessment only 908 13.5 59.8 26.7 86.5
----MT is other than assessment language only 1,720 39.8 43.0 17.1 60.2
----MT is language of assessment and other 1,332 21.3 55.4 23.3 78.7
SES 3,966 29.1 50.8 20.1 70.9
----High SES 1,127 8.0 56.2 35.8 92.0
----Medium high SES 371 22.7 58.9 18.4 77.3
----Medium low SES 1,332 27.3 57.7 15.0 72.7
----Low SES 1,136 55.5 35.2 9.3 44.5
Respondent's literate practices 3,966 29.7 49.8 20.5 70.3
----Broadcast media consumers 1,013 73.0 24.3 2.8 27.0
----Mobile phone users 1,758 23.5 56.9 19.6 76.5
----Computer users 1,194 6.6 63.3 30.1 93.4
Respondent's literate environment at community level 3,966 29.7 49.6 20.7 70.3
----High density 2,138 17.7 55.1 27.2 82.3
----Low density 1,810 42.2 44.3 13.4 57.8
Employment status 3,966 30.3 49.5 20.3 69.7
----Employed in a high-skill job 1,153 17.2 51.7 31.1 82.8
----Employed in a low-skill job 1,137 46.4 46.5 7.1 53.6
----Not working 1,669 25.7 52.1 22.2 74.3
Literacy self-report - reading 3,966 29.4 50.2 20.4 70.6
----Easily 3,369 19.9 56.4 23.7 80.1
----Difficulty or Not at all 591 89.8 7.7 2.5 10.2

195
LAMP: Implementation in Diverse Settings
Socio-Demographic Variable n Level 1 Level 2 Level 3
At or above
cut 1
Literacy self-report - computation 3,966 29.7 49.8 20.5 70.3
----Easily 3,277 21.7 55.2 23.0 78.3
----Difficulty or Not at all 688 74.8 24.0 1.2 25.2
Educational attainment (Total) 3,966 30.3 49.5 20.3 69.7
----Primary (ISCED 1) or less 1,612 63.3 30.0 6.7 36.7
----Secondary (ISCED 2 or 3) 1,540 12.3 71.7 16.0 87.7
----Post-secondary (ISCED 4 to 6) 807 2.2 56.0 41.9 97.8

196
LAMP: Implementation in Diverse Settings
Annex 17. Paraguay: Percentage of respondents at each LAMP Document Reading level for various demographic
categories
Socio-Demographic Variable n Level 1 Level 2 Level 3
At or
above cut 1
Gender (Total) 3,966 24.3 54.4 21.4 75.7
----Male 1,636 24.9 50.0 25.1 75.1
----Female 2,330 25.2 56.7 18.1 74.8
Age (Total) 3,966 24.3 54.4 21.4 75.7
----15-24 1,052 16.2 63.3 20.5 83.8
----25-39 1,244 18.9 53.1 28.0 81.1
----40-64 1,247 33.4 51.2 15.4 66.6
----65+ 423 51.8 31.4 16.9 48.2
Location (Total) 3,966 24.3 54.4 21.4 75.7
----Urban 2,090 16.8 53.6 29.6 83.2
----Rural 1,876 35.9 52.2 11.9 64.1
Mother tongue (Total) 3,966 24.6 53.7 21.7 75.4
----MT is language of assessment only 908 8.9 57.6 33.5 91.1
----MT is other than assessment language only 1,720 35.3 51.5 13.2 64.7
----MT is language of assessment and other 1,332 16.6 55.7 27.7 83.4
SES (Total) 3,966 24.3 54.4 21.4 75.7
----High SES 1,127 4.5 49.9 45.7 95.5
----Medium high SES 371 24.0 49.0 27.0 76.0
----Medium low SES 1,332 22.1 60.0 17.9 77.9
----Low SES 1,136 44.9 52.1 3.0 55.1
Respondent's literate practices (Total) 3,966 24.4 54.5 21.1 75.6
----Broadcast media consumers 1,013 62.6 36.2 1.1 37.4
----Mobile phone users 1,758 24.3 60.7 15.0 75.7
----Computer users 1,194 2.5 51.6 45.9 97.5
Respondent's literate environment at community level (Total) 3,966 24.6 53.7 21.7 75.4
----High density 2,138 15.3 54.1 30.6 84.7
----Low density 1,810 34.5 52.8 12.6 65.5
Employment status (Total) 3,966 24.9 53.5 21.6 75.1
----Employed in a high-skill job 1,153 8.2 51.5 40.3 91.8
----Employed in a low-skill job 1,137 38.6 51.9 9.6 61.4
----Not working 1,669 25.4 56.5 18.1 74.6
Literacy self-report - reading (Total) 3,966 24.6 53.7 21.7 75.4
----Easily 3,369 15.3 60.3 24.5 84.7
----Difficulty or Not at all 591 87.3 12.5 0.1 12.7

197
LAMP: Implementation in Diverse Settings
Socio-Demographic Variable n Level 1 Level 2 Level 3
At or
above cut 1
Literacy self-report - computation (Total) 3,966 24.4 54.5 21.1 75.6
----Easily 3,277 17.1 58.8 24.1 82.9
----Difficulty or Not at all 688 69.8 24.5 5.8 30.2
Educational attainment (Total) 3,966 24.9 53.5 21.6 75.1
----Primary (ISCED 1) or less 1,612 53.1 43.5 3.4 46.9
----Secondary (ISCED 2 or 3) 1,540 10.6 69.4 19.9 89.4
----Post-secondary (ISCED 4 to 6) 807 2.4 46.5 51.1 97.6

198
LAMP: Implementation in Diverse Settings
Annex 18. Paraguay: Percentage of respondents at each LAMP Numeracy level for various demographic categories
Socio-Demographic Variable n Level 1 Level 2 Level 3
At or above
cut 1
Gender (Total) 3,966 23.5 42.3 34.2 76.5
----Male 1,636 21.4 38.2 40.5 78.6
----Female 2,330 27.4 43.6 29.0 72.6
Age (Total) 3,966 23.5 42.3 34.2 76.5
----15-24 1,052 19.6 50.0 30.3 80.4
----25-39 1,244 21.7 38.3 40.0 78.3
----40-64 1,247 27.3 37.5 35.2 72.7
----65+ 423 38.6 33.5 27.9 61.4
Location (Total) 3,966 23.5 42.3 34.2 76.5
----Urban 2,090 14.2 41.9 43.9 85.8
----Rural 1,876 37.2 42.4 20.5 62.8
Mother tongue (Total) 3,966 24.3 41.7 34.0 75.7
----MT is language of assessment only 908 11.3 41.4 47.3 88.7
----MT is other than assessment language only 1,720 34.8 40.4 24.9 65.2
----MT is language of assessment and other 1,332 15.6 44.1 40.2 84.4
SES (Total) 3,966 23.5 42.3 34.2 76.5
----High SES 1,127 3.7 33.1 63.3 96.3
----Medium high SES 371 19.7 52.0 28.3 80.3
----Medium low SES 1,332 22.8 48.1 29.0 77.2
----Low SES 1,136 46.5 39.8 13.7 53.5
Respondent's literate practices (Total) 3,966 24.0 41.8 34.2 76.0
----Broadcast media consumers 1,013 62.1 30.2 7.6 37.9
----Mobile phone users 1,758 21.1 48.8 30.1 78.9
----Computer users 1,194 3.3 37.4 59.2 96.7
Respondent's literate environment at community level (Total) 3,966 24.3 41.2 34.5 75.7
----High density 2,138 13.8 41.6 44.6 86.2
----Low density 1,810 35.0 43.7 21.3 65.0
Employment status (Total) 3,966 24.3 41.8 33.9 75.7
----Employed in a high-skill job 1,153 4.9 37.8 57.3 95.1
----Employed in a low-skill job 1,137 34.3 44.7 21.0 65.7
----Not working 1,669 29.7 44.7 25.7 70.3
Literacy self-report - reading (Total) 3,966 24.3 41.7 34.0 75.7
----Easily 3,369 16.0 45.7 38.3 84.0
----Difficulty or Not at all 591 82.9 14.3 2.9 17.1

199
LAMP: Implementation in Diverse Settings
Literacy self-report - computation (Total) 3,966 24.0 41.8 34.2 76.0
----Easily 3,277 16.3 45.1 38.6 83.7
----Difficulty or Not at all 688 70.4 24.0 5.6 29.6
Educational attainment (Total) 3,966 24.3 41.8 33.9 75.7
----Primary (ISCED 1) or less 1,612 51.1 37.5 11.4 48.9
----Secondary (ISCED 2 or 3) 1,540 12.5 51.9 35.7 87.5
----Post-secondary (ISCED 4 to 6) 807 1.0 28.7 70.2 99.0

200
LAMP: Implementation in Diverse Settings
Annex 19. How the socio-economic index was computed
Since social stratification is not equal across countries and the discriminatory power of the variables used to
measure socio-economic status (SES) varies across countries, the sets of variables used in the computation
of the SES are country-specific and the distribution of the population among classes differs.
An SES index was constructed separately for each country. Indices were created to maximise ordinal rank
positions and therefore, only variable indicators that discriminate were included in the computation of the
SES indexes. After exploring several methodologies, taking into account the structure of the questions and
their response categories in the Background Questionnaire, latent class analysis (LCA) was identified as the
most suitable methodology for this purpose.
LCA requires an exploratory and iterative process. Initially, several variables are considered for the
construction of the index. See Table A.19.1 for details on the input variables for the construction of each
country’s socio-economic index. During the process, indicators or variables are included and then discarded,
mainly for two reasons: (i) the indicator does not discriminate between people, or (ii) the variation provided
by the indicator is captured in a better way by another indicator that is strongly associated with the first. LCA
assumes local independence and thus implies that, within each class, the indicators should be independent
of each other or in other words, once the classes are identified, all (or almost all) covariance between
indicators should occur between classes, not within each class.
The following criteria were used to determine the number and constituents of classes for each country: (i) a
good value of entropy, an indicator uses in LCA; (ii) a good ‘separation’ (discrimination) between classes; and
(iii) a result that yields classes that can be ranked on an ordinal scale. Finally, the country teams validated
the findings.
In the Background Questionnaire, the LAMP respondents provided information on: (i) household
possessions; (ii) housing characteristics and demographic conditions; (iii) education level of the head of
household; and (iv) access to utilities and infrastructure.
Household possessions
Questions about household possessions dealt with: (i) the availability, in the household, of a refrigerator, a
washing machine, a water heater, an air conditioner, a microwave oven, a television, a computer and an
internet connection; and (ii) the possession, by any member of the household, of a mobile phone, a clock, a
radio, a bicycle, a motorcycle or motor scooter, an animal-drawn cart, a car or truck, a boat with or without
a motor, a bank account, life insurance, land for agricultural or other purposes, and livestock, herds or
animals.
Housing characteristics and demographic conditions
Housing characteristics include information on the building materials of floors, roof and walls, the number
of rooms in the household, the number of bedrooms, and the availability of a special room for cooking.33
The number of bedrooms per household member in the household is used as proxy for crowding.
33 Note that there are three categories of building materials; natural, rudimentary and finished. Each
country specified the materials to be included in each of the categories.

201
LAMP: Implementation in Diverse Settings
Education level of head of household
The respondent answered the question on the head of the household’s educational attainment according to
the national classification. Responses were later mapped to ISCED levels and included as such in the index.
Access to utilities and infrastructure
Respondents provided information on the sanitation facility, source of drinking water, waste disposal, access
to electricity, and source of energy used for cooking.

202
LAMP: Implementation in Diverse Settings
Table A.19.1 Input variables and indicators used to construct the socio-economic
index
Indicators that discriminated and were
retained for further exploration into a
latent class analysis (X)
Indicators included in the final latent class
analysis
Variable and
indicators Indicator Description Jordan Mongolia Palestine Paraguay Jordan Mongolia Palestine Paraguay
Access to utilities and infrastructure
D1 Number of rooms in
household
X X X X X X
D2 Number of bedrooms in
household
X X X X X X
D3 Main source of drinking water X X X X
D5 Where is the cooking done X X X
D6 How is the food cooked X X X
D8 Source of energy used for
cooking
X X X
D9 Waste disposal X
D10 Type of toilet facility X X X X X X
D11 Availability of a telephone line X X X X X
D12 Electricity
Household possessions
D13 Possession of a/an…
D13_1 … refrigerator X X X X X X
D13_2 … washing machine X X X X X X
D13_3 … water heater X X X X X X X X
D13_4 … air conditioner X X X X X X X X
D13_5 … microwave X X X X X X X X
D13_6 … television X X X X X
D13_7 … computer X X X X X X X X
D13_8 … internet connection X X X X X X X X
D14 Does anyone in the household
have a/an …
D14_1 … mobile phone
D14_2 … clock
D14_3 … radio X X X X X
D14_4 … bicycle X X X X
D14_5 … motorcycle or motor
scooter
X X X X
D14_6 … animal drawn cart X X X X
D14_7 … car X X X X X X X X
D14_8 … boat without a motor
D14_9 … boat with a motor
D14_10 … bank account X X X X X X X X
D14_11 … life insurance X X X X
D14_12 … land for agricultural
purposes
X X X X X
D14_13 … land for other purposes X X X X X
D14_14 … livestock, herds, or farm
animals
X X X X X X X

203
LAMP: Implementation in Diverse Settings
D15 Number of animals owned
D15_1 Cows, oxen bulls X X X X
D15_2 Horses, donkeys and mules X X X X
D15_3 Camels/Pigs X X X X
D15_4 Goats X X X X
D15_5 Sheep X X X X
D15_6 Chicken X X X X
Housing characteristics and demographics
D16 Material used for floors of
dwelling
X X X X X X
D17 Material used for roof of
dwelling
X X X X X X
D18 Material used for walls of
dwelling
X X X X X X
INTRO1-5 Number of individuals less
than 15
X X X X
INTRO1-5 Number of individuals in
household
X X X X X X
Education level of head of household
INTRO 14 Education of head of
household
X X X X X X X
Constructed variables/indicators
Bedrooms
per HH
member
D2 ÷ Number of individuals in
household
- - - - X X
Child
dependency
#individuals <age 15 ÷
#individuals >=age 15
- - - - X X
D13_P1 Composite of 3 common
possessions: D13_1, D13_2
and D13_6
- - - - X X
D14_land If someone owns either
D14_12 or D14_13
X

204
LAMP: Implementation in Diverse Settings
Table A.19.2. Recoding of variables that are applicable to more than one country
Variable Coding scheme
INTRO14 – Education Level of head of household:
1: More than complete ISCED 3
2: Incomplete or complete ISCED 2 or
ISCED 3
3: Complete ISCED 1
4: Less than Complete ISCED 1
Child dependency - Child Dependency Ratio:
Formula: child dependency = (Number of individuals less than
15 years old) ÷( Number of individuals equal and greater than
15 years old)
1: No dependents
2: 0 < child dependency ≤ 1
3: 1 < child dependency ≤ 2
4: child dependency > 2
Bedrooms per HH member - Proxy for crowding:
Formula: Bedrooms per HH member = D2 ÷ Number of
individuals in household
1: Bedrooms per HH member ≥ 1
2: 0.5 ≤ Bedrooms per HH member < 1
3: 0.25 ≤ Bedrooms per HH member <
0.5
4: Bedrooms per HH member < 0.25
Number of individuals in the household
Note: this includes all members of the household, including
children
1: 1-2 individuals per household
2: 3-4 individuals per household
3: 5-6 individuals per household
4: 7 or more

205
LAMP: Implementation in Diverse Settings
Table A.19.3. Country-specific recoding of Indicators
Indicator Jordan Mongolia Palestine Paraguay D1 1: 3 or fewer rooms
2: 4 rooms
3: 5 rooms
4: 6 rooms
5: 7 or more rooms
- 1: 2 or fewer rooms
2: 3 rooms
3: 4 rooms
4: 5 or more rooms
-
D2 - 1: 1 room used for
sleeping
2: 2 rooms used for
sleeping
3: 3 or more rooms used
for sleeping
- 1: 1 room used for
sleeping
2: 2 rooms used for
sleeping
3: 3 rooms used for
sleeping
4: or more rooms used for
sleeping
D5 - 1: in a special room inside
the dwelling
2: not in a special room
inside the building, in a
separate building or
outdoors
- -
D6 - - - 1: with an electric/gas
stove
2: with a stove that uses
wood or charcoal
3: on an open fire
D8 - 1: Electricity/gas
2: Wood or charcoal
3: Animal dung
- -
D10 1: Flush/pour type toilet
connected to sewage
system
2: Flush/pour type toilet
connected to septic tank,
pit latrine, or other
3: other
1: Flush/pour type toilet
2: Ventilated improved pit
latrine
3: Pit latrine with a slab
4: Open pit, composting
toilet, bucket toilet, or no
facility
- -
D13_P1 1: Has 3 common
possessions
2: Has 2 common
possessions
3: Has 1 common
possession
4: Has no common
possessions
- 1: Has 3 common
possessions
2: Has 2 common
possessions
3: Has 1 common
possession
4: Has no common
possessions
-
D14_land 1: Owns land
2: Does not own land
- - -

206
LAMP: Implementation in Diverse Settings
Table A.19.4. Summary of the classification of response profiles for each country
Jordan:
Classification (Proportion of
respondents in each class) Class 1 (0.18) Class 2 (0.30) Class 3 (0.15) Class 4 (0.36)
All common possessions 1.00 0.99 0.93 0.94
Water heater 0.76 0.80 0.57 0.40
Air conditioner 0.50 0.23 0.10 0.04
Microwave oven 0.86 0.61 0.37 0.19
Clock 0.86 0.73 0.54 0.50
Telephone (land line) 0.58 0.33 0.17 0.02
Computer 0.94 0.95 0.31 0.28
Internet 0.80 0.57 0.11 0.03
Bank account 0.89 0.71 0.41 0.27
Car 0.89 0.75 0.29 0.32
Land for agricultural or other
purposes 0.45 0.39 0.21 0.20
Type of toilet facility
Flush/pour type connected to
sewage system 0.86 0.66 0.70 0.55
Flush/pour type connected to
other 0.14 0.34 0.29 0.43
Number of rooms in the dwelling 5 or more, 0.88 6 or less, 0.84 5 or less, 0.85 5 or less, 0.89
Number of household members Between 3 and
6, 0.86
7 or more,
0.73 4 or less, 0.84
5 or more,
0.85
Number of Individuals per
bedroom 2 or less, 1.00 3-4, 0.88 2 or less, 0.97
3 or more,
0.94
Child-dependency ratio 1 or less, 0.95 1 or less, 0.84 None, 0.84
1 or more,
0.85
Educational attainment of the
head of the household
Less than complete ISCED 1 0.06 0.10 0.24 0.27
Complete ISCED 1 0.01 0.05 0.10 0.11
Incomplete or complete ISCED 2
or ISCED 3 0.36 0.45 0.41 0.51
More than complete ISCED 3 0.55 0.38 0.23 0.10
Notes: (a) The child-dependency ratio represents the number of dependents under 15 years of age per
adult in the household. (b) In Jordan, dwellings predominately have finished floors, roofs and walls.
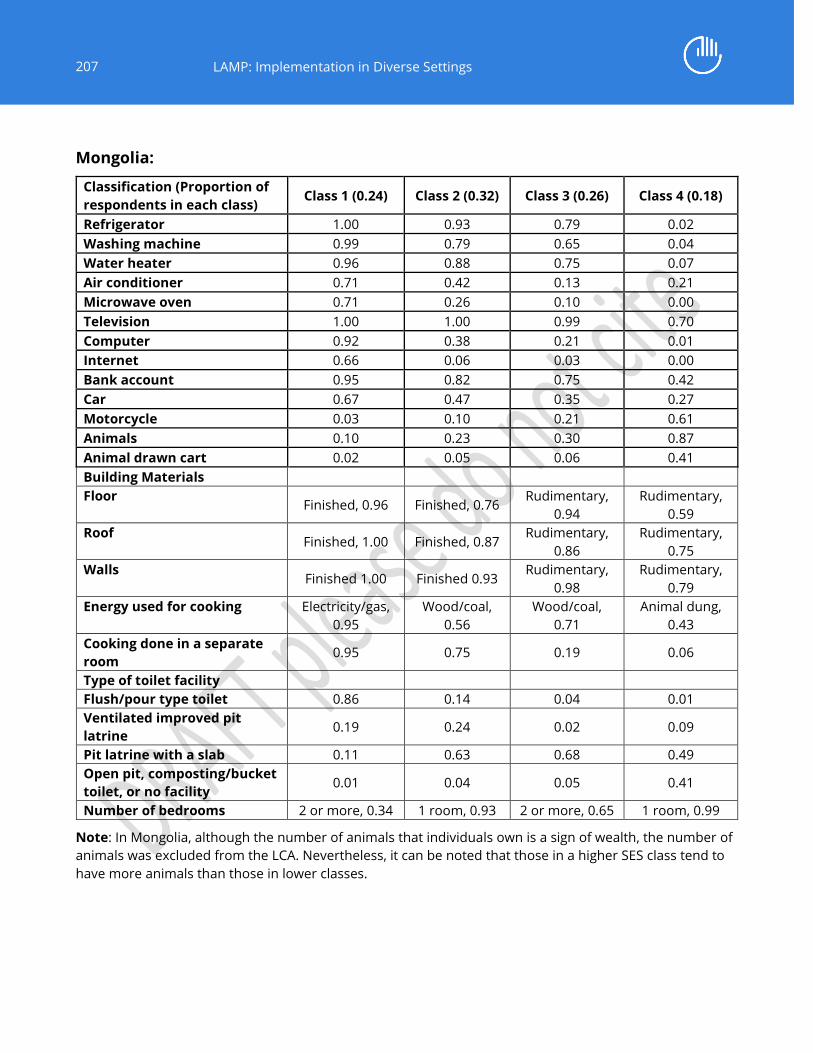
207
LAMP: Implementation in Diverse Settings
Mongolia:
Classification (Proportion of
respondents in each class) Class 1 (0.24) Class 2 (0.32) Class 3 (0.26) Class 4 (0.18)
Refrigerator 1.00 0.93 0.79 0.02
Washing machine 0.99 0.79 0.65 0.04
Water heater 0.96 0.88 0.75 0.07
Air conditioner 0.71 0.42 0.13 0.21
Microwave oven 0.71 0.26 0.10 0.00
Television 1.00 1.00 0.99 0.70
Computer 0.92 0.38 0.21 0.01
Internet 0.66 0.06 0.03 0.00
Bank account 0.95 0.82 0.75 0.42
Car 0.67 0.47 0.35 0.27
Motorcycle 0.03 0.10 0.21 0.61
Animals 0.10 0.23 0.30 0.87
Animal drawn cart 0.02 0.05 0.06 0.41
Building Materials
Floor Finished, 0.96 Finished, 0.76
Rudimentary,
0.94
Rudimentary,
0.59
Roof Finished, 1.00 Finished, 0.87
Rudimentary,
0.86
Rudimentary,
0.75
Walls Finished 1.00 Finished 0.93
Rudimentary,
0.98
Rudimentary,
0.79
Energy used for cooking Electricity/gas,
0.95
Wood/coal,
0.56
Wood/coal,
0.71
Animal dung,
0.43
Cooking done in a separate
room 0.95 0.75 0.19 0.06
Type of toilet facility
Flush/pour type toilet 0.86 0.14 0.04 0.01
Ventilated improved pit
latrine 0.19 0.24 0.02 0.09
Pit latrine with a slab 0.11 0.63 0.68 0.49
Open pit, composting/bucket
toilet, or no facility 0.01 0.04 0.05 0.41
Number of bedrooms 2 or more, 0.34 1 room, 0.93 2 or more, 0.65 1 room, 0.99
Note: In Mongolia, although the number of animals that individuals own is a sign of wealth, the number of
animals was excluded from the LCA. Nevertheless, it can be noted that those in a higher SES class tend to
have more animals than those in lower classes.

208
LAMP: Implementation in Diverse Settings
Palestine:
Classification (Proportion of
respondents in each class) Class 1 (0.21) Class 2 (0.37) Class 3 (0.10) Class 4 (0.32)
All common possessions 0.98 0.98 0.84 0.88
Water heater 0.89 0.80 0.60 0.48
Air conditioner 0.32 0.17 0.07 0.04
Microwave oven 0.65 0.43 0.22 0.16
Computer 0.98 0.99 0.19 0.23
Internet 0.87 0.73 0.04 0.00
Bank account 0.72 0.56 0.27 0.21
Car 0.47 0.33 0.11 0.13
Number of rooms in the dwelling 5 or more,
0.61
5 or more,
0.58 4 or less, 0.72 4 or less, 0.68
Number of household members 6 or less, 0.94
7 or more,
0.75 4 or less, 0.91
5 or more,
0.91
Number of individuals per
bedroom 2 or less 0.92 3-4, 0.83 4 or less, 0.90
3 or more,
1.00
Child-dependency ratio 1 or less, 0.94 1-2, 0.85 None, 0.83 1-2, 0.85
Education level of the head of
the household
Less than complete ISCED 1 0.00 0.00 0.23 0.05
Complete ISCED 1 0.28 0.34 0.41 0.58
Incomplete or complete ISCED 2
or ISCED 3 0.37 0.35 0.24 0.29
More than complete ISCED 3 0.33 0.29 0.10 0.05
Notes: (a) The child-dependency ratio represents the number of dependents under 15 years of age per
adult in the household. (b) In Palestine, dwellings predominately have finished floors, roofs and walls.

209
LAMP: Implementation in Diverse Settings
Paraguay:
Classification (Proportion
of respondents in each
class)
Class 1 (0.25) Class 2 (0.14) Class 3 (0.31) Class 4 (0.30)
Refrigerator 0.99 0.96 0.94 0.58
Washing machine 0.97 0.94 0.83 0.34
Water heater 0.34 0.11 0.07 0.00
Air conditioner 0.71 0.22 0.20 0.00
Microwave oven 0.69 0.48 0.30 0.03
Computer 0.96 0.29 0.06 0.00
Internet 0.86 0.12 0.00 0.00
Bank account 0.58 0.22 0.15 0.00
Car 0.72 0.37 0.19 0.00
Motorcycle 0.51 0.91 0.63 0.58
Animals 0.22 0.98 0.36 0.82
Animal drawn cart 0.02 0.33 0.02 0.13
Land for agricultural
purposes 0.22 0.95 0.10 0.60
Land for other purposes 0.36 0.69 0.07 0.21
Building Materials
Floor Finished, 0.98 Finished, 0.73 Finished, 0.82 Natural, 0.46
Roof Finished, 0.96 Finished, 0.75 Finished, 0.78
Rudimentary,
0.53
Walls Finished, 0.98 Finished, 0.71 Finished, 0.87
Rudimentary,
0.71
Cooking Electricity/gas,
0.95
Wood/coal,
0.52
Electricity/gas,
0.71 Wood/coal, 0.63
Number of bedrooms 3 or more, 0.69 3 or more, 0.65 3 or less, 0.87 2 or less, 0.68
Educational attainment of
head of household
Less than complete ISCED 1 0.05 0.30 0.31 0.63
Complete ISCED 1 0.20 0.35 0.30 0.32
Incomplete or complete
ISCED 2 or ISCED 3 0.36 0.23 0.26 0.04
More than complete ISCED
3 0.38 0.12 0.12 0.00
Notes: (a) In Paraguay, the question about the ownership of a water heater was phrased in a way that
named a specific type of water heater. Thus, it does not mean that those who do not possess the specified
type of water heater are necessarily without access to hot water. (b) In Paraguay, although variability was
observed, sanitation facilities, waste disposal and source of drinking water are strongly associated with
urban or rural settings, and were excluded from the analysis.

210
LAMP: Implementation in Diverse Settings
Annex 20. An explanation of the LAMP ordinal index of literacy and numeracy
practices
The LAMP Background Questionnaire includes an array of questions about individuals’ literacy practices,
both at home and at work. Typically, respondents answer the questions based on the frequency of
engagement: “Daily”, “At least once a week”, “Seldom” or “Never”.34
Section A focuses primarily on age, language, and self-reporting of literacy skills, but also includes questions
about the use of written materials in everyday life. Section B is centred on respondents’ education, including
training and enrolment in literacy programmes – it covers engagement in educational and cultural activities
and exposure to literacy through other media. Section C generates information about everyday exposure to
and production of written materials and calculations. This section also examines individuals’ use of different
communication and information devices, including mobile phones and computers. Section D is on
household-level information. Section E focuses on employment and the use of written texts and numeracy
skills at work.
In this annex, literacy practices are defined as the activities that expose individuals to written and numerical
materials at home and in daily life, outside work. This may be in the form of printed texts (books, magazine
or instruction manuals), through information and communication technologies (ICTs) (use of mobile phones
or computers), through digital media such as watching television, and attendance of cultural activities
(visiting a museum or a fair). For a detailed list of variables considered for the construction of the literacy
practices index, refer to Table A.20.6.
Latent class analysis: A technique to identify indicators for the index of literacy practices
The data are based on individuals’ own reporting of their literacy-related activities. Moreover, the questions,
by design, yield information that is subjective and ordinal in nature. Latent class analysis (LCA) is a technique
that results in the clustering of subjects based on categorical variables. When identifying indicators to retain,
LCA requires an exploratory and iterative process. Initially, all indicators are considered, and during the
process, indicators are included and then discarded, mainly for two reasons: (i) the indicator does not help
discriminate, or (ii) the variation provided by the indicator is captured in a better way by another indicator
that is strongly associated with the first. LCA assumes local independence, and thus implies that, within each
class, the indicators should be independent of each other or, in other words, once the classes are identified,
all (or almost all) covariance between indicators should occur between classes, not within each class.
The same variables and indicators were retained for all four countries’ analyses. The variables can be
summarised in six broad categories, each encompassing several indicators. Refer to Table A.20.6 for the list
of variables that were retained for the analysis. They include:
1. Use of computers for writing texts and preparing spreadsheets; reading and writing emails; using
the internet to search for health or education-related purposes; reading the news; or being in touch
with people through instant messaging and social networks.
34 Other categorical response patterns may be: (i) “always”, “sometimes”, “never”; (ii) “none”, “less than an
hour”, “between 1 and 2 hours”, “more than two hours”; or (iii) dichotomous “yes”, “no”.

211
LAMP: Implementation in Diverse Settings
2. Use of mobile phones; reading and writing text messages.
3. Personal finances, such as reading bills or invoices; and using calculators.
4. Reading printed materials, such as newspapers, magazine or books.
5. Health awareness, such as reading instruction labels before taking medicine; or the labels printed
on food packages (this may include prices, nutritional value and expiry dates).
An LCA was performed on the retained variables, where each individual was assigned to a class with a given
probability based on his or her response pattern. Each class is defined based on a predominant response
profile or, in other words, describes different levels and types of individuals’ engagements in literacy
practices. The following criteria were used to determine the number and constituents of classes for each
country: (i) a good value of entropy, an indicator used in LCA; (ii) a good ‘separation’ (discrimination) between
classes; and (iii) a result that yields classes that can be ranked on an ordinal scale.
Three classes were identified for each of the four countries. Even though the distribution of the population
among the three classes varies by country, the description of the classes and the predominant response
pattern were the same. Classes identified were:
Class 1 (broadcast media users): Most of the exposure of literacy for this group comes from listening to the
radio and watching television. This group does not use computers and does not use text messages as a form
of communication, even if a very large proportion declares using mobile phones. This group generally does
not read instruction labels on food and medicine and, with low probability, reads books or magazines for
pleasure.
Class 2 (mobile phone users): While individuals in this class with high probability use mobile phone texting
as a means of communication, this group has very low engagement in computer-related activities, and is not
likely to attend cultural activities. This group generally reads books and magazines for pleasure, and
organizes their personal finances. This group always reads the instruction on the labels before taking any
medicine and reads the labels on printed food packages.
Class 3 (computer users): With high probability, this class engages in computer-related activities, such as
emailing, searching the internet for information, getting in touch using social media, reading the news; uses
mobile phones, communicates using text messaging (reading and writing); and reads other printed
materials, such as magazines, books and pamphlets. This group is also the most likely to attend cultural
events, such as visiting museums, trade fairs, galleries or even attending lectures, workshops or seminars.
Similar to Class 2, this group always reads the instructions before taking any medicine and reads the labels
on printed food packages.

212
LAMP: Implementation in Diverse Settings
Table A.20.1 Percent of respondents in each leisure literacy use class by country
Class 1 Class 2 Class 3
Jordan 13.3 51.7 35.0
Mongolia 30.5 34.4 35.1
Palestine 15.7 47.8 36.5
Paraguay 22.4 47.3 30.3
Construction of the index
Reliability of indicators
Coefficient alpha was used to determine if the indicators to the literacy practices index, which were
determined by the LCA, are consistent and reliable. Coefficient alpha can have values between zero and one.
Literature on reliability indicates that 0.7 is an acceptable value, although sometimes other thresholds are
used.35 The coefficient alpha for all countries exceeds 0.7.
Table A.20.2. Coefficient alpha reliability in each country data set for scores based
on indicators
Coefficient alpha Number of indicators
Jordan 0.858 30
Mongolia 0.890 30
Palestine 0.878 30
Paraguay 0.923 30
Note: A15 and A16 were dichotomized for the reliability analysis: 1 Always, 0 Otherwise.
Recoding
Recoding of categorical variables (see Table A.20.6):
All retained indicators in Sections B and C were recoded to dichotomous responses: 1 yes, 0 no.
A15 and A16 were recoded to: 3 always, 2 sometimes (includes responses “often” and “seldom”), 1
never.
If respondents report not being able to read (C1_0), then all indicators in C1 and C2 were assigned a
value of zero.
35 Nunnaly (1978) and Reynaldo et al. (1999) have indicated 0.7 to be an acceptable reliability coefficient,
while Bland (2001) argues that for comparing groups, α values of 0.7 to 0.8 are regarded as satisfactory.

213
LAMP: Implementation in Diverse Settings
If respondents report not having used a computer in the past month in C5, all indicators in C6 and
C7 were assigned a value of zero, indicating that neither computer use nor access to the Internet
through a computer were activities undertaken by respondents in the past month.
If respondents did not access the Internet through a computer (their response to C6_11 is “never”),
then all indicators in question C7 were assigned a value of zero, indicating that even though
respondents may have used a computer, they did not use it to access the Internet.
The index of leisure literacy use
A 34-point scale of engagement in literacy activities was constructed from the recoded indicators. The
distribution of the population among the three classes obtained with LCA was used to determine the cut-off
points on distribution of scores. The cut-off points were selected as close as possible to the thresholds
identified by the LCA, and therefore, the proportion of individuals in each of the three categories differs
slightly.
Table A.20.3. Cut-off scores on the 34-point scale
Class 1 Class 2 Class 3
Jordan 0-12 12.01-21.99 22-34
Mongolia 0-14.99 15-22.99 23-34
Palestine 0-9 9.01-19.99 20-34
Paraguay 0-13 13.01-22 22.01-34
Table A.20.4. Percent of respondents in each country falling into each class using
the 34-point scale
Class1 Class 2 Class 3
Jordan 14.5 49.9 35.6
Mongolia 29.7 35.1 35.2
Palestine 16.0 47.9 36.1
Paraguay 24.3 46.7 29.0
Given the high correspondence between the LCA classification and the ordinal index (highlighted by the high
proportion of individuals falling in the diagonal of the cross-tabulation below), it is reasonable to assume the
definitions stemming from the LCA are suitable to describe individuals belonging to the relative ordinal
index.
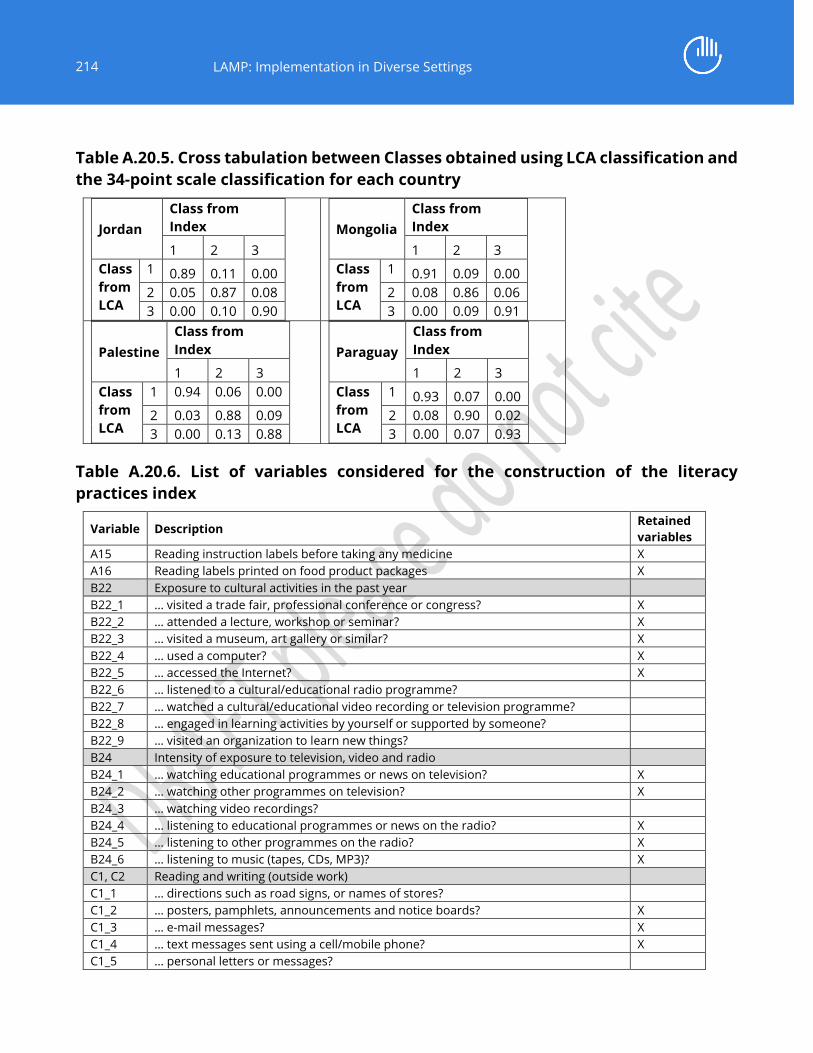
214
LAMP: Implementation in Diverse Settings
Table A.20.5. Cross tabulation between Classes obtained using LCA classification and
the 34-point scale classification for each country
Jordan
Class from
Index
1 2 3
Class
from
LCA
1 0.89 0.11 0.00
2 0.05 0.87 0.08
3 0.00 0.10 0.90
Mongolia
Class from
Index
1 2 3
Class
from
LCA
1 0.91 0.09 0.00
2 0.08 0.86 0.06
3 0.00 0.09 0.91
Palestine
Class from
Index
1 2 3
Class
from
LCA
1 0.94 0.06 0.00
2 0.03 0.88 0.09
3 0.00 0.13 0.88
Paraguay
Class from
Index
1 2 3
Class
from
LCA
1 0.93 0.07 0.00
2 0.08 0.90 0.02
3 0.00 0.07 0.93
Table A.20.6. List of variables considered for the construction of the literacy
practices index
Variable Description Retained
variables
A15 Reading instruction labels before taking any medicine X
A16 Reading labels printed on food product packages X
B22 Exposure to cultural activities in the past year
B22_1 … visited a trade fair, professional conference or congress? X
B22_2 … attended a lecture, workshop or seminar? X
B22_3 … visited a museum, art gallery or similar? X
B22_4 … used a computer? X
B22_5 … accessed the Internet? X
B22_6 … listened to a cultural/educational radio programme?
B22_7 … watched a cultural/educational video recording or television programme?
B22_8 … engaged in learning activities by yourself or supported by someone?
B22_9 … visited an organization to learn new things?
B24 Intensity of exposure to television, video and radio
B24_1 … watching educational programmes or news on television? X
B24_2 … watching other programmes on television? X
B24_3 … watching video recordings?
B24_4 … listening to educational programmes or news on the radio? X
B24_5 … listening to other programmes on the radio? X
B24_6 … listening to music (tapes, CDs, MP3)? X
C1, C2 Reading and writing (outside work)
C1_1 … directions such as road signs, or names of stores?
C1_2 … posters, pamphlets, announcements and notice boards? X
C1_3 … e-mail messages? X
C1_4 … text messages sent using a cell/mobile phone? X
C1_5 … personal letters or messages?

215
LAMP: Implementation in Diverse Settings
C1_6 … newspapers or magazines? X
C1_7 … all or parts of books for educational purposes? X
C1_8 … all or parts of books for job/business-related reasons?
C1_9 … all or parts of books for pleasure? X
C1_10 … bills, invoices or budget tables? X
C1_11 … maps, diagrams, or charts?
C2_1 … written e-mail messages? X
C2_2 … sent text messages using a cell/mobile phone? X
C2_3 … written a personal letter or message?
C2_4 … filled in forms?
C2_5 … written an official letter to an authority or organization?
C2_6 … written a report or article?
C2_7 … produced a bill, invoice or budget table?
C2_8 … produced a chart, diagram or map?
C4 Exposure to ICT at home
C4_1 … used a cell/mobile phone? X
C4_2 … used a calculator at home? X
C4_4 … used a fax machine at home?
C4_7 … used an automated teller machine (ATM)?
C4_8 … played with video games?
C4_9 … listened to the radio?
C4_10 … watched over-the-air television?
C4_11 … watched cable television?
C5-C7 Use of computers and internet outside work
C5_1 … at home or a friend’s or relative’s place?
C5_2 … at job/business?
C5_3 … at a school?
C5_4 … somewhere else (library/café)?
C6_1 … write or edit texts? X
C6_2 … work with spreadsheets? X
C6_3 … create graphics and designs or edit pictures?
C6_4 … work with presentations?
C6_5 … programme?
C6_6 … keep a schedule or calendar?
C6_7 … play games?
C6_9 … communicate using instant messages? X
C6_10 … communicate using voice?
C6_11 … access the Internet? X
C7_1 … search for information for education-related purposes? X
C7_2 … search for information for health-related purposes? X
C7_3 … search for information for work-related purposes? X
C7_4 … search for job opportunities?
C7_5 … read news? X
C7_6 … play games?
C7_7 … do banking?
C7_8 … buy goods or services?
C7_9 … be in touch with other people through social networks? X
C7_10 … watch/download movies, listen to/download music?

216
LAMP: Implementation in Diverse Settings
Literacy Assessment and Monitoring Programme (LAMP): Implementation in Diverse Settings
describes the development and application of a unique procedure for the cross-national
assessment of literacy and numeracy. The worldwide pledge to achieve Sustainable
Development Goal (SDG) 4 on education poses many challenges – among them how to
monitor the move towards the provision of quality education for all and the promotion of
lifelong learning by 2030. With the SDG 4 goal in mind, LAMP helps to provide a means to
compare countries on a common metric. LAMP was developed with the assistance of 10
countries representing 13 languages, 7 language families and 4 language scripts. This report
presents the findings of the assessment that was administered in four developing countries
(Jordan, Mongolia, Palestine and Paraguay) and explores the challenges of implementing a
household-based literacy assessment in very diverse settings. The report's findings aim to
inform the policies needed to assess literacy and numeracy in low-skill populations as well as
deliver the promise of SDG 4 to countries using direct assessment.
The report's main findings demonstrate why cross-country collaboration, consistent data
collection, pragmatic statistical methodology and easy-to-understand reporting are
fundamental when using assessment results to design effective interventions to improve
literacy skills in adult populations. The report also presents the types of data and analyses
countries need to address the compounding effects of disadvantages faced by adults with
illiteracy or with low language proficiency – particularly women, people living in rural areas,
those with lower socio-economic status and in low literate environments. Cross-sector
collaboration, practical approaches to assessment and capacity building in affected countries
are guideposts in a roadmap for using reliable and valid data to catalyse action to improve
worldwide literacy and achieve SDG 4 in this critical moment of international development.


