

Improving national waste data and reporting 30 MARCH 2018
PREPARED FOR
Department of the Environment and Energy
PREPARED IN ASSOCIATION WITH

Disclaimer
This report has been prepared for Department of the Environment and Energy in accordance with the terms and conditions of appointment dated 20 September 2017, and is based on the assumptions and exclusions set out in our scope of work. Information in this document is current as of 1 February 2018. While all professional care has been undertaken in preparing this report, Blue Environment Pty Ltd cannot accept any responsibility for any use of or reliance on the contents of this report by any third party.
The mention of any company, product or process in this report does not constitute or imply endorsement by Blue Environment Pty Ltd.
© Blue Environment and the Department of the Environment and Energy
Blue Environment prints on 100% recycled paper
Blue Environment Pty Ltd ABN 78 118 663 997 Suite 208, 838 Collins St, Docklands Vic 3008 Email: [email protected] Web: www.blueenvironment.com.au Phone: +61 3 9081 0440 / +61 3 5426 3536
Report title Improving national waste data and reporting (revised v2)
Client Department of the Environment and Energy
Author(s) Joe Pickin, Paul Randell, Geoff Latimer
Reviewer(s) Christine Wardle, Brendan Lim, Joe Pickin, Paul Randell, Geoff Latimer
Project number P836
Report date 30 March 2018
Contract date 20 September 2017
Information current to 1 February 2018
Copyright Blue Environment and the Department of the Environment and Energy

Improving national waste data and reporting (revised v2)
Page i
Contents
Summary .................................................................................................................................... iv
1 Introduction ........................................................................................................................ 1 1.1 Improvements program method ...................................................................................... 1 1.2 About this report .............................................................................................................. 1
2 Situation review................................................................................................................... 2 2.1 History and processes ...................................................................................................... 2 2.2 Overviews of the recent reports ...................................................................................... 4 2.3 Motivations for improving ............................................................................................... 7 2.4 Potential areas of improvement ...................................................................................... 7
3 Investigation methods and findings ...................................................................................... 8 3.1 Consultations with the states and territories................................................................... 8 3.2 Consultations with industry and community ................................................................. 13 3.3 Review of drivers and options for expanding the waste scope covered ....................... 17 3.4 Quality and issues analysis – National Waste Report .................................................... 21 3.5 Quality and issues analysis – Hazardous Waste in Australia ......................................... 24 3.6 Research program .......................................................................................................... 26 3.7 An outsider’s view .......................................................................................................... 29 3.8 Best practice visualisation .............................................................................................. 31
4 Agreed improvements........................................................................................................ 38 4.1 Scope expansions ........................................................................................................... 38 4.2 Corrections and adjustments ......................................................................................... 44 4.3 Better expression of uncertainty .................................................................................... 45 4.4 Improved data collation and warehousing .................................................................... 45 4.5 Data visualisations .......................................................................................................... 48 4.6 Standardising data and reporting on non-hazardous waste .......................................... 53 4.7 Hazardous waste data improvements ........................................................................... 54 4.8 Structure of the National Waste Report 2018 ............................................................... 57
References ................................................................................................................................. 58
Appendices Appendix A The current national waste report method .................................................................. 59
Appendix B Resource Futures assessment of the NWR (included as a separate PDF file) ............... 62
Improving national waste data and reporting (revised v2)
Page ii
Figures Figure 1 An illustration of the process for preparing national waste data collations, covering
both the NWR and hazardous waste reporting ............................................................... 3 Figure 2 Abbreviated table of contents of the National Waste Report 2016 ................................ 4 Figure 3 Sample charts from the NWR 2016 .................................................................................. 5 Figure 4 Major flows of hazardous waste in Australia, 2014-15 .................................................... 6 Figure 5 Aspirational national waste data reporting parameters agreed with the states and
territories 2014-15 ......................................................................................................... 19 Figure 6 Example of ABS reporting for System of Environmental-Economic Accounting ........... 21 Figure 7 Example of the standardised output sheet in the national waste reporting tool.......... 23 Figure 8 Example of a ‘tree map’ diagram ................................................................................... 34 Figure 9 Example of a ‘small multiples’ presentation .................................................................. 35 Figure 10 Illustration of the scope of wastes and sources to be included in the NWR 2018 ........ 43 Figure 11 Example of the flat database structure .......................................................................... 46 Figure 12 Illustration of the current and revised data collation and warehousing system ........... 47 Figure 13 An example of a Sankey infographic .............................................................................. 51
Tables Table 1 Waste categories and types analysed in the NWR 2016 .................................................. 5 Table 2 Improvement workshop details ....................................................................................... 9 Table 3 Summary of the main outcomes of the improvement workshops .................................. 9 Table 4 Definitions of recovery or recycling applied in jurisdictional reporting ......................... 12 Table 5 Information on indicators of data uncertainty ............................................................... 12 Table 6 The 25 stakeholders consulted ...................................................................................... 13 Table 7 Summary of the outcomes of the consultation program............................................... 15 Table 8 Responses to the online survey ...................................................................................... 17 Table 9 Key findings of the quality and issues analysis of the NWR 2016 .................................. 22 Table 10 Key findings of the quality and issues analysis for hazardous waste ............................. 25 Table 11 Waste audits compared with NWR 2016 landfill composition values ........................... 27 Table 12 Additional data sources and alternative data classifications of potential relevance to
national waste reporting ................................................................................................ 28 Table 13 Local government waste data collations by state and territory .................................... 29 Table 14 Principles for best practice visualisation ........................................................................ 31 Table 15 Little Sketches comments on sample graphics from the NWR 2016 ............................. 32 Table 16 Little Sketches suggestions on general aesthetics to improve the presentation clarity 33 Table 17 Little Sketches suggested options for alternative chart types ....................................... 33 Table 18 Review of data visualisation software options............................................................... 36 Table 19 Agreed expansions of the scope of wastes covered in the NWR 2018 .......................... 39 Table 20 Other expansions in the scope of the NWR 2018 .......................................................... 40 Table 21 Increasing the depth of the detail and discussion included in the NWR 2018 .............. 41 Table 22 Agreements for correcting and adjusting data to be presented in the NWR 2018 ....... 44 Table 23 Data options for the flat databases ................................................................................ 46 Table 24 A general approach to data visualisation ....................................................................... 49 Table 25 Visualisation types for the NWR 2018 ............................................................................ 50 Table 26 Draft list of key visualisations ......................................................................................... 52 Table 27 Improvements to hazardous waste data ....................................................................... 55 Table 28 Draft table of contents of the NWR 2018 ...................................................................... 57

Improving national waste data and reporting (revised v2)
Page iii
Abbreviations and glossary
AiG Australian Industry Group
AORA Australian Organics Recycling Association
APCO Australian Packaging Covenant Organisation
C&D construction and demolition (waste)
C&I commercial and industrial (waste)
the consultants Blue Environment, supported by Randell Environmental Consulting, Ascend Waste and Environment, Little Sketches and Resource Futures (UK)
Controlled waste NEPM National Environment Protection (Movement of Controlled Waste between States and Territories) Measure
CSG coal-seam gas
the Department Department of the Environment and Energy
e-waste electronic waste (i.e. discarded equipment that runs on electricity)
flat database a table in which all records are stored as single rows of data comprising field entries in columns
the hazwaste standard Australian Hazardous Waste Data and Reporting Standard
HWiA Hazardous Waste in Australia (report)
MSW municipal solid waste
NWR National Waste Report
NWRIC National Waste and Recycling Industry Council
the project the Department’s waste data and reporting needs 2017-19
QA quality assurance
SEEA System of Environmental-Economic Accounts
WMAA Waste Management Association of Australia

Improving national waste data and reporting (revised v2)
Page iv
Summary
In September 2017, the Department of the Environment and Energy commissioned Blue Environment and sub-consultants to manage its waste data and reporting needs until 2019. An early project requirement was to research and propose improvements to the previous versions of the core waste reports, particularly the national waste report. The work program to explore potential areas for improvement involved consultations with the states and territories, industry and community, as well as various reviews and research projects. An initial version of this report proposed a series of changes. A workshop to discuss these was held at the Department’s offices on 19 March. The workshop and subsequent discussions resulted in an agreed set of improvements on how national waste reporting should be improved. This report documents the method and outcomes of the improvements program, including the agreed improvements. After an introduction in Section 1, a situation review in Section 2 describes the history and current status of national waste reporting, discusses why improvements are needed and canvasses potential areas of improvement. Section 3 describes the various investigations and their findings. Section 4 presents the agreed improvements. Sixty-five agreed improvements are documented, mostly focusing on the National Waste Report 2018. The improvements encompass expansions to the scope, corrections and adjustments, better expression of uncertainty, improved data warehousing, a new approach to data visualisation, standardising non-hazardous waste data and reporting, and improvements to hazardous waste data and reporting. Among the most significant changes are:
• inclusion of data on local government waste management, product waste, tip shops, litter and dumping, container deposit schemes, mining waste, stockpiles, approved long-term storages, waste infrastructure and international waste flows
• increasing the depth of the detail and discussion, particularly of the key data areas of waste generation, recycling, energy recovery and disposal
• restructuring the national waste report to focus on these key data areas and remove the distinct sections on each state and territory (whilst maintaining and reporting state and territory data)
• construction of a flat database including the historical record of waste back to 2006-07 and interaction with that database using Power BI to generate data visualisations
• a contribution towards national standardisation of waste data and reporting by appendicising the national method and definitions as a basis for a potential future standard
• a range of improvements to hazardous waste data, including to correction methods, the historical record and the major publications that deal with hazardous waste.
A draft table of contents for the National Waste Report 2018 is given on page 57.
Improving national waste data and reporting (revised v2)
Page 1
1 Introduction
In September 2017, the Australian Government’s Department of the Environment and Energy (the Department) commissioned Blue Environment – supported by Randell Environmental Consulting, Ascend Waste and Environment and others (the consultants) – to manage its waste data and reporting needs until 2019 (the project). The project outputs will include:
• hazardous waste data collations covering the calendar years 2016 and 2017 for reporting to the Basel Convention secretariat
• an updated Hazardous Waste Infrastructure Needs and Capacity Assessment
• the National Waste Report (NWR) 2018
• Hazardous Waste in Australia (HWiA) 2019
• one or more updates to the Australian Standard on Hazardous Waste Data and Reporting (BE et al. 2017).
Each of these outputs needs to build on previous versions, including the NWR 2016 (BE and REC 2017) and HWiA 2017 (BE and AWE 2017). An early project requirement was to research and propose improvements to the core waste reports, particularly the NWR. This draft report represents the outputs of the improvement considerations.
1.1 Improvements program method
The work program to explore potential areas of improvement involved:
• consultations with the states and territories, including workshops in each of the capitals
• industry and community consultations, including discussions with key stakeholders and an open internet-based survey
• a review of drivers and options for expanding the scope of wastes covered
• an in-house quality and issues review
• an in-house research program
• an international review conducted by the UK consultancy, Resource Futures
• a review of data presentation and visualisation options
• submission of an initial version of this report, including proposed improvements
• a workshop at the Department’s offices on 19 March 2018 and subsequent discussions
• submission of a revised report including the agreed improvements.
1.2 About this report
This report documents the method and outcomes of the improvements investigation, and documents the agreed improvements to national waste reporting. Following this introduction, a situation review describes the history and current status of national waste reporting, discusses why improvements are needed and canvasses potential areas of improvement. Section 3 describes the various investigations and their findings. Section 4 presents the agreed improvements.
Improving national waste data and reporting (revised v2)
Page 2
2 Situation review
To provide context for considering the improvements program, this section documents the history of national waste reporting, provides an overview of the most recent reports, discusses motivations for improvements and introduces potential areas of improvement.
2.1 History and processes
2.1.1 The National Waste Report
National waste reporting was first attempted in the 1990s to measure progress in implementing the 1992 National Waste Minimisation and Recycling Strategy. This first attempt had little success, mainly because the scope, categories and comprehensiveness of the data collected by each state and territory did not correspond to that in the proposed system and there was little appetite to change. During the 2000s, the Department commissioned several snapshots of national waste quantities. Data quality and comprehensiveness improved over time, but these differences meant that trends could not be readily compiled using these reports. There were concerns from the states and territories about the transparency of the data transformations used to create a common national platform. Following the release of the 2009 National Waste Policy, the Department started to develop a national waste data system. The first NWR was released in 2010 using 2006-07 data and the second in 2013 using 2010-11 data. In between these two reports, the Department commissioned a ‘method report’ to describe what data would be collected and how it would be transformed. This was applied in the NWR 2013, which was released with a calculation workbook so states and territories could see how their data had been transformed. Subsequently, a procedural document describing the whole process and a revised method was developed (REC and BE 2015). This was signed off by all the states and territories in mid-2015. Accompanying the document was a Microsoft Excel tool established to implement the agreed method, into which states and territories would enter their data and in which it would be transformed to standardised output tables and charts. On completion of the agreed method, process and tool, the available historical data was revisited and transformed to be consistent with the agreed approach, producing, in four separate tools, a historical record back to 2006-07. It was initially intended that the Department would develop a national waste data system for storing and querying the national data record over time, but this did not receive budgetary approval. The NWR 2016, released last year, covered two data years (2013-14 and 2014-15) and presented trends back to 2006-071. During preparation, some amendments were made to the tool and its presentational outputs and an additional worksheet was added to include national data and historical trends, imported from the earlier versions of the tool. There are now six annual versions of the tool using similar methods. These represent the national waste database. It is understood that the Department will continue to prepare the NWR every two years.
1 Waste quantities for 2007-08, 2011-12 and 2012-13 were interpolated as data was not collected in those years.
Improving national waste data and reporting (revised v2)
Page 3
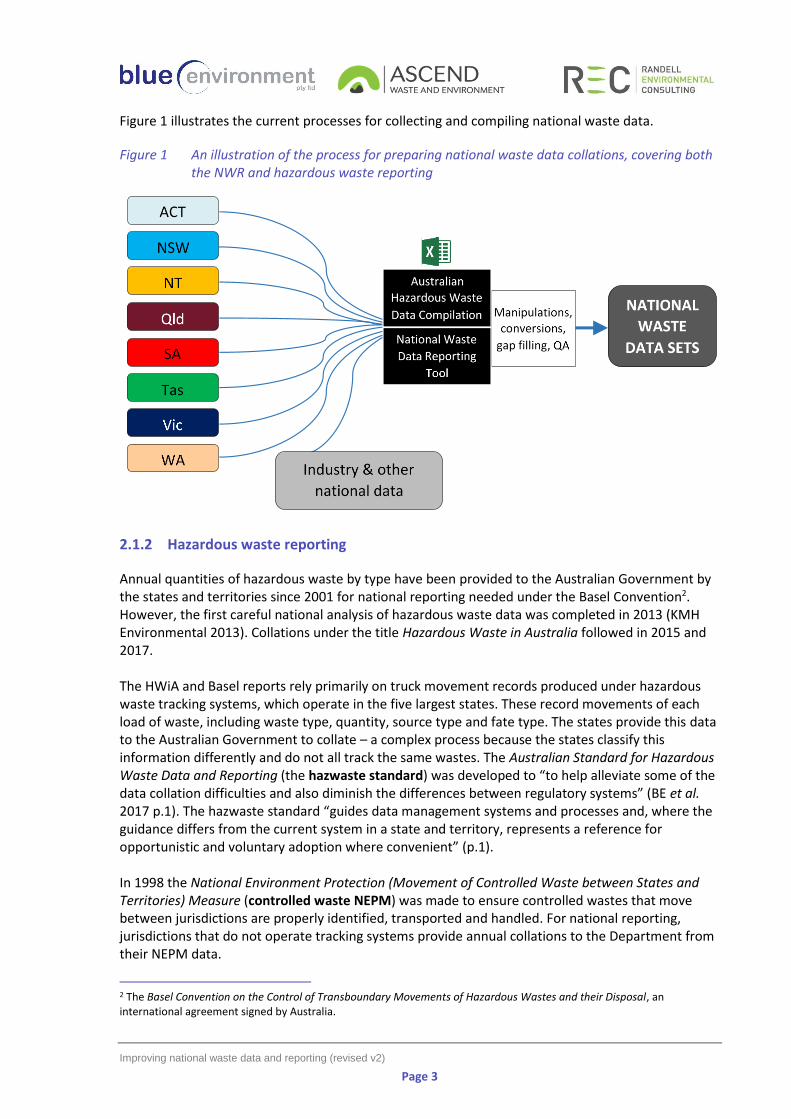
Figure 1 illustrates the current processes for collecting and compiling national waste data.
Figure 1 An illustration of the process for preparing national waste data collations, covering both the NWR and hazardous waste reporting
2.1.2 Hazardous waste reporting
Annual quantities of hazardous waste by type have been provided to the Australian Government by the states and territories since 2001 for national reporting needed under the Basel Convention2. However, the first careful national analysis of hazardous waste data was completed in 2013 (KMH Environmental 2013). Collations under the title Hazardous Waste in Australia followed in 2015 and 2017. The HWiA and Basel reports rely primarily on truck movement records produced under hazardous waste tracking systems, which operate in the five largest states. These record movements of each load of waste, including waste type, quantity, source type and fate type. The states provide this data to the Australian Government to collate – a complex process because the states classify this information differently and do not all track the same wastes. The Australian Standard for Hazardous Waste Data and Reporting (the hazwaste standard) was developed to “to help alleviate some of the data collation difficulties and also diminish the differences between regulatory systems” (BE et al. 2017 p.1). The hazwaste standard “guides data management systems and processes and, where the guidance differs from the current system in a state and territory, represents a reference for opportunistic and voluntary adoption where convenient” (p.1). In 1998 the National Environment Protection (Movement of Controlled Waste between States and Territories) Measure (controlled waste NEPM) was made to ensure controlled wastes that move between jurisdictions are properly identified, transported and handled. For national reporting, jurisdictions that do not operate tracking systems provide annual collations to the Department from their NEPM data.
2 The Basel Convention on the Control of Transboundary Movements of Hazardous Wastes and their Disposal, an international agreement signed by Australia.

Improving national waste data and reporting (revised v2)
Page 4
It is understood that the Department will continue to prepare HWiA every two years, alternating with the NWR. Figure 1 illustrates the current processes for collecting and compiling national waste data, including for hazardous waste.
2.2 Overviews of the recent reports
2.2.1 National Waste Report 2016
The NWR 2016 was a 72-page report released in August 20173. Its table of contents is duplicated in Figure 2. Most of the content is based on data provided by the states and territories, with some additional national and industry data. The data content was supplemented by discussion on current and emerging challenges. Peak industry bodies provided their perspectives, and most states and territories provided a page of text reflecting on their data.
Figure 2 Abbreviated table of contents of the National Waste Report 2016
The report covers waste generated in Australia, including solid non-hazardous materials and all hazardous wastes including liquids (effectively a summary of HWiA data). The report excludes waste from primary production activities (agriculture, mining and forestry), waste that is reused (such as via ‘tip shops’), pre-consumer waste that is recycled as part of a production process, and clean fill/soil (whether or not it is sent to landfill). The method for collecting, organising and reporting data is set out in Appendix A. This is consistent with the procedural document agreed by all jurisdictions in 2015, with a few minor amendments. Waste sources are considered in three streams: municipal solid waste (MSW) from households and council operations; commercial and industrial (C&I) waste from businesses and institutions; and construction and demolition (C&D) waste. Waste fates are categorised into three types: ‘disposal’, which overwhelmingly means landfill; ‘recycling’; and ‘energy recovery’, including from waste that generates landfill gas. Recycling and energy generation sum to ‘resource recovery’. Disposal and resource recovery sum to ‘waste generation’.
3 It was late due to a delay in receiving data from one of the jurisdictions and Australian Government concern over some of the content of Hazardous Waste in Australia 2017, which was to be released simultaneously.

Improving national waste data and reporting (revised v2)
Page 5
Wastes are categorised in the NWR 2016 as shown in Table 1.
Table 1 Waste categories and types analysed in the NWR 2016
* In recent national reporting, all biosolids are assumed to be contaminated and are included as a hazardous waste. For details on why this is the case, see HWiA 2017 (BE and AWE 2017).
Fifty-eight figures were used in the report, almost all of which were data charts. Two sample charts are presented below to show the general form used. Features of the charts are:
• use of stacked bar and stacked area charts with colour-coding of waste disposal, recycling and energy recovery, which sum to waste generation
• absolute data read from the left-hand y-axis and per capita rates read from the right
• presentation of the chart data (and associated data) immediately below the chart so as to be readable using the same x-axis
• resource recovery rates stated as percentages above the stacked bars and explained below the data table
Figure 3 Sample charts from the NWR 2016
Waste categories Waste types included in this category
Masonry materials Asphalt, bricks, concrete, rubble (including non-hazardous foundry sands), plasterboard and cement sheeting.
Metals Steel, aluminium, other non-ferrous metals.
Organics
Food, garden organics, timber, other organics, non-contaminated biosolids*. Excludes:
• paper, cardboard, leather, textiles and rubber (included in separate categories)
• except where specified, hazardous organic wastes (these are included in the ‘hazardous’ category).
Paper and cardboard
Liquid paperboard, newsprint and magazines, office paper.
Plastics PET (1), HDPE (2), PVC (3), LDPE (4), PP (5), PS (6), Other (7).
Glass
Other Leather and textiles, rubber excluding tyres, other unclassified wastes.
Hazardous
Acids; alkalis; inorganic chemicals; reactive chemicals; paints, resins, inks and organic sludges; organic solvents, pesticides, oils, putrescible/organic waste; organic chemicals; contaminated soils; asbestos; other soil/sludges (including contaminated biosolids)*; clinical and pharmaceutical; tyres; other miscellaneous.
Fly ash
Improving national waste data and reporting (revised v2)
Page 6
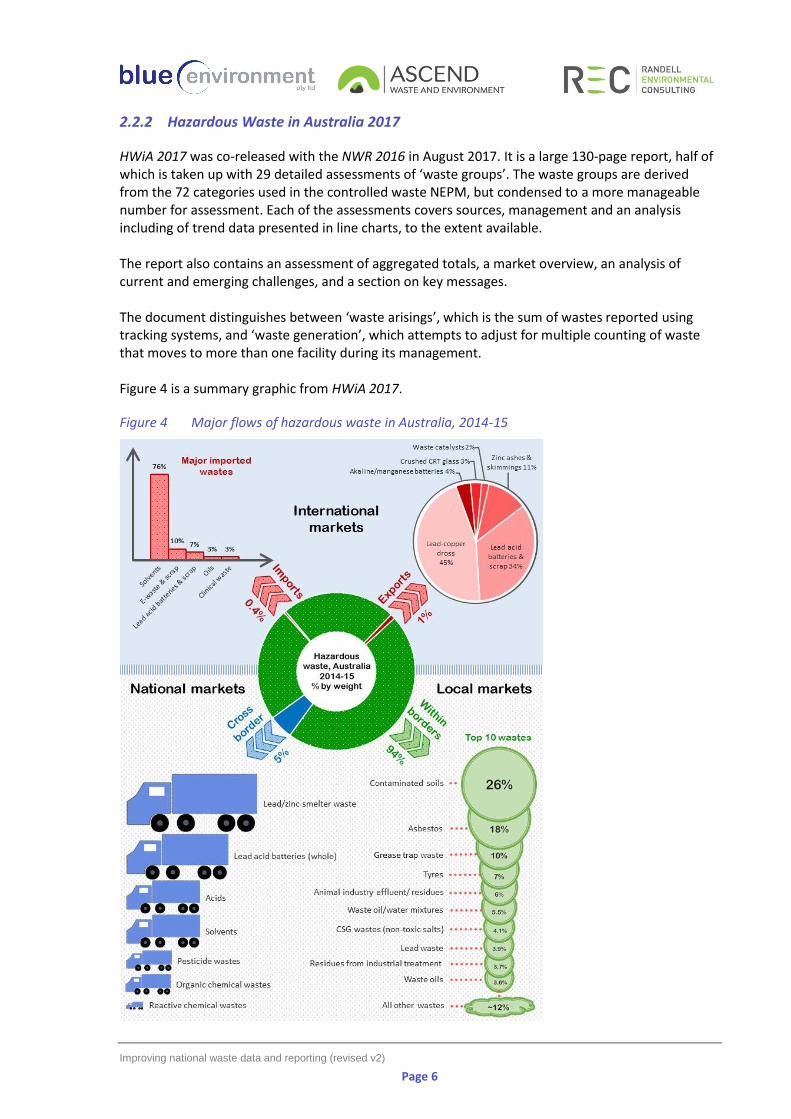
2.2.2 Hazardous Waste in Australia 2017
HWiA 2017 was co-released with the NWR 2016 in August 2017. It is a large 130-page report, half of which is taken up with 29 detailed assessments of ‘waste groups’. The waste groups are derived from the 72 categories used in the controlled waste NEPM, but condensed to a more manageable number for assessment. Each of the assessments covers sources, management and an analysis including of trend data presented in line charts, to the extent available. The report also contains an assessment of aggregated totals, a market overview, an analysis of current and emerging challenges, and a section on key messages. The document distinguishes between ‘waste arisings’, which is the sum of wastes reported using tracking systems, and ‘waste generation’, which attempts to adjust for multiple counting of waste that moves to more than one facility during its management. Figure 4 is a summary graphic from HWiA 2017.
Figure 4 Major flows of hazardous waste in Australia, 2014-15

Improving national waste data and reporting (revised v2)
Page 7
2.3 Motivations for improving
There are a number of motivations for improving national waste reporting:
• the Department’s project brief asked for improvements and suggested the following areas - principles of data quality such as scope, accuracy and timeliness - how best to integrate liquid and solid waste data into national reporting - the scope of data recorded as food waste
• the consultant’s experience, which led to proposals to - incorporate in the NWR 2018 wastes that are subject to product stewardship programs,
electronic waste (e-waste) and detailed data on organic wastes by type - undertake for HWiA 2019 an assessment of the proportions of each waste type in different
forms (solid, liquid, sludge)
• the recently increased profile of waste has led to an interest in providing more detail and better reporting
• stakeholder views and feedback, which suggested a few areas of improvement, including to support industry calls for harmonised definitions, classifications and reporting across the states and territories
• the prospect of conforming with the requirements of the System of Environmental-Economic Accounts (the SEEA, see Section 3.3)
• the need for better data warehousing in the context of the demise of the proposed national waste data system (discussed in Section 2.1.1)
• technological improvement and the potential for more sophisticated data visualisations.
2.4 Potential areas of improvement
Potential ways of improving the NWR include:
• expanding the scope, including the wastes covered, other waste information, the depth of the detail and discussion
• correcting errors, filling gaps and improving the historical record
• better expression of the degree of uncertainty
• realigning the warehousing of the new and data so that analysis is more automated (for quality assurance) and it is more easily accessed and analysed by third parties (governments, industry, consultants, etc.)
• ensuring the data visualisations are easy to interpret and consistent with best practice
• contributing to the national standardisation of waste data and reporting. There are also a number of ways in which HWiA could be improved. These potential areas of improvement were explored through various methods as discussed in Section 3. Specific agreed improvements are set out in Section 4.
Improving national waste data and reporting (revised v2)
Page 8
3 Investigation methods and findings
The following methods were used for exploring potential areas of improvement:
• consultations with the states and territories, including workshops in each capital canvassing options for harmonisation and improvement (Section 3.1)
• industry and community consultations, comprising a targeted survey of senior and expert stakeholders and an open internet-based survey (Section 3.2)
• a review of drivers and options for expanding the scope of wastes covered, covering earlier agreements and the SEEA, including how it applies to waste and its status in Australia (Section 3.3)
• a quality and issues analysis covering the most recent waste data used, the gap filling and assumptions applied to produce the nationally consistent data set, and the format of the current data sets (Sections 3.4 and 3.5)
• a research program with three aspects – a review of Australian landfill composition audits and how they compare with the national average used in the NWR 2016 for some jurisdictions; an examination of national data sets not used in the NWR 2016 that might be useful for inclusion or might influence the ways the NWR data is presented; and an examination of the availability of local government waste data (Section 3.6)
• an outsider’s view – an appraisal by Resource Futures of Australia’s waste data system and comparison with UK and other systems (Section 3.7)
• a study of best practice in data visualisation and its potential application to the NWR data set (Section 3.8).
The investigations and their findings are presented in the following sections.
3.1 Consultations with the states and territories
The consultants visited each of the state and territory capitals to facilitate a 2-3½ hour ‘improvements workshop’ to relevant government staff. The workshops involved a PowerPoint presentation that covered most of the issues presented in this report and focused discussion on pathways forward. The level of engagement was excellent. Workshop details are set out in Table 2.

Improving national waste data and reporting (revised v2)
Page 9
Table 2 Improvement workshop details
Jurisdiction and date
Attendees (consultants & Department)
Attendees
(jurisdiction)
ACT
21.11.17
Joe Pickin, Antonella Bates
Gayan Ratwatte, Anthony Haraldson, Petra Crowe, Alex Taylor, Dunstan Vanniasinghe (ACT NOWaste)
Des Clayton (EPA ACT)
NSW
7.12.17
Joe Pickin, Paul Starr
Sarah Sutton, Suyog Shrestha, Sara-Rose Pogson, John Klepetko, Rebecca
Murray, Brendan O’Keefe, Sarah Seery, Mildi Palmer (EPA NSW)
NT
13.12.17
Paul Randell, Paul Starr
Leonie Cooper, Fity Peehikuru, Kathleen Davis, Christopher Coombes (EPA NT)
Qld
15.1.18
Joe Pickin, Paul Starr
Sally Thomas, Rhiannon Stewart, Laurence Knight, Mark Hilton, Sylvie
Garner, Christopher Stewart, Esther Richards (Dep’t Environment &
Science)
SA
12.12.17
Paul Randell, Paul Starr
John Vanzo, Alexandra Davis, Vaughan Levitzke (Green Industries SA);
Kylie McLeod, Steven Sergi (EPA SA)
Tas
4.12.17
Paul Randell, Paul Starr
Alasdair Wells, Jaimie Clarke, Brad Arkell, Tammy Miller (EPA Tas)
Vic
20.11.17
Joe Pickin, Geoff Latimer, Paul Starr, Antonella Bates
Julie Pearce (Dep’t of the Environment, Land Water and Planning)
Guy Pritchard, Nick Chrisant, James Walters, Tracey Jackson, Gustavo Recaman, Marcus Fogarty (Sustainability Victoria)
Mark Bannister, Danielle Minerve, Carolina Marcosbolanos, Matthew Johnson (EPA Vic)
WA
17.11.17
Joe Pickin, Paul Starr
Corina Williums, Julie Wyland, Simon Vieira, Kristie Wilson, Katie Needham (Dep’t of Water and Environmental Regulation)
Finding 1
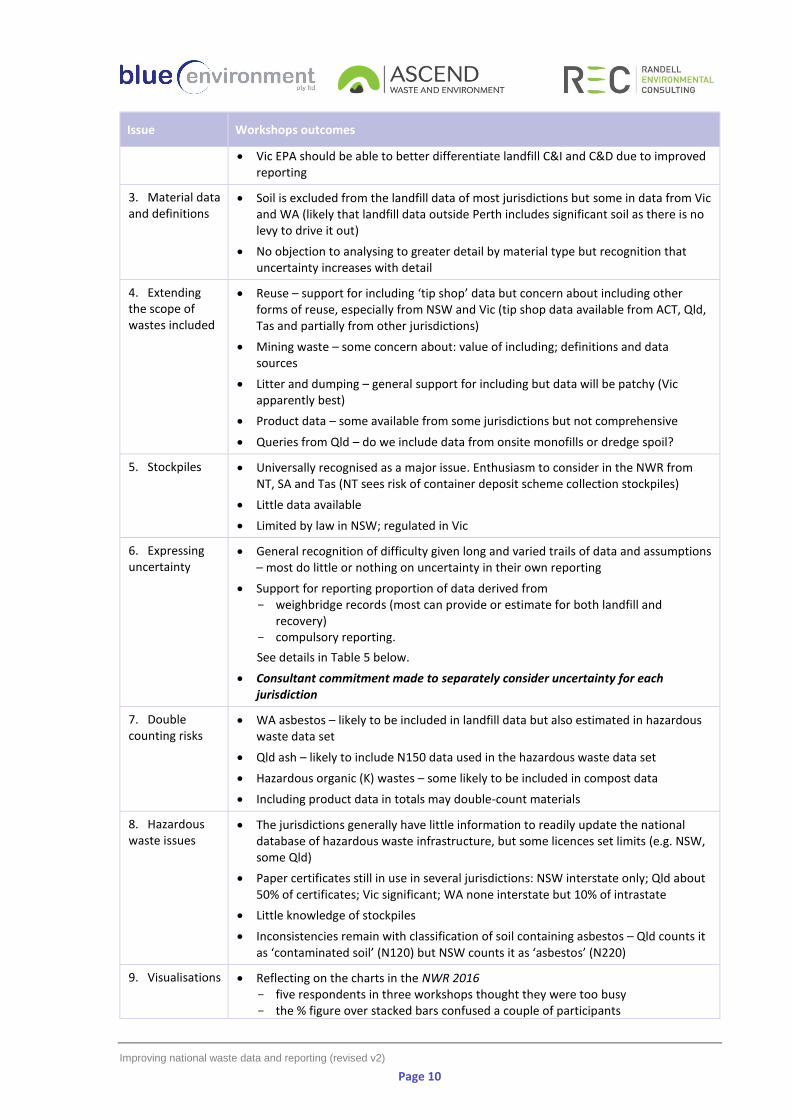
A summary of the main workshop outcomes is given below.
Table 3 Summary of the main outcomes of the improvement workshops
Issue Workshops outcomes
1. Recovery data and definitions
• Significant concerns about data and variability in definitions applied in jurisdictional reporting – see Table 4 below
• Concern from NSW and WA that significant quantities of waste processed on-site for recovery may be overlooked e.g. asphalt
2. Stream data and definitions
• For most jurisdictions MSW = domestic + council waste
• Some waste from domestic sources is recorded as C&I or C&D (e.g. skip bins)
• Skip bins are C&D in NSW but C&I in SA and likely to be mostly C&I in Vic and WA
• Most jurisdictions include some C&D materials as MSW (e.g. council roadworks) but NSW and Qld do not
• Neither ACT nor Qld collect recycling data by stream but both able to estimate
• Stream allocation of disaster waste is uncertain
Improving national waste data and reporting (revised v2)
Page 10
Issue Workshops outcomes
• Vic EPA should be able to better differentiate landfill C&I and C&D due to improved reporting
3. Material data and definitions
• Soil is excluded from the landfill data of most jurisdictions but some in data from Vic and WA (likely that landfill data outside Perth includes significant soil as there is no levy to drive it out)
• No objection to analysing to greater detail by material type but recognition that uncertainty increases with detail
4. Extending the scope of wastes included
• Reuse – support for including ‘tip shop’ data but concern about including other forms of reuse, especially from NSW and Vic (tip shop data available from ACT, Qld, Tas and partially from other jurisdictions)
• Mining waste – some concern about: value of including; definitions and data sources
• Litter and dumping – general support for including but data will be patchy (Vic apparently best)
• Product data – some available from some jurisdictions but not comprehensive
• Queries from Qld – do we include data from onsite monofills or dredge spoil?
5. Stockpiles • Universally recognised as a major issue. Enthusiasm to consider in the NWR from NT, SA and Tas (NT sees risk of container deposit scheme collection stockpiles)
• Little data available
• Limited by law in NSW; regulated in Vic
6. Expressing uncertainty
• General recognition of difficulty given long and varied trails of data and assumptions – most do little or nothing on uncertainty in their own reporting
• Support for reporting proportion of data derived from - weighbridge records (most can provide or estimate for both landfill and
recovery) - compulsory reporting.
See details in Table 5 below.
• Consultant commitment made to separately consider uncertainty for each jurisdiction
7. Double counting risks
• WA asbestos – likely to be included in landfill data but also estimated in hazardous waste data set
• Qld ash – likely to include N150 data used in the hazardous waste data set
• Hazardous organic (K) wastes – some likely to be included in compost data
• Including product data in totals may double-count materials
8. Hazardous waste issues
• The jurisdictions generally have little information to readily update the national database of hazardous waste infrastructure, but some licences set limits (e.g. NSW, some Qld)
• Paper certificates still in use in several jurisdictions: NSW interstate only; Qld about 50% of certificates; Vic significant; WA none interstate but 10% of intrastate
• Little knowledge of stockpiles
• Inconsistencies remain with classification of soil containing asbestos – Qld counts it as ‘contaminated soil’ (N120) but NSW counts it as ‘asbestos’ (N220)
9. Visualisations • Reflecting on the charts in the NWR 2016 - five respondents in three workshops thought they were too busy - the % figure over stacked bars confused a couple of participants

Improving national waste data and reporting (revised v2)
Page 11
Issue Workshops outcomes
• Participants generally advised - keep it simple - ensure visualisations work in black-and-white - include Sankey diagrams and infographics
• Other comments - unhappiness with the colour scheme expressed in SA - unhappiness with the with/without fly ash layout expressed in WA - Vic movement of data online has resulted in significantly higher apparent usage
10. NWR timing • No major complaints about the proposed quicker timing
• Data risks: NSW (NWR data requires ministerial sign-off); Qld regulated waste data (processing backlog)
• Consultant commitment made not to estimate data unless outside the agreed timeframe
11. National standard for non-hazardous waste data and reporting
• Some concerns, especially from attendees involved in regulation, about the potential scale of the task and risks to jurisdictions (e.g. reference in enforcement activities, confusion where national definitions vary from jurisdictional definitions)
• Underlying support for some initiative, and strong support from some
• Much of the concern was mollified by reference to a ‘this is where we want to get to’ type of document
• Could include standard densities, definitions of resource recovery, diversion, etc.
12. Other • Inter-jurisdictional transfers of non-hazardous waste are poorly recorded, leading to errors in comparisons of jurisdictional generation and recovery rates e.g. Vic imports recyclables (major export of landfill waste from NSW to Qld is well recorded)
• We may be missing some energy recovery via co-burning of waste in coal-fired power stations in NSW – other jurisdictions?
• Text contributions to the NWR universally seen as both burdensome and worthwhile
• China closure is a major issue and must be discussed
• Tas has large gap in C&D data because can be used as ‘fill’ – can maybe estimate
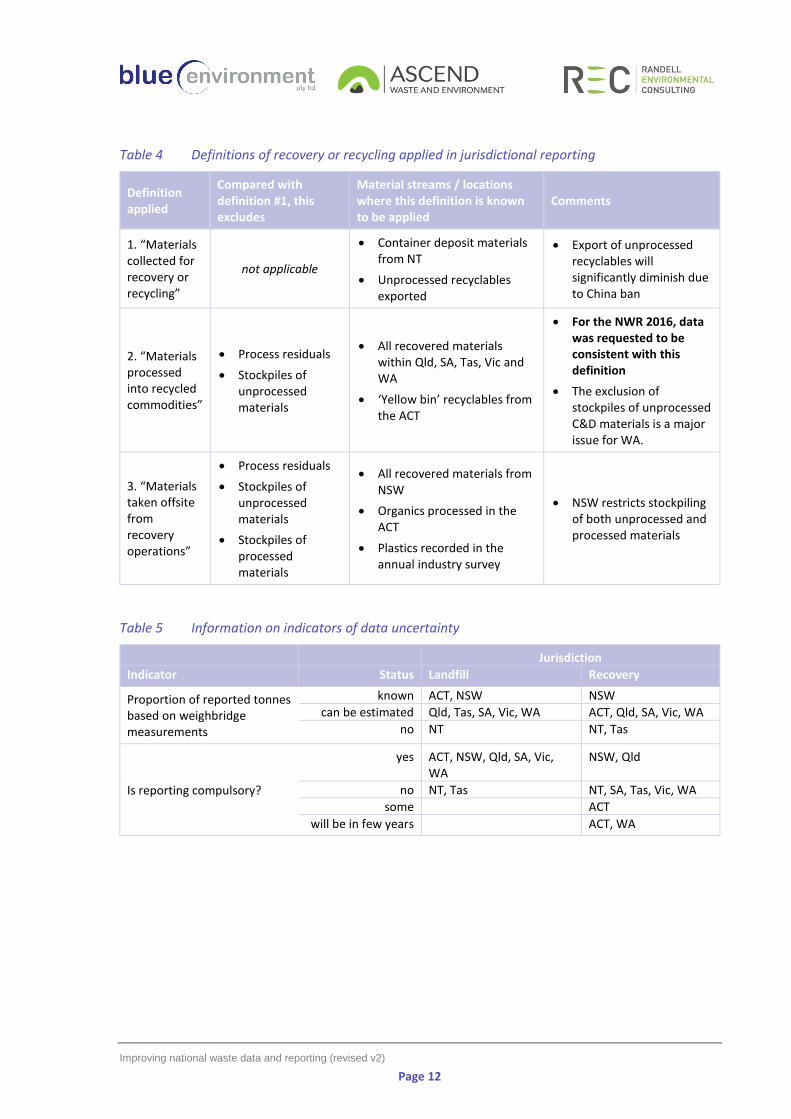
The tables overleaf follow from the workshops’ outcomes. Table 4 follows from issue no. 1; Table 5 follows from issue no. 6.
Improving national waste data and reporting (revised v2)
Page 12
Table 4 Definitions of recovery or recycling applied in jurisdictional reporting
Definition applied
Compared with definition #1, this excludes
Material streams / locations where this definition is known to be applied
Comments
1. “Materials collected for recovery or recycling”
not applicable
• Container deposit materials from NT
• Unprocessed recyclables exported
• Export of unprocessed recyclables will significantly diminish due to China ban
2. “Materials processed into recycled commodities”
• Process residuals
• Stockpiles of unprocessed materials
• All recovered materials within Qld, SA, Tas, Vic and WA
• ‘Yellow bin’ recyclables from the ACT
• For the NWR 2016, data was requested to be consistent with this definition
• The exclusion of stockpiles of unprocessed C&D materials is a major issue for WA.
3. “Materials taken offsite from recovery operations”
• Process residuals
• Stockpiles of unprocessed materials
• Stockpiles of processed materials
• All recovered materials from NSW
• Organics processed in the ACT
• Plastics recorded in the annual industry survey
• NSW restricts stockpiling of both unprocessed and processed materials
Table 5 Information on indicators of data uncertainty
Jurisdiction
Indicator Status Landfill Recovery
Proportion of reported tonnes based on weighbridge measurements
known ACT, NSW NSW
can be estimated Qld, Tas, SA, Vic, WA ACT, Qld, SA, Vic, WA
no NT NT, Tas
Is reporting compulsory?
yes ACT, NSW, Qld, SA, Vic, WA
NSW, Qld
no NT, Tas NT, SA, Tas, Vic, WA
some ACT
will be in few years ACT, WA
Improving national waste data and reporting (revised v2)
Page 13
3.2 Consultations with industry and community
3.2.1 Targeted stakeholders
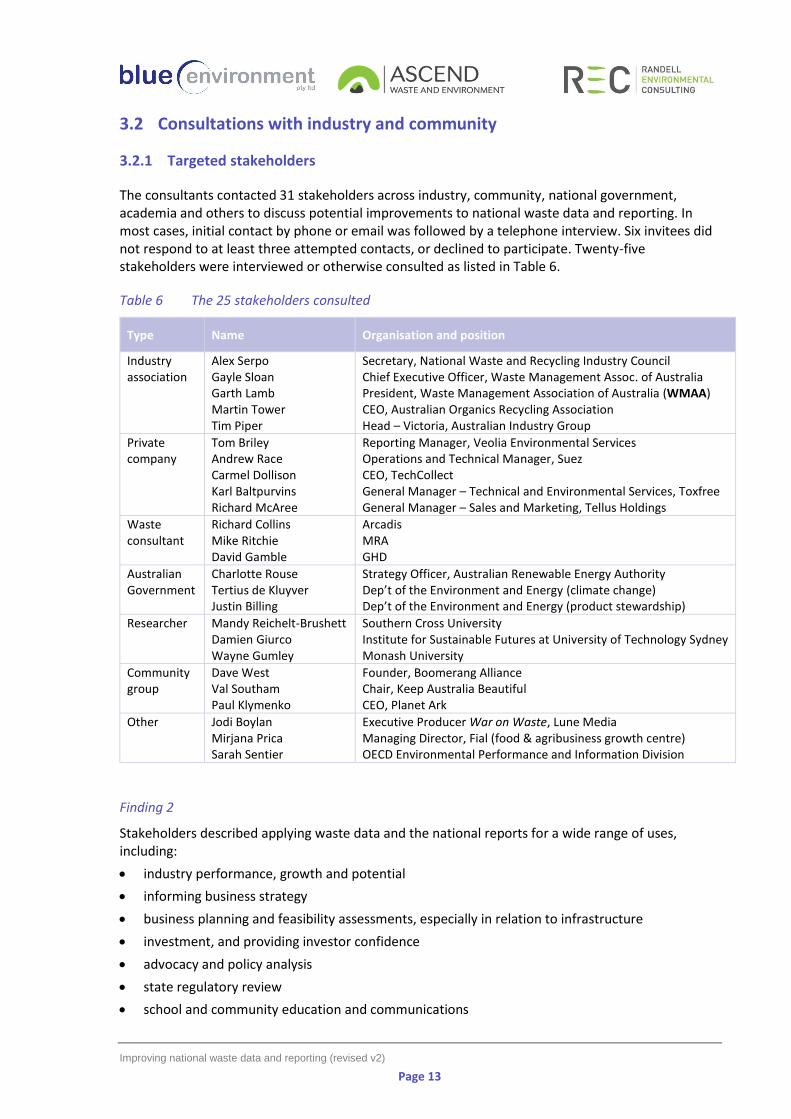
The consultants contacted 31 stakeholders across industry, community, national government, academia and others to discuss potential improvements to national waste data and reporting. In most cases, initial contact by phone or email was followed by a telephone interview. Six invitees did not respond to at least three attempted contacts, or declined to participate. Twenty-five stakeholders were interviewed or otherwise consulted as listed in Table 6.
Table 6 The 25 stakeholders consulted
Type Name Organisation and position
Industry association
Alex Serpo Gayle Sloan Garth Lamb Martin Tower Tim Piper
Secretary, National Waste and Recycling Industry Council Chief Executive Officer, Waste Management Assoc. of Australia President, Waste Management Association of Australia (WMAA) CEO, Australian Organics Recycling Association Head – Victoria, Australian Industry Group
Private company
Tom Briley Andrew Race Carmel Dollison Karl Baltpurvins Richard McAree
Reporting Manager, Veolia Environmental Services Operations and Technical Manager, Suez CEO, TechCollect General Manager – Technical and Environmental Services, Toxfree General Manager – Sales and Marketing, Tellus Holdings
Waste consultant
Richard Collins Mike Ritchie David Gamble
Arcadis MRA GHD
Australian Government
Charlotte Rouse Tertius de Kluyver Justin Billing
Strategy Officer, Australian Renewable Energy Authority Dep’t of the Environment and Energy (climate change) Dep’t of the Environment and Energy (product stewardship)
Researcher Mandy Reichelt-Brushett Damien Giurco Wayne Gumley
Southern Cross University Institute for Sustainable Futures at University of Technology Sydney Monash University
Community group
Dave West Val Southam Paul Klymenko
Founder, Boomerang Alliance Chair, Keep Australia Beautiful CEO, Planet Ark
Other Jodi Boylan Mirjana Prica Sarah Sentier
Executive Producer War on Waste, Lune Media Managing Director, Fial (food & agribusiness growth centre) OECD Environmental Performance and Information Division
Finding 2
Stakeholders described applying waste data and the national reports for a wide range of uses, including:
• industry performance, growth and potential
• informing business strategy
• business planning and feasibility assessments, especially in relation to infrastructure
• investment, and providing investor confidence
• advocacy and policy analysis
• state regulatory review
• school and community education and communications
Improving national waste data and reporting (revised v2)
Page 14
• prompts and sources for academic research
• understanding government and industry views on the health of the market
• comparing performance across states and territories
• comparing Australia’s performance with other countries. The level of engagement was excellent and responses were generally positive about most aspects of the report. Selected positive comments (paraphrased) are presented below with the organisation that the commentator represented:
• ‘the National Waste Report is the bible for us’
• ‘the environment sector is more than happy with where national waste reporting is going’
• ‘the data and reports are very well regarded by industry due to the transparency provided and the depth of the workbooks’
• ‘Hazardous Waste in Australia is a vitally important resource for our business planning and development’.
Less positive comments on the NWR 2016 included:
• ‘we need far more detail to get value out of it’
• ‘the timing needs to be improved/is embarrassing’
• ‘it is ridiculous to show landfill waste as recovered just because it generates energy’
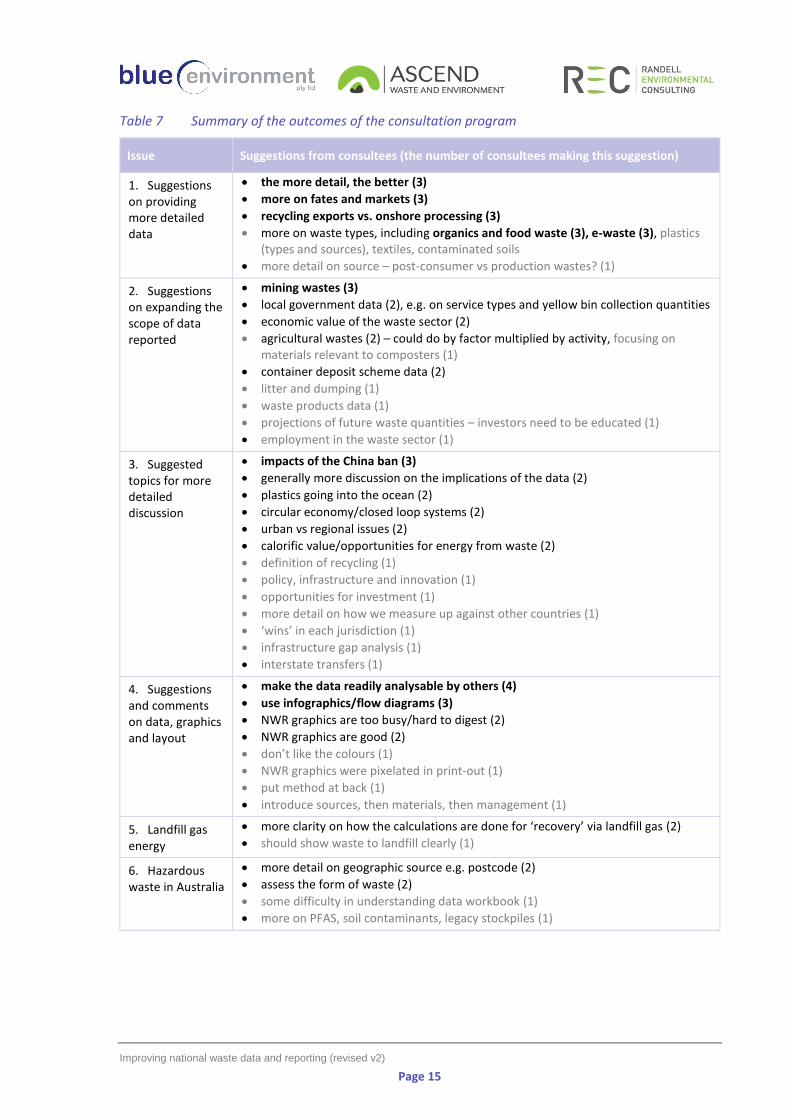
• ‘need to work on tools to improve the useability of the data’. Table 7 summarises the outcomes of the stakeholder consultation program. Ideas known to be unachievable or well out of the scope of the project are excluded.
Improving national waste data and reporting (revised v2)
Page 15
Table 7 Summary of the outcomes of the consultation program
Issue Suggestions from consultees (the number of consultees making this suggestion)
1. Suggestions on providing more detailed data
• the more detail, the better (3)
• more on fates and markets (3)
• recycling exports vs. onshore processing (3)
• more on waste types, including organics and food waste (3), e-waste (3), plastics (types and sources), textiles, contaminated soils
• more detail on source – post-consumer vs production wastes? (1)
2. Suggestions on expanding the scope of data reported
• mining wastes (3)
• local government data (2), e.g. on service types and yellow bin collection quantities
• economic value of the waste sector (2)
• agricultural wastes (2) – could do by factor multiplied by activity, focusing on materials relevant to composters (1)
• container deposit scheme data (2)
• litter and dumping (1)
• waste products data (1)
• projections of future waste quantities – investors need to be educated (1)
• employment in the waste sector (1)
3. Suggested topics for more detailed discussion
• impacts of the China ban (3)
• generally more discussion on the implications of the data (2)
• plastics going into the ocean (2)
• circular economy/closed loop systems (2)
• urban vs regional issues (2)
• calorific value/opportunities for energy from waste (2)
• definition of recycling (1)
• policy, infrastructure and innovation (1)
• opportunities for investment (1)
• more detail on how we measure up against other countries (1)
• ‘wins’ in each jurisdiction (1)
• infrastructure gap analysis (1)
• interstate transfers (1)
4. Suggestions and comments on data, graphics and layout
• make the data readily analysable by others (4)
• use infographics/flow diagrams (3)
• NWR graphics are too busy/hard to digest (2)
• NWR graphics are good (2)
• don’t like the colours (1)
• NWR graphics were pixelated in print-out (1)
• put method at back (1)
• introduce sources, then materials, then management (1)
5. Landfill gas energy
• more clarity on how the calculations are done for ‘recovery’ via landfill gas (2)
• should show waste to landfill clearly (1)
6. Hazardous waste in Australia
• more detail on geographic source e.g. postcode (2)
• assess the form of waste (2)
• some difficulty in understanding data workbook (1)
• more on PFAS, soil contaminants, legacy stockpiles (1)

Improving national waste data and reporting (revised v2)
Page 16
Interesting comments included:
• ‘trend data is particularly important’
• ‘include everything (e.g. CDS, APCO data) so we need only one central reference’
• ‘state reporting is problematic for national bodies because different definitions are used – we need national standards’
• ‘the current lag and lack of cohesion among the states are very frustrating’
• ‘the report should stick to reporting standard waste streams at the macro-level in standard ways so it is not held up by less important matters’
• ‘the industry perspectives section didn’t say much – too general’
• ‘can we talk about ‘resources’ rather than ‘waste’?’
• ‘the apparent decline in MSW per capita could be partially explained by shift to C&I, such as through increases in use of skip bins, multi-unit dwellings, fly-in fly-out mining and similar’
• ‘report with more clarity that an ‘unknown’ portion tends to exaggerate the recovery rate – i.e. litter, dumping, stockpiling, fraudulent export of e-waste, process losses in recycling operations (dust, carbon dioxide)’ .
Other outcomes of the consultation program:
1. There was a suggestion that the Australian Local Government Association should be asked to make a contribution.
2. There was an offer that the Boomerang Alliance could make a contribution on behalf of the environment movement.
3.2.2 Open survey
An open internet-based survey was established using SurveyMonkey and advertised through WMAA’s eNEWS and the digital news versions of the industry journals Inside Waste and Waste Management Review. Only seven responses were received, some of which said little.
Finding 3
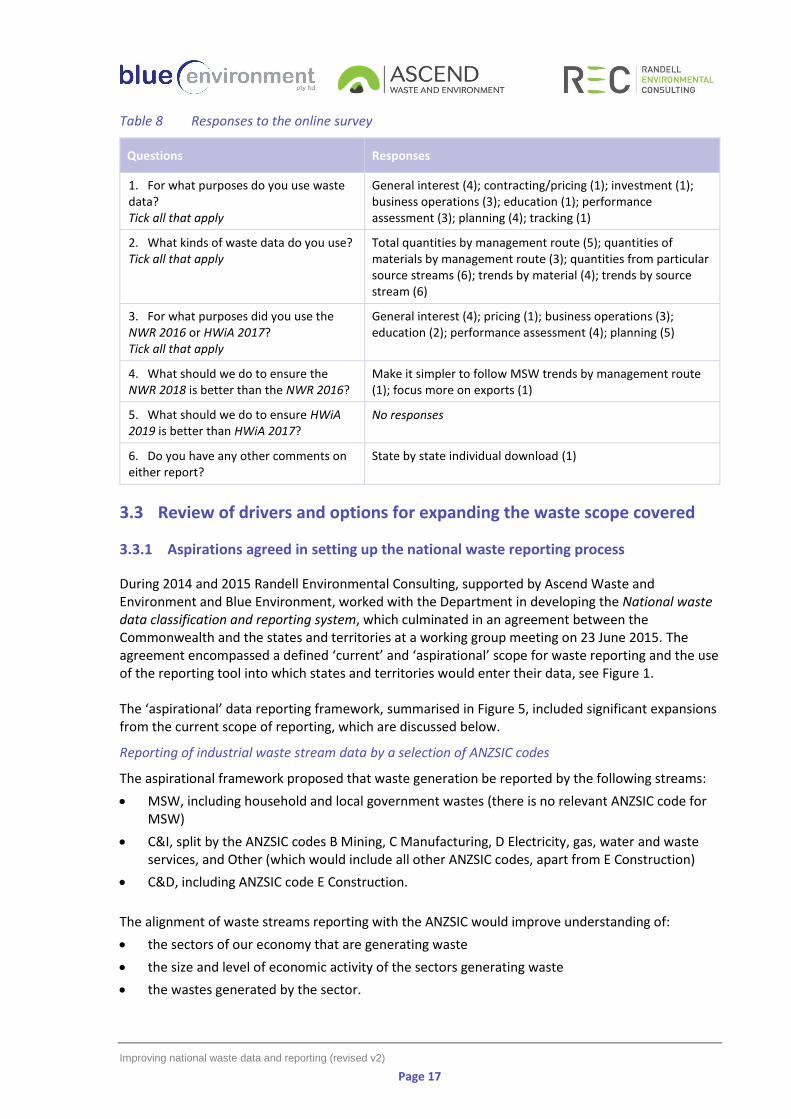
Questions and responses are summarised overleaf.
Improving national waste data and reporting (revised v2)
Page 17
Table 8 Responses to the online survey
Questions Responses
1. For what purposes do you use waste data? Tick all that apply
General interest (4); contracting/pricing (1); investment (1); business operations (3); education (1); performance assessment (3); planning (4); tracking (1)
2. What kinds of waste data do you use? Tick all that apply
Total quantities by management route (5); quantities of materials by management route (3); quantities from particular source streams (6); trends by material (4); trends by source stream (6)
3. For what purposes did you use the NWR 2016 or HWiA 2017? Tick all that apply
General interest (4); pricing (1); business operations (3); education (2); performance assessment (4); planning (5)
4. What should we do to ensure the NWR 2018 is better than the NWR 2016?
Make it simpler to follow MSW trends by management route (1); focus more on exports (1)
5. What should we do to ensure HWiA 2019 is better than HWiA 2017?
No responses
6. Do you have any other comments on either report?
State by state individual download (1)
3.3 Review of drivers and options for expanding the waste scope covered
3.3.1 Aspirations agreed in setting up the national waste reporting process
During 2014 and 2015 Randell Environmental Consulting, supported by Ascend Waste and Environment and Blue Environment, worked with the Department in developing the National waste data classification and reporting system, which culminated in an agreement between the Commonwealth and the states and territories at a working group meeting on 23 June 2015. The agreement encompassed a defined ‘current’ and ‘aspirational’ scope for waste reporting and the use of the reporting tool into which states and territories would enter their data, see Figure 1. The ‘aspirational’ data reporting framework, summarised in Figure 5, included significant expansions from the current scope of reporting, which are discussed below.
Reporting of industrial waste stream data by a selection of ANZSIC codes
The aspirational framework proposed that waste generation be reported by the following streams:
• MSW, including household and local government wastes (there is no relevant ANZSIC code for MSW)
• C&I, split by the ANZSIC codes B Mining, C Manufacturing, D Electricity, gas, water and waste services, and Other (which would include all other ANZSIC codes, apart from E Construction)
• C&D, including ANZSIC code E Construction.
The alignment of waste streams reporting with the ANZSIC would improve understanding of:
• the sectors of our economy that are generating waste
• the size and level of economic activity of the sectors generating waste
• the wastes generated by the sector.

Improving national waste data and reporting (revised v2)
Page 18
Waste data needs to provide a ‘fine enough’ level of detail regarding the source of generation. Alignment of waste streams reporting to ANZSIC codes would enable comparison of the level of economic activity by ANZSIC industry divisions with levels of waste generation. This would provide a useful indicator for industries that have opportunities for improvements in industrial efficiency and also enable better measurement of the effectiveness of materials efficiency programs.
Mining sector wastes are often reported internationally (UK, EuroStat, USA, Germany, OECD all
report mining waste). Mining is a major part of our economy and it is reasonable to report this as a
subset to C&I waste. The inclusion of mining waste would require an adjustment to M8: Wastes
generated by the core processes of primary production are excluded from national waste reporting.4
Where the mining sector generates wastes that are disposed, recycled, or recovered for energy and
the wastes are readily quantifiable it seems reasonable that the waste be included in the NWR. Note,
mining ‘overburden’ or soils would not be included as per M12: Clean fill/soils/rock data is excluded
from the national waste data reporting. The focus would be on ore processing (including tailings)
and smelting wastes.
The aspirational scope also included the separate reporting (within the C&I stream) of ANZSIC codes
C Manufacturing, and D Electricity, gas, water and waste services. These still appear to be the most
reasonable codes to report within the C&I stream as they are often reported in other countries and
will all have significant waste entering the waste management system; we should be able to
estimate flows from each of these sectors.
The reporting of waste generation by MSW, C&I (by B Mining, C Manufacturing, D Electricity, gas, water and waste services, and Other) and C&D (ANZSIC code E Construction) streams was discussed again and agreed to at the project inception workshop.
Reporting on all liquid wastes in the NWR
In 2011, DoEE commissioned Hyder Consulting to complete a liquid waste assessment (Hyder Consulting 2011) report which provided an account of liquid waste generation in Australia. Whilst the report identified some significant gaps in Australia’s liquid waste reporting, it also illustrated a significant amount of liquid waste data is readily available from states and territories. The report suggested that non-hazardous liquid waste data be included in national waste data reporting in future. In 2015, the merit of reporting all liquid wastes5 in the NWR was agreed, and all liquid wastes were included in the ‘aspirational’ scope. The inclusion of all liquid waste was discussed again at the project inception workshop. It was agreed that we should look to include this expanded scope in the 2018 NWR in a separate report section, as illustrated in Figure 5. The Bureau of Meteorology now publishes an Urban national performance report (e.g. BoM 2017) which would be the main reference for nonhazardous liquid wastes. There would be some overlap in public reporting between the Bureau’s reporting and the NWR.
4 Note we currently do report some mining waste within the hazardous waste data (e.g. red mud and CSG waste), so this exclusion is currently not a complete exclusion.
5 Currently only hazardous liquid wastes are reported.

Improving national waste data and reporting (revised v2)
Page 19
Figure 5 Aspirational national waste data reporting parameters agreed with the states and territories 2014-15
Source: REC and BE (2015)
* B Mining waste is primary production and is not currently reported by jurisdictions with the exception of Qld. Qld includes some wastes landfilled onsite at mining sites and at industrial on-site landfills (referred to as ‘monofills’ in Qld) that would otherwise be disposed of at council or commercial landfills in its C&I, C&D and regulated waste figures.
3.3.2 An examination of the System of Environmental-Economic Accounting
The United Nation’s System of Environmental-Economic Accounting (SEEA) Central Framework is a conceptual framework that describes the interaction between the economy and the environment and the stocks and changes in stocks of environmental assets. The SEEA applies the same accounting concepts, structures, rules and principles and the System of National Accounts (which is the basis for gross domestic product estimates) to environmental information. Features of the SEEA Central Framework relevant to the national waste reporting include the physical flow accounts which include:
• physical supply and use tables
Waste streams data
Excluding primary production waste except
mining waste
C&D
E: Construction
(includes demolition)
C&I
B Mining*
C Manufacturing
D Electricity, gas, water and waste
services
Other ANZSIC Divisions
MSW
Household
Local Government
Waste material flow
Materials types are included within material categories
Liquid Waste Reporting Categories
Sewage
Trade waste
Waste Products
As required to support product stewardship reporting
Waste generation (measured)
Reporting: • tonnes and per capita• GDP/GSP vs waste gen• waste gen vs number of jobs in waste management
Disposal
Res
ou
rce
Re
cove
ry
(RR
)
Recycling
Recovery of Energy (RoE)
Masonry Materials
Organics
Plastics
Paper
Metals
Glass
Textiles
Hazardous Note: not a material
category however requires
separate reporting
Solid and liquid Waste Reporting
Solid Waste ReportingMaterial Categories
Masonry Materials
Organics
Plastics
Paper
Metals
Glass
Other
Hazardous Not a material category however
requires separate reporting
Includes fly ash (reported as sub total)

Improving national waste data and reporting (revised v2)
Page 20
• the solid waste account, which includes waste generation, the management of solid waste to recycling facilities, to controlled landfills or directly to the environment
• economy-wide material flow accounts, which provide an overview (tonnes) of material inputs and outputs for the economy, including inputs from the environment, outputs to the environment, and the physical amounts of imports and exports.
The Australian Bureau of Statistics (ABS) have recently published their latest reporting to SEEA (ABS 2017). This provides the framework that ABS currently use, and will continue to use in some similar form in future. In reporting to the SEEA the ABS reported on waste generation by the following streams:
• agriculture, forestry (excluding fishing)
• mining (excluding mineral waste)
• manufacturing
• electricity, gas, water and waste management services (includes waste collection, treatment and disposal services (ANZSIC Division D, subdivision 29)
• construction
• all other industries (includes ANZSIC Divisions F-S, excluding classification 7530)
• public administration
• households
• imports.
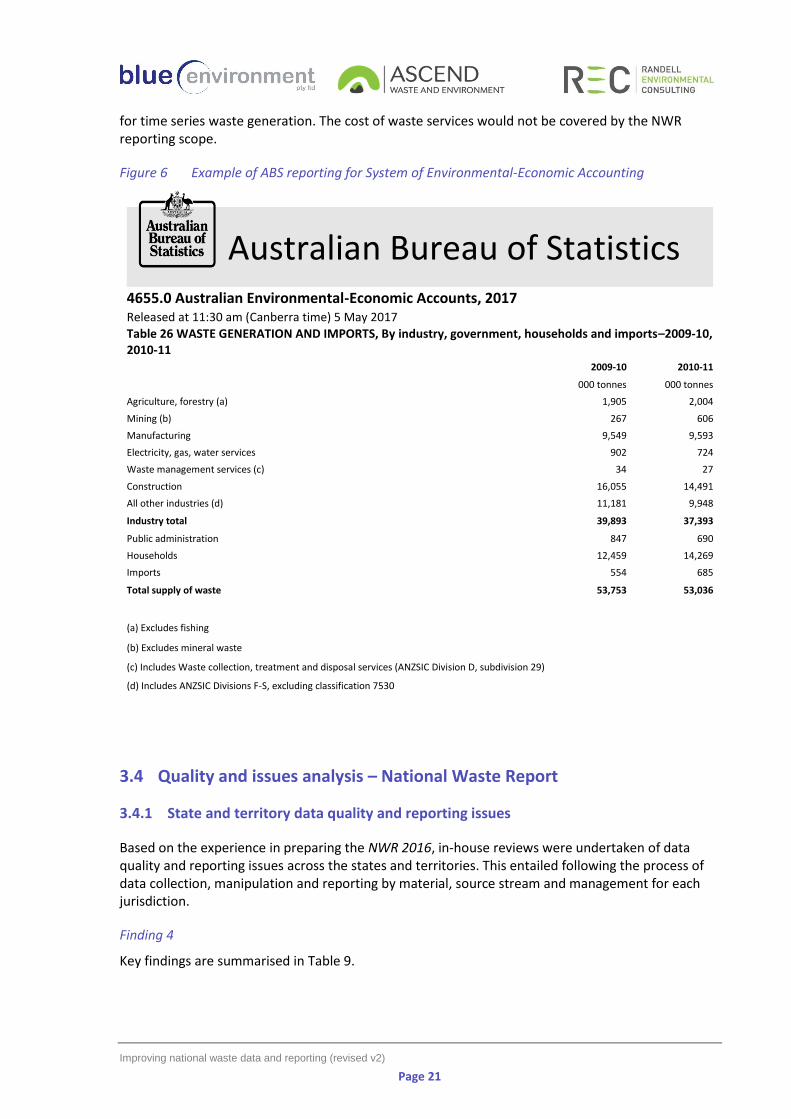
Review of the ABS reporting for SEEA found that the main waste parameters for reporting were:
• time series waste generation
• expenditure on waste services. The ABS reporting for SEEA produces a standard set of tables. Tables 1 and 26 are the most relevant. Table 26 is included for reference as Figure 6. The footnotes to Table 26 are important. The exclusion of ‘mineral waste’ appears to exclude the bulk of ore processing (including tailings) which would be the bulk of the waste generated by the mining sector. With the inclusion of the aspirational reporting scope, discussed above, mineral waste would not be excluded from the mining sector reporting in the 2018 NWR. The aspirational NWR scope, proposed to be implemented in 2018, covers all of the industry sectors that ABS are currently reporting to SEEA apart from agriculture, forestry. In the aspirational scope, we recognised that we should report on wastes that are sent to the fates of recycling, energy recovery and disposal, where data is available to support reporting. This includes on-site or off-site waste management, and waste from any generating sectors. There seems to be limited value in reporting the NWR fates for the agriculture6, forestry sectors as data will be very limited in coverage and it is questionable if much of the materials generated by this sector are a waste as defined for the NWR. Apart from inconsistences with mining and agriculture, forestry, with the inclusion of the aspirational reporting scope, discussed above, the scope of NWR reporting would meet the SEEA reporting needs
6 A small exception to this analysis is addressed at the foot of Table 19.
Improving national waste data and reporting (revised v2)
Page 21
for time series waste generation. The cost of waste services would not be covered by the NWR reporting scope.
Figure 6 Example of ABS reporting for System of Environmental-Economic Accounting
Australian Bureau of Statistics
4655.0 Australian Environmental-Economic Accounts, 2017 Released at 11:30 am (Canberra time) 5 May 2017
Table 26 WASTE GENERATION AND IMPORTS, By industry, government, households and imports–2009-10, 2010-11 2009-10 2010-11
000 tonnes 000 tonnes
Agriculture, forestry (a) 1,905 2,004
Mining (b) 267 606
Manufacturing 9,549 9,593
Electricity, gas, water services 902 724
Waste management services (c) 34 27
Construction 16,055 14,491
All other industries (d) 11,181 9,948
Industry total 39,893 37,393
Public administration 847 690
Households 12,459 14,269
Imports 554 685
Total supply of waste 53,753 53,036
(a) Excludes fishing
(b) Excludes mineral waste
(c) Includes Waste collection, treatment and disposal services (ANZSIC Division D, subdivision 29)
(d) Includes ANZSIC Divisions F-S, excluding classification 7530
3.4 Quality and issues analysis – National Waste Report
3.4.1 State and territory data quality and reporting issues
Based on the experience in preparing the NWR 2016, in-house reviews were undertaken of data quality and reporting issues across the states and territories. This entailed following the process of data collection, manipulation and reporting by material, source stream and management for each jurisdiction.
Finding 4
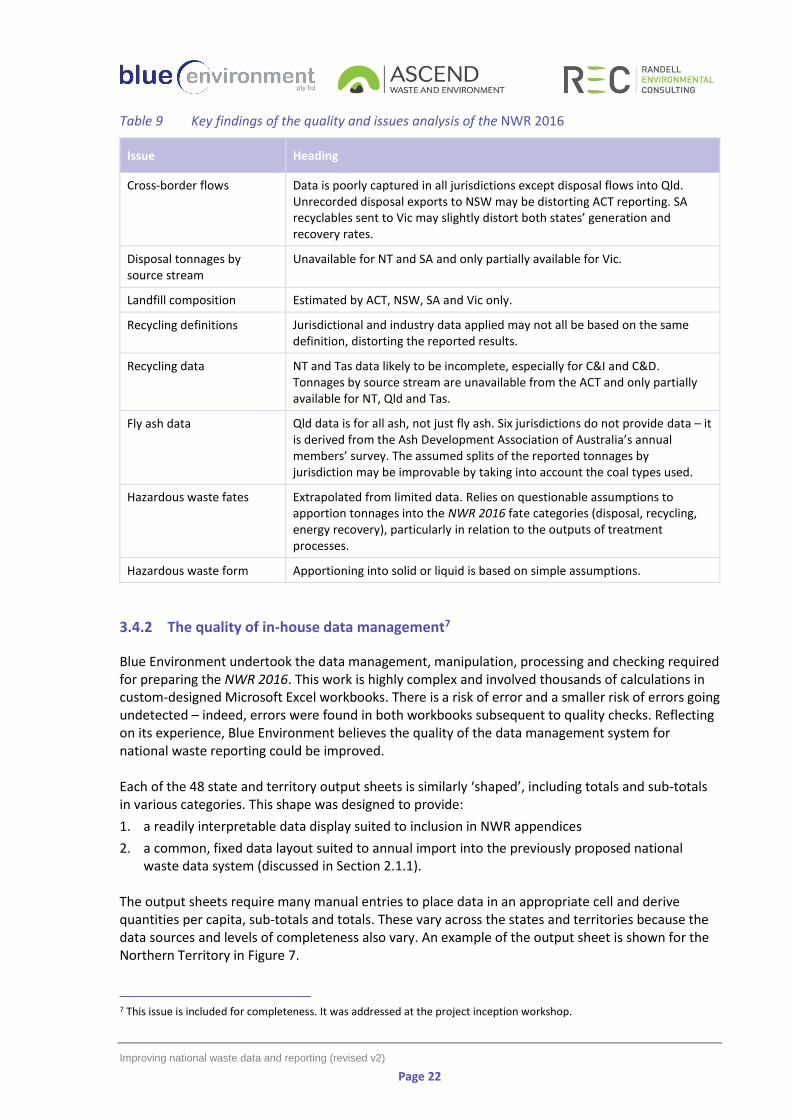
Key findings are summarised in Table 9.
Improving national waste data and reporting (revised v2)
Page 22
Table 9 Key findings of the quality and issues analysis of the NWR 2016
Issue Heading
Cross-border flows Data is poorly captured in all jurisdictions except disposal flows into Qld. Unrecorded disposal exports to NSW may be distorting ACT reporting. SA recyclables sent to Vic may slightly distort both states’ generation and recovery rates.
Disposal tonnages by source stream
Unavailable for NT and SA and only partially available for Vic.
Landfill composition Estimated by ACT, NSW, SA and Vic only.
Recycling definitions Jurisdictional and industry data applied may not all be based on the same definition, distorting the reported results.
Recycling data NT and Tas data likely to be incomplete, especially for C&I and C&D. Tonnages by source stream are unavailable from the ACT and only partially available for NT, Qld and Tas.
Fly ash data Qld data is for all ash, not just fly ash. Six jurisdictions do not provide data – it is derived from the Ash Development Association of Australia’s annual members’ survey. The assumed splits of the reported tonnages by jurisdiction may be improvable by taking into account the coal types used.
Hazardous waste fates Extrapolated from limited data. Relies on questionable assumptions to apportion tonnages into the NWR 2016 fate categories (disposal, recycling, energy recovery), particularly in relation to the outputs of treatment processes.
Hazardous waste form Apportioning into solid or liquid is based on simple assumptions.
3.4.2 The quality of in-house data management7
Blue Environment undertook the data management, manipulation, processing and checking required for preparing the NWR 2016. This work is highly complex and involved thousands of calculations in custom-designed Microsoft Excel workbooks. There is a risk of error and a smaller risk of errors going undetected – indeed, errors were found in both workbooks subsequent to quality checks. Reflecting on its experience, Blue Environment believes the quality of the data management system for national waste reporting could be improved. Each of the 48 state and territory output sheets is similarly ‘shaped’, including totals and sub-totals in various categories. This shape was designed to provide:
1. a readily interpretable data display suited to inclusion in NWR appendices
2. a common, fixed data layout suited to annual import into the previously proposed national waste data system (discussed in Section 2.1.1).
The output sheets require many manual entries to place data in an appropriate cell and derive quantities per capita, sub-totals and totals. These vary across the states and territories because the data sources and levels of completeness also vary. An example of the output sheet is shown for the Northern Territory in Figure 7.
7 This issue is included for completeness. It was addressed at the project inception workshop.

Improving national waste data and reporting (revised v2)
Page 23
Since the tool was designed the idea of data appendices was dropped, the intended unchanging format was subsequently changed, and the National Waste Database did not proceed. The rationale for the current data warehousing method is therefore redundant and the quality risks need to be addressed. In doing so, the national waste data record can also be made more integrated and accessible.
Figure 7 Example of the standardised output sheet in the national waste reporting tool
Finding 5
Blue Environment has decided that the risk of including the now redundant output sheets is too high. Quality would be improved through the use of a ‘flat’ database (in which all of the records are stored as single rows of data comprising field entries in columns) and rely on automated mechanisms to compute the necessary totals and subtotals. These mechanisms could include Excel pivot tables or Power BI. It is accepted that the level of transparency cannot decline as a result of this change.

Improving national waste data and reporting (revised v2)
Page 24
3.5 Quality and issues analysis – Hazardous Waste in Australia
Based on the experience in preparing HWiA 2017, in-house reviews were undertaken of data quality and reporting issues across the states and territories, which broadly encompassed:
• hazardous waste data collection processes
• the quality of the data collected
• the scope and definitions of the parameters reported in that data
• analysis, gap filling techniques and methods of resolving issues with supplied hazardous waste data
• the quality of the historical record
• improvements that relate specifically to the scope and analysis to be employed by Hazardous Waste in Australia 2019
• improvements that relate specifically to the hazwaste standard.
Finding 6
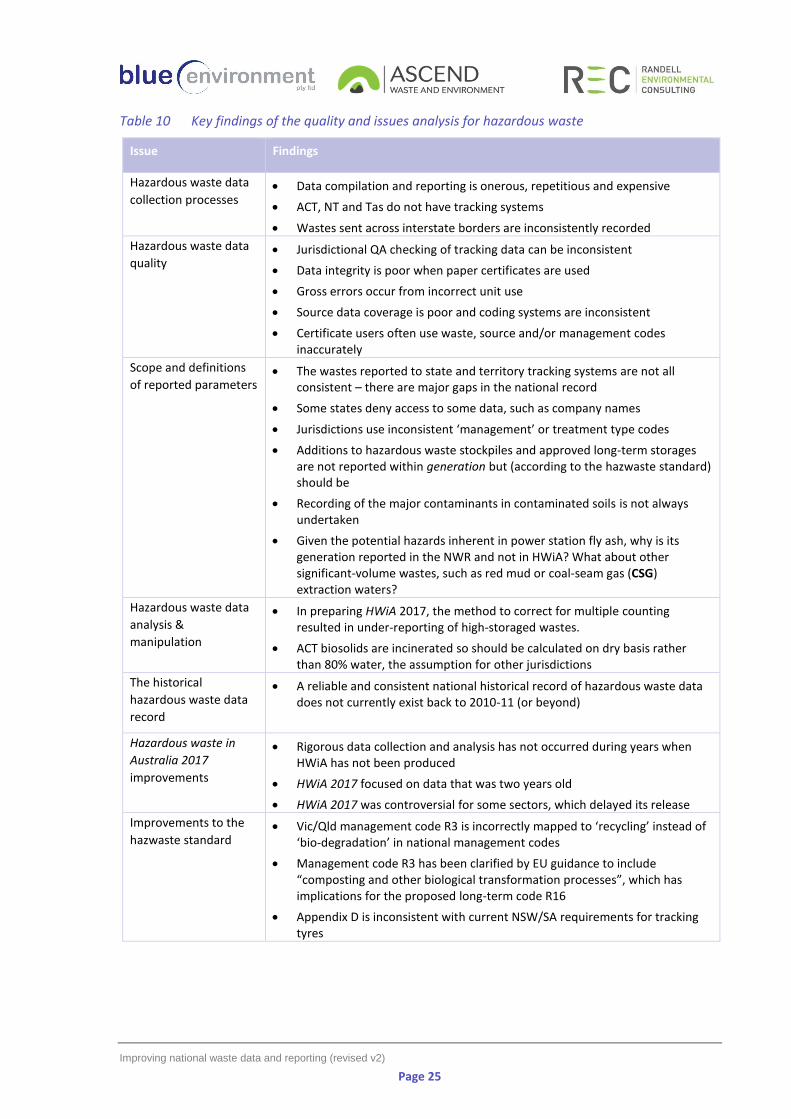
Key findings are summarised in Table 10.
Improving national waste data and reporting (revised v2)
Page 25
Table 10 Key findings of the quality and issues analysis for hazardous waste
Issue Findings
Hazardous waste data
collection processes • Data compilation and reporting is onerous, repetitious and expensive
• ACT, NT and Tas do not have tracking systems
• Wastes sent across interstate borders are inconsistently recorded
Hazardous waste data
quality • Jurisdictional QA checking of tracking data can be inconsistent
• Data integrity is poor when paper certificates are used
• Gross errors occur from incorrect unit use
• Source data coverage is poor and coding systems are inconsistent
• Certificate users often use waste, source and/or management codes inaccurately
Scope and definitions
of reported parameters • The wastes reported to state and territory tracking systems are not all
consistent – there are major gaps in the national record
• Some states deny access to some data, such as company names
• Jurisdictions use inconsistent ‘management’ or treatment type codes
• Additions to hazardous waste stockpiles and approved long-term storages are not reported within generation but (according to the hazwaste standard) should be
• Recording of the major contaminants in contaminated soils is not always undertaken
• Given the potential hazards inherent in power station fly ash, why is its generation reported in the NWR and not in HWiA? What about other significant-volume wastes, such as red mud or coal-seam gas (CSG) extraction waters?
Hazardous waste data
analysis &
manipulation
• In preparing HWiA 2017, the method to correct for multiple counting resulted in under-reporting of high-storaged wastes.
• ACT biosolids are incinerated so should be calculated on dry basis rather than 80% water, the assumption for other jurisdictions
The historical
hazardous waste data
record
• A reliable and consistent national historical record of hazardous waste data does not currently exist back to 2010-11 (or beyond)
Hazardous waste in
Australia 2017
improvements
• Rigorous data collection and analysis has not occurred during years when HWiA has not been produced
• HWiA 2017 focused on data that was two years old
• HWiA 2017 was controversial for some sectors, which delayed its release
Improvements to the
hazwaste standard • Vic/Qld management code R3 is incorrectly mapped to ‘recycling’ instead of
‘bio-degradation’ in national management codes
• Management code R3 has been clarified by EU guidance to include “composting and other biological transformation processes”, which has implications for the proposed long-term code R16
• Appendix D is inconsistent with current NSW/SA requirements for tracking tyres
Improving national waste data and reporting (revised v2)
Page 26
3.6 Research program
The three components of the in-house research program are discussed in separate sub-sections below. They include reviews of: landfill composition data; new national data and data structures; and the availability of local government waste data.
3.6.1 Landfill composition review
In the NWR, each state and territory is allocated an assumed proportional breakdown of each stream (MSW, C&I, C&D) of waste to landfill by material category or type. This is used to estimate the recovery rate of each material. The sources of the assumed landfill composition are summarised below:
• ACT, NSW, SA and Vic – landfill composition estimate provided by the jurisdiction based on landfill audits, sometimes supported by MSW bin audits and other data
• NT, Qld, Tas and WA – a national average figure was applied. Based on the agreed method, the national average composition was derived from two sources:
• The main organic fractions (food, garden organics, timber, other organics, paper and cardboard) were taken from the default landfill composition given in the National Greenhouse and Energy Reporting (Measurement) Determination. The values were reviewed in detail in 2014 by APC and Blue Environment, referencing 19 landfill audits and 137 kerbside bin audits, and found to closely match the audit average.
• The remaining fractions were estimated from the weighted average of the jurisdictions that provided an estimated composition (i.e. ACT, NSW, SA and Vic).
Blue Environment compared the results of nine publicly available waste audits as listed below with the NWR 2016 assumed compositions, particularly the inorganic fractions of the national average composition.

Improving national waste data and reporting (revised v2)
Page 27
Table 11 Waste audits compared with NWR 2016 landfill composition values
Source State Year Landfills audited Waste streams
Auditor
1. Disposal-based audit Commercial and industrial waste stream in the regulated areas of NSW
NSW 2015 10 landfills, 4 transfer stations
C&I APC
2. ACT NOWaste 2015 Landfill and Transfer Station Waste Audits
ACT 2015 Mugga Lane landfill, 2 transfer stations (Mugga Lane & Mitchell)
C&I, C&D, self-haul
APC
3. City of Burnside - Kerbside Waste Audit
SA 2014 MSW KESAB Env. Solutions
4. NTWMG Residential kerbside bin audit
Tas 2014 MSW EC Sustainable
5. DEC, Disposal based audits of the C&I and C&D waste streams
WA 2007 5 landfills and 1 transfer station (3 C&I and 3 C&D)
C&I, C&D Waste Audit & Golder Assoc.
6. Awaba Landfill Waste Audit Report
NSW 2010 Awaba landfill C&I, C&D, MSW
MRA
7. Domestic Kerbside Waste Stream Audit and Landfill Visual Audit
NSW 2011 Gregadoo Waste Management Centre
MRA
8. Landfill audit Tas 2011 Launceston, Westbury, Deloraine, Dulverton, Burnie, Port Latta, Ulverstone
C&I, C&D, MSW
APC
Finding 7
There is reasonably close alignment between the compositions in the reviewed audits and those provided and derived for the NWR 2016. For the NWR 2018, the consultants should check that the composition values provided by the ACT and NSW are reasonably consistent with the audits.
3.6.2 New data and structures
Policies, programs and data systems for waste management are regularly created or changed. An investigation was undertaken to assess potential:
• additional data sources
• alternative data classifications, noting that the classifications shown in Table 1 (p.5) were established in 2011.
To be relevant to national reporting, these needed to be occurring beyond the level of a single jurisdiction. Two potential sources were identified, as tabulated below.

Improving national waste data and reporting (revised v2)
Page 28
Table 12 Additional data sources and alternative data classifications of potential relevance to national waste reporting
Program Description Materials covered Comments
Australian Packaging Covenant Organisation
Collects data on packaging waste nationally. Already partly used in NWR (plastics). Recently reviewed data systems but new system apparently not finalised.
Plastic, paper, glass, steel and aluminium packaging products. Plastics are by types consistent with the NWR. The other materials are presented by packaging material in subsets of the data needed for the NWR.
Tonnage data are net product sold into the market. Materials are a subset of those required for the NWR.
Container deposit schemes
Established in SA and NT. New or impending in ACT, NSW, Qld, WA (no schemes in Tas or Vic). Robust data collection systems are needed to support money transfers.
Drink containers in various categories below certain sizes (and above certain sizes in ACT, NSW, Qld, WA). Exemptions for some glass bottles.
May be of supplementary use to national reporting.
Finding 8
The plastics survey for the Australian Packaging Covenant should continue to be a useful input to the NWR but caution should be exercised in ensuring:
• data on non-packaging plastic recycling is obtained
• a consistent definition of recycling is used throughout the NWR. Other data from the Australian Packaging Covenant and from container deposit schemes may be of supplementary use to the NWR 2018 but are not appropriate data substitutes.
3.6.3 Local government data
Local governments (councils) are major players in waste management. They are generally responsible for the management of domestic waste and own much of the waste infrastructure outside the metropolitan areas. Local government data was not directly collated for the NWR 2016 because it is typically a sub-set (albeit the major subset) of municipal waste data collected from landfills and the recycling industry. However, there could be some benefit in separately identifying council waste data – for example, to report service types and levels by jurisdiction. The consultants reviewed the availability of local government waste data collations from the states and territories. The results are tabulated below. All these collations contain data on garbage, recycling and organic materials generated from domestic sources, as well as service levels and, in some cases, composition.

Improving national waste data and reporting (revised v2)
Page 29
Table 13 Local government waste data collations by state and territory
Jurisdiction & agency Method Compulsion Scope
ACT Not applicable
NSW (EPA) Annual survey Voluntary Targets all councils (generally successfully)
NT No collation
Qld (Dep’t of Env. & Science)
Annual reporting Compulsory All councils
SA (Green Industries SA) Annual reporting Compulsory Councils that have received ‘kerbside performance incentive payments’
Tas No collation
Vic (Sustainability Victoria) Annual survey Voluntary Targets all councils (generally successfully)
WA (Waste Authority) Annual survey Voluntary Targets all councils (94% response rate in 2015-16)
Finding 9
A rich data set is available on domestic waste generation and management in Australia. It is likely to cover more than 95% of the population.
3.7 An outsider’s view
Resource Futures, a UK-based environmental consultancy, was commissioned to examine Australia’s national waste reporting system. They were asked to compare it with UK systems in detail and other countries to a lesser extent, encompassing:
• data categories and types
• data units
• data sources
• definitions (data types, sources, fates, others?)
• the scope of wastes and other information reported
• uncertainty assessment and presentation
• data collection mechanisms
• how the data is presented and visualised
• any other matters considered to be of interest. The Resource Futures (2018) response is summarised below and presented in full in Appendix B.
Finding 10 – Summary of Resource Futures’ findings
The Australia National Waste Report was assessed with reference to the report and the data collation method of the Australia National Waste Data System (NWDS). These documents were assessed by way of comparison to case studies of national waste reports from the EU (Eurostat), the UK and Japan. The assessment found that the approach and presentation of the Australia National Waste Report shows many similarities to examples from other nations. It demonstrates international best practice in discussing waste policy and related factors such as population and economic growth, and it leads the field of statistics reporting with:
• sensitive discussion and handling of uncertainty
Improving national waste data and reporting (revised v2)
Page 30
• transparency in data handling by publishing the NWDS spreadsheet used to generate the statistics
• detailed reporting of sub-regions (states and territories) using a common approach and presentation of data
• representation of industry perspectives
• a comparison with other countries against key metrics. National waste statistics reports often differ due to legislative monitoring and reporting requirements, political interest in particular areas, dominant production industries in a country, and the importance of import and export activity. The assessment highlighted a number of key differences and observations, as follows:
• The case study countries focus on recycling rate (inclusive of waste reuse, recycling and composting) as a key performance indicator rather than resource recovery (inclusive of energy recovery).
• Waste generation and treatment are typically monitored and reported separately.
• A broader scope of waste data is typically reported by other countries, facilitated by legislation requiring stakeholders to monitor and report waste using centralised data systems. Examples include: - economic data, such as gross value added (GVA), GVA per tonne and employment in the waste sector - waste infrastructure and treatment capacity, which can be derived from permit records - waste crime and enforcement data.
• The categorisation of waste streams (MSW, C&I, C&D) is common amongst national reports, although the definition and scope of these terms varies and can have a considerable impact on the statistics reported.
• Mining, agriculture and forestry wastes are often included in national waste reports, for example data is presented by Eurostat including and excluding mining wastes and UK reports these wastes in a category labelled ‘other’ alongside MSW, C&I & C&D.
• It is increasingly common to see waste presented in the wider context of resource consumption and recirculation stemming from a political interest in circular economy thinking. Metrics such as resource productivity (GVA per tonne of resource use), and cyclical use rate (% of resource consumption met by secondary materials) can be used to set targets and monitor progress.
• Australian data presentation and visualisation is in keeping with international case studies, except the manner in which recovery rates are presented on top of stacked column charts of waste generation and fate. The current data could also be visualised using mapping to communicate regional variation, and if the scope of data were expanded it would lend itself to other forms of visualisation such as resource flow diagrams and time series relative to a base year to clearly show annual development.
• The use of infographics can be a powerful way to communicate key messages, particularly around improvements in environmental performance.
• International comparison could be improved by adjusting for differences in definitions, similar to the approach taken with the NWDS in consolidating data from states and territories.
• There are several examples of sophisticated national waste data systems, most notably from the UK, but the value derived from these systems is dependent on the level of use and some systems have very poor coverage where use is not mandated by legislation.
The assessment also revealed a considerably different approach that encapsulates waste statistics as an integral part of reporting the regular review and revision of national waste plans, as demonstrated in Japan. The associated planning document encompasses:
• a simple summary of national waste strategy
• the background situation and developments that led to the current situation
• current environmental performance focussed on achieving circular resource use
• global and regional trends that will affect future priorities in resource management, such as economic development, demand and supply of material resources
• future actions to achieve national targets and goals.

Improving national waste data and reporting (revised v2)
Page 31
3.8 Best practice visualisation
Brendan Lim of Little Sketches worked with Blue Environment in reviewing the methods for presenting data in the NWR 2018. Little Sketches’ brief was to review the visualisation approach and individual visualisation applied in the NWR 2016 and propose options for improvement. In proposing options, Little Sketches was asked to consider:
• best practice in data visualisation
• Blue Environment’s need for automated totals and sub-totals to improve quality control
• the Department’s requirement, stated in the project brief, for “capacity to respond to periodic state and territory data releases” such as providing for “results published (possibly via Power BI) into a limited series of key charts etc. displayed on the Department’s website”.
In including the last two points within the brief, we linked visualisation, quality control and reporting flexibility. These are linked through the medium of the program software to be used for the bulk of the data presentations. This section discusses principles for best practice visualisation, then assesses the NWR 2016 from that perspective, and finally discusses options for visualisation and data presentation software.
3.8.1 Principles for best practice visualisation
Principles for best practice visualisation are tabulated below. They are collated by Little Sketches from several sources.
Table 14 Principles for best practice visualisation
Principle Comments
1. Maximise the proportion of the ‘ink’ used for displaying information
The implication is that ‘chart junk’ should be minimised. Advocated by Edward Tuft.
2. Use multiple small dense charts for comparisons Also popularised by Edward Tuft.
3. Annotate the things that matter Help the reader understand the key points of the visualisation.
4. Choose chart types that best match the data types (i.e. ‘perceptually optimised’)
Put simply, this is about choosing the type of chart (‘visual encoding’) that humans best understand.
Based on research of the Hierarchy of Perceptual tasks by William S. Cleveland and Robert MacGill
5. Keep charts simple. Minimise the messages per chart.
3.8.2 Assessment of the NWR 2016 from the perspective of best practice visualisation
Data visualisations (i.e. charts) from the NWR 2016 were reviewed. Suggestions for improvements are separated into three tabulated sections (following). These are:
• Comments on sample charts from the NWR 2016 (Table 15): the NWR 2016 approach to data visualisation utilises a series of densely packed charts – often combining multiple data series.

Improving national waste data and reporting (revised v2)
Page 32
Suggestions here focused on separated data series to allow readers to better see specific trends and patterns (i.e. a ‘small multiples’ approach to data visualisation).
• General aesthetic improvements (Table 16): these suggestions focus on improving the clarity of information and communication, particularly in regard to highlight the ‘story’ of each chart.
• Options and alternatives (Table 17 and appended figures): some visualisation alternatives are provided and explored to illustrate some of the suggested improvements.
Table 15 Little Sketches comments on sample graphics from the NWR 2016
Sample figure Suggestion for improvement
Fig. 4: Waste generation and fate
• Improve the clarity of the tabulated figures (i.e. ‘generation’ here is the total of the other three rows)
Fig. 5: Waste generation and fate by state
• Provide a separate chart for states that produce fly ash
Fig. 7: Trends in waste generation and fate
• Separate per capita trend line into another chart, smaller and directly above or below
• Consider producing separate area charts (small multiples) for interactive version
• Consider direct labelling of area layers (if possible)
Fig. 9: Trends in waste generation per capita by state and territory
• Separate to multiples or spark lines (generally too hard to read/follow this many lines)
• Directly label the trendlines
• Rank the table
• Include growth rates in table
Fig. 26: Comparisons with other countries
• Could potentially made a bar chart, allowing for more legible labelling (i.e. country names) and allowing for the countries to be ranked (either by kg/ capita or recovery rate)
• Consider adding a similar bar chart showing just the recovery rate (again, this could be ranked). This would avoid the confusion over what the % is.

Improving national waste data and reporting (revised v2)
Page 33
Table 16 Little Sketches suggestions on general aesthetics to improve the presentation clarity
Aspect of NWR 2016 visualisations
Comments and options
Gridlines and table outlines • Reduce visual clutter by reducing/lightening weight of all gridlines and table outlines.
Reducing information in charts with multiple data points/series
• Start to separate 'data stories' in 'small multiples' style charts where possible (or where the trend in the breakdown is important to see).
Colour, legends and labelling
• Palettes for waste streams (in particular) and states can be reviewed in line with the final report design.
• Use of legends should be minimised where possible – for example by directly labelling coloured areas on a chart. This helps cognition as users do not need to shift their gaze back and forth from the legend.
Recovery rate label
• In the current approach, without the 'note' it is not clear what that figure is from the chart alone (i.e. its position suggests it has something to do with the height of the columns). Suggest finding a different solution to placing this info (e.g. it could be in the tables below each chart, if desired to be more prominent, directly under the column label).
Table 17 Little Sketches suggested options for alternative chart types
NWR 2016 approach Comments and options
Charts showing breakdowns in waste data are primarily presented as 'stacked column' charts: presented as a series.
• This format remains an option but some alternatives are better attuned to the expected visual literacy of the audience and may also be influenced by judgement on the general aesthetic and structure of the final report – see Figure 8, for example.
Charts showing trends in waste data are primarily presented as stacked area charts, or in combination with or as a line chart
• This format remains an option but 'small multiples' area charts are also suggested. This format allows for trends within the 'layers' to be better shown as they each have the same baseline – see Figure 9.
Charts showing a direct comparison of breakdowns (%) are not currently presented
• For example, there is no direct comparison to breakdowns (%) between states as the columns are sized by mass or mass/person. This may be looked at further for inclusion.
Charts showing the 'flow' of waste from source to destination (and categories in between) are not currently presented
• A Sankey diagram of flows may be considered.
3.8.3 Review of software options
A selection of leading 'off the shelf' software options for visualising data in charts and tables were reviewed. These were selected based on a combination of cost, ease of use, data privacy, data connection options and fitness for preparing the relevant reports for the Department (in specified static digital format). Most options are capable of extending publishing options to include interactive and web-based reporting. More complex options requiring multiple technologies and specialised developer skills (e.g. with HTML, Cascading Style Sheets and/or Javascript libraries) are not included. The review is summarised in Table 18.
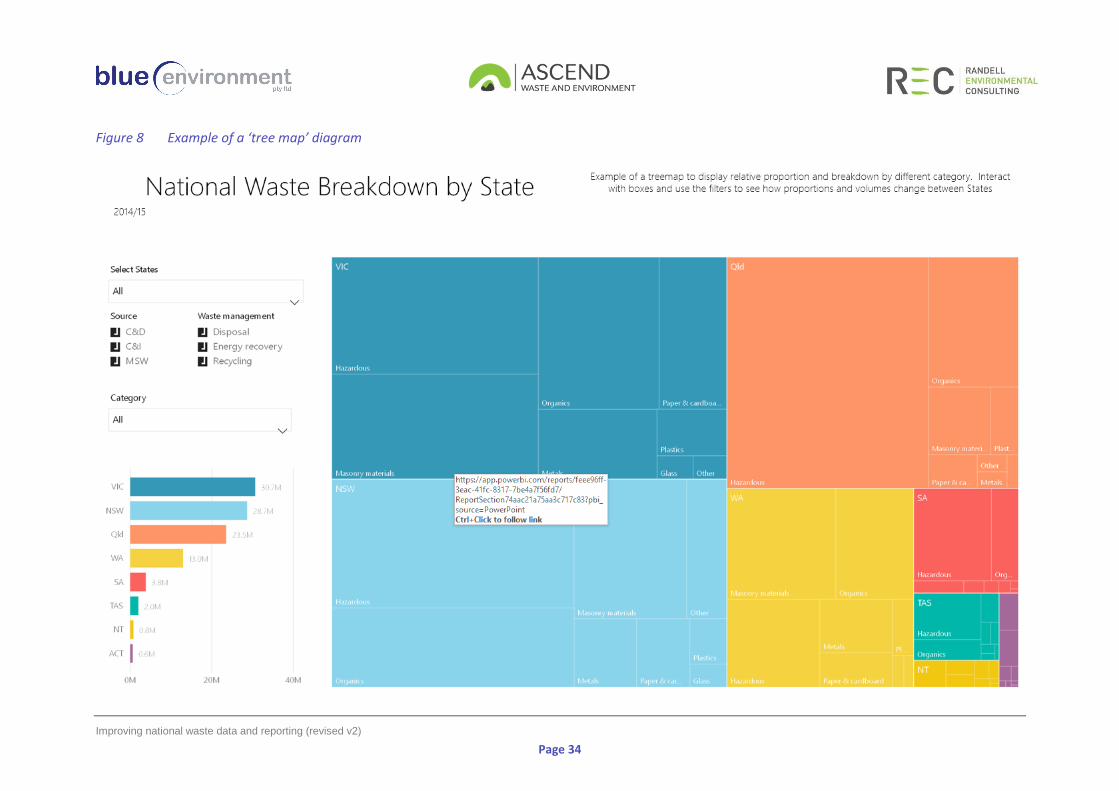
Improving national waste data and reporting (revised v2)
Page 34
Figure 8 Example of a ‘tree map’ diagram

Improving national waste data and reporting (revised v2)
Page 35
Figure 9 Example of a ‘small multiples’ presentation

Improving national waste data and reporting (revised v2)
Page 36
Table 18 Review of data visualisation software options
Software & description Cost Outputs Output format Pros Cons
Microsoft Excel
Standard program from the ‘Office’ suite
Depends on version license. However assumed to be no marginal cost as Excel is ubiquitous
Static charts and tables
As images to static reports - Familiarity
- Existing license (free)
- Does not support interactivity
- Limited visualisation options
- Difficult to manage large volumes of visualisations
- Requires most manual design and 'workarounds'
Microsoft Power BI Desktop
Authoring software for bringing together different data sources (e.g. Excel files, databases etc.) in a 'model', which is then the basis of an interactive visual report and/or dashboard.
Note: in this case the 'Report' can be multiple pages of charts and tables, whereas a 'dashboard' is a single page summary output.
Free
- Static charts and tables
- Interactive charts and tables in a report or dashboard
1. As images to static reports (exported via images to PowerPoint reports)
2. As an individual file for others to view/edit in Power BI Desktop
3. As publicly published to the internet (able to be embedded in websites for public consumption)
- Free to author and distribute
- Connected to the Microsoft technology 'stack', so similar feel and functionality to Excel
- Richer visualisation options
- Robust data modelling (i.e. connected to raw data)
- Publishing to websites is public only (i.e. no private sharing)
Microsoft Power BI Pro
This extends Power BI Desktop to allow sharing and collaboration between colleagues (i.e. sharing of visualisation reports/dashboards within a private organisation).
Note: This is more targeted at regular (e.g. hourly, daily weekly, monthly, etc.)
$12.70 per user per month
As per MS Power BI Desktop
As above plus
4. As interactive reports/dashboards able to be shared within an organisation
5. Embedded into apps (for computers and mobile)
As above plus
- Can be used to share/collaborate privately within an organisation
- Cost of licensing for all 'users', including authors and consumers/readers of the reports’

Improving national waste data and reporting (revised v2)
Page 37
Software & description Cost Outputs Output format Pros Cons
reporting and app building for internal business intelligence purposes
Tableau Desktop
Authoring software for bringing together different data sources (e.g. Excel files, databases etc.) in a 'model', which is then the basis of an interactive visual report and/or dashboard.
Note: Functionality and purpose is similar to Microsoft Power BI Desktop
Free
1. Static charts and tables
2. Interactive charts and tables in a report or dashboard
1. As images to static reports (export to PDF)
2. As an individual file for others to view/edit in Tableau Desktop
3. As publicly published to the internet (able to be embedded in websites for public consumption)
vs Power BI Desktop - Richer visualisation and interactivity options
vs Power BI Desktop - Less familiarity for users of MS services - Potentially higher learning curve - Cost (for Professional)
Tableau Desktop (Professional)
The Professional version is a paid service that extends Tableau Desktop to work in a private organisation (note: potentially with "Tableau Server" as an added cost).
Note: Functionality and purpose is similar to Microsoft Power BI Professional
$70 per user per month
As per Tableau Public
As above plus
4. As interactive reports/dashboards able to be shared within an organisation
5. Embedded into apps (for computers and mobile)
Qlk Sense
Qlk Sense is a competitor to Tableau and Power BI - with similar ‘freemium’ and paid 'full-feature’ subscription model'
Free for 'Basic' and $25USD per user per month for Business
Similar to Power BI and Tableau
Similar to Power BI and Tableau
vs Power BI Desktop and Tableau
- Visualisation options expected to be 'in between' Power BI and Tableau (but would need testing)
vs Power BI Desktop
- Less well known/lower market share
IBM Watson Analytics
Watson Analytics is based around Machine Learning BI analytics with visualisation as an option
$30 to $80 USD per month per user
Watson Analytics (due to its cost) was not reviewed as deeply as other tools. It is a fairly new product focusing on machine learning/AI services that integrates visualisation, and is included more as a ‘watching brief’ as the product may mutate or mature into a more visualisation-based tool over time.

Improving national waste data and reporting (revised v2)
Page 38
4 Agreed improvements
Based on the findings of the investigations reported in Section 3, we proposed major improvements to national waste reporting in an initial version of this report. A workshop at the Department’s offices on 19 March and subsequent discussions and email exchanges resulted in a final agreed set of improvements that are documented in this section. Expansions to the scope are addressed in Section 4.1, corrections and adjustments in Section 4.2, better expression of uncertainty in Section 4.3, improved data warehousing in Section 4.4, a new approach to data visualisation in Section 4.5, standardising waste data and reporting in Section 4.6 and improvements to hazardous waste data and reporting in Section 4.7. We close with a draft structure of the NWR 2018 in Section 4.8. Significant changes include:
• inclusion of data on local government waste management, product waste, tip shops, litter and dumping, container deposit schemes, mining waste, stockpiles, approved long-term storages, waste infrastructure and international waste flows
• increasing the depth of the detail and discussion, particularly of the key data areas of waste generation, recycling, energy recovery and disposal
• restructuring the national waste report to focus on these key data areas and remove the distinct sections on each state and territory (whilst maintaining and reporting state and territory data)
• construction of a flat database including the historical record of waste back to 2006-07 and interaction with that database using Power BI to generate data visualisations
• a contribution towards national standardisation of waste data and reporting by appendicising the national method and definitions as a basis for a potential future standard
• a range of improvements to hazardous waste data, including to correction methods, the historical record and the major publications that deal with hazardous waste.
4.1 Scope expansions
We cover the agreed scope expansions in three tables and a figure below, all of which focus on the NWR 2018. Table 19 lists expansions in the scope of wastes covered, Table 20 addresses other expansions to the scope of the report, and Table 21 contains our methods for increasing the depth of the detail and discussion. These are followed by an illustration of the overall scope of wastes and sources to be covered in the NWR 2018. Note that we do not propose to track the trends associated with the ‘new’ wastes listed in Table 19. We would report for the base year of 2016-17 only. The improvements listed in Table 21 incorporate a significant restructure of the NWR 2018 compared with the NWR 2016. There may be an element of trial and error with the new structure (which is also summarised in Section 4.8). It is possible that the final structure does not adhere totally to this draft. Approximate costs have been included in some of the larger scope expansions. These are for consultant reference only.

Improving national waste data and reporting (revised v2)
Page 39
Table 19 Agreed expansions of the scope of wastes covered in the NWR 2018
Expansion Data source(s) Rationale Comments and notes
1. Local government data
a. quantities, particularly of recyclables
b. services, particularly the availability of kerbside services by jurisdiction
States and territories
Adds depth to the report
Suggested by 2 consultees
Adequate data is readily available (see Table 13)
Will go in a stand-alone section and not form part of the ‘total waste’ quantities reported. Will not be nationally comprehensive. Budget impost approx. $5k.
2. Product and packaging waste, including
a. product stewardship products b. e-waste (beyond TVs & computers) c. other products as available d. container deposit system data e. Australian Packaging Covenant
data
a. the Department b. existing BE/REC
modelling c. states and
territories d. states and
territories e. APCO
Adds depth to the report
Commitment of our project proposal
Inclusion of CDS data suggested by 2 consultees
Will go in a stand-alone section and not form part of the ‘total waste’ quantities reported.
3. Tip shop data States and territories
Adds depth to the report
Generally supported by states & territories
Adequate data is readily available
Will be the focus of a stand-alone section titled ‘waste reuse’. Would not form part of the ‘total waste’ quantities reported. Will not be nationally comprehensive.
4. Litter and dumping data States and territories
Adds depth to the report
Generally supported by states & territories
Adequate data is readily available to support commentary on scale and cost
Will be a focus of a separate section (see Table 20). Would not form part of the ‘total waste’ quantities reported. Will not be nationally comprehensive. Budget impost approx. $5k.
5. Mining waste
Headline Economic Values of Waste project report and/or industry (major companies)
Adds depth to the report
‘First-cut’ data available
Suggested by 3 consultees
We will advise industry of the plan to include the HEVW data unless they have better data. Budget impost approx. $5k.
6. Waste to stockpiles and long-term storages
States and territories;
Stockpiles project
Adds depth to the report
Seen as major issue by states & territories Unlikely to be nationally comprehensive.
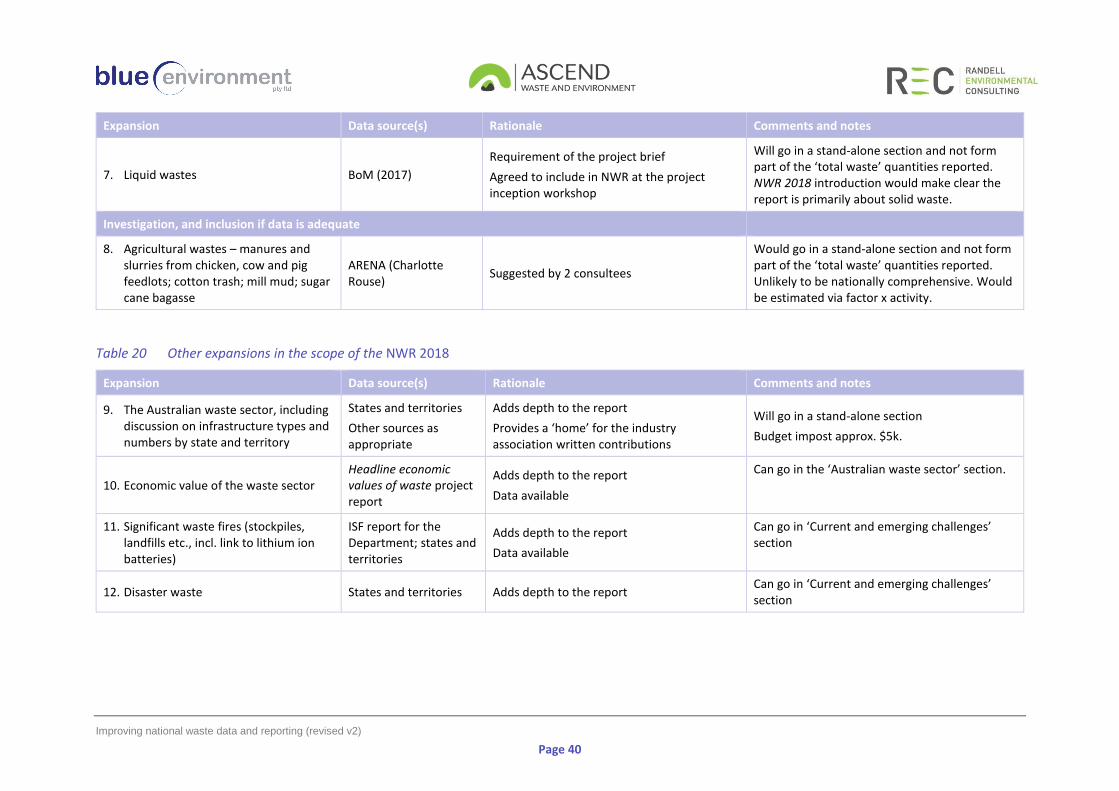
Improving national waste data and reporting (revised v2)
Page 40
Expansion Data source(s) Rationale Comments and notes
7. Liquid wastes BoM (2017)
Requirement of the project brief
Agreed to include in NWR at the project inception workshop
Will go in a stand-alone section and not form part of the ‘total waste’ quantities reported. NWR 2018 introduction would make clear the report is primarily about solid waste.
Investigation, and inclusion if data is adequate
8. Agricultural wastes – manures and slurries from chicken, cow and pig feedlots; cotton trash; mill mud; sugar cane bagasse
ARENA (Charlotte Rouse)
Suggested by 2 consultees
Would go in a stand-alone section and not form part of the ‘total waste’ quantities reported. Unlikely to be nationally comprehensive. Would be estimated via factor x activity.
Table 20 Other expansions in the scope of the NWR 2018
Expansion Data source(s) Rationale Comments and notes
9. The Australian waste sector, including discussion on infrastructure types and numbers by state and territory
States and territories
Other sources as appropriate
Adds depth to the report
Provides a ‘home’ for the industry association written contributions
Will go in a stand-alone section
Budget impost approx. $5k.
10. Economic value of the waste sector Headline economic values of waste project report
Adds depth to the report
Data available
Can go in the ‘Australian waste sector’ section.
11. Significant waste fires (stockpiles, landfills etc., incl. link to lithium ion batteries)
ISF report for the Department; states and territories
Adds depth to the report
Data available
Can go in ‘Current and emerging challenges’ section
12. Disaster waste States and territories Adds depth to the report Can go in ‘Current and emerging challenges’ section
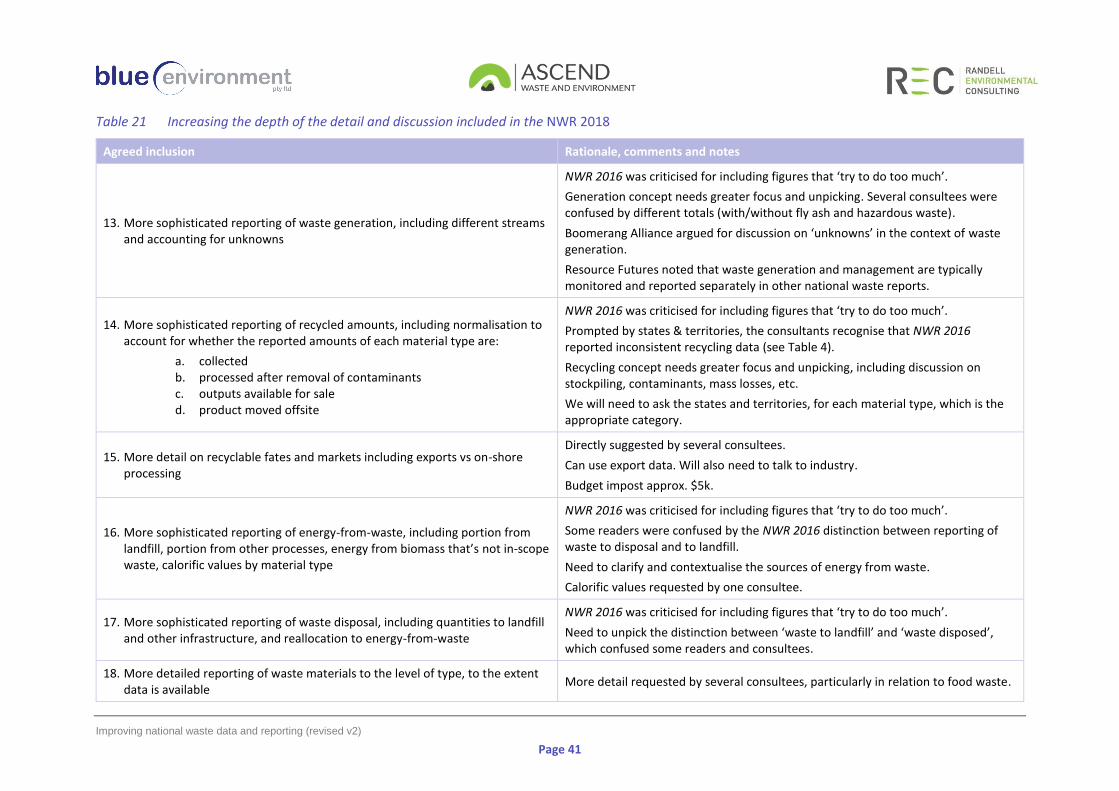
Improving national waste data and reporting (revised v2)
Page 41
Table 21 Increasing the depth of the detail and discussion included in the NWR 2018
Agreed inclusion Rationale, comments and notes
13. More sophisticated reporting of waste generation, including different streams and accounting for unknowns
NWR 2016 was criticised for including figures that ‘try to do too much’.
Generation concept needs greater focus and unpicking. Several consultees were confused by different totals (with/without fly ash and hazardous waste).
Boomerang Alliance argued for discussion on ‘unknowns’ in the context of waste generation.
Resource Futures noted that waste generation and management are typically monitored and reported separately in other national waste reports.
14. More sophisticated reporting of recycled amounts, including normalisation to account for whether the reported amounts of each material type are:
a. collected b. processed after removal of contaminants c. outputs available for sale d. product moved offsite
NWR 2016 was criticised for including figures that ‘try to do too much’.
Prompted by states & territories, the consultants recognise that NWR 2016 reported inconsistent recycling data (see Table 4).
Recycling concept needs greater focus and unpicking, including discussion on stockpiling, contaminants, mass losses, etc.
We will need to ask the states and territories, for each material type, which is the appropriate category.
15. More detail on recyclable fates and markets including exports vs on-shore processing
Directly suggested by several consultees.
Can use export data. Will also need to talk to industry.
Budget impost approx. $5k.
16. More sophisticated reporting of energy-from-waste, including portion from landfill, portion from other processes, energy from biomass that’s not in-scope waste, calorific values by material type
NWR 2016 was criticised for including figures that ‘try to do too much’.
Some readers were confused by the NWR 2016 distinction between reporting of waste to disposal and to landfill.
Need to clarify and contextualise the sources of energy from waste.
Calorific values requested by one consultee.
17. More sophisticated reporting of waste disposal, including quantities to landfill and other infrastructure, and reallocation to energy-from-waste
NWR 2016 was criticised for including figures that ‘try to do too much’.
Need to unpick the distinction between ‘waste to landfill’ and ‘waste disposed’, which confused some readers and consultees.
18. More detailed reporting of waste materials to the level of type, to the extent data is available
More detail requested by several consultees, particularly in relation to food waste.

Improving national waste data and reporting (revised v2)
Page 42
Agreed inclusion Rationale, comments and notes
States and territories unconcerned by proposal to report landfill composition with more granularity.
Will need to emphasise higher levels of uncertainty.
19. More detailed breakdown of source by industry sector (C&I).
Disaggregation by source sector is to be as set out in Figure 10.
Will investigate whether the breakdown supports an estimate of waste generated at the post-consumption and production waste levels.
20. In the ‘current and emerging challenges section’, discussions on:
a. stockpiles b. China bans c. circular economy (enhanced from NWR 2016 text) d. plastics in the ocean e. disaster waste f. major waste fires
a. a significant issue with the states and territories and at least some data is available from them and the recent Department stockpiles project
b. a major issue that cannot be avoided c. discussed in the NWR 2016 but could be enhanced with more detail and news
on programs d. also touched on in the NWR 2016 but is increasingly important and could be
addressed more fully, including drawing on the Senate inquiry report and investigating whether any data is available to estimate quantities and types.
21. Focus on urban vs regional where possible, e.g. the texts on infrastructure and domestic services
Touched on in the context section of the NWR 2016 but could also be considered in the local government and waste sector sections.
22. For each state and territory, discuss:
a. waste management highlights e.g. infrastructure, recycling plants, challenges (e.g. Tas), wins
b. data peculiarities e.g. Tas C&D c. data uncertainties
Suggested by states & territories and/or stakeholders.
23. Invite contributions from ALGA and Boomerang Alliance Suggested by the Boomerang Alliance. BA acts as a peak community body in relation to waste issues.
24. Discussion on drivers for future quantities of waste Several consultees raised issues about future waste and projections. We do not believe projections are a good idea as there is too much uncertainty, but the issue could be addressed through text.

Improving national waste data and reporting (revised v2)
Page 43
Figure 10 Illustration of the scope of wastes and sources to be included in the NWR 2018
Waste generation (measured)
Waste streams data
C&D
E: Construction
(includes demolition)
C&I
B Mining
C Manufacturing
D Electricity, gas, water and waste
services
Other ANZSIC Divisions (excludes Agriculture, Forestry
and Fishing)
MSW
Household
Local Government
Waste material flow
Liquid Waste (non hazardous)
Sewage
Trade waste
Waste Products As required to support product
stewardship reporting
Final fates
Res
ou
rce
Re
cove
ry
Recycled
Recovered for Energy (RoE)
Masonry Materials
Plastics
Paper
Metals
Glass
Hazardous Note: not a material
category however requires
separate reporting
Hazardous waste
Solid Waste (non-hazardous)Masonry Materials
Organics
Plastics
Paper
Metals
Glass
Textiles, leather, rubber
Reported by NEPM categories
Including: Acids, Alkalis, Inorganics chemicals, Reactive
chemicals, Paints, Organics solvents, Pesticides, Oils,
Hazardous organics, Contaminated soils, Asbestos, Clinical and pharmaceutical,
Tyres, other
Who? Data from which generators
What?What materials / products to report
How?What waste fates should be reported and how
Waste stockpiling▪ More than 12 months storage
▪ Untreated, unprocessed to product specification
▪ Requires active management to protect human health or the environment from impact
▪ Waste clearance requirement
typically apply
Dis
po
sal
Landfilled
Discharged to waterbody
Treatmentas required
Other
Fly ash from power generation
Long-term on-site storage (regulator approved)
Long-term isolation facility

Improving national waste data and reporting (revised v2)
Page 44
4.2 Corrections and adjustments
Corrections and adjustments to existing data sets are tabulated below.
Table 22 Agreements for correcting and adjusting data to be presented in the NWR 2018
Correction or adjustment Rationale
25. Rename the category ‘other’ as ‘textiles, leather and rubber (excl. tyres)’. Under this renamed category, change the types from ‘leather and textiles’ and ‘rubber excluding tyres’ to ‘textiles’ and ‘leather and rubber excl. tyres’.
The current classification ‘other’ has confused reporters (and we consultants) – it excludes ‘other materials reported by jurisdiction’ and masks the important category ‘textiles’. Commented on by the War on Waste, which had to rely on alternative data sources. Merging ‘leather’ and ‘rubber excluding tyres’ creates a category that is consistent with the landfill waste categories applied in NGER and international greenhouse inventory methods.
26. Create a new category ‘other’ comprising two new waste types:
a. residuals from waste processing operations
b. other unclassified materials.
Residuals from waste processing operations are ignored in current waste breakdown and information on average composition is unavailable. A separate ‘type’ is appropriate. The new type ‘other unclassified materials’ would encompass the current ‘other materials reported by jurisdiction’, which has not been used much. It would also correspond to unclassified residuals from audit programs. The appendix that aims to promote standard waste data and reporting could set an expectation for the proportion of waste in ‘other unclassified materials’. This lower limit could then flow into specifications for audit programs.
27. Ensure that quantities of waste to landfill are clearly spelled out, not just waste disposal
This issue confused some readers of the NWR 2016. There is no reason why both data cannot be reported. This will require changes to the national waste reporting tool.
28. Review and correct historical arisings back to 2006-07
A reliable trend data set is critical for national waste reporting. Experience in preparing NWR 2016 and consultation with jurisdictions identified some issues that need revisiting, particularly in relation to data on:
• NSW hazardous waste prior to 2010-11
• NSW 2014-15 recycling
• Qld hazardous waste data subsequent to 2014-15.
29. Review the method for reporting fly ash data
It may be possible to split the national industry data more accurately.
Need to confirm that Qld reported ash data does not double-count N150 data.
30. Review double-count risks
Need to review the following potential double-count risks:
• asbestos in WA (consultant hazardous waste estimate + landfill data)
• organic wastes to composting (hazardous waste data + compost data)
• contaminated soil (hazardous waste data + landfill data)
31. Co-burning of waste in power stations Need to check whether the states and territories are collecting data and checking the extent of this practice

Improving national waste data and reporting (revised v2)
Page 45
4.3 Better expression of uncertainty
Several stakeholders, as well as the Department, raised the issue of uncertainty and its expression within national waste reporting. The states and territories did not support or believe there was sufficient evidence for measured uncertainty ranges in the NWR data. However, the improvement workshops showed that some enhancements were achievable. Amendments to the national waste reporting tool will be required.
Agreement
32. Include a more comprehensive section on uncertainty including discussion on: - ‘missing wastes’ such as on-site asphalt reprocessing, litter and dumping, unknown flows to
stockpiles (e.g. WA C&D), export of computers that are likely to end up being recycled, recycling process losses (where relevant)
- uncertainties over cross-border flows - uncertain and potentially migrating split between MSW and C&I - the estimated proportion of data derived from weighbridge measurements - the estimated proportion of data obtained through compulsory reporting processes.
4.4 Improved data collation and warehousing
4.4.1 Review and assessment of current data collation and warehousing
Section 3.4.2 examined the current data collection and warehousing system, concluding that a flat database was needed for improved quality assurance. It noted additional benefits in making the data more accessible and easier to produce visualisations.
Agreement
33. Convert the jurisdictional data output sheets into two flat databases that will allow: - direct analysis using tools such as Excel pivot tables or Power BI (potentially online) - better access and assessment to consultants and others, who could interrogate the data using a
range of tools - better quality control in data collation and auditing - simpler recording of the accumulated national record over time.
Two interlinked databases will be required to account for the different levels of data resolution. That is, some data is received by broad ‘category’ (e.g. ‘metals’) whereas other data is received by more specific ‘type’ (e.g. ‘steel’). The first database will hold ‘type’ information and the second will hold ‘category’ information. Category information will be either directly inserted from the input data or, if type information is available, will comprise the sum of the relevant types in a category. A draft framework for the flat database (including ‘type’ data) is shown in Figure 11. Note that three additional columns are required to provide for other changes documented in this report – these are the tonnes to disposal, recycling and energy recovery. These are needed because we will now need to ask states and territories about the waste management rather than waste fate (disposal, recycling, energy recovery). Data manipulations will transparently convert the tonnes sent to each management type into tonnes allocated to each fate. These manipulations will:
• divide waste sent to landfill into ‘disposal’ and ‘energy recovery’ (done previously, but not with great transparency)
• calculate ‘waste to recycling’ from three recycling management types – recycling (collection), recycling
(processed) or recycling (taken offsite), providing a common basis for developing recovery rates.

Improving national waste data and reporting (revised v2)
Page 46
Figure 11 Example of the flat database structure
Other than the tonnage data, the entries within the different columns would be restricted to the options shown in Table 238.
Table 23 Data options for the flat databases
Year Jur. Categories Types Management Streams
2006-07 ACT Masonry materials Asphalt Landfill MSW
2008-09 NSW Metals Bricks Long-term storage C&I
2009-10 NT Organics Concrete Other disposal C&D
2010-11 Qld Paper & cardboard Rubble (incl. non-haz. f/sands) Recycling (collected)
2013-14 SA Plastics Plasterboard & cement sheet Recycling (processed)
2014-15 Tas Glass Steel Recycling (taken offsite)
2015-16 Vic Other Aluminium Energy recovery facility
2016-17 WA Hazardous Non-ferrous metals (ex. aluminium)
Fly ash Food organics
Other mat. rpted. by jur. Garden organics
Timber
Other organics
Biosolids (non-contaminated)
Cardboard
Liquid paperboard (LPB)
Newsprint and magazines
Office paper
Polyethylene terephthalate (PET)
High density polyethylene (HDPE)
Polyvinyl chloride (PVC)
Low density polyethylene (LDPE)
Polypropylene (PP)
Polystyrene (PS)
Other plastics
Glass
Leather & textiles
8 The data options have not been adjusted to take into account all the changes proposed in this document.

Improving national waste data and reporting (revised v2)
Page 47
Year Jur. Categories Types Management Streams
Rubber, excluding tyres
Plating and heat treatment
Acids
Alkalis
Inorganic chemicals
Reactive chemicals
Paints, resins, inks, organic sludges
Organic solvents
Pesticides
Oils
Putrescible/organic waste
Organic chemicals
Contaminated soils
Asbestos
Other soil/sludges
Clinical and pharmaceutical
Tyres
Other miscellaneous
Fly ash
Other materials reported by jurisdiction
The conversion of the current system to a flat database will be a significant task, involving careful transformation of 48 output sheets (eight jurisdictions and six years’ of data) with frequent quality checks. Figure 12 illustrates the change. The transparency of the record will be maintained.
Figure 12 Illustration of the current and revised data collation and warehousing system

Improving national waste data and reporting (revised v2)
Page 48
4.5 Data visualisations
In this section we firstly set out a general approach to data visualisation and then discuss specific visualisations and infographics
4.5.1 A general approach to data visualisation
Data visualisations are intended to communicate trends and patterns and should ‘add value’ to the reader’s understanding. A chart is not necessary when a simple sentence, table or number might better convey the meaning or narrative of a chart. The improvements outlined in Section 3.8.2 speak to the need and potential application of best practices in the design of visualisations. To enhance comprehension and navigation, data visualisations will be accompanied by visual language aids such as iconography and colour palettes, particularly where more illustrative ‘infographic’ outputs are sought. From a technical perspective, we also recognise that data visualisation must be data driven: meaning that any visualisation ‘tool’ should be directly connected to the ‘raw’ data (i.e. source of truth) wherever possible. While this is possible in carefully designed models using traditional tools like Excel, this can quickly become unwieldy and difficult to maintain as Excel functions as both a ’model’ and a ‘database’. Specialist visualisation tools are solving this problem by enabling dynamic and interactive charts to be more easily linked to raw data and controlled by users through the web browser: giving them more power to explore datasets through the visualisation tool, rather than purely consuming a pre-prepared chart. The capacity to publish visualisations natively to web browser (particularly with interactive features), greatly enhances the ability to share, communicate and update data in the future. In summary, the advantages of the agreed amended approach are:
• comparable preparation time (for visualisation design)
• more robust data handling (i.e. less data handling to prepare visualisations)
• streamlined update process for new data
• enhanced 'richer' visualisation options
• interactive reports (publishable online) can become standard
• no software licensing costs
• more immediate understanding of waste flows.

Improving national waste data and reporting (revised v2)
Page 49
Table 24 A general approach to data visualisation
Approach for NWR 2018 Contrast with approach in NWR 2016
34. Use Power BI linked to the Excel model/tool. This enables the production of an enhanced set of charts and tables that allow flexibility in visualisation and options for interactivity and sharing (e.g. on the web). Excluding the time to develop the database, the design and build time are comparable since:
- the authoring tools are designed specifically for this purpose
- building filterable charts means that lower-level charts can be easily replicated by simply filtering the master chart, e.g. a national trend chart can be filtered to individual state level.
The NWR 2016 used MS Excel to generate a series of charts and tables to visually summarises all key data. Charts and data tables were:
• generated within the Excel model/tool used for data collection and cleansing
• generally 'tied' together in presentation to allow users to see both the visual breakdown and comparison between groups (e.g. states) or a trend over time.
35. Create charts and tables from a flat master data table. Data only needs to be handled once (from input to master table).
The data for each individual chart and table needed to be manually summarised: calculated, formatted and checked before creating an Excel chart. This approach meant multiple handling of data for each chart/table and is prone to error.
36. Use infographics with recurring themes (bins, buildings, trucks) linked with Sankey diagrams. This provides for more immediate understanding of waste quantities, types, sources, management and fate.
Not used
37. Make national waste data available to external users using Power BI’s web-native dashboard capabilities. Our preferred option is for the Department to provide access on its website via an embedded iframe that we will create and provide. The iframe will link to and show a dashboard report hosted on a Microsoft PowerBI server. Users would be able to interrogate the data visually using this dashboard, based on the parameters of interest to them. There are no costs or licensing requirements for Power BI under this proposal.
Not used
Notes on the new approach
The native format of charts and tables is as an interactive data report or dashboard that can be readily filtered and presented in different visual forms. This allows visuals to be presented as interactive reports either as a Power BI Desktop file (which is ‘editable’), or published to and embedded in a website. Charts can also be extracted as static images for PDF reports, breaking the link between data and report.
Charts and tables were 'static' and suitable for copying into MS Word and PDF reports, breaking the link between the data and report.
Specialist visualisation tools generally provide more options for richer visualisations/types of charts. The default visualisations can be interacted with, for example, (cross) filtering options, hover/pop up information and highlights.
Available visualisations are limited by the options in MS Excel.
Any interactive reports can be quickly refreshed to reflect the updated data (including subsequent years’ data)
Updating data in charts and tables involves updating the data model and reissuing any PDF reports.
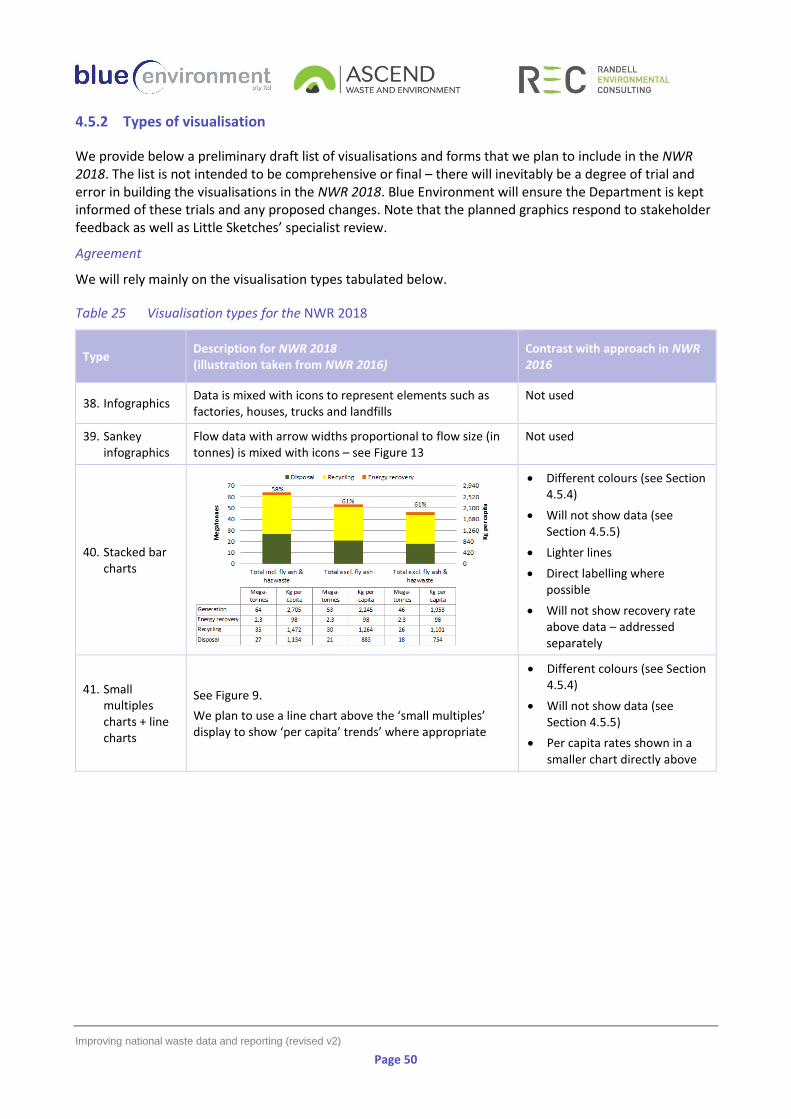
Improving national waste data and reporting (revised v2)
Page 50
4.5.2 Types of visualisation
We provide below a preliminary draft list of visualisations and forms that we plan to include in the NWR 2018. The list is not intended to be comprehensive or final – there will inevitably be a degree of trial and error in building the visualisations in the NWR 2018. Blue Environment will ensure the Department is kept informed of these trials and any proposed changes. Note that the planned graphics respond to stakeholder feedback as well as Little Sketches’ specialist review.
Agreement
We will rely mainly on the visualisation types tabulated below.
Table 25 Visualisation types for the NWR 2018
Type Description for NWR 2018 (illustration taken from NWR 2016)
Contrast with approach in NWR 2016
38. Infographics Data is mixed with icons to represent elements such as factories, houses, trucks and landfills
Not used
39. Sankey infographics
Flow data with arrow widths proportional to flow size (in tonnes) is mixed with icons – see Figure 13
Not used
40. Stacked bar charts
• Different colours (see Section 4.5.4)
• Will not show data (see Section 4.5.5)
• Lighter lines
• Direct labelling where possible
• Will not show recovery rate above data – addressed separately
41. Small multiples charts + line charts
See Figure 9.
We plan to use a line chart above the ‘small multiples’ display to show ‘per capita’ trends’ where appropriate
• Different colours (see Section 4.5.4)
• Will not show data (see Section 4.5.5)
• Per capita rates shown in a smaller chart directly above
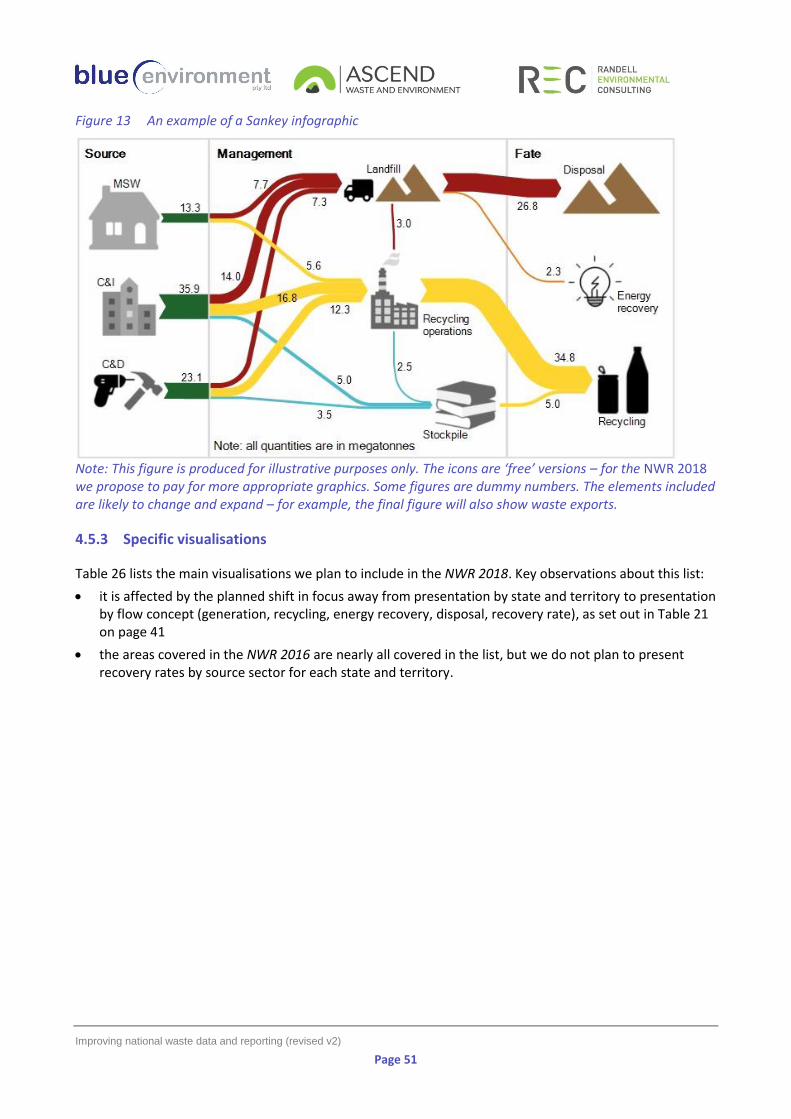
Improving national waste data and reporting (revised v2)
Page 51
Figure 13 An example of a Sankey infographic
Note: This figure is produced for illustrative purposes only. The icons are ‘free’ versions – for the NWR 2018 we propose to pay for more appropriate graphics. Some figures are dummy numbers. The elements included are likely to change and expand – for example, the final figure will also show waste exports.
4.5.3 Specific visualisations
Table 26 lists the main visualisations we plan to include in the NWR 2018. Key observations about this list:
• it is affected by the planned shift in focus away from presentation by state and territory to presentation by flow concept (generation, recycling, energy recovery, disposal, recovery rate), as set out in Table 21 on page 41
• the areas covered in the NWR 2016 are nearly all covered in the list, but we do not plan to present recovery rates by source sector for each state and territory.

Improving national waste data and reporting (revised v2)
Page 52
Table 26 Draft list of key visualisations
Section Type Description
42. At a glance Sankey infographic Macro-level waste flows in Australia, showing sources, management and fates (similar to Figure 13)
43. Generation section
Stacked bars Generation split by source sector, material, management, jurisdiction
Small multiples + line chart
Overall trends in generation by source sector (absolute) + per capita
44. Recycling section
Infographic Flows of material to recycling showing the different ‘data points’ (collected, processed, taken offsite)
Stacked bars Recycling split by source sector, materials, jurisdictions
Small multiples + line chart
Trends in recycling by source sector (absolute) + per capita
45. Energy recovery section
Stacked bars Energy recovery split by technology type, materials, jurisdictions
Small multiples + line chart
Trends in energy recovery by source sector (absolute) + per capita
46. Disposal section
Infographic Flows of waste to landfill showing source sector and energy recovery component
Stacked bars Disposal split by source sector, material, jurisdiction
Small multiples + line chart
Trends in waste to landfill showing disposal and energy recovery + per capita
47. Recovery rates section
Stacked bars Bar for each state showing percentage recycled and recovered for energy
Small multiples Trends in recovery rates by source sector
Trends in recovery rates by jurisdiction
48. Waste types
Stacked bars Generation for each material split by management
Small multiples Trends in generation by material
Small multiples Trends in recovery by material
49. Hazardous waste Sankey infographic Flows of hazardous waste to its various fates and pathways
4.5.4 Colour themes
For the NWR 2016 we used the following colour scheme for many of the charts: Recycling Energy recovery Disposal
We received comments from some readers that disposal should not be shown as green, but we should rather represent disposal with the colour red – the standard lid colour for domestic garbage bins.

Improving national waste data and reporting (revised v2)
Page 53
Agreement
50. For the NWR 2018 we provisionally propose to adopt the following colour scheme: Recycling Energy recovery Disposal
We say ‘provisionally’ propose because it will depend on:
• how the figures look in context, noting that we will not present recycling, energy recovery and disposal in close proximity in as many charts as previously
• the capacities of Power BI, which are yet to be explored in full. The above colour scheme works acceptably when converted to grey-scale. To test this on a PC computer, simultaneously press control/windows/c.
4.5.5 Linking visualisations with data
The NWR 2016 presented chart data below each chart, sharing the x-axis. MS Excel, the program used to produce the charts, provides an automated option for presenting chart data in this way. However, in the NWR 2016 the data presented with the charts was not always restricted to chart data – it also variously included relevant data that was not charted. This included, sometimes, additional data rows for non-charted generation quantities or recovery rates, and additional columns for uncharted average growth or for secondary axis data. Producing these tailored data charts was highly time-consuming, especially given significant rework between draft and final reports. The availability of data adjacent to the charts was not widely cited as a positive in stakeholder feedback. We believe the availability of a readily accessible flat database and standard Power BI data tables supersedes the need to provide tightly-linked chart data.
Agreement
51. For the NWR 2018 we will provide data tables with the data visualisations only when displaying ‘headline’ figures. These data tables would be separate from the chart as shown in Figure 9.
4.6 Standardising data and reporting on non-hazardous waste
States and territories do not all apply the same definitions and categories in their waste data reporting, or more broadly in their waste policy frameworks. This is problematic for national reporting and is a common source of industry complaint (including in our consultations reported in Section 3.2.1). It is also a matter that has been increasingly discussed between states and territories in recent months, particularly in the context of the difficulties of large cross-border flows. Similar issues apply in the hazardous waste area. The Department has worked towards improving these by preparing the hazwaste standard (BE et al. 2017), which was introduced in Section 2.1.2. The question arises – would a similar standard for non-hazardous wastes be useful? In the improvement workshops run with the states and territories (reported in Section 3.1) there were concerns that a national standard might create difficulties for states and territories where its definitions differ from their own, leading to confusion, potential difficulties in enforcement action, and pressure to make changes on an unfavourable timeline. There were also concerns about the scale of the task needed to make a comprehensive consensus document. However, there was also a consensus view that the national
Improving national waste data and reporting (revised v2)
Page 54
waste reporting process could help harmonise definitions and categories through a ‘this is where we want to get to’ type document. In considering how this issue might be advanced within the scope of the current project, another issue needs to considered. That is, for the purposes of transparency the consultants need to document the processes and definitions applied in developing the NWR 2018. This is not identical to the preparation of a national standard, but it overlaps with that function. The method applied for the NWR 2016 was not comprehensively documented. The most recent iteration of the method was in REC and BE (2015). We believe this needs to be updated and presented with the NWR 2018 so that the processes and definitions can be understood by readers.
Agreement
52. Provide a ‘method and national definitions’ appendix in the NWR 2018 that provides a dual function: - to describe the method and processes used in developing the NWR 2018 - to provide a foundation for a future national standard.
The appendix could indicate which methods and definitions it would be good to standardise nationally without being formally nominated as a standard. This approach would allow the issues to be collated and addressed without any strong implication that states and territories must or even should adopt the preferred approach. Jurisdictions and other stakeholders would have the opportunity to review and comment on the content at the draft report stage. After final publication, subsequent work could further develop a standard based on feedback, budgets and demand. The appendix would include:
• definitions of terms such as ‘diversion’, ‘recovery’ and ‘recycling’
• source classifications for MSW and C&I masonry materials, skip bins and disaster waste
• a description of the ‘reverse NGERs’ calculations of landfilled waste allocated to energy recovery.
4.7 Hazardous waste data improvements
Section 3.5, Table 10 lays out a list of issues pertinent to hazardous waste, with detailed findings against each. A common theme in potential improvements to Hazardous waste data collection processes, Hazardous waste data quality and Scope and definitions of reported parameters is the benefits of adoption of a nationally consistent tracking system. It is noted that this would be a complex and potentially long-term transition, but there are opportunities for incremental implementation, such as providing a system for those jurisdictions without one and/or designing it to manage interstate transactions initially, given the weaknesses in current tracking of these movements. The remaining issues from Table 10 are addressed through improvements that can be implemented by the consultants, as listed in Table 27 below.

Improving national waste data and reporting (revised v2)
Page 55
Table 27 Improvements to hazardous waste data
Issue Improvement Rationale
Use of hazardous waste data in the NWR 2018
53. Do not attempt to fully classify the fate of all hazardous waste
In the NWR 2016, outputs of hazardous wastes sent to chemical and physical treatment were assumed to be proportionally identical to the fates of wastes not sent to treatment. This was done to ‘shoehorn’ hazardous waste into the NWR fate categories. We are no nearer to discovering the true fate of these wastes. Under the restructure discussed in Table 21, this is not required – there is more scope for a specific discussion on waste fates and pathways.
Recording of the major contaminants in contaminated soils
54. Provide for the recording and analysis of contaminants in contaminated soil in the HWiA 2019 data collation
‘Contaminated’ soil, without reference to what contaminants are present, offers no information about contaminant nature and therefore the hazard posed. Most jurisdictions require laboratory testing to demonstrate what the hazards are. Recording of these contaminants should be encouraged by tracking systems and compiled in national data.
Should fly ash from coal-fired power stations be included in HWiA 2019?
55. HWiA 2019 should include a separate discussion on annual generation of power station fly ash, with figures consistent with NWR.
The potential for hazard is equivalent (or possibly higher) for coal-fired power station fly ash than for other types of fly ash (such as from energy-from-waste facilities) that are included in tracking systems under N150. Excluding the former creates an inconsistency without a clear rationale as to why. We note that fly ash was included in the NWR 2016.
Should other significant-volume potentially hazardous wastes that are poorly covered by tracking systems (e.g. red mud; CSG wastes) be included in HWiA 2019?
56. HWiA 2019 should discuss and report annual generation of red mud and other large-volume wastes with potential for hazard (that are not captured by tracking systems), where data or estimation methods can be credibly used.
There may be consistency problems in reporting/not reporting wastes from similar industries or processes as hazardous, not hazardous or simply not at all. The rationale for scoping what is part of hazardous and non-hazardous reporting needs to be explored and tested to ensure consistent logic is being applied.
The method to correct for multiple counting results in under-reporting for high-storaged wastes
57. When 2017-18 data has been received, review the multiple-counting adjustment method with respect to high-storaged wastes to ensure only short-term storage practices are subtracted when adjusting arisings to generation. Where it is evident for these wastes that storage is not short-term, these subtractions should not be made.
For some important wastes, such as C100 (from the CSG industry), the current method to subtract apparent double-counting due to storage releases results in significant under-reporting, because closer inspection of certificate data shows limited waste volumes coming out of storage infrastructure for these wastes.
A reliable and consistent national historical record of hazardous waste data does not currently exist back to 2010-11 (or beyond)
58. Fix up historical generation back to 2006-07, in line with the plan for non-hazardous waste data
The available time series data contains significant omissions (such as 3 years of missing NSW contaminated soils) and lacks consistent method and assumptions applied each year. Back casting by filling gaps and applying consistent assumptions would enable the historical record to be locked down, so that a better evaluation of trend could be conducted.

Improving national waste data and reporting (revised v2)
Page 56
Issue Improvement Rationale
Data collection and collation in the years when HWiA is not produced.
59. Tracking system data should be collated annually, even in the years that HWiA will not be produced.
It would be duplicative to ask states and territories for hazardous waste data in two forms (the Basel collation workbook and the disaggregated tracking data collation).
HWiA 2017 had a two-year lag between data period and publication
60. HWiA 2019 is intended to be based on data collected for 2017-18, the most current and fully completed financial year.
HWiA 2017 was published in 2017 based on data collected for 2014-15, as was the case in the previous HWiA 2015. This data is ‘old’ by the time the report is available to readers.
HWiA 2017 was controversial for some sectors, which delayed its release
61. A small and targeted industry preview of the draft report is proposed for HWiA 2019.
Government and industry reaction to CSG industry content in HWiA 2017 required briefing responses that delayed publication. This could have been alleviated to some extent with a small and targeted industry preview of the draft.
Vic/Qld mgt code R3 is incorrectly mapped to ‘recycling’ instead of ‘bio-degradation’ in national management codes
62. Correct the current mapping so that jurisdictional R3 codes translate to biodegradation in national management codes
This approach significantly increases apparent recycling of hazardous waste in national analysis, and correspondingly under-represents composting
EU guidance confirms that management code R3 includes “composting and other biol. transformation processes”, which has implications for the proposed long-term code R16
63. Consider correcting the hazwaste standard’s long-term management typology to consolidate R16 into R3. Assess the merits of EU alignment with the benefits of splitting out organic waste processing (the current R16) on its own.
The current long-term management code for R3 (and the subsequent R16) proposed in the hazwaste standard are inconsistent with newly discovered EU intent on R3.
Appendix D is inconsistent with current NSW/SA requirements for tracking tyres
64. Update Appendix D Gaps in waste tracking systems to identify new SA and NSW requirements to track tyres
The hazwaste standard is inconsistent with current requirements for tracking tyres.
4.7.1 Additional long-term proposal
We see no intrinsic need why NWR and HWiA should be developed in alternate years. The NWR requires data about hazardous waste, so needs to either: include old data from the previous HWiA; or require analysis of hazardous waste data outside the HWiA program. 65. We propose that a future NWR 2020 should incorporate HWiA 2020. We do not propose a realignment
within the scope of this contract.

Improving national waste data and reporting (revised v2)
Page 57
4.8 Structure of the National Waste Report 2018
Based on the agreed changes set out above, a draft table of contents for the NWR 2018 is given below.
Table 28 Draft table of contents of the NWR 2018
Section heading Comments and coverage
At a glance
Introduction Scope and definitions, report structure and data layout, data uncertainty
Waste generation Concepts, data. Includes mining waste.
Recycling Concepts, data, exports v. onshore (incl. waste to China & affected by bans), ref. to WA C&D stockpiles
Energy recovery Concepts, data, calorific values
Disposal Concepts, data. Includes long-term storages.
Resource recovery rates Concepts, data
Wastes by type Status, trends, going into more detail by type. Select ag. wastes (as listed in Table 19) may be included in the ‘organics’ section
International comparisons A report by Eunomia (2017) will help improve this component
Role of states and territories Overview, inventory of policies, contributions from states & territories, highlights, data peculiarities, uncertainties
Local government waste management Overview, services, quantities, composition, written contribution from ALGA
The waste sector Overview, economic value, infrastructure, written contributions from industry associations
Waste products Product stewardship waste E-waste Other products To the extent data is readily available
Packaging waste Concepts, data APCO data APCO has agreed to provide its data for inclusion CDS data
Reuse Tip shops
Litter and dumping Concepts, data – can refer to the broader term ‘waste crime’
Liquid waste
Current and emerging challenges Concise discussion incl. stockpiles, China bans, plastics in ocean, circular economy, waste fires, disaster waste, plus contribution from Boomerang Alliance
Context Population growth Economic growth Access to recycling markets Carbon policy Drivers of future waste generation /mgt
Method Data collation methods Differences from jurisdictional data Data quality Data sources Assumptions
Bibliography
Appendices Method and national definitions
Summary of improvements

Improving national waste data and reporting (revised v2)
Page 58
References
ABS (Australian Bureau of Statistics 2017) 4655.0 - Australian Environmental-Economic Accounts, 2017, available from: http://www.abs.gov.au/ausstats/[email protected]/Latestproducts/4655.0Main%20Features12017?opendocument&tabname=Summary&prodno=4655.0&issue=2017&num=&view= BE and AWE (Blue Environment and Ascend Waste and Environment 2017) Hazardous Waste in Australia 2017, prepared for the Department of the Environment and Energy, available from: http://www.environment.gov.au/protection/publications/hazardous-waste-australia-2017 BE et al. (Blue Environment, Ascend Waste and Environment and Randell Environmental Consulting 2017) Australian Hazardous Waste Data and Reporting Standard, 2017 Revision, available from: http://www.environment.gov.au/protection/national-waste-policy/publications/australian-hazardous-waste-data-reporting-standard BE and REC (Blue Environment and Randell Environmental Consulting 2017) National Waste Report 2016, prepared for the Department of the Environment and Energy, available from: http://www.environment.gov.au/protection/national-waste-policy/national-waste-reports/national-waste-report-2016 BoM (Bureau of Meteorology 2017) National Performance Report 2015-16, March, available from: http://www.bom.gov.au/water/npr/ Eunomia (2017) Recycling – Who Really Leads the World? Issue 2, available from: http://www.eunomia.co.uk/reports-tools/recycling-who-really-leads-the-world-issue-2/ Hyder Consulting (2011) Liquid waste assessment, prepared for the Department of Sustainability, Environment, Water, Population and Communities, available from: http://www.environment.gov.au/protection/national-waste-policy/publications/liquid-waste-assessment-report KMH Environmental (2013) Hazardous Waste Data Assessment, prepared for the Department of Sustainability, Environment, Water, Population and Communities, April, available from: http://www.environment.gov.au/protection/national-waste-policy/publications/hazardous-waste-data-assessment REC and BE (Randell Environmental Consulting and Blue Environment 2015) NWDCRS supporting documentation: SOPs, reporting tool user guide, and reporting guidance, prepared for the Australian Government Department of the Environment, August Resource Futures (2018) Assessment of Australia National Waste Report with comparison to other countries reporting methods, prepared for Blue Environment by George Cole, January.
Improving national waste data and reporting (revised v2)
Page 59
Appendix A The current national waste report method
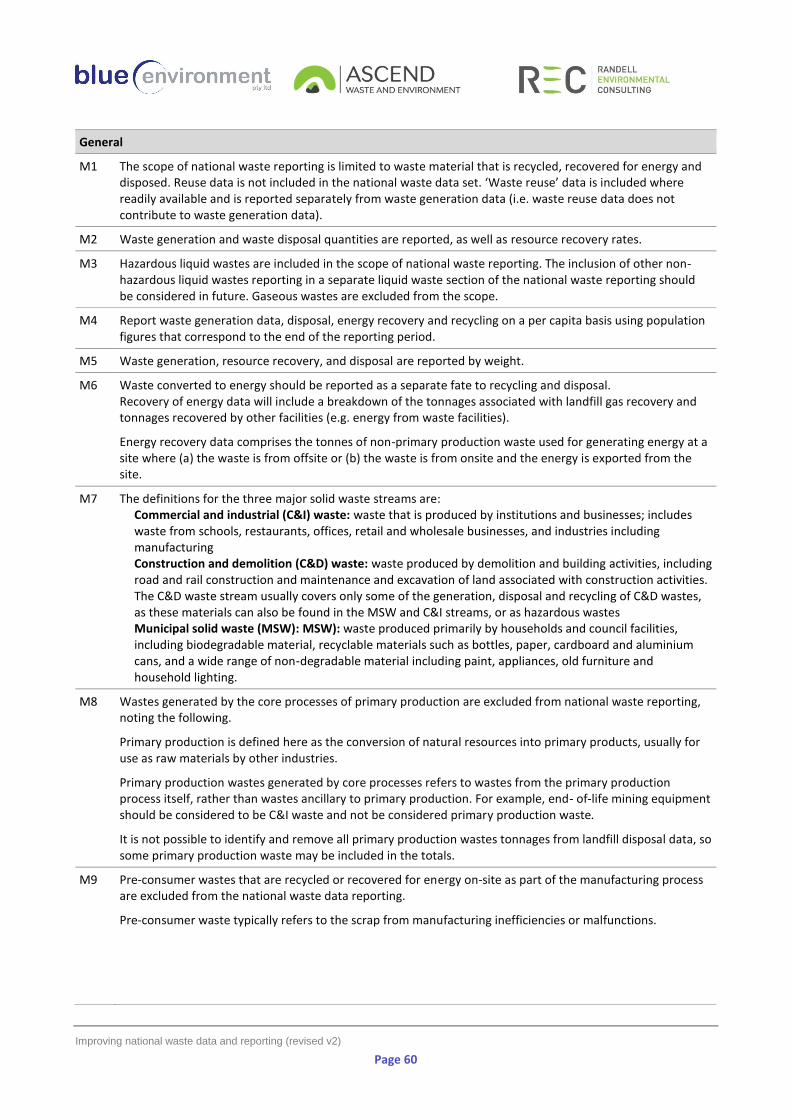
Improving national waste data and reporting (revised v2)
Page 60
General
M1 The scope of national waste reporting is limited to waste material that is recycled, recovered for energy and disposed. Reuse data is not included in the national waste data set. ‘Waste reuse’ data is included where readily available and is reported separately from waste generation data (i.e. waste reuse data does not contribute to waste generation data).
M2 Waste generation and waste disposal quantities are reported, as well as resource recovery rates.
M3 Hazardous liquid wastes are included in the scope of national waste reporting. The inclusion of other non-hazardous liquid wastes reporting in a separate liquid waste section of the national waste reporting should be considered in future. Gaseous wastes are excluded from the scope.
M4 Report waste generation data, disposal, energy recovery and recycling on a per capita basis using population figures that correspond to the end of the reporting period.
M5 Waste generation, resource recovery, and disposal are reported by weight.
M6 Waste converted to energy should be reported as a separate fate to recycling and disposal. Recovery of energy data will include a breakdown of the tonnages associated with landfill gas recovery and tonnages recovered by other facilities (e.g. energy from waste facilities).
Energy recovery data comprises the tonnes of non-primary production waste used for generating energy at a site where (a) the waste is from offsite or (b) the waste is from onsite and the energy is exported from the site.
M7 The definitions for the three major solid waste streams are: Commercial and industrial (C&I) waste: waste that is produced by institutions and businesses; includes
waste from schools, restaurants, offices, retail and wholesale businesses, and industries including manufacturing
Construction and demolition (C&D) waste: waste produced by demolition and building activities, including road and rail construction and maintenance and excavation of land associated with construction activities. The C&D waste stream usually covers only some of the generation, disposal and recycling of C&D wastes, as these materials can also be found in the MSW and C&I streams, or as hazardous wastes
Municipal solid waste (MSW): MSW): waste produced primarily by households and council facilities, including biodegradable material, recyclable materials such as bottles, paper, cardboard and aluminium cans, and a wide range of non‑degradable material including paint, appliances, old furniture and household lighting.
M8 Wastes generated by the core processes of primary production are excluded from national waste reporting, noting the following.
Primary production is defined here as the conversion of natural resources into primary products, usually for use as raw materials by other industries.
Primary production wastes generated by core processes refers to wastes from the primary production process itself, rather than wastes ancillary to primary production. For example, end- of-life mining equipment should be considered to be C&I waste and not be considered primary production waste.
It is not possible to identify and remove all primary production wastes tonnages from landfill disposal data, so some primary production waste may be included in the totals.
M9 Pre-consumer wastes that are recycled or recovered for energy on-site as part of the manufacturing process are excluded from the national waste data reporting.
Pre-consumer waste typically refers to the scrap from manufacturing inefficiencies or malfunctions.
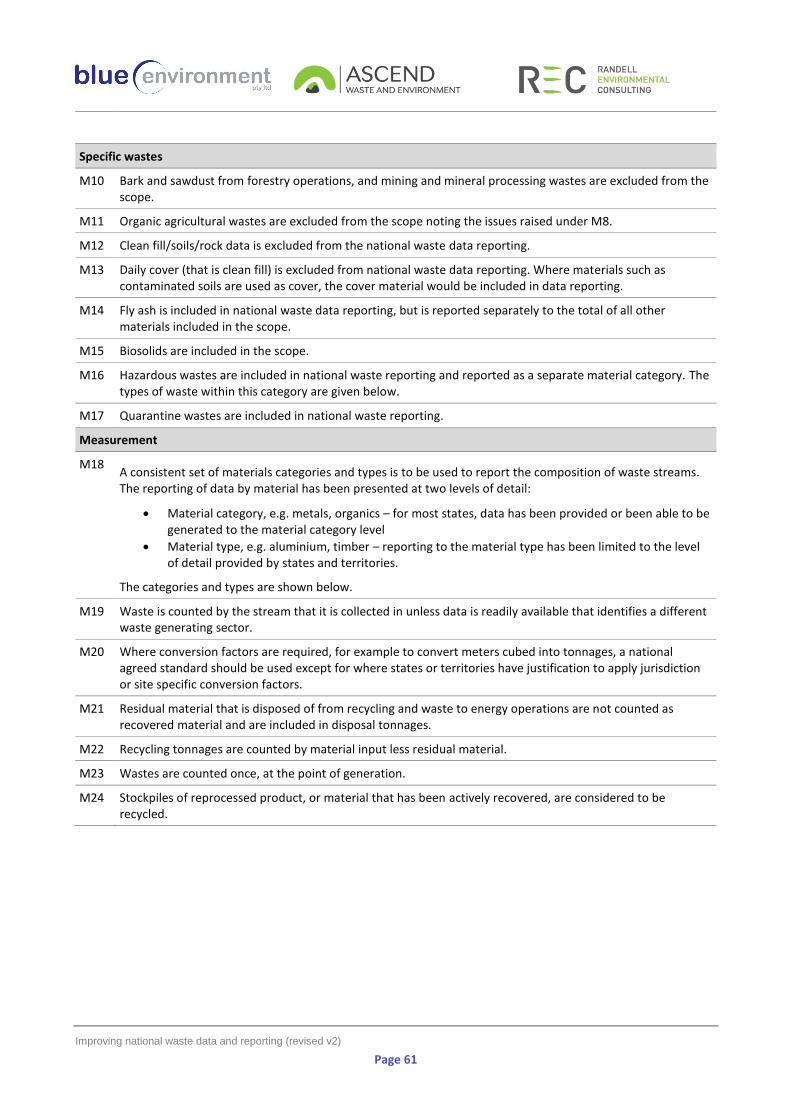
Improving national waste data and reporting (revised v2)
Page 61
Specific wastes
M10 Bark and sawdust from forestry operations, and mining and mineral processing wastes are excluded from the scope.
M11 Organic agricultural wastes are excluded from the scope noting the issues raised under M8.
M12 Clean fill/soils/rock data is excluded from the national waste data reporting.
M13 Daily cover (that is clean fill) is excluded from national waste data reporting. Where materials such as contaminated soils are used as cover, the cover material would be included in data reporting.
M14 Fly ash is included in national waste data reporting, but is reported separately to the total of all other materials included in the scope.
M15 Biosolids are included in the scope.
M16 Hazardous wastes are included in national waste reporting and reported as a separate material category. The types of waste within this category are given below.
M17 Quarantine wastes are included in national waste reporting.
Measurement
M18 A consistent set of materials categories and types is to be used to report the composition of waste streams. The reporting of data by material has been presented at two levels of detail:
• Material category, e.g. metals, organics – for most states, data has been provided or been able to be generated to the material category level
• Material type, e.g. aluminium, timber – reporting to the material type has been limited to the level of detail provided by states and territories.
The categories and types are shown below.
M19 Waste is counted by the stream that it is collected in unless data is readily available that identifies a different waste generating sector.
M20 Where conversion factors are required, for example to convert meters cubed into tonnages, a national agreed standard should be used except for where states or territories have justification to apply jurisdiction or site specific conversion factors.
M21 Residual material that is disposed of from recycling and waste to energy operations are not counted as recovered material and are included in disposal tonnages.
M22 Recycling tonnages are counted by material input less residual material.
M23 Wastes are counted once, at the point of generation.
M24 Stockpiles of reprocessed product, or material that has been actively recovered, are considered to be recycled.
Improving national waste data and reporting (revised v2)
Page 62
Appendix B Resource Futures assessment of the NWR (included as a separate PDF file)


