

PMA Technologies, LLC
Sheraton New Orleans Hotel | January 29 – 30, 2016
Technologies, LLC
– 30, 2016
PMA Technologies, LLC
Sheraton New Orleans Hotel | January 29 –
GUI PONCE DE LEON, PHD, GUI PONCE DE LEON, PHD, PEPEPE, , PMPPMP, LEED AP
IN PURSUIT OF IN PURRRRRRRRSUIT OF
RELIABLE SCHEDULESIntroducing NetPoint Numerati
Presentation Outline
Schedules encompassing thousands of activities contain overwhelming amounts of data. Even in the case of level 2 schedules, the volume of information increases greatly as updates and revised baselines are generated.
In this Keynote, Dr. Gui introduces new schedule analytics functionality in NetPoint for modeling and recasting attributes and data within a schedule or within two compared schedules. NetPoint schedule analytics provides meaningful schedule metrics and scores schedule reliability through a novel Schedule IQ™
algorithmic application of Core Traits of a Reliable Schedule.
30 January 2016 2

Biography
Gui Ponce de Leon, PhD, PE, PMP, LEED APCHIEF EXECUTIVE OFFICERPMA CONSULTANTS, LLC
Dr. Gui is one of our nation’s foremost planning and scheduling experts. His experience includes roles as investor’s developer, construction manager, program manager, forensic scheduler, EPC contractor planner/scheduler, and expert witness. Dr. Gui has pioneered innovations in project management throughout his career. With GPM, he is on a quest to transform scheduling from tasks performed by specialists using a black box to stakeholder-centric processes that promote collaboration, enhance stakeholder interaction, and inherently result in reliable schedules.
30 January 2016 3
Why Not Aspire to Great Schedules
30 January 2016
“Construction scheduling, as we know it, has been practiced
for over 50 years. This being the case, stakeholders responsible for delivering a project should be entitled to a great, not just a good, schedule. A great schedule is authored, understood, and followed by key stakeholders─as opposed to by just one savvy scheduler. A great schedule is a credible predictor of credible performance, both at the onset and as the project progresses. Lastly, a great schedule is free of technical deficiencies.” Lastly, a great schedule is free of technical deficiencies.”
30 January 201630 January 2016
Foreword to Core Traits of a Reliable Schedule
4
Foreword to Core Traits of a Reliable Schedule
“The authors posit that a schedule that is comprehensive,
credible, well constructed, and controlled (considered the four corners of a reliable schedule) captures the notion of a great schedule.”
Reliability is the Sine Qua Non of Great Schedules
30 January 2016 5

Topics Selected for Discussion
30 January 2016
A Reliable Schedule Standards
B Metrics Analysis Supports Standards
C NetPoint v5.2 Schedule Analytics
D Schedule IQ™
6
RELIABLE SCHEDULE STANDARDS
A

Reliable Schedule Standards
30 January 2016
National Defense Industrial Association (NDIA) Planning & Scheduling Excellence Guide (PASEG) Introduces generally accepted scheduling principles
GAO Schedule Assessment GuideDiscusses ‘Ten Best Practices’ associated with high-quality and reliable project schedules
Core Traits of a Reliable Schedule aka The 20-Trait Protocol Codifies the essential elements of reliable schedules into 20 core traits
2011 & 2012
2014
GAODiscusses high
20122012 2015
8
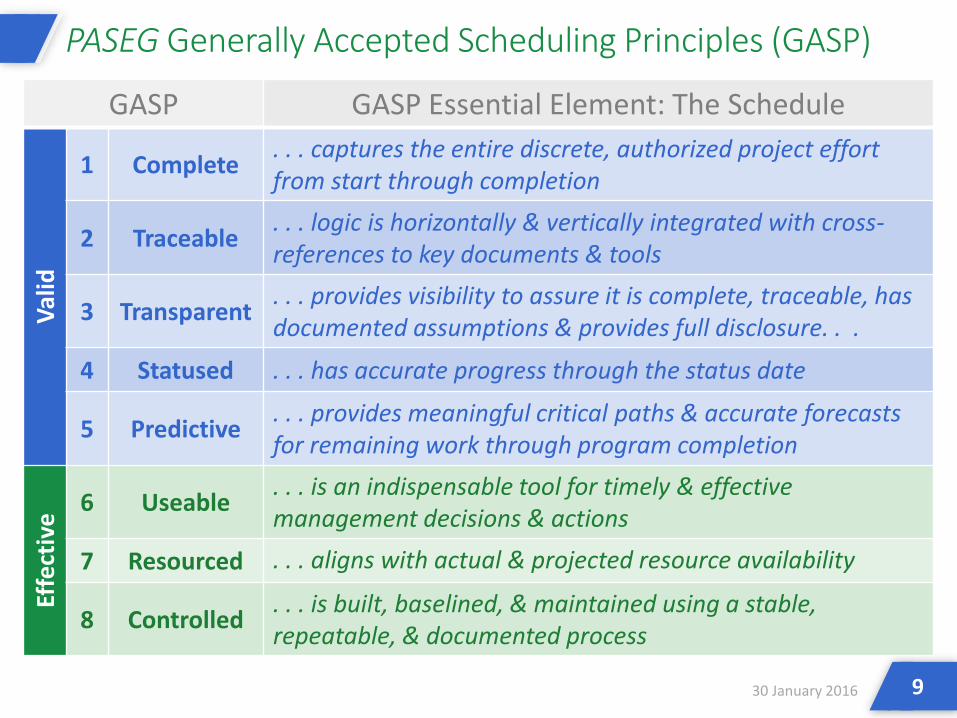
PASEG Generally Accepted Scheduling Principles (GASP)
30 January 2016
GASP GASP Essential Element: The Schedule
Valid
1 Complete . . . captures the entire discrete, authorized project effort from start through completion
2 Traceable . . . logic is horizontally & vertically integrated with cross-references to key documents & tools
3 Transparent . . . provides visibility to assure it is complete, traceable, has documented assumptions & provides full disclosure. . .
4 Statused . . . has accurate progress through the status date
5 Predictive . . . provides meaningful critical paths & accurate forecasts for remaining work through program completion
Effe
ctiv
e 6 Useable . . . is an indispensable tool for timely & effective management decisions & actions
7 Resourced . . . aligns with actual & projected resource availability
8 Controlled . . . is built, baselined, & maintained using a stable, repeatable, & documented process
9
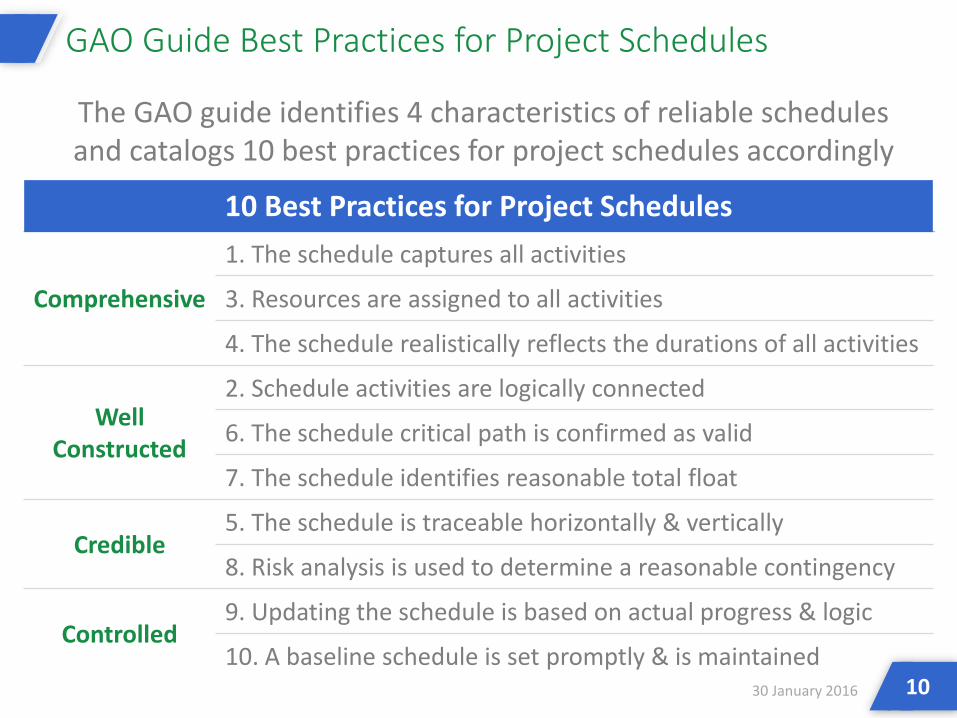
The GAO guide identifies 4 characteristics of reliable schedules and catalogs 10 best practices for project schedules accordingly
GAO Guide Best Practices for Project Schedules
30 January 2016
10 Best Practices for Project Schedules
Comprehensive
1. The schedule captures all activities
3. Resources are assigned to all activities
4. The schedule realistically reflects the durations of all activities
Well Constructed
2. Schedule activities are logically connected
6. The schedule critical path is confirmed as valid
7. The schedule identifies reasonable total float
Credible5. The schedule is traceable horizontally & vertically
8. Risk analysis is used to determine a reasonable contingency
Controlled9. Updating the schedule is based on actual progress & logic
10. A baseline schedule is set promptly & is maintained 10

Traits in green have elements in common with a GAO best practice for project schedules
Reliable Construction Schedules per the 20-Trait Protocol
The Schedule Is Comprehensive
The Schedule Is Credible
The Schedule Is Well Constructed
The Schedule Is Controlled
A1 Aligned B1 Predictive C1 Hierarchical D1 Statused
A2 Complete B2 Risked C2 Phased D2 Weathered
A3 Conforming B3 Weather Fit C3 Logical D3 Re-baselined
A4 Formulaic B4 ResourceFlowing C4 Connected D4 Forensic
A5 Resourced B5 Flexible C5 Calendar-Fit D5 Trended
30 January 2016 11

METRICS ANALYSIS SUPPORTS STANDARDS
B
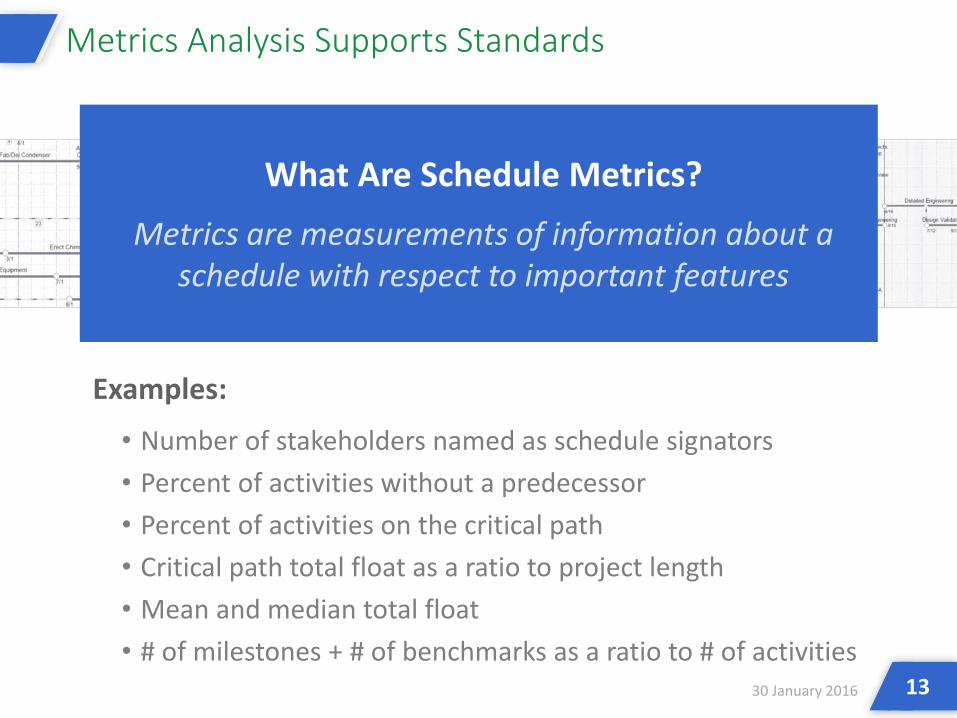
Metrics Analysis Supports Standards
Examples:• Number of stakeholders named as schedule signators• Percent of activities without a predecessor• Percent of activities on the critical path • Critical path total float as a ratio to project length• Mean and median total float• # of milestones + # of benchmarks as a ratio to # of activities
What Are Schedule Metrics? Metrics are measurements of information about a
schedule with respect to important features
30 January 2016 13

Relevant schedule counts and
schedule attributes that characterize
the schedule:# of negative-total-
float activities# of milestones# of calendars# of resources
# of redundant links
Schedule Metrics Can Be Categorized Into Three Sets
Key schedule parameters relative to a normative range and schedule performance
(execution) metricsCritical path indexMilestone densityCompletion index
Float performance indexSchedule index
Quantify and help identify variances for
selected filters between two schedule
issues for a project
Reliability Metrics
1
Comparative Metrics
Data Metrics
2 3
30 January 2016 14
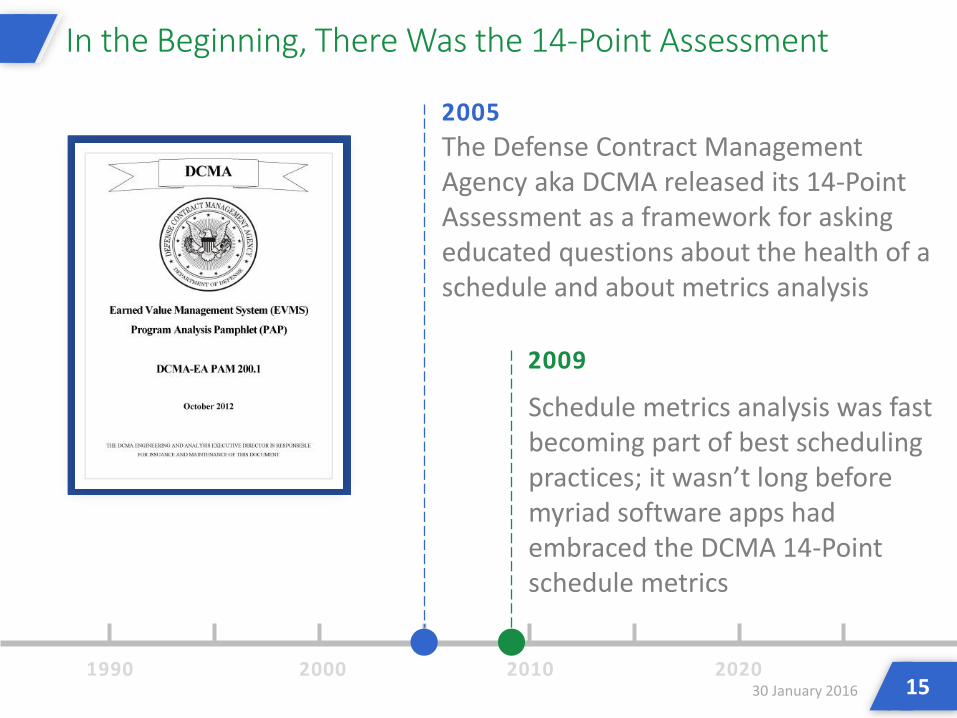
In the Beginning, There Was the 14-Point Assessment
2010
Schedule metrics analysis was fast becoming part of best scheduling practices; it wasn’t long before myriad software apps had embraced the DCMA 14-Point schedule metrics
2009
The Defense Contract Management Agency aka DCMA released its 14-Point Assessment as a framework for asking educated questions about the health of a schedule and about metrics analysis
2005
20001990 202030 January 2016 15

The 14-Point Assessment in a Nutshell
# 14-Point Assessment Metrics1 At most, 5% of remaining activities may be with open ends
2 There should be NO leads/negative lags
3 At most, 5% of FS logic ties should have lags
4 At least 90% of logic ties should be FS logic
5 At most, 5% of activities have imposed hard constraints
6 At most, 5% of remaining activities have total float ≥ 44 days*
7 There are NO activities with negative total float
8 At most, 5% of remaining activities have duration ≥ 44 days*
* Metric is not schedule-level sensitive30 January 2016 16

The 14-Point Assessment in a Nutshell (cont’d)
# 14-Point Assessment Metrics9 No remaining/actualized activities left/right of data date
10 Activities with duration > 0 should be resource loaded
11 At most, 5% of activities missed their baseline finish dates
12 A delay on a critical activity equally extends the schedule
13 Critical path length index (CPLI) = (critical path length + critical path total float) / critical path length ≥ 0.95**
14 Baseline execution index (BEI) = # of activities completed / (# of activities completed + # of activities missing their baseline finish dates) ≥ .95
30 January 2016 17** Incoherent vis-à-vis metric #7
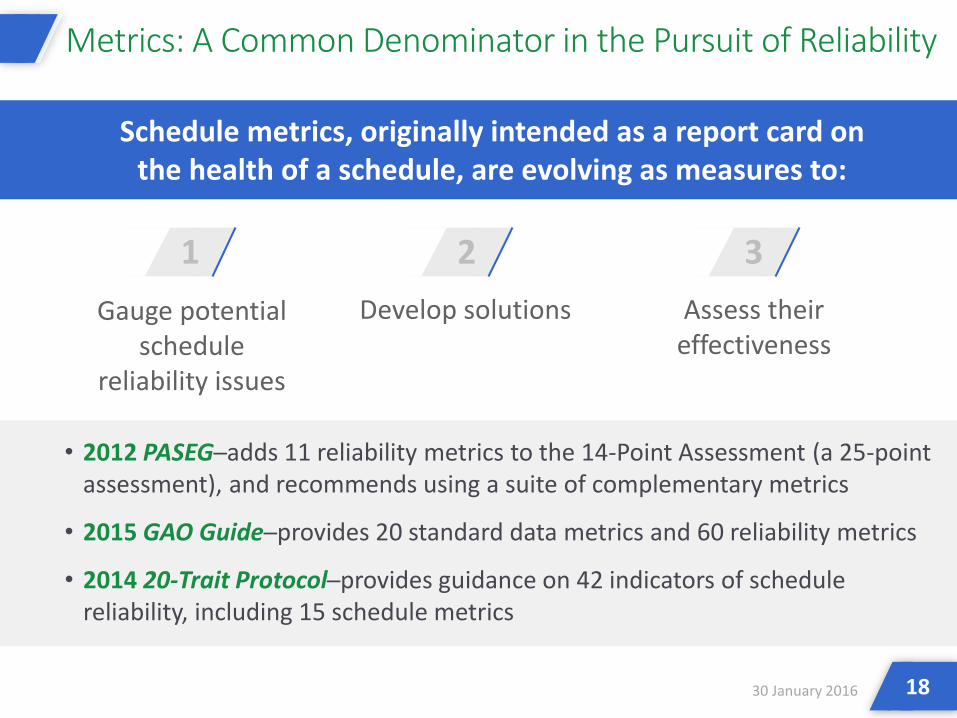
Schedule metrics, originally intended as a report card on the health of a schedule, are evolving as measures to:
Metrics: A Common Denominator in the Pursuit of Reliability
• 2012 PASEG─adds 11 reliability metrics to the 14-Point Assessment (a 25-point assessment), and recommends using a suite of complementary metrics
• 2015 GAO Guide─provides 20 standard data metrics and 60 reliability metrics
• 2014 20-Trait Protocol─provides guidance on 42 indicators of schedule reliability, including 15 schedule metrics
Gauge potential schedule
reliability issues
1Develop solutions
2Assess their
effectiveness
3
30 January 2016 18

Selected PASEG Schedule Execution Metrics
Critical path length index (CPLI) Favorable if > 1.00, unfavorable otherwise
Schedule performance index (SPI) Favorable if > 1.00, unfavorable otherwise
Baseline execution index (BEI) Favorable if > 1.00, unfavorable otherwise
Current execution index (CEI) At least 80% of activities scheduled to finish in the prior update actually finished
Total float consumption index(TFCI)
[applied to project duration to predict critical path total float
(CPTF) at completion]
(Critical path length up to data date + critical path total float) / critical path length up to data dateFor example, if after 100 days of progress, a 250-day project is 10 days behind schedule (CPTF = -10), the project will complete (250 / 100) x -10, or -25 days behind schedule
SPI = budgeted cost of work performed / budgeted cost of work scheduled
30 January 2016 19
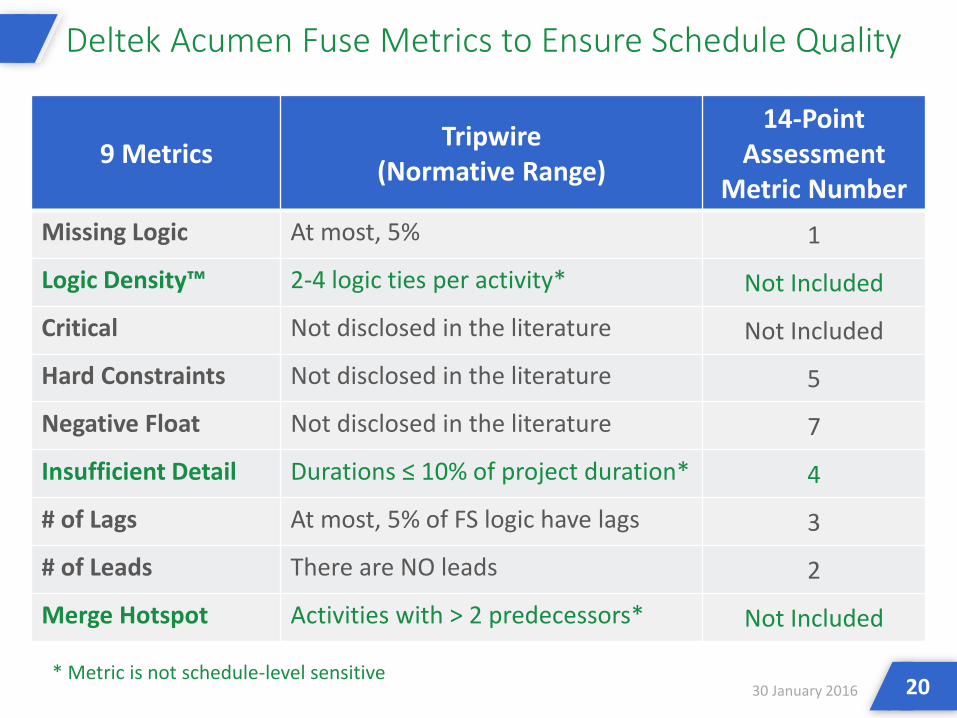
Deltek Acumen Fuse Metrics to Ensure Schedule Quality
9 Metrics Tripwire(Normative Range)
14-Point Assessment
Metric NumberMissing Logic At most, 5% 1
Logic Density™ 2-4 logic ties per activity* Not Included
Critical Not disclosed in the literature Not Included
Hard Constraints Not disclosed in the literature 5
Negative Float Not disclosed in the literature 7
Insufficient Detail Durations ≤ 10% of project duration* 4
# of Lags At most, 5% of FS logic have lags 3
# of Leads There are NO leads 2
Merge Hotspot Activities with > 2 predecessors* Not Included
* Metric is not schedule-level sensitive30 January 2016 20

Deltek Acumen Fuse Schedule Quality Index™
Average Fuse Schedule Index for 13 months for thousands of projects as reported by Deltek
30 January 2016 21
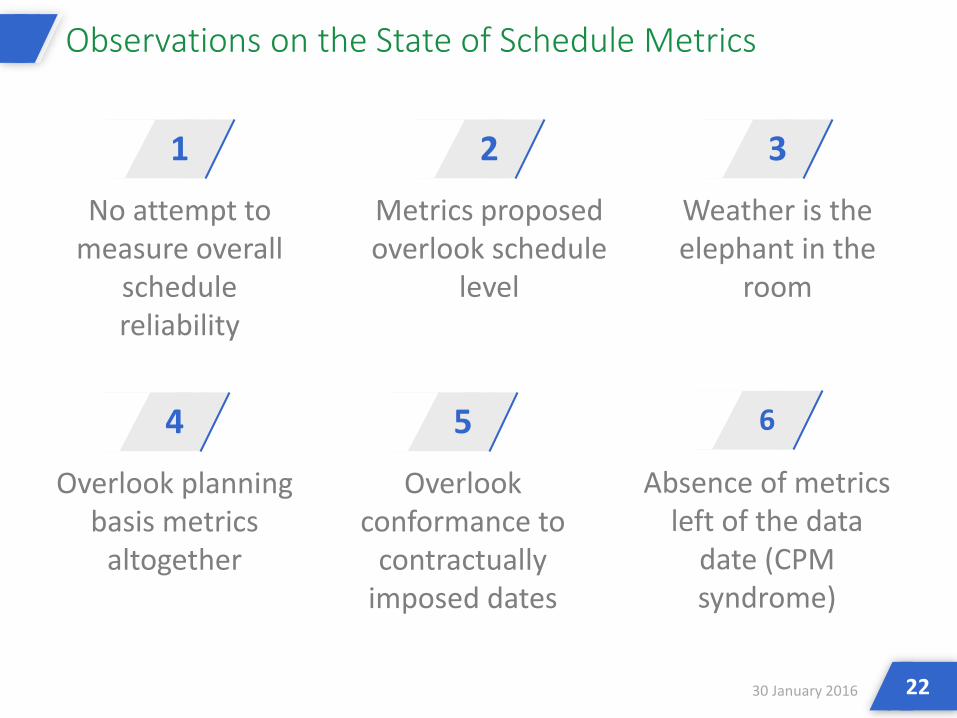
Observations on the State of Schedule Metrics
1
No attempt to measure overall
schedule reliability
2
Metrics proposed overlook schedule
level
3
Weather is the elephant in the
room
4
Overlook planning basis metrics
altogether
5
Overlook conformance to
contractually imposed dates
30 January 2016 22
6
Absence of metrics left of the data
date (CPM syndrome)
NETPOINT V5.2 SCHEDULE ANALYTICS
C
• Data metrics, i.e., varying activity counts, logic counts, and other relevant schedule counts
• Up to 45 metrics are analyzed and combined into Schedule IQ™, a reliability score for baselines and updates
• Weather enabling protocol that uses weather calendars to calculate “weathered start dates” and “weathered finish dates”
• Comparative analysis pinpoints changes between a current baseline or an update against a prior baseline, update, or target
NetPoint v5.2 Schedule Analytics
Measure, score, validate, and enable schedule reliability through an interactive, flexible application of the 20-Trait Protocol using the
comprehensive, credible, well-constructed, and controlled framework
30 January 2016 24

NetPoint v5.2 Schedule Analytics Framework
The Schedule Is:NetPoint Schedule Metrics
NetPointReliability Indicators
Captures 14-Point
Assessment Metric Number
Comprehensive
Over 200
10 8 & 10
Credible 5 6, 7 & 13
Well Constructed 10 1, 2, 3, 4 & 5
Controlled 5 9, 11, 12 & 14
30 January 2016
A 30-Point Assessment
25
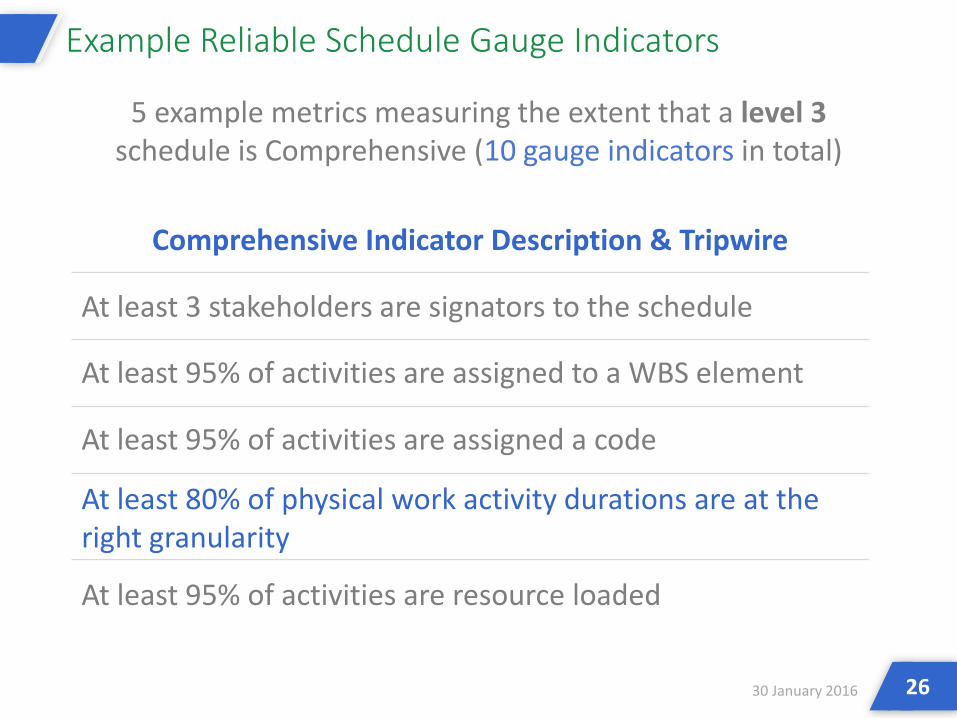
5 example metrics measuring the extent that a level 3 schedule is Comprehensive (10 gauge indicators in total)
Example Reliable Schedule Gauge Indicators
30 January 2016 26
Comprehensive Indicator Description & Tripwire
At least 3 stakeholders are signators to the schedule
At least 95% of activities are assigned to a WBS element
At least 95% of activities are assigned a code
At least 80% of physical work activity durations are at the right granularity
At least 95% of activities are resource loaded

Normative activity duration ranges (major projects, per the 20-Trait Protocol and PMI’s CPM Scheduling for Construction)
Example Physical Work Activity Duration Granularity
20-Trait Protocol DCMA Deltek Fuse
PMI CPM Scheduling
Level 1 2 - 12 months
≤ 44 days≤ 10% of project
duration
3-12 months
Level 25% - 15% of project
duration, generally 6 weeks - 6 months
2-6 months
Level 31% - 3% of project
duration, generally 2 - 6 weeks
2-6 weeks
Level 4≤ 1% of project
duration, generally ≤ 2 weeks
2-4 weeks
30 January 2016 27

5 example metrics measuring the extent that a level 3 schedule is credible (5 gauge indicators in total)
Example Reliable Schedule Gauge Indicators
30 January 2016 28* CPI can be calculated for every contractual milestone and contractual benchmark
Credible Indicator Description & Tripwire
Critical path index (CPI) = (critical path total float (adjusted for weather) / remaining project length) is between 5% and 10%*
15% to 30% of activities are on the critical path
Likelihood of completing by the required finish date ≥ 70%
Weather index = (weather dates per year / # of reasonable weather days per year) ≥ 95%
Float performance index ≥ 80%
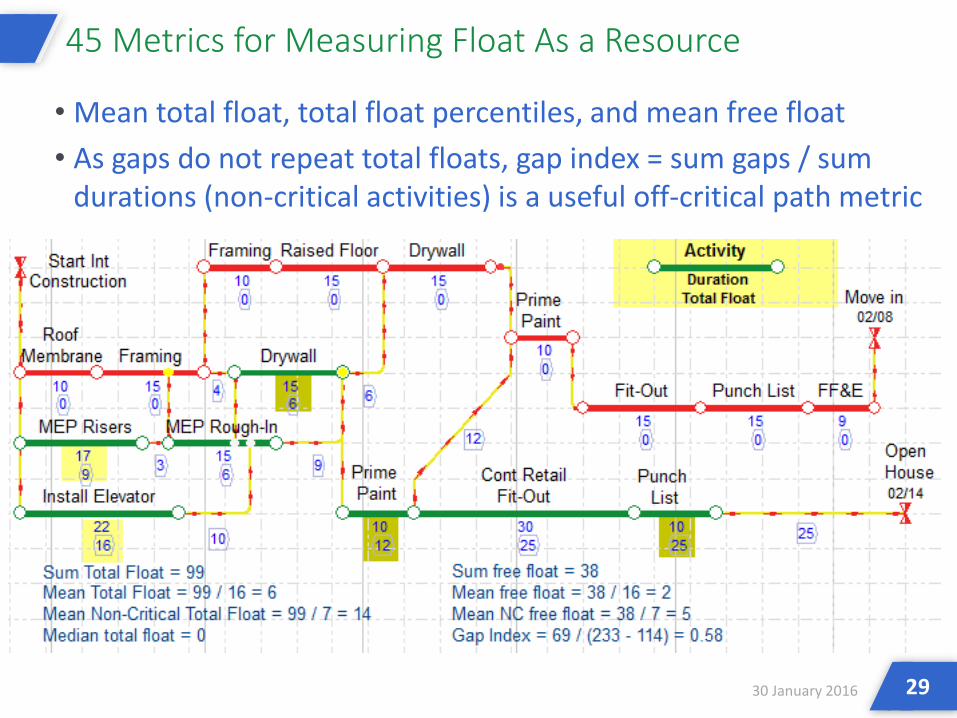
• Mean total float, total float percentiles, and mean free float• As gaps do not repeat total floats, gap index = sum gaps / sum
durations (non-critical activities) is a useful off-critical path metric
45 Metrics for Measuring Float As a Resource
30 January 2016 29

FPI measures the rate of float depletion off the critical path
FPI relies on gap indices vs. on total floats or free floats
Float Performance Index (FPI)
30 January 2016 30
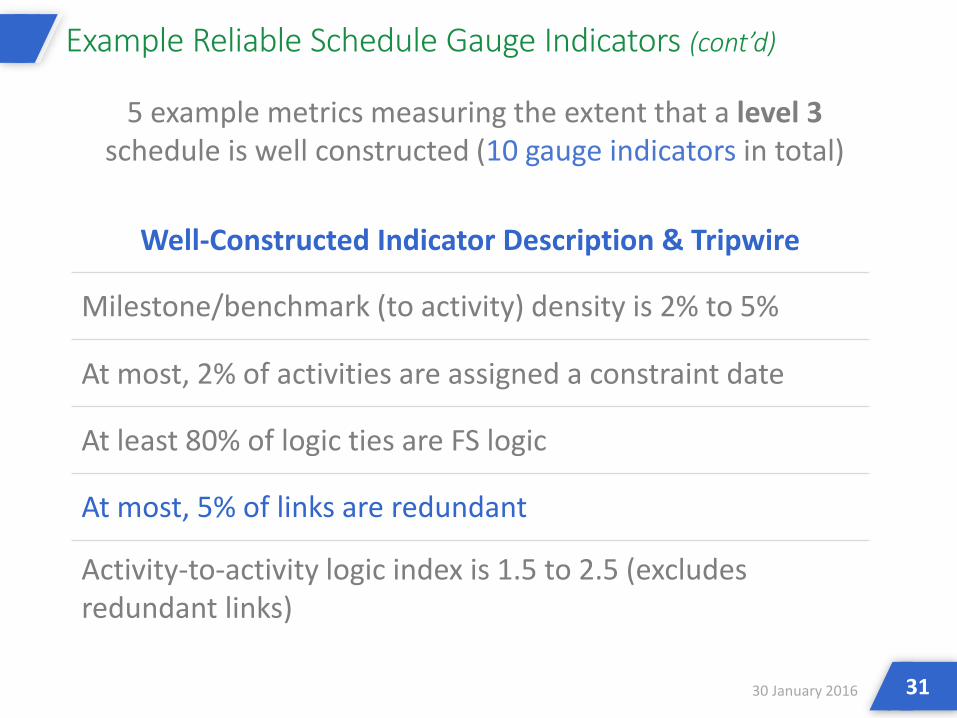
Example Reliable Schedule Gauge Indicators (cont’d)
5 example metrics measuring the extent that a level 3schedule is well constructed (10 gauge indicators in total)
30 January 2016 31
Well-Constructed Indicator Description & Tripwire
Milestone/benchmark (to activity) density is 2% to 5%
At most, 2% of activities are assigned a constraint date
At least 80% of logic ties are FS logic
At most, 5% of links are redundant
Activity-to-activity logic index is 1.5 to 2.5 (excludes redundant links)
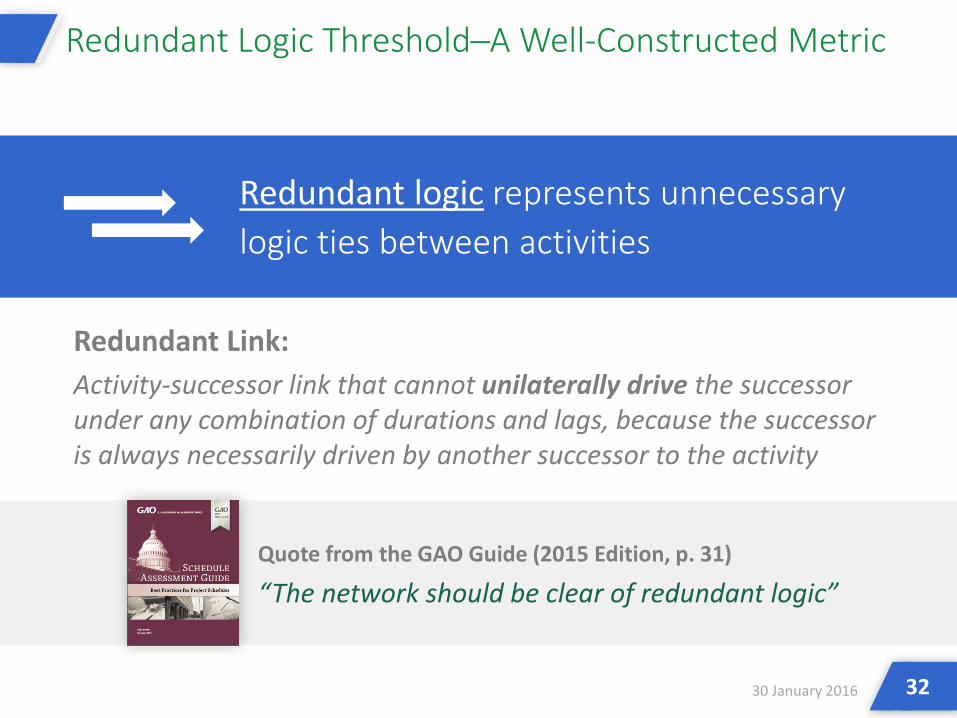
Redundant Link: Activity-successor link that cannot unilaterally drive the successor under any combination of durations and lags, because the successor is always necessarily driven by another successor to the activity
Redundant Logic Threshold─A Well-Constructed Metric
Redundant logic represents unnecessary logic ties between activities
30 January 2016
Quote from the GAO Guide (2015 Edition, p. 31)
“The network should be clear of redundant logic”
Quote from the GAO Guide (2015 Edition, p. 31)
32

The classic and indeed most obvious case of redundant logic comprises Activity A preceding Activity B on FS logic, Activity B preceding Activity C
on FS logic, making─if included─an FS link between Activities A and C unnecessary and thus redundant
Redundant Logic Example
Redundant links cause fictive parallel relationships or path convergence and needlessly obfuscate the display of the schedule
P
O
P
A C
B
30 January 2016 33
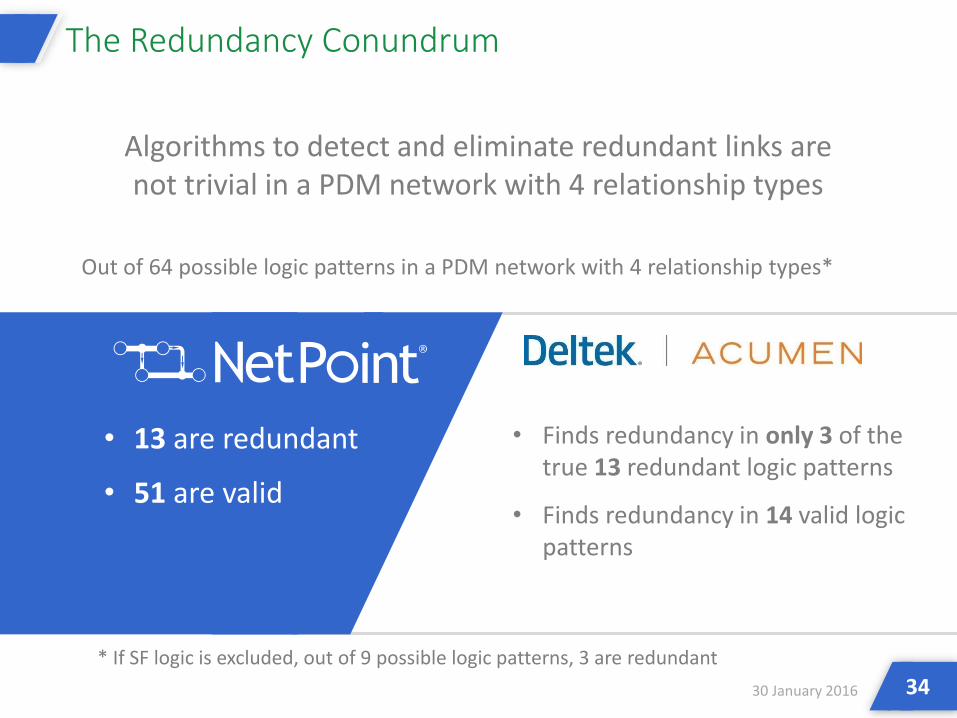
Algorithms to detect and eliminate redundant links are not trivial in a PDM network with 4 relationship types
The Redundancy Conundrum
Out of 64 possible logic patterns in a PDM network with 4 relationship types*
• Finds redundancy in only 3 of the true 13 redundant logic patterns
• Finds redundancy in 14 valid logic patterns
• 13 are redundant
• 51 are valid
30 January 2016
* If SF logic is excluded, out of 9 possible logic patterns, 3 are redundant34

SCHEDULE IQ™
D

Algorithmic application of the 20-Trait Protocol as postulated in Automate This: How Algorithms Came to Rule Our World by Christopher Steiner
Schedule IQ™
Planning basis (e.g., contract dates conformance, extent that activities are WBS coded, weather basis, etc.)
Network characteristics (open ends, logic index, % of links that are FS, etc.)
1 2
Algorithm that provides an overall reliability score for project schedules based on:
30 January 2016 36

Schedule IQ™ Inner Workings─Un-progressed Baselines
Schedule IQ™ operates as a series of 39 independent reliability indicator tests, each test yielding a score
that contributes to the total score (100)
Un-progressed Baseline
# of Independent
Tests
Contribution to IQ Score
Comprehensive 12 34%
Credible 11 25%
Well Constructed 15 38%
Controlled 1 3%
30 January 2016 37
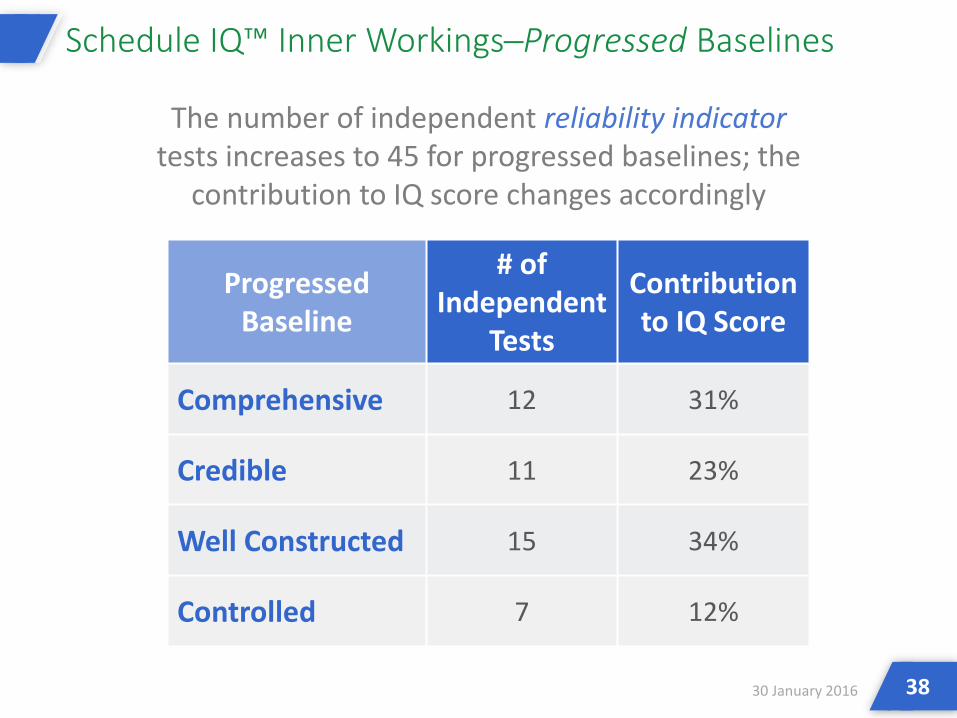
Schedule IQ™ Inner Workings─Progressed Baselines
The number of independent reliability indicatortests increases to 45 for progressed baselines; the
contribution to IQ score changes accordingly
Progressed Baseline
# of Independent
Tests
Contribution to IQ Score
Comprehensive 12 31%
Credible 11 23%
Well Constructed 15 34%
Controlled 7 12%
30 January 2016 38

Interpretation of Schedule IQ™ Scores
30 January 2016 39
IQ Range
Somewhat Reliable Schedule
Unreliable Schedule
≥ 91
81-9061-8051-60≤ 50
Reliable ScheduleHighly Reliable Schedule
Marginally Reliable Schedule
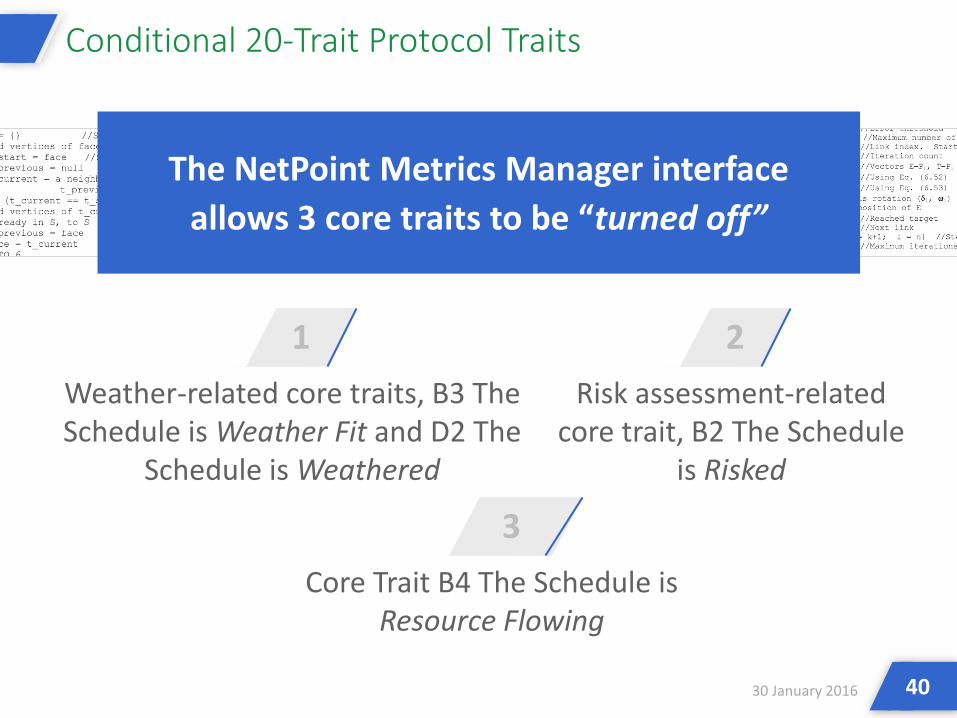
Conditional 20-Trait Protocol Traits
Weather-related core traits, B3 The Schedule is Weather Fit and D2 The
Schedule is Weathered
Risk assessment-related core trait, B2 The Schedule
is Risked
1 2
The NetPoint Metrics Manager interface allows 3 core traits to be “turned off”
30 January 2016
Core Trait B4 The Schedule is Resource Flowing
3
40
If activities are not resource loaded
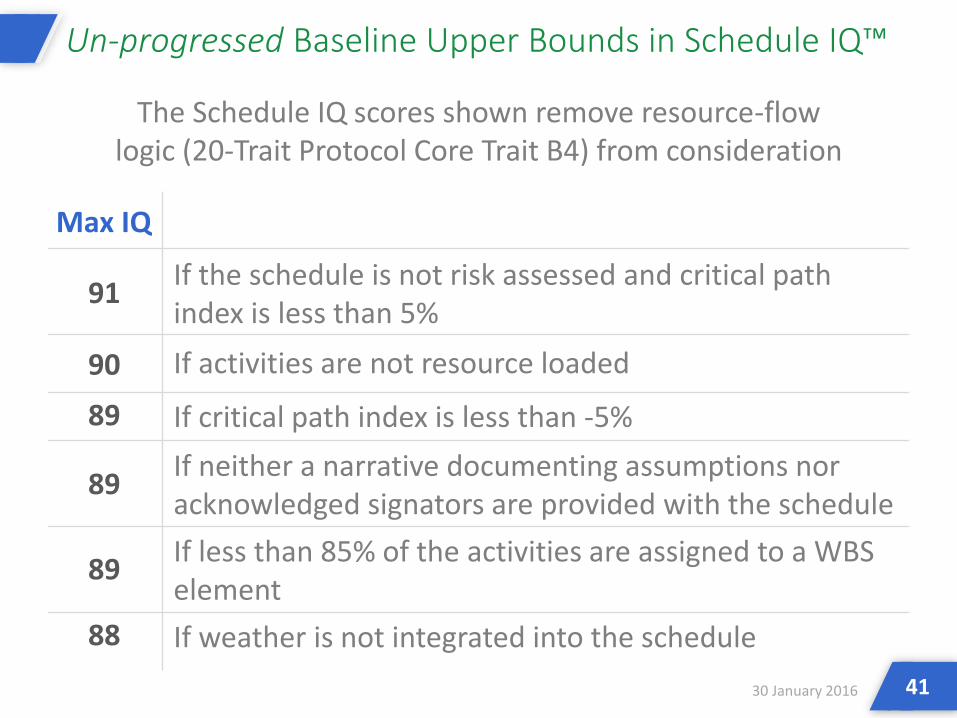
Un-progressed Baseline Upper Bounds in Schedule IQ™
30 January 2016
The Schedule IQ scores shown remove resource-flow logic (20-Trait Protocol Core Trait B4) from consideration
41
If the schedule is not risk assessed and critical path index is less than 5%
If critical path index is less than -5%
If less than 85% of the activities are assigned to a WBS element
If neither a narrative documenting assumptions nor acknowledged signators are provided with the schedule
If weather is not integrated into the schedule
91
9089
89
89
88
Max IQ

SUMMARY
E

Take-Aways
Metrics analysis is crucial for the typical
level 3 master schedule
NetPoint metrics functionality advances
schedule analytics from the well constructed and
credible to the reliable realm
There is much to be learned about the behavior of critical
path, total float, & gap metrics relative to percent complete
No judgment is made in Schedule IQ™ as to means
& methods portrayed in the schedule
30 January 2016
1 2
3 4
43

Take-Aways (cont’d)
The IQ score of a contractually required
schedule submittal may be useful as a protocol to determine whether the submittal is reviewable
or, say where IQ is below 60, should be returned
for revision and resubmittal
Schedule analytics and Schedule IQ™ can be applied to any group
of activities by a filter or time window to ascertain whether the
score is/is not homogeneous
Schedule analytics needs to evolve to measure period
density, activity count, activity count growth, earned schedule, and
other yet untested metrics30 January 2016
5 6
7
44

AACE International. AACE International Recommended Practice No. 38R-06 Documenting the Schedule Basis, 2009.
AACE International. AACE International Recommended Practice No. 84R-13 Planning and Accounting for Adverse Weather, 2015.
Bachman, D. Better Schedule Performance Assessments Derived from Integrated Master Plan-Referenced Schedule Metrics. Fort Belvoir, VA: Defense Acquisition University, 2011.
Baker, S. The Numerati. New York: Houghton Mifflin Company, 2008.Carson, C. Planning for Adverse Weather Conditions in Construction Projects. Web only: Alpha
Corporation, 2010.Carson, C. , Oaklander, P. and Relyea, C., eds. CPM Scheduling for Construction, Best Practices
and Guidelines. Newtown Square: Project Management Institute, 2014. Defense Contract Management Agency. Earned Value Management System. Washington DC:
Author, 2012.Deltek, Inc. 9 Metrics to Ensure Schedule Quality. Author. 2012.National Defense Industrial Association. Planning & Scheduling Excellence Guide (PASEG) v. 2.0.
Washington DC: Author, 2012.Patterson, D. Building a Sound Schedule in an Enterprise Environment Using Schedule Metric
Analysis. PMICOS webinar, May 2012.Patterson, D. "Does Better Scheduling Drive Execution Success?" Project Acumen, May 2012.
Bibliography
30 January 2016 45

Ponce de Leon, G. et al. Guide to the Forensic Scheduling Body of Knowledge Part I. Ann Arbor: PMA Consultants, LLC, 2010.
Ponce de Leon, G., Field, D., & Zann, J. “Force Majeure Weather Modeling.” PMI College of Scheduling 7th Annual Conference.
Ponce de Leon, G. & Spittler, P. “Scheduling a Project at Different Levels.” PMI College of Scheduling 8th Annual Conference.
Ponce de Leon, G. et al. Core Traits of a Reliable Schedule. Ann Arbor: PMA Consultants, LLC, 2014.
Ponce de Leon, G. & Puri, V. “Delay Principles Based on Completion Risk.” AACE International Transactions, 2015.
Project Management Institute. A Guide to the Project Management Body of Knowledge (PMBOK®), 5th ed. Newtown Square: Author, 2013.
Steiner, C. Automate This: How Algorithms Came to Rule Our World. New York: Penguin Group, 2012.
US Government Accountability Office. GAO Schedule Assessment Guide. Washington DC: Author, 2015.
Weber, J. The Schedule Quality Index™. Web only: ©2015, Deltek.com.Winter, R. DCMA 14-Point Schedule Assessment. Ron Winter Consulting, LLC., 2011.
Woolf, M. Faster Construction Projects with CPM Scheduling. New York: McGraw-Hill. 2007.
Bibliography (cont’d)
30 January 2016 46
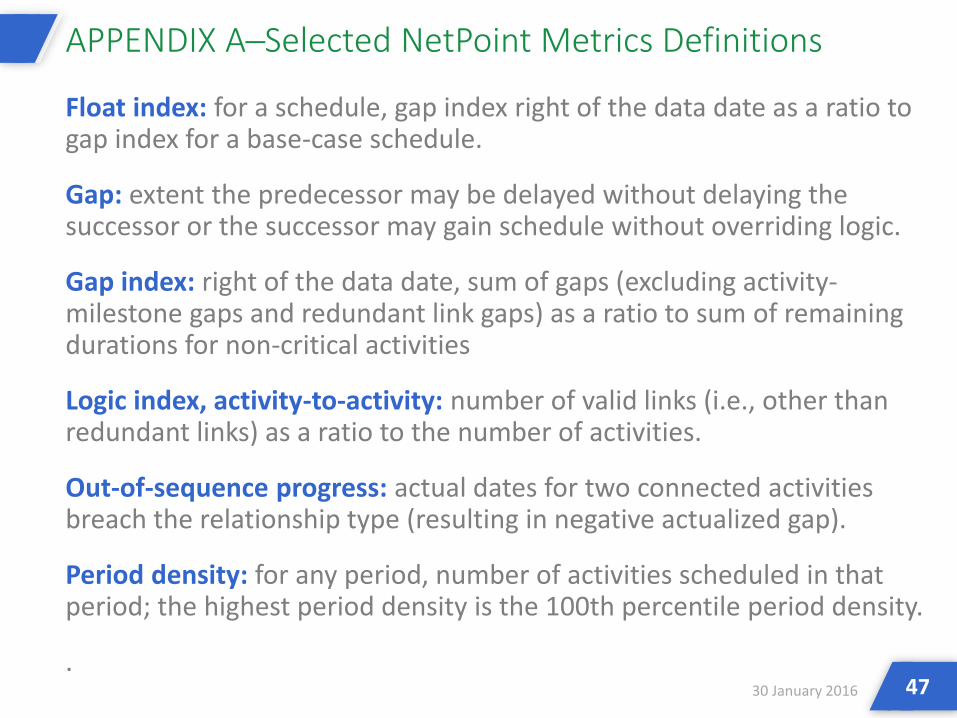
Float index: for a schedule, gap index right of the data date as a ratio to gap index for a base-case schedule.
Gap: extent the predecessor may be delayed without delaying the successor or the successor may gain schedule without overriding logic.
Gap index: right of the data date, sum of gaps (excluding activity-milestone gaps and redundant link gaps) as a ratio to sum of remaining durations for non-critical activities
Logic index, activity-to-activity: number of valid links (i.e., other than redundant links) as a ratio to the number of activities.
Out-of-sequence progress: actual dates for two connected activities breach the relationship type (resulting in negative actualized gap).
Period density: for any period, number of activities scheduled in that period; the highest period density is the 100th percentile period density.
.
APPENDIX A─Selected NetPoint Metrics Definitions
30 January 2016 47
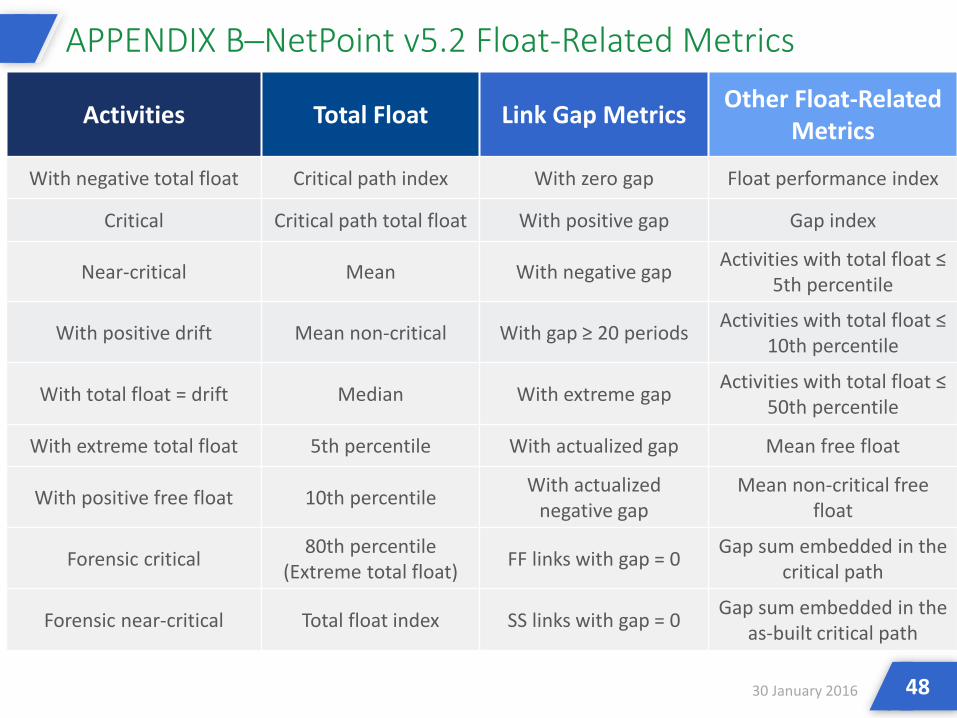
APPENDIX B─NetPoint v5.2 Float-Related Metrics
30 January 2016
Activities Total Float Link Gap Metrics Other Float-Related Metrics
With negative total float Critical path index With zero gap Float performance index
Critical Critical path total float With positive gap Gap index
Near-critical Mean With negative gap Activities with total float ≤ 5th percentile
With positive drift Mean non-critical With gap ≥ 20 periodsActivities with total float ≤
10th percentile
With total float = drift Median With extreme gap Activities with total float ≤ 50th percentile
With extreme total float 5th percentile With actualized gap Mean free float
With positive free float 10th percentile With actualized negative gap
Mean non-critical free float
Forensic critical 80th percentile (Extreme total float) FF links with gap = 0 Gap sum embedded in the
critical path
Forensic near-critical Total float index SS links with gap = 0 Gap sum embedded in the as-built critical path
48

Thank You!Dr. Gui Ponce de [email protected]


