

6
» in short «At the end of the fiscal year
Jenoptik had
4,043 employees in total.
Consolidated Financial Statements
With this increase of more than 10 percent compared with the prior year, the number of employees also reached a new record figure. More than half of the new employees joined
Jenoptik as a result of the acquisit ions made.

140
JENOPTIK Annual Report 2018
Consolidated Financial Statements | Notes
Notes
1 PresentationoftheGroupStructure
1.1 Parentcompany
The parent company is JENOPTIK AG headquartered in Jena and
is registered in the Commercial Register at the local court of
Jena in Department B under the number 200146. JENOPTIK AG
is listed on the German Stock Exchange in Frankfurt and traded
on the TecDax and SDax, amongst others.
The list of shareholdings of the Jenoptik Group is published in
the Federal Gazette in accordance with § 313 (2) Nos. 1 to 4 of
the German Commercial Code (Handelsgesetzbuch [HGB]) and
is disclosed from page 205 in the Notes under the heading List
of Shareholdings of the Jenoptik Group. The entities to which
the simplification relief regulations were applied as specified in
§ 264 (3) or § 264b of the HGB, are disclosed in the section
“Required and Supplementary Disclosures under HGB”.
1.2 Accountingprinciples
The consolidated financial statements of JENOPTIK AG were
prepared for the 2018 fiscal year in accordance with the Inter-
national Financial Reporting Standards (IFRS) and the binding
interpretations of the International Financial Reporting Interpre-
tations Committee (IFRIC) in force at the reporting date for use
in the European Union.
The consolidated financial statements were presented in euros.
If not otherwise specified, all amounts are presented in thousand
euros. Please note that there may be rounding differences as
compared to the mathematically exact amounts (monetary units,
percentages, etc.). The statement of comprehensive income
was prepared in accordance with the cost of sales method.
The fiscal year of JENOPTIK AG and those of the subsidiaries
included in the consolidated financial statements corresponds
with the calendar year.
In order to improve the clarity of the presentation, individual
items were aggregated in the statement of comprehensive
income and the statement of financial postition. The classifica-
tions used for these items are listed in the Notes.
ChangesinaccountingpoliciesThe following International Financial Reporting Standards were
applied for the first time in the fiscal year:
IFRS 9 “Financial Instruments”. This standard replaces all earlier
versions of IAS 39 for the classification and valuation of financial
assets and liabilities as well as for the accounting treatment for
hedging instruments. This new version of the standard contains
revised guidelines for the classification and valuation of financial
instruments. These include a new model for anticipated credit
defaults for calculating the impairment loss to financial assets
as well as the new general accounting regulations for hedging
transactions. This standard also adopts the IAS 39 guidelines
for the recognition and derecognition of financial instruments. IFRS 9 is to be adopted in fiscal years beginning on or after
January 1, 2018. With the exception of the accounting for hedg-
ing transactions, the standard is to be applied retrospectively
but there is no requirement for the disclosure of comparison
information. Apart from a few exceptions, the regulations for
the accounting treatment of hedging transactions must be
applied in general prospectively.
This gave rise to the following overall effects on the statment
of financial position, income statement and equity for Jenoptik:
a) Classification and valuation
The Group will take advantage of the option, which can be
exercised on an individual case basis, of applying a valuation,
outside of profit or loss, at fair values for equity instruments
which were previously valued as available-for-sale assets.
As a result, all fluctuations in the value of these equity instru-
ments will now be recognized outside of profit or loss in
other comprehensive income, without the possibility of a
later reclassification through profit or loss. Under IFRS 9,
there are no material changes with regard to assets valued
at amortized procurement costs. Loans and trade receivables
are held in order to collect the contractual cash flows which
exclusively represent redemption of and interest payments
on the outstanding nominal amounts. Jenoptik analyzed the
contractual cash flows and came to the conclusion that
the cash flow requirement is being met and no reclassification
is necessary.

141
15 Management 35 Corporate Governance 133 Consolidated 207 Further69 Combined53 Non-financial Reporting Management Report Financial Statements Information
Consolidated Financial Statem
ents
133
206
134136137138140
Consolidated Statement of Comprehensive IncomeConsolidated Statement of Financial PositionConsolidated Statement of Cash FlowsStatement of Changes in EquityNotes
b) Impairment losses
A provision for losses in the sum of 0.6 million euros for
current cash investments and bank deposits to cover the
debtor default risk on the date of first application was
recognized for the first time. The Group also applies the
simplified approach to determine the Expected Credit
Loss over the entire term for all trade receivables.
c) Accounting for hedging transactions
The Group has determined that all hedging transactions
currently designated as effective hedging relationships on
the date of first application, also meet the criteria of IFRS 9
for hedge accounting. Since IFRS 9 does not provide for
any change in the general principles for the accounting of
effective hedging relationships, no material changes arise
with regard to the accounting of hedging relationships in
the consolidated financial statements.
The amended classification and valuation of financial assets has
led to the following implications on the date of first application:
in thousand euros
Valuation category
according to IAS 39 1)
Carrying amounts
according to IAS 39 as at 31/12/2017
Revaluation according to the
application of the expec-
ted-loss model
Carrying amounts
according to IFRS 9 as at
1/1/2018
Valuation category
according to IFRS 9 1)
Financial investments
Cash desposits LAR 64,169 – 214 63,955 AC
Shares in unconsolidated associates and investments 2) AFS 2,812 2,812 FVTOCI
Aviable-for-sale financial assets 3) AFS 867 867 AC
Loans granted LAR 730 730 AC
Financial assets held to maturity HTM 408 408 AC
Trade receivables LAR 136,017 136,017 AC
Other financial assets
Receivables from lease agreements 340 340 –
Derivatives with hedging relations 2,962 2,962 –
Derivates without hedging relations FVTPL 2,003 2,003 FVTPL
Miscellaneous financial assets LAR 2,322 2,322 AC
Cash and cash equivalents LAR 132,310 – 368 131,942 AC
1) LAR = Loans and receivables AFS = Available for sale HTM = Held to maturity FVTPL = Fair value through Profit & Loss AC = Amortized acquisition costs FVTOCI = Fair value through other comprehensive income2) Reduction in the sum of 1,225 thousand euros due to changes in the group of entities consolidated see 2.1 from page 1463) Full consolidation after acquisition of ASAM, see 2.4 from page 150 on
There were no implications for financial liabilities on the date of
first application.
The Group recorded the transition effects as at January 1,
2018 on a cumulative basis in equity. With consideration of an
increase of deferred tax assets in the sum of 173 thousand
euros, other reserves reduced by 409 thousand euros.
The application of IFRS 9 had only an insignificant impact on
the statement of financial position and income statement for
the fiscal year 2018. There were also no significant impacts on
the cash flow statement.
IFRS 15 “Revenue from Contracts with Customers”. IFRS 15
introduces a five-stage model for accounting of revenue from
contracts with customers. Under IFRS 15, revenue is recorded
in the amount of the consideration in return which an entity
can expect for the transfer of goods or services to a customer
(the transaction price). The new standard replaces all existing
guidelines for recording revenues such as IAS 18 Revenue,
Transition of financial assets from IAS 39 to IFRS 9

142
JENOPTIK Annual Report 2018
Consolidated Financial Statements | Notes
IAS 11 Construction Contracts and IFRIC 13 Customer Loyalty
Programs. For the fiscal year commencing on January 1, 2018,
the modified retrospective method was applied.
Clarifications on IFRS 15 “Revenue from Contracts with Cus-
tomers”. The clarifications explain implementation issues which
were addressed by the Joint Transition Group for Revenue
Recognition. These questions relate to the identification of per-
formance obligations, the application guidelines for principal-
agent relationships and licenses for intellectual property, as well
as the transitional provisions. In addition, the aim of the amend-
ments is to ensure a more consistent approach in the imple-
mentation of IFRS 15 and to reduce the costs and complexity
associated with its application. Together with the main stan-
dard the changes came into effect on January 1, 2018 and
essentially affect Jenoptik as follows:
a) Customer-specific development projects, followed by volume
production: In the past, revenues were recognized after
delivery of the product, unless IAS 11 applied (successive
contracts to supply). The Group concludes that in most
cases development services under IFRS 15 are categorized
as separate performance obligations over the period of
development as revenue and no longer recognized through
volume production. Therefore, a revenue portion of the
future volume production has to be anticipated and recorded
as revenue. In fiscal year 2018, this led to a reduction in
revenue of 4.2 million euros and a reduction in cost of sales
by 5.0 million euros.
b) Customer-specific volume production: Up to and including
the fiscal year 2017, revenue was recognized with the
transfer of risk after delivery or acceptance by the customer.
Under IFRS 15, Jenoptik concludes that certain contracts
are to be accounted for in accordance with the requirements
of IFRS 15.35 (c) over time, leading to revenue being recog-
nized earlier. In fiscal year 2018, these transactions led to
an increase in revenue of 2.6 million euros with an increase
in cost of sales of 1.4 million euros.
In addition, the application of IFRS 15 in individual cases led to
a change in revenue recognition for customer contracts previously
recognized as construction contracts in accordance with IAS 11,
which are now recognized at a point in time. In fiscal year 2018,
this led to a reduction in revenue of 0.6 million euros and a
reduction in cost of sales by 0.2 million euros.
Through the acquisition of Prodomax Automation Ltd. in the
3rd quarter of 2018, the volume of business transactions that
would have been recognized over time under IAS 11 in accor-
dance with the POC method but which under IFRS 15 must be
recognized at a point in time, has increased considerably. A
hypothetical comparison with the accounting standards appli-
cable in 2017 results in higher revenues of 13.7 million euros
for the 2018 fiscal year, as substantial performance obligations
were satisfied in the period between the acquisition and
December 31, 2018. Cost of sales rose accordingly by 12.2 mil-
lion euros.
In addition, revenue increased slightly in fiscal year 2018 due to
further effects arising from the application of IFRS 15, including
from the reallocation of the consideration between performance
obligations.
The Group recognized the transition effects cumulatively in
equity as of January 1, 2018 for all customer orders not yet
completed at that date (modified retrospective method).
Overall, the initial application of IFRS 15 led to the following
changes in the items in the consolidated statement of
financial position:
in thousand euros 1/1/2018
Non-current assets 1,007
Deferred tax assets 1,007
Current assets – 2,520
Inventories – 8,484
Current trade receivables – 14,859
Contract assets 20,824
Total assets – 1,512
Equity – 2,467
Other Reserves – 2,466
Non-controlling interests – 1
Non-current liabilities 19
Deferred tax liabilities 19
Currents liabilities 935
Other current provisions – 1,581
Contract liabilities 30,685
Other current non-financial liabilities – 28,169
Total equity and liabilities – 1,512
143
15 Management 35 Corporate Governance 133 Consolidated 207 Further69 Combined53 Non-financial Reporting Management Report Financial Statements Information
Consolidated Financial Statem
ents
133
206
134136137138140
Consolidated Statement of Comprehensive IncomeConsolidated Statement of Financial PositionConsolidated Statement of Cash FlowsStatement of Changes in EquityNotes
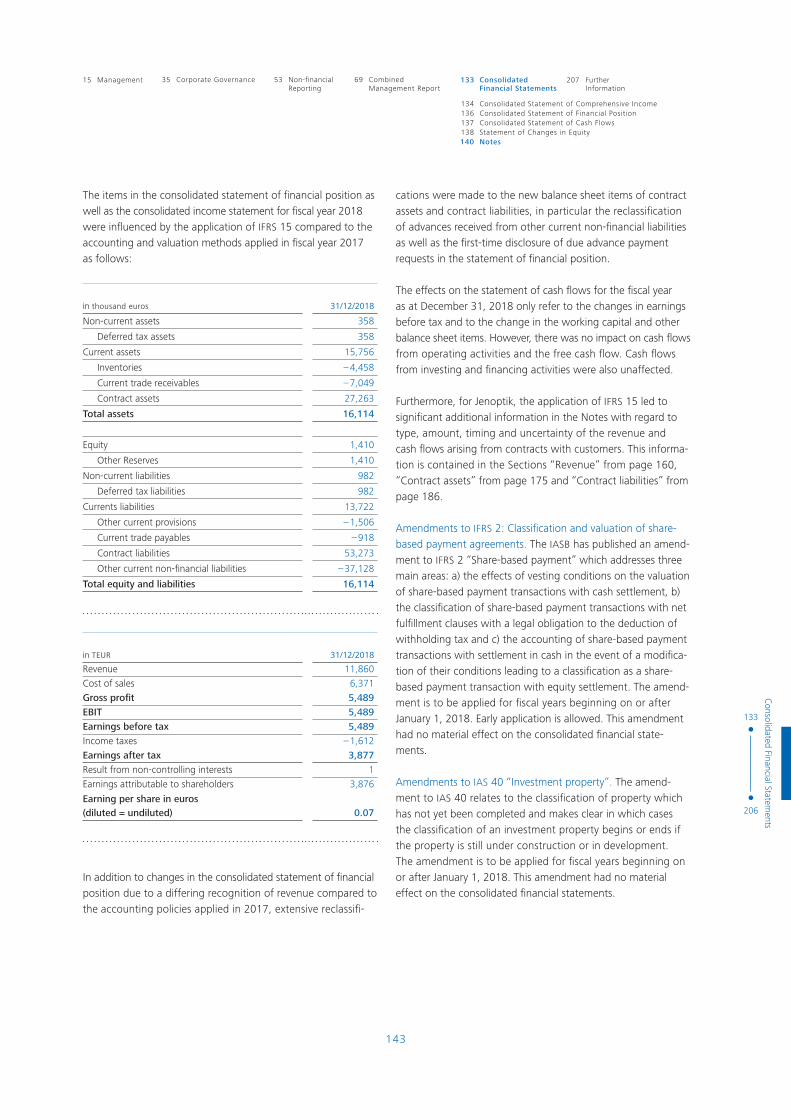
The items in the consolidated statement of financial position as
well as the consolidated income statement for fiscal year 2018
were influenced by the application of IFRS 15 compared to the
accounting and valuation methods applied in fiscal year 2017
as follows:
in thousand euros 31/12/2018
Non-current assets 358
Deferred tax assets 358
Current assets 15,756
Inventories – 4,458
Current trade receivables – 7,049
Contract assets 27,263
Total assets 16,114
Equity 1,410
Other Reserves 1,410
Non-current liabilities 982
Deferred tax liabilities 982
Currents liabilities 13,722
Other current provisions – 1,506
Current trade payables – 918
Contract liabilities 53,273
Other current non-financial liabilities – 37,128
Total equity and liabilities 16,114
in TEUR 31/12/2018
Revenue 11,860
Cost of sales 6,371
Gross profit 5,489
EBIT 5,489
Earnings before tax 5,489
Income taxes – 1,612
Earnings after tax 3,877
Result from non-controlling interests 1
Earnings attributable to shareholders 3,876
Earning per share in euros (diluted = undiluted) 0.07
In addition to changes in the consolidated statement of financial
position due to a differing recognition of revenue compared to
the accounting policies applied in 2017, extensive reclassifi-
cations were made to the new balance sheet items of contract
assets and contract liabilities, in particular the reclassification
of advances received from other current non-financial liabilities
as well as the first-time disclosure of due advance payment
requests in the statement of financial position.
The effects on the statement of cash flows for the fiscal year
as at December 31, 2018 only refer to the changes in earnings
before tax and to the change in the working capital and other
balance sheet items. However, there was no impact on cash flows
from operating activities and the free cash flow. Cash flows
from investing and financing activities were also unaffected.
Furthermore, for Jenoptik, the application of IFRS 15 led to
significant additional information in the Notes with regard to
type, amount, timing and uncertainty of the revenue and
cash flows arising from contracts with customers. This informa-
tion is contained in the Sections “Revenue” from page 160,
“Contract assets” from page 175 and “Contract liabilities” from
page 186.
Amendments to IFRS 2: Classification and valuation of share-
based payment agreements. The IASB has published an amend-
ment to IFRS 2 “Share-based payment” which addresses three
main areas: a) the effects of vesting conditions on the valuation
of share-based payment transactions with cash settlement, b)
the classification of share-based payment transactions with net
fulfillment clauses with a legal obligation to the deduction of
withholding tax and c) the accounting of share-based payment
transactions with settlement in cash in the event of a modifica-
tion of their conditions leading to a classification as a share-
based payment transaction with equity settlement. The amend-
ment is to be applied for fiscal years beginning on or after
January 1, 2018. Early application is allowed. This amendment
had no material effect on the consolidated financial state-
ments.
Amendments to IAS 40 “Investment property”. The amend-
ment to IAS 40 relates to the classification of property which
has not yet been completed and makes clear in which cases
the classification of an investment property begins or ends if
the property is still under construction or in development.
The amendment is to be applied for fiscal years beginning on
or after January 1, 2018. This amendment had no material
effect on the consolidated financial statements.
144
JENOPTIK Annual Report 2018
Consolidated Financial Statements | Notes
IFRS Improvements (2014 – 2016). The Annual Improvements
Project has made changes to various standards. This also affects
the IFRS 1 and IFRS 28 standards. The amendments to IFRS 1
cover the deletion of the remaining, temporary relief regula-
tions for first-time users. The amendments to IAS 28 entail
clarifications. The date on which this part of the Improvement
Project came into effect was January 1, 2018. These amend-
ments had no material effects on the consoli dated financial
statements.
IFRIC 22 “Foreign currency transactions and prepaid consider-
ations”. The IASB has clarified the date for calculating the
exchange rate for the conversion of transactions in a foreign
currency which include advance payments received or paid.
The amendment is to be applied for fiscal years beginning on
or after January 1, 2018. This amendment had no material
effect on the consolidated financial statements.
The amendments of IFRS 4: Application of IFRS 9 “Financial
instruments” together with IFRS 4 “Insurance contracts” are
not applicable to the Group and therefore have no influence
on the consolidated financial statements.
Standards which have been published but not yet adopted by the EU as mandatoryThe application of the following standards and interpretations
published by the IASB and adopted by the EU is not yet manda-
tory. They were applied by Jenoptik in the consolidated finan-
cial statements as of December 31, 2018. The Group has no
plans to apply these standards early.
IFRS 16 “Leasing”. IFRS 16 includes a comprehensive set of
new rules for accounting for leases and supersedes the previous
rules of IAS 17 Leases and some interpretations. The objective
is to disclose the lessee’s rights and obligations associated with
the leases in the statement of financial position. Relief is
planned for short-term leases and the leasing of objects of low-
value. Lessors will continue having to account for leases by
classifying them as either finance or operating leases, applying
the criteria defined in IAS 17. Moreover, IFRS 16 contains fur-
ther regulations on classification and disclosures in the Notes. IFRS 16 is to be adopted in fiscal years beginning on or after
January 1, 2019. Early application is permitted insofar as IFRS 15
is also applied.
These changes are expected to have a significant impact on the
Group as a lessee, as it has so far largely concluded contracts
on movable assets as well as real estate that were accounted as
operating leases.
For the first application of IFRS 16 as of January 1, 2019, the
Group will apply the modified retrospective approach and
value the rights of use in the amount of the continuing carrying
amounts from the commencement of the leases, applying
interest rates from the date of first application. As a result of
this and based on the current information, the Group expects
a substantial increase in fixed assets of between 50 and
55 million euros. The financial liabilities are expected to increase
by between 55 and 60 million euros as the result of the first
time recognition of the leasing liabilities as a discounted value
of the outstanding lease payments. The difference between
rights of use and leasing liabilities is expected to reduce equity
by between 3.0 and 3.5 million euros, taking deferred taxes
into account. The resulting increase in total assets of approxi-
mately 50 to 55 million euros is resulting in a corresponding
decline in the equity ratio.
Furthermore, the change in the recognition of the leasing
expenses in the income statement will lead to an improvement
in the EBITDA of between 10 to 11 million euros, as well as to
a smaller improvement in the EBIT of around 1.5 to 2 million
euros. In the cash flow statement, payments for operating leases
will in future be reported in the cash flows from financing
activities which leads to an improvement of between 10 and
11 million euros in the cash flows from operating activities
compared to the provisions in IAS 17.
With regard to the scope of leases arising in future periods and
to be recorded in the accounts, we refer to the disclosure in the
Notes 5.4 from page 171.
This is not expected to have any material effects for the Group
as a lessor.
Amendments to IFRS 9: Prepayment features with negative
compensation. The change clarifies that the cash flow condition
is met for financial assets with negative compensation in the
event of early repayment. The amendment is to be applied for
fiscal years beginning on or after January 1, 2019. Early appli-
cation is allowed. Due to its narrow scope, Jenoptik does not
expect this amendment standard to affect the consolidated
financial statements.

145
15 Management 35 Corporate Governance 133 Consolidated 207 Further69 Combined53 Non-financial Reporting Management Report Financial Statements Information
Consolidated Financial Statem
ents
133
206
134136137138140
Consolidated Statement of Comprehensive IncomeConsolidated Statement of Financial PositionConsolidated Statement of Cash FlowsStatement of Changes in EquityNotes
Amendments to IAS 28: Long-term interests in associates and
joint ventures. In particular, the amendments address the ques-
tion of how the requirements in IAS 28 and IFRS 9 Financial
Instruments interact. They regulate the extent to which long-term
interests, which are part of the net investment in the associ-
ated companies or joint ventures and to which the equity method
does not apply, are covered under the scope of the two stan-
dards. These essentially make it clear that IFRS 9 must initially
apply to such long-term interests. The amendments are to be
applied retrospectively on January 1, 2019. Earlier application is
allowed. This amendment will have no material impact on the
consolidated financial statements.
IFRIC 23 “Uncertainty over income tax treatments”. The inter-
pretation is to be applied to the accounting of income taxes if
there are any uncertainties regarding the treatment of income
for tax purposes. The interpretation is to be applied for fiscal
years beginning on or after January 1, 2019. At the balance
sheet date no uncertain tax positons were known.
Standards which have been published but not yet adopted by the EU as mandatoryThe following standards and interpretations published by the IASB have not yet been adopted by the European Union.
Amendments to IAS 19: “Plan amendment, curtailment or
settlement” The changes relate to the accounting for plan
amendment, curtailment or settlement that are made during a
reporting period and specify how a company must define and
report the effects of a plan amendment, curtailment or settle-
ment carried out during a fiscal year. The amendments are to
be applied prospectively on January 1, 2019. Earlier application
is allowed.
IFRS Improvements (2015 – 2017). The Annual Improvements
Project has made changes to various standards. The collective
standard contains clarifications on IFRS 3, IFRS 11, IAS 12, and
IAS 23. The effective date is January 1, 2019. These amendments
will have no material effects on the consolidated financial state-
ments.
Revised framework concept and adjustments to the cross-
references in the IFRS. In connection with the publication of the
extensively revised framework concept in March 2018 which
came into force immediately, adjustments were also made to
the cross-references in the IFRS to the framework concept or
from reproductions from the framework concept. This may
e.g. have an impact on previously applied accounting policies
and valuation methods developed under IAS 8. The amend-
ments are to be applied prospectively on January 1, 2020.
Earlier application is permissible if all adjustments are applied.
Amendments to IFRS 3 “Definition of a business combination”.
The changes are intended to help companies determine whether
a transaction should be recognized as a business combination
or acquisition of assets, by clarifying the minimum requirements
for a business combination. In order to illustrate the application
of the changes, illustrative examples have also been added. The
amendments are to be applied prospectively on January 1,
2020. Earlier application is allowed.
Amendments to IAS 1 and IAS 8 “Definition of materiality”.
The amendments specify when information is material. For the
first time, the new definition of materiality takes into account
the obscuring of information as a measure of materiality in terms
of the information. Furthermore, information must be rea-
sonably able to influence decisions in order to be material. The
amendments were made to adapt the definition to the state-
ments on materiality in the 2018 framework concept and to
generally make them more easily applicable. The amendments
are to be applied for the first time prospectively on January 1,
2020.
Amendment to IFRS 10 “Consolidated financial statements”
and IAS 28 “Investments in associates and joint ventures”. The
amendments address a well-known inconsistency between the
regulations of IFRS 10 and IAS 28 (2011) for cases when assets
are to be sold to an associated company or to a joint venture
or when assets are to be contributed towards an associated
company or to a joint venture. The intention in the future is
for the entire profit or loss from a transaction to only be recog-
nized if the assets, either sold or contributed, constitute a
business combination in accordance with IFRS 3. This applies
independently of whether the transaction is designed as a
share deal or an asset deal. If, by contrast, the assets do not
constitute a business, then the results may only be recognized
on the basis of the percentage of completion method. The
date on which the amendments come into effect has been
deferred by the IASB for an indefinite period. This amendment
will have no material impact on the consolidated financial
statements.
146
JENOPTIK Annual Report 2018
Consolidated Financial Statements | Notes
1.3 Estimates
The preparation of the consolidated financial statements in
accordance with IFRS, as are to be applied in the EU, requires
that assumptions be made for certain items that affect their
recognition in the statement of financial position or in the state-
ment of comprehensive income of the Group as well as the
disclosure of contingent receivables and contingent liabilities.
All assumptions and estimates are made to the best of the
Group’s knowledge and belief in order to provide a true and
fair picture of the asset, financial and earnings situation
of the Group.
The underlying assumptions and estimates are continually
reviewed. This gives the author of the consolidated financial
statements a certain amount of discretionary leeway. This
essentially relates to:
• the assumptions and parameters for the valuation of intan-
gible assets identified as part of the purchase price allocation
(see section “Entities acquired” from page 148 f.),
• the assessment of impairment to goodwill (see section
“Intangible assets” from page 166),
• determining the useful lives when valuing intangible assets,
property, plant, and equipment and investment property
(see section “Intangible assets” from page 166, section
“Property, plant, and equipment” from page 169 and sec-
tion “Investment property” from page 170),
• the method for valuing inventories, as well as for defining
valuation routines and discounts, (see section “Inventories”
from page 173),
• the estimate of anticipated losses as part of the valuation
of financial assets (see section “Trade receivables” from
page 173),
• the actuarial parameters for the valuation of provisions for
pensions and similar obligations as well as the determina-
tion of the fair value of fiduciary assets (see section “Provi-
sions for pensions and similar obligations” from page 179),
• the assumptions and methods for valuing other provisions -
for example, warranty obligations and actuarial parameters
of personnel provisions (see section “Other provisions” from
page 183),
• the estimate of the probability of the outflow of resources
from current obligations and their reporting as a contingent
liability (see section “Contingent liabilities and contingent
payables” from page 198),
• the realizability of future tax breaks – in particular arising
from losses carried forward – in the valuation of deferred
tax assets (see section “Income taxes” from page 163).
2 Consolidation Principles
2.1 The Group of entities consolidated
Along with JENOPTIK AG, all significant subsidiaries have been
included fully in the consolidated financial statements and one
joint operation on a proportional basis. The list of shareholdings
is presented in Disclosure Note 12 from page 205.
The consolidated financial statements of JENOPTIK AG includes
40 (prior year: 35) fully consolidated subsidiaries. Of which 16
(prior year: 12) have their legal seat in Germany and 24 (prior
year: 23) have theirs abroad. The consolidated entities of the
Jenoptik Group include one joint operation (prior year: 1).
In fiscal year 2018, 100 percent of the shares were acquired in
Prodomax Automation Ltd., Barrie (Ontario), Canada (referred
to below as: Prodomax) as well as 100 percent of the shares
respectively in OTTO Vision Technology GmbH, Jena, as well as in
its sister company OVITEC GmbH, Jena, Germany (referred to
below as: OTTO Group). In addition, in the fiscal year 94 percent
of the limited partnership interest in Asam Grundstücksverwal-
tungsgesellschaft mbH & Co. Vermietungs KG, Mainz, Germany
(referred to below as: ASAM). Detailed disclosures on the corpo-
rate acquisitions are provided in Note 2.4 from page 148.
In addition, RADARLUX Radar Systems GmbH, Leverkusen,
Germany, which had previously not been one of the group of
entities, was included in the consolidated financial statements
for the first time with effect from 1 January 2018. This did not
have any significant effects on the Group.
TELSTAR-HOMMEL CORPORATION, Ltd., Pyeongtaek, Korea,
was also included in the consolidated financial statements as an
associated company using the at-equity method as of January 1,
2018 (see Disclosure Note 5.5 from page 172).
Hillos GmbH, Jena, is included in the consolidated financial
statements as a joint operation with a proportional shareholding
of 50 percent in accordance with IFRS 11. This entity is a
strategic customer of Jenoptik, operating in the area of construc-
tion and construction-related applications of laser technology.
The following assets and liabilities are to be allocated to the
Group:

147
15 Management 35 Corporate Governance 133 Consolidated 207 Further69 Combined53 Non-financial Reporting Management Report Financial Statements Information
Consolidated Financial Statem
ents
133
206
134136137138140
Consolidated Statement of Comprehensive IncomeConsolidated Statement of Financial PositionConsolidated Statement of Cash FlowsStatement of Changes in EquityNotes
in thousand euros 2018 2017
Non-current assets 578 524
Current assets 8,631 10,043
Non-current liabilities 57 37
Current liabilities 1,819 2,665
Income 22,353 22,884
Expenses 21,947 22,280
Further 11 subsidiaries, of which 9 are non-operating entities,
are not consolidated as their influence on the net assets, financial
and earnings position – both individually and in total – is of
minor significance. The total revenue of the non- consolidated
entities amounts to about 0.2 percent of group revenue; the EBIT was almost zero percent of group EBIT. The estimated effect
of consolidating all the previously non-con solidated entities
on the consolidated statement of financial position total is
approximately 0.1 percent.
The following subsidiaries have investments held by non-con-
trolling shareholders:
NameLegal seat
of the entity
Non- controlling
interests
JENOPTIK Korea Corporation Ltd. Korea 33.40
JENOPTIK Japan CO. Ltd. Japan 33.42
Asam Grundstücksverwaltungs-gesellschaft mbH & Co. Vermietungs KG Germany 6.00
For reasons of materiality, it was decided not to present separate
financial information on these subsidiaries.
2.2 Consolidation procedures
The assets and liabilities of domestic and foreign entities
included fully or proportionately in the consolidated financial
statements are recognized uniformly in accordance with the
accounting policies and valuation methods applicable through-
out the entire Jenoptik Group.
At the acquisition date, the capital consolidation is based on
the acquisition method. In this context, the assets and liabilities
of the subsidiaries are recognized at fair values. Furthermore,
identifiable intangible assets are capitalized and contingent
liabilities are classified as liabilities as defined in IFRS 3.23. The
remaining difference between the purchase price and the
acquired net assets corresponds to the goodwill. This is subject
to an annual impairment test in the subsequent periods in
accordance with IAS 36.
Receivables and payables as well as income and expenses
between the consolidated entities are eliminated. The Group’s
inter-company goods and services are delivered and rendered
both on the basis of market prices as well as transfer prices and
are determined on the basis of the “dealing-at-arm’s-length”
principle. Assets from inter-company deliveries included in the
inventories and property, plant, and equipment are adjusted by
interim results. Consolidation procedures recognized as profit or
loss are subject to the delimitation of deferred taxes, with
deferred tax assets and deferred tax liabilities being netted if
there is a legally enforceable right to offset current tax refund
claims against current tax liabilities and only if they concern
income taxes levied by the same tax authority.
Changes in shares in subsidiaries which reduce or increase the
investment ratio without loss of control, are shown as transac-
tions between equity investors, outside of profit or loss.
There was no change in the consolidation methods applied in
the prior year.
2.3 Foreign currency conversion
Annual financial statements prepared by subsidiaries in foreign
currencies are converted on the basis of the functional currency
concept as defined in IAS 21 “The effects of changes in foreign
exchange rates” by using the modified reporting date exchange
rate method. Since the subsidiaries conduct their business
activities independently from the financial, economic and orga-
nizational aspects, the functional currency is generally identical
to that of the subsidiary’s respective national currency.

148
JENOPTIK Annual Report 2018
Consolidated Financial Statements | Notes
Assets and liabilities are consequently converted at the exchange
rate on the reporting date, whereas income and expenses are
converted at the annual average exchange rate which is deter-
mined on a monthly basis. The resulting difference arising from
the currency conversion is offset outside of profit or loss and
shown separately in equity under foreign currency reserves.
If a consolidated entity leaves the group of consolidated entities,
the corresponding difference arising from the foreign currency
conversion is reversed through profit or loss.
Receivables and payables in the individual financial statements
of consolidated entities prepared in a local currency which is
not the functional currency of the subsidiary, are converted at
the exchange rate on the balance sheet date in accordance
with IAS 21. Differences arising from the foreign currency con-
version are shown under other operating income or other
operating expenses affecting the results and, if these are derived
from financial transactions, are recognized under financial
income or financial expenses (see details on the Income Statement
from page 160). This excludes currency conversion differences
arising from loans and advances which constitute a part of the
net investment in a foreign business operation. These differences
from foreign currency conversions are recorded in other com-
prehensive income outside of profit or loss until the sale of
the net investment; it is only at the time of their disposal that
the cumulative amount is reclassified into the income statement.
The exchange rates used for the conversion are shown in the
table below:
Annual average exchange rate Reporting date exchange rate
1 EUR = 2018 2017 31/12/2018 31/12/2017
Australia AUD 1.5799 1.4729 1.6220 1.5346
Canada CAD 1.5302 n. a. 1.5605 n. a.
Switzerland CHF 1.1549 1.1115 1.1269 1.1702
China CNY 7.8073 7.6264 7.8751 7.8044
Great Britain GBP 0.8847 0.8761 0.8945 0.8872
India INR 80.7275 73.4967 79.7298 76.6055
Japan JPY 130.4090 126.6541 125.8500 135.0100
Korea KRW 1,299.2331 1,275.8233 1,277.9300 1,279.6100
Malaysia MYR 4.7642 4.8501 4.7317 4.8536
Singapore SGD 1.5928 1.5582 1.5591 1.6024
USA USD 1.1815 1.1293 1.1450 1.1993
2.4 Entities acquired and sold
Acquisition of ProdomaxWith the signing of the agreement on July 10, 2018 and closing
on July 23, 2018, Jenoptik acquired a 100 percent stake in
Prodomax Automation Ltd., Barrie (Ontario), Canada, through its US company JENOPTIK North America Inc. The acquired entity
specializes in process automation for the automotive industry.
The acquisition allows the Group to boost its position as a
turnkey supplier of automated production solutions which
Jenoptik established with the acquisition of Five Lakes Automa-
tion LLC in 2017.
The information below is based on provisional figures. The
provisional nature relates to the determination of the acquired
net assets because of the so far not final valuation of the
intangible assets identified during the process of the purchase
price allocation. The first-time consolidation will be finalized
by the end of the valuation period.
The purchase price comprises a fixed cash component of
120.197 thousand Canadian dollars (78.128 thousand euros).
In return, we acquired the following net assets as at the date
of the initial consolidation:
in thousand euros Total
Non-current assets 32,961
Current assets 41,675
Non-current liabilities 19,800
Current liabilities 30,833

149
15 Management 35 Corporate Governance 133 Consolidated 207 Further69 Combined53 Non-financial Reporting Management Report Financial Statements Information
Consolidated Financial Statem
ents
133
206
134136137138140
Consolidated Statement of Comprehensive IncomeConsolidated Statement of Financial PositionConsolidated Statement of Cash FlowsStatement of Changes in EquityNotes
The acquired assets include receivables with a gross value of
12,815 thousand euros, corresponding to the full fair value.
There is no expectation that the acquired receivables will be
unrecoverable. Also included in the acquired assets are cash
and cash equivalents amounting to 3,156 thousand euros and
bank liabilities assumed by Jenoptik amounting to 22,786 thou-
sand euros.
In connection with the acquisition of shares in Prodomax, in
addition to the revaluation of work in progress, a customer
base, order backlog, brand and advantageous contracts were
identified as intangible assets as part of the purchase price
allocation. The intangible assets are amortized over periods of
between three and eight years. The order backlog and newly
valued work in progress will be amortized in line with the prog-
ress of the project. Goodwill in the sum of 54,125 thousand
euros was also recorded for the acquisition of the skilled person-
nel as well as for synergy effects arising from combining auto-
mation solutions and laser processing machines, the enlarged
customer base and opening up of new markets. The goodwill
is to be allocated to the “Automotive” group of cash-generating
units and is not tax-deductible.
Contingent liabilities were not included in the company acquisi-
tion.
Costs incurred up to December 31, 2018 for the acquisition of
Prodomax totaled 1,797 thousand euros. These were shown in
other operating expenses.
Acquisition of the OTTO GroupOn signing the agreement on August 31, 2018, Jenoptik
acquired a 100 percent stake in OTTO Vision Technology GmbH,
Jena, and its sister company OVITEC GmbH, Jena, through its
company JENOPTIK Industrial Metrology Germany GmbH. The
OTTO Group specializes in optical testing systems for quality
assurance and process optimization, as well as in complex imag-
ing systems for applications in the field of parts measurement,
inspection testing and position detection. The acquisition will
enable the Jenoptik Group to strengthen its range of services
for innovative metrology solutions in the Mobility Segment and
further expand its market position as a systems supplier for
production metrology and industrial imaging applications.
The purchase price of 7,918 thousand euros comprises a fixed
cash component (6,684 thousand euros) and a conditional
component (1,234 thousand euros), which is based on the
attainment of agreed earnings figures in the years 2018 and
2019 and recognized at fair value. In return, we acquired the
following net assets as at the date of the initial consolidation:
in thousand euros Total
Non-current assets 2,094
Current assets 4,629
Non-current liabilities 636
Current liabilities 1,936
The acquired assets include trade receivables with a gross value
of 1,497 thousand euros, corresponding to the full fair value.
There is no expectation that the acquired receivables will be
unrecoverable. Also included in the acquired assets are cash and
cash equivalents amounting to 1,701 thousand euros.
In connection with the acquisition of shares in the OTTO Group,
in addition to the revaluation of work in progress and finished
goods, a customer base, order backlog, and internally produced
software were identified in particular as intangible assets during
the process of the purchase price allocation. The intangible
assets are amortized over periods of between six months and
five years. Goodwill in the sum of 3,768 thousand euros was
also recorded for the acquisition of the skilled personnel as well
as for synergy effects arising from the expansion of the range
of services in the field of 2D and 3D metrology, from the enlarged
customer base, and from the opening up of new markets. The
goodwill is to be allocated to the “Automotive” group of cash-
generating units and is not tax-deductible.
Contingent liabilities were not included in the company acquisi-
tion.
Costs incurred up to December 31, 2018 for the acquisition of
the OTTO Group totaled 107 thousand euros. These were
shown in other operating expenses.
In connection with the acquisition of shares in the OTTO Group,
an agreement was signed under which JENOPTIK Industrial
Metrology Germany GmbH also acquires its business premises.
The transfer of ownership took place in December 2018.

150
JENOPTIK Annual Report 2018
Consolidated Financial Statements | Notes
Acquisition of ASAMUnder the agreement dated February 13, 2018, JENOPTIK
Optical Systems GmbH, Jena, Germany, acquired 94 percent of
the limited partnership interest in Asam Grundstücksverwal-
tungsgesellschaft mbH & Co. Vermietungs KG, Mainz, Germany.
The company is the owner of the production and administra-
tion building used by JENOPTIK Polymer Systems GmbH at the
Triptis site. The fixed cash purchase price was 5 thousand
euros. Since the acquired company has no business, this does not
constitute a business combination as defined in IFRS 3 but
rather an acquisition of the individual assets and liabilities of the
company. There were the following additions to assets and
liabilities at the time of initial consolidation:
in thousand euros Total
Non-current assets 3,452
Current assets 36
Non-current liabilities 3,001
Current liabilities 482
The non-current liabilities contain a tenant loan of JENOPTIK
Polymer Systems GmbH with a fair value of 867 thousand euros
that will be eliminated within the consolidated financial state-
ments.
As a result of the inclusion of Prodomax, the consolidated
financial statements include revenue in the sum 34,463 thousand
euros and earnings after tax (EAT) of minus 1,068 thousand
euros and from the OTTO Group revenue in the sum of 2,578
thousand euros and earnings after tax in the sum of minus 74
thousand euros. The reasons for the two negative earnings
after tax items are particularly expenses incurred in the scheduled
amortization of the intangible assets identified during the
purchase price allocation and a higher cost of sales from the
consumption of remeasured inventory.
On the premise that all corporate acquisitions had already
taken place as of January 1, 2018, the Jenoptik Group would
show revenue of 864,882 thousand euros and consolidated
earnings after tax (EAT) of 90,453 thousand euros. In order to
determine this information, it was assumed that the fair values
and useful lives of the intangible assets identified in the context
of the allocation of the purchase price as of January 1, 2018
are identical to those as at the initial consolidation date. These
proforma figures were produced solely for comparison pur-
poses. They do not provide a reliable indication either of the
operating results that would actually have been achieved if
the acquisition had been made at the beginning of the period
or of future results.
With the signing the agreement on July 27, 2017 and on fulfill-
ment of the conditions precedent on August 21, 2017, Jenoptik
acquired a 100 percent stake in Five Lakes Automation LLC,
Novi (MI), US through its US company JENOPTIK Automotive
North America LLC. Its inclusion in the 2017 consolidated
financial statements in accordance with IFRS 3 was based on
provisional figures. The provisional nature concerned determi-
nation of the acquired net assets and measurement of the
intangible assets identified in the process of purchase price allo-
cation. The figures were finalized by the end of the valuation
period and resulted in a change of 1,177 thousand euros to
the intangible assets identified during the purchase price alloca-
tion. The development of goodwill arising from this acquisition
up to December 31, 2018 is as follows:
in thousand euros Total
Goodwill as of 1/1/2018 5,700
Change in goodwill after finalizing first-time consolidation 1,177
Foreign currency exchange effects 280
Goodwill as of 31/12/2018 7,157
In the 4th quarter of 2018, non-controlling shareholders of
JENOPTIK Holdings UK Ltd. (formerly: Vysionics Ltd.) exercised
existing put options. This resulted in Jenoptik’s investment
quota in JENOPTIK Holdings UK Ltd. and the companies con-
trolled by this entity increasing from 96.50 to 100.00 percent
with a corresponding reduction in non-controlling interests.
The change is shown as an acquisition of non-controlling inter-
ests in the consolidated statement of changes in equity.
There were no sales of companies in the 2018 fiscal year.
2.5 Notes on other entities
Jenoptik holds shares in 6 (prior year 8) other entities with a
maximum 50 percent investment quota respectively. These invest-
ments are of minor importance individually and as a whole for
the asset, financial and earnings situation of Jenoptik. Therefore,
based on the principle of cost effectiveness and materiality,
the equity valuation was not applied to these investments. The
general disclosures on the investments are contained in the
list of shareholdings of the Jenoptik Group from page 205.

151
15 Management 35 Corporate Governance 133 Consolidated 207 Further69 Combined53 Non-financial Reporting Management Report Financial Statements Information
Consolidated Financial Statem
ents
133
206
134136137138140
Consolidated Statement of Comprehensive IncomeConsolidated Statement of Financial PositionConsolidated Statement of Cash FlowsStatement of Changes in EquityNotes
3 Accounting Policies and Valuation Methods
3.1 Goodwill
Goodwill as stated in IFRS 3 corresponds to the positive differ-
ence between the consideration for a business combination and
the newly acquired, revalued assets and liabilities, including
certain contingent liabilities, remaining after a purchase price
has been allocated. Within the framework of this purchase
price allocation, the identifiable assets and liabilities are not rec-
ognized at their previous carrying amounts but at their fair
value. During an acquisition of a controlling interest, non-con-
trolling interests are valued according to their proportion of
the identifiable net assets.
Goodwill is recognized as an asset and subject to an impairment
test at least once a year on a defined date or whenever there is
an indication that the cash-generating unit could be impaired.
An impairment loss is recognized immediately through profit or
loss and not reversed in later reporting periods.
3.2 Intangible assets
Intangible assets acquired in return for payment, primarily
patents, trademarks, software and customer relationships, are
capitalized at their acquisition costs. Intangible assets with
finite useful lives are subject to schedule amortization on a
straight-line basis over their economic useful lives. This is
generally a period of between three and ten years. The Group
reviews whether its intangible assets with finite useful lives
have suffered an impairment loss (see section “Impairment of
property, plant, and equipment and intangible assets”).
Internally generated intangible assets are capitalized if the
recognition criteria specified in IAS 38 “Intangible assets” have
been fulfilled.
Internally generated intangible assets are subject to schedule
amortization on a straight-line basis over their anticipated useful
lives. This is generally a period of between five and ten years.
Development costs are capitalized if a newly developed product
or process can be clearly identified, is technically realizable and
if there are plans for production, own use, or marketing.
Furthermore, it is assumed that, if capitalized, there is sufficient
probability that the development costs will be covered by
future financial cash inflows and can be reliably determined.
Finally, there must be adequate resources available to con-
clude the development and enable the asset to be used or sold.
Capitalized development costs are subject to scheduled amor-
tization over the anticipated sales period of the products – in
principle however no longer than five years. In this context,
the acquisition and production costs cover all the costs directly
attributable to the development process as well as appropri-
ate portions of the overheads relating to the development. If the
requirements for capitalization have not been fulfilled, the
expenditures are recognized through profit or loss in the year
they occurred.
Amortization of intangible assets is apportioned on the basis
of the causer principle to the corresponding function areas in the
income statement.
Research costs are recorded as current expenses in research
and development expenses in accordance with IAS 38.
3.3 Property, plant, and equipment
Property, plant, and equipment are valued at acquisition and
production costs, less scheduled, straight-line depreciation. The
depreciation method reflects the anticipated pattern of con-
sumption of the future economic benefits. Where necessary,
impairment losses reduce the amortized acquisition and pro-
duction costs. In principle, government grants are deducted from
the acquisition and production costs in accordance with IAS 20
“Accounting for and presentation of government grants” (see
section entitled “Government grants”). Production costs are
calculated on the basis of directly attributable specific costs as
well as proportionate, directly attributable cost of materials
and production overheads including depreciation. In accordance
with IAS 23 “Borrowing costs”, borrowing costs directly attrib-
utable to acquisition or production costs of a qualifying asset
are capitalized as a portion of the acquisition or production
costs.
Costs incurred for repairing property, plant, and equipment are
generally treated as an expense. Subsequent acquisition costs
for any components of property, plant, and equipment replaced
at regular intervals, can be capitalized insofar as future eco-
nomic benefits can be reasonably expected and the respective
costs can be reliably measured.

152
JENOPTIK Annual Report 2018
Consolidated Financial Statements | Notes
Scheduled depreciation is essentially based on the following
useful lives:
Useful life
Building 20 – 80 years
Machinery and technical equipment 4 – 20 years
Other equipment, operating and office equipment 3 – 10 years
If any items of property, plant, and equipment are decommis-
sioned, sold or relinquished, the gain or loss arising from the
difference between the proceeds of the sale and the residual
carrying amount are recorded under other operating income or
other operating expenses.
3.4 Impairment of property, plant
and equipment and intangible assets
Property, plant, and equipment and intangible assets with finite
useful lives are assessed at each reporting date to see if there
are any indications of possible impairment losses for the corre-
sponding assets in accordance with IAS 36 “Impairment of
assets”. If any such indications for specific assets or cash-gen-
erating units are identified, impairment tests are performed on
these assets.
The demarcation between cash-generating units is primarily
carried out on the basis of the business units constituting the
divisions.
As part of the impairment test, the recoverable amount of an
asset or cash-generating unit first determined and then compared
with the corresponding carrying amount in order to identify if
there is any need for an impairment to be applied.
The recoverable amount is the higher of an asset’s fair value
less costs to sell and its value in use.
The amount designated as at fair value less costs to sell is
that which could be achieved through the sale of an asset in
a transaction at arm’s length between knowledgeable and
willing parties.
Value in use is determined on the basis of discounted expected
future cash inflows. This is based on a fair market interest rate
before tax that reflects the risks of using the asset that are not
yet considered in the estimated future cash inflows.
If the recoverable amount of an asset is estimated to be less
than the carrying amount, it is then depreciated to the recover-
able amount. The impairment loss is recognized immediately
through profit or loss.
If an impairment loss is reversed in a subsequent accounting
period, the carrying amount of the asset must then be adjusted
to the recoverable amount determined. The maximum limit is
determined by the amount of the amortized acquisition or pro-
duction costs that would have been recorded if an impairment
loss had not been recognized in prior periods. The impairment
loss reversal is immediately recorded through profit or loss.
3.5 Government grants
IAS 20 distinguishes between grants related to acquiring
non-current assets and grants related to income.
In general, IAS 20 states that grants are to be accounted for
through profit or loss in the same period as the relevant
expenses.
In the Jenoptik Group a grant for a non-current asset is deducted
from the acquisition costs. Correspondingly, the amount to be
written off is determined on the basis of the reduced acquisition
costs.
3.6 Leases
When using leased items of property, plant, and equipment,
the conditions for finance leases as defined in IAS 17 “Leases”
are fulfilled if all material risks and opportunities incidental to
ownership have been transferred to the respective consolidated
entity of the Group. All other leases are classified as operating
leases.
Finance leases. The Group, as a lessee of the finance lease, cap-
italizes the assets leased at the inception of the lease at the
amount equal to their fair value, or if lower, the current value
of the minimum lease payments. The straight-line depreciation
method is to be used to write off the asset over the period of
its economic useful life or the shorter term of the lease agree-
ment if it is unlikely that an option to purchase the asset will
153
15 Management 35 Corporate Governance 133 Consolidated 207 Further69 Combined53 Non-financial Reporting Management Report Financial Statements Information
Consolidated Financial Statem
ents
133
206
134136137138140
Consolidated Statement of Comprehensive IncomeConsolidated Statement of Financial PositionConsolidated Statement of Cash FlowsStatement of Changes in EquityNotes
be exercised. Liabilities from finance lease agreements are shown
at the current value of the minimum lease payments.
If the Group is a lessor, the net value of the investment from
the lease is capitalized as a receivable. Financial income is
recognized through profit or loss in the respective reporting
period, so that there is a constant periodic return on the net
investment.
Operating leases. Lease payments from operating leases are
recognized through profit or loss on a straight-line basis over
the term of the corresponding lease.
Any incentives received or outstanding for entering into an
operating lease agreement are also recognized on a straight-
line basis over the term of the lease.
3.7 Investment property
Investment property comprises plots of land and buildings held
for gaining rental income or for the purpose of their value
increasing. These properties are not held for the Group’s own
production, for supplying goods or rendering services, for
administration purposes or for any sales in the ordinary course
of business activities.
In accordance with the right of choice under IAS 40 “Investment
property”, such assets are to be accounted for at the amortized
acquisition or production costs (see page 170). The fair values
to be stated are determined using a discounted cash flow
method or standard land values.
The straight-line depreciation method is based on a useful life
of between 20 to 80 years.
In accordance with IAS 36, depreciation resulting from impair-
ment losses on investment property is charged if the value in
use or fair value less costs to sell of the respective asset is less
than the carrying amount. If the reasons for an impairment loss
resulting from depreciation from a prior period cease to exist,
corresponding write ups are recorded.
3.8 Financial instruments
Financial instruments are contracts giving rise to a financial
asset of one entity and to a financial liability or an equity instru-
ment of another entity. As defined in IAS 32, such instruments
include on the one side primary financial instruments such as
trade receivables and trade payables or financial receivables
and financial payables. On the other side, they also include
derivative financial instruments which are used for hedging
risks arising from fluctuations in interest and foreign currency
exchange rates.
Financial assets and financial liabilities are recognized in the
consolidated statement of income from the date on which the
Group becomes a contractual party in a financial instrument
agreement.
Depending upon the Group’s business model for managing
assets and the question as to whether the contractual cash flows
of the financial instruments exclusively constitute repayments
and interest payments on the outstanding nominal amount, the
existing financial instruments are categorized either as “at
amortized acquisition costs”, “at fair value through other com-
prehensive income”, or “at fair value through profit or loss”
and valued accordingly.
In the past fiscal year, depending on their classification, existing
financial instruments were recognized at amortized acquisition
costs, or “available-for-sale financial assets” at fair value, in
the categories “receivables and loans”.
The amortized acquisition costs of a financial asset or a
financial liability are defined as the amount at which the finan-
cial asset or financial liability was valued at initial recognition:
• minus any repayments
• minus any impairment losses or potential inability to be
recovered, as well as
• plus / minus any difference between the original amount
and the amount repayable on maturity (e. g. premium and
transaction costs). Under the effective interest method,
this difference is spread over the full contractual term of the
financial asset or financial liability.
The amortized acquisition costs for current receivables and
payables generally reflect the nominal amount or the repayment
value.
Fair value generally corresponds to the market or stock market
value. If there is no active market, the fair value is determined
by using financial mathematical methods such as by discount-
ing estimated future cash flows at market interest rates or by
applying standard option price models and by confirmations
issued by the banks that sold the instruments.

154
JENOPTIK Annual Report 2018
Consolidated Financial Statements | Notes
a) Primary financial instruments
Shares in entities
Initial recognition in the statement of financial position is based
on the fair value.
In the Jenoptik Group, on the basis of the exercising of the
option, all investments in listed public companies are classified
as “at fair value through other comprehensive income” and, in
the subsequent periods, at the fair value derived from observ-
able market prices. In the period under comparison, these
investments are classified as “available for sale” and in subse-
quent periods are valued at fair value without deducting trans-
action costs.
Under IFRS 9, and on the basis of the exercising of the option,
shares in unlisted subsidiaries and other investments are classified
as at “fair value through other comprehensive income”. In
the absence of any identifiable market prices, the fair values of
these financial instruments are determined on the basis of
discounted cash flows. In the 2017 fiscal year, these shares were
classed as “available-for-sale financial assets” but generally
shown at the respective acquisition costs as these represented a
reasonable approxi mation for the fair values. As far as there
were any indications of lower fair values, these were recognized.
With the exception of impairments that are reported as profit
or loss under IAS 39, all changes in the value of shares in com-
panies are recognized outside profit or loss in other compre-
hensive income.
Shares in entities which are subject to valuation at-equity
Shares in entities over which Jenoptik exerts key influence,
are valued using the at-equity method under IAS 28. For this
purpose, the original investment carrying amount is updated
with the shares in the company’s consolidated statement of
changes in equity to which the shareholders are entitled.
Shares in the profit or loss are recognized under profit or loss,
whilst shares in other comprehensive income are recorded
outside profit or loss.
Loans
Loans involve credits granted by the Jenoptik Group which
are valued at the amortized acquisition costs in accordance with
both IAS 39 and IFRS 9.
Non-current, non-interest-bearing loans and low interest-bearing
loans are accounted for at current value. If any objective, sub-
stantial evidence of impairment can be identified, then unsched-
uled depreciation is applied.
Other financial assets
Under IAS 39, the other financial assets shown in the 2017 fiscal
year were classified under the category of “available-for-sale
financial assets” and shown at fair value. Until sold, they were
recognized under other comprehensive income outside profit
or loss, taking deferred taxes into consideration. When securities
are sold or if a significant or permanent impairment loss occurs,
the cumulative profit or loss that had been accounted for directly
in equity up to then was reclassified in the profit or loss of the
current reporting period. The initial valuation was recorded at
the settlement date at acquisition costs which reflect the fair
value.
Trade receivables
Trade receivables are non-interest bearing due to their short term
nature and are recognized at nominal value less impairment
losses on the basis of anticipated bad debts (amortized acquisi-
tion costs). The anticipated bad debts are determined in
accordance with IFRS 9 via the simplified method. In this context,
consideration is given to both the individual default risk as
well as an anticipated default risk derived from past events for
a group of receivables with comparable default risks (portfolio-
based impairment) through the recognition of a provision for
risk in the amount of the bad debts anticipated over the entire
period, using an impairment loss account. Under IAS 39, indi-
vidual impairments as well as portfolio-based impairments were
also recognized in the 2017 fiscal year, using an impairment
account.
When the loss of a trade receivable is finally realized, the receiv-
able is booked out by using any impairment previously recog-
nized.

155
15 Management 35 Corporate Governance 133 Consolidated 207 Further69 Combined53 Non-financial Reporting Management Report Financial Statements Information
Consolidated Financial Statem
ents
133
206
134136137138140
Consolidated Statement of Comprehensive IncomeConsolidated Statement of Financial PositionConsolidated Statement of Cash FlowsStatement of Changes in EquityNotes
Contract assets
Contract assets reported under IFRS 15 are recognized at nomi-
nal value, taking impairment losses under IFRS 9 into account.
Jenoptik also applies the simplified approach to determine
impairment losses on contract assets and determines the risk
provisions for the anticipated bad debts over the total term.
Other financial assets
Other financial assets are recognized at amortized acquisition
costs. All identifiable default risks are accounted for by a corre-
sponding impairment.
Significant non-current, non-interest-bearing or low interest-
bearing receivables are discounted.
Current financial assets
Current cash deposits are classified as “at amortized acquisition
costs” in accordance with IFRS 9 and valued accordingly. Under
IAS 39, the classification was carried out as “loans and receiv-
ables”, with the valuation also being applied at the amortized
acquisition costs.
In the 2017 fiscal year, some of the current financial assets
under IAS 39 were classified as “financial investment to be held
to maturity” and valued at the amortized acquisition costs.
Cash and cash equivalents
Cash and cash equivalents comprise cash on hand, checks
and bank credit balances available on demand with an original
maturity of up to three months. These are recognized at the
nominal amount less a provision for the risk of anticipated loan
defaults.
Financial liabilities and equity instruments
In principle, financial liabilities are valued at amortized acquisi-
tion costs by applying the effective interest method. This does
not apply to financial liabilities which are accounted for at fair
value through profit or loss.
Liabilities from finance lease agreements are shown at the cash
value of the outstanding minimum lease payments.
An equity instrument is any contractual agreement containing a
residual interest in the assets of the Group after all liabilities
have been deducted. Shares which have been issued are classified
as equity, whereby the costs (less related income tax benefits)
directly attributable to the issue of treasury shares, have been
deducted from equity.
Liabilities to banks
Interest-bearing bank loans and overdraft lines of credit are
accounted for at the amounts received less any directly attrib-
utable disbursement expenses. Financing costs, including
premiums due to be paid on repayments or redemption, are
accounted for on an accrual basis by applying the effective
interest method, and increase the carrying amount of the
instrument insofar as they have not been settled at the date
of its inception.
b) Derivative financial instruments
Within the Jenoptik Group, derivative financial instruments are
used for hedging risks arising from fluctuations in interest and
foreign currency exchange rates. They serve to reduce earnings
volatility resulting from interest and foreign currency exchange
rate risks. Fair values are determined on the basis of the market
conditions – interest rates, foreign currency exchange rates – at
the balance sheet date and using the valuation methods shown
below.
Derivative financial instruments are not used for speculation
purposes. The use of derivative financial instruments is governed
by a group guideline which is authorized by the Executive Board
and represents a fixed written guideline on the use of derivative
financial instruments. In order to hedge risks from fluctuations
in interest and foreign currency exchange rates, the Group uses
cash flow hedges.
Changes in the fair value of derivative financial instruments
which serve to hedge cash flow risks, are documented. If the
hedge accounting has been classified as effective, the changes
in fair value are recognized outside of profit or loss in other
comprehensive income. Reclassifications from equity to profit
or loss are carried out in the period during which the hedged
underlying transaction affects profit or loss. Fluctuations in
value arising from financial instruments which are classified as
not effective are recorded directly in profit or loss.
156
JENOPTIK Annual Report 2018
Consolidated Financial Statements | Notes
3.9 Inventories
Inventories are recognized at the lower of acquisition or pro-
duction costs and their net realizable value.
The net realizable value is the estimated proceeds from sale less
the estimated production costs and any further costs incurred
up to sale.
Acquisition costs also include any other costs incurred to restore
the inventories to their current condition. Any reductions in
purchase prices such as rebates, bonuses or trade discounts are
taken into account.
Production costs include the full costs relating to production
that have been determined on the basis of normal production
capacity utilization. In addition to direct costs, these also include
the appropriate portion of the necessary material and production
overheads as well as production related depreciation which
can be directly attributable to the production process. In this
context, particular account is taken of the costs that are allocated
to specific production cost centers. Administrative expenses
are also taken into account insofar as they can be allocated to
production. If fair values at the reporting date have decreased
owing to lower prices on the sales market, then these are rec-
ognized. In principle, the valuation of similar inventory assets
is based on the average cost method. If the reasons that led
to a write-down of inventories cease to exist and the net realiz-
able value has consequently increased, the reversals of write-
downs are recognized as a reduction in material expenses in
the corresponding periods in which they occur.
3.10 Borrowing costs
Borrowing costs that can be directly attributed to the construction
or production of a qualifying asset are capitalized as a portion
of the acquisition or production costs of this asset.
3.11 Construction contracts
In accordance with IAS 11 “Construction contracts”, revenue
and profits from construction contracts in the 2017 fiscal year
were recognized according to the “Percentage of completion
method”. The percentage of completion is derived from the
ratio between the actual contract costs incurred up to the end
of the fiscal year and the currently estimated total contract
costs (“cost-to-cost method”). Losses arising from construction
contracts are recognized immediately and in full in the fiscal
year in which they were identifiable.
Construction contracts valued according to the “Percentage
of completion method” were recognized as receivables or pay-
ables arising from construction contracts, depending on the
amount of the advanced payments or progress billings received.
They were valued at production costs plus any proportion
of income received according to the percentage of completion
achieved. Insofar as the cumulative services rendered (con-
tract costs and contract outcome) exceed the progress billings
and advances received in individual cases, construction con-
tracts are shown under receivables from construction contracts.
If, after deducting progress billings and advances received,
there was a negative balance, this was shown as a payable
under liabilities from construction contracts. Any anticipated
contract losses were taken into account as write-downs or pro-
visions. They were determined, taking into consideration all
identifiable risks.
Customer orders which were previously reported under IAS 11
as construction contracts, have been reported in accordance with
IFRS 15 since the 2018 fiscal year. Any differences between
advance payments and progress billings received and realized
revenue are shown as contract assets or contract liabilities.
3.12 Contract assets and contract liabilities
A contract asset is the not yet unconditional claim to the receipt
of a consideration in return for goods or services transferred
to a customer. If the Group meets its contractual obligations by
transferring goods or services to a customer before the cus-
tomer pays the consideration or before the payment is due, a
contract asset will be recognized for the conditional claim to
consideration in return. This gives rise to contract assets as the
difference between the realized revenue from the respective
order, less advances received and customer billings. Receivables
from customers arising from invoices issued, are shown under
trade receivables.
If the requested advances received and due, as well as the
customer billings issued, exceed the realized revenue, a contract
liability will be shown. A contract liability therefore constitutes
the obligation of the group to transfer goods or services to
a customer for which the Group has received a consideration
from the customer or for which a requested payment is due.
Contract liabilities are recognized as proceeds as soon as the
Group fulfills its contractual obligations.
The contract liabilities also include obligations arising from
agreed contractual penalties that are accounted as a reduction
in revenue.
157
15 Management 35 Corporate Governance 133 Consolidated 207 Further69 Combined53 Non-financial Reporting Management Report Financial Statements Information
Consolidated Financial Statem
ents
133
206
134136137138140
Consolidated Statement of Comprehensive IncomeConsolidated Statement of Financial PositionConsolidated Statement of Cash FlowsStatement of Changes in EquityNotes
3.13 Deferred taxes
The accounting for and valuation of deferred taxes is per-
formed in accordance with IAS 12 “Income Taxes”. Deferred
tax assets and deferred tax liabilities are shown as separate
items in the statement of financial position in order to take into
account future tax effects resulting from timing differences
between the balance sheet valuations of assets and liabilities
and tax losses carried forward.
Deferred tax assets and deferred tax liabilities are computed in
the amount of the anticipated tax burden or tax relief in subse-
quent fiscal years on the basis of the tax rate applicable on the
date of realization. The effects of changes in tax rates on deferred
taxes are recognized in the reporting period during which the
legislative procedure on which the change in the tax rate is based
has been completed.
Deferred tax assets on differences in the statement of financial
position and on tax losses carried forward are only recognized if
it is probable that these tax advantages can be realized in the
foreseeable future.
Deferred tax assets and deferred tax liabilities are offset against
each other insofar as taxes are levied by the same authority
and relate to the same tax period. In accordance with the regu-
lations of IAS 12, there is no discounting of deferred tax assets
and liabilities.
3.14 Provisions for pensions and similar obligations
Pensions and similar obligations comprise both the pension
obligations of the Jenoptik Group as well as defined benefit
and defined contribution retirement schemes.
In accordance with IAS 19, pension obligations for defined
benefit schemes are determined by applying the so-called pro-
jected unit credit method. Actuarial expert opinions are annu-
ally obtained for this procedure.
In Germany, the mortality rates are determined in accordance
with the Klaus Heubeck guideline mortality tables 2018 G. In
Switzerland, the BVG / LPP 2015 mortality tables apply. Actuarial
gains and losses are recognized outside profit or loss in other
comprehensive income. Past-service expenses are shown under
personnel expenses and the interest portion of the addition to
provisions is recorded in the financial result.
For defined contribution schemes, the contributions payable
are recognized immediately as an expense.
3.15 Tax provisions
Tax provisions contain obligations arising from current income
taxes. Deferred taxes are disclosed in separate items in the
statement of financial position.
Tax provisions for corporate income tax and trade tax or similar
income tax expenses are determined on the basis of the taxable
income of the consolidated entities, less any prepayments
made. Any other taxes to be assessed are considered in the
same manner.
3.16 Other provisions
In accordance with IAS 37 “Provisions, contingent liabilities
and contingent assets”, provisions are set aside insofar as
there is any current liability to a third party resulting from a past
event that is likely to lead to an outflow of resources in the
future and the amount of which can be reliably estimated. Other
provisions are only set aside for legal or de facto obligations to
third parties that are more likely than not at the reporting date.
Provisions are recognized at their settlement value discounted
to the reporting date, providing the interest effect is significant.
The settlement value also includes the anticipated price or
cost increases. Discounting is based on interest rates before
taxes that reflect current market expectations with regard
to the interest effect and which are dependent upon the corre-
sponding term of the obligation. The interest portion of the
compounding of the provision is recorded in the financial result.
Provisions are valued on the basis of empirical values, taking the
circumstances at the balance sheet date into consideration.
Provisions for guarantees and warranties are set aside for individ-
ual cases and on a lump-sum basis. The amount of the provi-
sion is based on the historical development of guarantees and
warranties as well as on a consideration of all future potential
guarantee or warranty claims, weighted by the probability of
their occurrence.
Claims of recourse are only taken into account if these claims
are virtually certain.

158
JENOPTIK Annual Report 2018
Consolidated Financial Statements | Notes
3.17 Share-based payments
The members of the Executive Board and some senior mana-
gement personnel of JENOPTIK AG receive share-based remuner-
ation in the form of long term incentives (LTI) as well as per-
formance shares in accordance with the new Executive Board
remuneration system. These payments are accounted for as
share-based payment with settlement in cash in accordance with
IFRS 2 “Share-based payment”. At the balance sheet date and
depending upon the contractual provisions, a long-term liability
is set aside in the amount either of the pro rata temporis or
full fair value of the payment obligation. Changes in fair value
are recognized through profit or loss.
3.18 Advances received
Advance payments received from customers were recognized
as liabilities in the fiscal year 2017, insofar as such payments do
not relate to construction contracts.
From the 2018 fiscal year, advance payments received will be
reported in accordance with IFRS 15 as part of the contract
assets or contract liabilities.
3.19 Contingent liabilities
Contingent liabilities are potential obligations that are based
on past events and whose existence is only confirmed by the
occurrence of one or more uncertain future events, which are,
however, outside the control of the Jenoptik Group. Moreover,
current obligations can constitute contingent liabilities if there
is insufficient certainty regarding the likelihood of outflows
of resources to set aside a provision and/or the amount of the
obligation cannot be reliably estimated. The valuations of the
contingent liabilities correspond to the existing scope of liability
at the balance sheet date. In principle, they are not accounted
for in the statement of financial position but are explained in
the Notes in the section “Contingent liabilities and contingent
payables” from page 198.
3.20 Revenue
Proceeds from contracts with customers are recognized in
accordance with IFRS 15 if the control of the goods or services
is transferred to the customer. These are recognized in the
amount of the consideration in return that the Group is
expected to receive in exchange for these goods or services.
For sales transactions with several performance obligations,
the revenue is allocated based on stand-alone selling prices.
Proceeds from the sale of goods are generally recorded at the
time when control of the asset passes to the customer. The
determination of this timing takes into account, among other
things, the transfer of the legal ownership, the physical transfer
of possession and any potentially agreed acceptance of the
products by the customer.
In certain cases, the goods produced by Jenoptik within a
specific order process represent assets without any alternative
benefit to the Group. Under the condition of a claim for com-
pensation of the work performed so far, revenue is realized over
time, with the percentage of completion determined accord-
ing to the input-oriented cost-to-cost method. This applies both
to the production of individual assets and development pro-
jects, followed by volume production (customer- specific volume
production).
Proceeds from the provision of services are recognized over
time according to the percentage of completion as at the bal-
ance sheet date, with the percentage of completion generally
determined according to the input-oriented cost-to-cost
method.
The Group usually offers statutory warranties for the repair of
defects that were present at the time of sale. These so-called
assurance-type warranties are recognized under provisions for
warranties in accordance with IAS 37. If agreed guarantees
and warranty claims significantly exceed the usual framework
(so-called service-type warranties), these are assessed and
accounted for as a separate performance obligation. In this
case, revenue proportion thereof is realized on a straight-line
basis over the agreed period of the service-type warranty.
Rental income received from investment property is recognized
on a straight-line basis over the term of the corresponding rental
contracts and disclosed in revenue.
If a contract contains a number of delimitable components (multi-
component contracts), these will be implemented separately in
accordance with the above principles.
In determining the consideration in return that Jenoptik receives
for fulfilling a customer order, agreed variable components are
estimated at the beginning of the contract and then included
in the transaction price when it is highly likely that the elimination
of the uncertainty associated with the variable components of
the consideration in return will not lead to a cancellation of
revenue which has already been recognized. At Jenoptik, this

159
15 Management 35 Corporate Governance 133 Consolidated 207 Further69 Combined53 Non-financial Reporting Management Report Financial Statements Information
Consolidated Financial Statem
ents
133
206
134136137138140
Consolidated Statement of Comprehensive IncomeConsolidated Statement of Financial PositionConsolidated Statement of Cash FlowsStatement of Changes in EquityNotes
applies to both agreed discounts and bonuses as well as to
possible contractual penalties.
As a result of the fact that advance payments received from the
customer are generally short-term, the Group takes advantage
of the simplification relief offered by IFRS 15 and refrains from
taking a financing component into account when determining
the consideration in return.
In the 2017 fiscal year, revenues were recorded in accordance
with both IAS 11 for construction contracts as well as IAS 18.
This gave rise to the following accounting policies and valua-
tion methods used in the prior year.
Revenue generated from the sale of goods is recognized through
profit or loss as soon as all material risks and rewards associated
with the ownership of the goods have been transferred to the
buyer, a price has been agreed or could be determined and
payment of same could be assumed. The payments charged to
the customers for the goods and services – less sales deduc-
tions and trade discounts – are shown under revenue.
Revenue from services was recorded in accordance with the
percentage of completion of the order at the balance sheet
date. The percentage of completion of the order is determined
on the basis of the services rendered. Income was only recog-
nized if there was sufficient probability that the entity would
receive the economic benefit associated with the contract.
Otherwise, income was only recognized to the extent that the
expenses incurred were refundable.
Rental income received from investment property was recog-
nized on a straight-line basis over the term of the corresponding
rental contracts and disclosed in revenue.
If a contract contained a number of delimitable components
(multi-component contracts), these were implemented sepa-
rately in accordance with the above principles.
3.21 Cost of sales
Cost of sales show the costs incurred to generate revenue.
This item also includes the costs for setting aside provisions for
warranties and guarantees. The scheduled depreciation
or amortization of intangible assets and property, plant, and
equipment is shown in accordance with the principle of cause
and included in cost of sales insofar as they are attributed to
the production process.
3.22 Research and development expenses
Research and development expenses include non-capitalizable
research and development expenses, with the exception of
research and development expenses for customer orders which
are disclosed under cost of sales.
3.23 Selling expenses and general administrative
expenses
Along with personnel expenses and cost of materials, selling
expenses include the costs incurred for distribution, advertising,
sales promotion, market research, and customer service. In
addition, since the 2018 fiscal year, selling expenses have also
included the costs for contract initiation which are immediately
recognized as an expense as a result of the application of the
practical remedy under IFRS 15, as the period of depreciation
for the asset that the Group would otherwise have recognized
is not more than one year.
General administrative expenses include personnel expenses
and the cost of materials as well as administration-related
depreciation.
3.24 Other operating income and expenses
Income from the reversal of provisions is recorded in the func-
tional costs, insofar as the provision was also generated in the
corresponding functional costs. If the provision was set aside
in other operating expenses, the provision reversal will also be
shown in other operating expenses. Furthermore, these items
include currency exchange gains and losses arising from opera-
tional receivables and liabilities as well as net gains or losses
arising from hedging instruments for these items. In addition to
other taxes, expenses for group projects are also allocated to
other operating expenses.
3.25 Financial income and financial expenses
The financial income and financial expenses of the Group
mainly comprise interest income and interest expenses. Further-
more, these items include currency exchange gains and losses
arising from financial assets and liabilities as well as net gains or
losses arising from hedging instruments for these financial assets
and liabilities. In addition, the financial income and financial
expenses include net gains and losses arising from the measure-
ment of the fair value of contingent considerations that are
classified as financial liabilities.
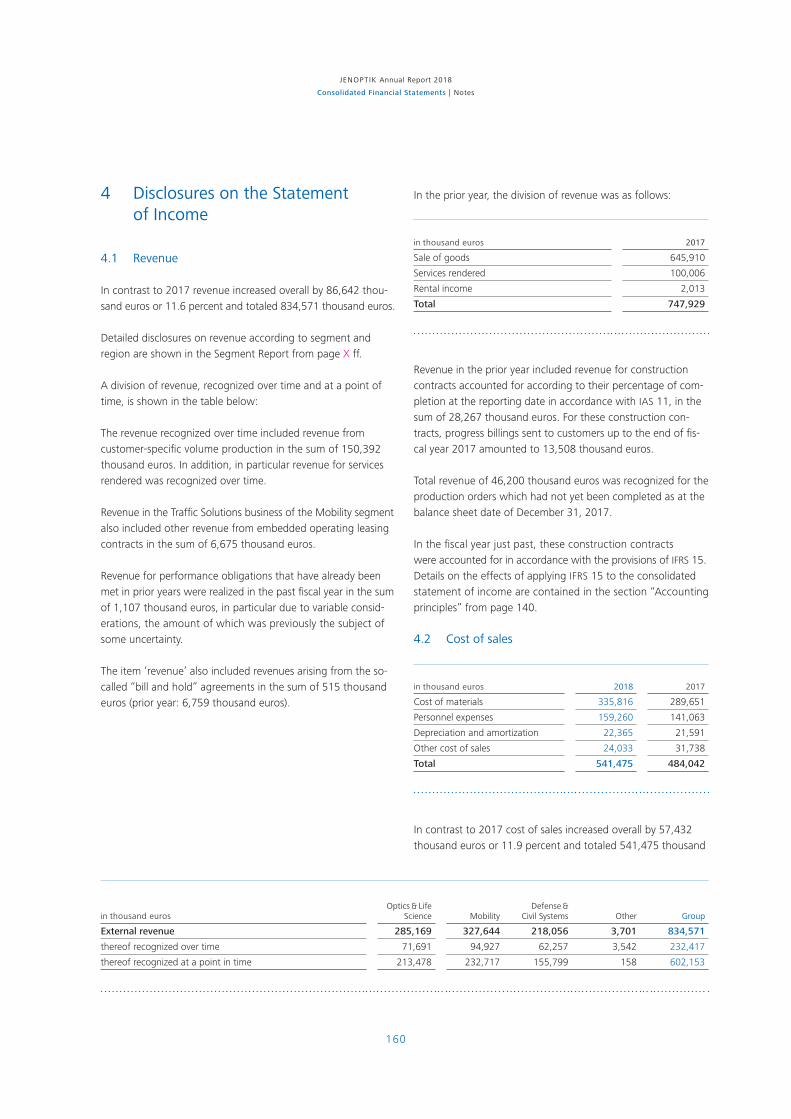
160
JENOPTIK Annual Report 2018
Consolidated Financial Statements | Notes
4 Disclosures on the Statement of Income
4.1 Revenue
In contrast to 2017 revenue increased overall by 86,642 thou-
sand euros or 11.6 percent and totaled 834,571 thousand euros.
Detailed disclosures on revenue according to segment and
region are shown in the Segment Report from page X ff.
A division of revenue, recognized over time and at a point of
time, is shown in the table below:
The revenue recognized over time included revenue from
customer- specific volume production in the sum of 150,392
thousand euros. In addition, in particular revenue for services
rendered was recognized over time.
Revenue in the Traffic Solutions business of the Mobility segment
also included other revenue from embedded operating leasing
contracts in the sum of 6,675 thousand euros.
Revenue for performance obligations that have already been
met in prior years were realized in the past fiscal year in the sum
of 1,107 thousand euros, in particular due to variable consid-
erations, the amount of which was previously the subject of
some uncertainty.
The item ‘revenue’ also included revenues arising from the so-
called “bill and hold” agreements in the sum of 515 thousand
euros (prior year: 6,759 thousand euros).
In the prior year, the division of revenue was as follows:
in thousand euros 2017
Sale of goods 645,910
Services rendered 100,006
Rental income 2,013
Total 747,929
Revenue in the prior year included revenue for construction
contracts accounted for according to their percentage of com-
pletion at the reporting date in accordance with IAS 11, in the
sum of 28,267 thousand euros. For these construction con-
tracts, progress billings sent to customers up to the end of fis-
cal year 2017 amounted to 13,508 thousand euros.
Total revenue of 46,200 thousand euros was recognized for the
production orders which had not yet been completed as at the
balance sheet date of December 31, 2017.
In the fiscal year just past, these construction contracts
were accounted for in accordance with the provisions of IFRS 15.
Details on the effects of applying IFRS 15 to the consolidated
statement of income are contained in the section “Accounting
principles” from page 140.
4.2 Cost of sales
in thousand euros 2018 2017
Cost of materials 335,816 289,651
Personnel expenses 159,260 141,063
Depreciation and amortization 22,365 21,591
Other cost of sales 24,033 31,738
Total 541,475 484,042
In contrast to 2017 cost of sales increased overall by 57,432
thousand euros or 11.9 percent and totaled 541,475 thousand
in thousand eurosOptics & Life
Science MobilityDefense &
Civil Systems Other Group
External revenue 285,169 327,644 218,056 3,701 834,571
thereof recognized over time 71,691 94,927 62,257 3,542 232,417
thereof recognized at a point in time 213,478 232,717 155,799 158 602,153

161
15 Management 35 Corporate Governance 133 Consolidated 207 Further69 Combined53 Non-financial Reporting Management Report Financial Statements Information
Consolidated Financial Statem
ents
133
206
134136137138140
Consolidated Statement of Comprehensive IncomeConsolidated Statement of Financial PositionConsolidated Statement of Cash FlowsStatement of Changes in EquityNotes
euros. Cost of sales include the costs incurred to generate reve-
nue. This item also records the costs for setting aside provisions
for sales-related transactions, in particular for guarantee and
warranty costs, as well as the costs for development services on
behalf of customers.
Cost of sales of 47,634 thousand euros was recognized for the
production orders which had not yet been completed as at the
balance sheet date of December 31, 2017. The profit realized
from these contracts totaled 8,299 thousand euros, a loss was
posted in the sum of 9,733 thousand euros. As a result of the
initial application of IFRS 15 as of January 1, 2018, these orders
are no longer accounted for as construction contracts within
the meaning of IAS 11.
4.3 Research and development expenses
In 2018, in contrast to the prior year, research and develop-
ment expenses increased overall by 4,364 thousand euros to
47,443 thousand euros.
These cover all expenses attributable to research and develop-
ment activities. These income statement items did not include
expenses paid by customers in connection with research and
development services in the sum of 20,191 thousand euros
(prior year: 22,155 thousand euros). Such expenditures were
allocated to cost of sales.
In the fiscal year just past, costs in the sum of 1,280 thousand
euros (prior year 549 thousand euros) were capitalized in intan-
gible assets for internal development projects.
More detailed information on the Group’s research and develop-
ment activities is provided in the Combined Management Report
in the section “Research and development” from page 81.
4.4 Selling expenses
In contrast to 2017, selling expenses increased overall by 6,737
thousand euros or 8.4 percent to 87,050 thousand euros in 2018.
Selling expenses include personnel expenses and the cost of
materials as well as sales-related depreciation / amortization.
They also include the expenses for sales commissions as well as
marketing and communication.
In addition, since the 2018 fiscal year, selling expenses have
also included the costs for contract initiation which are immedi-
ately recognized as an expense as a result of the application of
the practical remedy under IFRS 15, since the period of depreci-
ation for the asset that the Group would otherwise have recog-
nized, is not more than one year.
4.5 General administrative expenses
Compared to the prior year, general administrative expenses in
2018 increased slightly by 312 thousand euros to 56,129 thou-
sand euros.
General administrative expenses include personnel expenses
and the cost of materials as well as administration-related
depreciation / amortization.
4.6 Expenses according to types of expense
The following main types of expenses are included in revenue,
selling and administrative expenses as well as in the research
and development expenses:
in thousand euros 2018 2017
Cost of materials 356,089 309,343
Personnel expenses 278,347 258,275
Depreciation and amortization 30,569 28,684
Other expenses 67,091 66,947
Total 732,096 663,250
4.7 Other operating income
in thousand euros 2018 2017
Foreign currency exchange gains 9,744 8,178
Income from reversed bad debt allowances for receivables 3,461 1,416
Income from services, offsets and rentals 2,022 1,375
Income from non-cash contributions 1,686 1,593
Income from government grants 1,090 970
Income from damage claims / insurance benefits 557 414
Income from the sale of materials 230 351
Income from the sale of intangible assets and property, plant and equipment 119 222
Others 1,952 1,425
Total 20,861 15,944

162
JENOPTIK Annual Report 2018
Consolidated Financial Statements | Notes
Other operating income increased by 4,917 thousand euros
and thus by 30.8 percent to 20,861 thousand euros in 2018.
Income from foreign currency exchange gains mainly includes
gains arising from fluctuations in exchange rates between the
transaction date and the payment date of receivables and pay-
ables in foreign currencies, as well as exchange rate gains
arising from the valuation at the exchange rate on the report-
ing date.
The reversal of bad debt allowance for receivables has been
recorded through profit or loss on the basis of payments
received for overdue receivables.
Income from services, clearing and rental is not derived from
the normal activities of the companies.
Income from government grants generally related essentially
to grants for research and development projects that Jenoptik
received from the Federal Ministry for Education and Research
and other federal and European institutions.
Other operating income includes, amongst other things, income
from compensation and insurance payments, income from the
operation of staff canteens as well as income from asset disposal.
4.8 Other operating expenses
in thousand euros 2018 2017
Foreign currency exchange losses 8,823 11,836
Expenses from increase of bad debt allowances for receivables and bad debt losses 5,904 3,531
Expenses for group projects 2,877 530
Impairments of intangible assets and property, plant and equipment 2,136 248
Amortization of intangible assets from a first-time consolidation 2,031 1,362
Expenses for services and rentals 1,925 2,404
Acquisition costs 1,901 1,158
Losses from disposals of intangible assets and property, plant and equipment 387 296
Other taxes 358 359
Additions / reversals of provisions – 349 – 763
Others 2,433 1,618
Total 28,426 22,579
Other operating expenses increased by 5,847 thousand euros
or 25.9 percent compared with the prior year, to 28,426 thou-
sand euros.
The expenses incurred from foreign currency exchange losses
primarily include losses from changes in currency exchange
rates between the transaction date and the date of payment of
receivables or payables, as well as from the valuation at the
exchange rate on the reporting date. Exchange rate gains
resulting from these items are recognized under other operating
income. From the net viewpoint, foreign currency gains and
losses led to a net gain of 921 thousand euros in 2018 (prior
year: net loss of 3,658 thousand euros).
The expenses for group projects relate to a project to analyze
and optimize business processes and implement a new group-
wide ERP system.
Impairment losses on intangible assets and property, plant
and equipment include both the unscheduled amortization of
an intangible asset from an earlier acquisition, as a well as an
impairment loss on a building partly leased to a third party. Details
on this can be found in the sections “Intangible assets” from
page 166 and “Property, plant and equipment” from page 169.
The increase in amortization of intangible assets arising from
initial consolidations relates to some of the intangible assets
identified within the framework of the acquisitions of Prodomax
and the OTTO Group.
The acquisition costs include transaction and consultancy costs
for corporate acquisitions. In 2018, these were attributable to
the acquisitions of Prodomax and the OTTO Group.
The addition to and reversal of provisions include additions
in the sum of 237 thousand euros (prior year: 683 thousand
euros) as well as reversals in the sum of 586 thousand euros
(prior year: 1,446 thousand euros) which were not directly
apportioned to the functional costs. More information on these
items can be found in the section “Other provisions” from
page 183.
In fiscal year 2018, other operating expenses included, amongst
other things, one-off costs for the Group’s strategic realignment
project as well as for the launch of the VINCORION brand for
the mechatronics business.

163
15 Management 35 Corporate Governance 133 Consolidated 207 Further69 Combined53 Non-financial Reporting Management Report Financial Statements Information
Consolidated Financial Statem
ents
133
206
134136137138140
Consolidated Statement of Comprehensive IncomeConsolidated Statement of Financial PositionConsolidated Statement of Cash FlowsStatement of Changes in EquityNotes
4.9 Investment income
in thousand euros 2018 2017
Impairments and impairment reversals of financial investments – 9 74
Earnings from investments 161 6,393
Total 152 6,468
The investment income reduced by 6,316 thousand euros com-
pared to 2017, to 152 thousand euros.
The income from investments in the prior year included in
particular income from the sale of a minority holding and the sale
of listed securities in the total sum of 6,344 thousand euros.
In 2018, income from dividend payments from investment
companies as well as income from the subsequent adjustment
of the consideration for the minority shareholding that had
been transferred in the previous year, were recog nized under
this item.
4.10 Financial income and financial expenses
in thousand euros 2018 2017
Income from measuring financial instruments in foreign currency 3,105 776
Income from financial asset securities and loans 63 19
Income from fair value measurment of financial instruments 33 280
Other interest and similar income 237 682
Total financial income 3,438 1,756
Expenses for measuring financial instruments in foreign currency 2,135 1,797
Interest expenses for debenture loans 1,769 1,867
Interest expenses for syndicated loan 561 693
Interest expenses for foreign finance loans 551 485
Impairment losses from current financial investments cash and cash equivalents 411 0
Net interest expenses for pension provisions 540 502
Other interest and similar expenses 1,093 843
Total financial expenses 7,060 6,186
Total – 3,622 – 4,430
The net balance of financial income and financial expenses
improved by 808 thousand euros or 18.2 percent to minus
3,622 thousand euros (prior year: minus 4,430 thousand euros).
Income from the foreign currency valuation of financial
transactions in the sum of 3,105 thousand euros (prior year:
776 thousand euros) and countervailing expenses in the
sum of 2,135 thousand euros (prior year: 1,797 thousand
euros) led to a net profit of 970 thousand euros in fiscal
year 2018 (prior year: net loss of 1,021 thousand euros).
This result is derived from the foreign currency exchange
gains and losses arising from the valuation of financial invest-
ments which were issued in foreign currencies, less the
valuation of the respective derivatives.
The income from the valuation of financial instruments at fair
value includes the valuation of the put option agreed as part of
the acquisition of the Vysionics Group.
The item other interest and similar income primarily comprises
interest income from bank deposits.
Interest expenses for foreign finance loans were incurred on
local financing of entities in the USA and China.
The item other interest and similar expenses included guaranty
and bank charges, interest arising from finance leasing contracts,
as well as interest expenses from accrued interest on non-current
liabilities and other provisions.
4.11 Income taxes
Current income taxes (paid or owing) in the respective countries
as well as deferred tax assets and deferred tax liabilities are
shown as income taxes. The calculation of the current income
taxes of the Jenoptik Group was performed by using the tax
rates applicable at the balance sheet date.
The calculation of the deferred taxes for the domestic entities
was based on a tax rate of 29.74 percent (prior year: 29.74 per-
cent) In addition to the corporate income tax at 15.0 percent
(prior year: 15.0 percent) and the solidarity surcharge of 5.5 per-
cent of the corporate income tax charge (prior year 5.5 percent),
an effective trade tax rate of 13.92 percent (prior year:
13.92 percent) was taken into account. The calculation of
deferred taxes for foreign entities is based on the tax rates
applicable in the respective country.
Deferred taxes are recognized as either tax income or tax
expenses in the income statement, unless these directly relate
to items recognized outside of profit or loss in other compre-
hensive income. In this event, deferred taxes are also recognized
outside of profit or loss in other comprehensive income.
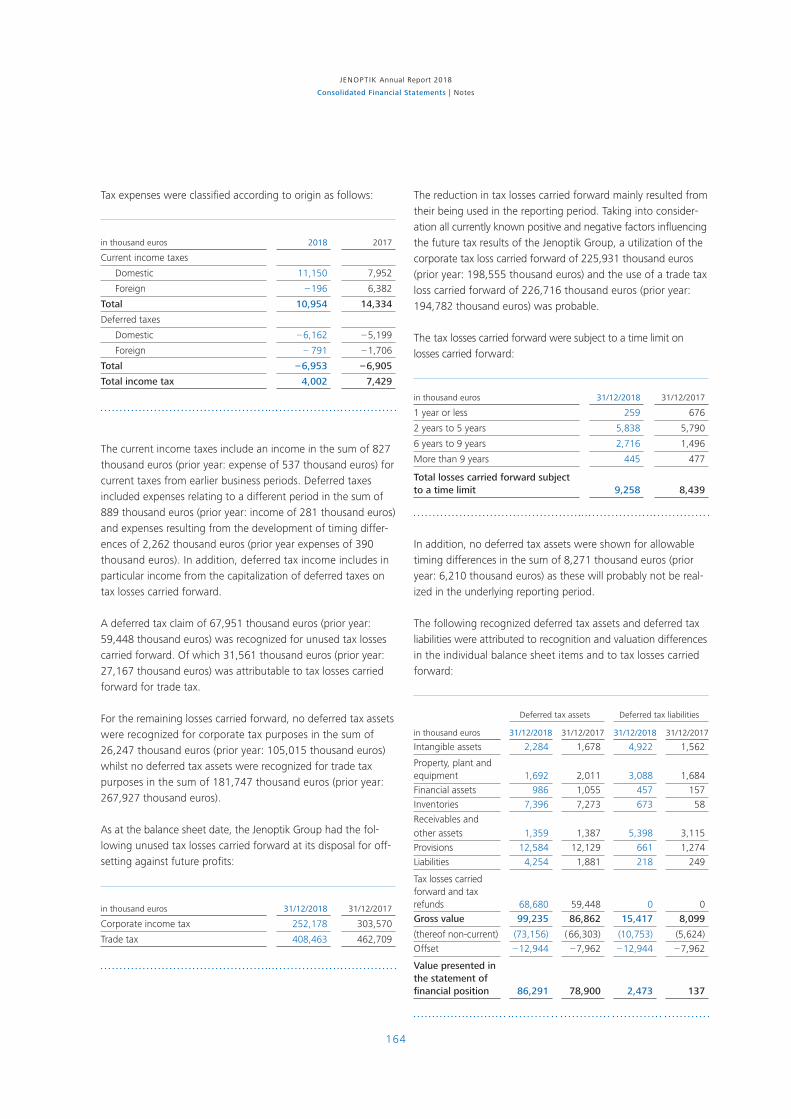
164
JENOPTIK Annual Report 2018
Consolidated Financial Statements | Notes
Tax expenses were classified according to origin as follows:
in thousand euros 2018 2017
Current income taxes
Domestic 11,150 7,952
Foreign – 196 6,382
Total 10,954 14,334
Deferred taxes
Domestic – 6,162 – 5,199
Foreign – 791 – 1,706
Total – 6,953 – 6,905
Total income tax 4,002 7,429
The current income taxes include an income in the sum of 827
thousand euros (prior year: expense of 537 thousand euros) for
current taxes from earlier business periods. Deferred taxes
included expenses relating to a different period in the sum of
889 thousand euros (prior year: income of 281 thousand euros)
and expenses resulting from the development of timing differ-
ences of 2,262 thousand euros (prior year expenses of 390
thousand euros). In addition, deferred tax income includes in
particular income from the capitalization of deferred taxes on
tax losses carried forward.
A deferred tax claim of 67,951 thousand euros (prior year:
59,448 thousand euros) was recognized for unused tax losses
carried forward. Of which 31,561 thousand euros (prior year:
27,167 thousand euros) was attributable to tax losses carried
forward for trade tax.
For the remaining losses carried forward, no deferred tax assets
were recognized for corporate tax purposes in the sum of
26,247 thousand euros (prior year: 105,015 thousand euros)
whilst no deferred tax assets were recognized for trade tax
purposes in the sum of 181,747 thousand euros (prior year:
267,927 thousand euros).
As at the balance sheet date, the Jenoptik Group had the fol-
lowing unused tax losses carried forward at its disposal for off-
setting against future profits:
in thousand euros 31/12/2018 31/12/2017
Corporate income tax 252,178 303,570
Trade tax 408,463 462,709
The reduction in tax losses carried forward mainly resulted from
their being used in the reporting period. Taking into consider-
ation all currently known positive and negative factors influencing
the future tax results of the Jenoptik Group, a utilization of the
corporate tax loss carried forward of 225,931 thousand euros
(prior year: 198,555 thousand euros) and the use of a trade tax
loss carried forward of 226,716 thousand euros (prior year:
194,782 thousand euros) was probable.
The tax losses carried forward were subject to a time limit on
losses carried forward:
in thousand euros 31/12/2018 31/12/2017
1 year or less 259 676
2 years to 5 years 5,838 5,790
6 years to 9 years 2,716 1,496
More than 9 years 445 477
Total losses carried forward subject to a time limit 9,258 8,439
In addition, no deferred tax assets were shown for allowable
timing differences in the sum of 8,271 thousand euros (prior
year: 6,210 thousand euros) as these will probably not be real-
ized in the underlying reporting period.
The following recognized deferred tax assets and deferred tax
liabilities were attributed to recognition and valuation differences
in the individual balance sheet items and to tax losses carried
forward:
Deferred tax assets Deferred tax liabilities
in thousand euros 31/12/2018 31/12/2017 31/12/2018 31/12/2017
Intangible assets 2,284 1,678 4,922 1,562
Property, plant and equipment 1,692 2,011 3,088 1,684
Financial assets 986 1,055 457 157
Inventories 7,396 7,273 673 58
Receivables and other assets 1,359 1,387 5,398 3,115
Provisions 12,584 12,129 661 1,274
Liabilities 4,254 1,881 218 249
Tax losses carried forward and tax refunds 68,680 59,448 0 0
Gross value 99,235 86,862 15,417 8,099
(thereof non-current) (73,156) ( 66,303) (10,753) (5,624)
Offset – 12,944 – 7,962 – 12,944 – 7,962
Value presented in the statement of financial position 86,291 78,900 2,473 137

165
15 Management 35 Corporate Governance 133 Consolidated 207 Further69 Combined53 Non-financial Reporting Management Report Financial Statements Information
Consolidated Financial Statem
ents
133
206
134136137138140
Consolidated Statement of Comprehensive IncomeConsolidated Statement of Financial PositionConsolidated Statement of Cash FlowsStatement of Changes in EquityNotes
The net inventory of the asset surplus in deferred taxes
increased by 5,055 thousand euros. Taking into consideration
the deferred taxes (minus 2,229 thousand euros) recognized
outside of profit or loss, initial consolidations (4,217 thousand
euros), as well as the foreign currency exchange conversions
(minus 90 thousand euros), offset in the reporting year, this
gave rise to deferred tax income of 6,953 thousand euros
shown in the income statement.
Temporary differences in the sum of 79,965 thousand euros
(prior year: 66,463 thousand euros) related to shares in subsid-
iaries. Deferred tax liabilities in the sum of 28 thousand euros
(prior year: 0) were set aside on outside basis differences.
The table above shows the tax reconciliation between the tax
expense expected in the respective fiscal year and the actual
tax expense recognized. To determine the anticipated
tax expense, in the fiscal year 2018 the applicable group tax
rate of 29.74 percent (prior year: 29.74%) was multiplied by
the earnings before tax (EBT).
in thousand euros 2018 2017
Earnings before tax 91,440 80,082
Corporate income tax rate for the Jenoptik Group in % 29.74 29.74
Expected tax expense 27,194 23,816
Following tax effects resulted in the difference between the actual and the expected tax expense:
Non-deductible expenses, tax-free income and permanent deviations 691 578
Changes in unrecognized deferred taxes – 24,204 – 20,590
Effects resulting from tax rate differences 415 1,080
Effects of tax rate changes 79 1,535
Taxes for prior years – 414 584
Other tax effects 241 426
Total adjustments – 23,192 – 16,387
Actual tax expense 4,002 7,429
4.12 Earnings from non-controlling interests
Earnings from non-controlling interests in the group earnings
totaled 138 thousand euros (prior year: 149 thousand euros)
and related to the non-controlling interests in JENOPTIK Korea
Corporation Ltd., JENOPTIK Japan Co. Ltd. as well as the
Vysionics Group. The portion of group earnings of the non-
controlling shareholders of the Vysionics Group were only
taken into account up to the exercising of the put options of
the non-controlling shareholders in respect of all shares still
held by them during the course of the year.
More information on the entities with non-controlling interests
is available in section 2.1 “The group of entities consolidated”
from page 146.
4.13 Earnings per share
Earnings per share corresponds to the earnings attributable
to shareholders divided by the weighted average of outstanding
shares.
2018 2017
Earnings attributable to shareholders 87,575 72,504
Weighted average number of outstanding shares 57,238,115 57,238,115
Earnings per share in euros (diluted = undiluted) 1.53 1.27
Further information on earnings per share is available in section
Jenoptik Share from page 32.
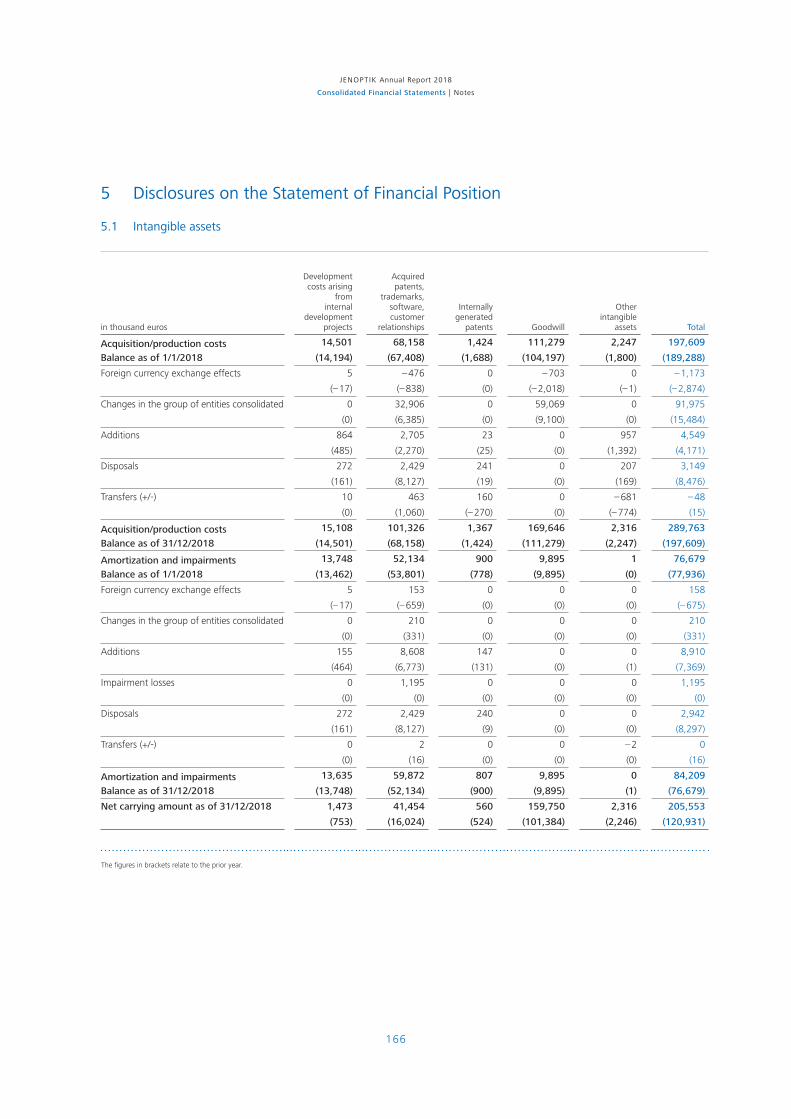
166
JENOPTIK Annual Report 2018
Consolidated Financial Statements | Notes
5 Disclosures on the Statement of Financial Position
5.1 Intangible assets
in thousand euros
Developmentcosts arising
from internal
developmentprojects
Acquired patents,
trademarks,software,customer
relationships
Internally generated
patents Goodwill
Otherintangible
assets Total
Acquisition/production costsBalance as of 1/1/2018
14,501 68,158 1,424 111,279 2,247 197,609
(14,194) (67,408) (1,688) (104,197) (1,800) (189,288)
Foreign currency exchange effects 5 – 476 0 – 703 0 – 1,173
(– 17) (– 838) (0) (– 2,018) (– 1) (– 2,874)
Changes in the group of entities consolidated 0 32,906 0 59,069 0 91,975
(0) (6,385) (0) (9,100) (0) (15,484)
Additions 864 2,705 23 0 957 4,549
(485) (2,270) (25) (0) (1,392) (4,171)
Disposals 272 2,429 241 0 207 3,149
(161) (8,127) (19) (0) (169) (8,476)
Transfers (+/-) 10 463 160 0 – 681 – 48
(0) (1,060) (– 270) (0) (– 774) (15)
Acquisition/production costs Balance as of 31/12/2018
15,108 101,326 1,367 169,646 2,316 289,763
(14,501) (68,158) (1,424) (111,279) (2,247) (197,609)
Amortization and impairments Balance as of 1/1/2018
13,748 52,134 900 9,895 1 76,679
(13,462) (53,801) (778) (9,895) (0) (77,936)
Foreign currency exchange effects 5 153 0 0 0 158
(– 17) (– 659) (0) (0) (0) (– 675)
Changes in the group of entities consolidated 0 210 0 0 0 210
(0) (331) (0) (0) (0) (331)
Additions 155 8,608 147 0 0 8,910
(464) (6,773) (131) (0) (1) (7,369)
Impairment losses 0 1,195 0 0 0 1,195
(0) (0) (0) (0) (0) (0)
Disposals 272 2,429 240 0 0 2,942
(161) (8,127) (9) (0) (0) (8,297)
Transfers (+/-) 0 2 0 0 – 2 0
(0) (16) (0) (0) (0) (16)
Amortization and impairments Balance as of 31/12/2018
13,635 59,872 807 9,895 0 84,209
(13,748) (52,134) (900) (9,895) (1) (76,679)
Net carrying amount as of 31/12/2018 1,473 41,454 560 159,750 2,316 205,553
(753) (16,024) (524) (101,384) (2,246) (120,931)
The figures in brackets relate to the prior year.

167
15 Management 35 Corporate Governance 133 Consolidated 207 Further69 Combined53 Non-financial Reporting Management Report Financial Statements Information
Consolidated Financial Statem
ents
133
206
134136137138140
Consolidated Statement of Comprehensive IncomeConsolidated Statement of Financial PositionConsolidated Statement of Cash FlowsStatement of Changes in EquityNotes
The changes in the group of entities consolidated included
the additions from the acquisitions of Prodomax and the OTTO
Group, as well as the effects from the final valuation of the
intangible assets of Five Lakes Automation LLC identified as
part of the purchase price allocation.
As the result of an impairment test, an impairment loss on cus-
tomer relationships capitalized in the context of an acquisition
was recognized in the sum of 1,195 thousand euros.
Disposals of patents, trademarks, software, and customer rela-
tionships primarily relate to intangible assets that were recorded
in prior years within the context of acquisitions and which are
written off in full at the end of their useful life.
As in the prior year, intangible assets were not subject to any
disposal restrictions. The order commitments for intangible
assets totaled 329 thousand euros (prior year: 545 thousand
euros).
Additions to other intangible assets included capitalized expenses
for internally generated assets in development in the sum of
632 thousand euros (prior year: 260 thousand euros), of which
417 thousand euros were attributable to development costs
arising from internal development projects and 216 thousand
euros to internally generated patents. Once the internal devel-
opment projects have been completed or the patents granted,
these were transferred to the corresponding groups of intangi-
ble assets.
Other than goodwill, there were no intangible assets with an
indefinite useful life.
As of December 31, 2018 goodwill amounted to 159,750 thou-
sand euros (prior year: 101,384 thousand euros). The additions
to goodwill in the sum of 59,069 thousand euros resulted from
the acquisitions of Prodomax and the OTTO Group as well as
the finalization of the initial consolidation Five Lakes Automation
LLC. The further change in the carrying amounts in the sum of
minus 703 thousand euros was attributable exclusively to currency
effects (prior year: minus 2,017 thousand euros).
As in the prior year, no impairments were required for goodwill
in the 2018 fiscal year.
The following table summarizes the goodwill for each
cash-generating unit according to segment:
in thousand euros 31/12/2018 31/12/2017
Optics & Life Science 42,759 42,661
Optical Systems 1,529 1,460
Healthcare & Industry 41,230 41,201
Mobility 109,071 50,802
Automotive 68,704 10,032
Traffic Solutions 40,367 40,770
Defense & Civil Systems 7,921 7,921
Total 159,750 101,384
The following table shows the allocation of goodwill to the
segments by percentage:
in percent 31/12/2018 31/12/2017
Optics & Life Science 27 42
Mobility 68 50
Defense & Civil Systems 5 8
Total 100 100
The impairment test for goodwill was performed at the level of
the cash-generating units benefiting from the synergies of the
respective business combination and representing the lowest
level at which goodwill is monitored for internal company man-
agement. If the carrying amounts of these cash-generating
units exceeded their recoverable amounts, the goodwill allocated
was correspondingly reduced. The determining factor for the
impairment test was the recoverable amount, i.e. the higher of
the two amounts derived from the fair value less costs to sell or
value in use.
Jenoptik calculated the recoverable amount in the form of the
value in use, based on a discounted cash flow method. The
basis for this was the five-year corporate plan approved by the
management and submitted to the Supervisory Board. This
took past experience into consideration and was based on the
management’s best estimate of future development. The cash
flows in the detailed planning phase were planned on the basis
of differentiated growth rates. These took account of the
development and dynamics of the relevant sectors and target
markets.
In fiscal year 2018, Healthcare & Industry, as part of the Optics
& Life Science segment, repeated the positive performance it
achieved in the prior year. Sales growth was marked by a signif-
icant increase in profitability. The focus on the strategic market
segments Bio-Imaging, Laser-based Therapy and Mobility,

168
JENOPTIK Annual Report 2018
Consolidated Financial Statements | Notes
Industrial Automation & Security will secure the profitable busi-
ness and contribute to sustainable growth.
The Automotive division, as part of the Mobility segment, posted
a significant increase in revenue and profitability in the past
fiscal year. Future growth will be driven by an expansion of its
automotive customer business, as well as the increased offer-
ing of integrated production solutions and the development of
other key industries on the international level. The corporate
plan for the Automotive division takes only moderate growth
into account. Additional synergy effects are expected as a result
of the new acquisitions.
In fiscal year 2018, Traffic Solutions, as part of the Mobility
segment, posted an increase in revenue and profitability. The
focus of development over the coming years will be on the
increasing level of internationalization, especially in the regions
of the Americas, the Middle East/North Africa, and other European
countries. The on-going continuation of structural and process
optimizations as well as the increase in the creation of local
and international value added, lead us to anticipate a sustained
increase in revenue and profitability over the medium term.
Based on the expansion of the international business, sales
are anticipated to continue growing across all segments. This is
coupled with the assumption that part of the added value is
relocated to the target regions in order to generate sustainable
growth in profitability.
Differentiated ranges are used to determine the future develop-
ment of the working capital. At the same time, the result of the
respective planning year for determining the free cash flow is
adjusted for non-cash expenses and income such as depreciation /
amortization.
This assumes a perpetual annuity, the amount of which is indi-
vidually determined for each cash-generating unit by management
from the fifth year of the planning time frame. The perpetual
annuity includes a growth component in the form of a deduction
on the capitalization interest rate of between 0.9 and 1.1 per-
centage points (prior year 0.9 and 1.1 percentage points). Non-
recurring effects in the last year of the plan are eliminated prior
to calculating the perpetual annuity.
The weighted average cost of capital after taxes required for
the impairment tests is determined by using the capital asset
pricing model for determining the cost of equity. The compo-
nents for calculating the cost of equity are a risk-free interest
rate, the market risk premium, a beta factor customary in our
industry determined from peer groups, and the average country
risk of each cash-generating unit. Borrowing costs were deter-
mined by including a risk-free interest rate, the spread custom-
ary in our industry, and the standard average tax rate. The
weighted costs of equity and borrowing costs resulted from
applying the capital structure customary in our industry.
Impairment testing was conducted assuming a weighted average
cost of capital after taxes at a rate of between 5.26 and 8.26
percent (prior year: 6.10 percent and 8.15 percent). This corre-
sponded to the weighted average cost of capital before tax of
between 6.47 percent and 11.67 percent (prior year: 7.85 per-
cent and 10.68 percent).
The assumptions used to determine the values in use of the
cash-generating unit are shown in the following table:
Growth component in perpetual
annuity
Weighted average cost
of capital after taxes
Weighted average cost
of capital before taxes
Optical Systems 1.10 7.51 10.45
(1.00) (7.30) (10.65)
Healthcare & Industry 1.10 7.35 9.71
(1.10) (8.15) (10.68)
Automotive 0.90 8.26 11.67
(0.90) (7.20) (10.16)
Traffic Solutions 0.90 5.26 6.47
(0.90) (6.10) (7.85)
Defense & Civil Systems 0.90 6.20 8.63
(0.90) (6.10) (8.80)
The figures in brackets relate to the prior year.
Sensitivity analyses were conducted for all cash-generating units
to which goodwill was allocated as of December 31, 2018.
An increase in the weighted cost of capital rates of more than
0.4 percentage points, or a reduction in the cash flow of more
than 8.0 percent would have caused the recoverable amount to
fall below the carrying amount of the cash-generating unit
Automotive.
Sensitivity analyses for the other cash-generating units would
not result in the recoverable amount being less than the carry-
ing amount within the bandwidths considered possible by the
management.
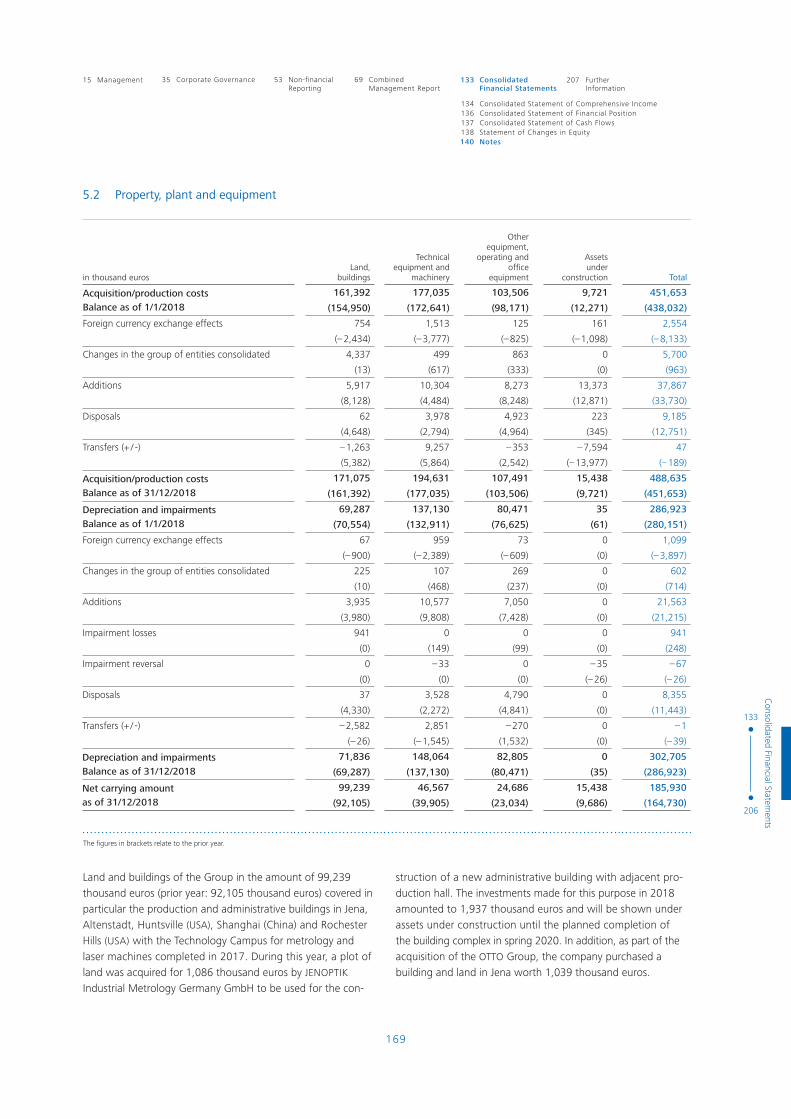
169
15 Management 35 Corporate Governance 133 Consolidated 207 Further69 Combined53 Non-financial Reporting Management Report Financial Statements Information
Consolidated Financial Statem
ents
133
206
134136137138140
Consolidated Statement of Comprehensive IncomeConsolidated Statement of Financial PositionConsolidated Statement of Cash FlowsStatement of Changes in EquityNotes
5.2 Property, plant and equipment
in thousand eurosLand,
buildings
Technicalequipment and
machinery
Otherequipment,
operating andoffice
equipment
Assetsunder
construction Total
Acquisition/production costs Balance as of 1/1/2018
161,392 177,035 103,506 9,721 451,653
(154,950) (172,641) (98,171) (12,271) (438,032)
Foreign currency exchange effects 754 1,513 125 161 2,554
(– 2,434) (– 3,777) (– 825) (– 1,098) (– 8,133)
Changes in the group of entities consolidated 4,337 499 863 0 5,700
(13) (617) (333) (0) (963)
Additions 5,917 10,304 8,273 13,373 37,867
(8,128) (4,484) (8,248) (12,871) (33,730)
Disposals 62 3,978 4,923 223 9,185
(4,648) (2,794) (4,964) (345) (12,751)
Transfers (+ / -) – 1,263 9,257 – 353 – 7,594 47
(5,382) (5,864) (2,542) (– 13,977) (– 189)
Acquisition/production costsBalance as of 31/12/2018
171,075 194,631 107,491 15,438 488,635
(161,392) (177,035) (103,506) (9,721) (451,653)
Depreciation and impairmentsBalance as of 1/1/2018
69,287 137,130 80,471 35 286,923
(70,554) (132,911) (76,625) (61) (280,151)
Foreign currency exchange effects 67 959 73 0 1,099
(– 900) (– 2,389) (– 609) (0) (– 3,897)
Changes in the group of entities consolidated 225 107 269 0 602
(10) (468) (237) (0) (714)
Additions 3,935 10,577 7,050 0 21,563
(3,980) (9,808) (7,428) (0) (21,215)
Impairment losses 941 0 0 0 941
(0) (149) (99) (0) (248)
Impairment reversal 0 – 33 0 – 35 – 67
(0) (0) (0) (– 26) (– 26)
Disposals 37 3,528 4,790 0 8,355
(4,330) (2,272) (4,841) (0) (11,443)
Transfers (+ / -) – 2,582 2,851 – 270 0 – 1
(– 26) (– 1,545) (1,532) (0) (– 39)
Depreciation and impairmentsBalance as of 31/12/2018
71,836 148,064 82,805 0 302,705
(69,287) (137,130) (80,471) (35) (286,923)
Net carrying amount as of 31/12/2018
99,239 46,567 24,686 15,438 185,930
(92,105) (39,905) (23,034) (9,686) (164,730)
The figures in brackets relate to the prior year.
Land and buildings of the Group in the amount of 99,239
thousand euros (prior year: 92,105 thousand euros) covered in
particular the production and administrative buildings in Jena,
Altenstadt, Huntsville (USA), Shanghai (China) and Rochester
Hills (USA) with the Technology Campus for metrology and
laser machines completed in 2017. During this year, a plot of
land was acquired for 1,086 thousand euros by JENOPTIK
Industrial Metrology Germany GmbH to be used for the con-
struction of a new administrative building with adjacent pro-
duction hall. The investments made for this purpose in 2018
amounted to 1,937 thousand euros and will be shown under
assets under construction until the planned completion of
the building complex in spring 2020. In addition, as part of the
acquisition of the OTTO Group, the company purchased a
building and land in Jena worth 1,039 thousand euros.
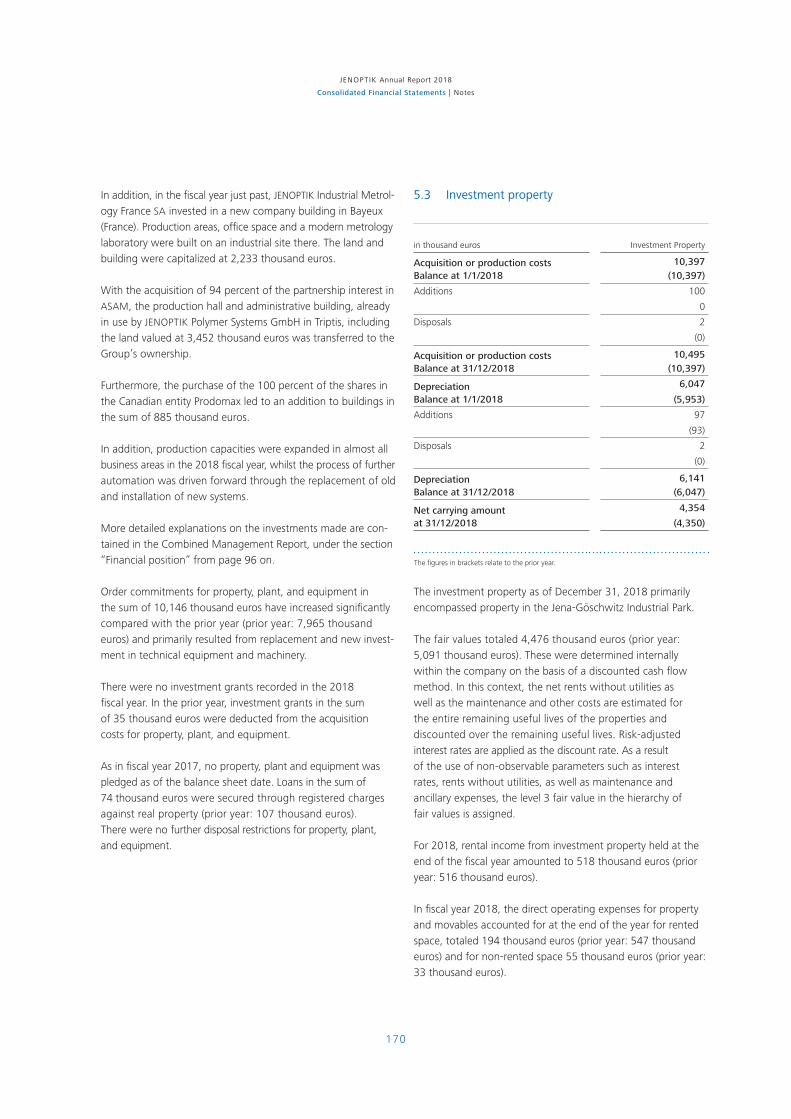
170
JENOPTIK Annual Report 2018
Consolidated Financial Statements | Notes
In addition, in the fiscal year just past, JENOPTIK Industrial Metrol-
ogy France SA invested in a new company building in Bayeux
(France). Production areas, office space and a modern metrology
laboratory were built on an industrial site there. The land and
building were capitalized at 2,233 thousand euros.
With the acquisition of 94 percent of the partnership interest in ASAM, the production hall and administrative building, already
in use by JENOPTIK Polymer Systems GmbH in Triptis, including
the land valued at 3,452 thousand euros was transferred to the
Group’s ownership.
Furthermore, the purchase of the 100 percent of the shares in
the Canadian entity Prodomax led to an addition to buildings in
the sum of 885 thousand euros.
In addition, production capacities were expanded in almost all
business areas in the 2018 fiscal year, whilst the process of further
automation was driven forward through the replacement of old
and installation of new systems.
More detailed explanations on the investments made are con-
tained in the Combined Management Report, under the section
“Financial position” from page 96 on.
Order commitments for property, plant, and equipment in
the sum of 10,146 thousand euros have increased significantly
compared with the prior year (prior year: 7,965 thousand
euros) and primarily resulted from replacement and new invest-
ment in technical equipment and machinery.
There were no investment grants recorded in the 2018
fiscal year. In the prior year, investment grants in the sum
of 35 thousand euros were deducted from the acquisition
costs for property, plant, and equipment.
As in fiscal year 2017, no property, plant and equipment was
pledged as of the balance sheet date. Loans in the sum of
74 thousand euros were secured through registered charges
against real property (prior year: 107 thousand euros).
There were no further disposal restrictions for property, plant,
and equipment.
5.3 Investment property
in thousand euros Investment Property
Acquisition or production costs Balance at 1/1/2018
10,397 (10,397)
Additions 100
0
Disposals 2
(0)
Acquisition or production costs Balance at 31/12/2018
10,495 (10,397)
Depreciation Balance at 1/1/2018
6,047
(5,953)
Additions 97
(93)
Disposals 2
(0)
Depreciation Balance at 31/12/2018
6,141 (6,047)
Net carrying amount at 31/12/2018
4,354
(4,350)
The figures in brackets relate to the prior year.
The investment property as of December 31, 2018 primarily
encompassed property in the Jena-Göschwitz Industrial Park.
The fair values totaled 4,476 thousand euros (prior year:
5,091 thousand euros). These were determined internally
within the company on the basis of a discounted cash flow
method. In this context, the net rents without utilities as
well as the maintenance and other costs are estimated for
the entire remaining useful lives of the properties and
discounted over the remaining useful lives. Risk-adjusted
interest rates are applied as the discount rate. As a result
of the use of non-observable parameters such as interest
rates, rents without utilities, as well as maintenance and
ancillary expenses, the level 3 fair value in the hierarchy of
fair values is assigned.
For 2018, rental income from investment property held at the
end of the fiscal year amounted to 518 thousand euros (prior
year: 516 thousand euros).
In fiscal year 2018, the direct operating expenses for property
and movables accounted for at the end of the year for rented
space, totaled 194 thousand euros (prior year: 547 thousand
euros) and for non-rented space 55 thousand euros (prior year:
33 thousand euros).

171
15 Management 35 Corporate Governance 133 Consolidated 207 Further69 Combined53 Non-financial Reporting Management Report Financial Statements Information
Consolidated Financial Statem
ents
133
206
134136137138140
Consolidated Statement of Comprehensive IncomeConsolidated Statement of Financial PositionConsolidated Statement of Cash FlowsStatement of Changes in EquityNotes
5.4 Leasing
Finance leasesThe Group as lessee. In fiscal year 2018, all technical equipment
and machinery was lease financed. These were accounted
for at a carrying amount of 3,658 thousand euros. The original
acquisition and production costs totaled 4,101 thousand euros.
In addition, there are leases for other equipment, operating
and office equipment. The carrying amount totaled 558 thousand
euros (prior year: 416 thousand euros). The original acquisition
and production costs for these assets totaled 668 thousand
euros (prior year: 505 thousand euros). This essentially included
technical testing equipment as well as a storage system in the IT environment.
The finance lease contracts in force as of the balance sheet date
were based on a weighted average interest rate of 1.7 percent
(prior year: 2.9 percent).
Of the lease payments in the sum of 749 thousand euros
(prior year: 87 thousand euros), 36 thousand euros (prior year:
7 thousand euros) were recognized through profit or loss in
the fiscal year 2018. This corresponds to the interest portion
included in the lease payment.
The lease payments due in the future are shown in the following
table:
in thousand eurosUp to 1 year 1 to 5 years
More than 5 years Total
Minimum lease payments
868 3,230 11 4,109
(193) (705) (0) (898)
Interest portions included in payments
39 63 0 102
(12) (15) (0) (27)
Present value 829 3,167 11 4,007
(180) (690) (0) (871)
The figures in brackets relate to the prior year.
The Group as lessor. One group entity in the Mobility segment
had concluded contracts for leasing traffic safety equipment
to a client which were qualified as finance leases. The average
total lease period for these contracts was 30 months.
Of the agreed minimum lease payments received in the fiscal
year 2018 in the sum of 298 thousand euros (prior year:
468 thousand euros) none (prior year: 5 thousand euros) were
recognized through profit or loss as no interest was due on the
current portion due to the expiry of the contract in the current
fiscal year.
As of December 31, 2018, there were no further outstanding
minimum lease payments:
in thousand eurosUp to 1 year 1 to 5 years
More than 5 years Total
Minimum lease payments
0 0 0 0
(340) (0) (0) (340)
Present value 0 0 0 0
(340) (0) (0) (340)
The figures in brackets relate to the prior year.
All financial income arising from this lease business was recorded
through profit or loss.
Operating leasesThe Group as lessee. Operating leases mainly included lease
agreements for commercial space as well as for office and data
processing equipment and motor vehicles.
The payments arising from leases were recognized through
profit or loss in the sum of 11,052 thousand euros (prior year:
9,767 thousand euros). As in the prior year, there were no
contingent lease payments included.
As of the balance sheet date, there were open obligations arising
from operating leases without a termination date, with the
following maturities:
in thousand eurosUp to 1 year 1 to 5 years
More than 5 years Total
Minimum lease payments
10,107 30,494 25,397 65,999
(8,670) (23,193) (21,607) (53,470)
The figures in brackets relate to the prior year.
The increase in the minimum lease payments in fiscal year 2018
was essentially attributable to the conclusion of a new long-
term lease contract at JENOPTIK Holdings UK Ltd. following a
relocation to a new company building.
The Group as lessor. Within the framework of operating leases
the Group leases commercial property. Rental income from the

172
JENOPTIK Annual Report 2018
Consolidated Financial Statements | Notes
leasing of property, plant, and equipment and from investment
property in the reporting period amounted to 1,905 thousand
euros (prior year: 2,013 thousand euros).
At the balance sheet date the following minimum lease payments
had been contractually agreed with the tenants:
in thousand eurosUp to 1 year 1 to 5 years
More than 5 years Total
Minimum lease payments
475 1,381 7 1,864
(857) (1,068) (7) (1,933)
The figures in brackets relate to the prior year.
Lease agreements without a termination date were recorded
in rental income only up until the date of the earliest possible
termination. The probability of leasing the space further or of
granting extensions on the lease agreements was not included
in the calculation.
5.5 Financial investments
in thousand euros 31/12/2018 31/12/2017
Shares in associates 5,191 0
Shares in unconsolidated associates 411 610
Investment companies 1,158 2,202
Loans to unconsolidated associates and investment companies 10 730
Long-term loans 0 867
Total 6,770 4,408
Shares in associatesAs of January 1, 2018 TELSTAR-HOMMEL CORPORATION, Ltd.
of Pyeongtaek, Korea, was also included in the consolidated
financial statements as an associated company using the at-
equity method. The company is a long-standing partner for
Jenoptik in the Korean market and sources components,
amongst other things, from the Automotive division.
The carrying amount of the investment was reclassified as
shares of an associated company and the difference between
the proportional net assets to which Jenoptik is entitled and
the carrying amount at the date of the initial at-equity consoli-
dation was offset in the sum of 3,614 thousand euros against
the retained earnings outside profit or loss.
The following table contains summarized financial information
of the company:
in thousand euros 2018
Disclosures on Income Statement
Revenue 40,179
Profit / loss from continuing operations 1,611
Other comprehensive income 55
Total comprehensive income 1,666
Amount of the shares in % 33.3 %
Group share of total comprehensive income 555
Disclosures on Statement of Financial Position and reconciliation to the at-equity carrying amount
Non-current assets 13,460
Current assets 23,187
Non-current liabilities 16,790
Current liabilities 4,281
Equity 15,575
Amount of the shares in % 33.3 %
Share in equity = at equity carrying amount 5,191
The figures in brackets relate to the prior year.
The share of the company’s profit due to Jenoptik is shown
under other operating income.
Other financial investmentsThe reduction in shares in and loans to unconsolidated associates
can be attributed to the initial consolidation of RADARLUX
Radar Systems GmbH. As a result of the acquisition of shares in
ASAM and its inclusion in the consolidated financial statements,
the tenant loan accounted for as a long-term loan in the prior
year was eliminated as part of the debt consolidation process.
The table below reflects the changes in the impairments to
financial investments:
in thousand euros 2018 2017
Impairments at 1/1 12,668 15,070
Change in the group of consolidated entities – 2,213 0
Additions 656 763
Utilization 586 2,978
Reversal / derecognition 1 187
Impairments at 31/12 10,523 12,668
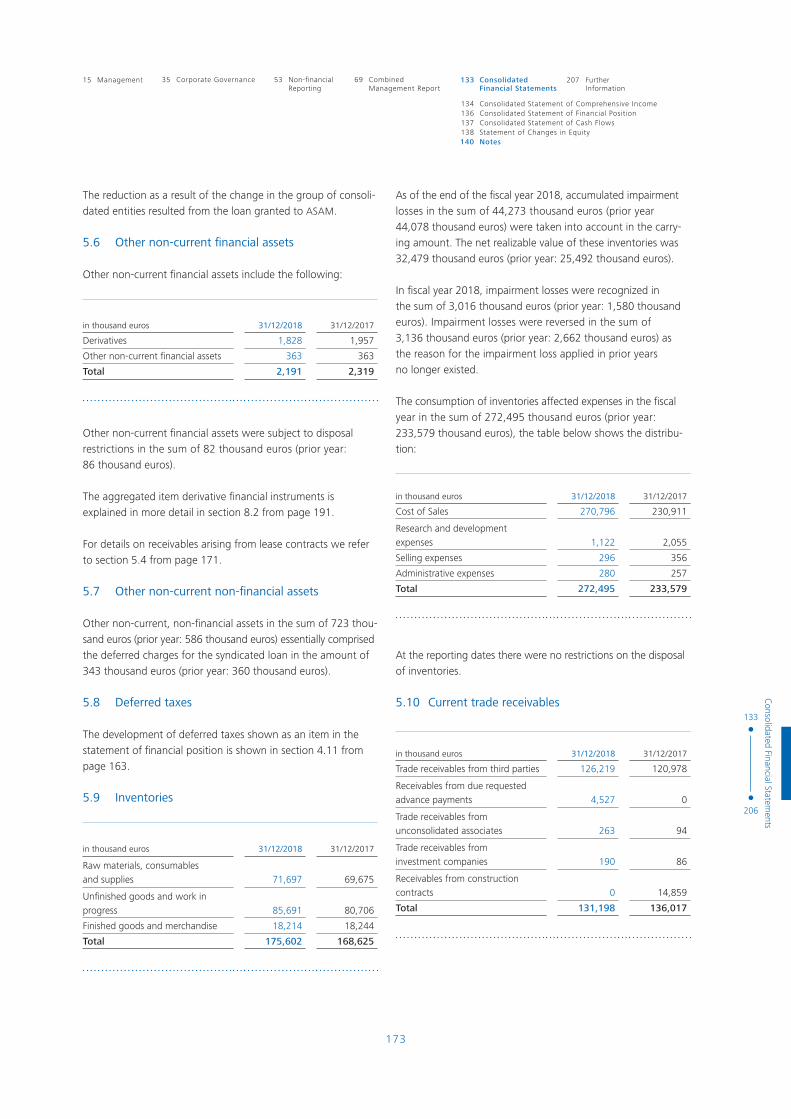
173
15 Management 35 Corporate Governance 133 Consolidated 207 Further69 Combined53 Non-financial Reporting Management Report Financial Statements Information
Consolidated Financial Statem
ents
133
206
134136137138140
Consolidated Statement of Comprehensive IncomeConsolidated Statement of Financial PositionConsolidated Statement of Cash FlowsStatement of Changes in EquityNotes
The reduction as a result of the change in the group of consoli-
dated entities resulted from the loan granted to ASAM.
5.6 Other non-current financial assets
Other non-current financial assets include the following:
in thousand euros 31/12/2018 31/12/2017
Derivatives 1,828 1,957
Other non-current financial assets 363 363
Total 2,191 2,319
Other non-current financial assets were subject to disposal
restrictions in the sum of 82 thousand euros (prior year:
86 thousand euros).
The aggregated item derivative financial instruments is
explained in more detail in section 8.2 from page 191.
For details on receivables arising from lease contracts we refer
to section 5.4 from page 171.
5.7 Other non-current non-financial assets
Other non-current, non-financial assets in the sum of 723 thou-
sand euros (prior year: 586 thousand euros) essentially comprised
the deferred charges for the syndicated loan in the amount of
343 thousand euros (prior year: 360 thousand euros).
5.8 Deferred taxes
The development of deferred taxes shown as an item in the
statement of financial position is shown in section 4.11 from
page 163.
5.9 Inventories
in thousand euros 31/12/2018 31/12/2017
Raw materials, consumables and supplies 71,697 69,675
Unfinished goods and work in progress 85,691 80,706
Finished goods and merchandise 18,214 18,244
Total 175,602 168,625
As of the end of the fiscal year 2018, accumulated impairment
losses in the sum of 44,273 thousand euros (prior year
44,078 thousand euros) were taken into account in the carry-
ing amount. The net realizable value of these inventories was
32,479 thousand euros (prior year: 25,492 thousand euros).
In fiscal year 2018, impairment losses were recognized in
the sum of 3,016 thousand euros (prior year: 1,580 thousand
euros). Impairment losses were reversed in the sum of
3,136 thousand euros (prior year: 2,662 thousand euros) as
the reason for the impairment loss applied in prior years
no longer existed.
The consumption of inventories affected expenses in the fiscal
year in the sum of 272,495 thousand euros (prior year:
233,579 thousand euros), the table below shows the distribu-
tion:
in thousand euros 31/12/2018 31/12/2017
Cost of Sales 270,796 230,911
Research and development expenses 1,122 2,055
Selling expenses 296 356
Administrative expenses 280 257
Total 272,495 233,579
At the reporting dates there were no restrictions on the disposal
of inventories.
5.10 Current trade receivables
in thousand euros 31/12/2018 31/12/2017
Trade receivables from third parties 126,219 120,978
Receivables from due requested advance payments 4,527 0
Trade receivables from unconsolidated associates 263 94
Trade receivables from investment companies 190 86
Receivables from construction contracts 0 14,859
Total 131,198 136,017

174
JENOPTIK Annual Report 2018
Consolidated Financial Statements | Notes
The fair values of trade receivables correspond to their carrying
amounts as of the reporting date. With the first application
of IFRS 15, the receivables from construction contracts are
reclassified into contract assets and the receivables from due
requested advance payments reported as trade receivables.
Trade receivables are non-interest bearing and are generally due
within 30 to 90 days.
The following table shows the composition of the trade receiv-
ables:
in thousand euros 31/12/2018 31/12/2017
Gross amount of trade receivables from third parties 132,977 128,406
Trade receivables from due requested advance payments 4,527 0
Gross amount of trade receivables from unconsolidated associates 1,643 1,475
Gross amount of trade receivables from investment companies 259 155
Gross amount of trade receivables from construction contracts 0 14,859
Gross amount of trade receivables (total) 139,406 144,895
Cumulative impairments – 8,208 – 8,879
Carrying amount of trade receivables 131,198 136,017
Default risks were determined through customer credit ratings
via a scorecard. In addition to internal company data, this includes
credit assessment by external credit bureaus. Based on the rating
of customers’ credit, lines of credit are granted to ensure the
active management of business transactions. This means for
example, amongst other things, that certain payment methods
can be agreed with customers depending on their creditworthi-
ness. In addition, outstanding receivables against customers are
regularly monitored and measures are taken to mitigate overdue
receivables.
The default risk is taken into account through corresponding
impairments. The following table shows the changes in impair-
ments to outstanding trade receivables:
in thousand euros 2018 2017
Impairments at 1/1 8,879 7,084
Change in the group of consolidated entities 809 0
Additions 3,640 3,308
Consumption 1,852 88
Reversal / derecognition 3,301 1,363
Foreign currency exchange effects 32 – 62
Impairments at 31/12 8,208 8,879
The impairment requirement is analyzed at each closing date
on the basis of an impairment matrix to determine anticipated
loan losses. The impairment quotas are determined on the
basis of the overdue period in days for different customer seg-
ments combined into groups with similar default patterns.
The amount of the impairment to trade receivables from third
parties totaled 6,759 thousand euros (prior year: 7,428 thousand
euros). The remaining impairment requirement relates mainly to
receivables due from an unconsolidated entity in liquidation.
Overdue but unimpaired receivables were owed primarily by
public sector contractors, companies in the automobile industry
as well as their suppliers. As of 31/12/2018 there were no
collaterals for unimpaired receivables in the form of bank guar-
antees (prior year: 660 thousand euros).
The table below shows the default risk position for trade receiv-
ables due from third parties as determined by an impairment
matrix:

175
15 Management 35 Corporate Governance 133 Consolidated 207 Further69 Combined53 Non-financial Reporting Management Report Financial Statements Information
Consolidated Financial Statem
ents
133
206
134136137138140
Consolidated Statement of Comprehensive IncomeConsolidated Statement of Financial PositionConsolidated Statement of Cash FlowsStatement of Changes in EquityNotes
in thousand euros Expected credit loss rate Expected total gross carrying amount at default Expected credit loss
Not due 0.35 % 87,352 305
0.42 % (88,966) (371)
overdue < 30 days 0.35 % 23,011 81
1.22 % (16,497) (202)
overdue 30 – 60 days 6.25 % 8,982 562
3.52 % (5,314) (187)
overdue 61 – 120 days 13.57 % 4,106 557
10.82 % (4,682) (507)
overdue 121 – 240 days 27.86 % 3,221 897
22.51 % (6,076) (1,368)
overdue 241 – 360 days 40.75 % 1,419 578
34.27 % (1,861) (638)
overdue > 360 days 77.30 % 4,887 3,778
82.94 % (5,010) (4,156)
Total 5.08 % 132,977 6,759
5.78 % (128,406) (7,428)
In the fiscal year 2017 the specific individual impairments to
receivables of 1,944 thousand euros were higher than in the year
just past (prior year: 3,732 thousand euros). These mainly con-
cerned receivables with an overdue date of 360 days.
5.11 Contract assets
The balance sheet item was reported for the first time in the
2018 fiscal year based on the application of IFRS 15 and
includes claims by the Group against customers for receipt of
a consideration in exchange for goods or services that have
already been transferred. These are grouped as follows:
in thousand euros 31/12/2018
Contract assets 23,385
Realization within one year 23,205
Realization within more than one year 180
The long-term share related to already fulfilled obligations arising
from development services in the Defense & Civil Systems
segment which will be billed to the customer via deliveries still
be rendered in the future.
5.12 Other current financial assets
in thousand euros 31/12/2018 31/12/2017
Receivables from Mitarbeiter-treuhand e.V. 1,880 1,728
Derivatives 171 3,008
Receivables from lease agreements 0 340
Miscellaneous current financial assets 3,217 230
Total 5,268 5,307
As in the prior year, in 2018 there were no restrictions on
disposals of other current financial assets.
For details on receivables arising from lease contracts we refer
to the Notes, section 5.4 from page 171.
In the current fiscal year, other current financial assets included,
in particular, a receivable due from a credit institution arising
from the settlement of a foreign exchange forward transaction
to hedge a foreign currency loan in the intercompany area.

176
JENOPTIK Annual Report 2018
Consolidated Financial Statements | Notes
Default risks are taken into account through impairments. The
composition of the carrying amount of other current financial
assets is as follows:
in thousand euros 31/12/2018 31/12/2017
Gross amount of other current financial assets 6,557 6,596
Cumulative impairments – 1,289 – 1,289
Carrying amount of other current financial assets 5,268 5,307
The following table shows the changes in impairment losses on
other current financial assets:
in thousand euros 2018 2017
Impairments at 1/1 1,289 1,504
Additions 0 7
Consumption 0 40
Reversal / derecognition 0 183
Impairments at 31/12 1,289 1,289
5.13 Other current non-financial assets
in thousand euros 31/12/2018 31/12/2017
Accruals 4,254 3,266
Receivables from other taxes 2,317 1,640
Receivables from income taxes 2,593 340
Receivables from subsidies and grants 226 176
Miscellaneous current non-financial assets 523 644
Total 9,912 6,067
As in the prior year, there were no restrictions on disposals of
other current non-financial assets.
5.14 Current financial investments
in thousand euros 31/12/2018 31/12/2017
Fair value 59,476 64,577
The current financial investments primarily entailed cash deposits
made in the sum of 59,476 thousand euros.
For financial investments valued at amortized acquisition
costs, it is assumed that the fair values correspond to the carrying
amounts, taking into account the impairments losses. A risk
provision in the sum of 493 thousand euros was recognized for
the first time as an impairment to cover the debtor’s default
risk, applying IFRS 9.
For further details on the financial instruments we refer to the
Notes, section 8.2 from page 191.
5.15 Cash and cash equivalents
in thousand euros 31/12/2018 31/12/2017
Checks, cash on hand, bank bal-ances and demand deposits with a maturity of less than 3 months 89,255 132,310
For further information on the change of cash and cash equiva-
lents we refer to the section entitled “Details on the cash flow
statement” from page 187. In addition, in application of IFRS 9,
an impairment of 500 thousand euros was recorded on the bank
deposits as a provision for the default risk in fiscal year 2018.
5.16 Equity
The development of the equity of Jenoptik is shown in the
consolidated statement of changes in equity.
Share capitalShare capital amounts to 148,819 thousand euros and is
divided into 57,238,115 registered no-par value shares.
177
15 Management 35 Corporate Governance 133 Consolidated 207 Further69 Combined53 Non-financial Reporting Management Report Financial Statements Information
Consolidated Financial Statem
ents
133
206
134136137138140
Consolidated Statement of Comprehensive IncomeConsolidated Statement of Financial PositionConsolidated Statement of Cash FlowsStatement of Changes in EquityNotes
At the beginning of July 2011 Thüringer Industriebeteiligungs
GmbH & Co. KG, Erfurt, Thüringer Industriebeteiligungsgeschäfts-
führungs GmbH, Erfurt, bm-t beteiligungsmanagement thüringen
GmbH, Erfurt, Stiftung für Unternehmensbeteiligungen und
-förderungen in der gewerblichen Wirtschaft Thüringens (StUWT),
Erfurt, Thüringer Aufbaubank Erfurt and the Free State of
Thüringia, Erfurt, disclosed that they had exceeded the thresh-
olds of 3, 5, and 10 percent of the voting rights in JENOPTIK AG
on June 30, 2011 and that they had held 11.00 percent of the
voting rights (6,296,193 voting rights) on that day. Thüringer
Industriebeteiligungs GmbH & Co. KG acquired the voting rights
from ECE Industriebeteiligungen GmbH.
On August 21, 2014, Deutsche Asset & Wealth Management
Investment GmbH, Frankfurt, Germany, notified us that it
had exceeded the threshold of 5 percent of the voting rights
in JENOPTIK AG on August 19, 2014. Accordingly, Deutsche
Asset & Wealth Management Investment GmbH directly held
5.20 percent of the voting rights (2,978,179 voting rights) in
JENOPTIK AG on that day. Of which 5.06 percent of the voting
rights (2,898,579 voting rights) were held directly by Deutsche
Asset & Wealth Management Investment GmbH and 0.14 percent
of the voting rights (79,600 voting rights) were attributable
to it on this date in accordance with § 22 (1) (1) No. 6 of the
WpHG (old version).
Capital Group Companies, Inc., Los Angeles, California, USA,
notified us on December 12, 2018 that it had exceeded the
threshold of 5 percent of the voting rights in JENOPTIK AG,
Jena, Germany, on December 10, 2018. Accordingly, on that
day Capital Group Companies, Inc. held 5.01 percent of the
voting rights (2,867,000 voting rights) which were attributable
to it indirectly in accordance with § 34 of the WpHG (new
version). More than 3 percent of the voting rights are held by
the SMALLCAP World Fund, Inc.
SMALLCAP World Fund, Inc., Baltimore, Maryland, USA, notified
us on February 4, 2019 that it had exceeded the threshold of
5 percent of the voting rights in JENOPTIK AG, Jena, Germany,
on January 31, 2019. Accordingly, on that day SMALLCAP World
Fund, Inc. held 5.04 percent of the voting rights (2,885,141 vot-
ing rights) which were attributable to it directly in accordance
with § 33 of the WpHG (new version).
Templeton Investment Counsel, LLC, Wilmington, Delaware,
USA, notified us on June 21, 2018 that it had exceeded the
threshold of 3 percent of the voting rights in JENOPTIK AG,
Jena, Germany, on June 20, 2018. Accordingly, on that day
Templeton Investment Counsel, LLC held 2.98 percent of the
voting rights (1,707,585 voting rights) which were attributable
to it indirectly in accordance with § 34 of the WpHG (new version).
BlackRock, Inc., Wilmington, USA, notified us on June 13, 2018
that it had exceeded the threshold of 3 percent of the voting
rights in JENOPTIK AG, Jena, Germany, on June 8, 2018. Accord-
ingly, BlackRock, Inc., held 3.17 percent of the voting rights
(1,812,914 voting rights) on that day. 3.02 percent of the voting
rights (1,721,197 voting rights) were attributable to BlackRock,
Inc. indirectly in accordance with § 34 of the WpHG. 0.02 percent
of the voting rights (2,052 voting rights) were attributable to
instruments in accordance with § 38 (1) (1) of the WpHG (new
version) and 0.15 percent of the voting rights (83,665 voting
rights) to instruments in accordance with § 38 (1) (2) of the
WpHG (new version).
The Ministry of Finance, Oslo, Norway, notified us on Novem-
ber 4, 2016 on behalf of the Norwegian state that it had exceeded
the threshold of 3 percent of the voting rights in JENOPTIK AG
on November 2, 2016. Accordingly, on that day the Ministry of
Finance held 3.06 percent of the voting rights (1,752,411 voting
rights) which were attributable to it in accordance with § 22
of the WpHG (old version). The voting rights are held directly by
the Norges Bank, Oslo, Norway.
The Oppenheimer International Small-Mid Company Fund,
Wilmington, Delaware, USA, notified us on January 30, 2018
that it had exceeded the threshold of 3 percent of the voting
rights in JENOPTIK AG on January 25, 2018. Accordingly, the
Oppenheimer International Small-Mid Company Fund held 3.16
percent of the voting rights (1,808,844 voting rights) on that
day. Oppenheimer Funds, Inc., Denver, Colorado, USA has an
indirect investment via the Oppenheimer International Small-
Mid Company Fund.
The voting right notifications of recent years and the notifica-
tions of shareholders that had closed out their investments
have been published on our Internet site www.jenoptik.com
under Investors/Share/Voting rights announcements.
Authorized capitalAn “Authorized Capital 2015” was created with the resolution
passed by the Annual General Meeting on June 3, 2015 as
follows: The Executive Board is authorized up to June 2, 2020,
with the consent of the Supervisory Board, to increase the
nominal capital of the company by up to 44,000 thousand
euros through one or multiple issues of new, no-par value
registered shares against cash and / or contribution in kind

178
JENOPTIK Annual Report 2018
Consolidated Financial Statements | Notes
(“Authorized Capital 2015”). The new shares can be taken
up by one or more banks with the obligation to offer these to
shareholders (indirect subscription rights). With the consent of
the Supervisory Board, the Executive Board is authorized to pre-
clude subscription rights of shareholders in certain cases: a) for
fractional amounts; b) capital increases against contributions
in-kind, in particular also within the framework of corporate
mergers or the acquisition of companies, parts of companies or
investments in companies (including increasing existing invest-
ments) or other contributable assets in conjunction with such
an intended acquisition, as well as claims against the entity; (c)
in the event of capital increases against cash contributions, to
the extent that the portion of the nominal capital attributable to
the new shares, taking into account resolutions at the Annual
General Meeting and/or the utilization of other authorizations
to exclude the subscription right in direct or corresponding
application of § 186 (3) (4) of the Stock Corporation Act (AktG)
since the date on which such authorization becomes effective,
neither exceeds a total of ten percent of the nominal capital as
of the date of registration for such authorized capital, nor
exceeds a total of ten percent of the nominal capital in existence
as of the date of issuance of the new shares and the issue
price of new shares is not significantly below the stock exchange
price; d) issue of new shares to employees of the entity and
to associates in which the entity holds a majority interest.
All aforementioned authorizations to exclude subscription
rights are limited to a total of 20 percent of the nominal capital
available at the time this authorization became effective – or,
if this value is lower, to 20 percent of the nominal capital at
the time this authorization is exercised. This limit of 20 percent
includes shares that (i) are sold for the purpose of servicing
option and/or convertible bonds that were or could still be issued
during the period of validity of the authorized capital to the
exclusion of subscription rights or (ii) are sold by the company
as treasury shares during the period of validity of authorized
capital to the exclusion of subscription rights.
Decisions on the details of the issuance of new shares, in
particular their conditions and the content of rights of the new
shares, are taken by the Executive Board, with the consent of
the Supervisory Board.
Conditional CapitalThe shareholder resolution passed at the Annual General Meeting
held on June 7, 2017, to contingently raise the share capital of
the entity by up to 28,600 thousand euros through the issue of
up to 11,000,000 new no-par value shares (“Conditional Capi-
tal 2017”). The conditional capital increase will only be exe-
cuted to the extent that
• the creditors / owners of option and / or conversion rights
arising from option and / or convertible bonds issued up
to June 6, 2022 by the company or a domestic or foreign
incorporated company in which the company has a direct
or indirect majority stake, pursuant to the authorization res-
olution of the Annual General Meeting dated June 7, 2017,
exercise their option or conversion rights and/or
• the creditors of the issued convertible bonds obliged to
exercise their conversion rights which were issued by the
company or a domestic or foreign incorporated company
in which the company has a direct or indirect majority stake,
on the basis of the resolution of the Annual General
Meeting on June 7, 2017, fulfill their conversion obligation
by June 6, 2022 and/or tenders for shares are issued and
neither own shares are used nor payment is made in cash.
The new shares participate in profits from the start of the
fiscal year for which, on the date of their issue, no resolu-
tion has yet been passed by the Annual General Meeting in
respect to the appropriation of profits. The Executive Board is
authorized, with the consent of the Supervisory Board, to
specify additional details on the issuance of the conditional
capital increase.
If the authorization to issue option and/or convertible bonds
to the exclusion of subscription rights is exercised, this authori-
zation is limited in the sense that the pro rata amount of nomi-
nal capital corresponding to those shares that must be issued
after exercising conversion and / or option rights / obligations
may not account for more than 20 percent of the nominal cap-
ital existing at the time this authorization takes effect or – if the
figure is lower – at the time use is made of the authorization.
This 20 percent limit also applies to the sale of treasury shares
that are excluded from subscription rights during the period
of this authorization, and to shares issued during the period of
this authorization under authorized capital and for which sub-
scription rights are excluded.
ReservesCapital reserve. The capital reserve contains the adjustments
recognized within the framework of the first-time adoption of IFRS as well as the differences resulting from the capital con-
solidation being offset against reserves up to December 31, 2002.

179
15 Management 35 Corporate Governance 133 Consolidated 207 Further69 Combined53 Non-financial Reporting Management Report Financial Statements Information
Consolidated Financial Statem
ents
133
206
134136137138140
Consolidated Statement of Comprehensive IncomeConsolidated Statement of Financial PositionConsolidated Statement of Cash FlowsStatement of Changes in EquityNotes
Other reserves. A component of other reserves is retained
earnings realized in the past by companies included in the con-
solidated financial statements less dividends paid.
Other reserves also contain value adjustments to be accounted
for outside of profit or loss for
• equity instruments designated as at fair value through other
comprehensive income,
• cash flow hedges,
• accumulated foreign currency exchange differences and
• actuarial gains / losses arising from the valuation of pensions
and similar obligations.
In the 2018 fiscal year value adjustments to equity instruments
measured through other comprehensive income amounted to
minus 22 thousand euros (prior year: minus 270 thousand
euros). The resultant deferred taxes totaled 6 thousand euros
(prior year: minus 32 thousand euros). The effective portions
of the change in the value of the derivatives to be recognized
outside of profit or loss within the framework of the cash flow
hedges were recognized at minus 4,760 thousand euros (prior
year: 4,456 thousand euros) less deferred taxes in the sum of
1,413 thousand euros (prior year: minus 1,325 thousand euros).
The accumulated foreign currency exchange differences
encompass the effects arising from foreign currency conversions
of the separate financial statements of subsidiaries whose
operating currency deviates from that of the Group, as well as
effects arising from foreign currency conversions of assets
and liabilities held in foreign currencies in the total sum of 692
thousand euros (prior year: minus 8,016 thousand euros).
The applicable deferred taxes changed in the sum of minus
258 thousand euros (prior year: 483 thousand euros).
Actuarial gains arising from the valuation of pensions are recog-
nized in the sum of 599 thousand euros (prior year: 1,156 thou-
sand euros). The resultant deferred taxes totaled minus
88 thousand euros (prior year minus 298 thousand euros).
In the 2018 fiscal year the change in deferred taxes recognized
outside of profit or loss led to an increase in the reserves in the
total sum of 1,073 thousand euros (prior year: reduced by
1,173 thousand euros). The amount of deferred tax assets in
equity totaled 5,861 thousand euros (prior year: 4,788 thou-
sand euros).
Treasury sharesOn the basis of a resolution passed by the Annual General
Meeting on June 5, 2018, the Executive Board is authorized up
to June 4, 2023 to purchase treasury no-par value shares not
exceeding a proportion of ten percent of the nominal capital
existing at the time the resolution is adopted or – if this amount
is lower – of the nominal capital existing at the time use is made
of this authorization for purposes other than trading in treasury
shares. The purchased treasury shares together with treasury
shares that the entity had already purchased and still holds
(including the attributable shares in accordance with §§ 71a et
seq. AktG) may not exceed 10 percent of the share capital of
the entity. The authorization may be exercised in whole or in
part, on a one-off or repeat basis and for one or more autho-
rized purposes. The purchase and sale of treasury shares may
be exercised by the entity or, for specific authorized purposes,
also by dependent companies, by com panies in which the
entity holds a majority interest, or by third parties for its or their
account. At the decision of the Executive Board, acquisition is
by purchase, subject to compliance with the principle of equal
treatment (§ 53a of the AktG), on the stock exchange or by
means of a public offering or a public invitation to the share-
holders to submit an offer for sale. Further details regarding the
buyback of treasury shares are described in the invitation under
agenda item 9 to the Annual General Meeting 2018, accessible
to the general public, on our website at www.jenoptik.de
under the heading Annual General Meeting.
5.17 Non-controlling interests
This balance sheet item contains reconciliation items for
shares of non-controlling shareholders in the capital to be con-
solidated, arising from the capital consolidation, as well as
the profits and losses allocated to them.
As a result of the acquisition of shares of non-controlling share-
holders, the amounts attributable to the acquired shares were
reclassified as retained earnings in the fiscal year 2018.
5.18 Provisions for pensions and similar obligations
Provisions for pension obligations are set aside on the basis
of pension plans for retirement, disability and survivor benefit
commitments and exist in Germany and Switzerland. The bene-
fits provided by the Group vary according to the legal, tax, and
economic circumstances of the respective country and, as a
rule, depend on the duration of employment and on the remu-
neration of the employee on commencement of retirement.
The existing pension plans in Germany are closed, with the excep-
tion of the reinsured group provident fund. Within the Group,
the occupational pension provision is provided both on the basis
of defined contribution as well as defined benefit plans. In the
case of defined contribution plans, the company pays contribu-
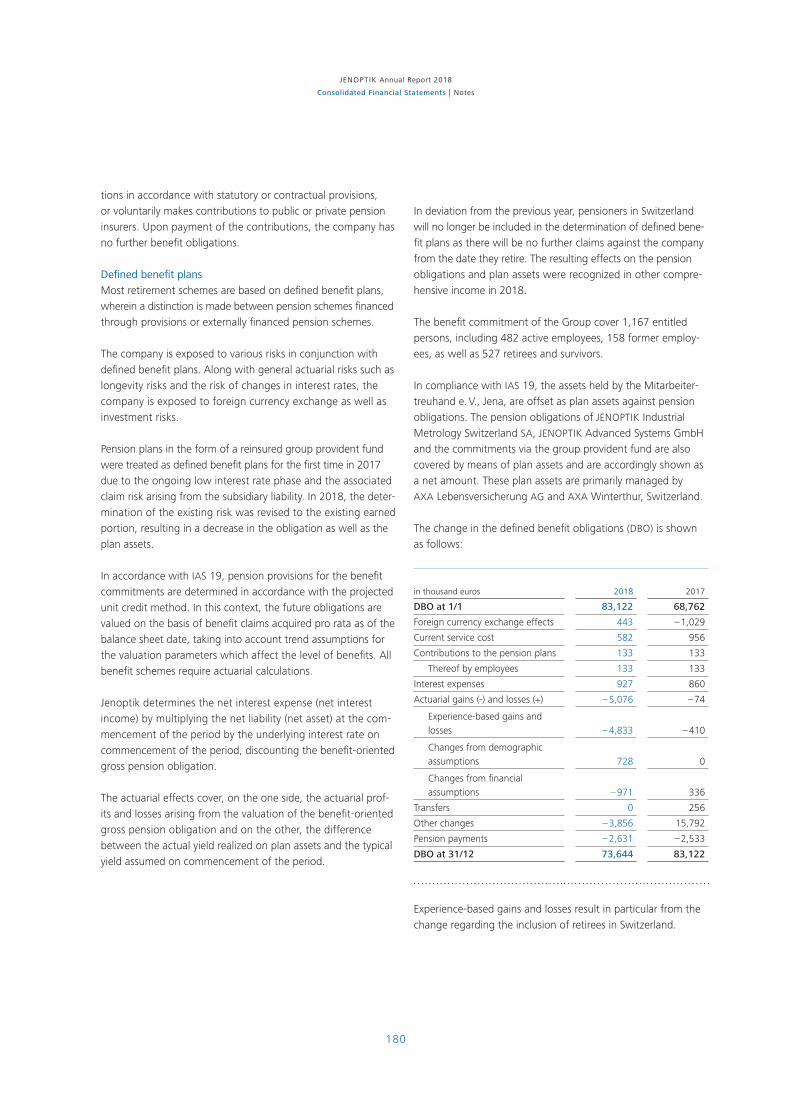
180
JENOPTIK Annual Report 2018
Consolidated Financial Statements | Notes
tions in accordance with statutory or contractual provisions,
or voluntarily makes contributions to public or private pension
insurers. Upon payment of the contributions, the company has
no further benefit obligations.
Defined benefit plansMost retirement schemes are based on defined benefit plans,
wherein a distinction is made between pension schemes fi nanced
through provisions or externally financed pension schemes.
The company is exposed to various risks in conjunction with
defined benefit plans. Along with general actuarial risks such as
longevity risks and the risk of changes in interest rates, the
company is exposed to foreign currency exchange as well as
investment risks.
Pension plans in the form of a reinsured group provident fund
were treated as defined benefit plans for the first time in 2017
due to the ongoing low interest rate phase and the associated
claim risk arising from the subsidiary liability. In 2018, the deter-
mination of the existing risk was revised to the existing earned
portion, resulting in a decrease in the obligation as well as the
plan assets.
In accordance with IAS 19, pension provisions for the benefit
commitments are determined in accordance with the projected
unit credit method. In this context, the future obligations are
valued on the basis of benefit claims acquired pro rata as of the
balance sheet date, taking into account trend assumptions for
the valuation parameters which affect the level of benefits. All
benefit schemes require actuarial calculations.
Jenoptik determines the net interest expense (net interest
income) by multiplying the net liability (net asset) at the com-
mencement of the period by the underlying interest rate on
commencement of the period, discounting the benefit-oriented
gross pension obligation.
The actuarial effects cover, on the one side, the actuarial prof-
its and losses arising from the valuation of the benefit-oriented
gross pension obligation and on the other, the difference
between the actual yield realized on plan assets and the typical
yield assumed on commencement of the period.
In deviation from the previous year, pensioners in Switzerland
will no longer be included in the determination of defined bene-
fit plans as there will be no further claims against the company
from the date they retire. The resulting effects on the pension
obligations and plan assets were recognized in other compre-
hensive income in 2018.
The benefit commitment of the Group cover 1,167 entitled
persons, including 482 active employees, 158 former employ-
ees, as well as 527 retirees and survivors.
In compliance with IAS 19, the assets held by the Mitarbeiter-
treuhand e. V., Jena, are offset as plan assets against pension
obligations. The pension obligations of JENOPTIK Industrial
Metrology Switzerland SA, JENOPTIK Advanced Systems GmbH
and the commitments via the group provident fund are also
covered by means of plan assets and are accordingly shown as
a net amount. These plan assets are primarily managed by AXA Lebensversicherung AG and AXA Winterthur, Switzerland.
The change in the defined benefit obligations (DBO) is shown
as follows:
in thousand euros 2018 2017
DBO at 1/1 83,122 68,762
Foreign currency exchange effects 443 – 1,029
Current service cost 582 956
Contributions to the pension plans 133 133
Thereof by employees 133 133
Interest expenses 927 860
Actuarial gains (-) and losses (+) – 5,076 – 74
Experience-based gains and losses – 4,833 – 410
Changes from demographic assumptions 728 0
Changes from financial assumptions – 971 336
Transfers 0 256
Other changes – 3,856 15,792
Pension payments – 2,631 – 2,533
DBO at 31/12 73,644 83,122
Experience-based gains and losses result in particular from the
change regarding the inclusion of retirees in Switzerland.

181
15 Management 35 Corporate Governance 133 Consolidated 207 Further69 Combined53 Non-financial Reporting Management Report Financial Statements Information
Consolidated Financial Statem
ents
133
206
134136137138140
Consolidated Statement of Comprehensive IncomeConsolidated Statement of Financial PositionConsolidated Statement of Cash FlowsStatement of Changes in EquityNotes
Changes based on demographic assumptions are derived from
the initial application of modified mortality tables for the existing
pension obligations in Germany (Heubeck 2018 G).
The other changes relate to the reduction in the obligations
arising from the reinsured provident fund; this reduction is also
offset by a reduction in plan assets.
The effects of the expense recognized in the statement of
income are summarized as follows:
in thousand euros 2018 2017
Current service costs 582 956
Net interest expenses 538 502
Total expenses 1,120 1,458
The amounts shown above are generally included in the per-
sonnel expenses of the functional areas. The interest charged
on the obligation as well as the interest received on plan assets
is recorded in the interest result.
Changes in plan assets are shown as follows:
in thousand euros 2018 2017
Plan assets at 1/1 46,055 31,134
Foreign currency exchange effects 296 – 700
Interest income from plan assets 390 358
Return on plan assets less interest income – 4,572 1,354
Contributions 267 266
Employers 133 133
Employees 133 133
Transfers 0 256
Administrative expenses – 16 0
Other changes – 3,826 15,517
Pension payments – 2,290 – 2,130
Plan assets at 31/12 36,304 46,055
The result of the plan assets includes the effects arising from
the exclusion of the pensioners in Switzerland. The adjustment
to the risk assessment arising from the reinsured provident
fund is shown as other change.
The net obligation as of the balance sheet date is as follows:
in thousand euros 2018 2017
Present value of the obligation covered by plan assets 68,458 77,600
Plan assets – 36,304 – 46,055
Net liability of the obligation covered by plan assets 32,154 31,545
Net liability of the obligation not covered by plan assets 5,186 5,521
Total 37,339 37,066
The portfolio structure of the plan assets is shown as follows:
in thousand euros 2018 2017
Loans rendered (loans and receivables) 2,930 4,407
Insurance contracts 16,981 24,536
Stocks and other securities 7,475 5,472
Investments 6,226 6,426
Cash equivalents 4,572 6,943
Other assets and liabilities – 1,880 – 1,728
Total 36,304 46,055
There is an active market for the stocks and other securities
held in plan assets.
Insurance contracts in the sum of 11,962 thousand euros relate
to pension insurance policies with AXA Lebensversicherung AG.
The insurance company’s investments were mainly in equities
and investment assets, debenture loans and fixed-interest bearing
securities. There are also existing insurance con tracts in the
sum of 4,267 thousand euros as a result of the pension plan of AXA Fondation LPP (Switzerland).

182
JENOPTIK Annual Report 2018
Consolidated Financial Statements | Notes
Other liabilities relate to repatriation obligations due to pension
payments made in 2018 from the plan assets to JENOPTIK AG.
The actuarial assumptions are shown in the table below. Where
applicable, the above-mentioned assumptions allow for antici-
pated inflation.
in percent 2018 2017
Discount rate
Germany 1.71 1.68
Switzerland 0.75 0.66
Expected salary increases
Germany 2.75 2.67
Switzerland 1.75 0.35
Expected pension increases
Germany 1.67 1.59
Switzerland 0 1.00
The discounting factor was applied accordingly to the yield
from the plan assets in the fiscal year 2018 for calculating the
DBO for the prior year at 390 thousand euros (prior year:
358 thousand euros). The actual yield from the plan assets was
minus 4,182 thousand euros (prior year: 1,712 thousand euros)
and includes in particular the effects arising from the change in
the presentation of the pensioners in Switzerland.
A change in the key actuarial assumptions as of the balance
sheet would influence the DBO as follows:
Change in the DBO
in thousand euros Increase Reduction
Discount rate –change by 0.5 percentage points
– 8,552 9,269
(– 6,763) (6,026)
Expected salary increases –change by 1.0 percentage points
226 – 229
(162) (– 69)
Expected pension increases –change by 1.0 percentage points
8,065 – 5,818
(8,642) (– 7,217)
The figures in brackets relate to the prior year.
The sensitivity analysis shows the change in a DBO in the event
of a change in an assumption. Since the changes do not have a
straight-line effect on the calculation of DBO due to actuarial
effects, the cumulative change in the DBO resulting from
changes in a number of assumptions cannot be directly deter-
mined.
Actuarial gains or losses are the result of changes in pension
beneficiaries and deviations from actual trends (e. g. increases
in income or pensions) vis-á-vis calculation assumptions. In
accordance with the regulations stated in IAS 19, this amount
is offset against other comprehensive income in equity.
As of December 31, 2018, the weighted average remaining
service period was 8 years and the weighted average remaining
maturity of the obligation was 16 years.
The financing of the pension plans of JENOPTIK Advanced
Systems GmbH, Wedel and JENOPTIK SSC GmbH, Jena, is per-
formed by using a CTA model. The pension plan of JENOPTIK
Industrial Metrology Switzerland SA provides for risk participation
by the beneficiaries on transition to retirement. In this context,
the pension plan is financed by contributions from both the
employer and the employees.
The anticipated pension payments arising from the pension
plans as of December 31, 2018 for the following fiscal year
amount to 2,514 thousand euros (prior year: 2,579 thousand
euros) and for the subsequent four fiscal years to a total of
12,191 thousand euros (prior year: 12,818 thousand euros).
Defined contribution plansWithin the framework of the defined contribution plans,
expenses for 2018 totaled 19,512 thousand euros (prior year:
18,075 thousand euros), this figure including contributions to
statutory pension insurance providers in the sum of 14,986 thou-
sand euros (prior year: 13,893 thousand euros).
5.19 Tax provisions
in thousand euros 31/12/2018 31/12/2017
Provisions for income taxes 8,764 8,870Provisions for other taxes 236 67
Total 9,000 8,938
Details on income tax expenses are provided in Note 4.11 from
page 163.

183
15 Management 35 Corporate Governance 133 Consolidated 207 Further69 Combined53 Non-financial Reporting Management Report Financial Statements Information
Consolidated Financial Statem
ents
133
206
134136137138140
Consolidated Statement of Comprehensive IncomeConsolidated Statement of Financial PositionConsolidated Statement of Cash FlowsStatement of Changes in EquityNotes
5.20 Other provisions
The development of other provisions is as follows:
in thousand eurosBalance at 1/1/2018
Foreign currency
exchange effects
Changes in the group of
entities consolidated Additions
Compound interest Utilization Reversals
Balance at 31/12/2018
Personnel 28,221 – 20 1,192 25,178 37 – 19,245 – 2,363 33,001
Guarantee and warranty obligations 20,922 1 81 15,377 35 – 5,836 – 1,246 29,334
Trademark and license fees 3,261 0 0 0 0 0 – 2,204 1,057
Onerous contracts 1,599 138 71 309 0 – 1,010 – 103 1,004
Price adjustments 1,423 0 0 375 39 0 – 439 1,398
Restructuring 137 0 0 0 0 0 – 137 0
Others 11,595 – 1,686 24 3,008 113 – 2,497 – 1,365 9,192
Total 67,159 – 1,567 1,368 44,247 223 – 28,588 – 7,858 74,985
Key items in the personnel provisions relate to performance
bonuses, profit sharing, and similar commitments, as well as to
the share-based payments for the Executive Board and some
senior management personnel. Personnel provisions also include
anniversary of service payments in the sum of 2,826 thousand
euros (prior year: 2,627 thousand euros) and partial retirement
obligations in the sum of 2,372 thousand euros (prior year:
1,286 thousand euros). Actuarial expert opinions were obtained
for the partial retirement obligations with the assumption of
income increasing by 2.8 percent (prior year: 2.7 percent). The
amount of the liability for top-up payments already earned
as of December 31, 2018 was 828 thousand euros (prior year:
609 thousand euros).
The provision for guarantee and warranty obligations include
expenses for individual guaranty cases as well as for general guar-
antees. The calculation of the provision for general guarantee
risks was based on empirical values which were determined as
a guarantee cost ratio of revenue on a company or product
group-specific basis and applied to revenues which are liable to
guarantees. The amounts that were reversed in the 2018
fiscal year chiefly comprise guarantee and warranty provisions for
specific individual cases for which the underlying obligations
no longer existed.
The provision for trademark and license fees relate to risks in
connection with potential patent infringement as well as license
cost risks. The reversal resulted from the latest findings and
the fact that on the basis of time passed the risk of a patent
infringement action being filed was only considered to be low.
The provision for pending losses mainly included the liability
overhang for individual customer projects. The utilization resulted
mainly from a customer-specific project of the Mobility segment.
Provisions for price adjustments exist for customer contracts
that were subject to the risk of subsequent changes in selling
prices. Additions and reversals were made to revenue.
Other provisions included, amongst others, provisions for
claims for damages. With the introduction of IFRS 15, the pro-
visions for possible contractual penalties arising from customer
orders were shown as contractual liabilities with effect from the
2018 fiscal year. Other provisions also included numerous iden-
tifiable specific risks as well as contingent liabilities, accounted
for in the amount of the best possible estimate of the settle-
ment sum. Additions in the 2018 fiscal year included, among
other things, the Supervisory Board remuneration as well as
expenses arising from decommissioning obligations.
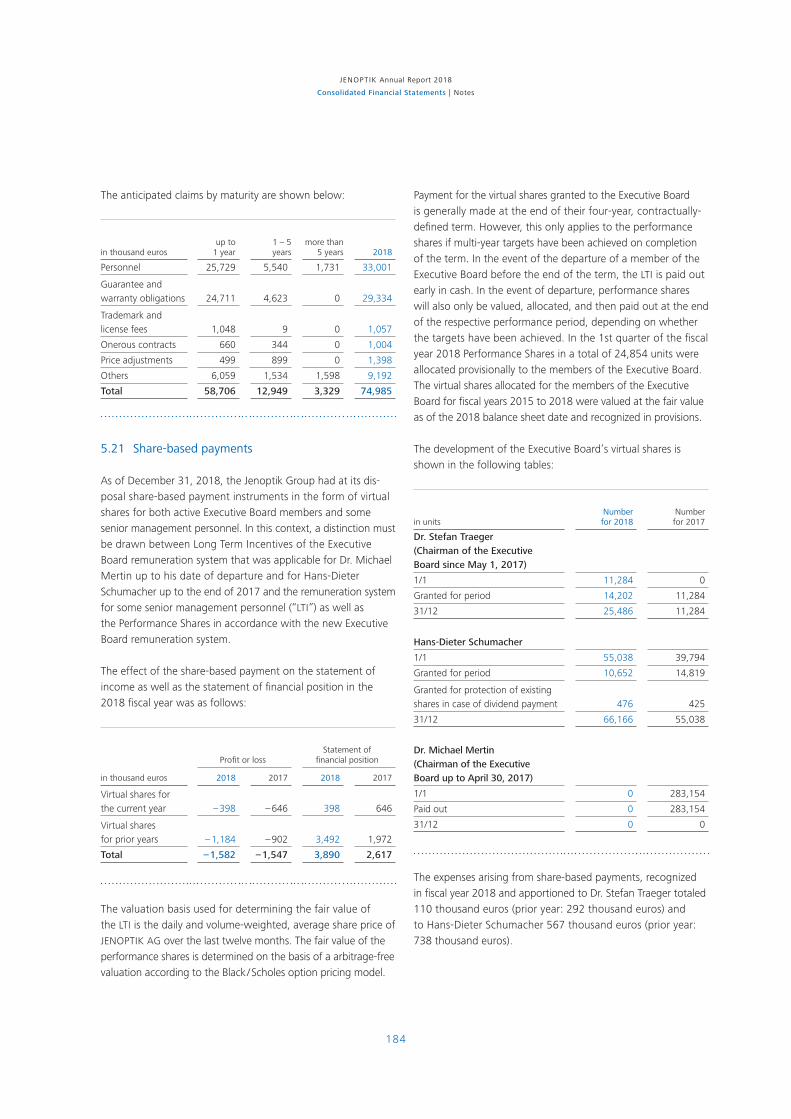
184
JENOPTIK Annual Report 2018
Consolidated Financial Statements | Notes
The anticipated claims by maturity are shown below:
in thousand eurosup to
1 year1 – 5 years
more than 5 years 2018
Personnel 25,729 5,540 1,731 33,001
Guarantee and warranty obligations 24,711 4,623 0 29,334
Trademark and license fees 1,048 9 0 1,057
Onerous contracts 660 344 0 1,004
Price adjustments 499 899 0 1,398
Others 6,059 1,534 1,598 9,192
Total 58,706 12,949 3,329 74,985
5.21 Share-based payments
As of December 31, 2018, the Jenoptik Group had at its dis-
posal share-based payment instruments in the form of virtual
shares for both active Executive Board members and some
senior management personnel. In this context, a distinction must
be drawn between Long Term Incentives of the Executive
Board remuneration system that was applicable for Dr. Michael
Mertin up to his date of departure and for Hans-Dieter
Schumacher up to the end of 2017 and the remuneration system
for some senior management personnel (“LTI”) as well as
the Performance Shares in accordance with the new Executive
Board remuneration system.
The effect of the share-based payment on the statement of
income as well as the statement of financial position in the
2018 fiscal year was as follows:
Profit or lossStatement of
financial position
in thousand euros 2018 2017 2018 2017
Virtual shares for the current year – 398 – 646 398 646
Virtual shares for prior years – 1,184 – 902 3,492 1,972
Total – 1,582 – 1,547 3,890 2,617
The valuation basis used for determining the fair value of
the LTI is the daily and volume-weighted, average share price of
JENOPTIK AG over the last twelve months. The fair value of the
performance shares is determined on the basis of a arbitrage- free
valuation according to the Black / Scholes option pricing model.
Payment for the virtual shares granted to the Executive Board
is generally made at the end of their four-year, contractually-
defined term. However, this only applies to the performance
shares if multi-year targets have been achieved on completion
of the term. In the event of the departure of a member of the
Executive Board before the end of the term, the LTI is paid out
early in cash. In the event of departure, performance shares
will also only be valued, allocated, and then paid out at the end
of the respective performance period, depending on whether
the targets have been achieved. In the 1st quarter of the fiscal
year 2018 Performance Shares in a total of 24,854 units were
allocated provisionally to the members of the Executive Board.
The virtual shares allocated for the members of the Executive
Board for fiscal years 2015 to 2018 were valued at the fair value
as of the 2018 balance sheet date and recognized in provisions.
The development of the Executive Board’s virtual shares is
shown in the following tables:
in unitsNumber for 2018
Number for 2017
Dr. Stefan Traeger (Chairman of the Executive Board since May 1, 2017)
1/1 11,284 0
Granted for period 14,202 11,284
31/12 25,486 11,284
Hans-Dieter Schumacher
1/1 55,038 39,794
Granted for period 10,652 14,819
Granted for protection of existing shares in case of dividend payment 476 425
31/12 66,166 55,038
Dr. Michael Mertin (Chairman of the Executive Board up to April 30, 2017)
1/1 0 283,154
Paid out 0 283,154
31/12 0 0
The expenses arising from share-based payments, recognized
in fiscal year 2018 and apportioned to Dr. Stefan Traeger totaled
110 thousand euros (prior year: 292 thousand euros) and
to Hans-Dieter Schumacher 567 thousand euros (prior year:
738 thousand euros).

185
15 Management 35 Corporate Governance 133 Consolidated 207 Further69 Combined53 Non-financial Reporting Management Report Financial Statements Information
Consolidated Financial Statem
ents
133
206
134136137138140
Consolidated Statement of Comprehensive IncomeConsolidated Statement of Financial PositionConsolidated Statement of Cash FlowsStatement of Changes in EquityNotes
For all further disclosures, we refer to the Remuneration
Re port in the section Corporate Governance which forms part
of the Combined Management Report.
Virtual shares are also granted to some members of the
top management. The number of virtual shares is usually deter-
mined on the basis of target achievement as well as on the
volume-weighted average closing price of the Jenoptik share in
the 4th quarter of the calendar year before the last. Payment is
made at the end of the fourth subsequent year after allocation,
based on the volume-weighted average closing price of the
Jenoptik share in the full fourth subsequent year. In the event of
an exit before the end of the term, the virtual shares may be
forfeited, depending on the reasons for the departure.
The development of these virtual shares is shown in the follow-
ing table:
in unitsNumber for 2018
Number for 2017
Members of the Executive Management Committee
1/1 83,073 109,726
Granted for period 12,073 15,967
Granted for adjusted achievement of prior year's goals – 1,072 – 644
Forfeited rights 0 – 7,953
Paid out – 18,240 – 34,023
31/12 75,834 83,073
5.22 Financial debt
The maturity periods for the financial debt are shown in the
table below:
in thousand euros Up to 1 year 1 to 5 years Total
Liabilities to banks9,294
(19,157)108,227
(107,883)117,521
(127,040)
Liabilities from finance leases
829 (180)
3,178 (690)
4,007 (871)
Total 10,123 111,405 121,528
(19,337) (108,573) (127,910)
The figures in brackets relate to the prior year.
The liabilities to banks up to a term of one year mainly com-
prise the utilization of the revolving credit lines of the Chinese
subsidiary in the sum of 5,718 thousand euros as well as the
repayments, due in 2019, of the loan for financing the invest-
ments at the Michigan, USA, site in the sum of 1,747 thousand
euros. The current liability to banks reported in the previous year
also still includes the tranche of the debenture loan due in 2018.
The liabilities to banks with a term of one to five years
include, in particular, further tranches of the debenture loans in
the nominal amount of 103,000 thousand euros, as well as
the non-current financial debt of JENOPTIK Automotive North
America LLC.
As at the balance sheet date, the syndicated loan was utilized
for guarantees in the sum of 17,023 thousand euros. Taking
into account the other lines of financing not fully utilized as of
the balance sheet date 220,179 thousand euros of guaranteed,
existing lines of credit were unused.
The liabilities arising from financing leases include, in particular,
the financing of technical equipment and machinery.
5.23 Other non-current financial liabilities
in thousand euros 31/12/2018 31/12/2017
Liabilities from acquiring associates 1,234 417
Derivatives 1,360 3
Non-current trade payables 69 0
Total 2,664 420
Liabilities arising from the acquisition of associated companies
include the long-term portion of the conditional purchase
price payment agreed as part of the acquisition of OTTO Vision
Technology GmbH and OVITEC GmbH. The liability arising from
the acquisition of Five Lakes Automation LLC was reclassified
into the short-term liabilities in the current fiscal year.
Further disclosures on derivatives are provided in Note 8.2 from
page 191.

186
JENOPTIK Annual Report 2018
Consolidated Financial Statements | Notes
5.24 Current trade payables
This item includes:
in thousand euros 31/12/2018 31/12/2017
Trade payables towards third parties 60,074 61,523
Trade payables towards unconsolidated associates and joint operations 16 116
Trade payables towards investment companies 11 18
Total 60,102 61,657
5.25 Other current financial liabilities
This item includes:
in thousand euros 31/12/2018 31/12/2017
Other liabilities towards unconsolidated associates and joint operations 2,127 2,854
Derivatives 1,857 676
Liabilities from acquiring associates 1,140 2,711
Interest payables 679 785
Miscellaneous current financial liabilities 1,779 1,628
Total 7,582 8,654
Liabilities to unconsolidated associates and joint operations pri-
marily include liabilities to a joint operation in the sum of the
non-consolidated portion of 2,124 thousand euros (prior year:
2,845 thousand euros). Standard market interest rates were
agreed for liabilities.
In 2018, liabilities arising from the acquisition of associates
related to the current portion of the conditional purchase price
payment as well as the liabilities arising from the subsequent
adjustment in the purchase price for the acquisition of the OTTO
Group in the sum of 684 thousand euros. In addition, the
acquisition of Five Lakes Automation LLC gave rise to an earn-out
liability on the sum of 437 thousand euros (prior year:
2,085 thousand euros). In 2017, the acquisition of the Vysionics
Group also gave rise to a liability from an agreed put option
for the purchase of the remaining shares.
The item derivative financial instruments is explained in greater
detail under Note 8.2 from page 191.
5.26 Contract liabilities
This balance sheet item was reported for the first time in
the 2018 fiscal year as a result of the application of IFRS 15 and
shows the Group’s obligations to transfer goods or services
to a customer from which it has received a consideration in return
or for which a requested advance is due.
As at January 1, 2018 contract liabilities totaled 30,400 thou-
sand euros, of which 23,420 thousand euros were realized in
the fiscal year just past.
The scheduled fulfillment of the contract liabilities as of the
balance sheet date December 31, 2018 is shown in the table
below:
in thousand euros 31/12/2018
Contract liabilities 53,273
Realization within one year 45,314
Realization within more than one year 7,959
The long-term portion essentially includes advances received
from customers of the Defense & Civil Systems segment for long-
running contracts. There were no significant financing com-
ponents.
The transaction price for all customer orders that have not
yet been completed in full is reported as the order backlog. This
shows the following due dates:
in thousand euros 31/12/2018
Transaction price of performance obligations not completely fulfiled 521,497
Realization within the next fiscal year 412,806
Realization within the next but one fiscal year 60,817
Realization within later fiscal years 47,874

187
15 Management 35 Corporate Governance 133 Consolidated 207 Further69 Combined53 Non-financial Reporting Management Report Financial Statements Information
Consolidated Financial Statem
ents
133
206
134136137138140
Consolidated Statement of Comprehensive IncomeConsolidated Statement of Financial PositionConsolidated Statement of Cash FlowsStatement of Changes in EquityNotes
5.27 Other current, non-financial liabilities
in thousand euros 31/12/2018 31/12/2017
Liabilities to employees 9,779 8,287
Accruals 1,768 2,816
Liabilities from other taxes 4,353 5,387
Liabilities from social security 1,382 1,307
Liabilities to employer's insurance association 1,283 1,065
Liabilities from advance payments received 0 28,169
Miscellaneous current non-financial liabilities 338 222
Total 18,903 47,253
Liabilities to employees included, amongst others, vacation
entitlements and flextime credits.
Liabilities from other taxes essentially comprise liabilities arising
from sales tax.
With the introduction of IFRS 15, liabilities from advances
received were shown under contract liabilities.
6 Disclosures on Cash Flows
Liquid funds comprise the cash and cash equivalents recog-
nized in the statement of financial position in the sum of 89,255
thousand euros (prior year: 132,310 thousand euros) after tak-
ing into account a provision for losses in the sum of 500 thou-
sand euros to cover the debtor default risk. Liquid funds are
defined as the sum of cash on hand and demand deposits at
banks with a maturity of less than three months.
The statement of cash flows explains the flow of payments,
divided between the inflows and outflows of cash from the cur-
rent business, from investing and financing activities. Changes
in the balance sheet items used for preparing the statement of
cash flows cannot be directly derived from the statement of
financial position because the effects arising from the foreign
currency conversion and changes in the group of entities con-
solidated are non- cash transactions and are therefore elimi-
nated. Cash flows from operating activities are indirectly derived
from earnings before tax. Earnings before tax are adjusted for
non-cash income and expenses. The cash flow from operating
activities is determined by taking into account the changes in
working capital, provisions, and other operating balance sheet
items.
The cash flows from current operating activities in the fiscal
year just past totaled 135,490 thousand euros (prior year:
96,347 thousand euros). The main reason for the change
to the prior year were the reduced payments in the working
capital as well as the improved operating profit.
Cash flows from investing activities totaled minus 117,527 thou-
sand euros (prior year: minus 42,164 thousand euros),
characterized primarily in fiscal year 2018 by corporate acquisi-
tions. These mainly include the acquisitions of Prodomax at
74,936 thousand euros and OTTO Vision Technology GmbH as
well as OVITEC GmbH at 4,299 thousand euros. These values
correspond to the purchase price payments minus acquired cash
on hand. The conditional purchase price payment within the
framework of the acquisition of Five Lakes Automation LLC, also
influenced the cash flow in the sum 2,165 thousand euros.
For details on the corporate acquisitions we refer to the section
Entities acquired and sold from page 148 on.
In addition, capital expenditure for property, plant, and
equipment in the sum of 36,564 thousand euros (prior year:
30,340 thousand euros) had a negative impact on the invest-
ment cash flow. More detailed information on the investments
is provided in the section Earnings, financial and asset position
in the Combined Management Report from page 90 on.
In addition, the cash flow for investing activities included net
payments from current cash deposits in the sum of 4,140 thou-
sand euros. By contrast, in the prior year net payments to cash
deposits in the sum of 14,460 thousand euros had a negative
impact on the cash flow.
Cash flows from financing activities amounted to minus
60,896 thousand euros (prior year: minus 12,909 thousand
euros). The cash outflows arising from the dividends paid
increased over the previous year as a result of the higher divi-
dend payment compared with 2017 of 0.30 euros per share
(prior year: 0.25 euros per share). The payments from the
repayment of bonds and loans in the year under review essen-
tially included the cash outflows arising from the repayment
of the tranche of the debenture loans in the sum of 11,000
thousand euros due in 2018, as well as from the repayment of
Prodomax’s bank loan in the sum of 22,870 thousand euros as
part of the acquisition. The change in the group financing
included payments from or to associated, unconsolidated com-
panies and investments.

188
JENOPTIK Annual Report 2018
Consolidated Financial Statements | Notes
The changes in financial liabilities that will lead to cash flows
from financing activities in the future, are shown in the follow-
ing table:
Non cash-effective change
in thousand eurosBalance
at 1/1/2018
Cash- effective change
Foreign currency
exchange effects Addition
Change in the
fair valueChange
in maturityBalance
at 31/12
Non-current financial debt 108,573 – 16,193 216 21,490 208 – 2,888 111,405
(120,479) (413) (– 966) (723) (222) (– 12,298) (108,573)
Non-current liabilities to banks 107,883 – 16,193 217 18,349 208 – 2,237 108,227
(120,434) (475) (– 961) (0) (222) (– 12,287) (107,883)
Non-current liabilities arising from finance leases
690 0 – 2 3,141 0 – 652 3,178
(45) (– 62) (– 5) (723) (0) (– 11) (690)
Current financial debt 19,337 – 19,909 16 7,791 0 2,888 10,123
(4,129) (3,181) (– 454) (182) (0) (12,298) (19,337)
Current liabilities to banks 19,157 – 19,200 17 7,083 0 2,237 9,294
(4,088) (3,236) (– 454) (0) (0) (12,287) (19,157)
Current liabilities arising from finance leases
180 – 709 – 1 708 0 652 829
(41) (– 54) (0) (182) (0) (11) (180)
Total 127,910 – 36,102 232 29,281 208 0 121,528
(124,608) (3,595) (– 1,420) (905) (222) (0) (127,910)
The figures in brackets relate to the prior year.
The non cash-effective additions include additions from changes
in the group of entities consolidated in the sum of 25,432
thousand euros (prior year: 0 thousand euros).
Information regarding the allocation of free cash flows to the
segments is provided in the Segment Report from page 103.
The total amounts for cash flows from operating, investing
and financing activities of the proportionately consolidated joint
operation are of minor significance for Jenoptik.
Additional information on the consolidated statement of cash
flows is provided in the Combined Management Report in the
section Financial Position.
189
15 Management 35 Corporate Governance 133 Consolidated 207 Further69 Combined53 Non-financial Reporting Management Report Financial Statements Information
Consolidated Financial Statem
ents
133
206
134136137138140
Consolidated Statement of Comprehensive IncomeConsolidated Statement of Financial PositionConsolidated Statement of Cash FlowsStatement of Changes in EquityNotes
7 Disclosure on Segment Reporting
The segments are shown in accordance with the regulations
laid down in IFRS 8 “Operating segments”.
IFRS 8 follows the management approach. Accordingly, the
external reporting is carried out for the attention of the chief
operating decision makers on the basis of the internal group
organizational and management structures as well as the inter-
nal reporting structure. The Executive Board analyzes the
financial information using the key performance indicators which
serve as a basis for decisions on allocating resources and
assessing performance. The accounting policies and principles
for the segments are the same as those described for Group
in the basic accounting principles.
Since 2016, Jenoptik has been reporting on the Optics & Life
Science, Mobility as well as Defense & Civil Systems segments.
The mechatronics business of the Defense & Civil Systems
division has been presented under the new VINCORION brand
since autumn 2018. In the future the product offering and the
ex pertise in the aviation, security and defense and rail markets
will be combined under this brand. In addition, a strategic
realignment was carried out in 2018 which will now cluster
the business segments into three divisions from the 2019 fiscal
year: “Light & Optics” (OEM business), “Light & Production”
(industrial customer business) and “Light & Safety” (business
with public sector contractors).
More information on the applicable organizational structure of
the Jenoptik Group and the realignment with effect from 2019,
is provided in the Combined Management Report in the section
General Group Information from page 70.
The Optics & Life Science segment pools the activities in the
Healthcare & Industry and Optical Systems businesses. In this field
Jenoptik is one the few development and production partners
worldwide for optical and micro-optic systems and precision
components used in the semiconductor equipment industry,
in IT and communication technologies, and for security and
defense technology. In addition, the segment develops and
manufactures specific system and application solutions for
customers worldwide in the medical technology and life sciences
sectors. It also offers industry high-performance opto-electro-
nic components and modules as well as integrated solutions for
laser, automotive and lighting applications.
The Mobility segment pools the activities in the automotive
and traffic safety markets. Mobility and infrastructure are closely
interlinked mega trends of the future. The components and
system solutions of this segment increase the efficiency of pro-
ducts and production processes in the automotive market. In
addition, the traffic flows in the global economic centers are daily
becoming more complex. The solutions provided by the seg-
ment ensure that traffic infrastructure in the future will not only
remain manageable but also become safer.
The Defense & Civil Systems segment develops, manufactures
and markets mechatronic and sensor products for civilian and
military markets. Its portfolio ranges from individual assemblies
for customers to integrate in their systems, through to turnkey
solutions and end products.
The activities of the holding company, the Shared Service Cen-
ter and real estate management are summarized under Other.
The “Consolidation” column comprises the business relation-
ships to be consolidated between the segments as well as the
required reconciliations.
The business relationships between the entities of the Jenoptik
Group segments are fundamentally based on prices that are
also agreed with third parties.
Revenue in excess of 10 percent of the total revenue of the
Jenoptik Group was generated with one customer of the
Optics & Life Science segment (92,158 thousand euros). There
were no
customer relationships with individual customers whose share
of revenue is significant when measured against group revenue.
The analysis of revenue by region is conducted according to
the country in which the customer has its legal seat.
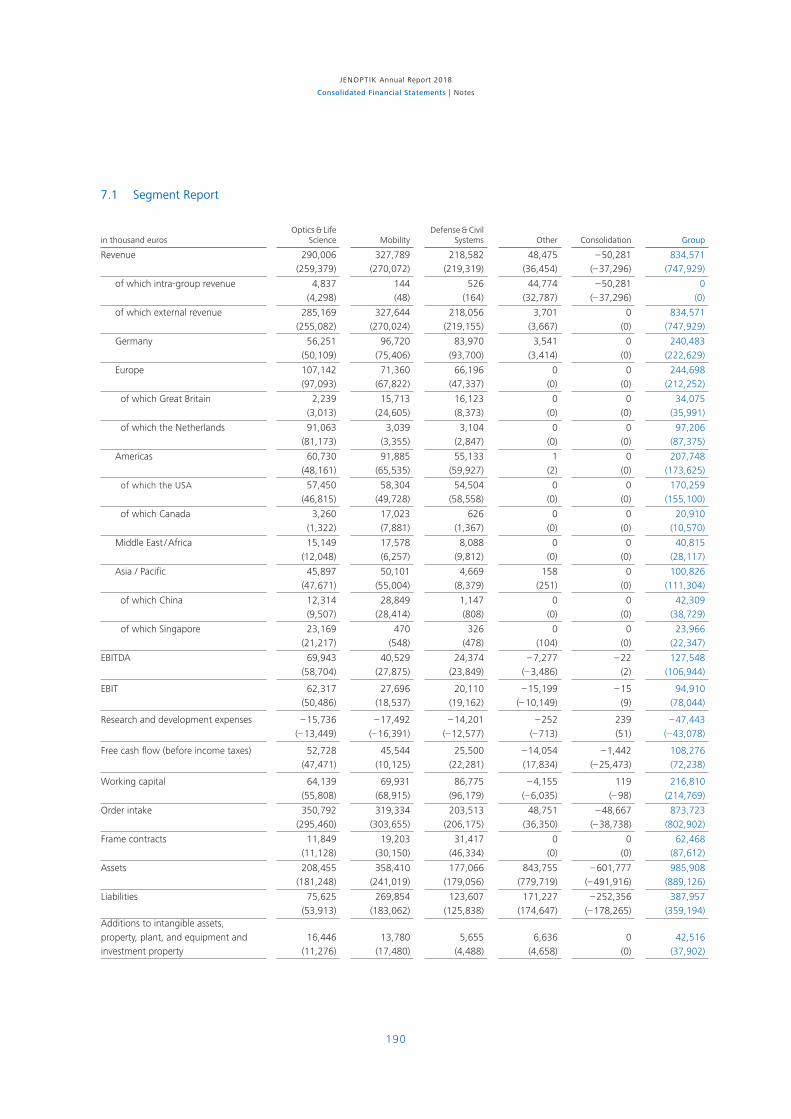
190
JENOPTIK Annual Report 2018
Consolidated Financial Statements | Notes
in thousand eurosOptics & Life
Science MobilityDefense & Civil
Systems Other Consolidation Group
Revenue 290,006(259,379)
327,789(270,072)
218,582(219,319)
48,475(36,454)
– 50,281(– 37,296)
834,571(747,929)
of which intra-group revenue 4,837(4,298)
144(48)
526(164)
44,774(32,787)
– 50,281(– 37,296)
0(0)
of which external revenue 285,169(255,082)
327,644(270,024)
218,056(219,155)
3,701(3,667)
0(0)
834,571(747,929)
Germany 56,251(50,109)
96,720(75,406)
83,970(93,700)
3,541(3,414)
0(0)
240,483(222,629)
Europe 107,142(97,093)
71,360(67,822)
66,196(47,337)
0(0)
0(0)
244,698(212,252)
of which Great Britain 2,239(3,013)
15,713(24,605)
16,123(8,373)
0(0)
0(0)
34,075(35,991)
of which the Netherlands 91,063(81,173)
3,039(3,355)
3,104(2,847)
0(0)
0(0)
97,206(87,375)
Americas 60,730(48,161)
91,885(65,535)
55,133(59,927)
1(2)
0(0)
207,748(173,625)
of which the USA 57,450(46,815)
58,304(49,728)
54,504(58,558)
0(0)
0(0)
170,259(155,100)
of which Canada 3,260(1,322)
17,023(7,881)
626(1,367)
0(0)
0(0)
20,910(10,570)
Middle East / Africa 15,149(12,048)
17,578(6,257)
8,088(9,812)
0(0)
0(0)
40,815(28,117)
Asia / Pacific 45,897(47,671)
50,101(55,004)
4,669(8,379)
158(251)
0(0)
100,826(111,304)
of which China 12,314(9,507)
28,849(28,414)
1,147(808)
0(0)
0(0)
42,309(38,729)
of which Singapore 23,169(21,217)
470(548)
326(478)
0(104)
0(0)
23,966(22,347)
EBITDA 69,943(58,704)
40,529(27,875)
24,374(23,849)
– 7,277(– 3,486)
– 22(2)
127,548(106,944)
EBIT 62,317(50,486)
27,696(18,537)
20,110(19,162)
– 15,199(– 10,149)
– 15(9)
94,910(78,044)
Research and development expenses – 15,736(– 13,449)
– 17,492(– 16,391)
– 14,201(– 12,577)
– 252(– 713)
239(51)
– 47,443(– 43,078)
Free cash flow (before income taxes) 52,728(47,471)
45,544(10,125)
25,500(22,281)
– 14,054(17,834)
– 1,442(– 25,473)
108,276(72,238)
Working capital 64,139(55,808)
69,931(68,915)
86,775(96,179)
– 4,155(– 6,035)
119(– 98)
216,810(214,769)
Order intake 350,792(295,460)
319,334(303,655)
203,513(206,175)
48,751(36,350)
– 48,667(– 38,738)
873,723(802,902)
Frame contracts 11,849(11,128)
19,203(30,150)
31,417(46,334)
0(0)
0(0)
62,468(87,612)
Assets 208,455(181,248)
358,410(241,019)
177,066(179,056)
843,755(779,719)
– 601,777(– 491,916)
985,908(889,126)
Liabilities 75,625(53,913)
269,854(183,062)
123,607(125,838)
171,227(174,647)
– 252,356(– 178,265)
387,957(359,194)
Additions to intangible assets, property, plant, and equipment and investment property
16,446(11,276)
13,780(17,480)
5,655(4,488)
6,636(4,658)
0(0)
42,516(37,902)
7.1 Segment Report
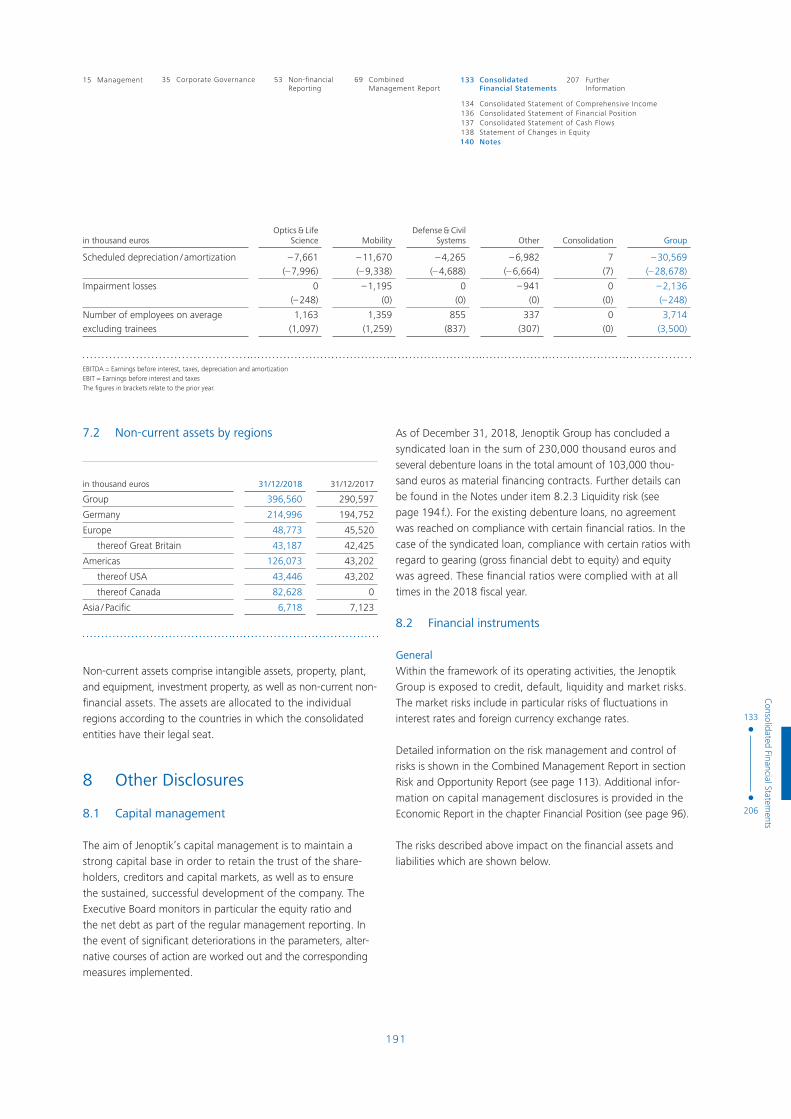
191
15 Management 35 Corporate Governance 133 Consolidated 207 Further69 Combined53 Non-financial Reporting Management Report Financial Statements Information
Consolidated Financial Statem
ents
133
206
134136137138140
Consolidated Statement of Comprehensive IncomeConsolidated Statement of Financial PositionConsolidated Statement of Cash FlowsStatement of Changes in EquityNotes
in thousand eurosOptics & Life
Science MobilityDefense & Civil
Systems Other Consolidation Group
Scheduled depreciation / amortization – 7,661(– 7,996)
– 11,670(– 9,338)
– 4,265(– 4,688)
– 6,982(– 6,664)
7(7)
– 30,569(– 28,678)
Impairment losses 0(– 248)
– 1,195(0)
0(0)
– 941(0)
0(0)
– 2,136(– 248)
Number of employees on average excluding trainees
1,163(1,097)
1,359(1,259)
855(837)
337(307)
0(0)
3,714(3,500)
EBITDA = Earnings before interest, taxes, depreciation and amortizationEBIT = Earnings before interest and taxesThe figures in brackets relate to the prior year.
7.2 Non-current assets by regions
in thousand euros 31/12/2018 31/12/2017
Group 396,560 290,597
Germany 214,996 194,752
Europe 48,773 45,520
thereof Great Britain 43,187 42,425
Americas 126,073 43,202
thereof USA 43,446 43,202
thereof Canada 82,628 0
Asia / Pacific 6,718 7,123
Non-current assets comprise intangible assets, property, plant,
and equipment, investment property, as well as non-current non-
financial assets. The assets are allocated to the individual
regions according to the countries in which the consolidated
entities have their legal seat.
8 Other Disclosures
8.1 Capital management
The aim of Jenoptik’s capital management is to maintain a
strong capital base in order to retain the trust of the share-
holders, creditors and capital markets, as well as to ensure
the sustained, successful development of the company. The
Executive Board monitors in particular the equity ratio and
the net debt as part of the regular management reporting. In
the event of significant deteriorations in the parameters, alter-
native courses of action are worked out and the corresponding
measures implemented.
As of December 31, 2018, Jenoptik Group has concluded a
syndicated loan in the sum of 230,000 thousand euros and
several debenture loans in the total amount of 103,000 thou-
sand euros as material financing contracts. Further details can
be found in the Notes under item 8.2.3 Liquidity risk (see
page 194 f.). For the existing debenture loans, no agreement
was reached on compliance with certain financial ratios. In the
case of the syndicated loan, compliance with certain ratios with
regard to gearing (gross financial debt to equity) and equity
was agreed. These financial ratios were complied with at all
times in the 2018 fiscal year.
8.2 Financial instruments
GeneralWithin the framework of its operating activities, the Jenoptik
Group is exposed to credit, default, liquidity and market risks.
The market risks include in particular risks of fluctuations in
interest rates and foreign currency exchange rates.
Detailed information on the risk management and control of
risks is shown in the Combined Management Report in section
Risk and Opportunity Report (see page 113). Additional infor-
mation on capital management disclosures is provided in the
Economic Report in the chapter Financial Position (see page 96).
The risks described above impact on the financial assets and
liabilities which are shown below.

192
JENOPTIK Annual Report 2018
Consolidated Financial Statements | Notes
Financial assets:Valuation in statement of financial position
in accordance with IFRS 9 resp. IAS 39
in thousand euros
Valuation category in accordance
with IFRS 9 resp. IAS 39 1)
Carrying amounts
31/12/2018
Amortized acquisition
costs
Fair value – through other
comprehensive income
Fair value – through profit
or loss
Valuation in accordance with IAS 17
Financial investments
Current cash deposits AC 59,476 59,476(64,169) (64,169)
Shares in unconsolidated associates and investments
FVTOCI 1,569 1,569(2,812) (2,812)
Shares in entities which are subject to the equity valuation
AC 5,191 5,191(0) (0)
Available-for-sale financial assets
AC 0 0(867) (867)
Loans granted AC 10 10(730) (730)
Financial assets to be held to maturity
AC 0 0(408) (408)
Trade receivables AC 131,198 131,198(136,017) (136,017)
Other financial assets
Receivables from finance leases – 0 0(340) (340)
Derivatives with hedging relations
Forward exchange transactions / currency swaps
– 128 128(2,962) (2,962)
Derivatives without hedging relations
Interest and currency swap FVTPL 101 101(225) (225)
Forward exchange transactions / currency swaps
FVTPL 1,770 1,770(1,778) (1,778)
Other financial assets AC 5,460 5,460(2,322) (2,322)
Cash and cash equivalents AC 89,255 89,255(132,310) (132,310)
Total 294,158 290,590 1,697 1,871 0(344,937) (336,821) (5,773) (2,003) (340)
The figures in brackets relate to the prior year.1) AC = Amortized acquisition costs FVTPL = Fair value through Profit & Loss FVTOCI = Fair value through other comprehensive income
Financial liabilities:Valuation in statement of financial position
in accordance with IFRS 9 resp. IAS 39
in thousand euros
Valuation category in accordance
with IFRS 9 resp. IAS 39 1)
Carrying amounts
31/12/2018
Amortized acquisition
costs
Fair value – through other
comprehensive income
Fair value – through profit
or loss
Valuation in accordance with IAS 17
Financial debt
Liabilities to banks AC 117,521 117,521(127,040) (127,040)
Liabilities arising from finance leases – 4,007 4,007(871) (871)
Trade payables AC 62,595 62,595(61,657) (61,657)

193
15 Management 35 Corporate Governance 133 Consolidated 207 Further69 Combined53 Non-financial Reporting Management Report Financial Statements Information
Consolidated Financial Statem
ents
133
206
134136137138140
Consolidated Statement of Comprehensive IncomeConsolidated Statement of Financial PositionConsolidated Statement of Cash FlowsStatement of Changes in EquityNotes
The classification of the fair values for the financial assets and
liabilities is taken from the following overview:
in thousand euros
Carrying amounts
31/12/2018 Level 1 Level 2 Level 3
Shares in unconsoli-dated associates and investments
1,569(2,812)
0(0)
0(0)
1,569(2,812)
Available-for-sale financial assets
0(867)
0(0)
0(0)
0(867)
Derivatives with hedging relations (assets)
128(2,962)
0(0)
128(2,962)
0(0)
Derivatives without hedging relations (assets)
1,871(2,003)
0(0)
1,871(2,003)
0(0)
Contingent liabilities
1,671(3,128)
0(0)
0(0)
1,671(3,128)
Derivatives with hedging relations (liabilities)
3,169(486)
0(0)
3,169(486)
0(0)
Derivatives without hedging relations (liabilities)
48(194)
0(0)
48(194)
0(0)
The figures in brackets relate to the prior year.
Valuation in statement of financial position in accordance with IFRS 9 resp. IAS 39
in thousand euros
Valuation category in accordance
with IFRS 9 resp. IAS 39 1)
Carrying amounts
31/12/2018
Amortized acquisition
costs
Fair value – through other
comprehensive income
Fair value – through profit
or loss
Valuation in accordance with IAS 17
Other financial liabilities
Contingent liabilities FVTPL 1,671 1,671
(3,128) (3,128)
Derivatives with hedging relations
Forward exchange transactions / currency swaps
– 3,169 3,169
(486) (486)
Derivatives without hedging relations
Interest swap FVTPL 0 0
(182) (182)
Interest and currency swap FVTPL 0 0
(0) (0)
Forward exchange transactions / currency swaps
FVTPL 48 48
(11) (11)
Other financial liabilities AC 5,288 5,288
(5,266) (5,266)
Total 194,300(198,642)
185,404(193,963)
3,169(486)
1,719(3,322)
4,007(871)
The figures in brackets relate to the prior year.1) AC = Amortized acquisition costs FVTPL = Fair value through Profit & Loss
Fair values which are available as quoted market prices at all
times, are allocated to level 1. Fair values determined on the
basis of direct or indirect observable parameters are allocated
to level 2. Level 3 is based on measurement parameters that
are not based upon observable market data.
Fair values of available-for-sale financial assets are determined
on the basis of stock exchange prices (level 1), respectively, dis-
counted cash flows (level 3).
The fair values of all derivatives are determined using the gen-
erally recognized cash value method. In this context, the future
cash flows determined via the agreed forward rate or interest
rate are discounted using current market data. The market data
used in this context is taken from leading financial information
systems, such as, for example, Reuters. If an interpolation of
market data is applied, this is done on a straight-line basis.
The fair value of contingent liabilities was measured by taking
the expected and discounted payment outflows at the reporting
date into consideration.
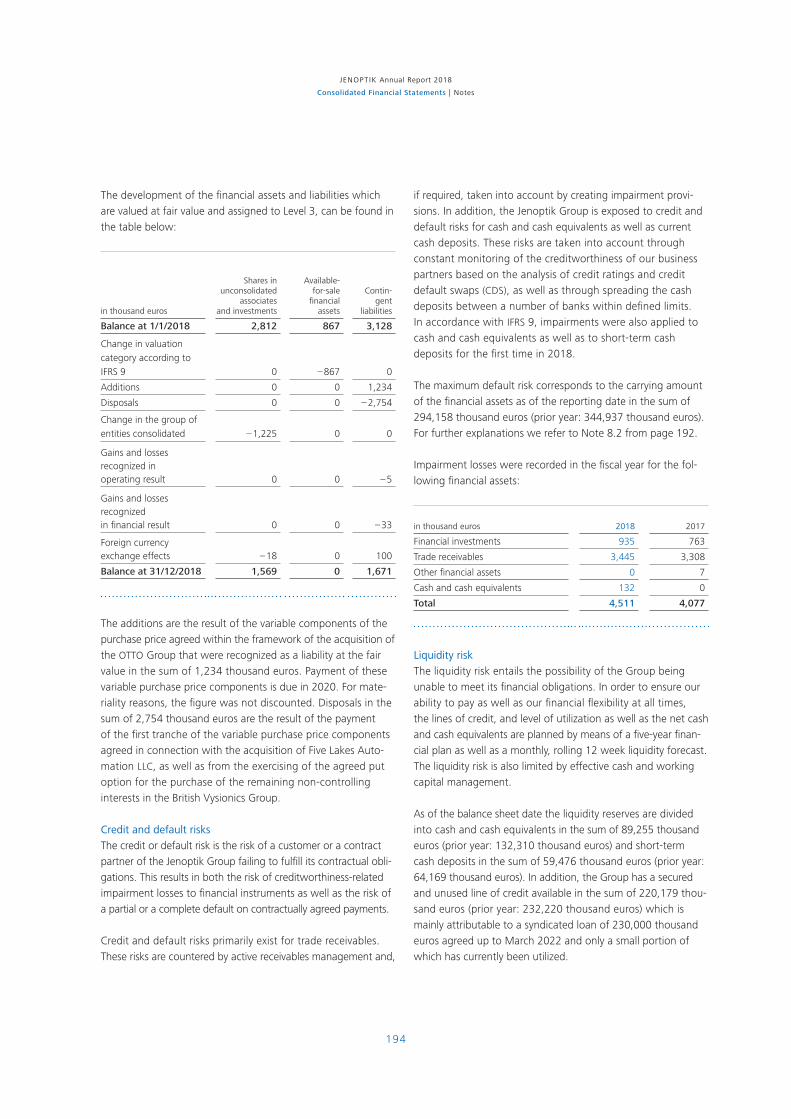
194
JENOPTIK Annual Report 2018
Consolidated Financial Statements | Notes
The development of the financial assets and liabilities which
are valued at fair value and assigned to Level 3, can be found in
the table below:
in thousand euros
Shares in unconsolidated
associates and investments
Avail able- for-sale
financial assets
Contin-gent
liabilities
Balance at 1/1/2018 2,812 867 3,128
Change in valuation category according to IFRS 9 0 – 867 0
Additions 0 0 1,234
Disposals 0 0 – 2,754
Change in the group of entities consolidated – 1,225 0 0
Gains and losses recognized in operating result 0 0 – 5
Gains and losses recognized in financial result 0 0 – 33
Foreign currency exchange effects – 18 0 100
Balance at 31/12/2018 1,569 0 1,671
The additions are the result of the variable components of the
purchase price agreed within the framework of the acquisition of
the OTTO Group that were recognized as a liability at the fair
value in the sum of 1,234 thousand euros. Payment of these
variable purchase price components is due in 2020. For mate-
riality reasons, the figure was not discounted. Disposals in the
sum of 2,754 thousand euros are the result of the payment
of the first tranche of the variable purchase price components
agreed in connection with the acquisition of Five Lakes Auto-
mation LLC, as well as from the exercising of the agreed put
option for the purchase of the remaining non-controlling
interests in the British Vysionics Group.
Credit and default risksThe credit or default risk is the risk of a customer or a contract
partner of the Jenoptik Group failing to fulfill its contractual obli-
gations. This results in both the risk of creditworthiness-related
impairment losses to financial instruments as well as the risk of
a partial or a complete default on contractually agreed payments.
Credit and default risks primarily exist for trade receivables.
These risks are countered by active receivables management and,
if required, taken into account by creating impairment provi-
sions. In addition, the Jenoptik Group is exposed to credit and
default risks for cash and cash equivalents as well as current
cash deposits. These risks are taken into account through
constant monitoring of the creditworthiness of our business
partners based on the analysis of credit ratings and credit
default swaps (CDS), as well as through spreading the cash
deposits between a number of banks within defined limits.
In accordance with IFRS 9, impairments were also applied to
cash and cash equivalents as well as to short-term cash
deposits for the first time in 2018.
The maximum default risk corresponds to the carrying amount
of the financial assets as of the reporting date in the sum of
294,158 thousand euros (prior year: 344,937 thousand euros).
For further explanations we refer to Note 8.2 from page 192.
Impairment losses were recorded in the fiscal year for the fol-
lowing financial assets:
in thousand euros 2018 2017
Financial investments 935 763
Trade receivables 3,445 3,308
Other financial assets 0 7
Cash and cash equivalents 132 0
Total 4,511 4,077
Liquidity riskThe liquidity risk entails the possibility of the Group being
unable to meet its financial obligations. In order to ensure our
ability to pay as well as our financial flexibility at all times,
the lines of credit, and level of utilization as well as the net cash
and cash equivalents are planned by means of a five-year finan-
cial plan as well as a monthly, rolling 12 week liquidity forecast.
The liquidity risk is also limited by effective cash and working
capital management.
As of the balance sheet date the liquidity reserves are divided
into cash and cash equiva lents in the sum of 89,255 thousand
euros (prior year: 132,310 thousand euros) and short-term
cash deposits in the sum of 59,476 thousand euros (prior year:
64,169 thousand euros). In addition, the Group has a secured
and unused line of credit available in the sum of 220,179 thou-
sand euros (prior year: 232,220 thousand euros) which is
mainly attributable to a syndicated loan of 230,000 thousand
euros agreed up to March 2022 and only a small portion of
which has currently been utilized.

195
15 Management 35 Corporate Governance 133 Consolidated 207 Further69 Combined53 Non-financial Reporting Management Report Financial Statements Information
Consolidated Financial Statem
ents
133
206
134136137138140
Consolidated Statement of Comprehensive IncomeConsolidated Statement of Financial PositionConsolidated Statement of Cash FlowsStatement of Changes in EquityNotes
Interest ratesCarrying amounts Cash outflows
in thousand euros (range in %) 31/12/2018 Total Up to 1 year 1 to 5 yearsMore than
5 years
Variable interest-bearing liabilities to banks 0.8 – 5.29(0.8 – 6.12)
32,285(33,002)
33,193(34,049)
6,287(6,860)
26,906(27,189)
0(0)
Fixed interest-bearing liabilities to banks 1.0 – 3.9(1.0 – 4.4)
85,236(94,038)
88,217(100,416)
3,395(14,795)
84,823(85,621)
0(0)
Fixed interest-bearing liabilities from lease agreements
0.9 – 7.6(0.9 – 7.6)
3,902(871)
4,109(898)
868(193)
3,230(705)
11(0)
Total 121,422
(127,910)
125,520
(135,363)
10,550
(21,848)
114,959
(113,515)
11
(0)
The figures in brackets relate to the prior year.
Outstanding debenture loans in the sum of 103,000 thousand
euros (prior year: 114,000 thousand euros) will be repaid in the
years 2020 resp. 2022.
Cash outflows up to one year mainly include interest and
redemption payments from short-term lines of credit for the
operational business in China, as well as from the real estate
financing conclude in 2016 in the United States. This item also
includes interest payments for existing debenture loans.
The cash outflows in the time frame of between one to five
years mainly include the repayments of the debenture loans
with original terms of five and seven years.
Further details are provided under Note 5.22 on page 185.
Interest rate fluctuation riskThe Jenoptik Group is fundamentally exposed to the risks of
changes in interest rates due to fluctuations in market interest
rates, for all interest-bearing financial assets and liabilities. In
the fiscal year 2018, this essentially related to debenture loans
issued in the sum of 103,000 thousand euros (prior year:
114,000 thousand euros) as well as short-term cash deposits in
the sum of 59,476 thousand euros (prior year: 64,169 thousand
euros), as well as a portion of the cash and cash equivalents in
the sum of 89,255 thousand euros (prior year: 132,310 thou-
sand euros) at the respective balance sheet. Despite the current
negative interest rate environment for short-term euro cash
deposits, the Group has succeed in avoiding negative interests
being applied to all interest-bearing financial assets.
Carrying amounts
in thousand euros 31/12/2018 31/12/2017
Interest-bearing financial assets 65,623 87,368
Variable interest 21,147 3,946
Fixed interest 44,476 83,421
Interest-bearing financial liabilities 121,422 127,910
Variable interest 32,285 33,002
Fixed interest 89,138 94,909
The constructed gains and losses arising from a change in the
market interest rate as of December 31, 2018 within a band-
width of 100 basis points are shown in the following table:
in thousand euros 31/12/2018 31/12/2017
Increase by 100 basis points
Interest-bearing financial assets 656 874
Interest-bearing financial liabilities – 1,214 – 1,279
Effect on earnings before tax – 558 – 405
Reduction by 100 basis points
Interest-bearing financial assets – 656 – 874
Interest-bearing financial liabilities 1,214 1,279
Effect on earnings before tax 558 405

196
JENOPTIK Annual Report 2018
Consolidated Financial Statements | Notes
As part of the management of interest rate risks, Jenoptik relies
on a mix of fixed and variable interest-bearing assets and liabili-
ties, as well as various interest rate hedging transactions. These
include for example interest swaps, interest caps and floors, as
well as combined interest and currency swaps. After an inter-
est rate swap with a nominal volume of 8,000 thousand euros
became due in October 2018, there was only one combined
interest rate and currency swap in place as of the balance
sheet date of December 31, 2018 with the following structure:
Interest and currency swap
Nominal amount CNY 17,980 thousand
Term March 12, 2015 to March 12, 2025
Fixed interest rate 5.10 percent p. a.
Variable interest rate 6-month Euribor
This hedging transaction is used to secure an intra-group loan
for real estate financing in Shanghai (China). The change in its
market value of minus 123 thousand euros was recorded
through profit or loss in the statement of income.
The following payments are anticipated from this interest rate
hedging instruments:
in thousand eurosUp to 1 year
1 to 5 years
More than 5 years Total
Interest swaps 0(183)
0(0)
0(0)
0(183)
Interest and currency swap
120(121)
459(448)
180(259)
759(827)
The figures in brackets relate to the prior year.
Foreign currency exchange riskCurrency risks are divided into two types: conversion risk and
transaction risk.
The conversion risk arises from fluctuations caused by changes
in exchange rates resulting from the conversion of existing for-
eign currency financial assets and liabilities into the balance
sheet currency. Since this is not associated with any cash flows,
no hedging is currently applied.
In connection with the acquisition of Prodomax Automation
Ltd. in Canada, JENOPTIK AG issued two intra-group loans. A
loan of 93,018 thousand Canadian dollars was issued to
Prodomax Automation Ltd. itself. A second loan in the sum of
47,127 thousand USD was issued to its parent company,
JENOPTIK North America Inc. Both loans have been declared as
a “Net investment in a foreign operation” in accordance
with the accounting principles, as no repayment of these loans
is expected in the short term. Based on the aforementioned
allocation for accounting purposes, the changes in the value of
the loan receivables resulting from fluctuating exchange rates
at the respective balance sheet dates, are recorded in equity out-
side of profit or loss. That is also the reason why no hedging
was applied.
The transaction risk arise from the fluctuation of cash flows
in foreign currencies caused by changes in currency exchange
rates. Derivative financial instruments, primarily forward
exchange transactions and currency swaps, are used to hedge
this risk.
Hedging is provided for significant cash flows in foreign cur-
rencies arising from its operational business (revenue). Contrac-
tually agreed cash flows are hedged 1:1 via so-called micro-
hedges. Planned cash flows are secured proportionally as part
of the anticipatory hedging.
JENOPTIK AG also hedges the anticipated cash flows from
intra-group loans in foreign currencies which have not been
declared as a “Net investment in a foreign operation” (mainly
GBP), using derivative financial instruments.
As of the balance sheet date, existing forward exchange trans-
actions and currency swaps totaled a nominal value of
134,762 thousand euros (prior year: 118,621 thousand euros).
A so-called cash flow hedge relationship with the respective
underlying transaction was documented for the vast majority
of these transactions. Where these are proven effective, their
changes do not have to be recorded through profit or loss. In
order to measure the effectiveness, a prospective, quality-rela-
ted effectiveness test has been conducted, on the designation
date as well as on an ongoing basis, normally as of the balance
sheet date, on the basis of the IFRS 9 “Financial instruments”
accounting document which has been applicable since January 1,
2018.

197
15 Management 35 Corporate Governance 133 Consolidated 207 Further69 Combined53 Non-financial Reporting Management Report Financial Statements Information
Consolidated Financial Statem
ents
133
206
134136137138140
Consolidated Statement of Comprehensive IncomeConsolidated Statement of Financial PositionConsolidated Statement of Cash FlowsStatement of Changes in EquityNotes
Forward exchange transactions and currency swaps are grouped
according to sales and purchases in foreign currencies (against
the EUR respectively) as follows:
in thousand euros 31/12/2018 31/12/2017
USD sale 111,267 87,893
USD purchase 67 5,776
GBP sale 21,402 22,498
CNY sale 990 103
KRW sale 572 0
JPY sale 465 983
JPY purchase 0 466
AUD sale 0 902
Total foreign currency sales 134,695 112,379
Total foreign currency purchases 67 6,242
These forward exchange transactions and currency swaps pro-
duce the following market values:
in thousand euros 31/12/2018 31/12/2017
Positive market values
Derivatives with hedging relations
non-current 37 50
current 91 2,912
Derivatives without hedging relations
non-current 1,828 1,907
current 43 97
Total positive market values 1,999 4,965
Negative market values
Derivatives with hedging relations
non-current 1,402 0
current 1,767 486
Derivatives without hedging relations
non-current 7 3
current 40 191
Total negative market values 3,217 680
The market values for hedging transactions for intra-group
loans are included in the derivatives without hedges as the under-
lying transaction comprising intra-group receivables and lia-
bilities is deconsolidated. As of the balance sheet date the posi-
tive market values of these derivatives totaled 1,745 thousand
euros (prior year: 1,778 thousand euros), the negative market
values totaled 47 thousand euros (prior year: 11 thousand
euros). The overall change led to a loss of 69 thousand euros
(prior year: earnings of 553 thousand euros) which was recog-
nized in the financial result through profit or loss.
Cumulative profits and losses in hedged derivatives in the sum of
2,556 thousand euros (prior year: minus 2,204 thousand euros)
were recognized in equity outside profit or loss as at December
31, 2018. Of the profits and losses recognized in equity outside
profit or loss as at December 31, 2017, in 2018 a reclassification
in the sum of minus 1,537 thousand euros (prior year: minus
2,252 thousand euros) was carried out from equity to profit or
loss. This type of reclassification is normally associated with the
recognition of the underlying transaction (for example recogni-
tion of revenue and booking of the corresponding receivable
on billing) through profit or loss so that the intended balancing
effect of concluding the hedge transaction is seen in the state-
ment of income.
The foreign currency hedging transactions hedge against for-
eign currency risks in the sum of 70,477 thousand euros with a
time frame up to the end of 2019. Foreign currency risks in
the sum of 64,151 thousand euros are hedged with a time frame
up to the end of 2021.
The main foreign exchange transactions of the Jenoptik Group
involve US dollars. The table below shows a breakdown of the
USD-based translation and transaction risks, as well as the
Group’s net risk position:
in thousand euros 31/12/2018 31/12/2017
Financial assets 52,106 20,071
Financial liabilities 2,820 2,005
Translation risk 49,287 18,066
Planned cash flows 135,023 68,594
Cash flows hedged by derivatives 111,199 82,117
Transaction risk 23,823 – 13,523
Net risk item 73,110 4,543
The increase in financial assets held in US dollars compared
to the prior year is mainly attributable to the cash available from
the acquisition of Prodomax Automation Ltd., the increased
cash and cash equivalents in US dollars at JENOPTIK AG, as well
as to an increase in group-wide trade receivables in US dollars.
In addition to international growth, the significant increase in the
planned cash flows in US dollars compared to the prior year
is attributable to currency-differentiated planning being applied
for the first time.

198
JENOPTIK Annual Report 2018
Consolidated Financial Statements | Notes
As of the balance sheet date there was a US dollar-based net
risk item in the sum of 73,110 thousand euros (prior year:
4,543 thousand euros). A change in the US dollar exchange rate
would have the following consequences:
EUR / USD-rate
Change in the net risk item (in
thousand euros)
Reporting date exchange rate 31/12/2018
1.1450(1.1993)
Increase by 5 percent 1.2023(1.2593)
3,481(216)
Decrease by 5 percent 1.0878(1.1393)
– 3,848(– 239)
Increase by 10 percent 1.2595(1.3192)
6,646(413)
Decrease by 10 percent 1,0305(1.0794)
– 8,123(– 505)
The figures in brackets relate to the prior year.
8.3 Contingent liabilities and contingent payables
As at December 31, 2018 there were no longer any guarantees
in place (prior year: 4,750 thousand euros). The guarantee
obliga tions in the prior year resulted from a warranty bond for
a unconsolidated associated entity in connection with a con-
struction project. Insofar as a claim under the bond was antic-
ipated, corresponding provisions had been set aside.
8.4 Other financial obligations
The financial obligations resulting from rental contracts or
lease agreements are shown from page 170.
In addition to the order commitments for intangible assets and
property, plant and equipment in the sum of 10,475 thousand
euros (prior year: 8,510 thousand euros) there were other
financial liabilities in the sum of 108,605 thousand euros (prior
year: 102,149 thousand euros), in particular for order commit-
ments for inventories in the sum of 83,454 thousand euros (prior
year: 65,996 thousand euros). In addition, the other financial
obligations resulted from a service contract for building manage-
ment services which has been in force for all German Jenoptik
sites since April 2018 and has a contract term of four years.
Loan commitments to unconsolidated associated entities in the
sum of 154 thousand euros (prior year: 1,147 thousand euros)
were not used.
8.5 Legal disputes
JENOPTIK AG and its Group entities are involved in court or
arbitration proceedings. Provisions for litigation risks, respectively
litigation expenses, were set aside in the appropriate amounts
in order to meet any possible financial burdens resulting from
any court decisions or arbitration proceedings (see section 5.20
from page 183).
8.6 Related party disclosures in accordance
with IAS 24
Related parties are defined in IAS 24 “Related party disclosures”
as being entities or persons that have control over or are con-
trolled by the Jenoptik Group to the extent that they have not
already been included in the consolidated financial statements
as consolidated entities as well as entities or persons that, on
the basis of the Articles of Association or by contractual agree-
ments, are able to significantly influence the financial and cor-
porate policies of the management of JENOPTIK AG or participate
in the joint management of JENOPTIK AG. Control applies if
a shareholder holds more than half of the voting rights in
JENOPTIK AG. The largest single shareholder of JENOPTIK AG
is Thüringer Industriebeteiligungs GmbH & Co. KG, Erfurt, which
directly holds in total 11 percent of the voting rights and thus
does not have control over JENOPTIK AG.
Members of the Executive Board and of the Supervisory Board
of JENOPTIK AG also qualify as related parties. In the 2018 fiscal
year no exchange of goods or of services was transacted
between the entity and members of these two bodies.
The breakdown of the total remuneration of the members of
the management in key positions (Executive Board and Super-
visory Board) is shown in the following table.
in thousand euros 2018 2017
Short-term benefits 2,836 3,126
Post-employment benefits 360 397
Share-based payments 677 1,042
Total 3,873 4,565
Detailed information on the disclosure of the remuneration of
the members of the Executive Board and the Supervisory Board
as required by IAS 24.9 has been published in the Remunera-
tion Report as part of the Combined Management Report in
the section Corporate Governance on pages 45 ff. as well as
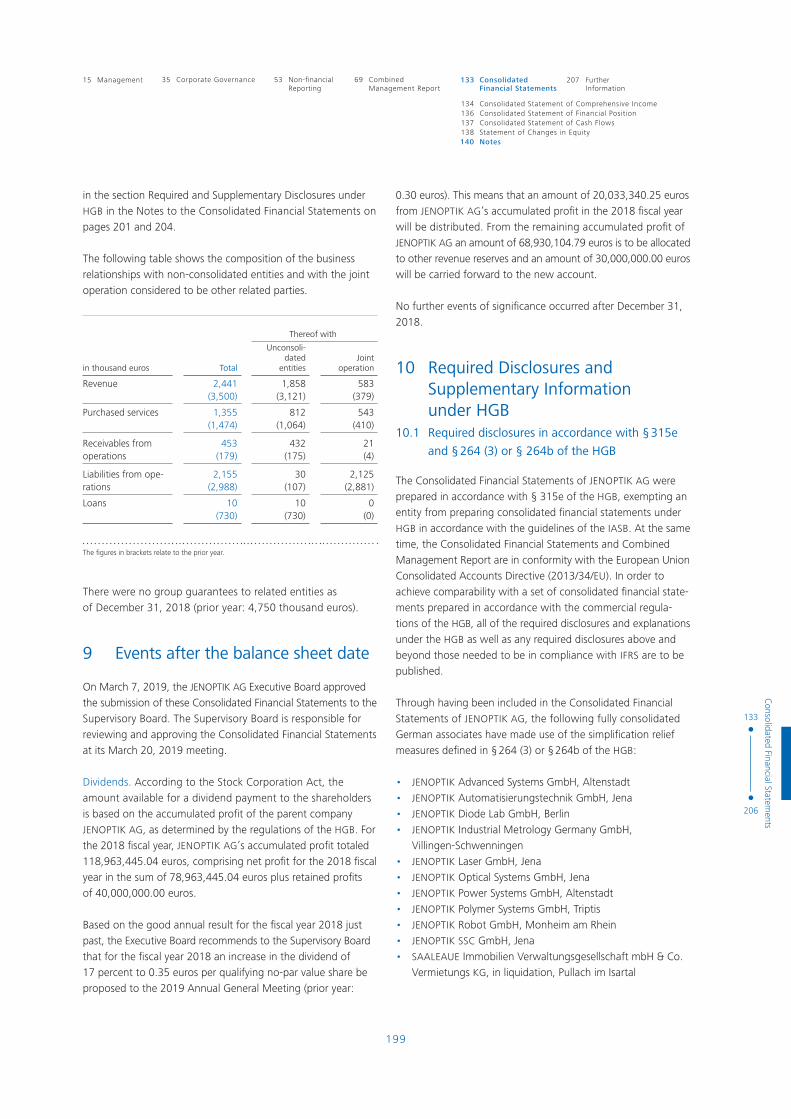
199
15 Management 35 Corporate Governance 133 Consolidated 207 Further69 Combined53 Non-financial Reporting Management Report Financial Statements Information
Consolidated Financial Statem
ents
133
206
134136137138140
Consolidated Statement of Comprehensive IncomeConsolidated Statement of Financial PositionConsolidated Statement of Cash FlowsStatement of Changes in EquityNotes
in the section Required and Supplementary Disclosures under
HGB in the Notes to the Consolidated Financial Statements on
pages 201 and 204.
The following table shows the composition of the business
relationships with non-consolidated entities and with the joint
operation considered to be other related parties.
Thereof with
in thousand euros Total
Unconsoli-dated
entitiesJoint
operation
Revenue 2,441(3,500)
1,858(3,121)
583(379)
Purchased services 1,355(1,474)
812(1,064)
543(410)
Receivables from operations
453(179)
432(175)
21(4)
Liabilities from ope-rations
2,155(2,988)
30(107)
2,125(2,881)
Loans 10(730)
10(730)
0(0)
The figures in brackets relate to the prior year.
There were no group guarantees to related entities as
of December 31, 2018 (prior year: 4,750 thousand euros).
9 Events after the balance sheet date
On March 7, 2019, the JENOPTIK AG Executive Board approved
the submission of these Consolidated Financial Statements to the
Supervisory Board. The Supervisory Board is responsible for
reviewing and approving the Consolidated Financial Statements
at its March 20, 2019 meeting.
Dividends. According to the Stock Corporation Act, the
amount available for a dividend payment to the shareholders
is based on the accumulated profit of the parent company JENOPTIK AG, as determined by the regulations of the HGB. For
the 2018 fiscal year, JENOPTIK AG’s accumulated profit totaled
118,963,445.04 euros, comprising net profit for the 2018 fiscal
year in the sum of 78,963,445.04 euros plus retained profits
of 40,000,000.00 euros.
Based on the good annual result for the fiscal year 2018 just
past, the Executive Board recommends to the Supervisory Board
that for the fiscal year 2018 an increase in the dividend of
17 percent to 0.35 euros per qualifying no-par value share be
proposed to the 2019 Annual General Meeting (prior year:
0.30 euros). This means that an amount of 20,033,340.25 euros
from JENOPTIK AG’s accumulated profit in the 2018 fiscal year
will be distributed. From the remaining accumulated profit of
JENOPTIK AG an amount of 68,930,104.79 euros is to be allocated
to other revenue reserves and an amount of 30,000,000.00 euros
will be carried forward to the new account.
No further events of significance occurred after December 31,
2018.
10 Required Disclosures and Supplementary Information under HGB10.1 Required disclosures in accordance with § 315e
and § 264 (3) or § 264b of the HGB
The Consolidated Financial Statements of JENOPTIK AG were
prepared in accordance with § 315e of the HGB, exempting an
entity from preparing consolidated financial statements under
HGB in accordance with the guidelines of the IASB. At the same
time, the Consolidated Financial Statements and Combined
Management Report are in conformity with the European Union
Consolidated Accounts Directive (2013/34/EU). In order to
achieve comparability with a set of consolidated financial state-
ments prepared in accordance with the commercial regula-
tions of the HGB, all of the required disclosures and explanations
under the HGB as well as any required disclosures above and
beyond those needed to be in compliance with IFRS are to be
published.
Through having been included in the Consolidated Financial
Statements of JENOPTIK AG, the following fully consolidated
German associates have made use of the simplification relief
measures defined in § 264 (3) or § 264b of the HGB:
• JENOPTIK Advanced Systems GmbH, Altenstadt
• JENOPTIK Automatisierungstechnik GmbH, Jena
• JENOPTIK Diode Lab GmbH, Berlin
• JENOPTIK Industrial Metrology Germany GmbH,
Villingen-Schwenningen
• JENOPTIK Laser GmbH, Jena
• JENOPTIK Optical Systems GmbH, Jena
• JENOPTIK Power Systems GmbH, Altenstadt
• JENOPTIK Polymer Systems GmbH, Triptis
• JENOPTIK Robot GmbH, Monheim am Rhein
• JENOPTIK SSC GmbH, Jena
• SAALEAUE Immobilien Verwaltungsgesellschaft mbH & Co.
Vermietungs KG, in liquidation, Pullach im Isartal
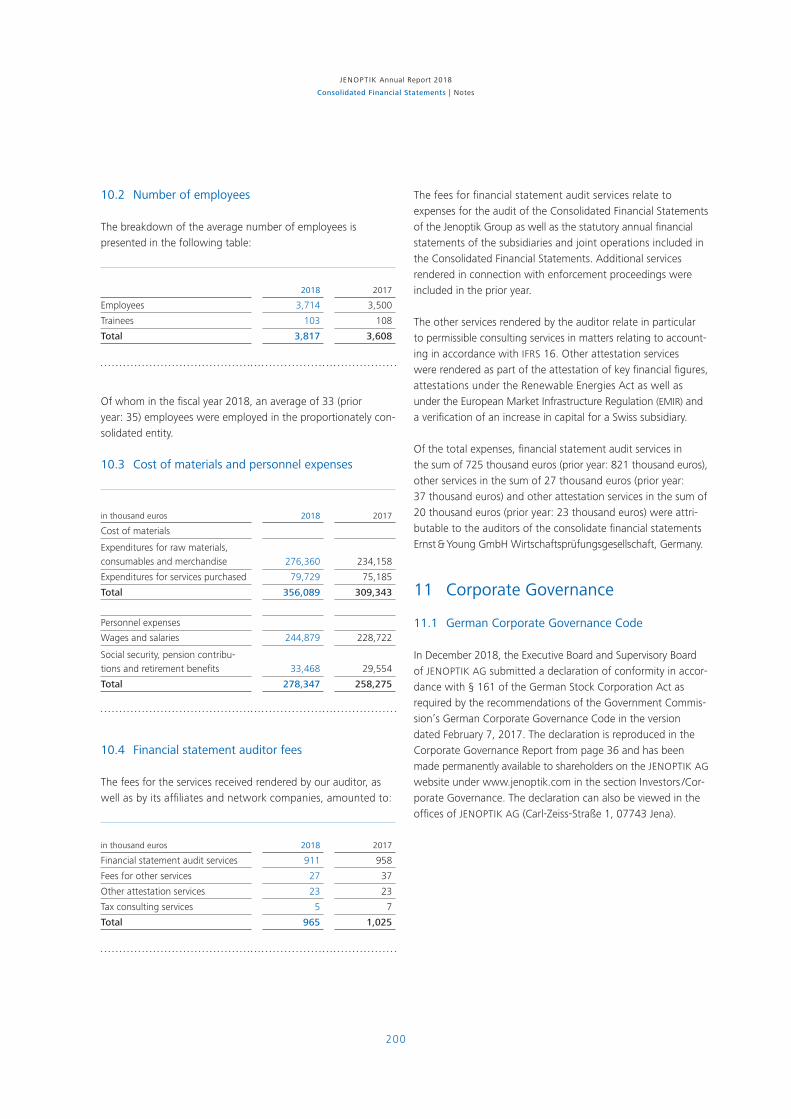
200
JENOPTIK Annual Report 2018
Consolidated Financial Statements | Notes
10.2 Number of employees
The breakdown of the average number of employees is
presented in the following table:
2018 2017
Employees 3,714 3,500
Trainees 103 108
Total 3,817 3,608
Of whom in the fiscal year 2018, an average of 33 (prior
year: 35) employees were employed in the proportionately con-
solidated entity.
10.3 Cost of materials and personnel expenses
in thousand euros 2018 2017
Cost of materials
Expenditures for raw materials, consumables and merchandise 276,360 234,158
Expenditures for services purchased 79,729 75,185
Total 356,089 309,343
Personnel expenses
Wages and salaries 244,879 228,722
Social security, pension contribu-tions and retirement benefits 33,468 29,554
Total 278,347 258,275
10.4 Financial statement auditor fees
The fees for the services received rendered by our auditor, as
well as by its affiliates and network companies, amounted to:
in thousand euros 2018 2017
Financial statement audit services 911 958
Fees for other services 27 37
Other attestation services 23 23
Tax consulting services 5 7
Total 965 1,025
The fees for financial statement audit services relate to
expenses for the audit of the Consolidated Financial Statements
of the Jenoptik Group as well as the statutory annual financial
statements of the subsidiaries and joint operations included in
the Consolidated Financial Statements. Additional services
rendered in connection with enforcement proceedings were
included in the prior year.
The other services rendered by the auditor relate in particular
to permissible consulting services in matters relating to account-
ing in accordance with IFRS 16. Other attestation services
were rendered as part of the attestation of key financial figures,
attestations under the Renewable Energies Act as well as
under the European Market Infrastructure Regulation (EMIR) and
a verification of an increase in capital for a Swiss subsidiary.
Of the total expenses, financial statement audit services in
the sum of 725 thousand euros (prior year: 821 thousand euros),
other services in the sum of 27 thousand euros (prior year:
37 thousand euros) and other attestation services in the sum of
20 thousand euros (prior year: 23 thousand euros) were attri-
butable to the auditors of the consolidate financial statements
Ernst & Young GmbH Wirtschaftsprüfungsgesellschaft, Germany.
11 Corporate Governance
11.1 German Corporate Governance Code
In December 2018, the Executive Board and Supervisory Board
of JENOPTIK AG submitted a declaration of conformity in accor-
dance with § 161 of the German Stock Corporation Act as
required by the recommendations of the Government Commis-
sion’s German Corporate Governance Code in the version
dated February 7, 2017. The declaration is reproduced in the
Corporate Governance Report from page 36 and has been
made permanently available to shareholders on the JENOPTIK AG
website under www.jenoptik.com in the section Investors /Cor-
porate Governance. The declaration can also be viewed in the
offices of JENOPTIK AG (Carl-Zeiss-Straße 1, 07743 Jena).

201
15 Management 35 Corporate Governance 133 Consolidated 207 Further69 Combined53 Non-financial Reporting Management Report Financial Statements Information
Consolidated Financial Statem
ents
133
206
134136137138140
Consolidated Statement of Comprehensive IncomeConsolidated Statement of Financial PositionConsolidated Statement of Cash FlowsStatement of Changes in EquityNotes
11.2 Executive Board
The following persons were appointed as members of the Exec-
utive Board in the 2018 fiscal year:
weitere Mandate bei:
Dr. Stefan Traeger President & CEO of JENOPTIK AG
JENOPTIK North America, Inc., US (GI; chairman, CCB)JENOPTIK (Shanghai) Precision Instrument and Equipment Co., Ltd; China (GI; chairman, CCB, since April 2018)JENOPTIK (Shanghai) International Trading Co., Ltd., China (GI, member CCB, since December 25, 2018)Prodomax Automation Ltd., Canada (GI, member CCB, since June 2018)JENOPTIK Korea Corp., Ltd., Korea (GI, member CCB, since July 2018)JENOPTIK JAPAN Co. Ltd., Japan (GI, member CCB, since March 2018)TELSTAR-HOMMEL Co., Ltd., Korea (GI, member CCB, since July 2018)
Hans-Dieter SchumacherMember of the Executive Board of JENOPTIK AG
Prodomax Automation Ltd., Canada (GI, member, CCB, since June 2018)JENOPTIK (Shanghai) Precision Instrument and Equipment Co., Ltd; China (GI, member CCB, since April 2018)JENOPTIK (Shanghai) International Trading Co., Ltd., China (GI, member CCB, since December 25, 2018)
Abbreviations: CCB Comparable controlling body, GI – Group internal appointment
The following overview shows the remuneration of the Executive
Board for the 2018 fiscal year. In addition to direct or indirect
remuneration components earned, this overview includes the fair
value of the share-based remuneration instruments (performance
shares). A detailed description of the remuneration system can
be found in the Remuneration Report on pages 45 of the Com-
bined Management Report in the chapter Corporate Governance.
Fringe benefits consist of contributions to the accident insur-
ance as well as the provision of company cars.
Retirement benefits were paid to former Executive Board mem-
bers in the sum of 181 thousand euros (prior year: 181 thousand
euros). As at the balance sheet date, the pension provisions
for former Executive Board members totaled 3,142 thousand
euros (prior year: 3,423 thousand euros). The expenses recorded
for these existing provisions in the 2018 fiscal year comprised
interest costs in the sum of 52 thousand euros (prior year:
51 thousand euros).
In 2018 bridging payments in the sum of 810 thousand euros
were paid to the former President and CEO Dr. Michael Mertin.
In the 2018 fiscal year – as in the preceding years – no loans or
advances were granted to the members of either the Executive
Board or the Supervisory Board. Consequently, there were no
loan redemption payments.
Dr. Stefan Traeger (President & CEO since
May 1, 2017)
Hans-Dieter Schumacher (Member of Executive Board)
in thousand euros 2018 2017 2018 2017
Fixed remuneration 600.0 400.0 437.5 400.0
Variable remuneration 521.7 200.0 347.8 235.3
LTI / performance shares of fiscal year – measured at fair value 324.3 266.7 243.2 235.3
Granted for protection of existing shares n. a. n. a. 14.7 9.9
Retirement benefits 200.0 116.7 160.0 160.0
Fringe benefits 15.0 9.8 18.3 13.8
Total remuneration 1,660.9 993.1 1,221.5 1,054.4
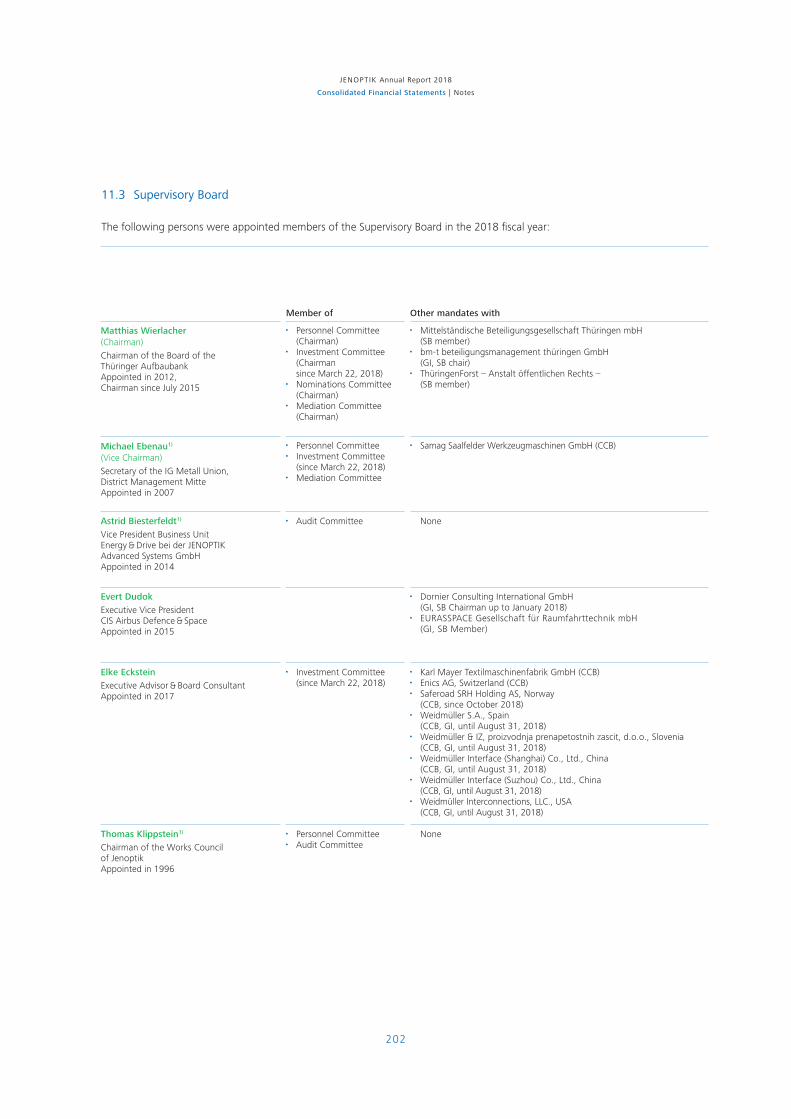
202
JENOPTIK Annual Report 2018
Consolidated Financial Statements | Notes
11.3 Supervisory Board
The following persons were appointed members of the Supervisory Board in the 2018 fiscal year:
Member of Other mandates with
Matthias Wierlacher(Chairman)
Chairman of the Board of the Thüringer AufbaubankAppointed in 2012, Chairman since July 2015
Personnel Committee (Chairman)
Investment Committee (Chairman since March 22, 2018)
Nominations Committee (Chairman)
Mediation Committee (Chairman)
Mittelständische Beteiligungsgesellschaft Thüringen mbH (SB member)
bm-t beteiligungsmanagement thüringen GmbH (GI, SB chair)
ThüringenForst – Anstalt öffentlichen Rechts – (SB member)
Michael Ebenau1)
(Vice Chairman)
Secretary of the IG Metall Union, District Management MitteAppointed in 2007
Personnel Committee Investment Committee
(since March 22, 2018) Mediation Committee
Samag Saalfelder Werkzeugmaschinen GmbH (CCB)
Astrid Biesterfeldt1)
Vice President Business Unit Energy & Drive bei der JENOPTIK Advanced Systems GmbHAppointed in 2014
Audit Committee None
Evert Dudok
Executive Vice President CIS Airbus Defence & SpaceAppointed in 2015
Dornier Consulting International GmbH (GI, SB Chairman up to January 2018)
EURASSPACE Gesellschaft für Raumfahrttechnik mbH (GI, SB Member)
Elke Eckstein
Executive Advisor & Board ConsultantAppointed in 2017
Investment Committee (since March 22, 2018)
Karl Mayer Textilmaschinenfabrik GmbH (CCB) Enics AG, Switzerland (CCB) Saferoad SRH Holding AS, Norway
(CCB, since October 2018) Weidmüller S.A., Spain
(CCB, GI, until August 31, 2018) Weidmüller & IZ, proizvodnja prenapetostnih zascit, d.o.o., Slovenia (CCB, GI, until August 31, 2018) Weidmüller Interface (Shanghai) Co., Ltd., China (CCB, GI, until August 31, 2018) Weidmüller Interface (Suzhou) Co., Ltd., China
(CCB, GI, until August 31, 2018) Weidmüller Interconnections, LLC., USA
(CCB, GI, until August 31, 2018)
Thomas Klippstein1)
Chairman of the Works Council of Jenoptik Appointed in 1996
Personnel Committee Audit Committee
None
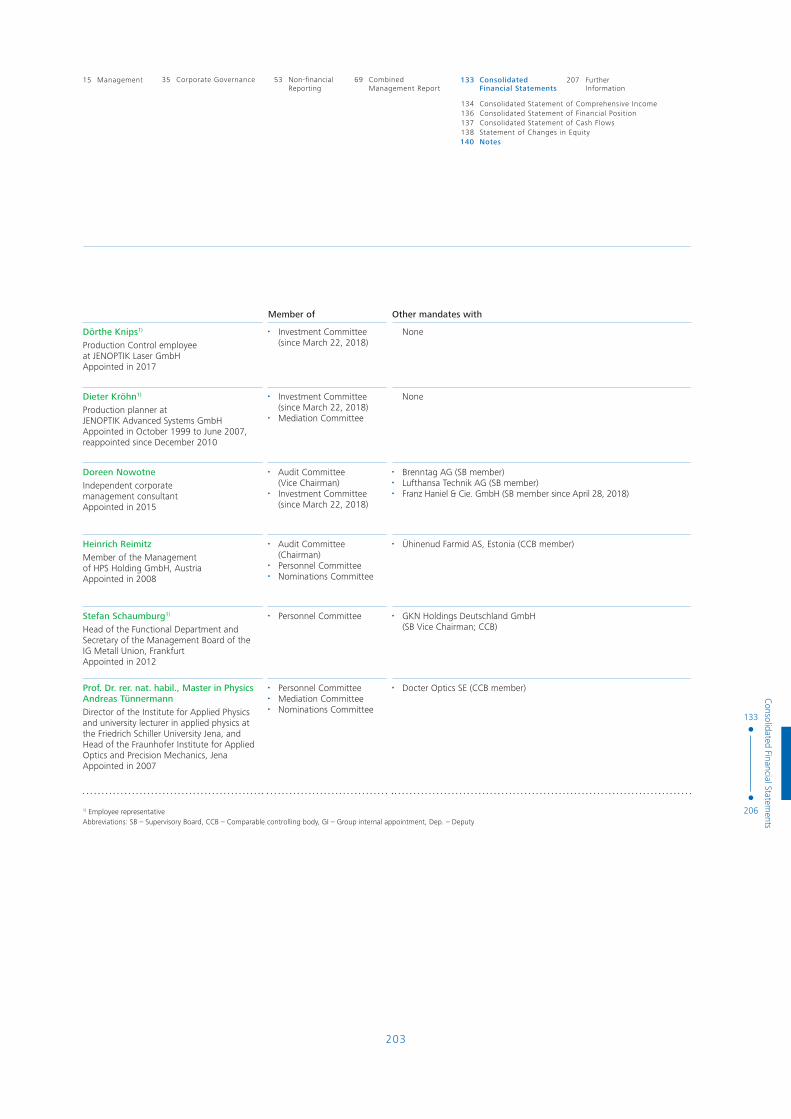
203
15 Management 35 Corporate Governance 133 Consolidated 207 Further69 Combined53 Non-financial Reporting Management Report Financial Statements Information
Consolidated Financial Statem
ents
133
206
134136137138140
Consolidated Statement of Comprehensive IncomeConsolidated Statement of Financial PositionConsolidated Statement of Cash FlowsStatement of Changes in EquityNotes
Member of Other mandates with
Dörthe Knips1)
Production Control employee at JENOPTIK Laser GmbHAppointed in 2017
Investment Committee (since March 22, 2018)
None
Dieter Kröhn1)
Production planner at JENOPTIK Advanced Systems GmbHAppointed in October 1999 to June 2007, reappointed since December 2010
Investment Committee (since March 22, 2018) Mediation Committee
None
Doreen Nowotne
Independent corporate management consultantAppointed in 2015
Audit Committee (Vice Chairman) Investment Committee (since March 22, 2018)
Brenntag AG (SB member) Lufthansa Technik AG (SB member) Franz Haniel & Cie. GmbH (SB member since April 28, 2018)
Heinrich Reimitz
Member of the Management of HPS Holding GmbH, AustriaAppointed in 2008
Audit Committee (Chairman) Personnel Committee Nominations Committee
Ühinenud Farmid AS, Estonia (CCB member)
Stefan Schaumburg1)
Head of the Functional Department and Secretary of the Management Board of the IG Metall Union, FrankfurtAppointed in 2012
Personnel Committee GKN Holdings Deutschland GmbH (SB Vice Chairman; CCB)
Prof. Dr. rer. nat. habil., Master in Physics Andreas Tünnermann
Director of the Institute for Applied Physics and university lecturer in applied physics at the Friedrich Schiller University Jena, and Head of the Fraunhofer Institute for Applied Optics and Precision Mechanics, JenaAppointed in 2007
Personnel Committee Mediation Committee Nominations Committee
Docter Optics SE (CCB member)
1) Employee representativeAbbreviations: SB – Supervisory Board, CCB – Comparable controlling body, GI – Group internal appointment, Dep. – Deputy

204
JENOPTIK Annual Report 2018
Consolidated Financial Statements | Notes
Supervisory Board remuneration
For the 2018 fiscal year the members of the Supervisory Board received the following remuneration in total:
of which
in thousand euros Total earningsFixed annual
remuneration 2018
Meeting allowances (plus reimbursement
of expenses) Sales tax ¹)
Matthias Wierlacher (Chairman) 126.9 116.4 10.5 20.3
Michael Ebenau (Vice Chairman) 91.5 82.0 9.5 14.6
Astrid Biesterfeldt 71.6 59.5 12.1 11.4
Evert Dudok 54.4 47.6 6.8 8.7
Elke Eckstein 60.8 52.2 8.5 9.7
Thomas Klippstein 79.7 65.4 14.3 12.7
Dörthe Knips 60.6 52.2 8.3 9.7
Dieter Kröhn 60.6 52.2 8.3 9.7
Doreen Nowotne 84.8 70.1 14.7 13.5
Heinrich Reimitz 82.1 65.0 17.1 –
Stefan Schaumburg 60.6 53.6 7.0 9.7
Prof. Dr. rer. nat. habil. Andreas Tünnermann 61.7 53.6 8.1 9.8
Total 895.4 769.9 125.5 129.9
¹) Included in total remuneration, fixed remuneration and meeting allowances; Mr. Mag. Heinrich Reimitz has a limited tax liability in Germany due to his place of residence being abroad; since his remuneration is subject to a withholding tax in accordance with § 50 a (1) No. 4 of the German Income Tax Act, no sales tax was incurred.
For a more detailed explanation of the Supervisory Board re-
muneration system we refer to the chapter on Corporate Gover-
nance in the Remuneration Report which forms part of the
Combined Management Report.
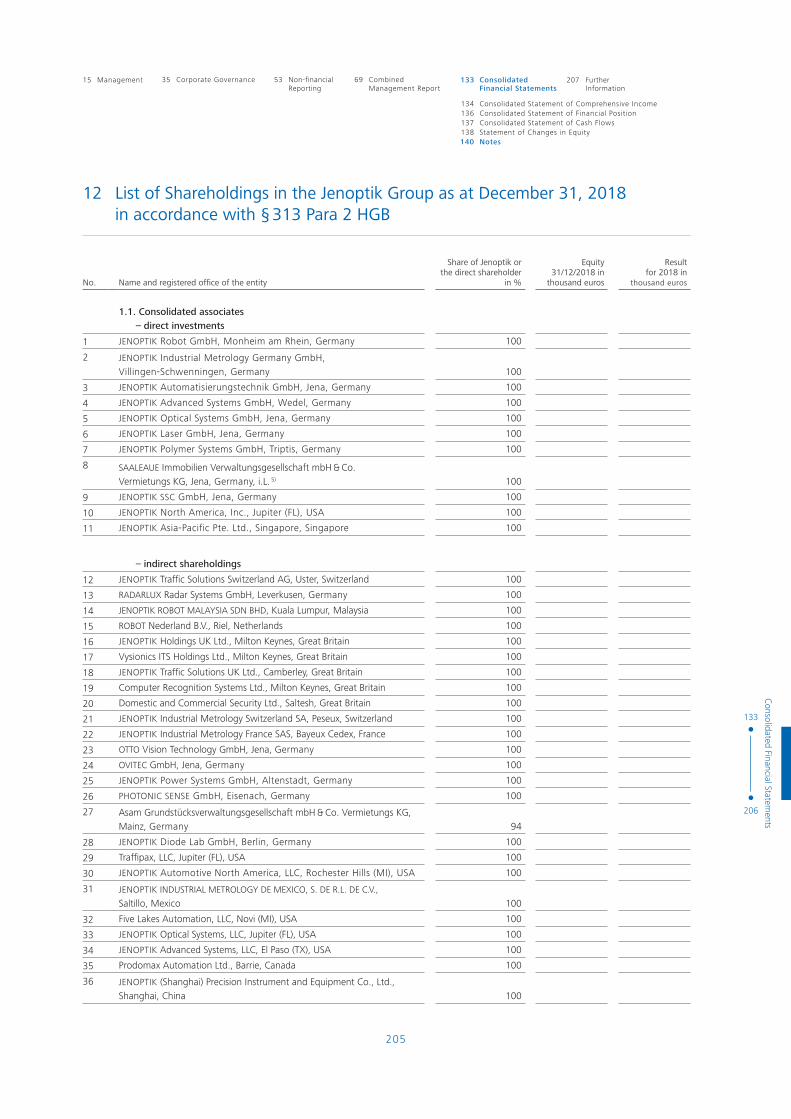
205
15 Management 35 Corporate Governance 133 Consolidated 207 Further69 Combined53 Non-financial Reporting Management Report Financial Statements Information
Consolidated Financial Statem
ents
133
206
134136137138140
Consolidated Statement of Comprehensive IncomeConsolidated Statement of Financial PositionConsolidated Statement of Cash FlowsStatement of Changes in EquityNotes
No. Name and registered office of the entity
Share of Jenoptik or the direct shareholder
in %
Equity 31/12/2018 in
thousand euros
Result for 2018 in
thousand euros
1.1. Consolidated associates – direct investments
1 JENOPTIK Robot GmbH, Monheim am Rhein, Germany 100
2 JENOPTIK Industrial Metrology Germany GmbH, Villingen-Schwenningen, Germany 100
3 JENOPTIK Automatisierungstechnik GmbH, Jena, Germany 100
4 JENOPTIK Advanced Systems GmbH, Wedel, Germany 100
5 JENOPTIK Optical Systems GmbH, Jena, Germany 100
6 JENOPTIK Laser GmbH, Jena, Germany 100
7 JENOPTIK Polymer Systems GmbH, Triptis, Germany 100
8 SAALEAUE Immobilien Verwaltungsgesellschaft mbH & Co. Vermietungs KG, Jena, Germany, i.L. 5) 100
9 JENOPTIK SSC GmbH, Jena, Germany 100
10 JENOPTIK North America, Inc., Jupiter (FL), USA 100
11 JENOPTIK Asia-Pacific Pte. Ltd., Singapore, Singapore 100
– indirect shareholdings
12 JENOPTIK Traffic Solutions Switzerland AG, Uster, Switzerland 100
13 RADARLUX Radar Systems GmbH, Leverkusen, Germany 100
14 JENOPTIK ROBOT MALAYSIA SDN BHD, Kuala Lumpur, Malaysia 100
15 ROBOT Nederland B.V., Riel, Netherlands 100
16 JENOPTIK Holdings UK Ltd., Milton Keynes, Great Britain 100
17 Vysionics ITS Holdings Ltd., Milton Keynes, Great Britain 100
18 JENOPTIK Traffic Solutions UK Ltd., Camberley, Great Britain 100
19 Computer Recognition Systems Ltd., Milton Keynes, Great Britain 100
20 Domestic and Commercial Security Ltd., Saltesh, Great Britain 100
21 JENOPTIK Industrial Metrology Switzerland SA, Peseux, Switzerland 100
22 JENOPTIK Industrial Metrology France SAS, Bayeux Cedex, France 100
23 OTTO Vision Technology GmbH, Jena, Germany 100
24 OVITEC GmbH, Jena, Germany 100
25 JENOPTIK Power Systems GmbH, Altenstadt, Germany 100
26 PHOTONIC SENSE GmbH, Eisenach, Germany 100
27 Asam Grundstücksverwaltungsgesellschaft mbH & Co. Vermietungs KG, Mainz, Germany 94
28 JENOPTIK Diode Lab GmbH, Berlin, Germany 100
29 Traffipax, LLC, Jupiter (FL), USA 100
30 JENOPTIK Automotive North America, LLC, Rochester Hills (MI), USA 100
31 JENOPTIK INDUSTRIAL METROLOGY DE MEXICO, S. DE R.L. DE C.V., Saltillo, Mexico 100
32 Five Lakes Automation, LLC, Novi (MI), USA 100
33 JENOPTIK Optical Systems, LLC, Jupiter (FL), USA 100
34 JENOPTIK Advanced Systems, LLC, El Paso (TX), USA 100
35 Prodomax Automation Ltd., Barrie, Canada 100
36 JENOPTIK (Shanghai) Precision Instrument and Equipment Co., Ltd., Shanghai, China 100
12 List of Shareholdings in the Jenoptik Group as at December 31, 2018 in accordance with § 313 Para 2 HGB
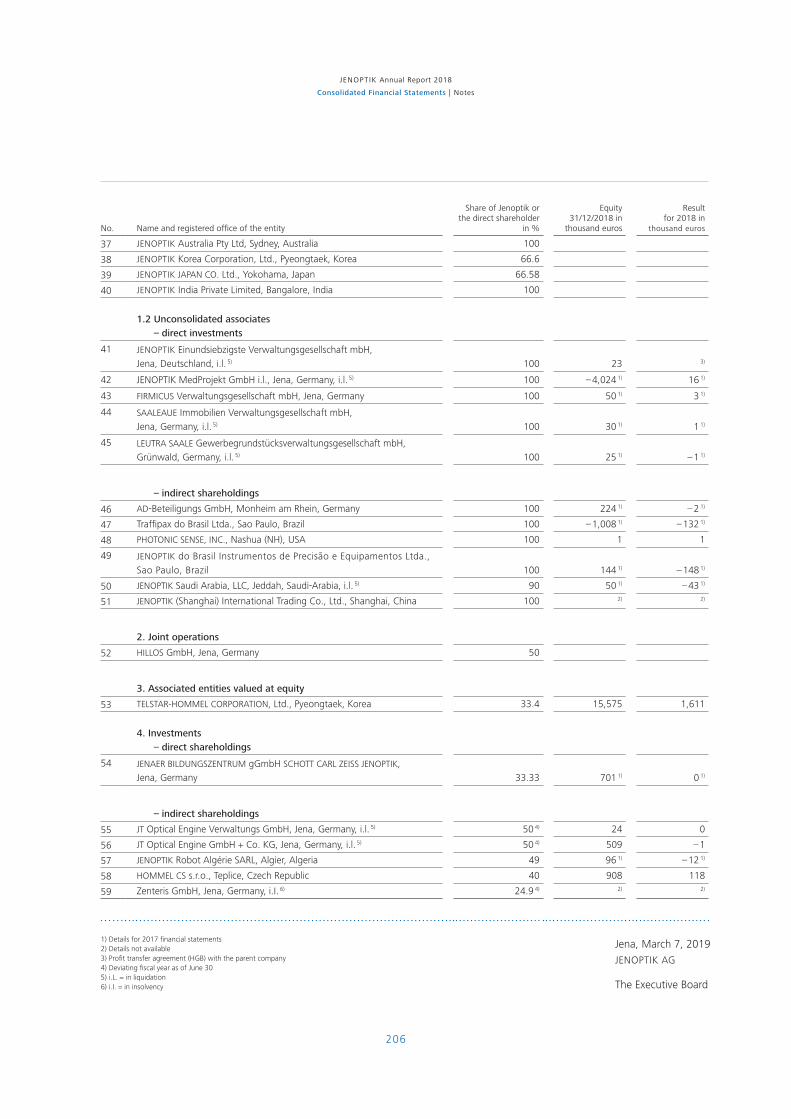
206
JENOPTIK Annual Report 2018
Consolidated Financial Statements | Notes
Jena, March 7, 2019
JENOPTIK AG
The Executive Board
No. Name and registered office of the entity
Share of Jenoptik or the direct shareholder
in %
Equity 31/12/2018 in
thousand euros
Result for 2018 in
thousand euros
37 JENOPTIK Australia Pty Ltd, Sydney, Australia 100
38 JENOPTIK Korea Corporation, Ltd., Pyeongtaek, Korea 66.6
39 JENOPTIK JAPAN CO. Ltd., Yokohama, Japan 66.58
40 JENOPTIK India Private Limited, Bangalore, India 100
1.2 Unconsolidated associates – direct investments
41 JENOPTIK Einundsiebzigste Verwaltungsgesellschaft mbH, Jena, Deutschland, i.l. 5) 100 23 3)
42 JENOPTIK MedProjekt GmbH i.l., Jena, Germany, i.l. 5) 100 – 4,024 1) 16 1)
43 FIRMICUS Verwaltungsgesellschaft mbH, Jena, Germany 100 50 1) 3 1)
44 SAALEAUE Immobilien Verwaltungsgesellschaft mbH, Jena, Germany, i.l. 5) 100 30 1) 1 1)
45 LEUTRA SAALE Gewerbegrundstücksverwaltungsgesellschaft mbH, Grünwald, Germany, i.l. 5) 100 25 1) – 1 1)
– indirect shareholdings
46 AD-Beteiligungs GmbH, Monheim am Rhein, Germany 100 224 1) – 2 1)
47 Traffipax do Brasil Ltda., Sao Paulo, Brazil 100 – 1,008 1) – 132 1)
48 PHOTONIC SENSE, INC., Nashua (NH), USA 100 1 1
49 JENOPTIK do Brasil Instrumentos de Precisão e Equipamentos Ltda., Sao Paulo, Brazil 100 144 1) – 148 1)
50 JENOPTIK Saudi Arabia, LLC, Jeddah, Saudi-Arabia, i.l. 5) 90 50 1) – 43 1)
51 JENOPTIK (Shanghai) International Trading Co., Ltd., Shanghai, China 100 2) 2)
2. Joint operations
52 HILLOS GmbH, Jena, Germany 50
3. Associated entities valued at equity
53 TELSTAR-HOMMEL CORPORATION, Ltd., Pyeongtaek, Korea 33.4 15,575 1,611
4. Investments – direct shareholdings
54 JENAER BILDUNGSZENTRUM gGmbH SCHOTT CARL ZEISS JENOPTIK, Jena, Germany 33.33 701 1) 0 1)
– indirect shareholdings
55 JT Optical Engine Verwaltungs GmbH, Jena, Germany, i.l. 5) 50 4) 24 0
56 JT Optical Engine GmbH + Co. KG, Jena, Germany, i.l. 5) 50 4) 509 – 1
57 JENOPTIK Robot Algérie SARL, Algier, Algeria 49 96 1) – 12 1)
58 HOMMEL CS s.r.o., Teplice, Czech Republic 40 908 118
59 Zenteris GmbH, Jena, Germany, i.I. 6) 24.9 4) 2) 2)
1) Details for 2017 financial statements2) Details not available3) Profit transfer agreement (HGB) with the parent company4) Deviating fiscal year as of June 305) i.L. = in liquidation6) i.I. = in insolvency


