

1
IN VIVO ASSESSMENT OF FOCAL ADHESION
KINASE (FAK) ACTIVITY IN BREAST CANCER
CELLS USING FLUORESCENCE RESONANCE
ENERGY TRANSFER(FRET) SENSOR AND
CONFOCAL LASER SCANNING
MICROSCOPE (CLSM)
MASTER'S THESIS PROJECT IN BIOMEDICINE
MARCH 2015 TO SEPTEMBER 2015(30ECTS)
Sujithera Haridoss
Supervisor
Wolfgang Schreibmayer
Examiner
Sandra Karlsson

2
ABSTRACT
Focal Adhesion Kinase (FAK) is essential for cell migration and plays an important role in
tumor metastasis. However, the complex intermolecular and intramolecular interactions that
regulate FAK activity at the focal adhesion remain unresolved. We have engineered a toolbox
of Fluorescence Resonance Energy Transfer (FRET) sensors for the assessment of FAK
activity in human breast cancer cells (MCF-7). Major activity of cancerous cells is drastically
growth of the cell in an uncontrollable manner in such cases our human anatomy system
normally consists of cell growth activity. The important protein involved in cell functionality
in the human body is FAK , due to FAK activity, cell motility, proliferation, survival has
been managed in the human body hence, it is necessary to investigate the performance of
FAK activity on breast cancer becomes important.
In our study, the differences in bleed through between zoom = 1 and for zoom >1 for donor
and acceptor was evaluated. There were no significant differences in Pearson correlation
coefficient and bleed through coefficient for both the zooms. With recent advances in
fluorescent probes, instrumentation and methodologies, FRET is sure to revolutionize
scientific research in the near future.
TABLE OF CONTENTS
ABSTRACT........................................................................................................................... [1]
TABLE OF CONTENTS....................................................................................................... [2]
LIST OF ABBREVIATIONS..............................................................................................[3,4]
1. INTRODUCTION .............................................................................................................[5]
1.1 FOCAL ADHESIONS.................................................................................................... [5]
1.2 FOCAL ADHESION KINASE.................................................................................... [6]
1.3 BIOSENSOR................................................................................................................. [6]
1.4 FRET............................................................................................................................... [6]
1.5 3CUBE FRET AND BIOLOGICAL MATERIAL....................................................... [7,8]
2. AIM AND OBJECTIVES OF THE STUDY....................................................................[7]

3
3. MATERIALS AND METHODS..................................................................................... [8]
3.1 DNA CONSTRUCTION............................................................................................... [8]
3.2 CELL CULTURE AND REAGENTS......................................................................... [8]
3.3 TRANSFECTION......................................................................................................... [8]
3.4 IMAGE ACQUISITION AND CLSM.......................................................................... [9]
3.5 IMAGE ANALYSIS WITH IMAGEJ SOFTWARE.................................................... [9]
4. RESULTS........................................................................................................................ [10]
4.1 CALIBRATION OF 3 CUBES FRET................................................................... [10-22]
4.2. FRET ANALYSIS................................................................................................. [22-23]
5. DISCUSSIONS............................................................................................................[23-25]
6. ETHICAL ASPECTS AND IMPACT OF RESEARCH ON THE SOCIETY.............. [25]
7. CONCLUSION .................................................................................................................26]
8. ACKNOWLEDGEMENT................................................................................................ [26]
9. REFERENCES........................................................................................................ [27,28]
LIST OF ABBREVIATIONS
MCF7 – Michigan Cancer Foundation 7
FAS - Focal Adhesion site
FAK - Focal Adhesion Kinase
CLSM - Confocal Laser Scanning Microscope
BT - Bleeding Through
FRET- Fluorescence Resonance Energy Transfer
FP - Fluorescent Proteins
LUT - Look Up Tables
4
YFP - Yellow Fluorescent Protein
CFP - Cyan Fluorescent Protein
CYTO FAK – Cytosolic Focal Adhesion Kinase
1. INTRODUCTION
Developments in fluorescence microscopy have enabled the study of membrane diffusion,
signal transduction and cell adhesion at the molecular level in living cells grown in culture.
Progresses in optical microscopy have produced a diversity of approaches suitable for the
study of protein changing aspects in cultured cells. This has been accelerated by the
improvement of fluorescent proteins (FPs), which allow not only selective labeling and
localization of virtually any protein, but also permit engineering of functional probes that
report on the activity of signaling molecules such as kinases [Su Hao Lo, 2006] and GTPases
[Adid.Dubash et al .,2009].

5
Cell migration, both single and collective, is a vastly unified multistep process that is
important in tissue homeostasis, embryonic morphogenesis and immune surveillance.While
collective migration requires the movement of cohesive groups of cells [Burridge,K et al.,
1988], the single migrating cell is highly polarized with complex regulatory pathways that are
spatiotemporally controlled [DavidD.Schlaepfer et al.,1994]. Migration contributes to several
important pathological processes, including cancer progression and metastasis formation.
Fluoroscence resonance energy transfer (FRET) involves the excitation of a donor
fluorophore by incident light within its absorption spectrum. This radiative absorption
elevates the donor fluorophore to a higher-energy excited state that would normally decay
(return to the ground state) radiatively with a characteristic emission spectrum. If another
fluorophore molecule (the acceptor) exists in proximity to the donor with its energy state
characterized by an absorption spectrum that overlaps the emission spectrum of the donor,
then the possibility of non-radiative energy transfer between donor and acceptor exists.
Using a mathematical linear regression analysis, a graph can be plotted keeping donor
channel as an independent variable (x- axis) and FRET channel as dependent variable (y-
axis). The graph plots a point for each pixel with donor channel intensity and its
corresponding fret channel intensity. A linear regression and standard error from the
predicted value of regression can be calculated, thus, predicting the FRET channel from the
donor channel pixel intensities.
1.1. FOCAL ADHESIONS
Focal adhesions are major sites of interaction between a cell and its extracellular matrix
environment Thus outside mechanical signals can be sensed at FAs through transmembrane
receptors, such as integrin. Focal adhesions were first discovered via electron microscopy by
Abercrombie et al.(1970) as electron-dense regions of the plasma membrane that make
intimate contact with the substratum in cultured cells[Abercrombie M et al.,1970]. Physical
interaction between the cells and outside extracellular matrix (ECM) is achieved through
transmembrane integrins[JihyeSeong et al.,2011]. Integrin’s are heterodimer receptors
containing α and β subunits, they function as transmembrane linkers (or integrators),
mediating the interaction between the cytoskeleton and the extracellular matrix that are
required for the cell to grip the matrix. When Focal adhesion are bound to the ECM, the

6
transmembrane integrin receptor can recruit signaling proteins and structural proteins such as
Src, focal adhesion kinase integrin linked kinase(ILK).Focal adhesions play critical role in
the maintenance of cell attachment, cell shape, proliferation, , migration, differentiation,
death and gene expression[Soule.H.D at al.,1973].
1.2. FOCAL ADHESION KINASE
Focal adhesion kinase is a cytoplasmic tyrosine kinase that plays critical roles in integrin-
mediated signal transduction. FAK, integrates signals from integrin and growth factor
receptors to regulate cellular responses. FAK localizes at focal adhesions upon integrin
clustering to regulate cell adhesion, migration, and mechanotransduction. FAK is
phosphorylated in response to integrin engagement, growth factor stimulation and the action
of mitogenic neuropeptides [Marc Thiriet,2012].In response to growth factors FAK regulates
cell migration and proliferation in the integrin mediated signaling cascades.FAK plays a
critical role in regulating cell migration, adhesion, spreading, reorganization of the actin
cytoskeleton, formation and disassembly of focal adhesions and cell cycle progression, cell
protrusions, cell proliferation and apoptosis [Martin Alexander Schwartz et al.,2001]. To
visualize subcellular molecular event in live cells, genetically encoded biosensors based on
fluorescent proteins (FPs) and Fluorescence Resonance Energy Transfer (FRET) were
developed.
1.3. BIOSENSORS
FRET biosensors are genetically engineered proteins containing two fluorescent protein
sequences, suitable to investigate the molecular regulations in living cells. Two particular
types of FRET sensor have been used in this study. The Lyn- FAK biosensor allows for the
visualization of activity of the membrane bound fraction of FAK localized to detergent
resistant lipid rafts, whereas Cyto-FAK allows for the visualization of activity of soluble
FAK localized to the cytosol.
1.4. FRET
FRET is a physical process by which energy is transferred from an excited fluorophore, the
donor, to an acceptor fluorophores without radiation. As a result the emission of the excited
donor is diminished (as part of the energy is transferred to the acceptor) and the emission of
the acceptor gets enhanced [Forster, T,1965]. A fluorophores is a chemical compound that
absorbs light energy at a specific wavelength and re-emits the energy absorbed upon
excitation in the form of fluorescence(light). The absorbed wavelength, energy transfer

7
efficiency and time before emission depend on both the fluorophore structure and its
chemical environment. FRET technique is widely used by biologists who study the
interaction between two proteins inside cells by expressing one of the proteins of interest
fused to a donor fluorophores and the other protein fused to the adequate acceptor
fluorophore. Measuring FRET between two interactive proteins is noninvasive. The emission
of the acceptor fluorophore, due to the FRET from the donor, is measured in the so-called
FRET channel.
1.5. 3CUBE FRET AND BIOLOGICAL MATERIAL
To measure the FRET index, 3 types of treatment (i.e. cells expressing different constructs)
are acquired at each confocal microscope session. (a)One treatment where cells express only
the donor fluorophore(eg:eCFP) on order to evaluate the donor bleed through
coefficient.(b)one treatment with cells expressing the acceptor fluorophores(eg:eYFP)only, in
order to evaluate the acceptor bleed through coefficient, i.e. the (c)one sample with cells co-
expressing the two fluorophores in which FRET signals will be measured. A common
combination of fluorophores for studying protein-protein interaction in cell of interest is Cyan
Fluorescent protein(eg:eCFP) and Yellow Fluorescent Protein (YFP) as donor acceptor
pair.In the Donor channel Image , the Donor have been emitted upon excitation of the donor .
For CFP, excitation was achieved at short wavelength (458nm) and emission detected
between 477-500nm. In the acceptor channel image(denoted “A” subsequently), the light
emitted by the acceptor have been emitted upon excitation of the acceptor. For YFP, the
excitation with long wavelength 514nm and emission between 540nm-570nm. In the FRET
channel Image, For CFP/YFP pairs: excitation with wavelength 458nm end emission
wavelength between 540nm-570nm was maintained. During the acquisition period and the
collection of the image for the FRET analysis the Channel settings and the PMTs settings was
maintained same, the argon - laser lines are adjusted to get the maximal dynamics.
In a FRET system, the emission wavelength of a fluorophore known as donor, excites another
fluorophore at proximity known as acceptor. Thus, in FRET channel the excites in the donor
wavelength and records the emission in acceptor wavelength. This can occur only when the
emission wavelength of donor is equal to the excitation wavelength of the acceptor and the
two fluorophores are in proximity. This sort of interactions between a pair of fluorophores
open an exciting opportunity in understanding the interaction between two proteins of interest
in molecular level by incorporating donor and acceptor fluorophores in each protein. One of

8
the demerits of FRET is the false positive in FRET which occurs due to two reasons: Donor
bleed through and acceptor bleed through. Due to broader and overlapping peaks during
emission of donor and excitation of acceptor fluorophores, there are probability of emission
or leakage of donor in FRET channel known as donor bleed through and direct excitation of
acceptor in FRET channel known as acceptor bleed through. Due to either of these, there are
chances of getting a false positive values in FRET channel. Hence, the calibration of donor,
acceptor and FRET channel can aid in reduction of false positive values. This can be
achieved by calculating the bleed through values of the pair of fluorophores and subtracting
them from the raw FRET images.
Using a mathematical linear regression analysis, a graph can be plotted keeping donor
channel as an independent variable (x- axis) and FRET channel as dependent variable (y-
axis). The graph plots a point for each pixel with donor channel intensity and its
corresponding fret channel intensity. A linear regression and standard error from the
predicted value of regression can be calculated, thus, predicting the FRET channel from the
donor channel pixel intensities.
2. AIM AND OBJECTIVES OF THE STUDY
To study the in vivo assessment of FAK activity in breast cancer cells using FRET sensor
and CLSM.
To visualize subcellular molecular event in live cells, genetically encoded biosensors
based on fluorescent proteins (FPs) and Fluorescence resonance energy transfer (FRET)
were developed.
3. MATERIALS AND METHODS
In this study, we systematically developedand characterized several highly sensitive
and specific biosensorsCyan Fluorescent Protein (eCFP) and Yellow Fluorescent
Protein (eYFP) based on Fluorescence Resonant Energy Transfer (FRET)
forvisualizing Human Mammary cancer cells (MCF-7) activity in live cells.
To adapt the FRET measurements, images were collected by a Confocal Laser
Scanning Microscope (CLSM) and the images were analyzed by using free Software
ImageJ (1.47v).

9
3.1 DNA CONSTRUCTION
The plasmid DNA was prepared according to PerfectPrepTM
Endofree Maxi Kit Manual from
5 PRIME.
3.2. REAGENTS
Human Mammary cancer Cell lines were purchased from the American Type Culture
Collection(ATCC, Manassas, VA) and cultured at 35°C and 5% CO2.Human Mammary
cancer cells (MCF-7) were cultured to ~80% confluence in T-75-cm2
Flasks. Cells were
maintained in Dulbecco’s modified Eagle’s Medium (DMEM) supplemented with 10% Fetal
bovine serum(FBS), 2 mmole/ L-Glutamine , 1 Unit ml-1
Pencillin, 100 µg ml-1
Streptomycin
and 1mMmole/L of sodium pyruvate. Cell culture reagents were purchased from GIBCO
BRL and SIGMA. Cells were cultured in a humidified 95% air, 5%CO2 incubator at
37°C.Medium was replenished 3 times weekly (50-90%) in cultures that had not been
transferred weekly. For cells transferred weekly medium was replaced on days 3 and 6.
Trypsin EDTA (Sigma Aldrich) of 0.25% for 10mins was used for transferring cultures. Free
floating passages were initiated by centrifuging the cells at 500 rpm for 5mins, the
supernatant was removed and cells were resuspended with Medium [Gu, Y.H et al.,2006].
3.3. TRANSFECTION
The MCF-7 DNA was transfected in a 24 well plate(ROTH). The day before transfection, the
cells were trypsinized and counted. About 4 x 10⁴ cells were plated per well in 0.5 ml of
complete growth medium. Cell density was maintained between 50~80% confluent on the
day of transfection.3 glass coverslip(Therma scientific) of each 6×6mm diameter was given
in each well. 9µl Transfast(Pro-omega), 3µg DNA, 700µl MEM was thawed, mixed together,
vortexes and kept at 10-15mins at room temperature. Medium was changed after 24hrs -
48hrs of transfection. Cells that were cultured on coverslip was mounted onto confocal
microscope slides along with CO2independent medium containing 0.5% FBS(Sigma) at 37°C
to acquire images for analysis.
3.4. IMAGE ACQUISITION BY CLSM
To adapt the FRET measurements, images were collected by a Confocal Laser Scanning
Microscope (CLSM) and the images were analyzed by using free Software ImageJ (1.47v).
The freely available ImageJ Plug-in called FRET and Colocalization Analyser includes

10
several steps of image analysis controls before and after computation of the FRET Index
Image. The False FRET images are eliminated since the FRET images are displayed
according to the colocalization of the pair of the fluorophores. In this study we have also
described our image treatment to evaluate donor and acceptor BTs, then the plug-in and
finally our data analysis.
Cells were observed with an inverted microscope (Leica) and a laser scanning confocal
imaging system (Leica microsystem) using a HCX PL APO CS 63× 1.2W CORR objective.
Electronic zoom was set to 3, the pinhole was 1.00 array and the resulting pixel size was
0.154µm.eYFP was excited with the 514nm laser-line of the Argon Laser and detected and
amplified by one photomultiplier tube(PMT1) in the so-called eYFP channel from 540-
570nm. eCFP was excited with the 458nm laser-line of the Argon laser, detected and
amplified by a second photomultiplier tube(PMT2) in the so-called eCFP channel from 477-
500nm. For analysis consecutive set of images were obtained to get the average of images
without noise ratio.
3.5. IMAGE ANALYSIS WITH IMAGEJ SOFTWARE
ImageJ version 1.47v for windows was obtained from the NIH (National Institute of
Health)website.Various number of tools were used in this software.
The mathematical functions applied on one image can be performed by
“process/Math/Add/subtract…”
The images are edited cut, copy, copy to the system by using “EDIT”.
The Look up tables (LUT) were chosen using “Image /Look up tables…” the color of
the images are changed using this option.
The type of the images are changed using “Image/type”
The tool “Analyse/plot profile” was used to visualize the profile of the pixel intension
sities along a linear selection in the images.
To evaluate the Bleed Through (BT) of the Donor , the total number of control images
should be entered , the donor channel image and the FRET channel Image from the
same image should be chosen .the regression control image and the regression graph
are obtained for the same image . the resulted regression graph indicates the pixel on
the image that follows linear regression function used to calculate the Bleed-through
parameter and of the pixels that are divergent from the equation.
11
The similar step is followed to Evaluate Acceptor BT, by choosing acceptor channel
image and FRET channel image.
The regression graph along with the regression control image allows the user to
decide whether the Bleed-Through coefficient is indeed correctly defined by the linear
equation that is given in the <<Results>> text file
4.RESULTS
4.1.CALIBRATION OF 3 CUBE FRET
FRET measurements in living cells using “three-cube FRET” fluorescence microscopy has
become increasingly popular as the method is fast, simple, non-destructive and requires only
a standard fluorescence imaging microscope. With this method, images are acquired using
three different fluorescence filter cubes: (1).the donor channel (IDD, donor excitation and
emission), (2).the FRET channel (IDA, donor excitation, acceptor emission), and (3). the
acceptor channel (IAA, acceptor excitation and emission). Because of spectral overlap
between donor and acceptor fluorescent proteins (FP), procedures are used to isolate the
donor (Idd), sensitized acceptor (Fc, i.e., fraction of IDA resulting from FRET) and direct
acceptor (Iaa) fluorescence intensities from the uncorrected intensity images (IDD, IDA and
IAA).
4.1.1.DONOR BLEED THROUGH CALIBRATION
FRET and Colocalization analyser plug-in was used to calculate the donor and acceptor bleed
through calibration. For donor bleed through evaluations, both donor channel (D) and FRET
channel (F) images of the cells expressing only the donor fluorophore (d) was obtained (Dd
and FD respectively). Images were acquired at zoom = 1 and at zoom > 1 (Figures 2A and
4A, digital zoom function of the CLSM). Fluorescence intensity values (ΔF, in arbitrary units
were assessed for individual pixels. ΔFDdvsΔFFd values were plotted to obtain a linear
regression function according to the following equation.
ΔFFd = a.ΔFDd+ b
By linear regression four different parameters were obtained from each individual set of
images (i) the donor bleed through coefficient a (a=ΔΔFFd / ΔΔFDd),(ii) the values of
ΔFFdatΔFDd=0 (b;interseption ), (iii) pearson correlation coefficient of the regression (r) and
(iv) the standard error (SEM) in the estimation of r up to ten sets of images for both zoom

12
settings 1 and >1 from an individual experiment was analysed. See, figure 1 and 3 for
original images with high correlation of ΔFFdwithΔFDd(r ≥ 0,9) and figures 2 and 4 for poor
correlation (r≤0,9). The differences between zoom =1 and for zoom >1 were analysed for the
four parameters obtained (a, b, r and SEM respectively). These parameters were analysed
separately for all the images as well as for the images with pearson correlation coefficient ≥
0, 9.
1A
Dd Transmission
1B
Dd ΔFDd
Fig.1: Original images and correction for donor bleeding through at zoom =1 and with high
correlation coefficient for ΔFDd/ΔFFd. Fig.1A: The sequence of channel from left to right is
original Donor channel (Dd) image, FRET channel image (Fd) and transmission(for better
visualization of colocalization) in the right, of which cells expressing only donor
fluorophores at zoom = 1 and with high correlation coefficient r >0,9. Fig.1B: The donor
Fd
Regression ΔFFd = a.ΔFDd+ b
a: 0,768 b: -1,873
r: 0,960 SEM: 2,557
13
bleeding through correction and their corresponding regression graph at zoom=1 and with
high correlation coefficient ie r >0,9
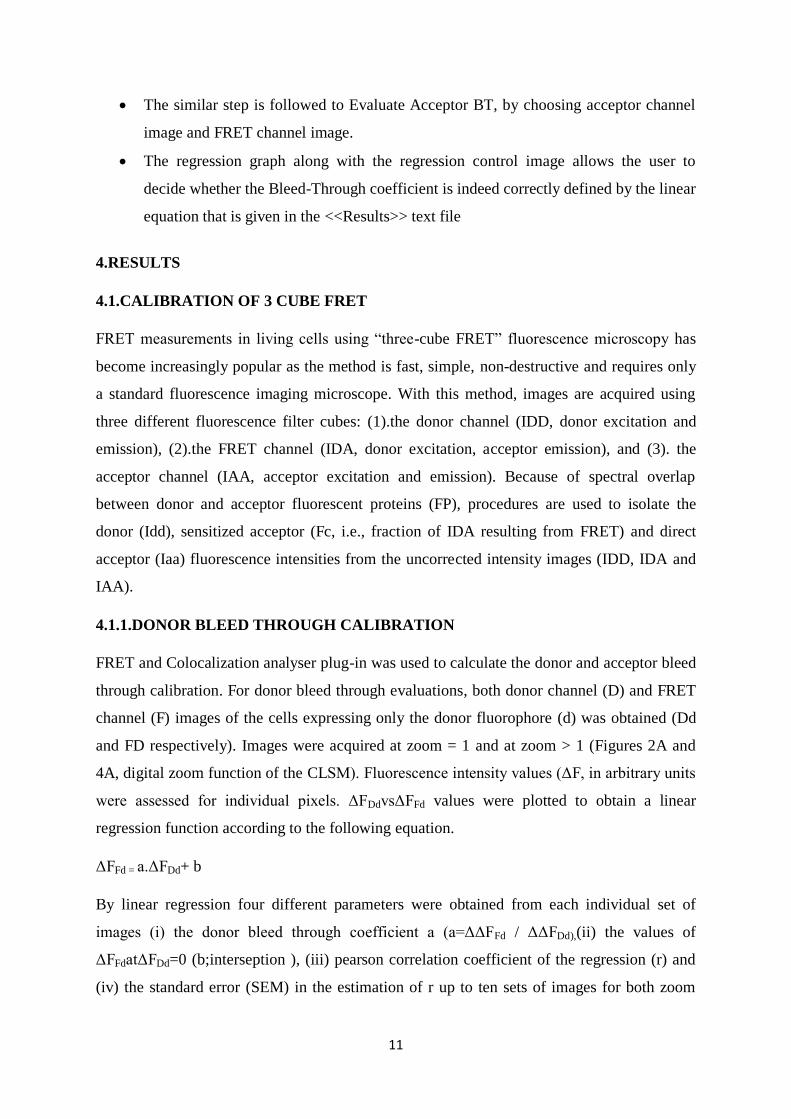
2A
Dd Fd Transmission
2B
Dd ΔFDd
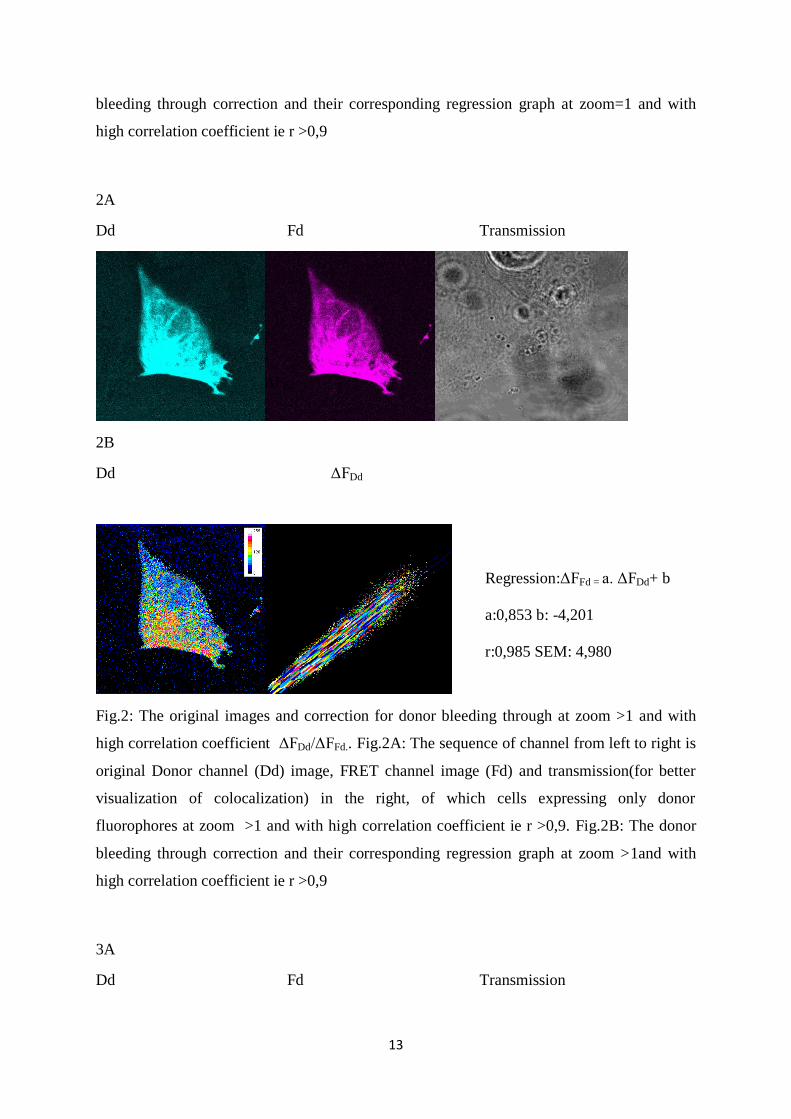
Fig.2: The original images and correction for donor bleeding through at zoom >1 and with
high correlation coefficient ΔFDd/ΔFFd.. Fig.2A: The sequence of channel from left to right is
original Donor channel (Dd) image, FRET channel image (Fd) and transmission(for better
visualization of colocalization) in the right, of which cells expressing only donor
fluorophores at zoom >1 and with high correlation coefficient ie r >0,9. Fig.2B: The donor
bleeding through correction and their corresponding regression graph at zoom >1and with
high correlation coefficient ie r >0,9
3A
Dd Fd Transmission
ΔFFd
Regression:ΔFFd = a. ΔFDd+ b
a:0,853 b: -4,201
r:0,985 SEM: 4,980

14
3B
Dd
ΔFDd
Fig.3: Theoriginal images and correction for donor bleeding through at zoom >1 and with
low correlation coefficient ΔFDd/ΔFFd.. Fig.3A:The sequence of channel from left to right is
original Donor channel (Dd) image, FRET channel image (Fd) and transmission(for better
visualization of colocalization) in the right, of which cells expressing only donor
fluorophores at zoom =1 and with low correlation coefficient r <0,9. Fig.3B: The donor
bleeding through correction and their corresponding regression graph at zoom =1 and with
low correlation coefficient r<0,9.
4A
Dd Fd Transmission
ΔFFd
Regression:ΔFFd = a.ΔFDd+ b
a: 0,729 b:3,267
r: 0,534 SEM: 5,429

15
4B
Dd
ΔFDd
Fig.4: Theoriginal images and correction for donor bleeding through at zoom >1 and with
low correlation coefficient ΔFDd/ΔFFd.. Fig.4A: The sequence of channel from left to right is
original Donor channel (Dd) image, FRET channel image (Fd) and transmission(for better
visualization of colocalization) in the right, of which cells expressing only donor
fluorophores at zoom >1 and with low correlation coefficient r <0,9. Fig.4B: donor bleeding
through correction and their corresponding regression graph at zoom >1 and with low
correlation coefficient r <0,9.
ΔFFd
Regression:ΔFFd = a. ΔFDd+ b
a :0,562 b : -6,937
SEM: 26,404 r : 0,362

16
a(F
Dd/
F Fd)
0,0
0,5
1,0
1,5
(10)(10)
0
5
10
:1X
:>1X
b(F F
d)
(10)
(10)
SE
0
10
20
30
(10)
(10) r
0,0
0,5
1,0
1,5
(10) (10)
Fig.5: Acquired ten sets of images of the cells expressed at zoom =1 and zoom >1 are
compared with the four different parameters, which was obtained from linear regression
graph for every individual set of images. A: a(ΔFFd / ΔFDd);the donor bleed through
coefficient of the cells expressed at zoom=1 and zoom >1 are compared. B:intersection value
obtained from the cells expressed at zoom=1 and zoom >1 are compared. C: pearson
correlation coefficient of the cells expressed at zoom=1 and zoom >1 are compared. D:
standard error obtained from the cells expressed at zoom=1 and zoom >1 are compared.
A B
C D

17
a(F Dd
/F Fd
)
0,0
0,5
1,0
1,5
:1x
:>1X
(6)(10)
b(F Fd
)
0
2
4
6
8
10
(6) (10)
SE
0
10
20
30
(6) (10) r
0,0
0,5
1,0
1,5
(6)(10)
Fig.6: Same as fig 5, but only images with pearson correlation coefficient r ≥ 0,9 of the cells
expressed at zoom =1 and zoom >1 are compared .
4.1.2 ACCEPTOR BLEED THROUGH CALIBRATION
Similar to donor bleed through calibration, acceptor bleed through coefficient was
determined. In this case acceptor channel and FRET channel images were obtained from cells
expressing only acceptor fluorophores and a regression graph was plotted accordingly (Figure
3) for zoom = 1 and for zoom >1. Pearson correlation coefficient and standard error were
obtained for individual regression graphs for up to ten images for zoom = 1 and for zoom >1.
The difference in bleed through coefficient and any compensation between zoom = 1 and for
zoom >1 were analysed. Various parameters between zoom = 1 and for zoom >1 were
analysed (Figure 4) for all the images as well for images with Pearson correlation coefficient
greater than 0.9 (Figure 4 B). Parameters such as FRET intensity, standard error and Pearson
correlation coefficient were compared between zoom = 1 and for zoom >1.
A B
C D

18
7A
Aa Fa Transmission
7B
Aa
ΔFAa
Fig.7: Original images and correction for acceptor bleeding through at zoom =1 and with
high correlation coefficient for ΔFAa/ΔFFa. Fig.7A: the sequence of channel from left to right
is original acceptor channel (Aa) image, FRET channel image (Fa) and transmission(for
better visualization of colocalization) in the right, of which cells expressing only acceptor
fluorophores at zoom = 1 and with high correlation coefficient r >0,7. Fig.1B: acceptor
bleeding through correction and their corresponding regression graph at zoom=1 and with
high correlation coefficient ie r >0,7
ΔFFa
Regression ΔFFa = a.ΔFAa+ b
a: 0,419b: 4,155
SEM: 3,709 r :0,762

19
8A
Aa Fa Transmission
8B
Aa
ΔFAa
Fig.8: Original images and correction for acceptor bleeding through at zoom >1 and with
high correlation coefficient for ΔFAa/ΔFFa. Fig.8A: the sequence of channel from left to right
is original acceptor channel (Aa) image, FRET channel image (Fa) and transmission(for
better visualization of colocalization) in the right, of which cells expressing only
acceptorfluorophores at zoom > 1 and with high correlation coefficient r >0,7. Fig.1B:
acceptor bleeding through correction and their corresponding regression graph at zoom>1 and
with high correlation coefficient ie r >0,7
ΔFFa
Regression :ΔFFa = a. ΔFAa+ b
a :0,468 b: 9,106
SEM: 6,156 r = 0,900

20
9A
Aa Fa Transmission
9B
Aa
ΔFAa
Fig.9: Original images and correction for acceptor bleeding through at zoom =1 and with low
correlation coefficient for ΔFAa/ΔFFa. Fig.9A: the sequence of channel from left to right is
original acceptor channel (Aa) image, FRET channel image (Fa) and transmission(for better
visualization of colocalization) in the right, of which cells expressing only acceptor
fluorophores at zoom = 1 and with low correlation coefficient r >0,7. Fig.9B: acceptor
bleeding through correction and their corresponding regression graph at zoom=1 and with
low correlation coefficient ie r >0,7
ΔFFa

21
10A
Aa FaTransmission
10B
Aa
ΔFAa
Fig.10: Original images and correction for acceptor bleeding through at zoom >1 and with
low correlation coefficient for ΔFAa/ΔFFa. Fig.10A: the sequence of channel from left to right
is original acceptor channel (Aa) image, FRET channel image (Fa) and transmission(for
better visualization of colocalization) in the right, of which cells expressing only acceptor
fluorophores at zoom >1 and with low correlation coefficient r >0,7. Fig.10B: acceptor
bleeding through correction and their corresponding regression graph at zoom>1 and with
low correlation coefficient ie r >0,7
ΔFFa

22
a(F A
a/F Fa
)
0,0
0,5
1,0
(10) (10)
b(F Fd
)
0
10
20
30
(10)
(10)
SE
0
5
10
15
(10)
(10)
r
0,0
0,5
1,0
:1X: >X1
(10)(10)
Fig.11: Acquired ten sets of images of the cells expressed at zoom =1 and zoom >1 are
compared with the four different parameters, which was obtained from linear regression
graph for every individual set of images. A: a(ΔFFa / ΔFAa);the acceptor bleeding through
coefficient of the cells expressed at zoom=1 and zoom >1 are compared. B:intersection value
obtained from the cells expressed at zoom=1 and zoom >1 are compared. C: pearson
correlation coefficient of the cells expressed at zoom=1 and zoom >1 are compared. D:
standard error obtained from the cells expressed at zoom=1 and zoom >1 are compared.
A B
C D

23
a(F
Aa/
FF
a)
0,0
0,5
1,0
:1X:>1X
b(F
Fa)
0
5
10
15
20
(6) (10)(6)
(10)
SE
0
5
10
15
(6)
(10)
r0,0
0,5
1,0
(6)(10)
Fig.12: Same as fig 11, but only images with pearson correlation coefficient r ≥ 0,7 of the
cells expressed at zoom =1 and zoom >1 are compared .
4.2. FRET ANALYSIS
Static FRET analysis was performed for cytosolic located FRET sensor (cFAK)and for FRET
sensor localized to detergent resistant domains of the plasma membrane(LynFAK)
4.2.1.cFAK
A B
C D
Df Ff Af
T cFRET cFRET_normalized

24
4.2.2.LynFAK
DfFfAf
5. DISCUSSION
The necessity for invivo imaging has established in aggregation with the considerate that
several cellular responses within a tissue niche are determined bysignals.Imaging
experiments in vivo differ from in vitro experiments innumerous ways. Not only do cells look
and behave differently but alsothe questions asked are often slightly different. Moreover,
imagingcells within tissues presents various technical challenges that coerce invivo
experimental design and influence the choice ofimaging approach. In this section, we
consider some of the subjects that relate to invivo experimental design and offer
suggestionshow to create an experimental pipeline that promotes successful invivo imaging
[Paul Timpson et al.,2011].
Cancerous cell major activity is drastically growth of the cell in an uncontrollable manner in
such cases our human anatomy system normally consists of cell growth activity. The
important protein involved in cell functionality in the human body is FAK (Focal Adhesion
kinase) located in the 8q24.3 chromosomes and in gene PtK2. Due to FAK activity cell
motility, proliferation, survival has been managed in the human body hence, it is necessary to
investigate the performance of FAK activity on breast cancer becomes important.
cFRET cFRET_normalized T

25
The research aim was to investigate the FAK activity on the breast cancer using FRET and
CLSM. FRET provides the clear view about the interaction between the molecules within the
cell further through FRET interaction between proteins can be clearly defined protein
conformation. The images of breast cancer cells are collected through CLSM which is fed
into FRET for analysis. This section provides the detailed description regarding the FAK
activity on breast cancer which is examined through FRET.
In our study, the differences in bleed through between zoom = 1 and for zoom >1 for donor
and acceptor was evaluated. There were no significant differences in Pearson correlation
coefficient and bleed through coefficient for both the zooms.
A powerful imaging method to study protein-proteininteractions in living cells is
fluorescence resonance energytransfer (FRET). FRET is the non-radiativetransfer of energy
from a donor fluorophore in an excitedstate to a nearby acceptor fluorophore to allow
energytransfer if within only 10 nm. Because this distance is inthe range of protein sizes,
FRET can also be used to studyconformational changes of proteins tagged with a FRETdonor
and FRET acceptor. The most frequently used FRETmethods are sensitised emission, ratio
imaging andacceptor photo-bleaching FRET but the latter is notappropriate for studying rapid
changes of protein interactionsover time. The sensitized emission approach detectsthe
emission of the acceptor fluorophore (often cyan fluorescentprotein, CFP) while the donor
fluorophore (oftenyellow fluorescent protein, YFP) is excited [Elangovan M et al.,2002].
Cross-talk and bleed through from onefluorophore to another makes the analysis highly
dependenton control measurements of cells in which only one of thetwo fluorophores is
present. An alternative approach todetermine FRET is acceptor/donor ratio imaging (e.g.
YFP/CFP) where both donor and acceptor emission are detectedsimultaneously when excited
at the excitation wavelengthof the donor. However, this method can be only appliedwhen
donor and acceptors are equally expressed in a cellsystem which is always the case when
using FRET biosensors.In the study of adhesions, a few FRET biosensorshave been designed
to monitor in live cells the activity of anumber of kinases, e.g. Src and FAK [Rajesh
BS.,Periasamy A., 2003].When correctly applied, FRET is a useful tool for investigatingthe
molecular mechanisms that regulate integrinmediatedsignalling in migrating cells [Kraynov,
V.S et al.,2000 ].
6. ETHICAL ASPECTS AND IMPACT OF RESEARCH ON THE SOCIETY

26
In vivo experimental design presents many challenges that are notencountered in
in vitro, including surgical preparation of animals,anaesthesia, suppression of motion
artefacts arising from breathing,heartbeat and muscle twitching, a limited timescale of
observation,a reduced number of experimental observations, difficulty synchronizing
experiments and reduced optical sensitivity andresolution.
The integration of molecular engineering and nano/micro-technology with fluorescent
proteins can provide powerful tools for live cell imaging. The molecular activities and
hierarchy inside live cells are largely dependent on the subcellular location. FRET biosensors
can be applied to investigate the molecular regulation in live cells under mechanical
stimulations.
7. CONCLUSION
Biology, imaging and spectroscopy have been recently combined to provide powerful
tools for research and clinical applications.FRET technology is a powerful tool to study
protein-protein interactions in living cells. As FRET efficiency is dependent upon the
distance between the two fluorophores and their relative orientation, changes in FRET
correspond to changes in distance and orientation between the fluorescent probes and in the
case of a single protein fused to two fluorophores can reflect changes in conformation. Here,
we have developed FRET biosensors to visualize changes in FAK conformation in vivo.
Potential applications for tissue FRET imaging are also burgeoning. With recent advances in
fluorescent probes, instrumentation and methodologies, FRET is sure to revolutionize
scientific research in the near future.
8. ACKNOWLEDGEMENT
I would like to express my sincere gratitude to professor wolfgang schreibmayer for all his
support towards my work and for providing me an opportunity to work with him. Special
thanks to laboratory incharge Astrid Gorischek for helping me in technical work and for
teaching me all the techniques with patience. Hearty thanks to my friend and PhD student
simin rezania for helping me in Austria. I would also like to thank my Professor Sandra
Karlsson for her guidance in performing my master thesis at medical university of graz.

27
9. REFERENCES
ABERCROMBIE M., HEAYSMAN JEM.,PEGRUM SM,1970.,The locomotion of fibroblast
in culture III.movements of particles on the dorsal surface of the leading lamina
Exp.Cell.Res.62,389.
BURRIDGE, K., K. FATH, T. KELLY, G. NUCKOLLS, AND C. TURNER. 1988,Focal
adhesions: transmembrane junctions between the extracellular matrix and the cytoskeleton.
Annu. Rev. Cell Biol. 4:487-525.
DAVIDD.SCHLAEPFER, STEVEN K.HANKS,TONY HUNTER & PETER VAN DER
GEER,1944,.Integrin-mediated signal transduction linked to Ras pathway by GRB2 binding
to focal adhesionkinase. Nature 372, 786 – 791
DUBASH AD, MENOLD MM, SAMSON T, BOULTER E, GARCÍA-MATA
R, DOUGHMAN R, BURRIDGE K ,2009.,chapter 1.Focal adhesion:new angles on old
structure.Int Rev Cell Mol Biol.;277:1-65.
ELANGOVAN M, R.N. DAY, AND A. PERIASAMY. 2002. Nanosecond fluorescence
resonance energy transfer-fluorescence lifetime imaging microscopy to localize the protein
interactions in a single living cell. J. Microsc. 205: 3–14.
FORSTER, T. 1965. Delocalized excitation and excitation transfer. Modern Quantum
Chemistry.93–137.
GU, Y.H., AND SIVAM, G., 2006, Cytotoxic effect of oyster mushroomPleurotusostreatus
on human androgen-independent prostate cancer PC-3cells,” Journal of Medicinal Food, 9(2),
196–204.
KRAYNOV, V.S., C. CHAMBERLAIN, G.M. BOKOCH, M.A. SCHWARTZ, S.
SLABAUGH, AND K.M. HAHN. 2000. Localized Rac activation dynamics visualized in
living cells. Science. 290: 333 - 337.
MARC THIRIET, 2012,Intracellular Signaling Mediators in the Circulatory and Ventilatory
Systems.
MARTIN ALEXANDER SCHWARTZ, RICHARD K,2011,Assoian,Integrins and cell
proliferation,Journal of Cell Science, 114: 2553-2560.
PAUL TIMPSON, EWAN J. MCGHEE AND KURT I. ANDERSON, 2011.Imaging
molecular dynamics in vivo – from cellbiology to animal models, Journal of Cell Science
124, 2877-2890.
RAJESH BS.,PERIASAMY A., 2003, Fluorescence resonance energy transfer (FRET)
microscopy imaging of live cell protein localizations, The journal of cell biology,160 (5):
629.
SEONG J, OUYANG M, KIM T, SUN J, WEN PC, LU S, ZHUO Y, LLEWELLYN
NM, SCHLAEPFER DD, GUAN JL, CHIEN S, WANG Y ,2011,Detection of focal adhesion kinase
activation at membrane microdomains by fluorescence resonance energy transfer. Nature
Communications.;2:406.

28
SU HAO LO, Focal adhesions: what's new inside; 2006. Elsevier Inc. Developmental
Biology 294,280–291.
SOULE.H.D, VAZQUEZ .J, LONG.A, ALBERT.S , BRENNAN.M.1973 .A Human Cell
Line From a Pleural Effusion Derived From a Breast Carcinoma .J Natl Cancer Inst 51:1409-
1416.


