

Individual Robot Analysis Diana Wu Wong A98066631
Team 4: Jaeger Component: Friction Drivetrain
MAE3 Section A01 T.A Howard Tai

Wu Wong 1 Part I: Description of Components.
Overview of “Gypsy Danger”
Initial Position View
The robot, Gypsy Danger, fits to the 10x10x10 inches constraint and it is created to carry balls from a 10-‐inch-‐high elevated platform to a 5-‐inch-‐high elevated goalie within a 20 inches distance. This robot was designed to drive, lift its upper base, extend its arm to reach behind the balls on the elevated platform and retract back its arm so that the ball rests on the upper platform. It would, then, drive back to the elevated goalie and release the ball. The robot mainly consists of 3 components: the base with two friction drives powered by high-‐speed motors, a lift that elevates the upper platform up to 5 inches higher than the limited height and an extendable arm that extends up to 7 inches long. The friction drives provide great mobility on high speed. It allows very sharp turns, it is able to turn 360 degrees, and move forwards and backwards on a straight line. The lift allows the upper platform to elevate to the needed height for the arm reach the balls when extended. At its maximum height, it can help the arm to reach the yellow ball, which are often inaccessible for most robots seen.
Fully Extended View
Wu Wong 2
Component Overview: Friction Drivetrain
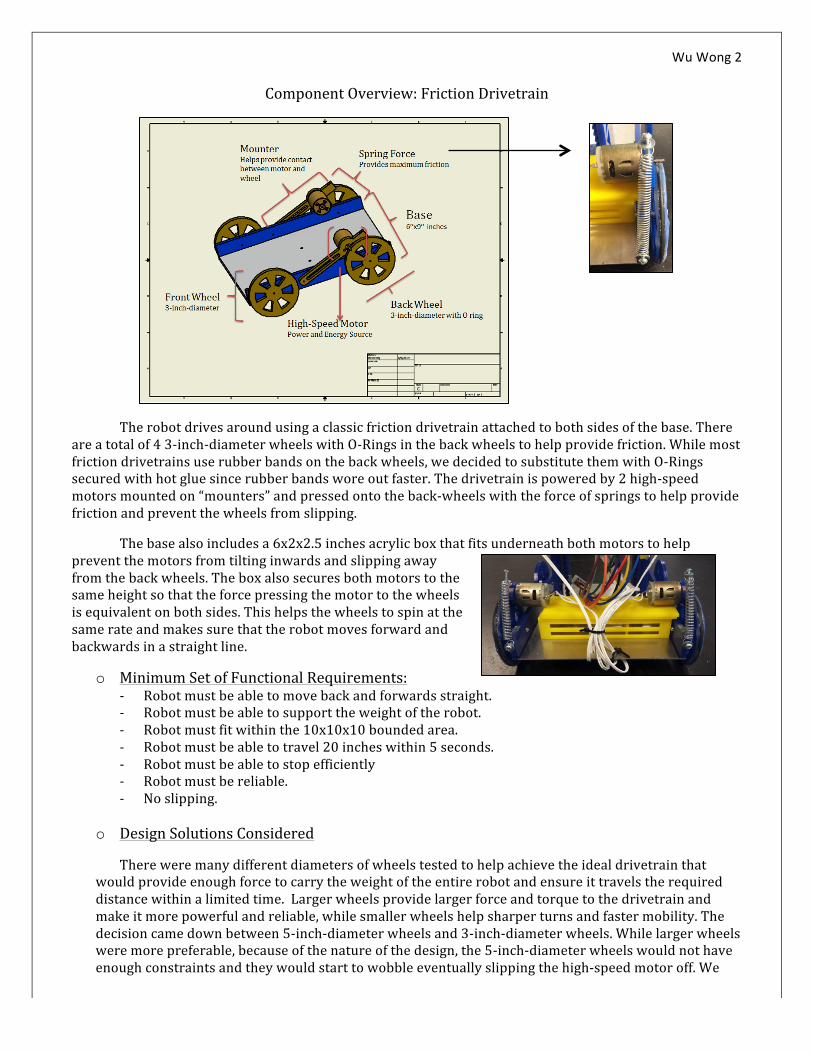
The robot drives around using a classic friction drivetrain attached to both sides of the base. There are a total of 4 3-‐inch-‐diameter wheels with O-‐Rings in the back wheels to help provide friction. While most friction drivetrains use rubber bands on the back wheels, we decided to substitute them with O-‐Rings secured with hot glue since rubber bands wore out faster. The drivetrain is powered by 2 high-‐speed motors mounted on “mounters” and pressed onto the back-‐wheels with the force of springs to help provide friction and prevent the wheels from slipping.
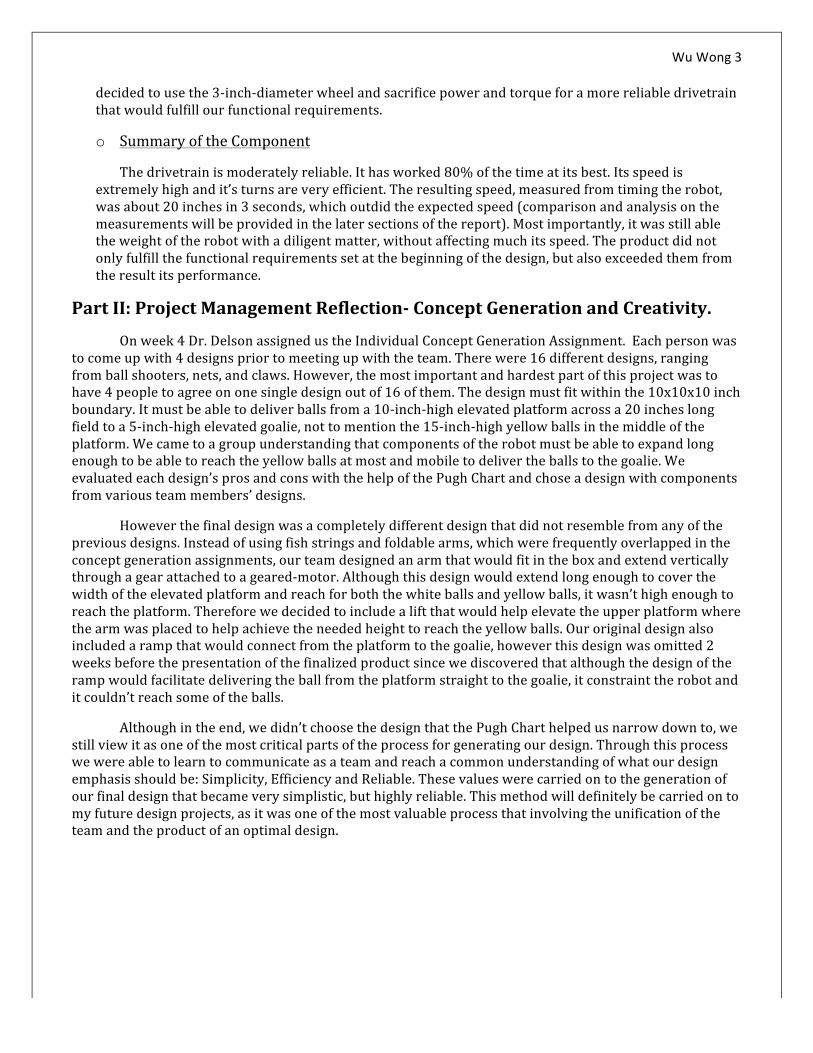
The base also includes a 6x2x2.5 inches acrylic box that fits underneath both motors to help prevent the motors from tilting inwards and slipping away from the back wheels. The box also secures both motors to the same height so that the force pressing the motor to the wheels is equivalent on both sides. This helps the wheels to spin at the same rate and makes sure that the robot moves forward and backwards in a straight line.
o Minimum Set of Functional Requirements: -‐ Robot must be able to move back and forwards straight. -‐ Robot must be able to support the weight of the robot. -‐ Robot must fit within the 10x10x10 bounded area. -‐ Robot must be able to travel 20 inches within 5 seconds. -‐ Robot must be able to stop efficiently -‐ Robot must be reliable. -‐ No slipping.
o Design Solutions Considered
There were many different diameters of wheels tested to help achieve the ideal drivetrain that would provide enough force to carry the weight of the entire robot and ensure it travels the required distance within a limited time. Larger wheels provide larger force and torque to the drivetrain and make it more powerful and reliable, while smaller wheels help sharper turns and faster mobility. The decision came down between 5-‐inch-‐diameter wheels and 3-‐inch-‐diameter wheels. While larger wheels were more preferable, because of the nature of the design, the 5-‐inch-‐diameter wheels would not have enough constraints and they would start to wobble eventually slipping the high-‐speed motor off. We
Wu Wong 3
decided to use the 3-‐inch-‐diameter wheel and sacrifice power and torque for a more reliable drivetrain that would fulfill our functional requirements.
o Summary of the Component
The drivetrain is moderately reliable. It has worked 80% of the time at its best. Its speed is extremely high and it’s turns are very efficient. The resulting speed, measured from timing the robot, was about 20 inches in 3 seconds, which outdid the expected speed (comparison and analysis on the measurements will be provided in the later sections of the report). Most importantly, it was still able the weight of the robot with a diligent matter, without affecting much its speed. The product did not only fulfill the functional requirements set at the beginning of the design, but also exceeded them from the result its performance.
Part II: Project Management Reflection-‐ Concept Generation and Creativity.
On week 4 Dr. Delson assigned us the Individual Concept Generation Assignment. Each person was to come up with 4 designs prior to meeting up with the team. There were 16 different designs, ranging from ball shooters, nets, and claws. However, the most important and hardest part of this project was to have 4 people to agree on one single design out of 16 of them. The design must fit within the 10x10x10 inch boundary. It must be able to deliver balls from a 10-‐inch-‐high elevated platform across a 20 inches long field to a 5-‐inch-‐high elevated goalie, not to mention the 15-‐inch-‐high yellow balls in the middle of the platform. We came to a group understanding that components of the robot must be able to expand long enough to be able to reach the yellow balls at most and mobile to deliver the balls to the goalie. We evaluated each design’s pros and cons with the help of the Pugh Chart and chose a design with components from various team members’ designs.
However the final design was a completely different design that did not resemble from any of the previous designs. Instead of using fish strings and foldable arms, which were frequently overlapped in the concept generation assignments, our team designed an arm that would fit in the box and extend vertically through a gear attached to a geared-‐motor. Although this design would extend long enough to cover the width of the elevated platform and reach for both the white balls and yellow balls, it wasn’t high enough to reach the platform. Therefore we decided to include a lift that would help elevate the upper platform where the arm was placed to help achieve the needed height to reach the yellow balls. Our original design also included a ramp that would connect from the platform to the goalie, however this design was omitted 2 weeks before the presentation of the finalized product since we discovered that although the design of the ramp would facilitate delivering the ball from the platform straight to the goalie, it constraint the robot and it couldn’t reach some of the balls.
Although in the end, we didn’t choose the design that the Pugh Chart helped us narrow down to, we still view it as one of the most critical parts of the process for generating our design. Through this process we were able to learn to communicate as a team and reach a common understanding of what our design emphasis should be: Simplicity, Efficiency and Reliable. These values were carried on to the generation of our final design that became very simplistic, but highly reliable. This method will definitely be carried on to my future design projects, as it was one of the most valuable process that involving the unification of the team and the product of an optimal design.
Wu Wong 4 Part III: Analysis of the Component
o Objective of Analysis
The objective of this analysis is to predict whether the robot will be able to travel in its expected carrying the weight of the robot and what its maximum pushing force is. This analysis can help predict the size of the back wheel needed to achieve the time without slipping. The bigger the wheel is, the more reliable the drivetrain is, however it will also be slower. The goal is to balance between the reliability and speed and also identify at what pushing force the wheels will begin to slip.
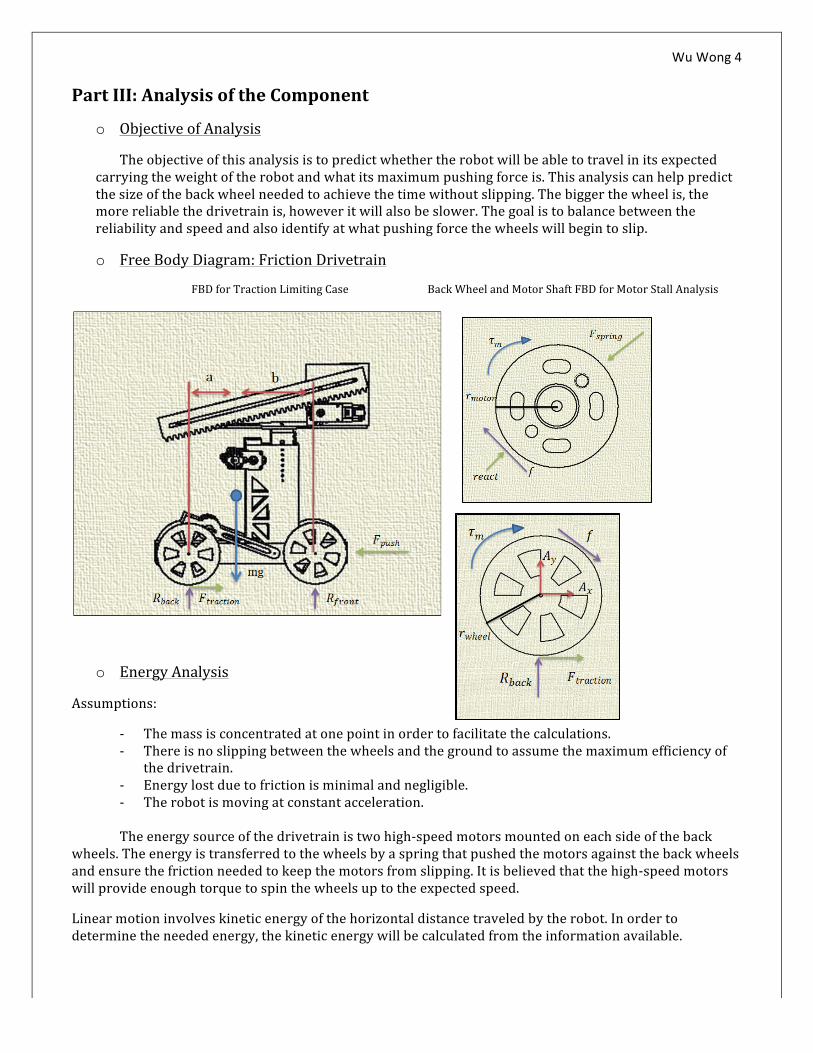
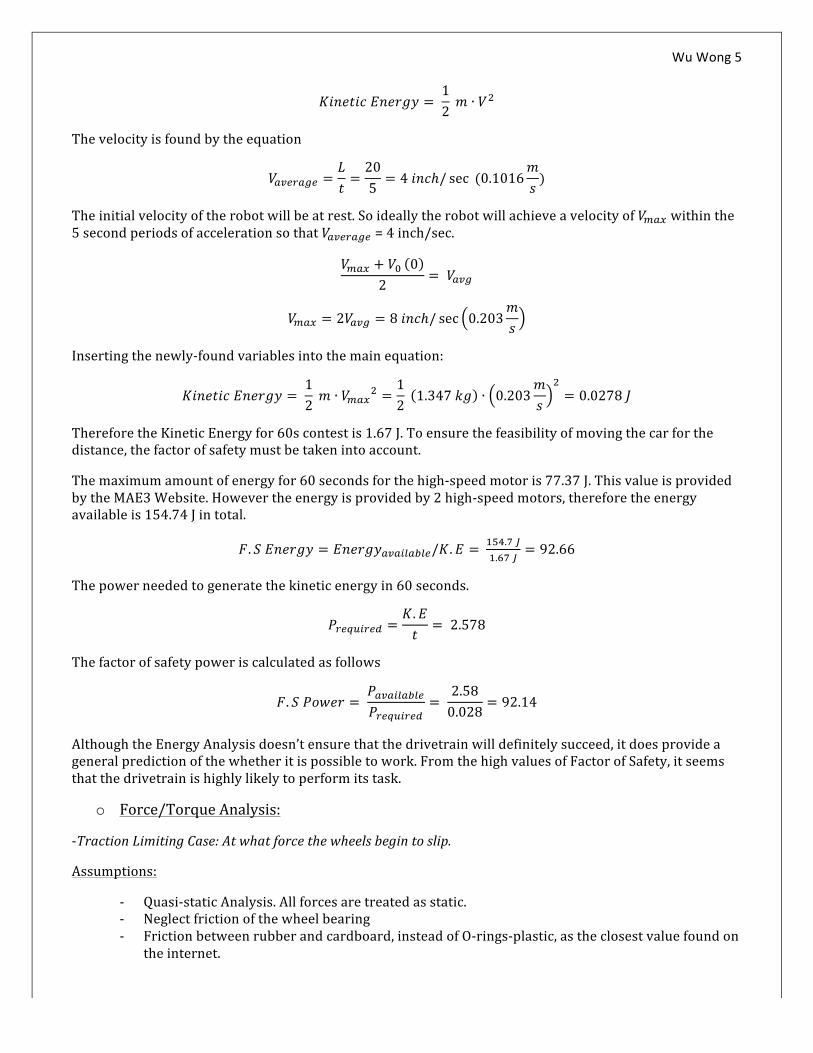
o Free Body Diagram: Friction Drivetrain
FBD for Traction Limiting Case Back Wheel and Motor Shaft FBD for Motor Stall Analysis
o Energy Analysis
Assumptions:
-‐ The mass is concentrated at one point in order to facilitate the calculations. -‐ There is no slipping between the wheels and the ground to assume the maximum efficiency of
the drivetrain. -‐ Energy lost due to friction is minimal and negligible. -‐ The robot is moving at constant acceleration.
The energy source of the drivetrain is two high-‐speed motors mounted on each side of the back
wheels. The energy is transferred to the wheels by a spring that pushed the motors against the back wheels and ensure the friction needed to keep the motors from slipping. It is believed that the high-‐speed motors will provide enough torque to spin the wheels up to the expected speed.
Linear motion involves kinetic energy of the horizontal distance traveled by the robot. In order to determine the needed energy, the kinetic energy will be calculated from the information available.
Wu Wong 5
𝐾𝑖𝑛𝑒𝑡𝑖𝑐 𝐸𝑛𝑒𝑟𝑔𝑦 = 12 𝑚 ∙ 𝑉!
The velocity is found by the equation
𝑉!"#$!%# =𝐿𝑡=205= 4 𝑖𝑛𝑐ℎ/ sec (0.1016
𝑚𝑠)
The initial velocity of the robot will be at rest. So ideally the robot will achieve a velocity of 𝑉!"# within the 5 second periods of acceleration so that 𝑉!"#$!%# = 4 inch/sec.
𝑉!"# + 𝑉! 02
= 𝑉!"#
𝑉!"# = 2𝑉!"# = 8 𝑖𝑛𝑐ℎ/ sec 0.203𝑚𝑠
Inserting the newly-‐found variables into the main equation:
𝐾𝑖𝑛𝑒𝑡𝑖𝑐 𝐸𝑛𝑒𝑟𝑔𝑦 = 12 𝑚 ∙ 𝑉!"#! =
12 1.347 𝑘𝑔 ∙ 0.203
𝑚𝑠
!= 0.0278 𝐽
Therefore the Kinetic Energy for 60s contest is 1.67 J. To ensure the feasibility of moving the car for the distance, the factor of safety must be taken into account.
The maximum amount of energy for 60 seconds for the high-‐speed motor is 77.37 J. This value is provided by the MAE3 Website. However the energy is provided by 2 high-‐speed motors, therefore the energy available is 154.74 J in total.
𝐹. 𝑆 𝐸𝑛𝑒𝑟𝑔𝑦 = 𝐸𝑛𝑒𝑟𝑔𝑦!"!#$!%$&/𝐾.𝐸 = !"#.! !!.!" !
= 92.66
The power needed to generate the kinetic energy in 60 seconds.
𝑃!"#$%!"& =𝐾.𝐸𝑡
= 2.578
The factor of safety power is calculated as follows
𝐹. 𝑆 𝑃𝑜𝑤𝑒𝑟 = 𝑃!"!#$!%$&𝑃!"#$%!"&
= 2.580.028
= 92.14
Although the Energy Analysis doesn’t ensure that the drivetrain will definitely succeed, it does provide a general prediction of the whether it is possible to work. From the high values of Factor of Safety, it seems that the drivetrain is highly likely to perform its task.
o Force/Torque Analysis:
-‐Traction Limiting Case: At what force the wheels begin to slip.
Assumptions:
-‐ Quasi-‐static Analysis. All forces are treated as static. -‐ Neglect friction of the wheel bearing -‐ Friction between rubber and cardboard, instead of O-‐rings-‐plastic, as the closest value found on
the internet.

Wu Wong 6
-‐ Center of mass is off-‐centered because the weight is mainly distributed at the back portion of the robot.
-‐ The friction of the bearing on the wheels is small enough to be neglected. Variables:
a (estimated distance back wheel to center of mass) =2.5 inch=0.0635 m
b (estimated distance front wheel to center of mass) =3.5 inch= 0.0889 m
𝜇 (coefficient of friction rubber-‐cardboard)=0.65
m (mass of the entire robot) = 1.347 kg
Calculations:
Σ𝐹! = 0 𝐹!"#$!%&' − 𝐹!"#! = 0
Σ𝐹! = 0 𝑅!"#$ − 𝑅!"#$% = 0
Σ𝑀! = 0 𝑚𝑔𝑏 − 𝑅!"#$(𝑎 + 𝑏) = 0 𝑅!"#$ =!"#!!!
Therefore the maximum traction force happens when
𝐹!"#$!%&',!"# = 𝜇𝑁
N= normal force=𝑅!"#$%
µ= Coefficient of friction
Therefore 𝐹!"#$!%&',!"# = 𝜇𝑅!"#$% =!"#$!!!
= 5 𝑁
-‐Motor Torque Analysis: At what Force will the Motor Stall?
Assumptions:
-‐ Traction is strong enough so that the wheels don’t slip -‐ Quasi-‐static Analysis -‐ Neglect friction of the wheel bearing
Variables:
𝜏! (torque of the motor)= 0.012 Nm
𝑟!!!!"= 1.5 inches= 0.0381 m
Calculations:
Σ𝐹! = 0 𝐹!"#$!%&' − 𝑅!"#$ = 0
Σ𝐹! = 0 𝑅!"#$ − 𝐴! = 0
Σ𝑀! = 0 𝐹!"#$!%&'𝑟!!!!" − 𝜏! = 0
Therefore 𝐹!"#$!%&' =!!!
Maximum pushing force happens at stall torqueà 𝜏! = 𝜏!"#$$

Wu Wong 7 Since there are motors on both sides of the car
𝐹!"#$!%&' =!!!"#$$!
= !(!.!"#)!.!"#$
= 6.30 𝑁
o Measurement of Component Performance:
Equations used:
𝑃𝑒𝑟𝑐𝑒𝑛𝑡𝑎𝑔𝑒 𝐸𝑟𝑟𝑜𝑟 = 𝐸𝑥𝑝𝑒𝑐𝑡𝑒𝑑 − 𝐴𝑐𝑡𝑢𝑎𝑙
𝐴𝑐𝑡𝑢𝑎𝑙 ×100%
The velocity of the drivetrain was measured by timing the amount of time the robot took to travel 10 inches. This method simply used a timer to time the robot while in a straight line for 10 inches.
The resulting measurements were 10 inches in 1.5 seconds (0.169 m/s). Compared to the ideal speed from the functional requirement of the robot (20 inches in 5 seconds, 0.1016 m/s), the robot was 40% faster than the expected speed, which means that we have highly underestimated the potential velocity of this robot. However the expected velocity was a value that was set by the team as a functional requirement for the robot, the fact that the actual speed outdid the expected velocity is highly beneficial for the robot.
𝑃𝑒𝑟𝑐𝑒𝑛𝑡𝑎𝑔𝑒 𝐸𝑟𝑟𝑜𝑟 = 0.1016 − 0.169
0.169 ×100% = 39.9% = ~40%
The pushing force was measured by attaching a force gauche to the back of the robot and holding the other end of the gauche while the robot drove straight. The same result was given by driving the robot into the force gauche until the robot couldn’t move further.
The resulting measurement was 8 N of pushing force. Compared to the estimated result from the Force Analysis from the previous section (6.3N and 5N), the actual pushing force was underestimated by 21.3% and 37.5% respectively. There are several factors that might have resulting such great percentage of error, however the most attributed factor in this case would be the coefficient of friction used. Given the limited amount of material combination for coefficient of friction provided by the internet, the closest material combination that was found was rubber-‐cardboard coefficient of friction which ranges from 0.4 to 0.8. As a result, a coefficient of friction of 0.65 was chosen to input in the calculations, in order to minimize the inaccuracy. However, the this value is still highly inaccurate since the coefficient of friction of the actual material (O-‐rings and Acrylic) is still unknown.
𝑃𝑒𝑟𝑐𝑒𝑛𝑡𝑎𝑔𝑒 𝐸𝑟𝑟𝑜𝑟 = 6.3 − 88
×100% = 21.3%
𝑃𝑒𝑟𝑐𝑒𝑛𝑡𝑎𝑔𝑒 𝐸𝑟𝑟𝑜𝑟 = 5 − 88
×100% = 37.5%
o Conclusion:
The Energy Analysis predicts that the drivetrain might work, however it does not ensure that it will. On the other hand, the Force Analysis gave us a general idea of the amount of pushing force that will make the wheels slip or the motor stall. From these analysis, we were able to make adjustments to the component in order to increase the pushing force and the traction and maximize the performance of the overall machine. For future reference, I would keep in mind the potential weaknesses of the final design of the robot. For instance, the wheels are located at the sides of the base, this makes the robot more susceptible to attacks, and if the opponent was to attack the wheels, the robot would be completely dysfunctional and incompetent to score. Overall, the robot is very simplistic and reliable,

Wu Wong 8
however it is not most efficient. Because it mainly relies on the drivetrain to deliver the balls from the platform to the goalie, it requires a lot of control and maneuvering . Unless the team members are very familiar controlling the robot, it won’t likely get all of the balls (including the yellow ones). Nevertheless it has been constantly performing great overall, scoring approximately 12 points each time.


