

Striking The Right Balance Between Reform and Growth
MINISTER OF FINANCE OF THE REPUBLIC OF INDONESIA
SRI MULYANI INDRAWATI
INDONESIA OUTLOOK
MANDIRI INVESTOR FORUM
7 FEBRUARY 2018
photo by KemenESDM

outline2
2017 ECONOMIC PERFORMANCE AND 2018 OUTLOOK
FUTURE GLOBAL CHALLENGES
TAX REFORMS AS PARTS OF FISCAL REFORMS
GOVERNMENT PRIORITIES SPENDING IN 2018
CONCLUSIONS
1
2
4
5
3 6STRUCTURAL REFORMS TOWARD SUSTAINABLE ECONOMIC GROWTH

2017
ECONOMIC
PERFORMANCE
AND
2018 OUTLOOK
3Slide #01

INDONESIA ECONOMIC PERFOMANCE IN 2017
4.6
4.775
4.95
5.125
5.3
Q1 Q2 Q3 Q4 Q1 Q2 Q3 Q4 Q1 Q2 Q3 Q4
5.19
5.065.015.01
4.945.03
5.21
4.94
5.15
4.784.744.83
China India Indonesia S. Arabia Turkey Korea Australia Argentina Mexico S. Africa Brazil Russia Canada US Germany UK France Japan Italy-0.6
0.40.81.11.21.31.51.62.02.12.12.32.73.33.53.7
5.6
7.4
9.0
2015 2016
(0 ,6 )
I t a l y
for a decade, Indonesia performs better than many other emerging economies
G20 & BRICS
YoY: 4,88 YoY: 5,032017
YoY: 5,07
Indonesia successfully maintaining the growth momentum in 2017

INDONESIA ECONOMIC OUTLOOK IN 2018
GDP Growth (%)
Inf lat ion
(%) YoY
5,4
3,5
Gas Lift ing ( thousand BOPD)
1.200
Oil Price
US$/barrel
Oi l Li f t ing (thousand BOPD)
4,8
800
Exc. Rate
( IDR/USD)
Int. Rate
(%) 5,4
13.400
0
2
4
6
8
10
0
2
4
6
8
10
2010 2011 2012 2013 2014 2015 2016 2017p 2018p
World Advanced economies Emerging market and developing economies Indonesia
5.405.075.034.885.015.566.036.176.38
2018 macroeconomic indicators
economic growth projected to rise higher in 2018, supported by the continuity of growth momentum across all sectors
FUTURE
GLOBAL
CHALLENGES6Slide #02

Population Ageing
FUTURE GLOBAL CHALLENGES Geopolitics & Security Water Conflicts Climate Change
Food and Energy Security

STRUCTURAL REFORMS TOWARDS
SUSTAINABLE ECONOMIC GROWTH
Populism in EU (Brexit,Eurosceptics)
Protectionism in USA(Inward Looking Policies) Rise of Asia as an
Economic Powerhouse
Rise of the machinesRise of Millenials
Green Economy
FUTURE GLOBAL ECEONOMIC TRENDS
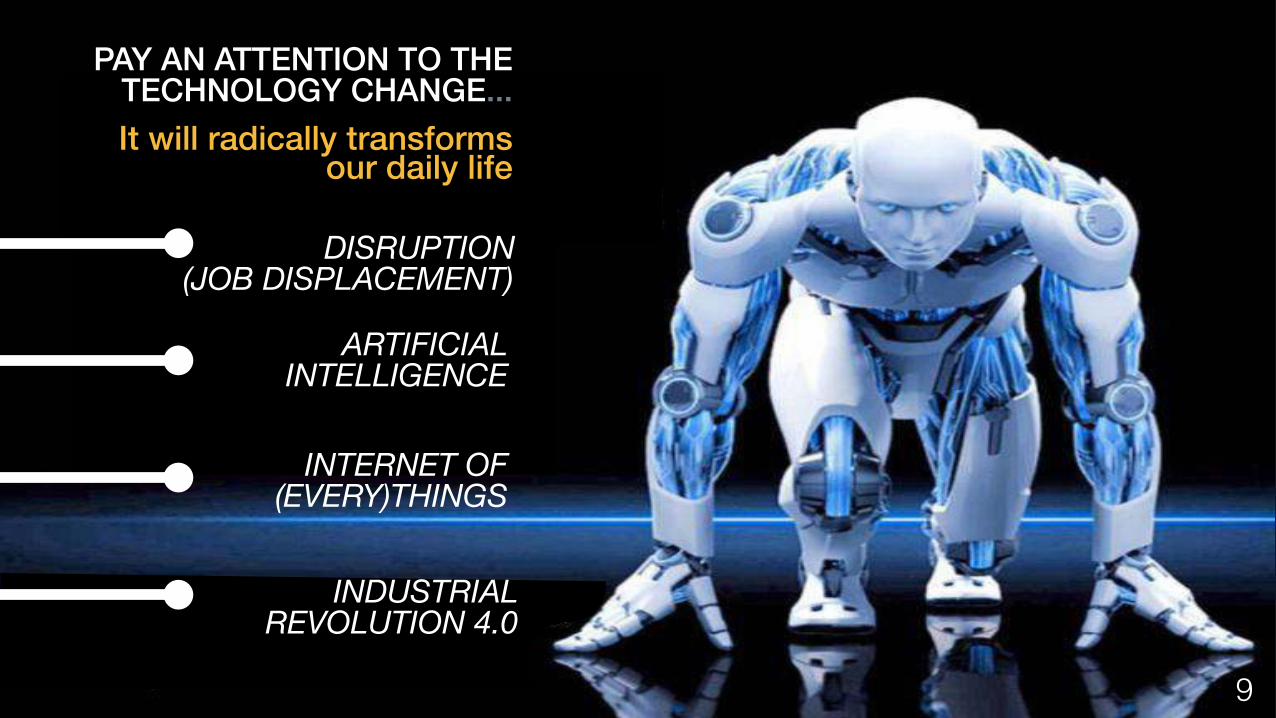
DISRUPTION (JOB DISPLACEMENT)
ARTIFICIAL INTELLIGENCE
INTERNET OF (EVERY)THINGS
INDUSTRIAL REVOLUTION 4.0
9
PAY AN ATTENTION TO THE TECHNOLOGY CHANGE...
It will radically transforms our daily life

SUSTAINABLE
ECONOMIC
TOWARDS
SUSTAINABLE
ECONOMIC GROWTH10Slide #03

Old Industrial Economy
11Slide #
NOW WE ARE LIVING IN THE AGE OF KNOWLEDGE DRIVEN ECONOMY (KDE)
• Resource based • Labour Intensive • Mass Production • Proximity is important • Require Control • Top Down Approach • Rigid
Knowledge Driven Economy
• Knowledge Intensive • High Skill Talent • Mass Colaboration
• Location less significant • Require Collaboration • Horisontal Collaboration • Flexible
strengthening KDE is an imperative to sustain high growth rates in the future and to avoid middle income trap

2010 2011 2012 2013 2014 2015 2016
70.1869.55
68.9068.31
67.7067.09
66.53
Singapore
BruneiDrslm
Malaysia
Turkey
Mexico
Brazil
Thailand
China
Indonesia
VietNam
Philippines
SouthAfrica
India
Cambodia
Myanmar0.00 0.25 0.50 0.75 1.00
0.556
0.563
0.624
0.666
0.682
0.683
0.689
0.738
0.74
0.754
0.762
0.767
0.789
0.865
0.925
Indonesia’s HDI 2010-2016 Comparison of HDI 2015
12,72 7,95
70,9 10.420*L i f e E x p e c t a n c y
A t B i r t h
E x p e c t e d y e a r s O f S c h o o l i n g
* I n t h o u s a n d
M e a n Ye a r s O f S c h o o l i n g
G N I p e r C a p i t a
HUMAN CAPITAL INVESTMENT IS A KEY
Indonesia’s HDI 2016
Indonesia still needs to continuously and consistently improving its human capital

Science Reading Mathematics
Singapore
Japan
Chinese Taipei
Vietnam
Hong Kong (China)
B-S-J-G (China)
Korea
United Kingdom
United States
OECD average
Turkey
Thailand
Mexico
Indonesia
Brazil
360.00 480.00 600.00
377
386
408
415
420
490
470
492
524
531
548
495
542
532
564Singapore
Japan
Chinese Taipei
Vietnam
Hong Kong (China)
B-S-J-G (China)
Korea
United Kingdom
United States
OECD average
Turkey
Thailand
Mexico
Indonesia
Brazil
360.00 480.00 600.00
407
397
423
409
428
493
497
498
517
494
527
487
497
516
535Singapore
Japan
ChineseTaipei
Vietnam
HongKong(China)
B-S-J-G(China)
Korea
UnitedKingdom
UnitedStates
OECDaverage
Turkey
Thailand
Mexico
Indonesia
Brazil
360.00 420.00 480.00 540.00 600.00
401
403
416
421
425
493
496
509
516
518
523
525
532
538
556
Source : OECD
“The performance
of Indonesian
students (girls and
boys) in science,
mathematics and
reading is one of the
lowest among PISA-
participating
countries with an
average ranking of
62 out of 69
countries”
Indonesia in PISA Score
TO SUCCESSFULY COMPETE IN KNOWLEDGE DRIVEN ECONOMYGreater Emphasis Should Be Put On
Science,Technology,Mathematics (STEM) subjects in Education

REGULATORY REFORM
FISCAL REFORM
INSTITUTIONAL REFORM
More Effective And Efficient Management
of Fiscal Policies
Designs Regulations That Foster Innovation,
Competition and Growth
Creating Institutions That Apply Good Governance and
adaptive to change
STRUCTURAL REFORMS IS CRITICAL FOR INDONESIA TO MAINTAIN HIGH SUSTAINABLE GROWTH IN KDE ERA
The key is to focus on three sets of reforms

Some Government Efforts To Improve Investment Climate
1. Easing Import and Export
Restrictions 2. Reducing Dwelling Time3. Revising and Perfecting Tax
Incentive Schemes (Tax Allowance
and Tax Holiday)
Institutions
Infrastructure
Macroeconomic
Environmen
Health and
Primary
Higher Education
and Training
Goods Market
Efficiency Labour Market
Efficiency
Financial Market
Development
Technological
Readiness
Market Size
Business
Sophistication
Innovation
2015 2016 2017
INDONESIAN GOVERNMENT VERY COMMITED TO CREATE STABLE AND GOOD INVESTMENT CLIMATE
While Ease Of Doing Bussiness (EODB) Score Consistently Improve, More Efforts Needs To Be Done
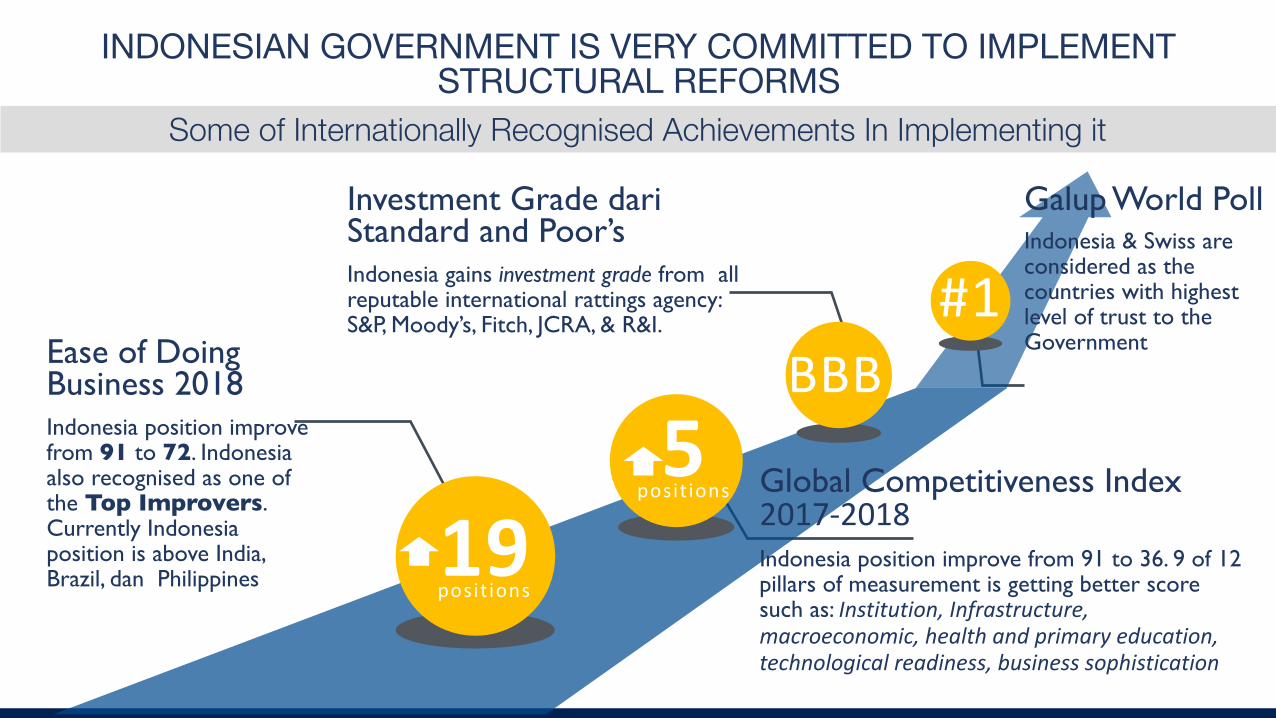
19
posit ions
5positions
BBB
#1
Indonesia position improve from 91 to 72. Indonesia also recognised as one of the Top Improvers. Currently Indonesia position is above India, Brazil, dan Philippines
Ease of Doing Business 2018
Indonesia position improve from 91 to 36. 9 of 12 pillars of measurement is getting better score such as: Institution,Infrastructure,macroeconomic,healthandprimaryeducation,
technologicalreadiness,businesssophistication
Global Competitiveness Index 2017-2018
Indonesia gains investment grade from all reputable international rattings agency: S&P, Moody’s, Fitch, JCRA, & R&I.
Investment Grade dari Standard and Poor’s Indonesia & Swiss are
considered as the countries with highest level of trust to the Government
Galup World Poll
INDONESIAN GOVERNMENT IS VERY COMMITTED TO IMPLEMENT STRUCTURAL REFORMS
Some of Internationally Recognised Achievements In Implementing it

TAX REFORMS AS
PARTS OF FISCAL
REFORMS17Slide #04

RRC Indonesia USA Germany Canada Malaysia Thailand Australia France UK
25.023.322.2
16.015.6
11.811.510.910.810.4
10 ,4 10 ,8 10 ,9 11 ,5 11 ,8
15 ,6 16 ,0
22 ,223 ,3
25 ,0
0%
4%
7%
11%
14%
0
500
1000
1500
2000
2008 2009 2010 2011 2012 2013 2014 2015 2016 2017
11.0%10.3%10.7%
11.4%11.9%11.9%11.8%
11.2%11.1%
13.3%
1495.91283.61240.41146.91077.3980.5873.9
723.3619.9658.7
13.3%
11.1% 11.2%11.8% 11.9% 11.9%
11.4%10.7% 10.3%
11.0%
Tax Revenue % of GDP
Even Among ASEAN Peers….
CHALLENGES OF INDONESIA’S TAXATION
tax revenue consistently increases every year, but tax ratio is still low

CHALLENGES OF INDONESIA’S TAXATION
40%
80%
0 mil
10 mil
20 mil
30 mil
40 mil
2013 2014 2015 2016
Registered Taxpayers (RTP) RTP with Obligation To submit Tax ReturnTax Return Submitted Tax Compliance
63%
60%59%
56%
12.711.010.910.0
20.218.218.417.7
32.830.0
27.424.3
56%
59%60%
63%
The Number of Registered Taxpayers is so small, those who pay taxes even smaller
GOVERNMENTS PRIORIT IES SPENDING IN 2018
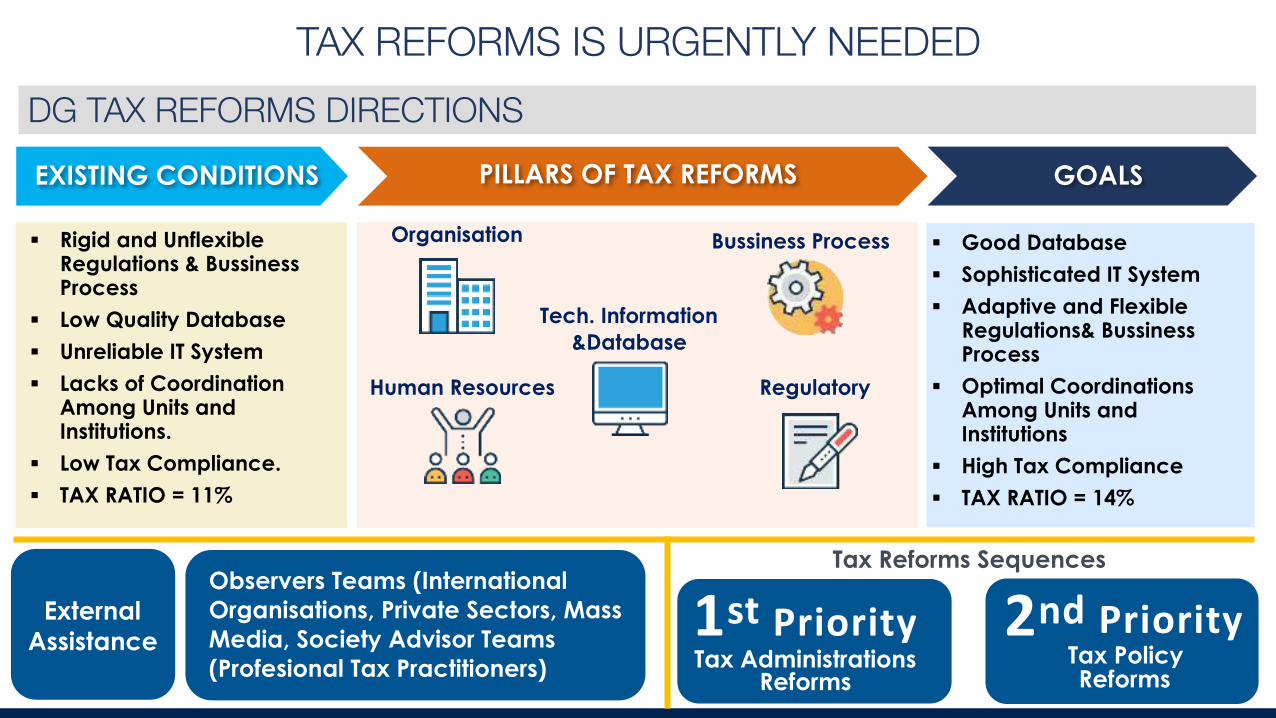
▪ Rigid and Unflexible Regulations & Bussiness Process
▪ Low Quality Database
▪ Unreliable IT System
▪ Lacks of Coordination Among Units and Institutions.
▪ Low Tax Compliance.
▪ TAX RATIO = 11%
▪ Good Database
▪ Sophisticated IT System
▪ Adaptive and Flexible Regulations& Bussiness Process
▪ Optimal Coordinations Among Units and Institutions
▪ High Tax Compliance
▪ TAX RATIO = 14%
Organisation
Human Resources
Tech. Information
&Database
Regulatory
EXISTING CONDITIONS PILLARS OF TAX REFORMS GOALS
Bussiness Process
DG TAX REFORMS DIRECTIONS
External
Assistance
Observers Teams (International
Organisations, Private Sectors, Mass
Media, Society Advisor Teams
(Profesional Tax Practitioners)
Tax Reforms Sequences
1stPriority 2nd PriorityTax Administrations
ReformsTax Policy Reforms
TAX REFORMS IS URGENTLY NEEDED

www.pajak.go.id
Domestic Declaration
4.884trilion(IDR)
Foreign Declaration
Repatriation
101 Countries In The WorldAgree to Share & Exchange Data For Taxation Purpose
TAX AMNESTY & AEOI AS PARTS OF DG TAX REFORMS
Achievement of Tax Amnesty Program
Tax Amnesty Main Purpose Is To Strengthen Tax Database, While AEOI Aims To Avoid Base Erosion and Profit Shifting

GOVERNMENTS
PRIORITIES
SPENDING IN 201822Slide #05

Allocation
Distribution
Stabilisation
STATE BUDGET AS FISCAL
INSTRUMENTS

DEFICIT
BUDGET
2018
REVENUE SPENDING
FINANCING
Tax Revenue
Non Tax Revenue
CENTRAL
GOVT
SPENDING
TRANSFER
FUND
1.894,7 2.220,7
325,9
1.618,1 1.454,5
766,2
275,4
2,19% of
GDP
GOVERNMENT BUDGET 2018 AT A GLANCEGRANT1,2 TRILLION RUPIAH

0
125
250
375
500
2013 2014 2015 2016 2017 2018
310
341.8
119.1106.8
89.9 94.5
46.159.7 65.9
92.3106.7 111
155.9 154.7
256.1269.1
400.9 410.4
332.4353.4
390.1370.4
426.7444.1
Productive Spending & Energy Subsidies (2013-2018)
Educat ion Infrastructure Health Energy Subsidies
PRODUCTIVE SPENDING CONTINUESInfrastructure Development, Reducing Inequality and Improving Human Capital Are The Government Focus, While Energy Subsidies Decrease Significantly...

CONCLUSIONS
2018 Allocation: 283,7* *Trillion Rupiah*
TARGETS 2018
PKH10 million houshold
FOOD
SUPPORT
15,6 million houshold
IND.SMART
PROGRAM
19,7 million Student
JKN FOR
POORS
92,4 million People
SUBSIDIES FOR SMALL
BUSSINESS
74.9587 Villages
VILLAGE FUND
117,7 thousand HouseHold
SOCIAL SPENDINGS TO REDUCE POVERTY AND INEQUALITY
Poverty Alleviation and Supports Towards Poor Segments Of The Society Continously Being Strengthened Through Well Designed Social Programs and Targeted Subsidies

SPENDING FOR HUMAN CAPITAL DEVELOPMENT
353,4
390,1370,4
419,8
444,1
6 ,3 10,4 (5 ,1 ) 13 ,3 5 ,8
2014 2015 2016 2017 2018
%
IND.SMART PROGRAM
SCHOOL OPERATIONAL FUND
BIDIK MISI SCHOLARSHIPS
SCHOOL REHABILITATION
TEACHER ALLOWANCE
19,7 Mil. Student
56 Mil. Student
401,5 Thousand Student
61,2 Thousand
1.8 Mil. Teacher
20% BUDGET
59,7
65,992.3
104.9
111.1
29,6 10,3 40,1 13,7 5 ,8
% 5% BUDGET
IND.HEALTHY PROGRAM
FAMILY PLANNING FACILITY
HEALTH FACILITY DEV.
FOOD & DRUG CERTIFICATION
BABY IMMUNISATION PROGRAM
92,4 Mil. People
1,8 Mil. People
49 Hospital/ Health Facility
92,5%
74 Thousand

INFRASTRUCTURE DEVELOPMENT REMAINS FOCAL FOCUS OF THE GOVERNMENT
Road Building
Targeted: 865 km
Irigation Development
Targeted: 781 km
Development of
Subsidised Apartments
Targeted:13.405 unit
Electrification Ratio
Targeted: 95,15 %
SOME GOVT
PRIORITIES FOR 2018
%
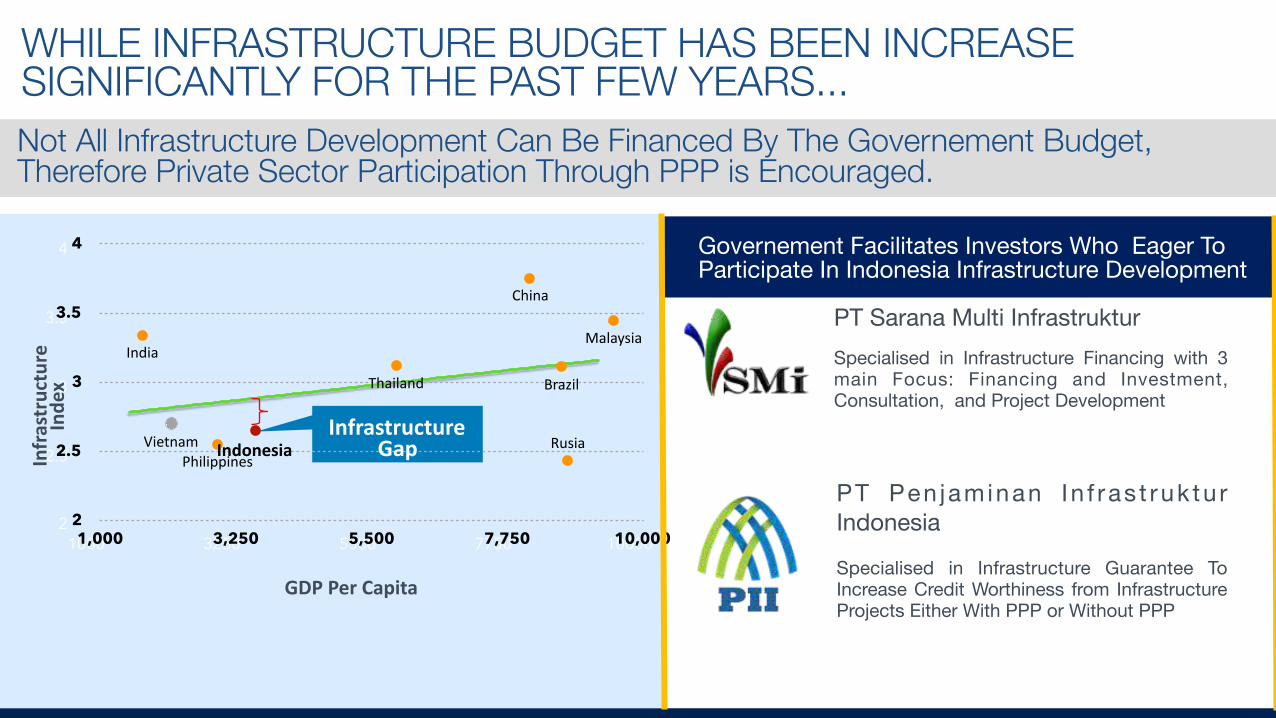
WHILE INFRASTRUCTURE BUDGET HAS BEEN INCREASE SIGNIFICANTLY FOR THE PAST FEW YEARS...
2
2.5
3
3.5
4
1000 3250 5500 7750 10000
2
2.5
3
3.5
4
1,000 3,250 5,500 7,750 10,000
Vietnam
Thailand
Malaysia
PhilippinesIndonesia
China
India
Rusia
Brazil
InfrastructureGap
GDPPerCapita
Infrastructure
Index
Governement Facilitates Investors Who Eager To Participate In Indonesia Infrastructure Development
PT Sarana Multi Infrastruktur
Specialised in Infrastructure Financing with 3 main Focus: Financing and Investment, Consultation, and Project Development
PT Pen jaminan In f ras t ruk tu r Indonesia
Specialised in Infrastructure Guarantee To Increase Credit Worthiness from Infrastructure Projects Either With PPP or Without PPP
Not All Infrastructure Development Can Be Financed By The Governement Budget, Therefore Private Sector Participation Through PPP is Encouraged.

CONCLUSIONS30Slide #06
Indonesian Economy in 2018 Will Continue To Experience Robust, Stable, and Increasing Growth, Supported By Recovery Momentums Gained During Previous Years
Indonesian Government Commited to Continue Structural Reforms (Institutional Reform, Regulatory Reform, and Fiscal Reforms) to achieve High and Sustainable Growth In The Era Of Knowledge Driven Economy
Indonesian Governement Will Continuously and Consistently Improve its Investment Climate In Order To Create A Good And Stable Environment For Bussiness To Thrive and Prosper
Indonesian Government Welcoming Any Constructive Suggestions and Advices From The Private Sectors Regarding its Efforts To Create A Good Investment Climate
Indonesian Government Strongly Encouraged And Will Facilitates Private Sectors To Take A Part In The Infrastructure Development In Indonesia
Indonesia Offers A Promising Future For Business, Dont Wait To Long!!!, Invest In Indonesia As Soon As Possible
1
2
4
5
3
6
CONCLUSIONS
THANK YOU
MINISTER OF FINANCE OF THE REPUBLIC OF INDONESIA
SRI MULYANI INDRAWATI
MANDIRI INVESTOR FORUM
7 FEBRUARY 2018
photo by KemenESDM

10 MINISTRIES AND GOVERNMENT INSTITUTIONS WITH THE LARGEST BUDGET IN 2018
Minist r ies
Government Inst i tut ions
107,7
114,2
107,4 62,2,7 59,1 48,2 41,3 40,1 32,9 45,7 23,8
102,7 60,9 54,2 17,2 36,9 37,8 27,8 40,3 23,7
96,3
95,5
12,5 8,3 6,4 5,7 5,6 5,6 5,5 4,8,7 2,8
3,3 8,2 5,2 3,8 9,8 1,9 2,2 4,0 2,7
OUTLOOK 2017APBN 2018


