

Inflammatory Markers,Inflammatory Markers,
Pharmacotherapy, and Clinical TrialsPharmacotherapy, and Clinical Trials
Paul M. Ridker, M.D., M.P.H., and Christie Paul M. Ridker, M.D., M.P.H., and Christie
M. Ballantyne, M.D.M. Ballantyne, M.D.
Is there clinical evidence that Is there clinical evidence that
inflammation can be modified by inflammation can be modified by
preventive therapies?preventive therapies?

0
1
2
3
4
5
hs-CRP, Aspirin, and Risks of Future MI: hs-CRP, Aspirin, and Risks of Future MI: Physicians' Health StudyPhysicians' Health Study
Adapted from Ridker PM et al. N Engl J Med 1997;336:973-979.©1997 Massachusetts Medical Society. All rights reserved.
Quartile of C-Reactive Protein
1 2 3 4
Aspirin
Placebo
Rela
tive R
isk
of
MI

Low-Dose Aspirin Reduces Thromboxane Low-Dose Aspirin Reduces Thromboxane
BB22 but not CRP but not CRP
Seru
m C
RP
(% o
f B
ase
line)
140
120
100
80
60
40
20
0Placebo(n=11)
Feldman M et al. J Am Coll Cardiol 2001;37:2036-2041.
140
120
100
80
60
40
20
0Seru
m T
hro
mb
oxane
(% o
f B
ase
line)
ASA 81 mg qd(n=13)
Placebo(n=11)
ASA 81 mg qd(n=13)
28 Days31 Days
* p<0.001
* *

Reduction of Proinflammatory Cytokines Reduction of Proinflammatory Cytokines and CRP with Higher-Dose Aspirin in and CRP with Higher-Dose Aspirin in Patients with Chronic Stable AnginaPatients with Chronic Stable Angina
Ikonomidis I et al. J Am Coll Cardiol 1999;100:793-798.
Placebo(n=40)
ASA 300 mg(n=40)
P
MCSF, pg/mL 991(459-1476)
843(501-1357)
<0.05
IL-6, pg/mL 3.5(3.2-4.6)
2.9(2.5-3.4)
<0.05
CRP, mg/mL 1.4(0.54-4.05)
1(0.5-3.1)
<0.05

0
5
10
15
20
25
Elevated CRP Levels in Obesity: Elevated CRP Levels in Obesity: NHANES 1988-1994NHANES 1988-1994
Visser M et al. JAMA 1999;282:2131-2135.
Normal
Perc
en
t w
ith C
RP
0.2
2
mg/d
L
Overweight Obese

Effects of Weight Loss on CRPEffects of Weight Loss on CRPConcentrations in Obese Healthy WomenConcentrations in Obese Healthy Women
83 women (mean BMI 33.8, range 28.2-43.8 kg/m2) placed on very low fat, energy-restricted diet (6.0 MJ, 15% fat) for 12 weeks
Baseline CRP positively associated with BMI (r=0.281, p=0.01)
CRP reduced by 26% (p<0.001)
Average weight loss 7.9 kg, associated with change in CRP
Change in CRP correlated with change in TC (r=0.240, p=0.03) but not changes in LDL-C, HDL-C, or glucose
At 12 weeks, CRP concentration highly correlated with TG (r=0.287, p=0.009), but not with other lipids or glucose
Heilbronn LK et al. Arterioscler Thromb Vasc Biol 2001;21:968-970.

0.00
0.50
1.00
1.50
2.00
2.50
3.00
0.0
1.0
2.0
3.0
4.0
5.0
6.0
7.0
Effects of Weight Loss in Obese Women on Effects of Weight Loss in Obese Women on IL-6, TNF-IL-6, TNF-, and CRP, and CRP
Bastard J-P et al. J Clin Endocrinol Metab 2000;85:3338-3342.
pg/m
L mg
/L
IL-6 TNF- CRP
Before diet
After very low calorie diet (mean BMI reduction 2.1 kg/m2; mean reduction in body fat mass 4 kg)
p=0.05
p=0.6
p=0.14

-50
-40
-30
-20
-10
0
Effects of n-3 Fatty Acid Therapy on Lipids Effects of n-3 Fatty Acid Therapy on Lipids and sCAMsand sCAMs
Perc
en
t C
han
ge
Abe Y et al. Arterioscler Thromb Vasc Biol 1998;18:723-731.
TG TC sICAM-1 sE-selectin
All Patients
DM Patients
*
*
**
* p<0.05

Effect of ACE Inhibition vs. Angiotensin II Effect of ACE Inhibition vs. Angiotensin II Receptor Blockade on sCAMs and CRP in Receptor Blockade on sCAMs and CRP in Type 1 Diabetics with Diabetic NephropathyType 1 Diabetics with Diabetic Nephropathy
580
590
600
610
620
630
640
650
660
200
220
240
260
280
300
Andersen S et al. Diabetes Care 2000;23:1031-1032.
PlaceboPlaceboLosartan 50 mgLosartan 50 mg
Losartan 100 mgLosartan 100 mg
Enalapril 10 mgEnalapril 10 mg
Enalapril 20 mgEnalapril 20 mg
*p<0.05 vs. *p<0.05 vs. placeboplacebo
**
** **sVC
AM
-1, ng/m
l sICA
M-1
, ng/m
l

Effect of ACE Inhibition vs. Angiotensin II Effect of ACE Inhibition vs. Angiotensin II Receptor Blockade on sCAMs and CRP in Receptor Blockade on sCAMs and CRP in Type 1 Diabetics with Diabetic NephropathyType 1 Diabetics with Diabetic Nephropathy
50
51
52
53
54
55
56
57
58
59
60
0.50
0.60
0.70
0.80
0.90
1.00
1.10
1.20
PlaceboPlaceboLosartan 50 mgLosartan 50 mg
Losartan 100 mgLosartan 100 mg
Enalapril 10 mgEnalapril 10 mg
Enalapril 20 mgEnalapril 20 mg
*p<0.05 vs. *p<0.05 vs. placeboplacebo
****
sE-s
ele
ctin
, ng/m
lC
RP, n
g/m
l
Andersen S et al. Diabetes Care 2000;23:1031-1032.

Effect of HRT on hs-CRP: Effect of HRT on hs-CRP: the PEPI Studythe PEPI Study
3.0
2.0
1.0hs-
CR
P (
mg/d
L)
Months
0 12 36
Cushman M et al. Circulation 1999;100:717-722.1999 Lippincott Williams & Wilkins.
CEE + MPA cyclicCEE + MPA continuousCEE + MPCEE
Placebo

0.0
0.5
1.0
1.5
2.0
hs-CRP and Relative Risk of Recurrent hs-CRP and Relative Risk of Recurrent Coronary Events: Coronary Events: CARECARE
Ridker PM et al. Circulation 1998;98:839-844.1998 Lippincott Williams & Wilkins.
1<0.12
Rela
tive R
isk
Quintile of hs-CRP (range, mg/dL)
P=0.02
20.12-0.20
30.21-0.37
40.38-0.66
5>0.66
PP Trend = 0.044 Trend = 0.044

0
1
2
3
Inflammation, Pravastatin, and Relative Inflammation, Pravastatin, and Relative Risk of Recurrent Coronary Events: Risk of Recurrent Coronary Events: CARECARE
Ridker PM et al. Circulation 1998;98:839-844.1998 Lippincott Williams & Wilkins.
Pravastatin
Rela
tive R
isk
Inflammation Absent
PP Trend = 0.005 Trend = 0.005
Placebo Pravastatin Placebo
Inflammation Present
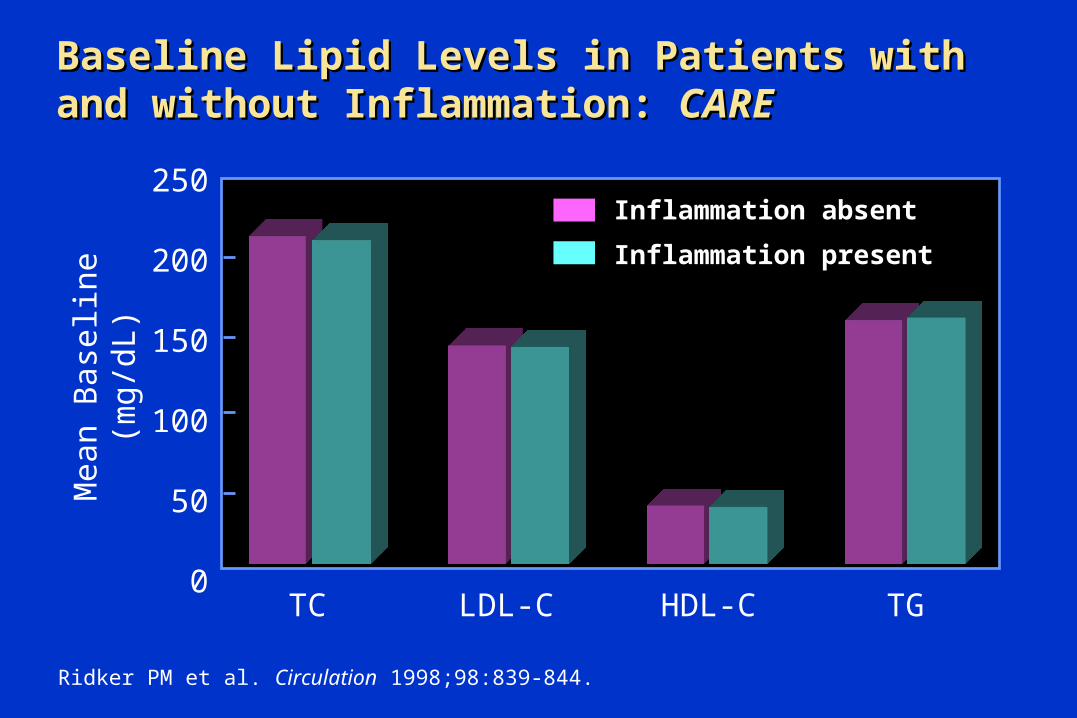
Mean B
ase
line (
mg
/dL) Inflammation absent
Inflammation present
250
200
150
100
50
0TC LDL-C HDL-C TG
Baseline Lipid Levels in Patients with and Baseline Lipid Levels in Patients with and without Inflammation: without Inflammation: CARECARE
Ridker PM et al. Circulation 1998;98:839-844.

Long-Term Effect of Pravastatin on hs-CRP:Long-Term Effect of Pravastatin on hs-CRP:CARE Placebo and Pravastatin GroupsCARE Placebo and Pravastatin Groups
Adapted from Ridker PM et al. Circulation 1999;100:230-235.1999 Lippincott Williams & Wilkins.
PravastatinPravastatin
PlaceboPlacebo
Med
ian
hs-
CR
PC
on
cen
trati
on
(m
g/d
L)
––21.6%21.6%((PP=0.007)=0.007)
0.25
0.24
0.23
0.22
0.21
0.20
0.19
0.18Baseline 5 Years

Change in hs-CRP Concentration Over 5 Change in hs-CRP Concentration Over 5 Years: Years: CARE Subgroup AnalysesCARE Subgroup Analyses
Change in hs-CRP over 5 Years (mg/dL)
HDL-C <35 mg/dL
All Subjects
Pravastatin
Age >60 yearsAge <60 yearsBMI >27 kg/m2
BMI <27 kg/m2
Placebo
SmokersNonsmokers
SBP >128 mm HgSBP <128 mm HgDBP >78 mm HgDBP <78 mm Hg
LDL-C >138 mg/dLLDL-C <138 mg/dLHDL-C >35 mg/dL
Triglycerides >160 mg/dLTriglycerides <160 mg/dL
-0.2 -0.1 0 0.1 0.2 0.3
Ridker PM et al. Circulation 1999;100:230-235.

Change in hs-CRP according to Observed Changes Change in hs-CRP according to Observed Changes in LDL-C: in LDL-C: CARE Placebo and Pravastatin GroupsCARE Placebo and Pravastatin Groups
Change in LDL-C (mg/dL)
Increase0–25
Decrease0–25
Decrease25–50
Decrease50–75
Decrease>75
Change in h
s-C
RP
(mg/d
L)
Placebo
Pravastatin
-0.15
-0.10
-0.05
0
0.05
0.10
0.15
Ridker PM et al. Circulation 1999;100:230-235.1999 Lippincott Williams & Wilkins.

Relative Risks of Future MI among Apparently Relative Risks of Future MI among Apparently Healthy Middle-Aged Men: Healthy Middle-Aged Men: Physician’s Health StudyPhysician’s Health Study
Relative Risk for Future MI0 1.0 2.0 4.0 6.0
Lipoprotein(a)Homocysteine
FibrinogentPA Antigen
hs-CRPhs-CRP + TC/HDL-C
Total Cholesterol
TC:HDL-C
Ridker PM. Ann Intern Med 1999;130:933-937.1999 ACP-ASIM.

CRP in Combination with LDL-C as a Method CRP in Combination with LDL-C as a Method to Target Statin Therapy in Primary to Target Statin Therapy in Primary Prevention: Prevention: AFCAPS/TexCAPSAFCAPS/TexCAPS
Ridker PM et al. N Engl J Med 2001;344:1959-1965.
Study Group Lovastatin Placebo NNT
Low LDL-C/low CRP 0.025 0.022 _
Low LDL-C/high CRP 0.029 0.051 48
High LDL-C/low CRP 0.020 0.050 33
High LDL-C/high CRP 0.038 0.055 58
Median LDL-C = 149.1 mg/dLMedian CRP = 0.16 mg/dL
Event Rate

CRP in Combination with TC:HDL-C Ratio as CRP in Combination with TC:HDL-C Ratio as a Method to Target Statin Therapy in a Method to Target Statin Therapy in Primary Prevention: Primary Prevention: AFCAPS/TexCAPSAFCAPS/TexCAPS
Ridker PM et al. N Engl J Med 2001;344:1959-1965.
Study Group Lovastatin Placebo NNT
Low TC:HDL-C/low CRP 0.024 0.025 983
Low TC:HDL-C/high CRP 0.025 0.050 43
High TC:HDL-C/low CRP 0.021 0.050 35
High TC:HDL-C/high CRP 0.041 0.057 62
Median TC:HDL-C = 5.96Median CRP = 0.16 mg/dL
Event Rate

hs-CRP: Potential Clinical Applicationshs-CRP: Potential Clinical Applications
Adjunct to lipid screening in the detection of individuals at high risk for coronary artery disease
Method to better target statin therapy in the setting of primary prevention
Potential prognostic value in acute coronary syndromes
Inflammation is likely to represent a new target for both the treatment and prevention of acute myocardial infarction

0
5
10
15
20
Statin Therapy, Lipid Levels, CRP, and Statin Therapy, Lipid Levels, CRP, and Survival Among Patients with Severe Survival Among Patients with Severe Coronary Artery DiseaseCoronary Artery Disease
Horne BD et al. J Am Coll Cardiol 2000;36:1774-1780.2000 Reprinted with permission from the American College of Cardiology.
CRP Tertiles StatinsStatins
Low
Mort
alit
y (
%)
CRP Tertiles No StatinsNo Statins
Medium High Low Medium High
PP Trend = Trend = 0.940.94
PP Trend Trend <0.0001<0.0001

Short-Term Effects of Statins on Short-Term Effects of Statins on hs-CRP Levelshs-CRP Levels
Randomized, double-blind, crossover trial with 22 hyperlipidemic patients (LDL-C >130, TG 200-600 mg/dL)
6 weeks of therapy with either simvastatin 20 mg, atorvastatin 10 mg, or pravastatin 40 mg
3-week washout between drugs
Jialal I et al. Circulation 2001;103:1933-1935.

Effect of Statin Therapy on Lipid and Effect of Statin Therapy on Lipid and Lipoprotein Levels at 6 WeeksLipoprotein Levels at 6 Weeks
Jialal I et al. Circulation 2001;103:1933-1935.
Baseline Pravastatin Simvastatin Atorvastatin
TC 264.3+36.9 219.7+37.8* 201.0+35.1* 191.5+33.5*
LDL-C 169.7+37.1 132.8+35.4* 118.3+30.2* 113.8+28.4*
HDL-C 44.7+13.2 45.8+12.8 45.7+13.4 44.8+12.5
TG 230.3(144-588)
178.8(97-1352)
164.0(91-400)*
162.3(87-581)*
Mean +SD or median (range), mg/dL*P<0.001 vs. baseline

hs-
CR
P (
mg/L
)Effect of Statin Therapy on hs-CRP Levels Effect of Statin Therapy on hs-CRP Levels at 6 Weeksat 6 Weeks
Jialal I et al. Circulation 2001;103:1933-1935.2001 Lippincott Williams & Wilkins.
6
5
4
3
2
1
0 Baseline
* * *
Prava(40 mg/d)
Simva(20 mg/d)
Atorva(10 mg/d)
*p<0.025 vs. Baseline

Effect of Cerivastatin on CRP Levels in Effect of Cerivastatin on CRP Levels in Patients with HypercholesterolemiaPatients with Hypercholesterolemia
Ridker PM et al. Circulation 2001;103:1191-1193.2001 Lippincott Williams & Wilkins.
-13.3 -11.1 -13.3
-41.0-37.3
-42.2
7.8 6.7 8.0
-50.0
-40.0
-30.0
-20.0
-10.0
0.0
10.0
20.0
Chan
ge a
t 8 w
eeks
, %
n=785 n=623n=162
All patients 0.4 mg 0.8 mg
CRP LDL-C HDL-C
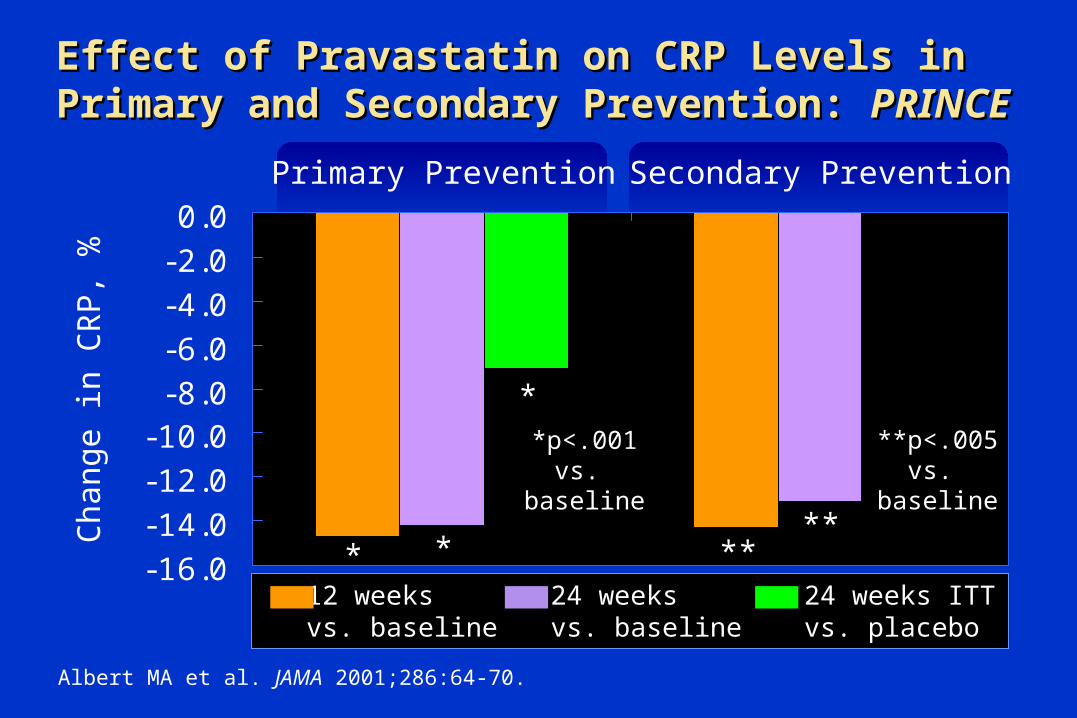
Effect of Pravastatin on CRP Levels in Effect of Pravastatin on CRP Levels in Primary and Secondary Prevention: Primary and Secondary Prevention: PRINCEPRINCE
-16.0-14.0-12.0-10.0-8.0-6.0-4.0-2.00.0
Primary Prevention
Chan
ge in
CR
P,
%
Secondary Prevention
* *
*
****
Albert MA et al. JAMA 2001;286:64-70.
12 weeksvs. baseline
24 weeksvs. baseline
24 weeks ITTvs. placebo
*p<.001vs.
baseline
**p<.005vs.
baseline

Effect of Bezafibrate with and without Fluvastatin Effect of Bezafibrate with and without Fluvastatin on Plasma Fibrinogen, PAI-1, and CRP in Patients on Plasma Fibrinogen, PAI-1, and CRP in Patients with CAD and Mixed Hyperlipidemiawith CAD and Mixed Hyperlipidemia
Beza 400 mg/d
Beza 400 mg/d+ fluva 20 mg/d
Beza 400 mg/d+ fluva 40 mg/d
Cortellaro M et al. Thromb Haemost 2000;83:549-553.
-20-15-10
-505
1015
Chan
ge a
t 24
weeks
, %
n: 81
Fibrinogen PAI-1 CRP
80 74
70 72 63 83 80 75
P<0.05 vs. baseline**
*

Effect of Gemfibrozil and Ciprofibrate on Plasma Effect of Gemfibrozil and Ciprofibrate on Plasma Fibrinogen and CRP Levels in Patients with Fibrinogen and CRP Levels in Patients with Primary HypercholesterolemiaPrimary Hypercholesterolemia
de Maat MPM et al. Thromb Haemost 1997;77:75-79.
0.00
0.50
1.00
1.50
2.00
2.50
3.00
3.50
4.00
0.00
0.20
0.40
0.60
0.80
1.00
1.20
1.40Pretreatment 12 Weeks
*
*
Fib
rin
og
en
, g
/L CR
P, m
g/L
Gemfibrozil600 mg bid
(n=51)
Ciprofibrate100 mg/d
(n=48)
Gemfibrozil600 mg bid
(n=51)
Ciprofibrate100 mg/d
(n=48)
*p<0.005 vs. pretreatment level

SummarySummary
Lifestyle modification and some pharmacotherapies (full-dose ASA, statins) lower hs-CRP
Lipid-modifying therapies with oral estrogens and fibrates are not associated with reduction in hs-CRP
Individuals with high levels of hs-CRP are at increased risk for CHD events and benefit from ASA and statins


