
Information Foraging &
Information Scent:
Theory, Models, and Applications
Peter Pirolli
User Interface Research
Work supported in part by the Office of Naval Research

Aim of this Talk
• Overview – Information foraging theory – Information scent
• Sample of psychological investigations• Sample of applications

Webpages
Database
Server
Human-Information Interaction:Can approach from user or producer side

Overview
• Motivations, origins, assumptions• Initial development: Scatter/Gather use• Extension: WIF-ACT model of WWW use• Information scent as a critical parameter
of the large-scale shape of WWW use
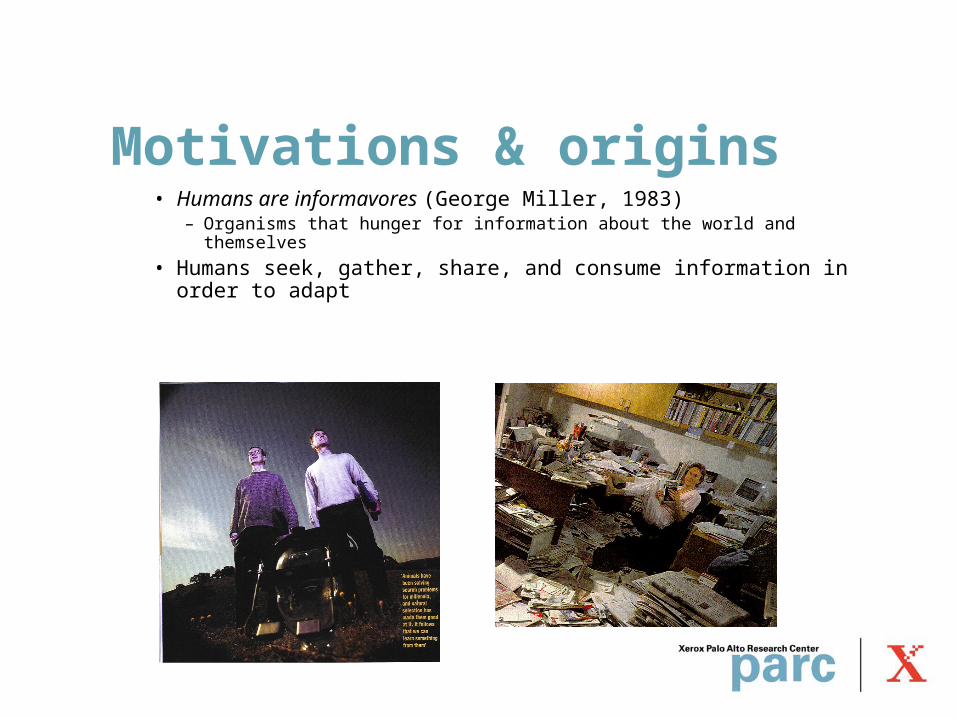
Motivations & origins• Humans are informavores (George Miller, 1983)
– Organisms that hunger for information about the world and themselves
• Humans seek, gather, share, and consume information in order to adapt

Pressures of the information environment
Journals/People x106
Year
0.01
0.1
1
10
100
1000
10000
100000
1000000
1750 1800 1850 1900 1950 2000
Journals
Growth of available information
Source: Price (1963)

Pressures of the information environment
YearYear
0.01
0.1
1
10
100
1000
10000
100000
1000000
1750 1800 1850 1900 1950 2000
Capacity of human working memory
Growth in attention

Pressures of the information environment
Herbert A. Simon
A wealth of informationcreates a poverty of attention and a need to allocate it efficiently
“”

WWW challenges HCI theory
• 2003 e-commerce revenue = $1 Trillion (est.)
BUT• 65% of virtual shopping trips end in failure
(Souza, 2000)
• 1M site visitors, 40% do not return, cost=$2.8 M (Manning, 1998)
• WWW site redesigns = $1.5 M/yr to $2.8 M/yr (Manning, 1998)

Information Foraging Theory
• Take concept of informavores seriously• Key ideas
– Information scent. Local cues used to explore and search information spaces
– Economics of attention and the cost structure of information
– Optimal foraging models

Take concept of informavores seriously
• Information processing systems evolve so as to maximize the gain of valuable information per unit cost– Sensory systems (vision, hearing)– Information access (card catalogs, offices)
• Natural selection has made animals (and our human ancestors) very good at searching for food (foraging)– Modern information foragers use problem-solving
abilities with deep evolutionary roots in food foraging
information valuecost of interaction[ ]maximize

Time scales of analysis
Time scale (s)Psychologicaldomain
10-1000 •Problem solving•Decision making
1-100•Visual search•Motor behavior
Pete Pirolli's Home Page
Peter Pirolli. ... Palo Alto, CA 94304 USA phone: +1-650-812-4483 fax: +1-650-812-4241
email: [email protected] This page updated December 18, 2000.
www.parc.xerox.com/istl/members/pirolli/pirolli.html - 9k - Cached - Similar pages
.100-1•Visual attention•Perceptual judgment
User Interface Domain

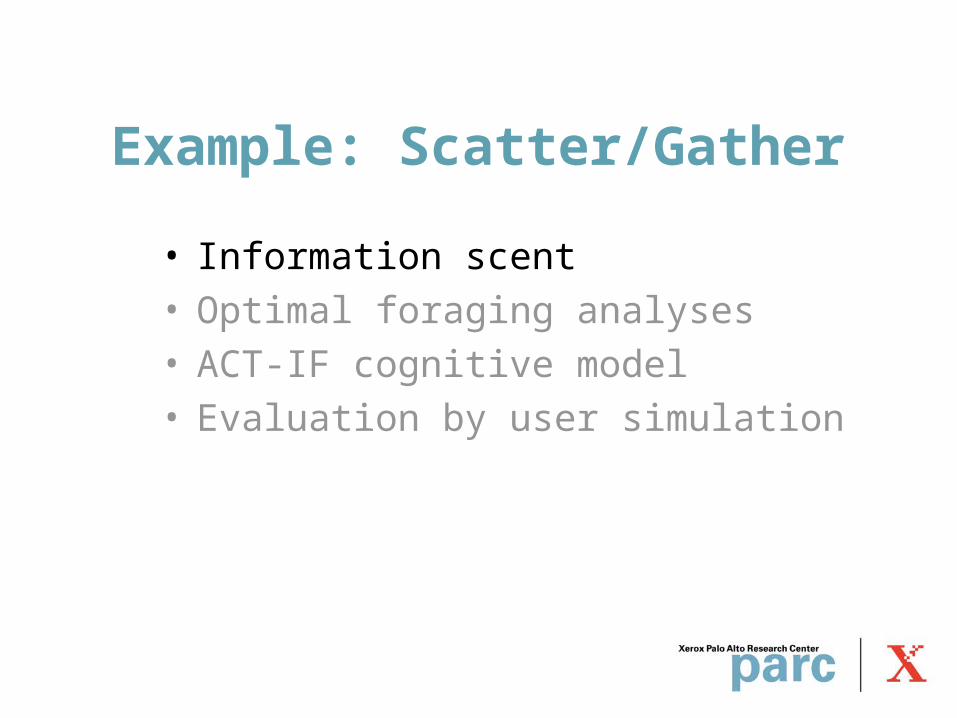
Example: Scatter/Gather
• Information scent• Optimal foraging analyses• ACT-IF cognitive model• Evaluation by user simulation
Example: Scatter/Gather
• Information scent• Optimal foraging analyses• ACT-IF cognitive model• Evaluation by user simulation
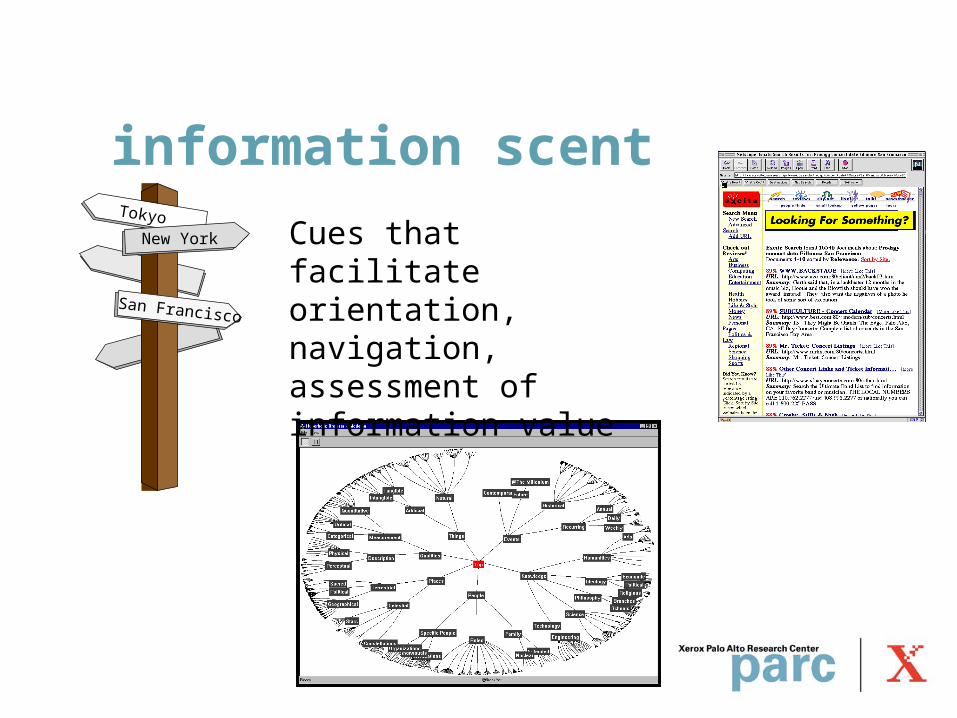
information scentTokyo
San Francisco
New York Cues that facilitate orientation, navigation, assessment of information value

Scatter/Gather
• supports exploration/browsing of very large full-text collections (~ 1,000,000)
• creates clusters of content-related documents• presents users with overviews of cluster
contents• allows user to navigate through clusters and
overviews• More recently extended to multi-modal
Scatter/Gather (Chen et al., 1999)– Images + text

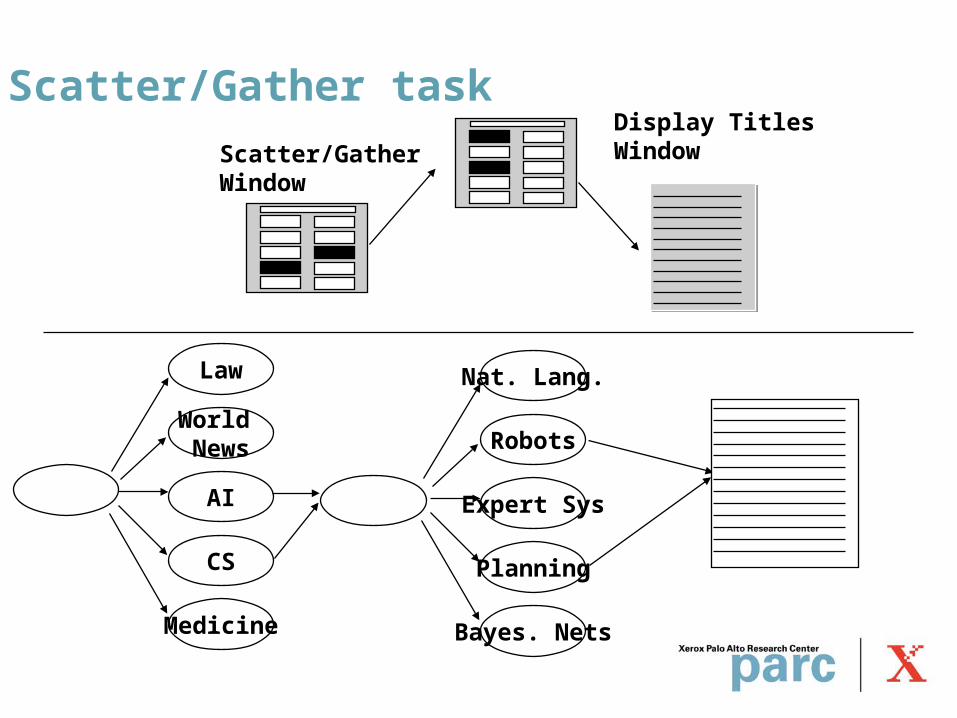
Scatter/Gather task
Scatter/GatherWindow
Law
World News
AI
CS
Medicine
Nat. Lang.
Robots
Expert Sys
Planning
Bayes. Nets
Display TitlesWindow

information scent
cell
patient
dose
beam
new
medical
treatments
procedures
InformationNeed
Text snippet
• Spreading activation– Derived from models of human memory– Activation reflects likelihood of relevance
given past history and current context– Approximates Bayesian network
0
1
2
3
4
5
6
7
1 2 3 4 5 6 7 8 9 10
Rank
Pro
bab
ilit
y r
ele
van
t Observed Rating
Predicted Rating

spreading activation
Bi = ln( ) Pr(i)Pr(not i)
Sji = ln( ) Pr(j|i)Pr(j|not i)
i“bread”
j“butter”
Ai = Bi + WjSji
Activation of node i
Base-levelactivation
Activation spreadfrom linked nodes j
Base-level reflects likelihood of occurrence
Strength of link spread reflects likelihoodof cooccurrance

spreading activation networks(for modeling “scent”)
Documentcorpus
Wordstatistics
Spreadingactivationnetwork

interface provides good scent of underlying document clustering
0
0.05
0.1
0.15
0.2
0.25
0.3
0.35
0.4
0.45
0.5
0 1 2 3 4 5 6 7 8 9 10
Rank of Cluster (c)
Pro
port
ion
of
Rele
van
t D
ocu
men
tsdP(c)
dD(c)Identified by computerPerceived by model

Summary: Information Scent
• Spreading activation predicts user judgments
• Networks built a priori. Only need to estimate one scaling parameter from user data
• Can be used to assess “goodness of links”

Example: Scatter/Gather
• Information scent• Optimal foraging analyses• ACT-IF cognitive model• Evaluation by user simulation

cost/value estimates• TREC
– queries and expert-identified relevant documents
• Analysis of clustering algorithm– distribution of relevant information over
clusters– Time costs

foraging evaluations
enrich
exp
loit
choose cluster
total relevant documents
task time
RD =
t1 + N t2
Activation from cluster text
Number of relevant documents in clusterTime to process cluster
Time to process relevant docsTime to process all docs
RSG = RD at t + 1

Cluster selection (optimal diet model)
Rank profitability
Rel
evan
t do
cum
ents
/sec
ond
0
2
4
6
8
10
12
14
16
0 1 2 3 4 5 6 7 8 9 10
Number of relevant documents in cluster
Time to process cluster =
Total relevant documentsTotal timeR =
R
Optimum
Choose clusters (in descending rank ) if > R

enrichment v exploitation
0 200 400 600 800 10000
.01
.02
.03
.04
.05
.06
R*SG
R*D
Time (sec)
Rat
e o
f ga
in
R*SG > R*
D R*D > R*
SG
relevant documentstime cost
if user chooses to display clusters now
if user choosesto display later(after more Scatter/Gather)
R=

Example: Scatter/Gather
• Information scent• Optimal foraging analyses• ACT-IF cognitive model• Evaluation by user simulation

Model-Tracing Method
System UsersCognitive
Model
Trace
Psychology
Optimal foragingtheory

ACT-IF production system
Declarative Memory Procedural Memory
Condition -> Action
Condition -> Action
Condition -> Action
Condition -> Action
PerceptualInput
MotorOutput
Foragingevaluationheuristics

production rule evaluationsSELECT-RELEVANT-CLUSTERGoal is to Process Scatter/Gather Window& there is a Query& there is an unselected cluster
Select the cluster
DO-SCATTER/GATHERGoal is to Process Scatter/Gather Window& there is a Query& some clusters have been selected
Scatter/Gather the window
DO-DISPLAY-TITLESGoal is to Process Scatter/Gather Window& there is a Query& some clusters have been selected
Scatter/Gather the window
RSG
RD

Model predicts user action
0
50
100
150
200
250
1 2 3 4 5 6 7 8 9
10
More
Rank of Predicted Production
Fre
qu
en
cy

Example: Scatter/Gather
• Information scent• Optimal foraging analyses• ACT-IF cognitive model• Evaluation by user simulation

Evaluation by user simulation
0
10
20
30
40
50
Few ManyPerc
en
t C
han
ge f
rom
Baselin
e(R
ele
van
t D
ocu
men
ts)
ImprovedClustering
FasterInteraction
0
10
20
30
40
50
Soft Hard
Task Deadline ConditionRepository Results Relevant to Task
ImprovedClustering
FasterInteraction

Summary: Scatter/Gather
• ACT-IF model matches user behavior• (most of) Model specified a priori• People optimize value/cost using
foraging heuristics

Overview
• Motivations, origins, assumptions• Initial development: Scatter/Gather use• Extension: WIF-ACT model of WWW use• Information scent as a critical parameter
of the large-scale shape of WWW use

WIF-ACT
• Web Information Foraging - ACT• Not a reality yet
– Preliminary version interacts with Internet Explorer
• What we have done:– Specialized instrumentation– Methodology– Preliminary analysis of information foraging and
information scent

Instrumentation
WebLogger
Eye trackerPoints of regard
Event logWebEyeMapper
Interface objects
Fixation table
Cached pages
Database& statistics
Visualizations
WebLogger
Eye trackerPoints of regard
Event logWebEyeMapper
Interface objects
Fixation table
Cached pages
Database& statistics
Visualizations

WebLogger Event File
(BEFORE-NAVIGATE (http://altavista.com/ ) 105.331s 0.100s 951763010 10:36:50)(DOC-MOUSEMOVE (881 122 ) 105.431s 0.100s 951763010 10:36:50)(NAVIGATE-COMPLETE (http://www.altavista.com/)105.632s 0.201s 951763011 10:36:51)(EYETRACKER-SYNC (103 ) 106.242s 0.610s 951763011 10:36:51)(DOCUMENT-COMPLETE (http://www.altavista.com/)106.773s 0.531s 951763012 10:36:52)(SCROLL-POSITION (0 0 759 1181 ) 106.853s 0.080s 951763012 10:36:52)(DOC-MOUSEMOVE (874 123 ) 107.024s 0.171s 951763012 10:36:52)(DOC-MOUSEMOVE (874 123 ) 107.044s 0.020s 951763012 10:36:52)(DOC-MOUSEMOVE (874 123 ) 107.214s 0.170s 951763012 10:36:52)(EYETRACKER-SYNC (104 ) 107.244s 0.030s 951763012 10:36:52)(CHAR (a 874 123 ) 108.125s 2.904s 951763013 10:36:53)(EYETRACKER-SYNC (105 ) 108.245s 1.001s 951763013 10:36:53)(DOC-KEYPRESS (a INPUT ) 108.446s 0.201s 951763013 10:36:53)


Study• 6 “Find information” tasks, e.g.,
– “You are Chair of Comedic events for Louisiana State University in Baton Rouge. Your computer has crashed and you have lost several advertisements for upcoming events. You know that the Second City tour is coming to your theatre in the spring, but you do not know the precise date. Find the date the comedy troupe is playing on your campus. Also find a photograph of the group to put on the advertisement.”
• 12 Stanford University students• 2 tasks (CITY, ANTZ) analyzed for 4 participants

Analysis
• Task/Information environment– Information patch structure– Problem space structure
• Information scent

Information structure
• Web sites– Portals– Search engines
• Pages– Website home page– Search engine page– Hitlist page
• Content elements
YahooMovie Posters Archive
123 Posters

Problem space structure
– URL
– Link
– Keyword
– Visual Search
123 Posters AntzS
www.antz.com www.antz.com/antzstoreCLCL
www.antzthemovie.com www.google.comTUTU

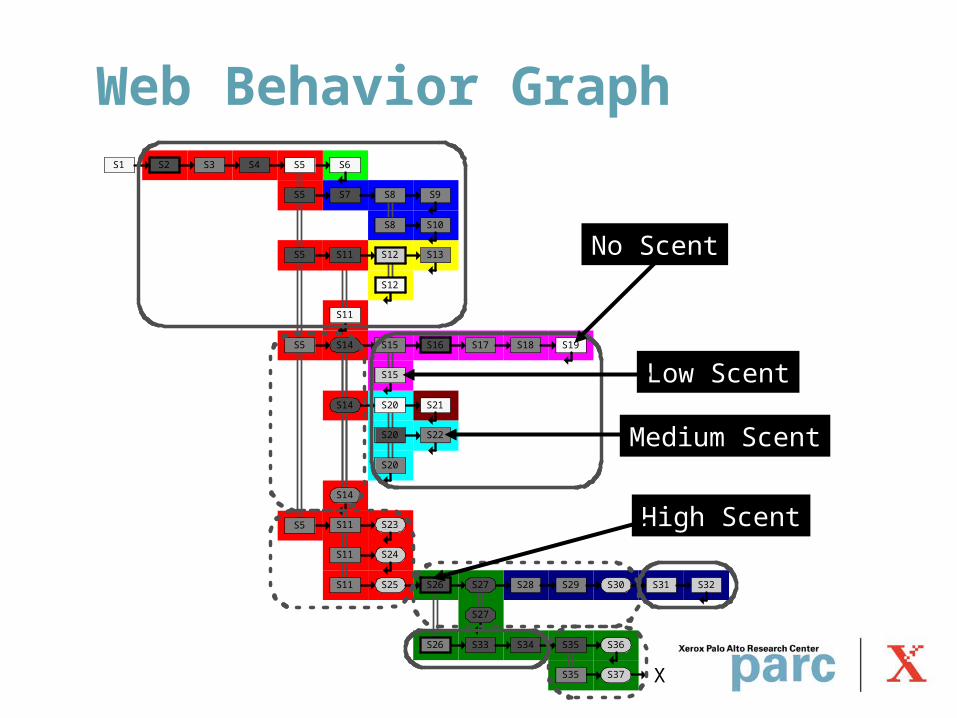
Web Behavior GraphS1 S2 S3 S4 S6
S7 S9
S10
S13
S16 S17 S18 S19
S21
S22
S23
S24
S25 S28 S29 S30 S31 S32
S33 S34 S36
S37 X
S5
S5
S5
S5
S5
S8
S8
S12
S12
S11
S11
S15
S15
S20
S20
S20
S11
S11
S11
S14
S14
S14
S26 S27
S27
S26 S35
S35

S1 S2 S3 S4 S6
S7 S9
S10
S13
S16 S17 S18 S19
S21
S22
S23
S24
S25 S28 S29 S30 S31 S32
S33 S34 S36
S37 X
S5
S5
S5
S5
S5
S8
S8
S12
S12
S11
S11
S15
S15
S20
S20
S20
S11
S11
S11
S14
S14
S14
S26 S27
S27
S26 S35
S35
State in Problem Space
Hit List
Web Behavior Graph

S1 S2 S3 S4 S6
S7 S9
S10
S13
S16 S17 S18 S19
S21
S22
S23
S24
S25 S28 S29 S30 S31 S32
S33 S34 S36
S37 X
S5
S5
S5
S5
S5
S8
S8
S12
S12
S11
S11
S15
S15
S20
S20
S20
S11
S11
S11
S14
S14
S14
S26 S27
S27
S26 S35
S35
Execution of Operator
Return to Previous State
Web Behavior Graph

S1 S2 S3 S4 S6
S7 S9
S10
S13
S16 S17 S18 S19
S21
S22
S23
S24
S25 S28 S29 S30 S31 S32
S33 S34 S36
S37 X
S5
S5
S5
S5
S5
S8
S8
S12
S12
S11
S11
S15
S15
S20
S20
S20
S11
S11
S11
S14
S14
S14
S26 S27
S27
S26 S35
S35
Yahoo123 Posters
Web Behavior Graph

S1 S2 S3 S4 S6
S7 S9
S10
S13
S16 S17 S18 S19
S21
S22
S23
S24
S25 S28 S29 S30 S31 S32
S33 S34 S36
S37 X
S5
S5
S5
S5
S5
S8
S8
S12
S12
S11
S11
S15
S15
S20
S20
S20
S11
S11
S11
S14
S14
S14
S26 S27
S27
S26 S35
S35
Link Problem Space
URL Problem Space
Keyword Problem Space Visual Search
Problem Space
Web Behavior Graph
S1 S2 S3 S4 S6
S7 S9
S10
S13
S16 S17 S18 S19
S21
S22
S23
S24
S25 S28 S29 S30 S31 S32
S33 S34 S36
S37 X
S5
S5
S5
S5
S5
S8
S8
S12
S12
S11
S11
S15
S15
S20
S20
S20
S11
S11
S11
S14
S14
S14
S26 S27
S27
S26 S35
S35
No Scent
High Scent
Low Scent
Medium Scent
Web Behavior Graph

S1 S3 S4 S5 S6 S7
S8 S9 S11
S9
S14
S15
S4 S16 S17
S22
S23
S2
S2
S8
S8
S13
S13
S8
S8
S13
S10
S10
S18 S19 S20
S19 S20
S19
S18 S21
S21 X
S12
S12
S1 S3 S4 S6
S7
S10
S11 S12 S13
S15
S17
S18 S19 S20 X
S2
S2
S2
S8
S8
S8
S5
S5
S5
S5
S9
S9
S14
S14
S16
S16
t?
S2 S4
S5 S6 S9
S13
X
S1
S1
S3
S3 S8
S8 S11
S11
S12
S12
S12
S10
S7
S7
S10
S7
S10
S1 S2 S3 S4 S6
S7 S9
S10
S13
S16 S17 S18 S19
S21
S22
S23
S24
S25 S28 S29 S30 S31 S32
S33 S34 S36
S37 X
S5
S5
S5
S5
S5
S8
S8
S12
S12
S11
S11
S15
S15
S20
S20
S20
S11
S11
S11
S14
S14
S14
S26 S27
S27
S26 S35
S35
S1 S3
S4
S10 S11 S12 S13
S2
S2 S5 S6 S7 S8 S9
S7 S9
S8
S7
S6 S7
S6
S5
S1 S2 S3 S4 S5 S7 S8 S9
S6 S10 S11 S12 S13
S6
S1 S2 S3 S4 S5 S6 S8
S9
S7
S7
S1 S2 S3 S4 S5 S6 S8
S9
S7
S7
ANTZ
CITY
S1 S6 S7 S10
S1 S6 S7 S10
Web Behavior Graphs (WBGs)

Information scent & leaving a site
0
0.5
1
1.5
2
2.5
3
Last-4 Last-3 Last-2 Last-1 Last AvgNext
Page visit at site
Sce
nt
rati
ng
3-Visits (N =3)
5-Visits(N =6)
Patch-leaving policy:
Leave Web site when information scent goes below some threshold

WWW Study Summary
• “Patchy” structure of the WWW– Goals and behavior organized around information
patches
• Multiple problem spaces• WBGs reveal heuristic search
– Easy search could be facilitated by making operations more efficient
– Hard (heuristic) search could be facilitated by better heuristic information (i.e., information scent)
• Information scent controls significant amount of behavior

Overview
• Motivations, origins, assumptions• Initial development: Scatter/Gather use• Extension: WIF-ACT model of WWW use• Information scent as a critical parameter
of the large-scale shape of WWW use

Usability gurus tout information scent key to good WWW design

UI research on better link summaries
• Enhanced Thumbnails (Woodruff et al., 2001)
• Picture thumbnails + emphasized text relevant to query or helpful in assessing page
0
20
40
60
80
100
120
Text Plain Enhanced
Tota
l Sea
rch
Tim
e (s
)
Note: N = 12

Information scent and large-scale Web use regularities
• Information scent, stickiness, and the universal law of surfing
• Phase shifts in cost structure of surfing

0
4,000
8,000
12,000
16,000
20,000
0 5 10 15 20 25 30 35 40 45 50
Clicks (L)
Fre
qu
en
cyInverse Gaussian Distribution
L
L
LLP
2
3
3 2exp
2)(
Variance(L) = 3/
GVU Website

surfers at each level
1
10
100
1000
1 10 100 1000
log(Clicks) log(L)
log
(Fre
qu
ency
)
slope -3/2
2og
2)(
og23
)(og 2
2
lL
LLlLPl

Surfing as Brownian motion(or real option)
• V is expected value• L is the number of clicks
L varies as independent
and identically distributed Gaussian
• Surfing proceeds until the perceived cost is larger than the discounted expected future value (VL hits a threshold)
VL = VL-1 + L
• Mean rate & variance of movement towards threshold
• High scent pages likely to lead to high scent; low scent to low scent
(Huberman, Pirolli, Pitkow, & Lukose, 1997)

Phase shifts in search costs
• “Thumbnails are better because you don’t have to waste time reading words”
• Implies that speed is the important factor• BUT: Improvements in accuracy have
qualitative impact

Information scent and the cost of search(based on Hogg & Huberman, 1987)
D = depth of search hierarchy
z = average branching fraction
(1- q) = prob. of eliminating wrong branches
(q, z) = qz =average no. branches explored
A(U, q, z) = average no. nodes explored within distance U= (1- (q, z)U +1)/(1-(q, z))
N(D, z, q) = average no. nodes examined before desired goal found
= (z - 1)q2[ ] A(s - 1, q, z)
s=1
D-1
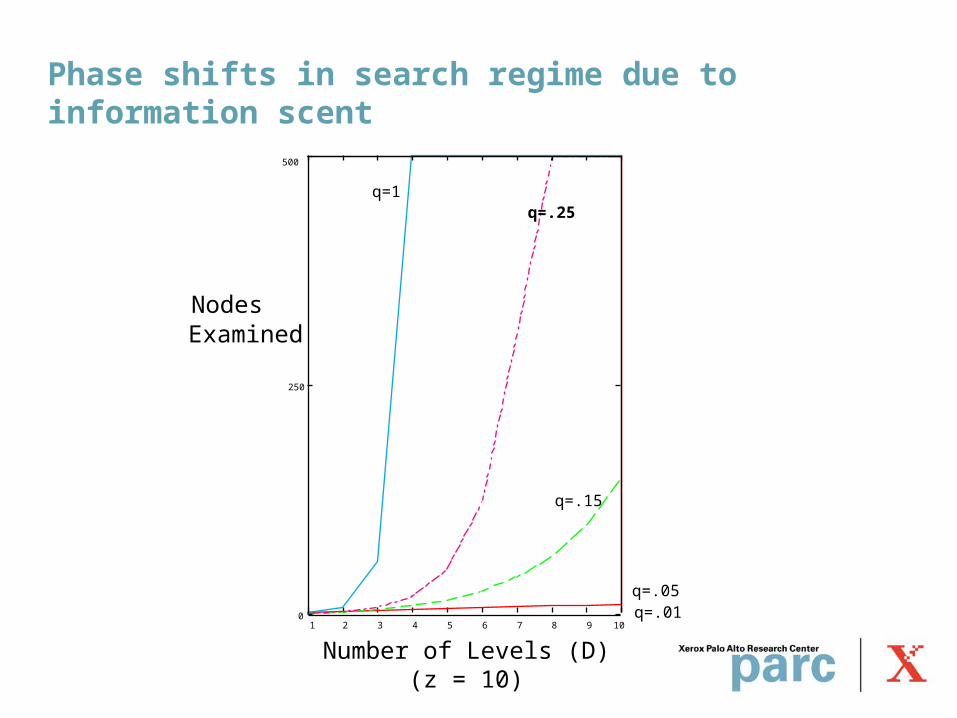
Phase shifts in search regime due to information scent
1 2 3 4 5 6 7 8 9 100
250
500
q=1q=.25
q=.15
q=.05q=.01
NodesExamined
Number of Levels (D)(z = 10)

Information scent controls
• Stickiness• Search cost regime

Applications
• Simulated user– Web page usability– Web site usability
• Other– Prefetching/caching to improve access
speed– Improve search engine results– Dynamic optimization of page and site layout

Web User Flow by Information Scent
Web site
WebPage
contentlinks
Web user flow simulation
UserInformation
goal
Predictedpaths

inferring user goal
Web site
WebPage
contentlinks
Web user flow simulation
UserInformation
goal
observedpaths

Conclusion: Information foraging & Information scent
• How & why humans adapt to information environments
• Formal models mix mathematics of optimal foraging theory with computational cognitive models
• Applications to UI design, Web access, Web usability analysis
• Proper theory for the study of human informavores


![Evolution of sustained foraging in three-dimensional ... · concepts are the bacterial foraging optimization algorithm (BFOA) [18], and artificial bee colony (ABC)[19]. Information](https://static.documents.pub/doc/80x56/602f7045505a0833176355a6/evolution-of-sustained-foraging-in-three-dimensional-concepts-are-the-bacterial.jpg)


