
January 2012
UNICEF Innocenti Research Centre
RELATIVE INCOME POVERTY AMONG
CHILDREN IN RICH COUNTRIES
Jonathan Bradshaw, Yekaterina Chzhen,
Gill Main, Bruno Martorano,
Leonardo Menchini and Chris de Neubourg
IWP-2012-01
INNOCENTI WORKING PAPER
ii
Innocenti Working Papers
UNICEF Innocenti Working Papers are intended to disseminate initial research contributions
within or relevant to the Centre‟s programme of work, addressing social, economic and other
aspects of the realisation of the human rights of children.
The findings, interpretations and conclusions expressed in this paper are those of the
author(s) and do not necessarily reflect the policies or views of UNICEF.
The text has not been edited to official publications standards and UNICEF accepts no
responsibility for errors.
Extracts from this publication may be freely reproduced with due acknowledgement.
Requests to utilize larger portions or the full publication should be addressed to the
Communication Unit at [email protected].
© 2012 United Nations Children‟s Fund (UNICEF)
ISSN: 1014-7837
For readers wishing to cite this document we suggest the following form:
Bradshaw, Jonathan, Yekaterina Chzhen, Gill Main, Bruno Martorano, Leonardo Menchini,
Chris de Neubourg (2012), „Relative Income Poverty among Children in Rich Countries‟,
Innocenti Working Paper No. 2012-01, UNICEF Innocenti Research Centre, Florence.
iii
The UNICEF Innocenti Research Centre
The UNICEF Innocenti Research Centre in Florence, Italy, was established in 1988 to
strengthen the research capability of the United Nations Children‟s Fund (UNICEF) and to
support its advocacy for children worldwide. The Centre helps to identify and research
current and future areas of UNICEF‟s work. Its prime objectives are to improve international
understanding of issues relating to children‟s rights and to help facilitate full implementation
of the United Nations Convention on the Rights of the Child in developing, middle-income
and industrialized countries.
IRC is the dedicated research hub of the UNICEF Office of Research (OOR), which provides
global leadership for the organization‟s strategic research agenda around children. The Office
aims to set out a comprehensive framework for research and knowledge within the
organization, in support of its global programmes and policies. Through strengthening
research partnerships with leading academic institutions and development networks in both
the North and South, the Office seeks to leverage additional resources and influence in
support of efforts towards policy reform in favour of children.
IRC‟s publications are contributions to a global debate on children and child rights issues and
include a wide range of opinions. For that reason, the Centre may produce publications that
do not necessarily reflect UNICEF policies or approaches on some topics. The views
expressed are those of the authors and/or editors and are published by the Centre in order to
stimulate further dialogue on child rights.
The Centre collaborates with its host institution in Florence, the Istituto degli Innocenti, in
selected areas of work. Core funding for the Centre is provided by the Government of Italy,
while financial support for specific projects is also provided by other governments,
international institutions and private sources, including UNICEF National Committees.
For further information and to download this or other IRC publications, please visit the IRC
website at www.unicef-irc.org.
Correspondence should be addressed to:
UNICEF Innocenti Research Centre
Piazza SS. Annunziata, 12
50122 Florence, Italy
Tel: (+39) 055 20 330
Fax: (+39) 055 2033 220
www.unicef-irc.org

iv

v
RELATIVE INCOME POVERTY AMONG CHILDREN IN
RICH COUNTRIES
Jonathan Bradshaw,a Yekaterina Chzhen,
b Gill Main,
a Bruno Martorano,
c
Leonardo Menchinic and Chris de Neubourg
c1
a University of York,
b University of Oxford,
c UNICEF Innocenti Research Centre
Abstract
This paper presents and discusses child relative income poverty statistics for 35 economically
advanced countries, representing all the members of the European Union, Australia, Canada, Iceland,
Japan, New Zealand, Switzerland and the United States. As most of the data refer to the year 2008,
the results partly reflect the initial impact of the global economic crisis as well as government
responses. According to the data, Nordic countries and the Netherlands present the lowest child
relative poverty levels, while Japan, the United States, most of the Southern European countries and
some of the new EU member states have among the highest. Several factors are associated with the
risk of poverty, such as demographic composition, educational level of household members, labour
conditions, but the extent to which these factors influence the risk of poverty vary considerably across
countries. Lastly, in several countries the role of government is found to be highly important in
reducing child poverty.
Keywords: child well-being, poverty, incomes, employment, OECD countries, fiscal policy
1 The authors wish to thank Bryan Perry (Ministry of Social Development, New Zealand) for having provided
the child poverty statistics for New Zealand and Aya Abe (National Institute of Population and Social Security
Research) for supplying the child poverty statistics for Japan; Jan Oliver Suer (UNICEF IRC) provided valuable
assistance; Peter Adamson and Marco Sanfilippo (UNICEF IRC) made important comments and suggestions.
The authors also wish to thank the UNICEF National Committees in Australia, Canada and New Zealand for
their support in accessing the relevant data sources used for the analysis.
vi
Table of Contents
1. INTRODUCTION……………………………………………………………………. 1
2. DATA SOURCES AND PERIOD OF REFERENCE OF THE DATA………….. 2
3. CHILD INCOME POVERTY: ASSUMPTIONS, POVERTY LINES AND
CALCULATIONS…………………………………………………………………….....4
4. THE RESULTS: CHILD INCOME POVERTY IN RICH COUNTRIES………………...4
5. CHILD POVERTY AND OVERALL POVERTY…………………………...……9
6. CHILD POVERTY AND HOUSEHOLD COMPOSITION…..…………………..11
7. CHILD POVERTY AND HOUSEHOLD SOCIO-ECONOMIC CONDITIONS 13
8. CHILD POVERTY AND GOVERNMENT INTERVENTION WITH TAXES
AND SOCIAL TRANSFERS...…………………………………………………………20
9. CONCLUSIONS………………………………………………………………………23
APPENDIX………………………………………………………………………………25
REFERENCES……………………………………..……………………………………30
1
1. INTRODUCTION
This paper reports and discusses the results of the analysis on relative income poverty among
children in high income countries conducted for the Innocenti Report Card 10. The analysis
includes all the 27 European Union countries, as well as Iceland and Norway, and Australia,
Canada, New Zealand, Japan, Switzerland and United States.
Child income poverty has been the specific focus of two previous Innocenti Report Cards
(Report Card 1 and Report Card 6) and of their background papers, where methodological
issues, meaning of the indicators, limitations and caveats have been presented and discussed.
In particular these studies confirmed the relevance of a relative approach for understanding
poverty in the context of economically advanced countries. Indeed, relative poverty reflects
better the cost of social inclusion and equality of opportunity in a specific time and space.
“Once economic development has progressed beyond a certain minimum level, the rub of the
poverty problem – from the point of view of both the poor individual and of the societies in
which they live – is not so much the effects of poverty in any absolute form but the effects of
the contrast, daily perceived, between the lives of the poor and the lives of those around
them. For practical purposes, the problem of poverty in the industrialized nations today is a
problem of relative poverty” (UNICEF 2000:9).
In addition, Report Card 6 included a series of recommendations on child income poverty
measurement, on setting poverty reduction goals and on monitoring progress in poverty
reduction. That Report also presented the comparative analysis of the effect of government
interventions, with taxes and transfer, in terms of child poverty reduction in OECD countries.
Child income poverty has also been an important component of the analysis in other issues of
the Report Card series, in addition to other indicators in multidimensional well-being
frameworks. In the Innocenti Report Card 7 on child well-being, figures on child income
poverty were included in the material well-being dimension: they were discussed along with
data on other well-being indicators, with the conclusion that no single indicator nor
dimension are representative of the overall situation of children in a country, but at the same
time it was acknowledged that income poverty data have an important and revealing role, and
clear policy linkages.
The Innocenti Report Card 9, on inequality in the bottom end of the distribution of well-being
among children, presents data on income inequality as well as on child relative income
poverty. Relative poverty reflects the inequality in the bottom-half of the income distribution:
the poor are those living in households with an equivalent income which is far lower than the
national median income (a poverty threshold set at half of the median is used in this analysis).
Consequently they are at risk of not enjoying the prevalent living standards of the society in
which they live, and are therefore unlikely to be able to fully participate in the community.
Report Cards 1 and 6 anticipated that the theme of child income poverty and statistical
updates would have continued in the series, along with a discussion on the meaning of this
measure for children in economically advanced countries. The Report Card 10 reintroduces
this discussion, providing more recent statistics on child income poverty and comparing the
measure with other indicators of material deprivation.

2
2. DATA SOURCES AND PERIOD OF REFERENCE OF THE DATA
The main source of the data used in the analysis of child income poverty is the European
Union Statistics on Income and Living Conditions (EU-SILC).2 This source is available for
all 27 European Union countries, plus Iceland and Norway. This analysis uses the 2009 round
of EU-SILC. The income data used for the poverty calculations refer to the household
incomes for the year 2008, except for the United Kingdom. For the latter they refer to the
year of the survey, i.e. 2009.
For Australia, Canada, New Zealand, Japan, Switzerland and United States other national
sources have been identified as reasonably suitable to perform a comparative analysis of child
income poverty.
For Australia, the microdata are from the Household Income and Living Dynamics in
Australia (HILDA)3 2009 elaborated by the Melbourne Institute of Applied Economic and
Social Research (University of Melbourne). The income data extracted from this survey refer
to the fiscal year July 2008-June 2009.
For Canada, the source is the Survey on Labour and Income Dynamics (SLID) run by
Statistics Canada.4 The survey used has been fielded in 2009, with income data referring to
the year 2008.
Data for New Zealand are taken from Perry (2011) based on the 2009–2010 Household
Economic Survey, with income data referred to 2010.
The poverty statistics for Japan have been derived from Cabinet Office, Gender Equality
Bureau (2011) which elaborates the microdata from the 2010 Comprehensive Survey of
Living Conditions of the ministry of Health, Labor and Welfare. Data on income refer to the
year 2010.
Data for Switzerland are from the Swiss Household Panel (SHP)5 2009 elaborated by the
Swiss Centre of Expertise in the Social Sciences. Household income information is for the
year 2008.
The source used for the United States of America is the Panel Study on Income Dynamics
(PSID)6 run by the University of Michigan. The round analysed is that of 2007, with income
data referring to the year 2006.
2 EU-SILC is the main source for the compilation of comparable indicators on social cohesion used for policy
monitoring at EU level in the framework of the Open Method of Coordination. On an annual basis it collects
timely and comparable multidimensional micro-data on income, poverty, social exclusion and living conditions.
Every year, both cross-sectional data and longitudinal data are collected.
http://epp.eurostat.ec.europa.eu/portal/page/portal/living_conditions_and_social_protection/introduction/income
_social_inclusion_living_conditions 3 HILDA is a household-based panel study which reports information on income, employment, family life and
household composition collected on an annual basis. For more information, see:
http://www.melbourneinstitute.com/hilda/ 4 SLID provides information on the financial, work and well-being conditions of people living in Canada. For
more information, see: http://www.statcan.gc.ca/cgi-
bin/imdb/p2SV.pl?Function=getSurvey&SDDS=3889&lang=en&db=imdb&adm=8&dis=2 5 The SHP is a longitudinal survey which provides yearly information on economic and living conditions for the
population of Switzerland. More information is reported in http://www.swisspanel.ch/index.php?lang=en
3
Lastly, for Australia, Canada, Switzerland and the United States, the income data used are
those standardized in the Cross National Equivalent File (CNEF) released by Cornell
University and partner institutions.7
It is evident, therefore, that the data used in the analysis do not refer to the same year for all
the countries included in the study. However, most of the income figures refer to the year
2008. It is then expected that the results in part reflect the initial impact of the global
economic crisis as well as the government responses, including stimulus packages. While it is
expected that the more profound impact of the global crisis on the living conditions of the
child populations in high income countries will be more visible in the data for the years
following 2008 and not necessarily on income poverty data, it is important that the poverty
data reported in this paper are read considering their historical context.
6 The Panel Study of Income Dynamics is a longitudinal household survey reporting information on
employment, income, wealth, expenditures, health, education, and other topics. See
http://psidonline.isr.umich.edu/ 7 The CNEF data file is elaborated and managed by Cornell University and staff affiliated with the German
Institute for Economic Research (DIW Berlin), the University of Essex, the University of Melbourne, the Swiss
Foundation for Research in the Social Sciences, the University of Lausanne, the Korea Labor Institute, and
Statistics Canada. See: http://www.human.cornell.edu/pam/research/centers-programs/german-panel/cnef.cfm
4
3. CHILD INCOME POVERTY: ASSUMPTIONS, POVERTY LINES
AND CALCULATIONS
The income poverty statistics reported in this study are based on data for household
disposable income. Disposable income is the income derived from different sources available
to the household, after deducting direct income taxes and adding public transfers. In the sub-
section on the impact of government interventions, poverty data are also reported on the basis
of market income (i.e. the household income before taxation and social transfers).
To compare the incomes of households of different size and composition, the modified-
OECD equivalent scale is applied. This equivalent scale gives a score of 1 to the household
head. Each of the other household members aged 14 and more receives a score of 0.5, while
each child with age less than 14 receives a score of 0.3. The sum of the individual scores
gives the equivalent household size. A household with 2 adults and 2 children under 14 has
an equivalent size of 2.1; a household with 3 adults and no child has an equivalent size of 2; a
household with an adult and 3 children has an equivalent size of 1.9, etc.
The equivalent disposable household income is obtained by dividing the total household
disposable income by the equivalent household size. If the equivalent disposable household
income is lower than the poverty line, then the household is considered as income poor.
The relative poverty threshold (or poverty line) used in this study is fixed, for each country, at
50 per cent of the median national disposable income. This is the threshold commonly used
by the OECD for its international poverty comparisons. It is also the threshold adopted in the
previous editions of the Innocenti Report Card series.
It should be noted however, that the European Union – which includes the large majority of
countries analysed here – has settled on a threshold of 60 per cent of the median though
Eurostat publishes poverty data at a range of thresholds.
Finally, while for obvious reasons the poverty calculations are made at the household level,
most of the results presented refer only to children.8 Children are defined as individuals aged
less than 18. In the analysis results on poverty for the total population (all ages) and for the
elderly (those aged 65 and more) are also reported.
4. THE RESULTS: CHILD INCOME POVERTY IN RICH COUNTRIES
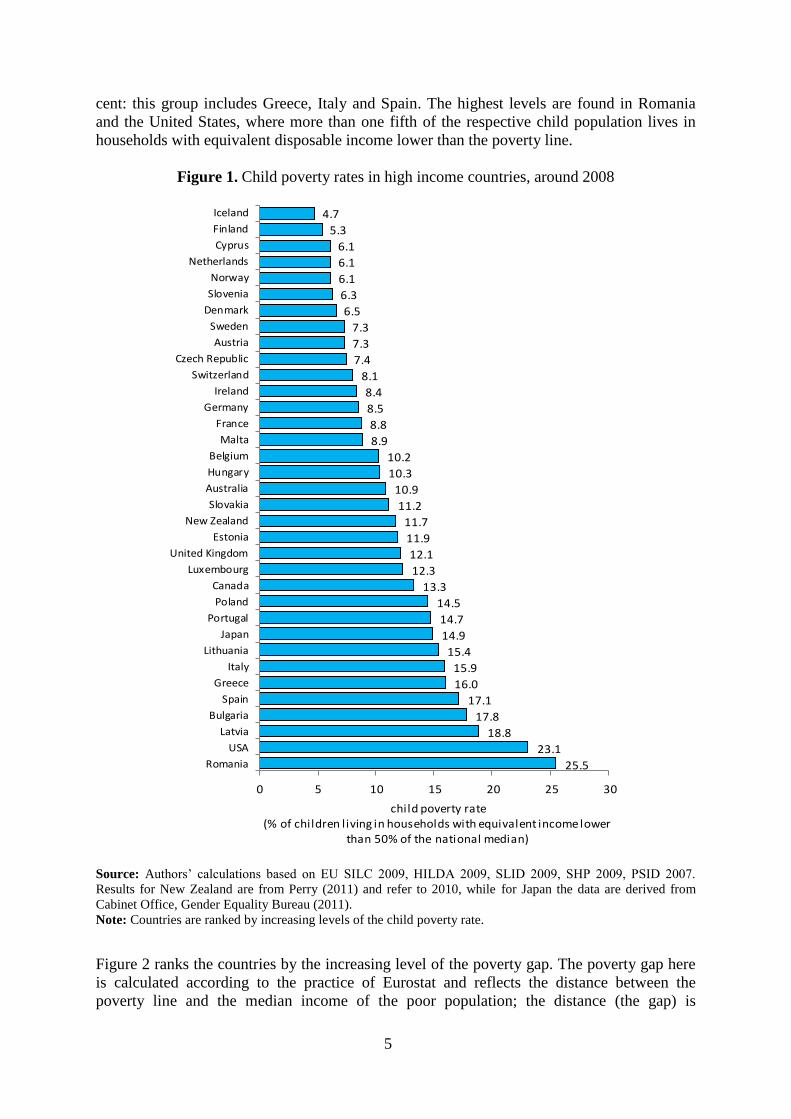
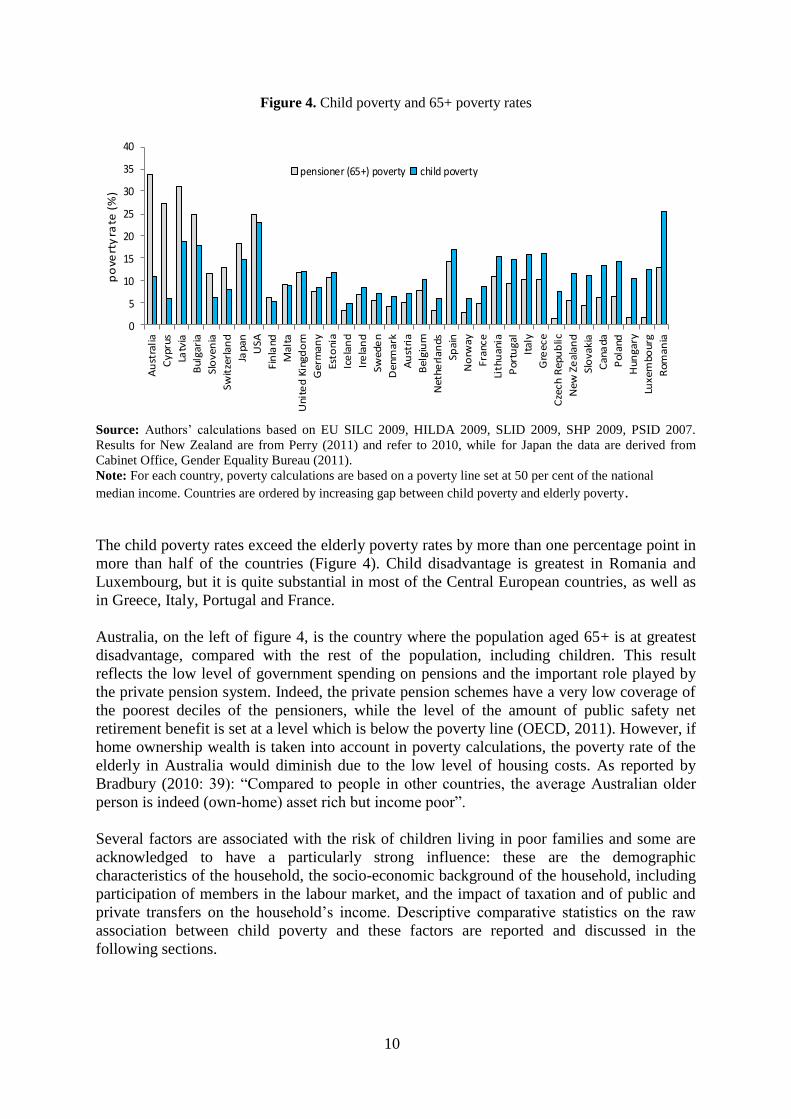
Figure 1 shows the headline child poverty rate using 50 per cent of the median threshold.
Child poverty varies from 5 per cent in Iceland to 25 per cent in Romania. Slightly less than
half of the countries with data have a child poverty rate lower than 10 per cent: this group
with relatively low child poverty includes all the Nordic countries, two fairly large countries
– Germany and France – Switzerland, Austria, and two Central European countries (Slovenia
and Czech Republic, generally characterised by low levels of income inequality). An
intermediate category – with poverty levels ranging from 10 to 15 per cent – includes, among
others, the Australia, Canada, Belgium, Japan, United Kingdom and the remaining Central
European countries. Slightly less than a third of the countries has a rate exceeding 15 per
8 Child poverty estimates are based on data weighted by the product of the survey household weight and the
number of children in the household.
5
cent: this group includes Greece, Italy and Spain. The highest levels are found in Romania
and the United States, where more than one fifth of the respective child population lives in
households with equivalent disposable income lower than the poverty line.
Figure 1. Child poverty rates in high income countries, around 2008
25.5
23.1
18.8
17.8
17.1
16.0
15.9
15.4
14.9
14.7
14.5
13.3
12.3
12.1
11.9
11.7
11.2
10.9
10.3
10.2
8.9
8.8
8.5
8.4
8.1
7.4
7.3
7.3
6.5
6.3
6.1
6.1
6.1
5.3
4.7
0 5 10 15 20 25 30
Romania
USA
Latvia
Bulgaria
Spain
Greece
Italy
Lithuania
Japan
Portugal
Poland
Canada
Luxembourg
United Kingdom
Estonia
New Zealand
Slovakia
Australia
Hungary
Belgium
Malta
France
Germany
Ireland
Switzerland
Czech Republic
Austria
Sweden
Denmark
Slovenia
Norway
Netherlands
Cyprus
Finland
Iceland
child poverty rate(% of children living in households with equivalent income lower
than 50% of the national median)
Source: Authors‟ calculations based on EU SILC 2009, HILDA 2009, SLID 2009, SHP 2009, PSID 2007.
Results for New Zealand are from Perry (2011) and refer to 2010, while for Japan the data are derived from
Cabinet Office, Gender Equality Bureau (2011).
Note: Countries are ranked by increasing levels of the child poverty rate.
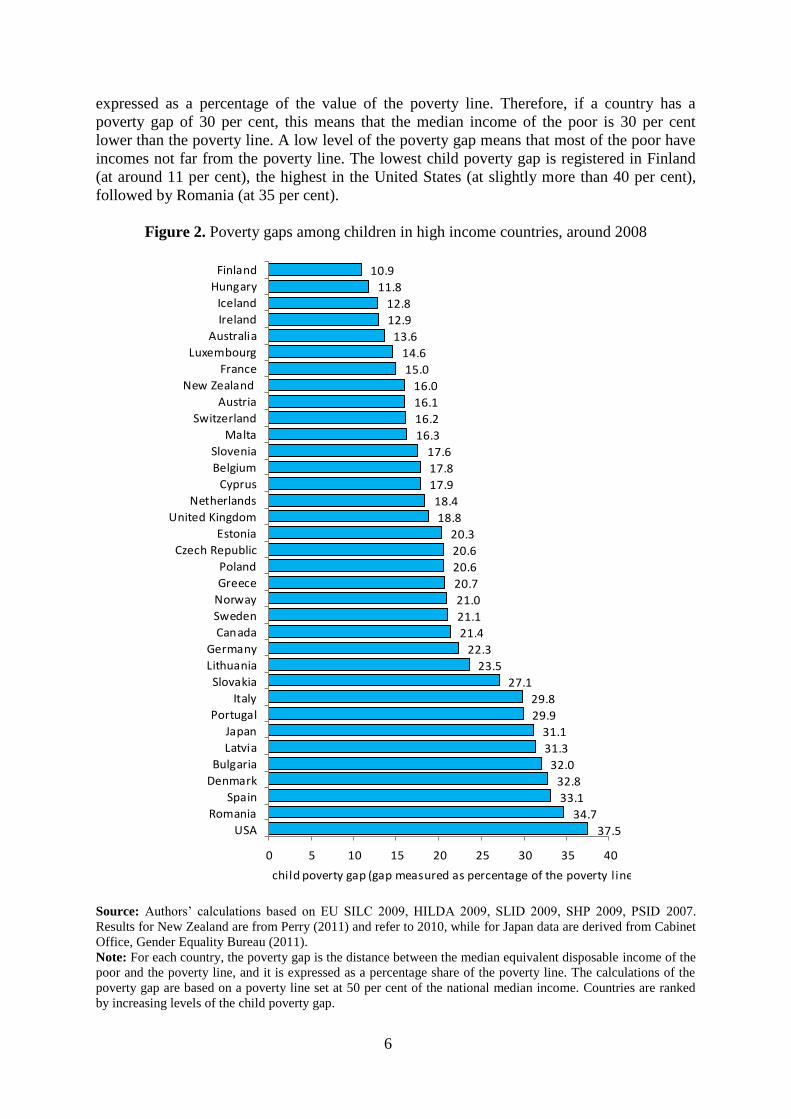
Figure 2 ranks the countries by the increasing level of the poverty gap. The poverty gap here
is calculated according to the practice of Eurostat and reflects the distance between the
poverty line and the median income of the poor population; the distance (the gap) is
6
expressed as a percentage of the value of the poverty line. Therefore, if a country has a
poverty gap of 30 per cent, this means that the median income of the poor is 30 per cent
lower than the poverty line. A low level of the poverty gap means that most of the poor have
incomes not far from the poverty line. The lowest child poverty gap is registered in Finland
(at around 11 per cent), the highest in the United States (at slightly more than 40 per cent),
followed by Romania (at 35 per cent).
Figure 2. Poverty gaps among children in high income countries, around 2008
37.5
34.7
33.1
32.8
32.0
31.3
31.1
29.9
29.8
27.1
23.5
22.3
21.4
21.1
21.0
20.7
20.6
20.6
20.3
18.8
18.4
17.9
17.8
17.6
16.3
16.2
16.1
16.0
15.0
14.6
13.6
12.9
12.8
11.8
10.9
0 5 10 15 20 25 30 35 40
USA
Romania
Spain
Denmark
Bulgaria
Latvia
Japan
Portugal
Italy
Slovakia
Lithuania
Germany
Canada
Sweden
Norway
Greece
Poland
Czech Republic
Estonia
United Kingdom
Netherlands
Cyprus
Belgium
Slovenia
Malta
Switzerland
Austria
New Zealand
France
Luxembourg
Australia
Ireland
Iceland
Hungary
Finland
child poverty gap (gap measured as percentage of the poverty line)
Source: Authors‟ calculations based on EU SILC 2009, HILDA 2009, SLID 2009, SHP 2009, PSID 2007.
Results for New Zealand are from Perry (2011) and refer to 2010, while for Japan data are derived from Cabinet
Office, Gender Equality Bureau (2011).
Note: For each country, the poverty gap is the distance between the median equivalent disposable income of the
poor and the poverty line, and it is expressed as a percentage share of the poverty line. The calculations of the
poverty gap are based on a poverty line set at 50 per cent of the national median income. Countries are ranked
by increasing levels of the child poverty gap.
7
The comparison between Figure 1 and Figure 2 shows that very often the higher the poverty
rate the higher the poverty gap. But there are also notable exceptions to that: Denmark and
Slovakia have higher gaps than expected, while Ireland, Hungary, Luxembourg and Greece
have lower gaps than those with similar poverty rates. A discrepancy between rates and gaps
may be an indication of the effectiveness of social protection. Countries with comparatively
high gaps may have inadequate coverage of social protection.
The use of different poverty thresholds obviously determines different poverty levels.
However, it useful to test and discuss results based on different poverty lines, to explore how
the country ranking varies and if poverty levels change dramatically with small changes in
the poverty line value (for example a substantial increase in poverty levels due to a small
increase in the value of the poverty line, means that there is a quite high density of
households just above the original poverty line).
Table 1 shows the child poverty rates calculated according to three poverty thresholds: an
extreme level set at 40 per cent of the national median income; the poverty line fixed at half
of the median, i.e. the one used in this paper; and a higher poverty line set at 60 per cent of
the median, which is also the threshold adopted by Eurostat for reporting poverty data for
European Union countries.
The threshold used makes only small differences to the countries‟ ranking order – for
example Netherlands, Ireland, Malta or Switzerland do relatively better using the 50 per cent
thresholds and Australia, Belgium, Denmark and Slovakia would do better in ranking using
the 60 per cent threshold. In general, however, sizeable re-ranking is quite limited.
If the 60 per cent poverty line is considered, around one third of the countries have a poverty
level between 10-15 per cent. In 14 countries out of 35, between one fifth and one fourth of
all children are living in poor households, while two countries (United States and Romania)
have poverty levels slightly exceeding 30 per cent.

8
Table 1. Percentage of children in households in poverty using 40 per
cent, 50 per cent and 60 per cent thresholds, around 2008
poverty line at
50% poverty line at
40% poverty line at
60%
Iceland 4.7 1.9 10.1
Finland 5.3 1.5 11.9
Cyprus 6.1 1.8 12.1
Netherlands 6.1 2.9 15.4
Norway 6.1 3.1 11.3
Slovenia 6.3 2.9 11.1
Denmark 6.5 3.6 11.4
Sweden 7.3 3.7 12.7
Austria 7.3 3.2 13.6
Czech Republic 7.4 3.8 13.0
Switzerland 8.1 3.2 17.9
Ireland 8.4 3.5 18.9
Germany 8.5 4.6 14.9
France 8.8 3.7 16.8
Malta 8.9 2.9 20.3
Belgium 10.2 4.1 16.6
Hungary 10.3 3.0 20.6
Australia 10.9 4.3 17.6
Slovakia 11.2 6.6 17.0
New Zealand 11.7 n.a. 19.4
Estonia 11.9 6.1 20.6
United Kingdom 12.1 5.6 20.8
Luxembourg 12.3 4.2 22.4
Canada 13.3 7.3 21.9
Poland 14.5 7.5 22.9
Portugal 14.7 9.6 22.7
Japan 14.9 9.6 20.5
Lithuania 15.4 8.8 24.3
Italy 15.9 9.7 24.2
Greece 16.0 8.1 23.5
Spain 17.1 11.5 23.6
Bulgaria 17.8 12.2 24.4
Latvia 18.8 12.8 25.0
USA 23.1 16.6 31.1
Romania 25.5 17.8 32.3
Source: Authors‟ calculations based on EU SILC 2009, HILDA 2009, SLID
2009, SHP 2009, PSID 2007. Results for New Zealand are from Perry (2011)
and refer to 2010, while for Japan the data are derived from Cabinet Office,
Gender Equality Bureau (2011).
Note: Countries are ordered by increasing levels of the child poverty rate based
on 50 per cent of the median poverty line. Light blue denotes the best
performing countries, mid-blue the average performers and dark blue the worst
in each single measure. n.a.= not available
9
5. CHILD POVERTY AND OVERALL POVERTY
In most countries, children – or better households with children – are at higher risk of living
in poverty compared to the rest of the population. However, there are a few notable
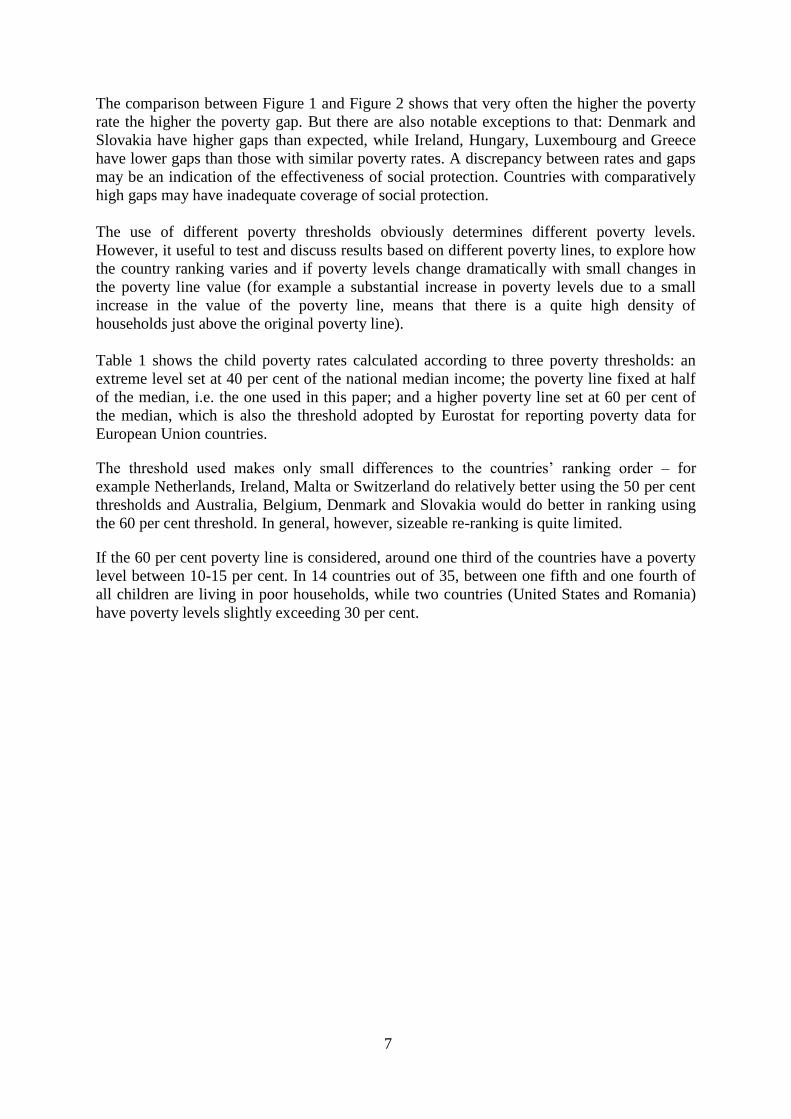
exceptions to that trend. Figure 3 compares statistics on income poverty for children and for
the overall population (including children) for 35 countries. While these results also reflect
the different demographic compositions of the various countries and the relative weight of the
child population, in only three countries are child poverty rates lower than more than one
percentage point compared to the poverty rate for the overall population: these countries,
where children are relatively more protected from poverty compared to adults, are Cyprus,9
Australia and Finland.
Figure 3. Child poverty and overall poverty rates
0
5
10
15
20
25
30
Cypr
us
Aus
tral
iaFi
nla
ndG
erm
any
Nor
way
Japa
nD
enm
ark
Slo
veni
aIc
elan
dSw
eden
Latv
iaN
ethe
rlan
dsIr
elan
dA
ustr
iaSw
itze
rlan
dM
alta
Esto
nia
Cana
da
Uni
ted
King
dom
Fran
ceB
elgi
umLi
thua
nia
New
Zea
land
Czec
h R
epub
licB
ulga
ria
Gre
ece
Spai
nU
SAPo
rtug
alPo
land
Hu
ngar
yIt
aly
Slo
vaki
aLu
xem
bour
gR
oman
ia
po
vert
y ra
te (%
)
population poverty
child poverty
Source: Authors‟ calculations based on EU SILC 2009, HILDA 2009, SLID 2009, SHP 2009, PSID 2007.
Results for New Zealand are from Perry (2011) and refer to 2010, while for Japan the data are derived from
Cabinet Office, Gender Equality Bureau (2011).
Note: For each country, poverty calculations are based on a poverty line set at 50 per cent of the national
median income. Countries are ordered by increasing gap between child poverty and the overall population
poverty (on the left of the figures are the countries where children are not relatively disadvantaged compared to
the overall population in terms of poverty; on the right are the countries where poverty is particularly
concentrated among children).
In a few other countries (all the other Nordic countries, Germany and Slovenia), child poverty
is slightly lower than overall poverty. In the remaining countries, children have a higher risk
of being in poverty compared to the rest of the population. The amount of disadvantage varies
considerably. In Poland, Hungary, Italy, Slovakia and Luxembourg, the child poverty rate
exceeds that of the overall population by 4-4.5 percentage points. In Romania, the difference
reaches 9 percentage points, indicating a huge concentration of poverty in households with
children.
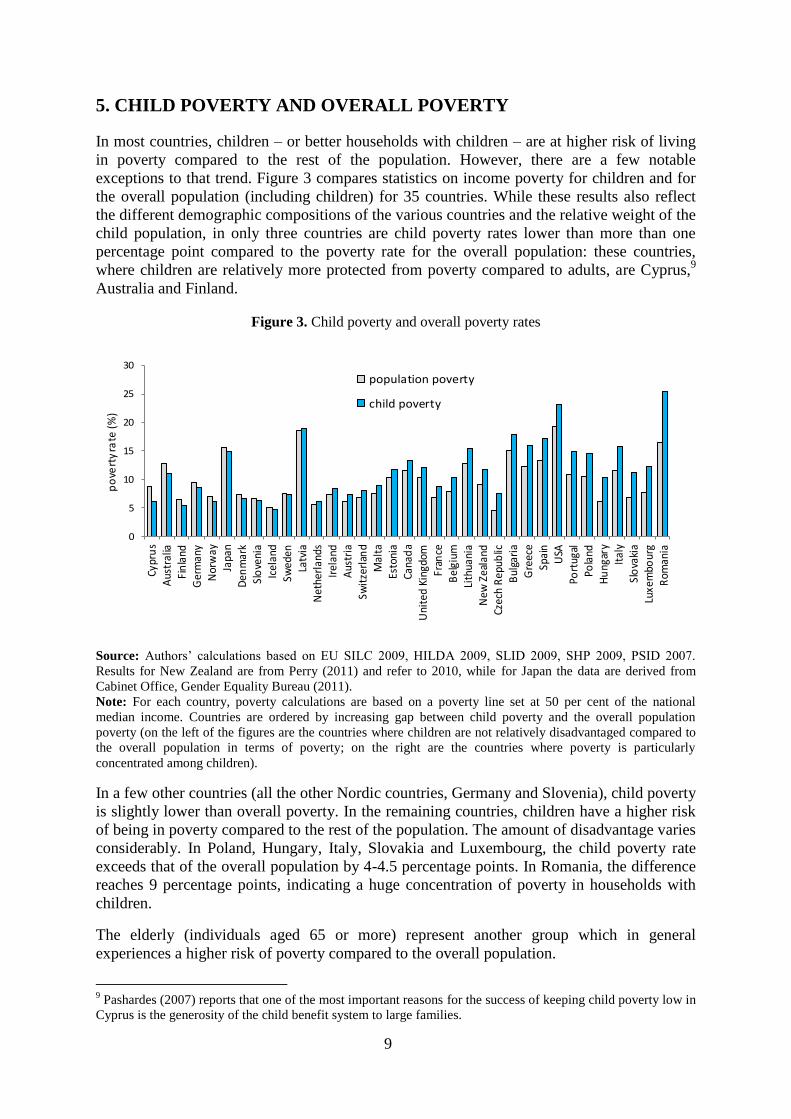
The elderly (individuals aged 65 or more) represent another group which in general
experiences a higher risk of poverty compared to the overall population.
9 Pashardes (2007) reports that one of the most important reasons for the success of keeping child poverty low in
Cyprus is the generosity of the child benefit system to large families.
10
Figure 4. Child poverty and 65+ poverty rates
0
5
10
15
20
25
30
35
40A
ust
ralia
Cyp
rus
Latv
ia
Bul
gari
a
Slo
ven
ia
Swit
zerl
and
Japa
n
USA
Fin
land
Mal
ta
Uni
ted
King
do
m
Ger
man
y
Esto
nia
Ice
lan
d
Ire
lan
d
Swed
en
Den
mar
k
Au
stri
a
Bel
giu
m
Net
herl
ands
Spai
n
No
rway
Fran
ce
Lith
uan
ia
Por
tuga
l
Ital
y
Gre
ece
Cze
ch R
epu
blic
New
Ze
alan
d
Slo
vaki
a
Can
ada
Pol
and
Hun
gary
Luxe
mbo
urg
Rom
ania
po
vert
y ra
te (
%)
pensioner (65+) poverty child poverty
Source: Authors‟ calculations based on EU SILC 2009, HILDA 2009, SLID 2009, SHP 2009, PSID 2007.
Results for New Zealand are from Perry (2011) and refer to 2010, while for Japan the data are derived from
Cabinet Office, Gender Equality Bureau (2011).
Note: For each country, poverty calculations are based on a poverty line set at 50 per cent of the national
median income. Countries are ordered by increasing gap between child poverty and elderly poverty.
The child poverty rates exceed the elderly poverty rates by more than one percentage point in
more than half of the countries (Figure 4). Child disadvantage is greatest in Romania and
Luxembourg, but it is quite substantial in most of the Central European countries, as well as
in Greece, Italy, Portugal and France.
Australia, on the left of figure 4, is the country where the population aged 65+ is at greatest
disadvantage, compared with the rest of the population, including children. This result
reflects the low level of government spending on pensions and the important role played by
the private pension system. Indeed, the private pension schemes have a very low coverage of
the poorest deciles of the pensioners, while the level of the amount of public safety net
retirement benefit is set at a level which is below the poverty line (OECD, 2011). However, if
home ownership wealth is taken into account in poverty calculations, the poverty rate of the
elderly in Australia would diminish due to the low level of housing costs. As reported by
Bradbury (2010: 39): “Compared to people in other countries, the average Australian older
person is indeed (own-home) asset rich but income poor”.
Several factors are associated with the risk of children living in poor families and some are
acknowledged to have a particularly strong influence: these are the demographic
characteristics of the household, the socio-economic background of the household, including
participation of members in the labour market, and the impact of taxation and of public and
private transfers on the household‟s income. Descriptive comparative statistics on the raw
association between child poverty and these factors are reported and discussed in the
following sections.
11
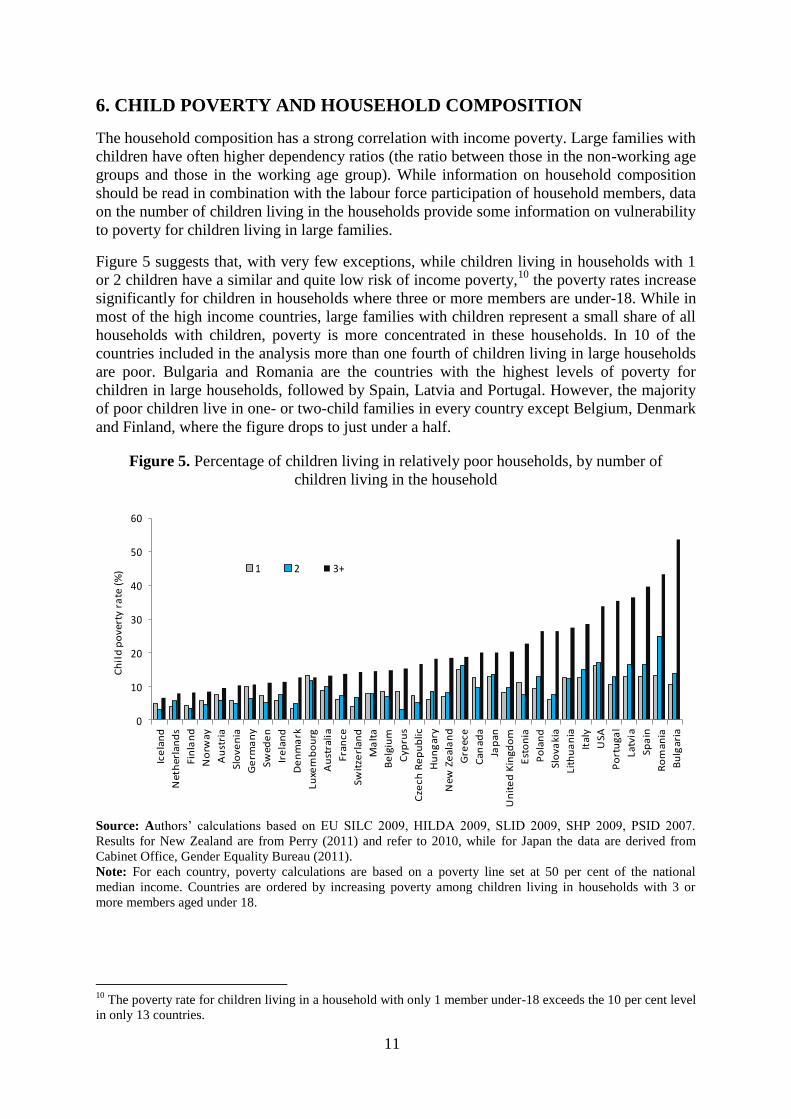
6. CHILD POVERTY AND HOUSEHOLD COMPOSITION
The household composition has a strong correlation with income poverty. Large families with
children have often higher dependency ratios (the ratio between those in the non-working age
groups and those in the working age group). While information on household composition
should be read in combination with the labour force participation of household members, data
on the number of children living in the households provide some information on vulnerability
to poverty for children living in large families.
Figure 5 suggests that, with very few exceptions, while children living in households with 1
or 2 children have a similar and quite low risk of income poverty,10
the poverty rates increase
significantly for children in households where three or more members are under-18. While in
most of the high income countries, large families with children represent a small share of all
households with children, poverty is more concentrated in these households. In 10 of the
countries included in the analysis more than one fourth of children living in large households
are poor. Bulgaria and Romania are the countries with the highest levels of poverty for
children in large households, followed by Spain, Latvia and Portugal. However, the majority
of poor children live in one- or two-child families in every country except Belgium, Denmark
and Finland, where the figure drops to just under a half.
Figure 5. Percentage of children living in relatively poor households, by number of
children living in the household
0
10
20
30
40
50
60
Ice
lan
d
Net
her
lan
ds
Fin
lan
d
No
rway
Au
stri
a
Slo
ven
ia
Ge
rma
ny
Swed
en
Ire
lan
d
De
nm
ark
Luxe
mb
ou
rg
Au
stra
lia
Fran
ce
Swit
zerl
and
Ma
lta
Be
lgiu
m
Cyp
rus
Cze
ch R
ep
ub
lic
Hu
ng
ary
New
Ze
ala
nd
Gre
ece
Can
ada
Jap
an
Un
ite
d K
ingd
om
Est
on
ia
Po
lan
d
Slo
vaki
a
Lith
ua
nia
Ital
y
USA
Po
rtu
gal
Latv
ia
Spa
in
Ro
man
ia
Bu
lgar
ia
Ch
ild
po
vert
y ra
te(%
) 1 2 3+
Source: Authors‟ calculations based on EU SILC 2009, HILDA 2009, SLID 2009, SHP 2009, PSID 2007.
Results for New Zealand are from Perry (2011) and refer to 2010, while for Japan the data are derived from
Cabinet Office, Gender Equality Bureau (2011).
Note: For each country, poverty calculations are based on a poverty line set at 50 per cent of the national
median income. Countries are ordered by increasing poverty among children living in households with 3 or
more members aged under 18.
10
The poverty rate for children living in a household with only 1 member under-18 exceeds the 10 per cent level
in only 13 countries.

12
Many studies show that children living in lone parent families are also at greater risk of
poverty, compared to children living in families with both parents. This condition is related to
the fact that households with a single parent are characterized by high earning instability,
especially among young lone mothers. This result is also confirmed by the most recent data
analysed for this paper. The highest levels of poverty for children in lone parent families are
found in the United States, Japan and Luxembourg, followed by Bulgaria and Lithuania.11
Figure 6. Child poverty rate by family type
0
10
20
30
40
50
Ice
lan
d
De
nm
ark
Net
her
lan
ds
Fin
lan
d
Hu
ng
ary
Ire
lan
d
Slo
ven
ia
Un
ite
d K
ingd
om
Swed
en
No
rway
Au
stri
a
New
Ze
ala
nd
Swit
zerl
and
Fran
ce
Cze
ch R
ep
ub
lic
Gre
ece
Be
lgiu
m
Slo
vaki
a
Au
stra
lia
Ma
lta
Po
lan
d
Ro
man
ia
Ge
rma
ny
Can
ada
Est
on
ia
Cyp
rus
Spa
in
Latv
ia
Ital
y
Lith
ua
nia
Bu
lgar
ia
Luxe
mb
ou
rg
Jap
an
Un
ite
d S
tate
s
chil
d p
ove
ty r
ate
(%
) couple family lone parent
Source: authors‟ calculations based on EU SILC 2009, HILDA 2009, SLID 2009, SHP 2009, PSID 2007.
Results for New Zealand are from Perry (2011) and refer to 2010, while for Japan the data are derived from
Cabinet Office, Gender Equality Bureau (2011).
Note: For each country, poverty calculations are based on a poverty line set at 50 per cent of the national
median income. Countries are ordered by increasing poverty among children living in lone parent families. Data
on lone parents is lacking for Portugal.
11
While the EU-SILC lacks a comprehensive household grid which would describe the relationships between
all household members, it reports personal identification (ID) numbers for all individuals in the household as
well as mother, father and partner or spouse identifiers. Where the mother, father or partner is not a household
member, the value of the corresponding ID is flagged up as missing, which allows the identification of lone
parent families living both within larger households and on their own. Family units where a child lives with a
sole parent cohabiting with another adult, who is not the child‟s parent, are also identified as couple families.
Conversely, we define single adults living with unrelated children under 18 as lone parent families, but such
cases are very rare (approximately 2.5% of all lone parents in the sample).

13
7. CHILD POVERTY AND HOUSEHOLD SOCIO-ECONOMIC
CONDITIONS
Both in high and low income countries (even if to a very different extent), the level of
education of the household members, in particular that of mothers, has a strong influence on
the survival and development chances of the child, including on the risk of poverty.
Figure 7 compares child poverty levels by the education level of the household they belong
to. The level of education of the household is reported here in terms of the highest level of
education attained among the household members and is based on the ISCED classification:
ISCED 0-2 means that the highest level attained by the members (at least one member) of the
household is lower secondary education, ISCED 3-4 indicates households where the
maximum level of education attained is upper secondary and post-secondary non tertiary
education, while ISCED 5 refers to tertiary education. As expected the higher the education
level in the household, the lower the risk of poverty, for virtually all the countries. In most
countries, those children in households where the highest attainment is secondary education
are relatively well protected from the risk of poverty. The main exception in this case is the
United States, where the poverty rates for those children living in households with upper
secondary education is close to 40 per cent.
Figure 7. Child poverty rate by the highest education level attained by household members
0
10
20
30
40
50
60
70
80
Ice
lan
d
De
nm
ark
Cy
pru
s
Ire
lan
d
Ma
lta
Ne
the
rla
nd
s
Fin
lan
d
Sw
ed
en
No
rwa
y
Po
rtu
ga
l
Au
stri
a
Sw
itze
rla
nd
Un
ite
d K
ing
do
m
Ne
w Z
ea
lan
d
Fra
nc
e
Au
stra
lia
Est
on
ia
Slo
ve
nia
Lu
xem
bo
urg
Ita
ly
Sp
ain
Be
lgiu
m
Po
lan
d
Gre
ec
e
Ca
na
da
Hu
ng
ary
Ge
rma
ny
Jap
an
La
tvia
Ro
ma
nia
Cze
ch
Re
pu
bli
c
Bu
lga
ria
US
A
Lit
hu
an
ia
Slo
va
kia
Ch
ild
po
ve
rty
ra
te(%
)
ISCED 0-2 ISCED 3-4 ISCED 5
Source: Authors‟ calculations based on EU SILC 2009, HILDA 2009, SHP 2009, SLID 2008 and PSID 2007.
Results for New Zealand are from Perry (2011) and refer to 2010, while for Japan the data are derived from
Cabinet Office, Gender Equality Bureau (2011).
Note: For each country, poverty calculations are based on a poverty line set at 50 per cent of the national
median income. Countries are ordered by increasing poverty among children living in households in which the
maximum education attainment is ISCED 0-2 (i.e maximum lower secondary education).
14
The poverty rates grow disproportionately for children in households with low education
attainment. In Slovakia and Lithuania, slightly less than 70 per cent of children in low
education households are poor. Five other countries have poverty rates between 50 and 60 per
cent for the same educational category, and also for Germany, which has low total poverty
rates, where more than two fifths of children living in low education households are poor.
The actual workforce participation of household members is another important factor in
shaping the child poverty profiles in high income countries. The information provided by the
household surveys available for this study enables us to calculate a measure of the
household‟s work intensity.12
As expected, in this case the child poverty gradient for
households with different categories of work intensity is striking (Figure 8).
Children in households with high work intensity (more than 0.8) have low and very low
poverty rates. The only country with a poverty level over 10 per cent for this category is
Romania. In Greece too, slightly less than 10 per cent of children in this category are poor.
However, in the majority of the countries studied at least 20 per cent of all poor children live
in households with work intensity above 0.8, due to the high share of households in this
category.
For the intermediate work intensity group (between 0.2 and 0.8) child poverty increases, and
reaches the level of at least 20 per cent in Romania, Spain, Greece, Latvia, Lithuania,
Bulgaria and Italy.
Poverty levels are extremely high for children living in jobless households or in households
with very low work intensity. In around half of the countries analysed more than 50 per cent
of children in jobless or low work intensity households are poor, the highest levels being
reached in Slovakia, Latvia and Bulgaria. While it is true that work is the best route out of
poverty, it does not guarantee freedom from poverty and in-work poverty remains a serious
problem in all the high income countries under analysis.
12
Work intensity is calculated as the ratio of the total months worked by each working age household member
to the total months available. For example, WI=0 means none of the household members worked at all during
the reference period, while WI=1 means all of the household members worked during the entire reference
period.

15
Figure 8. Child poverty rate <50% median by work intensity (authors‟ definition)
0
10
20
30
40
50
60
70
80
90S
wit
zerl
an
d
Ire
lan
d
Ice
lan
d
UK
No
rwa
y
Ne
the
rla
nd
s
De
nm
ark
Ca
na
da
Fin
lan
d
Gre
ec
e
Au
stra
lia
Ma
lta
Po
lan
d
Au
stri
a
Sw
ed
en
Ge
rma
ny
Hu
ng
ary
Lu
xem
bo
urg
Est
on
ia
Fra
nc
e
Be
lgiu
m
Sp
ain
Ro
ma
nia
Po
rtu
ga
l
Cze
ch
Re
p
Lit
hu
an
ia
Ita
ly
Slo
ve
nia
Cy
pru
s
US
A
La
tvia
Bu
lga
ria
Slo
va
kia
ch
ild
po
ve
rty
ra
te (
%)
0≤WI≤0.2 0.2<WI<0.8 0.8≤WI≤1
Source: Authors‟ calculations based on EU SILC 2009, HILDA 2009, SLID 2009, SHP 2009 and PSID 2007.
Data are not available for New Zealand and Japan.
Note: For each country, poverty calculations are based on a poverty line set at 50 per cent of the national
median income. Countries are ordered by increasing poverty among children living in households with low
work intensity (0<=WI<=0.2).
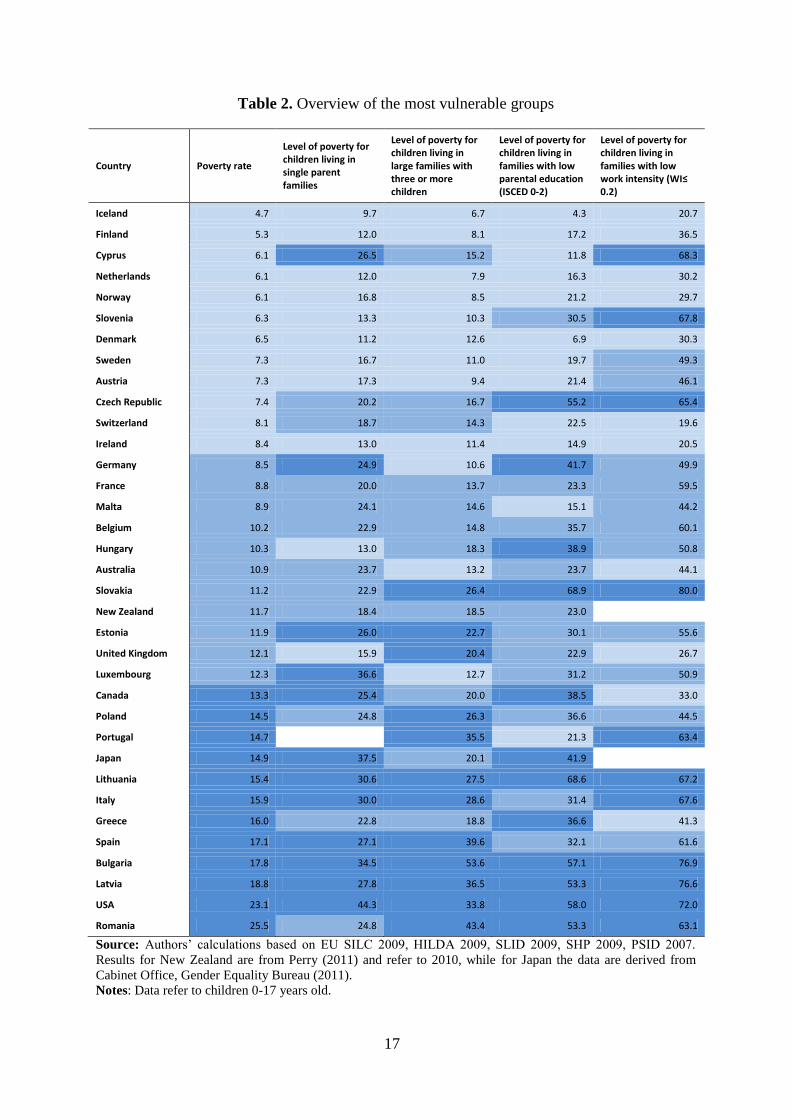
Table 2 summarizes some of the key trends emerging from the previous figures, by focusing
on the categories more at risk of poverty in the countries under analysis. The categories of
children at risk highlighted here are those of children living in single parent families, children
living in large families, children in households with low education and children in households
with low work intensity. The colour codes group the countries according to their ranking for
each single measure. The light blue indicates the 12 countries with a lower poverty rate in the
individual category, the mid-blue denotes the average performers, while the dark blue marks
the 12 countries with the highest levels of poverty. Overall, the country composition of the
groups is quite stable, as expected, but with some exceptions. Thus Denmark, Finland,
Iceland, Ireland, the Netherlands and Norway are among the best performers as might be
expected (for the total child poverty rate, in the first column, and also for the individual risk
categories) while Bulgaria, Latvia, Lithuania and USA are stable in the group of the worst
performing countries on relative poverty.
Belgium and France have a stable position in the intermediate group of countries, while
Germany and the United Kingdom (in the intermediate group, according to the total child
poverty rate) have contrasting positions when the poverty rate for children living in large
families is taken into account. In particular, the level of poverty for children living in families
with three or more children is amongst the lowest in Germany due to a social protection
system which assists large families via a reduction of taxable income and progressive birth
cash transfers, while one of the highest poverty levels is found in the United Kingdom.
Finally, there are some interesting changes at the extreme end of the ranking. Canada is in the
group of countries with the highest level of overall relative child poverty, but the
disadvantage and the vulnerability of children living in families with low work intensity is
16
much less accentuated compared to most of the countries under analysis. This result reflects
the labour market situation of the country, and in particular the low rate of unemployment,
one of the lowest levels of long-term unemployment among the OECD countries,13
the
greater emphasis placed on active labour market policies, and a social transfer system to
reduce poverty for working households, though jobless households do not enjoy the same
benefits (OECD, 2009).
In the Czech Republic too, the poverty level is much higher for children living in families
with low working intensity, compared to the average for all children. In 2008, this country
had one of the lowest unemployment rates in Europe (4.4 per cent of the workforce in
contrast to 7.1 per cent in the whole European Union), one of the highest long-term
unemployment rates among the unemployed (49 per cent compared to 37 per cent European
Union average) and one of the lowest levels of public expenditure in labour market policy
interventions (0.4 per cent of GDP compared to the EU average of 1.6 per cent).
Consequently, it is possible that long-term unemployment increases the probability of being
poor due to lack of labour income and social protection (Jurajda and Münich, 2002).
Lastly, the poverty level for children living in single parent families in Cyprus represents an
interesting case. As in other high income countries, single parent families are more numerous
in Cyprus than in the past, especially female headed households. Considering that the labour
market is subject to gender discrimination, it is easy to understand that the number of poor
children living in a lone parent household has increased in the recent past (Spyrou et al,
2007).
13
In 2008, the rate of long-term unemployment as a percentage of unemployment was 7% in contrast to 24% of
OECD countries (World Development Indicators, 2011).
17
Table 2. Overview of the most vulnerable groups
Country Poverty rate
Level of poverty for children living in single parent families
Level of poverty for children living in large families with three or more children
Level of poverty for children living in families with low parental education (ISCED 0-2)
Level of poverty for children living in families with low work intensity (WI≤ 0.2)
Iceland 4.7 9.7 6.7 4.3 20.7
Finland 5.3 12.0 8.1 17.2 36.5
Cyprus 6.1 26.5 15.2 11.8 68.3
Netherlands 6.1 12.0 7.9 16.3 30.2
Norway 6.1 16.8 8.5 21.2 29.7
Slovenia 6.3 13.3 10.3 30.5 67.8
Denmark 6.5 11.2 12.6 6.9 30.3
Sweden 7.3 16.7 11.0 19.7 49.3
Austria 7.3 17.3 9.4 21.4 46.1
Czech Republic 7.4 20.2 16.7 55.2 65.4
Switzerland 8.1 18.7 14.3 22.5 19.6
Ireland 8.4 13.0 11.4 14.9 20.5
Germany 8.5 24.9 10.6 41.7 49.9
France 8.8 20.0 13.7 23.3 59.5
Malta 8.9 24.1 14.6 15.1 44.2
Belgium 10.2 22.9 14.8 35.7 60.1
Hungary 10.3 13.0 18.3 38.9 50.8
Australia 10.9 23.7 13.2 23.7 44.1
Slovakia 11.2 22.9 26.4 68.9 80.0
New Zealand 11.7 18.4 18.5 23.0
Estonia 11.9 26.0 22.7 30.1 55.6
United Kingdom 12.1 15.9 20.4 22.9 26.7
Luxembourg 12.3 36.6 12.7 31.2 50.9
Canada 13.3 25.4 20.0 38.5 33.0
Poland 14.5 24.8 26.3 36.6 44.5
Portugal 14.7 35.5 21.3 63.4
Japan 14.9 37.5 20.1 41.9
Lithuania 15.4 30.6 27.5 68.6 67.2
Italy 15.9 30.0 28.6 31.4 67.6
Greece 16.0 22.8 18.8 36.6 41.3
Spain 17.1 27.1 39.6 32.1 61.6
Bulgaria 17.8 34.5 53.6 57.1 76.9
Latvia 18.8 27.8 36.5 53.3 76.6
USA 23.1 44.3 33.8 58.0 72.0
Romania 25.5 24.8 43.4 53.3 63.1
Source: Authors‟ calculations based on EU SILC 2009, HILDA 2009, SLID 2009, SHP 2009, PSID 2007.
Results for New Zealand are from Perry (2011) and refer to 2010, while for Japan the data are derived from
Cabinet Office, Gender Equality Bureau (2011).
Notes: Data refer to children 0-17 years old.

18
Finally, the migration background of households can also add elements to the description of
child poverty in rich countries. However, the available data do not have the kind of detail
needed for a clear understanding of the poverty risk for children in migrant families. As
clearly shown by UNICEF (2009), children with a migration background are far from being a
homogeneous group with respect to poverty: those whose parents were born in low and
middle income countries have in general a higher risk of poverty compared to those with no
migration background, while those with at least one parent originating from a high income
country are in general not at a disadvantage compared to the rest of the child population.
The available data do not allow such detailed disaggregation. They only indicate if the
household includes migrant members, irrespective of whether they originate from low or
other high income countries. Their origins are, however, an important factor in explaining
their differing poverty risk, but this information is lacking.
In most of the older EU countries, except Germany and Portugal the risk of poverty is higher
for children in migrant households (Figure 9). The findings are mixed for the new member
states: children in migrant households are more likely to be poor in the Czech Republic but
less likely to be poor in Estonia and Slovenia where it is interesting to note that migrants have
on average higher levels of education than in other countries. With respect to the other
member states, the percentage of poor children living in migrant households is high in
Belgium, Greece and Spain.

19
Figure 9. Child poverty rate by migrant status
0 5 10 15 20 25 30
Greece
Spain
Czech Republic
Belgium
United Kingdom
Italy
Denmark
France
Sweden
Luxembourg
Finland
Norway
Lithuania
Portugal
Austria
Malta
Cyprus
Latvia
Netherlands
Estonia
Slovenia
Ireland
Germany
Iceland
Child poverty rate (%)
1 or more
none
Source: Authors‟ calculations based on EU SILC 2009. Data are not available for Australia, Canada, New
Zealand, Japan, Switzerland and United States.
Note: For each country, poverty calculations are based on a poverty line set at 50 per cent of the national
median income. Countries are ordered by increasing poverty among children living in households with 1 or
more migrant members. Data are not presented for Bulgaria, Hungary, Poland, Romania and Slovakia (due to
too small a sample of children living in households with migrant members), and for Australia, Canada,
Switzerland and the United States.

20
8. CHILD POVERTY AND GOVERNMENT INTERVENTION WITH
TAXES AND SOCIAL TRANSFERS
Taxes and social transfers are some of the possible interventions that a government can use to
confront poverty. While their aim is not necessarily the reduction of poverty, in several
countries they are quite effective in protecting the population from poverty generated by
labour market forces alone. In particular, the tax transfer policies adopted in rich countries
translate into various outcomes.
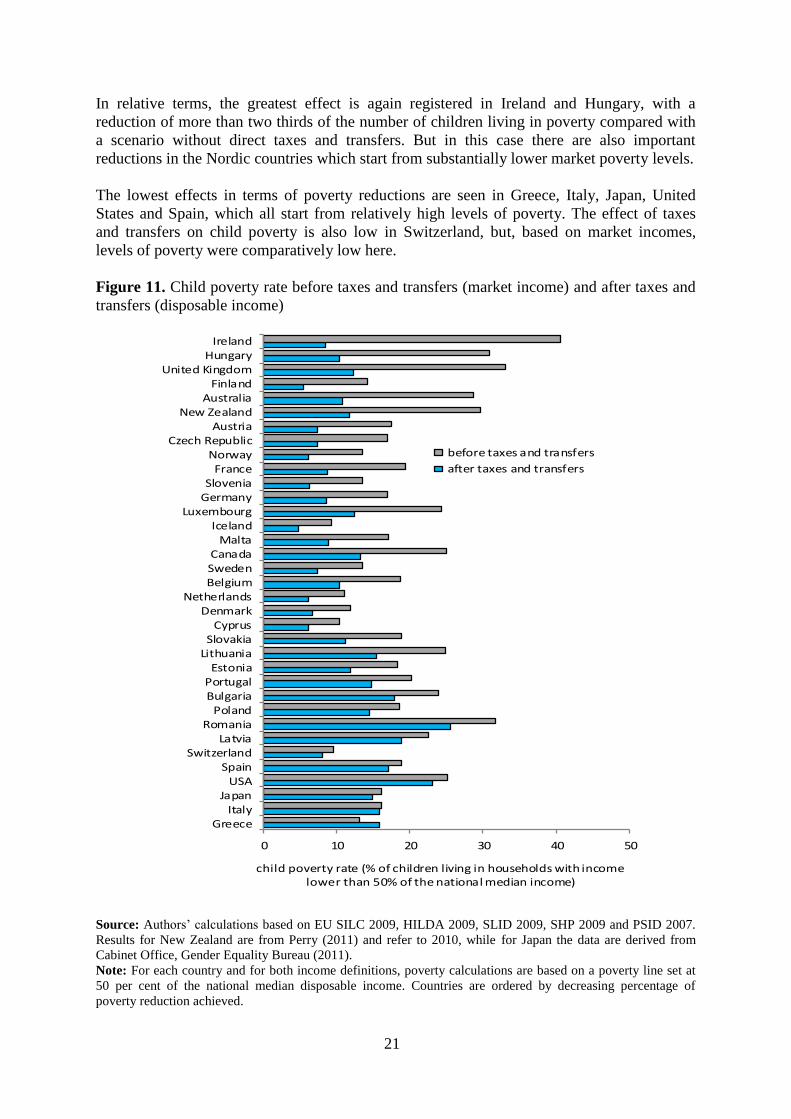
The snapshot provided in Figure 11, comparing market poverty and poverty after government
intervention, gives some raw indication of the different impacts of taxes and transfers on
child poverty reduction. In absolute terms, state intervention reduces child poverty levels by
more than 20 percentage points in Ireland, Hungary and the United Kingdom. But it also has
notable effects in Austria, Australia, Canada, France, Germany and New Zealand.
The composition of child poverty by level of urbanisation in the European Union countries
The EU-SILC data also allows us to identify the kind of urban setting within which poor households with
children are concentrated. Figure 10 shows the composition of the child population in poor households
according to the degree of urbanisation. In the older EU countries poor children tend to live in urban
(densely or „intermediately‟ populated) areas. But this does not apply to the new EU countries (except
Cyprus) where most poor children live in thinly populated rural settings. In addition, poverty rates in those
countries are lower in urban areas. This becomes an important factor when housing is used as an indicator
of deprivation as poor families in rural areas in the EU 10 group generally have a better quality of housing
than urban families.
Figure 10. Composition of the child population living in poor households by degree of urbanisation
Source: Authors‟ calculations based on EU SILC 2009. Data are not available for Australia, Canada, New Zealand,
Japan, Switzerland and United States.
Note: For each country, poverty calculations are based on a poverty line set at 50 per cent of the national median
income. Data are not available for Australia, Canada, the Netherlands, Slovenia, Switzerland and the United States.
21
In relative terms, the greatest effect is again registered in Ireland and Hungary, with a
reduction of more than two thirds of the number of children living in poverty compared with
a scenario without direct taxes and transfers. But in this case there are also important
reductions in the Nordic countries which start from substantially lower market poverty levels.
The lowest effects in terms of poverty reductions are seen in Greece, Italy, Japan, United
States and Spain, which all start from relatively high levels of poverty. The effect of taxes
and transfers on child poverty is also low in Switzerland, but, based on market incomes,
levels of poverty were comparatively low here.
Figure 11. Child poverty rate before taxes and transfers (market income) and after taxes and
transfers (disposable income)
0 10 20 30 40 50
GreeceItaly
JapanUSA
SpainSwitzerland
LatviaRomania
PolandBulgariaPortugalEstonia
LithuaniaSlovakia
CyprusDenmark
NetherlandsBelgiumSwedenCanada
MaltaIceland
LuxembourgGermanySlovenia
FranceNorway
Czech RepublicAustria
New ZealandAustralia
FinlandUnited Kingdom
HungaryIreland
child poverty rate (% of children living in households with income lower than 50% of the national median income)
before taxes and transfers
after taxes and transfers
Source: Authors‟ calculations based on EU SILC 2009, HILDA 2009, SLID 2009, SHP 2009 and PSID 2007.
Results for New Zealand are from Perry (2011) and refer to 2010, while for Japan the data are derived from
Cabinet Office, Gender Equality Bureau (2011).
Note: For each country and for both income definitions, poverty calculations are based on a poverty line set at
50 per cent of the national median disposable income. Countries are ordered by decreasing percentage of
poverty reduction achieved.
22
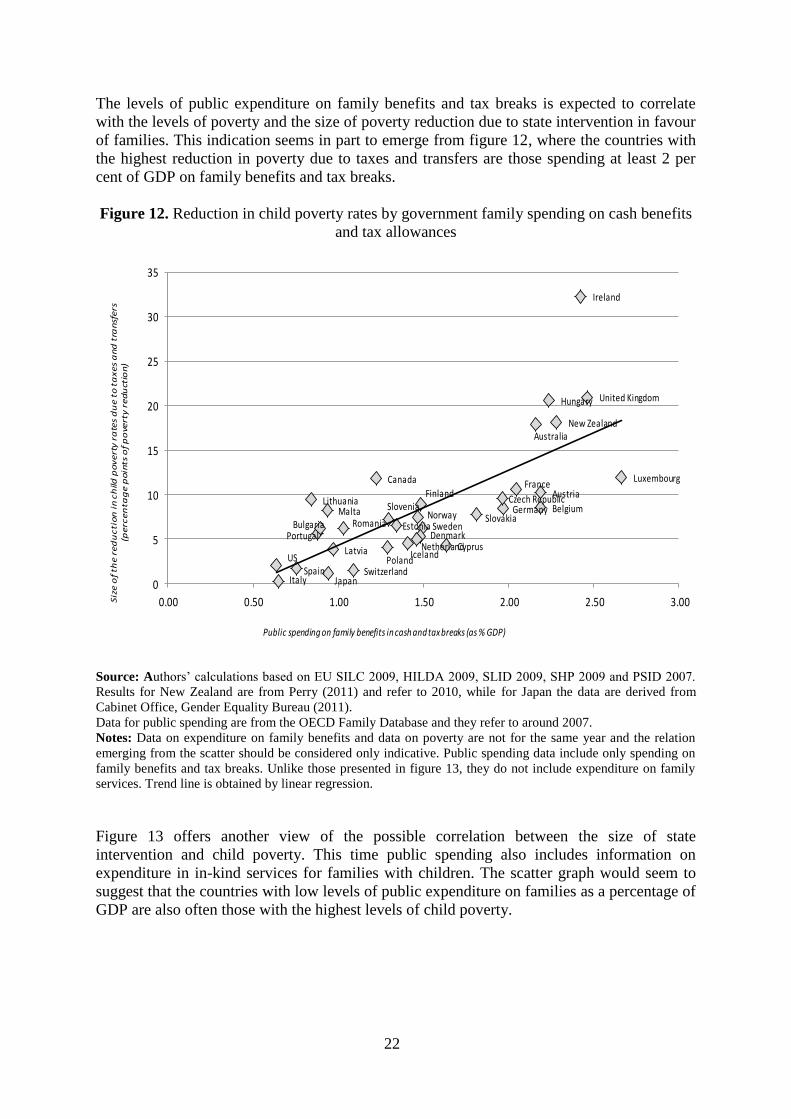
The levels of public expenditure on family benefits and tax breaks is expected to correlate
with the levels of poverty and the size of poverty reduction due to state intervention in favour
of families. This indication seems in part to emerge from figure 12, where the countries with
the highest reduction in poverty due to taxes and transfers are those spending at least 2 per
cent of GDP on family benefits and tax breaks.
Figure 12. Reduction in child poverty rates by government family spending on cash benefits
and tax allowances
France
United Kingdom
Sweden
Hungary
Denmark
Belgium
Luxembourg
Norway
IcelandNetherland
Finland
Australia
Germany
Ireland
AustriaCzech Republic
Slovakia
Cyprus
Slovenia
EstoniaRomania
PolandSpain Switzerland
Italy
Canada
PortugalBulgaria
US
Lithuania
Latvia
Malta
New Zealand
Japan0
5
10
15
20
25
30
35
0.00 0.50 1.00 1.50 2.00 2.50 3.00Siz
e o
f th
e r
ed
uc
tio
n i
n c
hild
po
ve
rty
ra
tes
du
e t
o t
ax
es
an
d t
ran
sfe
rs
(pe
rce
nta
ge
po
ints
of
po
vert
y r
ed
uct
ion
)
Public spending on family benefits in cash and tax breaks (as % GDP)
Source: Authors‟ calculations based on EU SILC 2009, HILDA 2009, SLID 2009, SHP 2009 and PSID 2007.
Results for New Zealand are from Perry (2011) and refer to 2010, while for Japan the data are derived from
Cabinet Office, Gender Equality Bureau (2011).
Data for public spending are from the OECD Family Database and they refer to around 2007.
Notes: Data on expenditure on family benefits and data on poverty are not for the same year and the relation
emerging from the scatter should be considered only indicative. Public spending data include only spending on
family benefits and tax breaks. Unlike those presented in figure 13, they do not include expenditure on family
services. Trend line is obtained by linear regression.
Figure 13 offers another view of the possible correlation between the size of state
intervention and child poverty. This time public spending also includes information on
expenditure in in-kind services for families with children. The scatter graph would seem to
suggest that the countries with low levels of public expenditure on families as a percentage of
GDP are also often those with the highest levels of child poverty.

23
Figure 13. Child poverty rates and public spending on families
France
UK
Sweden
Hungary
Denmark
Belgium
Luxembourg
Norway
Iceland
NetherlandsFinland
AustraliaGermany
IrelandAustria
Czech Republic
Slovakia
CyprusSlovenia
Estonia
Romania
Poland
Spain
Switzerland
Italy
CanadaPortugal
Bulgaria
United States
Lithuania
Latvia
Greece
Malta
New Zealand
Japan
0
5
10
15
20
25
30
0.00 0.50 1.00 1.50 2.00 2.50 3.00 3.50 4.00
Ch
ild
po
ve
rty
ra
te (
% o
f ch
ild
ren
liv
ing
in
po
or
ho
use
ho
lds)
Public spending on family in cash, tax breaks and services (as % GDP)
Source: Authors‟ calculations based on EU SILC 2009, HILDA 2009, SLID 2009, SHP 2009 and PSID 2007.
Results for New Zealand are from Perry (2011) and refer to 2010, while for Japan the data are derived from
Cabinet Office, Gender Equality Bureau (2011). Data for public spending come from OECD Family Database
and they refer to 2007.
Notes: Data on expenditure on family benefits and data on poverty are not for the same year and the relation
emerging from the scatter should be considered only indicative. Public spending data include only public
support that is exclusively for families (e.g. child payments and allowances, parental leave benefits and
childcare support). Spending in other social policy areas such as health and housing also assists families, but not
exclusively, and is therefore not included here. Trend line is obtained by linear regression.
9. CONCLUSIONS
The aim of this paper was to provide an updated analysis of relative income poverty among
children in high income countries. These recent data confirm Nordic countries and the
Netherlands as those having some of the lowest child poverty levels. At the other end of the
spectrum are Japan, the United States, some Southern European countries (Italy, Greece,
Spain and Portugal) and some of the new EU member states (Romania, Bulgaria, Latvia and
Lithuania). As discussed in the paper, several factors are associated with the risk of poverty,
in particular the household composition, the level of education and the actual workforce
participation of household members.
Children in households with low work intensity have very high poverty rates in all the
countries included in the study. The results also confirm that the risk of poverty is higher for
children in migrant households or those characterized by a lower level of education. This
suggests that poverty is not simply an outcome of labour market conditions and dynamics
(e.g. unemployment, low wage, inadequate benefit packages etc). Thus, a strategy to assure a
decent standard of living for children must take into consideration not only the generation of
employment but must also ensure decent working conditions for parents.
24
An important role in reducing child poverty is played by fiscal policies. Indeed, countries
with high levels of public expenditure on families are, in general, also those with the lowest
levels of child poverty. However, there is not always a direct relationship between public
expenditure and poverty outcomes but it is also evident that in some countries the level of
expenditure is too low and they need to spend more to achieve a reduction of child poverty
similar to the most virtuous countries. Furthermore, especially in a time of crisis, fiscal
stimulus packages and additional social protection measures are essential to avoid a
deterioration of the conditions of vulnerable groups and a further rise of poverty.
All in all, in limiting relative poverty among children it is important that the social transfers
system and the labour market should both function well. Governments have an important
responsibility to mitigate socially unacceptable results, to protect children, and to ensure them
a better future.
25
APPENDIX
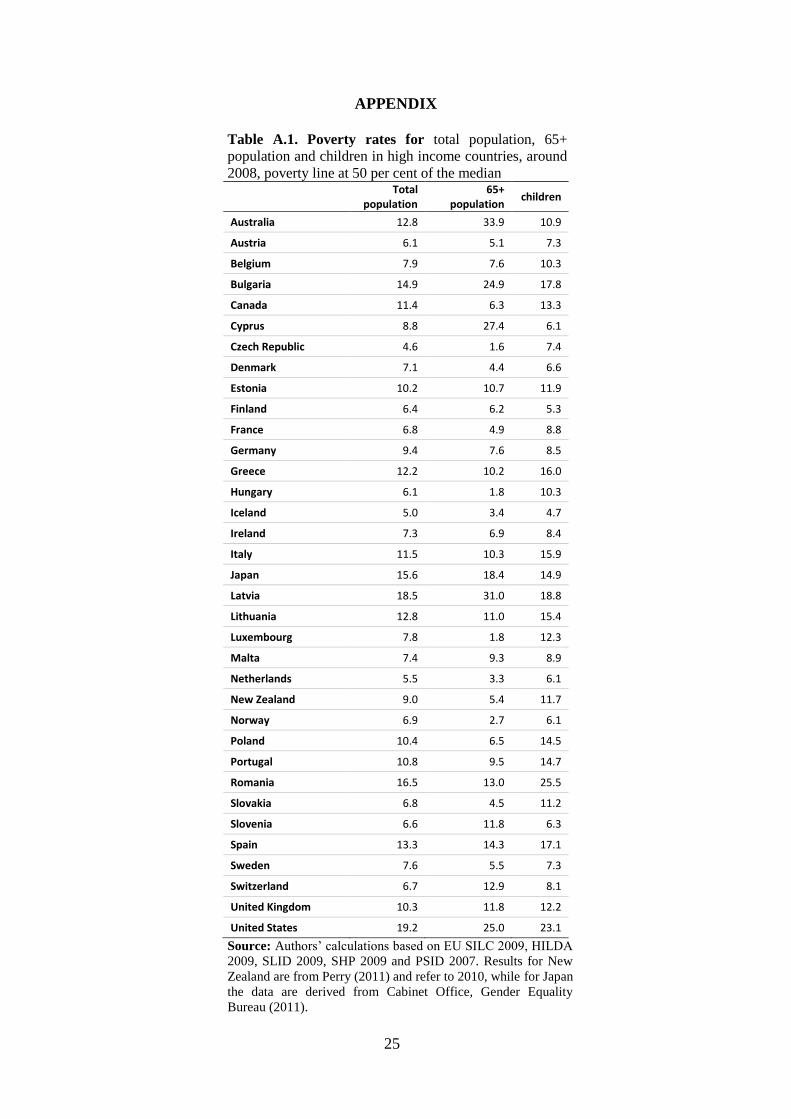
Table A.1. Poverty rates for total population, 65+
population and children in high income countries, around
2008, poverty line at 50 per cent of the median
Total
population 65+
population children
Australia 12.8 33.9 10.9
Austria 6.1 5.1 7.3
Belgium 7.9 7.6 10.3
Bulgaria 14.9 24.9 17.8
Canada 11.4 6.3 13.3
Cyprus 8.8 27.4 6.1
Czech Republic 4.6 1.6 7.4
Denmark 7.1 4.4 6.6
Estonia 10.2 10.7 11.9
Finland 6.4 6.2 5.3
France 6.8 4.9 8.8
Germany 9.4 7.6 8.5
Greece 12.2 10.2 16.0
Hungary 6.1 1.8 10.3
Iceland 5.0 3.4 4.7
Ireland 7.3 6.9 8.4
Italy 11.5 10.3 15.9
Japan 15.6 18.4 14.9
Latvia 18.5 31.0 18.8
Lithuania 12.8 11.0 15.4
Luxembourg 7.8 1.8 12.3
Malta 7.4 9.3 8.9
Netherlands 5.5 3.3 6.1
New Zealand 9.0 5.4 11.7
Norway 6.9 2.7 6.1
Poland 10.4 6.5 14.5
Portugal 10.8 9.5 14.7
Romania 16.5 13.0 25.5
Slovakia 6.8 4.5 11.2
Slovenia 6.6 11.8 6.3
Spain 13.3 14.3 17.1
Sweden 7.6 5.5 7.3
Switzerland 6.7 12.9 8.1
United Kingdom 10.3 11.8 12.2
United States 19.2 25.0 23.1
Source: Authors‟ calculations based on EU SILC 2009, HILDA
2009, SLID 2009, SHP 2009 and PSID 2007. Results for New
Zealand are from Perry (2011) and refer to 2010, while for Japan
the data are derived from Cabinet Office, Gender Equality
Bureau (2011).
26
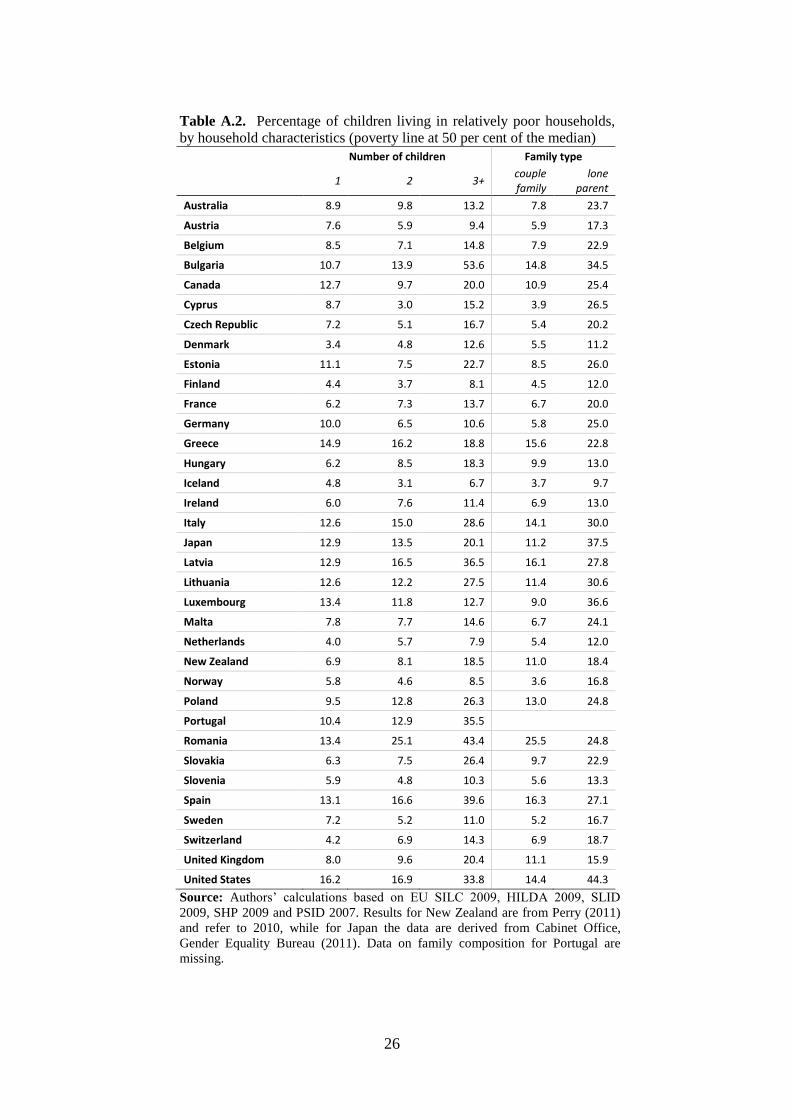
Table A.2. Percentage of children living in relatively poor households,
by household characteristics (poverty line at 50 per cent of the median)
Number of children Family type
1 2 3+ couple family
lone parent
Australia 8.9 9.8 13.2 7.8 23.7
Austria 7.6 5.9 9.4 5.9 17.3
Belgium 8.5 7.1 14.8 7.9 22.9
Bulgaria 10.7 13.9 53.6 14.8 34.5
Canada 12.7 9.7 20.0 10.9 25.4
Cyprus 8.7 3.0 15.2 3.9 26.5
Czech Republic 7.2 5.1 16.7 5.4 20.2
Denmark 3.4 4.8 12.6 5.5 11.2
Estonia 11.1 7.5 22.7 8.5 26.0
Finland 4.4 3.7 8.1 4.5 12.0
France 6.2 7.3 13.7 6.7 20.0
Germany 10.0 6.5 10.6 5.8 25.0
Greece 14.9 16.2 18.8 15.6 22.8
Hungary 6.2 8.5 18.3 9.9 13.0
Iceland 4.8 3.1 6.7 3.7 9.7
Ireland 6.0 7.6 11.4 6.9 13.0
Italy 12.6 15.0 28.6 14.1 30.0
Japan 12.9 13.5 20.1 11.2 37.5
Latvia 12.9 16.5 36.5 16.1 27.8
Lithuania 12.6 12.2 27.5 11.4 30.6
Luxembourg 13.4 11.8 12.7 9.0 36.6
Malta 7.8 7.7 14.6 6.7 24.1
Netherlands 4.0 5.7 7.9 5.4 12.0
New Zealand 6.9 8.1 18.5 11.0 18.4
Norway 5.8 4.6 8.5 3.6 16.8
Poland 9.5 12.8 26.3 13.0 24.8
Portugal 10.4 12.9 35.5
Romania 13.4 25.1 43.4 25.5 24.8
Slovakia 6.3 7.5 26.4 9.7 22.9
Slovenia 5.9 4.8 10.3 5.6 13.3
Spain 13.1 16.6 39.6 16.3 27.1
Sweden 7.2 5.2 11.0 5.2 16.7
Switzerland 4.2 6.9 14.3 6.9 18.7
United Kingdom 8.0 9.6 20.4 11.1 15.9
United States 16.2 16.9 33.8 14.4 44.3
Source: Authors‟ calculations based on EU SILC 2009, HILDA 2009, SLID
2009, SHP 2009 and PSID 2007. Results for New Zealand are from Perry (2011)
and refer to 2010, while for Japan the data are derived from Cabinet Office,
Gender Equality Bureau (2011). Data on family composition for Portugal are
missing.
27
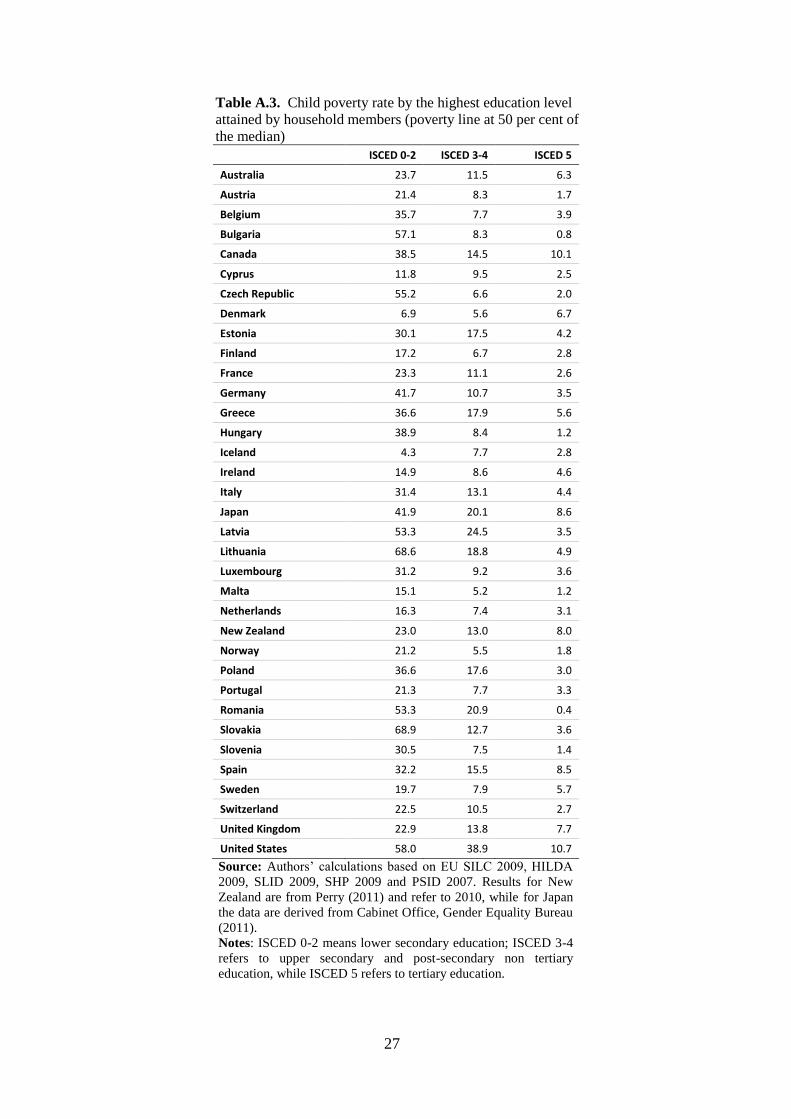
Table A.3. Child poverty rate by the highest education level
attained by household members (poverty line at 50 per cent of
the median)
ISCED 0-2 ISCED 3-4 ISCED 5
Australia 23.7 11.5 6.3
Austria 21.4 8.3 1.7
Belgium 35.7 7.7 3.9
Bulgaria 57.1 8.3 0.8
Canada 38.5 14.5 10.1
Cyprus 11.8 9.5 2.5
Czech Republic 55.2 6.6 2.0
Denmark 6.9 5.6 6.7
Estonia 30.1 17.5 4.2
Finland 17.2 6.7 2.8
France 23.3 11.1 2.6
Germany 41.7 10.7 3.5
Greece 36.6 17.9 5.6
Hungary 38.9 8.4 1.2
Iceland 4.3 7.7 2.8
Ireland 14.9 8.6 4.6
Italy 31.4 13.1 4.4
Japan 41.9 20.1 8.6
Latvia 53.3 24.5 3.5
Lithuania 68.6 18.8 4.9
Luxembourg 31.2 9.2 3.6
Malta 15.1 5.2 1.2
Netherlands 16.3 7.4 3.1
New Zealand 23.0 13.0 8.0
Norway 21.2 5.5 1.8
Poland 36.6 17.6 3.0
Portugal 21.3 7.7 3.3
Romania 53.3 20.9 0.4
Slovakia 68.9 12.7 3.6
Slovenia 30.5 7.5 1.4
Spain 32.2 15.5 8.5
Sweden 19.7 7.9 5.7
Switzerland 22.5 10.5 2.7
United Kingdom 22.9 13.8 7.7
United States 58.0 38.9 10.7
Source: Authors‟ calculations based on EU SILC 2009, HILDA
2009, SLID 2009, SHP 2009 and PSID 2007. Results for New
Zealand are from Perry (2011) and refer to 2010, while for Japan
the data are derived from Cabinet Office, Gender Equality Bureau
(2011).
Notes: ISCED 0-2 means lower secondary education; ISCED 3-4
refers to upper secondary and post-secondary non tertiary
education, while ISCED 5 refers to tertiary education.
28
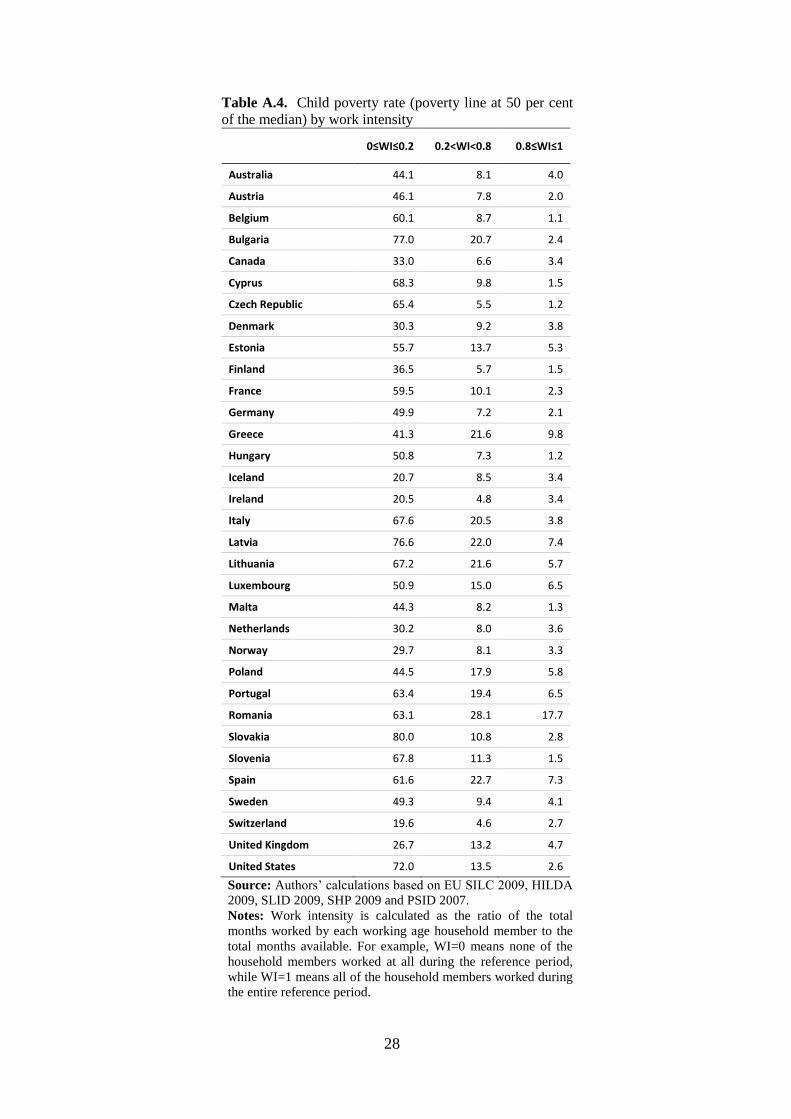
Table A.4. Child poverty rate (poverty line at 50 per cent
of the median) by work intensity
0≤WI≤0.2 0.2<WI<0.8 0.8≤WI≤1
Australia 44.1 8.1 4.0
Austria 46.1 7.8 2.0
Belgium 60.1 8.7 1.1
Bulgaria 77.0 20.7 2.4
Canada 33.0 6.6 3.4
Cyprus 68.3 9.8 1.5
Czech Republic 65.4 5.5 1.2
Denmark 30.3 9.2 3.8
Estonia 55.7 13.7 5.3
Finland 36.5 5.7 1.5
France 59.5 10.1 2.3
Germany 49.9 7.2 2.1
Greece 41.3 21.6 9.8
Hungary 50.8 7.3 1.2
Iceland 20.7 8.5 3.4
Ireland 20.5 4.8 3.4
Italy 67.6 20.5 3.8
Latvia 76.6 22.0 7.4
Lithuania 67.2 21.6 5.7
Luxembourg 50.9 15.0 6.5
Malta 44.3 8.2 1.3
Netherlands 30.2 8.0 3.6
Norway 29.7 8.1 3.3
Poland 44.5 17.9 5.8
Portugal 63.4 19.4 6.5
Romania 63.1 28.1 17.7
Slovakia 80.0 10.8 2.8
Slovenia 67.8 11.3 1.5
Spain 61.6 22.7 7.3
Sweden 49.3 9.4 4.1
Switzerland 19.6 4.6 2.7
United Kingdom 26.7 13.2 4.7
United States 72.0 13.5 2.6
Source: Authors‟ calculations based on EU SILC 2009, HILDA
2009, SLID 2009, SHP 2009 and PSID 2007.
Notes: Work intensity is calculated as the ratio of the total
months worked by each working age household member to the
total months available. For example, WI=0 means none of the
household members worked at all during the reference period,
while WI=1 means all of the household members worked during
the entire reference period.
29
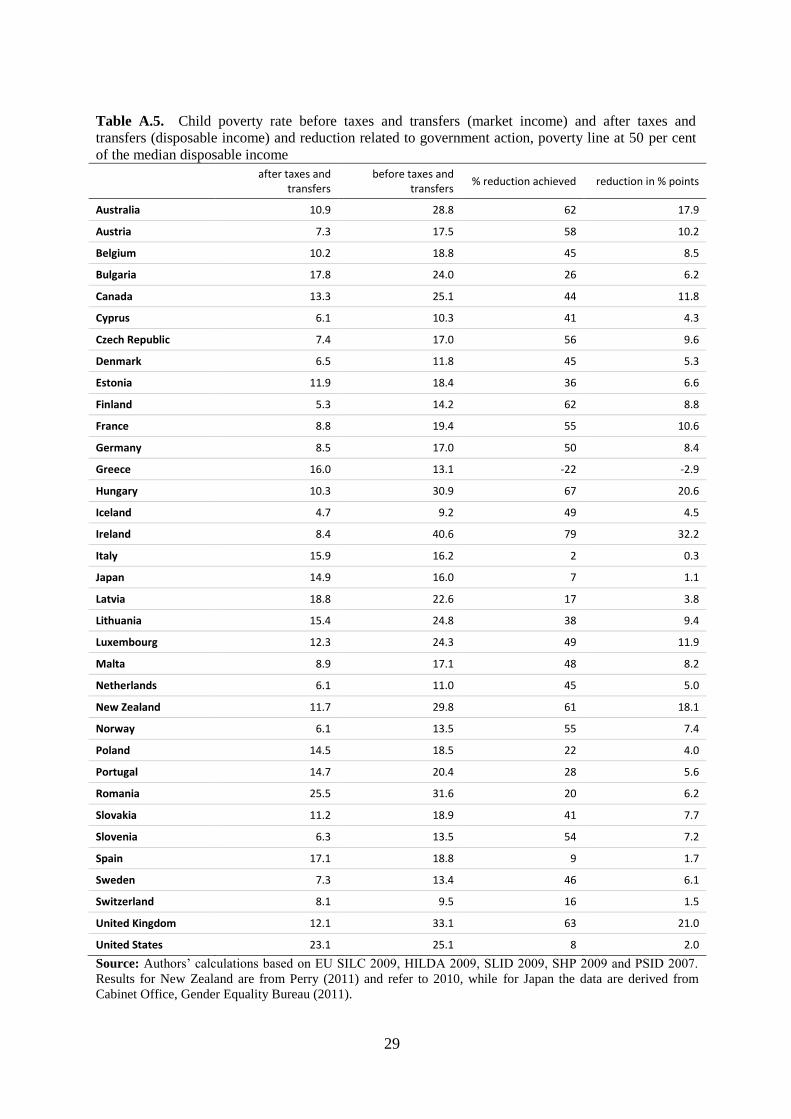
Table A.5. Child poverty rate before taxes and transfers (market income) and after taxes and
transfers (disposable income) and reduction related to government action, poverty line at 50 per cent
of the median disposable income
after taxes and
transfers before taxes and
transfers % reduction achieved reduction in % points
Australia 10.9 28.8 62 17.9
Austria 7.3 17.5 58 10.2
Belgium 10.2 18.8 45 8.5
Bulgaria 17.8 24.0 26 6.2
Canada 13.3 25.1 44 11.8
Cyprus 6.1 10.3 41 4.3
Czech Republic 7.4 17.0 56 9.6
Denmark 6.5 11.8 45 5.3
Estonia 11.9 18.4 36 6.6
Finland 5.3 14.2 62 8.8
France 8.8 19.4 55 10.6
Germany 8.5 17.0 50 8.4
Greece 16.0 13.1 -22 -2.9
Hungary 10.3 30.9 67 20.6
Iceland 4.7 9.2 49 4.5
Ireland 8.4 40.6 79 32.2
Italy 15.9 16.2 2 0.3
Japan 14.9 16.0 7 1.1
Latvia 18.8 22.6 17 3.8
Lithuania 15.4 24.8 38 9.4
Luxembourg 12.3 24.3 49 11.9
Malta 8.9 17.1 48 8.2
Netherlands 6.1 11.0 45 5.0
New Zealand 11.7 29.8 61 18.1
Norway 6.1 13.5 55 7.4
Poland 14.5 18.5 22 4.0
Portugal 14.7 20.4 28 5.6
Romania 25.5 31.6 20 6.2
Slovakia 11.2 18.9 41 7.7
Slovenia 6.3 13.5 54 7.2
Spain 17.1 18.8 9 1.7
Sweden 7.3 13.4 46 6.1
Switzerland 8.1 9.5 16 1.5
United Kingdom 12.1 33.1 63 21.0
United States 23.1 25.1 8 2.0
Source: Authors‟ calculations based on EU SILC 2009, HILDA 2009, SLID 2009, SHP 2009 and PSID 2007.
Results for New Zealand are from Perry (2011) and refer to 2010, while for Japan the data are derived from
Cabinet Office, Gender Equality Bureau (2011).
30
REFERENCES
Bradbury, Bruce (2010), “Asset Rich, but Income Poor: Australian housing wealth and
retirement”, FaHCSIA Social Policy Research Paper, No 41, Australian Government
Department of Families, Housing, Community Services and Indigenous Affairs,
Canberra.
Bradbury, Bruce and Markus Jäntti (1999), “Child Poverty Across Industrialized Countries”,
Innocenti Occasional Paper 71, UNICEF International Child Development Centre,
Florence.
Bradshaw, Jonathan and Yekaterina Chzhen (2009), “Child Poverty Policies Across Europe”,
Journal of Family Research, Vol. 21 (2), pp. 128-149.
Cabinet Office, Gender Equality Bureau, Japan (2011), “The State of Poverty and Gender
Gap", paper presented at the Working Group on "Women and the Economy",
Specialist Committee on Basic Issues and Gender Impact Assessment and Evaluation under the Council for Gender Equality, Tokyo 20 December 2011.
Jurajda, Štěpán and Daniel Münich (2003) “Understanding Czech Long-Term
Unemployment”, Finance a úvûr. Vol. 53(1-2), pp. 11-30.
OECD (2008), Growing Unequal? Income Distribution and Poverty in OECD Countries,
OECD, Paris.
OECD (2009), OECD Employment Outlook 2009: Tackling the Jobs Crisis. OECD, Paris.
OECD (2011), Pensions at a Glance 2011: Retirement-Income Systems
in OECD and G20 Countries. www.oecd.org/els/social/pensions/PAG.
Pashardes, Panos (2007), “Why Child Poverty in Cyprus is so Low”, Cyprus Economic
Policy Review, Vol. 1(2), pp. 3-16.
Perry, Bryan (2011), “Household Incomes in New Zealand: Trends in indicators of inequality
and hardship 1982 to 2010”, Ministry of Social Development, Wellington, July 2011.
Spyrou, S., N. Thoma, L. Antoniou, G. Agathokleous, F. Taylor, S. Cohen, K. Crawford, S.
Giullari, J. Walker, A. Mouriki, M. Michailidou, and E. Gazon (2007), Integrating
children’s perspectives in policy-making to combat poverty and social exclusion
experienced by single parent families: A transnational comparative approach,
European University in Cyprus, International Childhood and Youth Research
Network, Nicosia.
TÁRKI (2010), Child Poverty and Child Well-Being in the European Union, Report prepared
for the DG Employment, Social Affairs and Equal Opportunities of the European
Commission, Budapest.
TÁRKI (2011), Child Well-Being in the European Union: Better monitoring instruments for
better policies, Report prepared for the State Secretariat for Social Inclusion of the
Ministry of Public Administration and Justice, Budapest.
UNICEF (2000), “A League Table of Child Poverty in Rich Nations”, Innocenti Report Card
No.1, UNICEF Innocenti Research Centre, Florence, Italy.
UNICEF (2005) “Child Poverty in Rich Nations”, Innocenti Report Card, No. 6, UNICEF
Innocenti Research Centre, Florence.
UNICEF (2009) “Children in Immigrant Families in Eight Affluent Countries”, Innocenti
Insight, UNICEF Innocenti Research Centre, Florence.
UNICEF (2010) “The Children Left Behind”, Innocenti Report Card, No. 9, UNICEF
Innocenti Research Centre, Florence.


